
Submitted:
30 November 2023
Posted:
01 December 2023
You are already at the latest version
Abstract
This paper presents a methodology to detect the erosion and progradation effects in the Atrato river delta, located in the Gulf of Urabá in Colombia using SAR (Synthetic Aperture Radar) data. Other authors have studied this area by using optical images, encountering difficulties given the persistent presence of clouds in this region. SAR imagery is rescaled, despeckled, composed, classified, registered and processed to obtain a heatmap that shows the overall changes during eight years (2016–2023) in one single image. Since this technology uses microwave active signals, the presence of clouds and other environmental phenomena was not a problem, and all the images from the selected dates could be processed and analyzed. Also, detection of the dynamic processes was obtained for every period considered in this study with respect to the previous one in time, calculating areas and detecting the regions subject to the erosion and progradation processes. The multitemporal analysis performed found that the newly created mouth is the most active area for these processes, coinciding with other studies. A comparison of these findings with the Oceanic Niño Index (ONI) showed a relative delayed coupling to the erosion process and a coupling of progradation with dry and wet seasons.
Keywords:
Synthetic Aperture Radar (SAR)
; speckle
; computer vision
; remote sensing
; erosion
; progradation
; Oceanic Niño Index (ONI)
; Gulf of Urabá
; Atrato river
1. Introduction
The Atrato river basin in Colombia covers the northwestern area of the department of Antioquia and the northern area of the department of Chocó. It experiences one of the highest precipitation regimes on the planet due to orographic effects and the quasi-permanent transport of moisture towards the mountain range from the Pacific Ocean. This results in a regime with a dry season not very intense, classified as a tropical-rainy equatorial forest according to the Köppen-Geiger system [1,2]. These hydrometeorological conditions are associated with persistent cloudiness in the area and recurrent, prolonged rainfall, leading to runoff with sediment transport from the biodiverse jungles of this basin towards its mouth [3].
The Atrato river is crucial in the Biogeographic Region of Chocó, well-known for its high biodiversity. It is a river with great water yields, being one of the largest and most navigable in Colombia and establishing its stream, its basin and its affluent, as the first entity of this type in Colombia to be declared subject to rights to protection, conservation, maintenance and restoration by the State and the ethnic communities [4]. The Atrato is estimated to discharge between 4,900 and 5,000 of water per second into the Caribbean Sea, with an approximate length of 750 between its source in Cerro Plateado (Western mountain range of Colombia) to its mouth in the Caribbean Sea, which makes it one of the rivers with the largest flow in the world.
The mouth of the Atrato river is located between 8.274° and 8.009° north latitude and -77.007° and -76.813° longitude in the northwest of the Gulf of Urabá. It is rich in mangroves and wetlands, being the second area with the most mangroves on the entire Colombian Caribbean coast, with a large amount of ecosystem goods and services associated with this fragile ecosystem. These mangroves offer many ecosystem functions and services, both provisioning, regulation and landscaping, and support for populations of marine, terrestrial and estuarine fauna and flora. In this gulf, the largest estuary in the Caribbean of Colombia and with a U-shaped morphology, this digitated delta (with a shape of fingers) of great importance is evident because it has been the hydrological entrance to its basin for several centuries and with great number of populations associated with the main body of water, with access to the Caribbean Sea through this mouth [5].
In this delta, a dynamic balance is manifested as the result of the interaction of the processes of erosion/progradation, regional rise in sea level, coastal drift, extreme events such as storms and rough seas. This causes losses (erosion) and gains (progradation) of land simultaneously in different areas of this mouth, depending on the contributions of sediment from the basin through the main channel, which in turn generate effects on the mangrove ecosystem of the coastal zone, even leading to its possible expansion [3,5]. The trend of sediment contributions from said basin to the Caribbean Sea has increased in recent decades, as a result of the economic activities that take place in the basin and with it the morphological effects on the delta [6,7]. The Atrato river delta area in the different spatial contexts, of interest for this study, is presented in Figure 1.
Within the Atrato river delta there are areas of particular hydraulic, geomorphological and ecosystem interest due to the variability of its currents and shapes over time. Ancient mouths such as “Tarena” and current mouths such as “El Roto”, “Pavas”, “Matuntugo”, “Coquitos” and “Leoncito”, more evidently manifest the erosion and progradation processes of interest in the present study [8].
In 2021, a spatio-temporal analysis of erosion and progradation in the Atrato river delta was performed using Landsat imagery and Google Earth Engine (GEE) to automatically delineate shorelines [9]. These results were compared to manual delineations of the same imagery using ArcGIS with similar outcomes, identifying trends in erosion and progradation with good accuracy along the mouths and sides of the delta. The images used from Landsat were optical and, according to the authors, some images had to be excluded from the analysis due to the presence of clouds, the main obstacle in the region under study. On the other hand, Synthetic Aperture Radar (SAR) technology uses electromagnetic fields that are capable to get surface data even through the clouds, smoke, snow and some atmospheric perturbations. Hence, SAR technology can be used to obtain images from the Atrato river and the coast near to river mouth into the Caribbean Sea that can be successfully used for analyzing erosion and progradation of the delta over the time. In this study, we make use of SAR imagery with this purpose in the defined region of interest.
To identify morphological changes associated with the erosion-progradation balance, strategies involving remote sensing are employed, utilizing analog orthophotographs or satellite scans. One significant challenge in such studies is the need to monitor areas with persistent cloudiness, hindering observations through a considerable portion of passive multispectral satellite images. Figure 2 displays images from different hydroclimatic moments in the region captured by the passive sensors of the Sentinel 2 satellites from the Copernicus project of the European Space Agency (ESA). This highlights the mobility and persistence of cloud patterns, emphasizing the coupling between meteorology, climatology, and topography previously mentioned. It also underscores the imperative to explore technical alternatives for the analysis of areas characterized by persistent cloud cover.
Studies such as [3] identified substantial erosion exceeding through satellite images from the Landsat program (using passive sensing) between 1986 and 2019 in delta areas in contact with the open sea. The same study indicates that progradation in the region amounts to during the same analyzed period, primarily concentrated in areas like “El Roto” mouth. Despite its formation between the late 19th century and the early 20th century, this is currently the main mouth of the Atrato river, showing simultaneous progradation and erosion processes, although progradation dominates due to the substantial sediment contribution of the river [3]. The study also reveals that erosion is concentrated along all coastal areas of the delta, while progradation is focused on the mouths of the Atrato river channels. This is attributed to deposition and direct accumulation of sediments that do not enter the Gulf of Urabá itself. Cumulatively, progradation predominates in this region. The years with the most significant changes detected in the delta were 1997-1998, 1999-2000, 2010-2011, and 2013-2014, coinciding with phases of the ENSO La Niña phenomenon, marked by intense erosion and progradation processes. When using SAR data, the approaches used in the previously cited studies cannot be used, and the steps defined in Figure 4 must be followed, as will be shown in Section 4. This study relies on Sentinel-1 SAR data obtained from [10]. Sentinel-1 consists of a constellation of two polar-orbiting satellites designed to operate day and night, utilizing C-band synthetic aperture radar (SAR) imaging. This capability enables the acquisition of imagery regardless of weather conditions. Sentinel-1 represents the initial mission within the five-part series that the European Space Agency (ESA) is developing for the Copernicus initiative [11].
The data products provided by Sentinel-1 encompass SAR Level-0, Level-1 SLC, Level-1 GRD, and Level-2 OCN, comprising both single polarizations (VV or HH) for Wave mode and dual polarizations (VV+VH or HH+HV), or single polarizations (HH or VV) for SM, IW, and EW modes. Level-1 Ground Range Detected (GRD) products consist of focused SAR data that has undergone detection, multi-looking, and projection to ground range using an Earth ellipsoid model. The ellipsoid projection of the GRD products is corrected utilizing the terrain height specified in the product’s general annotation. The terrain height used varies in azimuth but remains constant in range [12]. For this study, GRD-HD images captured in IW mode from Sentinel-1 A and B with dual polarizations (VV and VH) are utilized.
This paper is organized as follows. In Section 2 the materials are presented, including the description of the region of interest (ROI), the availability and quality of SAR data and the classification technique considered in this study. In Section 3 the methodology to acquire and process the images is described. In Section 4 the results will be exposed including all the processing steps: raw images, intensity rescalization, filtering, composition, classification, registration and calculation of the heatmap, including the analysis of erosion and progradation. Finally, in Section 5 a discussion and interpretation of the results according to other studies is performed.
2. Materials
Sixteen pairs of SAR images, capturing the region of interest in both and polarizations, were collected from Sentinel 1A and 1B satellites. These images span sixteen distinct periods, providing a comprehensive dataset covering the timeline from 2016 to 2023 (See Figure 3). The oldest image in the dataset, serving as a reference, is associated with metadata based on the WGS 84 coordinate system. The upper-left corner of the image has coordinates 77.0104663321 degrees west and 8.27552300115 degrees north. Additionally, the average pixel size in the east-west direction is 0.0001009516 (approximately 10.90 m), and in the north-south direction, it is 0.0001168725 (approximately 12.62 m). According to these pixel sizes, each pixel would cover an area of approximately 137.62 .
The covered area of a segment in the image is obtained by multiplying the area of a single pixel by the number of pixels in the segment, providing an accurate representation of the covered area.
Additionally, the dry seasons, occurring from December to February, were considered, while the remainder of the year was designated as the wet season. Over these eight years, the La Niña and El Niño phenomena manifested at various points, determined by fluctuations in the Oceanic Niño Index (ONI). The ONI serves as the primary index for tracking the oceanic component of the El Niño-Southern Oscillation climate pattern (ENSO). Index values of +0.5 or higher indicate El Niño, whereas values of -0.5 or lower indicate La Niña. The ONI data used to compare and discuss in this study was taken from [13].
The programming language utilized for processing these images is Python, operating within the web-based integrated development environment of Google Colab. Several libraries were employed, including OpenCV, RasterIO, TensorFlow, Keras, NumPy, Matplotlib, Imutils, and Pandas.
3. Methodology
To find out how erosion and progradation evolve over time, the SAR images are processed using the pipeline in Figure 4. This pipeline includes a despeckling stage based on deep learning that was trained using actual SAR images instead of optical images corrupted with synthetic speckle. In addition, by analyzing the polarization distribution after the proposed despeckling stage, it was found that only VH polarization threshold was necessary for classification using Otsu’s method, adequately separating water from land in the SAR images. Finally, it is remarkable that a coupling relationship between ONI and the processes of erosion and progradation was found through the measurements performed with this pipeline. Below, all the procedures are detailed.
Figure 4.
SAR image processing pipeline.
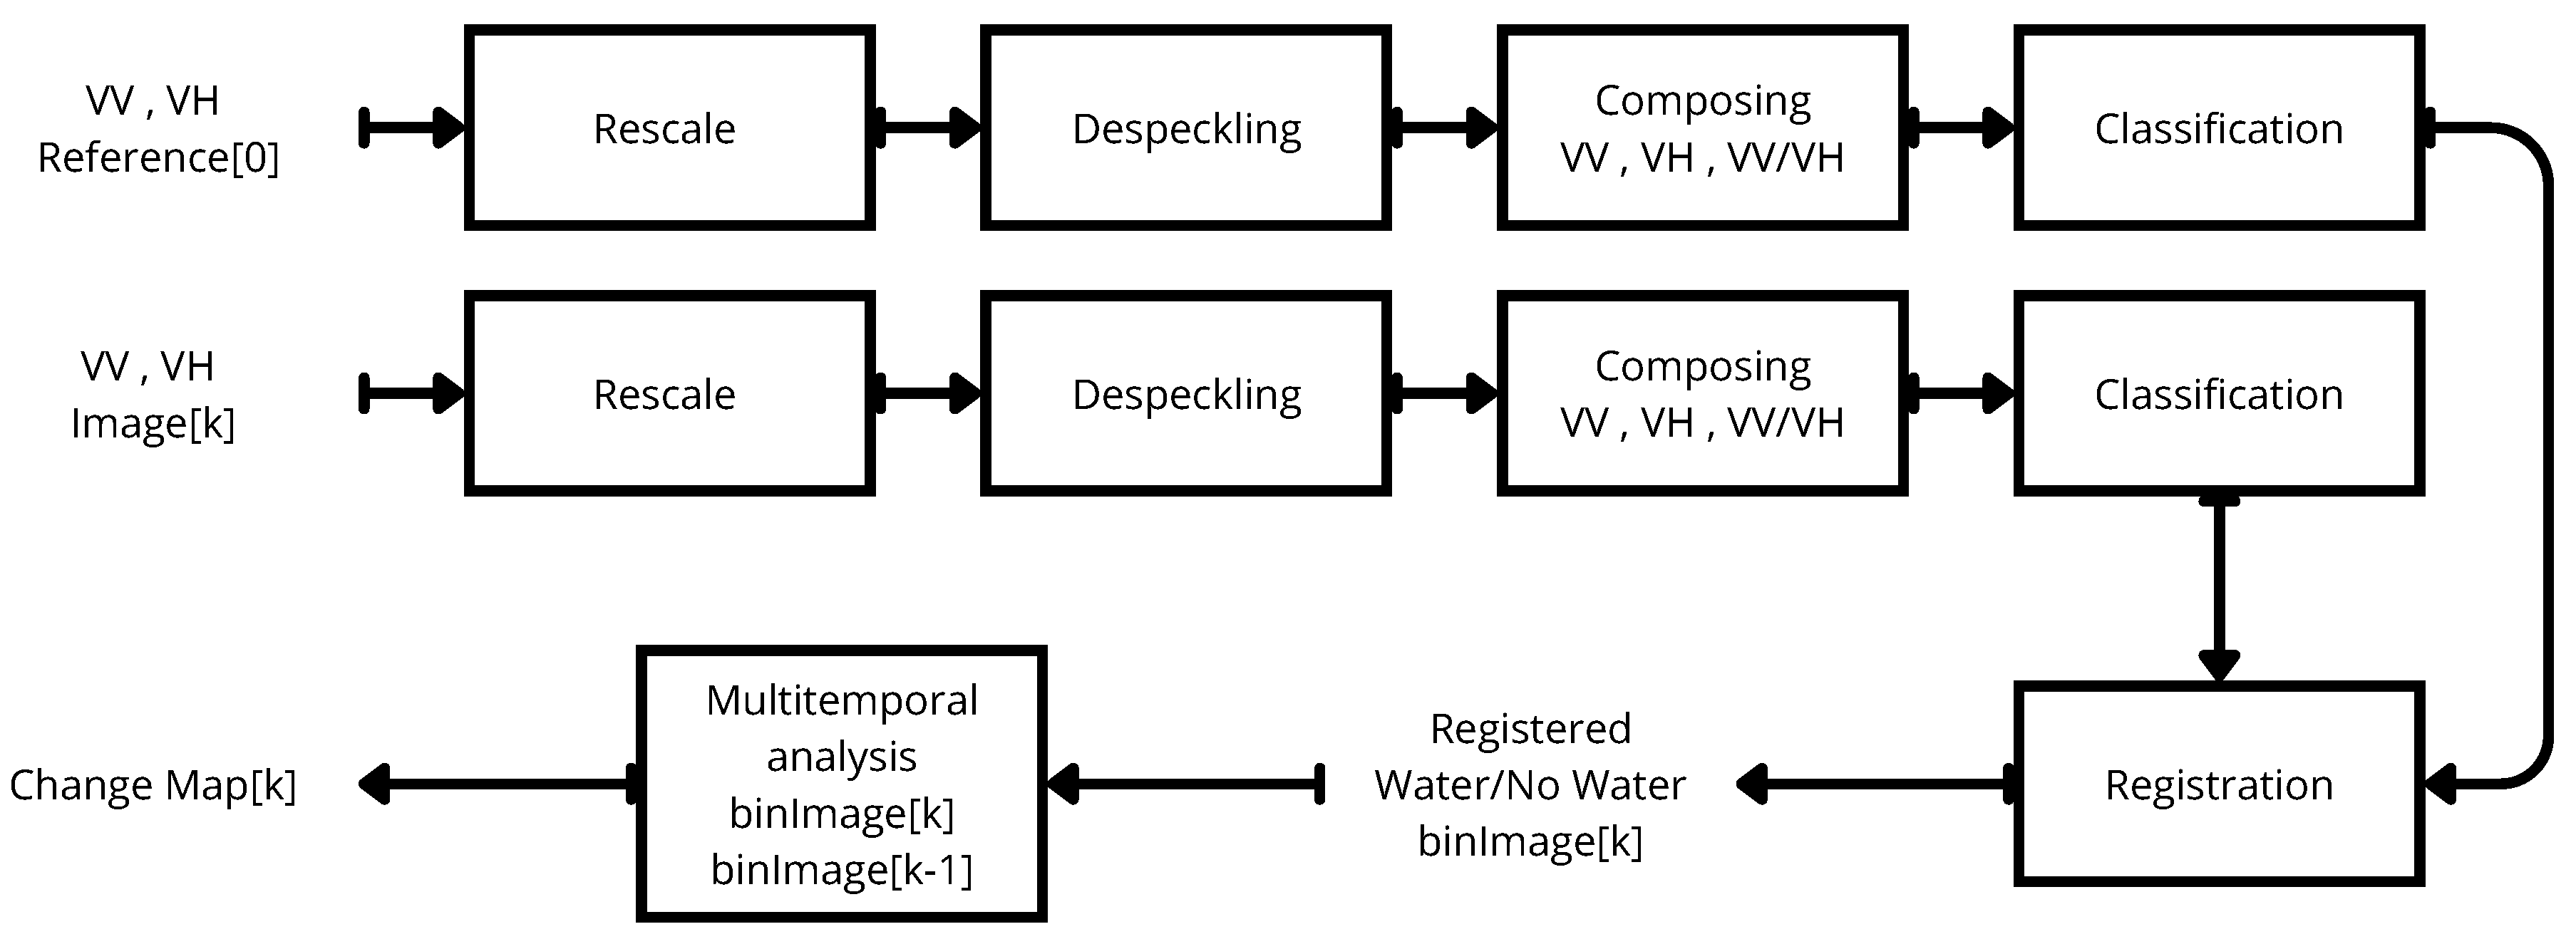
The VV and VH polarizations of the images are rescaled to a range from 0 up to 255. Second, a based on deep learning autoencoder filters the images for despeckling. Third, a composed color image is obtained. Fourth, a classifier returns a binary image that indicates whether each pixel of the image is water or not. Fifth, each of the binary images is registered with the first to obtain the same raster georeference. Finally, each binary and registered image is compared to the previous one to find whether each pixel in the image has been eroded, prograded, or remained unchanged.
3.1. Rescale
The downloaded images are Tag Image File Format (.tiff), with 16-bits unsigned integer data (uint16). To ensure a wide range of values and improve contrast while maintaining the structural characteristics of the images, a rescaling process is performed for each image I, as defined in (1):
Where is the pixel at coordinates of the rescaled image and is the mean of all the pixels in the image I. The images were additionally normalized and then multiplied by 255, so every image has values from 0 up to 255.
3.2. Despeckling
A real image I contains multiplicative noise N that affects to a noiseless SAR image X, it is . This noise is known as Speckle and is characterized by a Gamma distribution according to Eq. 2:
where L is the Equivalent Number of Looks (ENL) of the SAR image.
Aiming to reduce the effects of the speckle, each image is divided into sections of pixels with not overlap, then each section is filtered by using a based on deep learning autoencoder that was adjusted for filtering real SAR images [14].
The autoencoder receives the section of the image and returns the despeckled section of the image. There are four layers in the autoencoder: two encoders and two decoders. First, the encoder takes the input image and spatially compresses it to using a 32 filters, RELU activation function convolutional stage, and a MaxPool downsampling in the first encoder layer. Then, the image is spatially compressed to by using a 32 filters, RELU activation function convolutional stage, and a MaxPool downsampling in the second encoder layer. The obtained data here is a compressed version of the input with 32 levels of information associated with the image content. After, the decoder backs this image to the original size by using a 32 filters, RELU activation function deconvolutional stage, and an upsampling in the first decoder layer, and a 32 filters, RELU activation function deconvolutional stage, and an upsampling in the second decoder layer. Hence, the output layer produces a grayscale image resulting from the compression and decompression performed by the autoencoder while reducing the noise.
The autoencoder architecture is shown in Figure 5.
3.3. Composing
The filtered images both polarizations and are combined integrating the information into a single like-RGB image. The composition carried out is based on [15], using the polarization for red, the polarization for green, and the ratio for blue, also rescaled to the range of 0-255.
3.4. Classification
To determine the presence of water in each pixel of an image, a binary classifier is used. The classifier distinguishes whether the pixel corresponds to water or not based on the characteristic of consistently low values associated with water bodies.
The histograms associated with the and polarizations, as well as the ratio, were analyzed on the sixteen images. The histograms reveal that both polarizations, and , exhibit a bimodal distribution. Remarkably, the polarization demonstrates a higher level of repeatability compared to the polarization. The distribution of the polarization shows two peaks for pixel values at approximately 50 and 125, as shown in Figure 6. The Otsu’s method was chosen for automatic image segmentation [16].
Otsu’s method aims to determine an optimal threshold for dividing an image into two classes, typically the foreground (object) and background. This is achieved by exhaustively searching for the threshold that minimizes the intra-class variance. The intra-class variance is defined as a weighted sum of variances of the two classes defined by Eq. 3:
where describes the Between-Class Variance, a measure of the separation between two classes (foreground and background). Weights and are the probabilities of the two classes separated by a threshold t, and and are variances of these two classes.
The between-class variance quantifies the spread or separation between pixel intensity values of two classes, typically the foreground (object) and background. Otsu’s method iterates through possible threshold values, calculating the between-class variance for each threshold, and determines the threshold that provides the best separation. This characteristic makes it well-suited for image segmentation.
While Otsu’s method is grounded in a mathematical framework that models the image’s histogram as a combination of two normal distributions with the same variance and size, it’s noteworthy that Otsu’s thresholding can still yield satisfactory results even when these assumptions are not precisely met. This robustness to deviations from assumptions is similar to how statistical tests, closely related to Otsu’s method, can provide accurate results even when the underlying assumptions are not entirely fulfilled [17].
3.5. Registration
The process of registration is an important step before a multitemporal analysis, since this process ensures that all the images perfectly match. A reference image is defined, in this case the one corresponding to 20160611, then every one of the rest of images is taken to find several key points by using Oriented FAST and Rotated BRIEF (ORB) descriptors [18] which first use Features from Accelerated Segment Test (FAST) [19] to find key points, then apply Harris corner measure to find the top K points among them, and finally use a pyramid to produce multiscale-features. The registration process was applied over classified images with better results than applied over despeckled or composed images.
3.6. Multitemporal analysis
At this stage, a set of sixteen registered and segmented images has been obtained. Subsequently, a multitemporal analysis is conducted using a heatmap and pairwise comparisons between consecutive dates.
The heatmap unify all sixteen images into a single representation by counting the number of instances when each pixel was classified as water. Furthermore, the pairwise date comparisons allow the identification of pixels that have either eroded or prograded from instant to instant k. This iterative operation provides insights into the evolution of these processes at specific instances relative to their preceding dates.
4. Results
The top two images of Figure 7 are samples of SAR images from June 11th of 2016, in polarization (left) and (right) after the rescale process, while the bottom images display the same images from 2016 in polarizations VV and VH after the filtering process. For the despeckling process, the downloaded SAR images were clipped into patches, filtered independently by using the AE, and then integrated together into a new filtered image with the same size as the original. These filtered images increased the ENL from 18.91 and 21.75 before the despeckling process to 854.40 and 1360.31, respectively, after applying the autoencoder to the images. This was achieved while preserving edges and other important details, especially along the coast.
The composed image clearly illustrates the integration of information from the two polarizations, each represented as a single grayscale channel, into a colorful image. Land (no water) areas exhibit green and brown patterns, while water appears as dark blue. This composite image holds potential for various applications, such as land change analysis. However, in this study, the focus is on classifying water and non-water areas to detect changes in erosion and progradation. The resulting composition is displayed in Figure 8 (left).
4.1. Evaluation of changes in classified images
A multitemporal fusion was performed, by integrating all the sixteen classified images into a single one with an average operation. The result of this process is a heat map where white pixels will mean water presence in all images, yellow pixels mean water presence in most of the images, red pixels mean no water presence in most of the images, and black pixels mean no water presence in all the images, as shown in Figure 9.
Multitemporal analyzes in SAR images play a pivotal role in capturing dynamic changes and understanding the evolving nature of landscapes over time. The significance lies in the ability to monitor and assess variations in features such as water bodies, vegetation, and land cover across different temporal epochs. SAR images acquired at distinct intervals enable the identification of trends, patterns, and anomalies, providing valuable insights into environmental processes. In the context of this study, the multitemporal analysis of SAR images facilitates the detection of erosion and progradation in the Atrato river delta. By examining variations in water presence over sixteen periods, the research gains a comprehensive understanding of the region’s morphological dynamics. Such analyses not only contribute to a deeper comprehension of natural processes but also offer a foundation for informed decision-making in environmental management and land-use planning. The ability to observe and quantify changes over time enhances the utility of SAR technology, making it a valuable tool for monitoring and managing diverse ecosystems.
4.2. Erosion/Progradation detection and measurement
The detection of erosion/progradation is carried out by comparing two classified and registered images. A modified subtraction operation is performed over an image () with the subsequent image in time (), as described in Eq. 4, to calculate the erosion areas ().
Similarly, the progradation areas () can be determined according to Eq. 5.
The detected progradation is visualized as green overlays over the classified image, while erosion is represented as red overlays. A comparison of 20160611 vs. 20161214 and 20210627 vs. 20220228 is illustrated in Figure 10.
The measurement of erosion/progradation in the above results involves calculating the total area covered by green and red overlays. This measurement is initially determined in pixels and the conversion to is performed by considering the Sentinel resolution of per pixel, which leads to an area of 133.6173 per pixel. The results are presented in Table 1 and visualized in Figure 11. These calculated areas are compared to the Oceanic Niño Index (ONI) with data from [13].
5. Discussion
5.1. Raw SAR images
The downloaded SAR images of the Atrato river delta region exhibit the undesired granular pattern known as speckle, as shown in Figure 7. However, a significant advantage of these images is their robustness against of clouds or obstacles that might hinder satellite capture of surface or water information. Utilizing SAR images provides periodic information for comparing changes over time without data loss due to environmental phenomena, particularly clouds, which are common and can affect the selected region of interest.
Moreover, the raw SAR images serve as a foundational dataset that allows for a detailed analysis of the Atrato river delta’s morphological changes. The inherent speckle pattern, although a challenge, can be effectively addressed through advanced processing techniques. The absence of cloud cover in these images facilitates an uninterrupted observation of the study area, enabling the study to capture nuanced alterations in the delta’s structure over time. This reliability in data continuity, in conjunction with the detailed information provided by SAR, positions the study to unravel intricate patterns of erosion and progradation in the delta, contributing to a comprehensive understanding of its geomorphic dynamics.
5.2. Despeckling
The despeckling process applied to the SAR images yielded notable improvements in border preservation, as evidenced by a detailed visual analysis and comparison between the original SAR images and their filtered counterparts, as illustrated in Figure 7. Speckle, the granular noise inherent in SAR imagery, tends to obscure fine details and borders in raw images. However, the filtering algorithm effectively mitigated this issue, resulting in images with clearer and more defined borders. This enhancement is crucial, especially in a study focused on morphological changes such as erosion and progradation, where accurate delineation of features is essential.
To quantitatively assess the impact of despeckling, the Equivalent Number of Looks (ENL) was employed as a relevant metric. ENL is a measure of the effective resolution of an image, and an increase in ENL indicates an improvement in image quality. Before the despeckling process, SAR images typically exhibit a lower ENL due to the presence of speckle, which introduces unwanted variations and reduces the effective resolution. The significant increase in ENL observed after despeckling affirms the success of the filtering process in attenuating speckle. This metric not only corroborates the visual improvements but also provides a quantitative measure of the enhanced image quality.
The preservation of borders and the increase in ENL collectively contribute to the overall refinement of the SAR images, enhancing their utility for subsequent analyses. The filtered images serve as a more reliable foundation for extracting meaningful information regarding morphological changes in the Atrato river delta region. This improved dataset, free from the distortions introduced by speckle, strengthens the accuracy and precision of the study’s findings, ultimately contributing to a more robust understanding of the erosion and progradation dynamics in the area.
5.3. Composition
The process of composition, wherein the two polarizations (VV and VH) are mapped into three channels (RGB), represents a crucial step in integrating the wealth of information provided by SAR images into a comprehensible and visually interpretable format. The resulting composite images, exemplified in Figure 8 (left), effectively condense the complexity of dual-polarizations SAR data into a single, visually intuitive representation for each analyzed date.
The success of the composition lies in its ability to leverage the distinct characteristics of VV and VH polarizations to enhance the overall contrast between water and non-water regions. The VV channel, represented in red, captures backscattering signals that are predominantly vertical, while the VH channel, in green, captures signals with both horizontal and vertical components. By assigning the ratio of VV to VH as the blue channel, a balanced representation is achieved that encapsulates the complementary nature of the two polarizations. This synthesis creates a composite image that not only accentuates the unique signatures of water bodies but also highlights the variations in back scattering properties across different land cover types.
The resulting images exhibit a favorable level of contrast, enhancing the visual discrimination between water and non-water regions. This contrast is particularly crucial for the study’s objectives, where the identification of changes in water presence over time is central to understanding erosion and progradation dynamics in the Atrato river delta. The clarity achieved through composition facilitates the subsequent classification processes, enabling more accurate delineation of water boundaries and, consequently, providing a solid foundation for the detection and measurement of erosion and progradation.
Moreover, the composited images serve as a valuable tool for qualitative analysis, allowing researchers to visually inspect and interpret the observed changes in the landscape. The color-coded representation offers an immediate visual understanding of the spatial distribution of water bodies, making it easier to identify patterns and trends across multiple dates. This visual richness enhances the interpretability of the study’s findings and contributes to a more comprehensive analysis of the morphological changes occurring in the Atrato river delta over the study period.
5.4. Classification
The effectiveness of the classification process using Otsu’s method is noteworthy, as it autonomously determined an optimal threshold value, yielding a single-band classified image with distinct values of 0 for non-water areas and 255 for water regions. This outcome is visually demonstrated in the right of Figure 8, showcasing the clarity achieved in distinguishing between land and water features.
It is essential to highlight that, despite having a three-band image resulting from the composition process, the classification exclusively relied on the VH polarization band. This deliberate choice was driven by the study’s specific focus on water detection and measurement of changes in water presence over land or vice versa (erosion and progradation). By concentrating on the VH band, the classification process effectively bypassed potential confounding factors related to variations in vegetation, which may not be directly pertinent to the primary research objectives.
This strategic selection aligns with the study’s emphasis on detecting alterations in water and land patterns, streamlining the classification process to enhance its specificity to relevant features. In the context of future applications where the sole analysis of water dynamics is paramount, this focused approach remains valuable. However, it is acknowledged that for endeavors centered on detecting changes in land cover, preserving the RGB image might offer additional insights, especially when considering the influence of vegetation on land transformations. The intentional trade-off made in this study between specificity and broader contextual information underscores the adaptability of the methodology based on the research goals and the characteristics of the landscape under investigation.
5.5. Heatmap
The dynamic interplay between erosion and progradation is vividly depicted through the visual representation of red and yellow areas in Figure 9. These colors signify the alternating presence and absence of water in the identified regions throughout the sixteen analyzed periods. While the heatmap does not provide a precise temporal sequence of individual erosion or progradation events, it amalgamates the collective water behavior over time into a unified image. This holistic approach facilitates the identification of areas undergoing periodic changes in water dynamics, contributing to a comprehensive understanding of the evolving landscape.
The significance of our findings is underscored by the congruence with their observations presented in [3]. Specifically, the region known as “El Roto”, which took shape between the late 19th century and the early 20th century, emerges as one of the most dynamic areas in terms of erosion and progradation processes. This synchronicity between our analysis and the previous study provides additional validation for our methodology and reinforces the robustness of the results. The mutual corroboration of findings across different studies enhances the credibility of the identified erosion and progradation patterns, emphasizing the consistency and reliability of the outcomes derived from our multitemporal SAR analysis.
5.6. Erosion and progradation time series
The operations applied to analyze the changes from one to the next show green overlays for progradation and red ones for erosion. As shown in Figure 10, there are areas with a lot of progradation (left) corresponding to the changes from 20160611 to 20161214, while a lot of erosion (right) is shown corresponding to the changes from 20161214 to 20170531. This can also be seen in Table 1 and Figure 11.
The results obtained from the processing of the SAR images allow focusing attention on the most hydraulically active area, the aforementioned mouth of “El Roto”, where the progradation and erosion processes are most evident, which vary in clear dependence on the multi-temporal range in which the data is captured, as determined in the selection of the images, seeking to obtain a multi-year analysis from 2016 to 2023, where for each year images were selected, both in the dry season (December, January, February) and in the wet season (April, May, June). This analysis made it possible to capture varied hydroclimatic moments where events were manifested with diverse occurrences that in turn have hydrological influence in the area, such as the multiannual cycle of precipitation related to the Intertropical Convergence Zone - ITCZ; El Niño Southern Oscillation - ENSO with its El Niño and La Niña phases, with notable changes in precipitation regimes, among others. Various studies conclude that ENSO is the one that most influences Colombian hydroclimatology at interannual scales, especially in its La Niña phase, and therefore it is considered in this study [20,21,22,23,24,25,26].
As seen in Figure 11, erosion and progradation phenomena usually occur in opposite trends for the analyzed interval, however, they can occur simultaneously in increases and decreases of both phenomena, confirming the coexistence of both processes in the study area. The Oceanic Niño Index (ONI), which is a quarterly indicator on the behavior of ENSO phases in the Pacific Ocean, demonstrates macroscale hydroclimatic aspects with impacts on erosion and progradation processes. In addition, the dry seasons of the area are highlighted (in gray), with a monomodal regime as explained above, to try to capture coupling between these two hydroclimatic variations and the hydraulic effects considered.
With respect to the estimated behavior of the erosion process versus the ONI index, a relative delayed coupling of the phenomenon is evident when there is a phase change from La Niña to El Niño such as those that occurred in the first half of 2017 and 2018. In the first half of 2023, the erosion process experienced increases generally related to the contribution of sediments to the Gulf of Urabá typical of the rainy phase. It can also be observed that the maximum erosion value identified in the middle of the first half of 2021 results from a weakening of the intensity during the La Niña phase and after the end of a dry phase, both phenomena signify a decrease in water contributions to the Caribbean Sea and possibly a greater record of erosion in the region. There is no marked coupling between the dry hydroclimatic season at the beginning of the year and the series, since while some years coincide with decreases, in others there are increases in the erosion rate.
Regarding the progradation process, trends partially coupled with the ONI index series are observed, finding a relative recurrence of an increase in progradation after a decrease in ONI values, which results in an increase in precipitation at from the weakening of El Niño and a strengthening of the La Niña phase and therefore, the injection of sediments into the gulf that favor this progradation. For progradation, there seems to be a coupling with the dry hydroclimatic season, where the highest values are recorded in contrast to the wet season. This coupling would be associated with the delay of the wet signal that lasts until that time, so that when the season of less rainfall begins, the basin is still evacuating through its mouths the water levels of the previous season, favoring the injection of sediments in the Gulf of Urabá and the respective progradation. Then, a decrease is evident in the middle of the wet season, perhaps associated with the decrease in flows from the preceding hydrological phase.
Between the processes of erosion and progradation, the decoupling of the series stands out, which indicates that increases in the values of one of them do not imply a decrease in the values of the other, and this reiterates the coexistence of both phenomena in the study area. This coexistence could be due to the fact that the phenomena are associated with two different bodies of water, the sea and river, which are in constant interaction, and that their dynamics are associated with different hydraulic processes that favor the simultaneous manifestation of both in the delta areas. For the first two values of progradation and erosion reported, a very high contrast of values is found, probably related to the marked preceding hydroclimatic change, where a weak La Niña phase was exited after one of the most intense El Niño phases in recent years (2016-2017), which could significantly force land growth values at the land-water interface of the Gulf of Urabá.
The analysis and estimation of the spatial change rates of the phenomena are carried out in a zonal manner, so the reported values correspond not to a single point but to an entire region, where the phenomena occur at different rhythms and can coexist. For a more detailed analysis of these couplings, subsequent studies should delve deeper into including more hydroclimatic variables that have an influence on the study area and whose hydrological weight can help explain the variations in the growth and decrease rates of the digitized delta of the Atrato river.
The data found also show consistency with the study by [27] and the Global Surface Water (GSW) tool by [28], which used Landsat images for the last three decades, with spatial resolutions of 30 meters, to find data on the extent and change of water bodies around the planet. Among the data provided by the GSW are the occurrence, absolute change, seasonality, recurrence, transition and maximum extension of water bodies, which, as can be seen below, are closely related to the results of this study, even though it is limited only to the last 6 years.
As seen in the Global Surface Water [28], the changes are spatially concentrated in the same areas detected as hydraulically relevant in this study, such as the mouths: “El Roto”, “Tarena” and “Matungo” (see Figure 12 compared to Figure 9). These results confirm the spatial detection of the phenomena in the study area based on SAR data and for much shorter time periods, confirming the high hydraulic dynamism and the convenience of these resources.
The Atrato river delta is therefore an area of high hydraulic variability related to the hydroclimatic and even social patterns of the tributary basin. The coexistence of both phenomena and their relationship with hydroclimatology have been studied in the past but require more analysis based on the data offered by satellite remote sensing. This study serves as a starting point to continue exploring this area with hydroclimatic complexity that complicates the scanning of passive sensors but which can be scanned by active sensors such as SAR; and whose periodicity could be considered more constant to have a greater density of detection of the rates of change associated with erosion and progradation and to understand more clearly the relationship between both phenomena and hydroclimatology at different spatial and temporal scales. This area, of high biological and ecosystem interest, could even serve as a kind of thermometer indicator of the susceptibility of tropical coastal zones and associated ecosystems (such as mangroves) to hydroclimatic changes in the context of climate change, which has altered the patterns of intensity and recurrence of the forcings of these coastline changes across the planet.
5.7. Future research
Future research directions might be focused on improving the quality of the images, specially during the despeckling process. It is known from the literature that the current despeckling techniques still affect the borders and edge preservation of the images and do not fully remove the speckle. Also, it could be focused on designing another pipeline that better classifies, detects and measures the erosion and progradation compared to this study. It could be possible to use another composition of RGB bands, another classifier or another modified mathematical operation to improve the results. Modifying this pipeline to detect changes in land cover, for example, in urban areas in order to detect deforestation due to construction or in rural areas to detect deforestation, illegal mining, illicit crops, and so on. Finally, the same study could be conducted to increase the number of years and frequency of data analyzed to make predictions and statistically evaluate the behavior of the trends. This last alternative is limited to the availability of SAR data in the region of interest, in the particular case of Sentinel-1 only data from 2016 on is available.
Author Contributions
Rubén Darío Vásquez-Salazar: Conceptualization, Methodology, Writing - Original Draft; Ahmed Alejandro Cardona-Mesa: Methodology, Writing - Original Draft; Juan Valdés-Quintero: Conceptualization, Methodology & Investigation; César Olmos-Severiche: Conceptualization, Methodology & Investigation; Luis Gómez: Conceptualization, Methodology, Formal Analysis, Writing - Review & Editing; Carlos M. Travieso-Gonzalez: Conceptualization, Methodology, Formal Analysis, Writing - Review & Editing; Jean Pierre Díaz-Paz: Conceptualization, Methodology, Analysis, Writing - Original Draft;Jorge E. Espinosa-Oviedo: Conceptualization, Methodology & Investigation. Lorena Diez-Rendón: Resources, Writing - Original Draft; Andrés F. Garavito-González: Software, Writing - Original Draft; Esteban Vásquez-Cano: Software, Writing - Original Draft. All authors have read and agreed to the published version of the manuscript.
Funding
This research was funded by Politécnico Colombiano Jaime Isaza Cadavid (Colombia) through the project called “Detección de variaciones multitemporales en coberturas vegetales del Valle de Aburrá usando imágenes de radar de apertura sintética (SAR) y herramientas de visión por computador e inteligencia artificial”.
Institutional Review Board Statement
Not applicable.
Informed Consent Statement
Not applicable
Data Availability Statement
All scripts and images used in this paper are available at: https://github.com/rubenchov/Paper_Coastal_V3.
Acknowledgments
Many thanks to Politécnico Colombiano Jaime Isaza Cadavid (Colombia) for funding the project and to the University of Las Palmas de Gran Canaria (Spain) for its support in the project as a co-executor. Special thanks to the platform ASF Data Search Vertex from the University of Alaska and the European Space Agency (ESA) for the free availability of Copernicus and Sentinel SAR images used in this study.
Conflicts of Interest
The authors declare no conflict of interest.
Abbreviations
The following abbreviations are used in this manuscript:
| SAR | Synthetic Aperture Radar |
| ENL | Equivalent Number of Looks |
| ROI | Region Of Interest |
| GEE | Google Earth Engine |
| DL | Deep Learning |
| SLC | Single Look Complex |
| GRD | Ground Range Detected |
| HD | High Definition |
| OCN | Ocean |
| ONI | Oceanic Niño Index |
| VV | Vertical Vertical |
| VH | Vertical Horizontal |
| SM | Stripmap |
| IW | Interferometric Wide swath |
| EW | Extra-Wide swath |
| ENSO | El Niño-Southern Oscillation climate pattern |
References
- IDEAM. Atlas climatológico de Colombia, 2023. Accessed on November 28, 2023.
- de Hidrología Meteorología y Estudios Ambientales IDEAM, I. La variabilidad climática y el cambio climático en Colombia, 2018. Accessed on November 28, 2023.
- Vélez-Castaño, J.D.; Betancurth-Montes, G.L.; Cañon-Barriga, J.E. Erosion and progradation in the Atrato River delta: A spatiotemporal analysis with Google Earth Engine. Revista Facultad de Ingeniería Universidad de Antioquia.
- Court, C.C. Expediente T-5.016.242, 2016. Accessed on November 28, 2023.
- Blanco-Libreros, J.F. Cambios globales en los manglares del golfo de Urabá (Colombia): entre la cambiante línea costera y la frontera agropecuaria en expansión. 2016.
- Restrepo, J.D.; Alvarado, E.M. 11.12 – Assessing Major Environmental Issues in the Caribbean and Pacific Coasts of Colombia, South America: An Overview of Fluvial Fluxes, Coral Reef Degradation, and Mangrove Ecosystems Impacted by River Diversion. 2011.
- Restrepo, J.D.; Kjerfve, B. The Pacific and Caribbean Rivers of Colombia: Water Discharge, Sediment Transport and Dissolved Loads. 2004.
- Duránn, I.D.C.; Daza, R.J.M. Multitemporal analysis of the flow of sediments using MODIS MYD09 and MOD09 images. Ciencia e Ingeniería Neogranadina.
- Velez, J.; Betancurth, L.; Cañón-Barriga, J. Erosion and progradation in the Atrato River delta: A spatiotemporal analysis with Google Earth Engine. Revista Facultad de Ingeniería Universidad de Antioquia. [CrossRef]
- NASA. ASF Data Search, 2023. Accessed on November 28, 2023.
- ESA. Sentinel-1 Missions, 2023. Accessed on November 28, 2023.
- ESA. Ground Range Detected Sentinel-1, 2023.
- for Environmental Prediction, N.C. ONI - Cold & Warm Episodes by Season, 2023. Accessed on November 28, 2023.
- Vásquez-Salazar, R.D.; Cardona-Mesa, A.A.; Gómez, L.; Travieso-González, C.M. A new methodology for assessing SAR despeckling filters. TechRxiv 2023. [Google Scholar] [CrossRef]
- ESA. User guides - Sentinel-1 SAR - polarimetry - sentinel online, 2023. Accessed on November 28, 2023.
- Otsu, N. A Threshold Selection Method from Gray-Level Histograms. IEEE Transactions on Systems, Man, and Cybernetics 1979, 9, 62–66. [Google Scholar] [CrossRef]
- Xue, J.H.; Titterington, D.M. t -Tests, F -Tests and Otsu’s Methods for Image Thresholding. IEEE Transactions on Image Processing 2011, 20, 2392–2396. [Google Scholar] [CrossRef] [PubMed]
- Rublee, E.; Rabaud, V.; Konolige, K.; Bradski, G.R. ORB: An efficient alternative to SIFT or SURF. 2011 International Conference on Computer Vision, 2564. [Google Scholar] [CrossRef]
- Viswanathan, D. Features from Accelerated Segment Test (FAST). 2011.
- Díaz, D.P.; Villegas, N. Correlación canónica entre índices macroclimáticos y variables meteorológicas de superficie en Colombia. 2015.
- Gil, M.M.; Quiceno, N.; Poveda, G. Efecto del ENSO y la NAO sobre el ciclo anual de la hidrología de Colombia: análisis de correlación, reanálisis de NCEP/NCAR y modelos de pronóstico. 1998.
- Martínez, J.A.; Arias, P.A.; Castro, C.L.; Chang, H.I.; Ochoa-Moya, C.A. Sea surface temperature-related response of precipitation in northern South America according to a WRF multi-decadal simulation. International Journal of Climatology 2018, 39, 2136–2155. [Google Scholar] [CrossRef]
- Poveda, G. La Hidroclimatología de Colombia: Una síntesis desde la escala inter-decadal hasta la escala diurna. Revista de la Academia Colombiana de Ciencias Exactas, Físicas y Naturales.
- Poveda, G.; Mesa, O.; Agudelo, P.A.; Álvarez, J.F. Diagnóstico del Ciclo Diurno de la Precipitación en los Andes Tropicales de Colombia, 2002. Accessed on November 28, 2023.
- Poveda, G.; Mesa, O.J. Feedbacks between Hydrological Processes in Tropical South America and Large-Scale Ocean–Atmospheric Phenomena. Journal of Climate 1997, 10, 2690–2702. [Google Scholar] [CrossRef]
- Restrepo, J.C.; Ortíz, J.C.; Pierini, J.O.; Schrottke, K.; Maza, M.; Otero, L.; Aguirre, J. Freshwater discharge into the Caribbean Sea from the rivers of Northwestern South America (Colombia): Magnitude, variability and recent changes. Journal of Hydrology 2014, 509, 266–281. [Google Scholar] [CrossRef]
- Du, J.; Kimball, J.S.; Galantowicz, J.F.; Kim, S.; Chan, S.T.K.; Reichle, R.H.; Jones, L.A.; Watts, J.D. Assessing global surface water inundation dynamics using combined satellite information from SMAP, AMSR2 and Landsat. Remote sensing of environment 2018, 213, 1–17. [Google Scholar] [CrossRef] [PubMed]
- Pekel, J.F.; Cottam, A.; Gorelick, N.; Belward, A.S. High-resolution mapping of global surface water and its long-term changes. Nature 2016, 540, 418–422. [Google Scholar] [CrossRef]
Figure 1.
Region of interest: Delta of the Atrato river in Colombia.
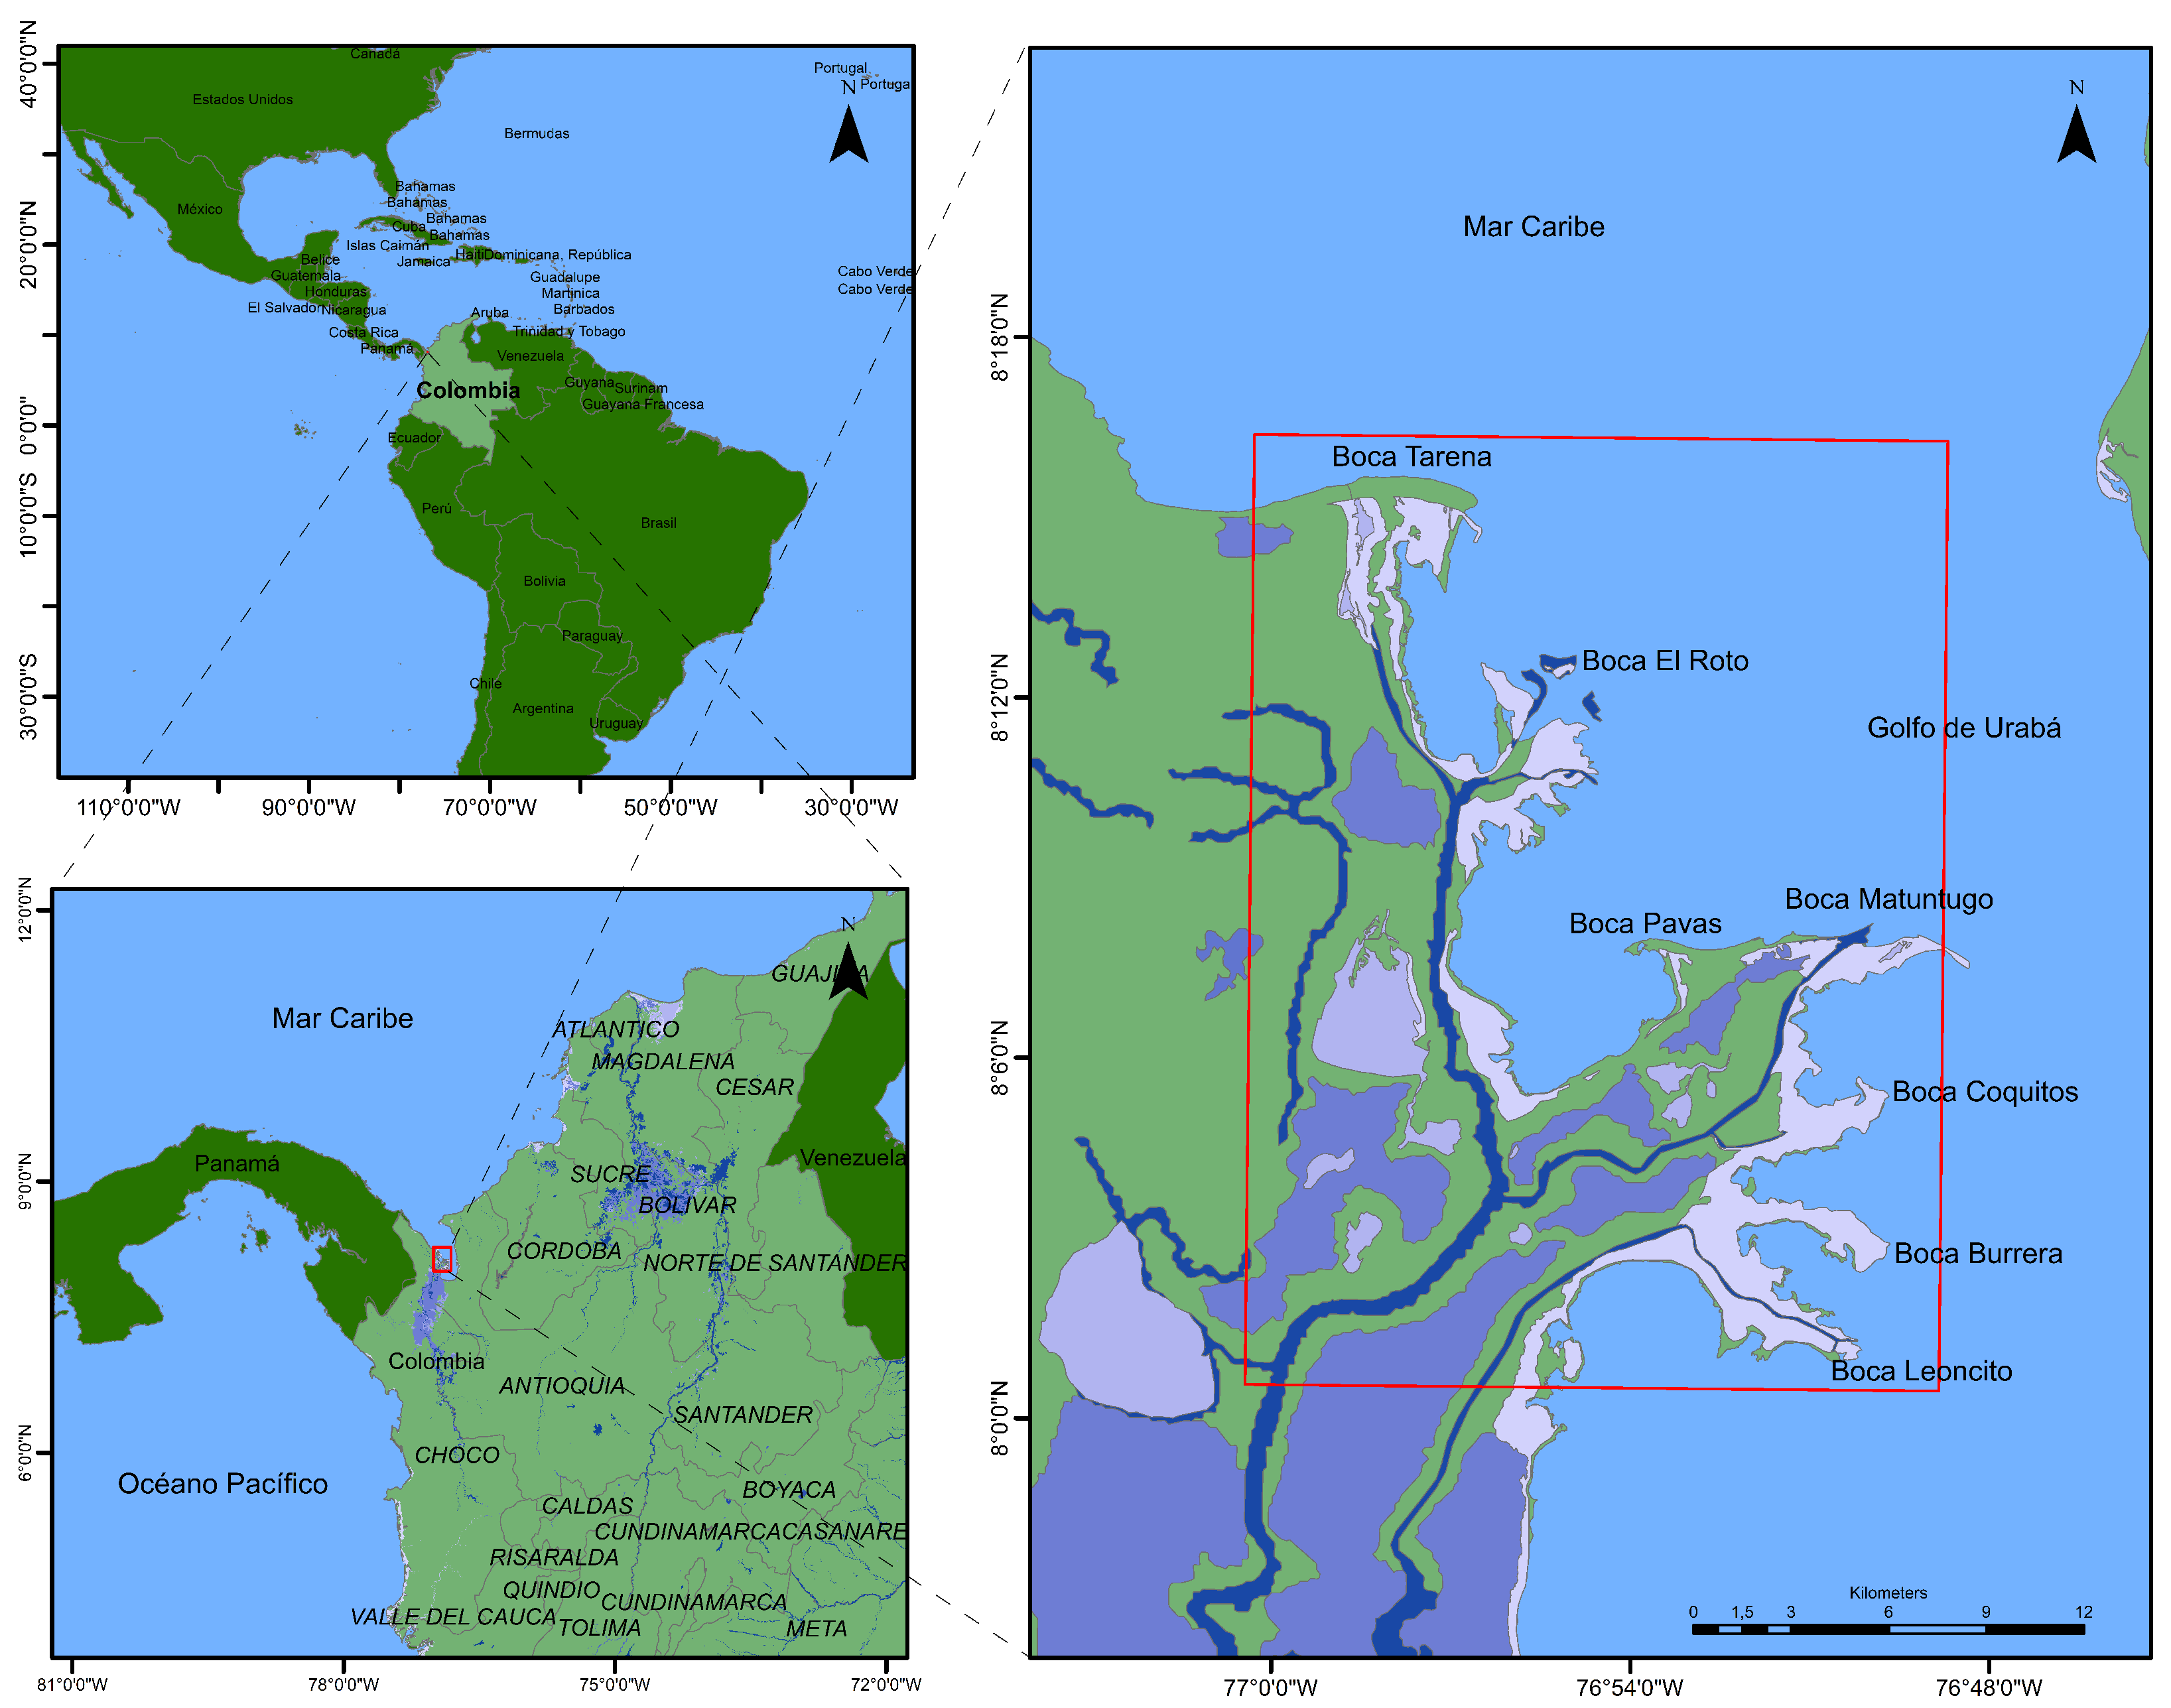
Figure 2.
Images of the region of interest captured by Sentinel 2 satellites in five different dates of 2023.
Figure 2.
Images of the region of interest captured by Sentinel 2 satellites in five different dates of 2023.
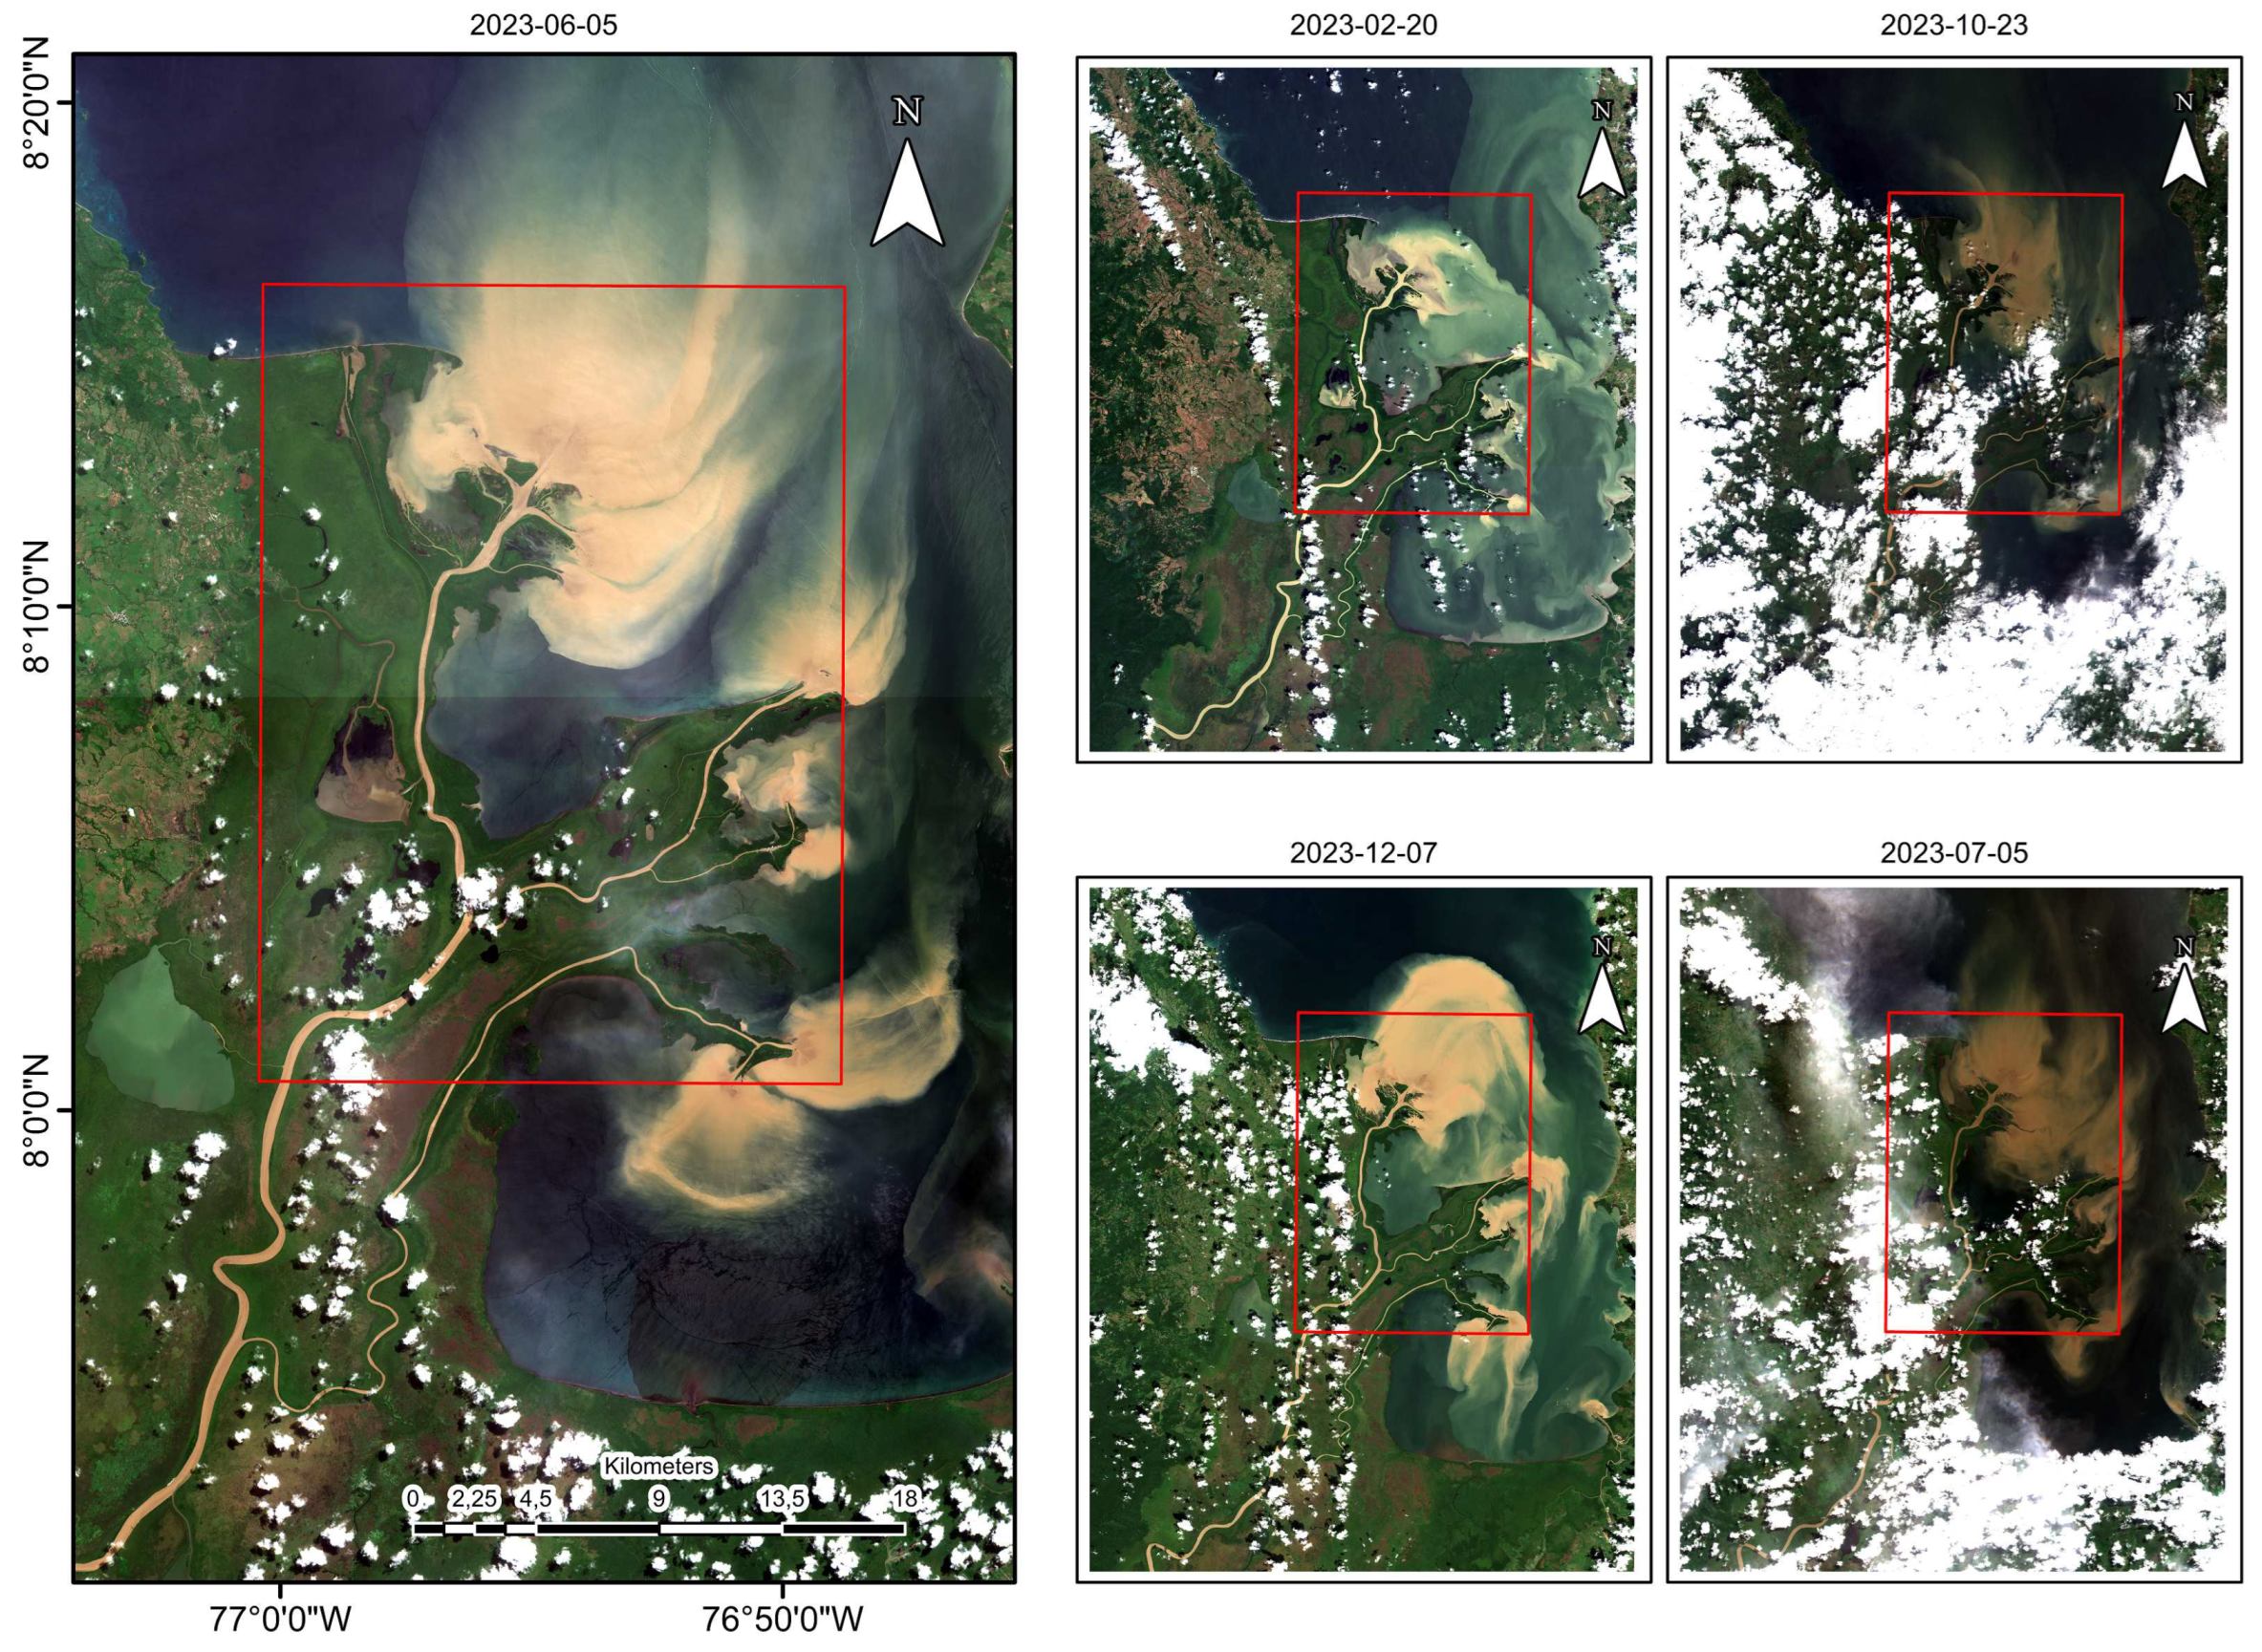
Figure 3.
and polarizations on SAR images collected for distinct periods.
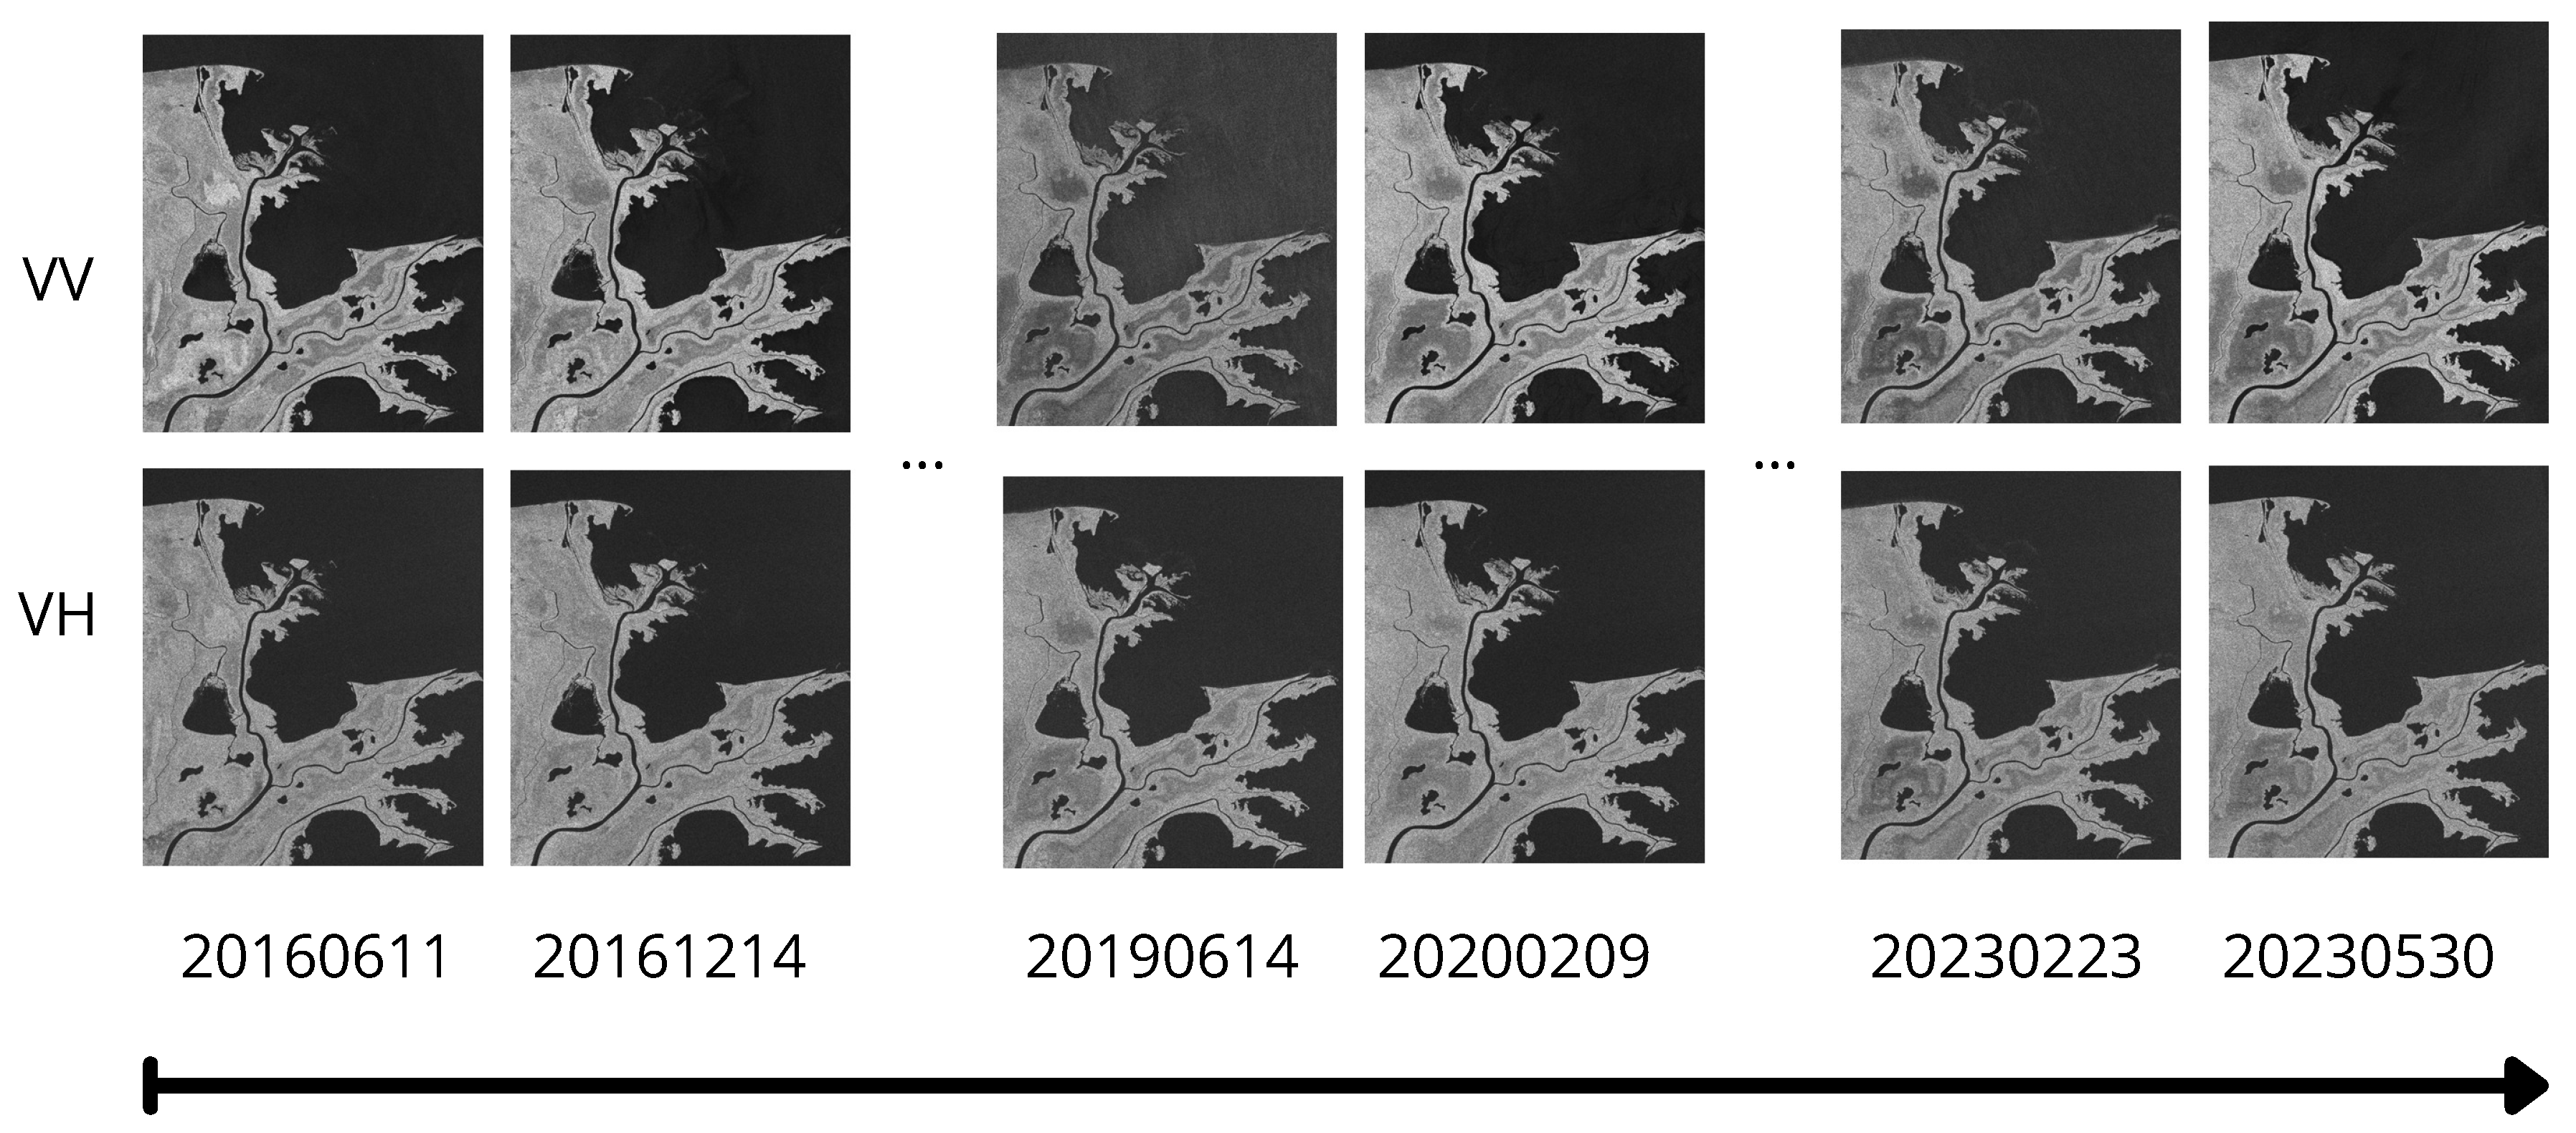
Figure 5.
Autoencoder for filtering.
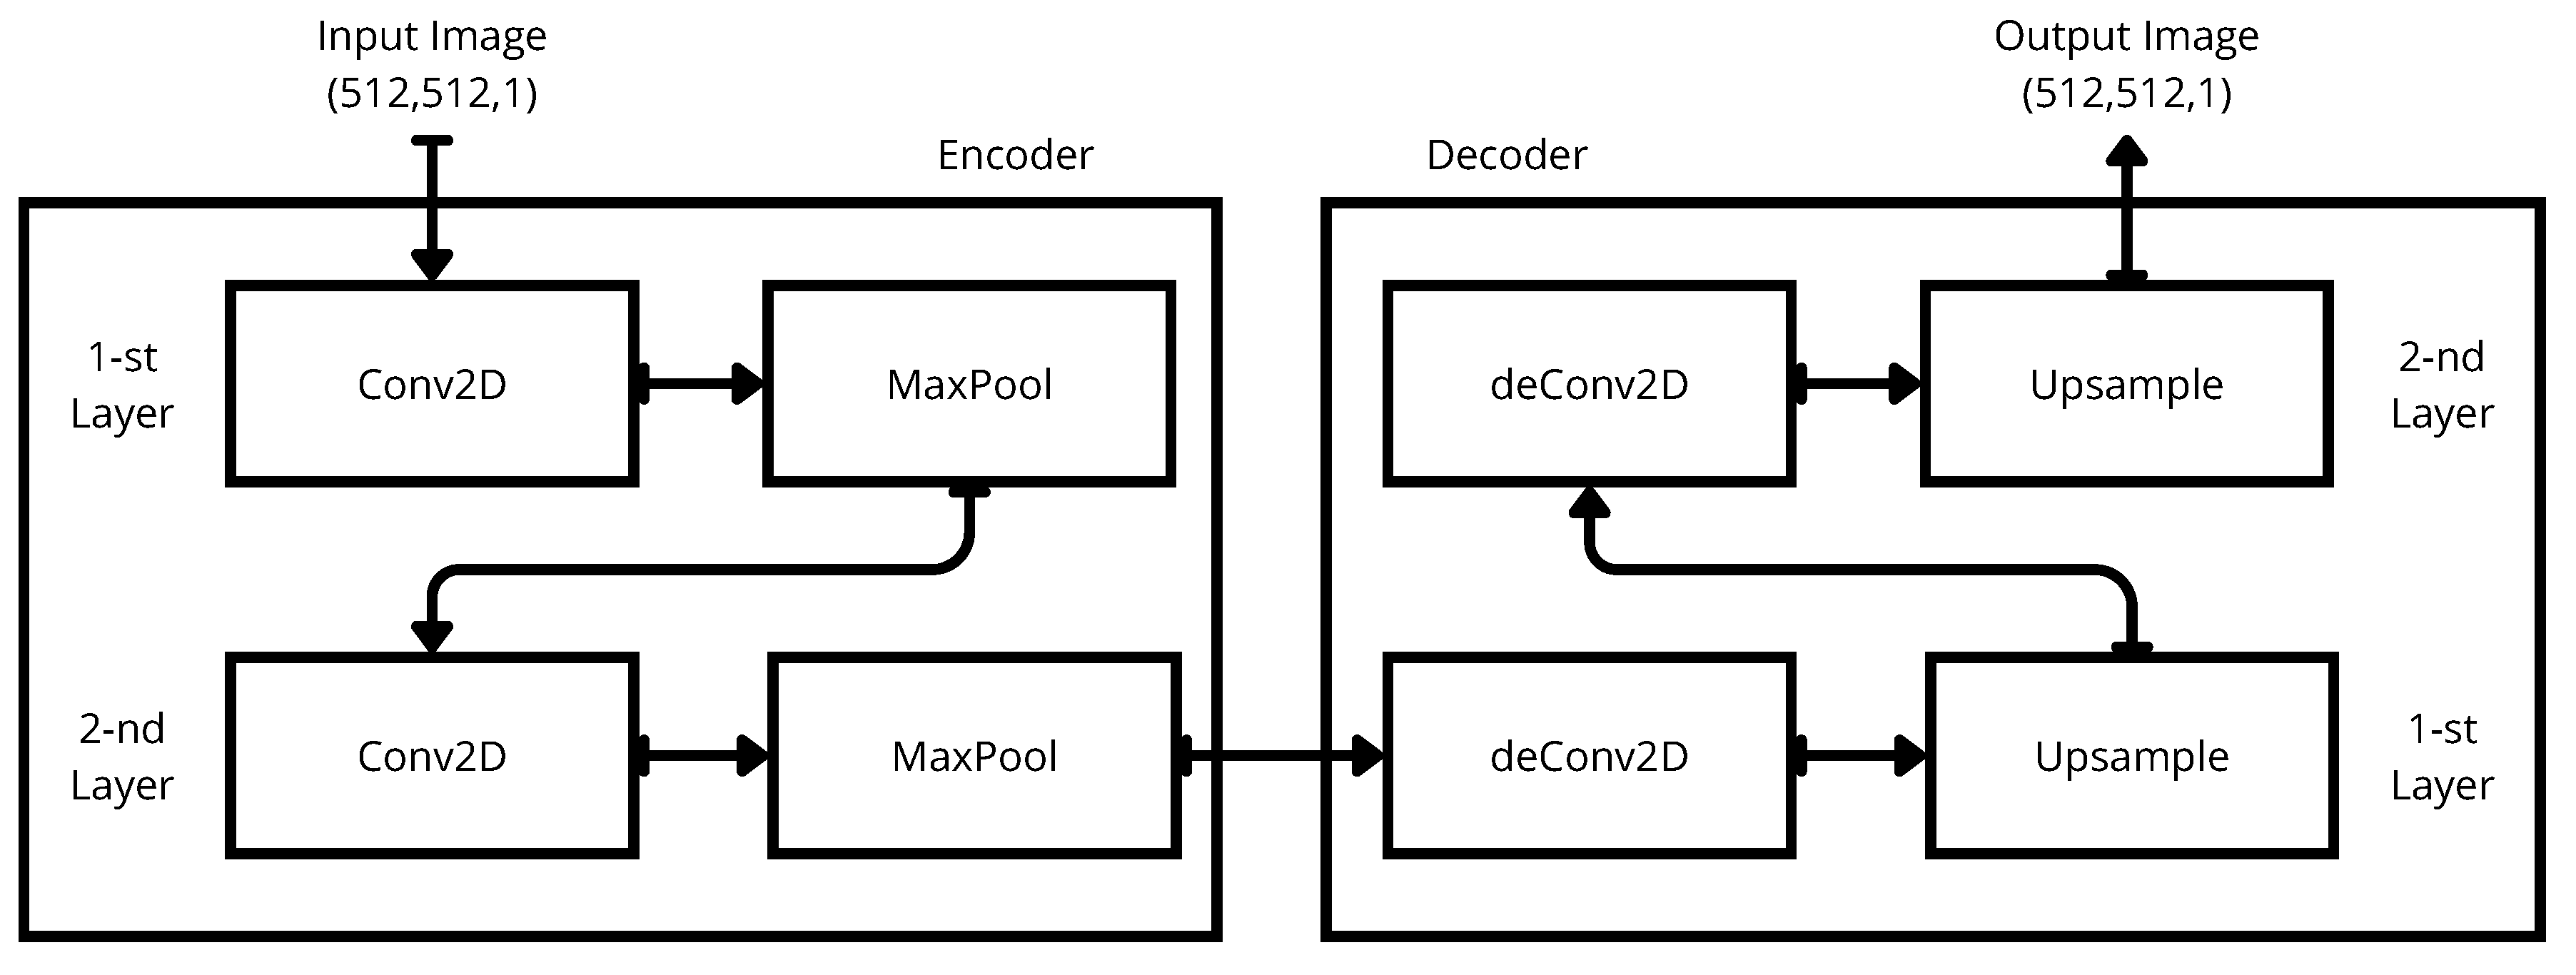
Figure 6.
Histograms of every images. From left to right: , , .
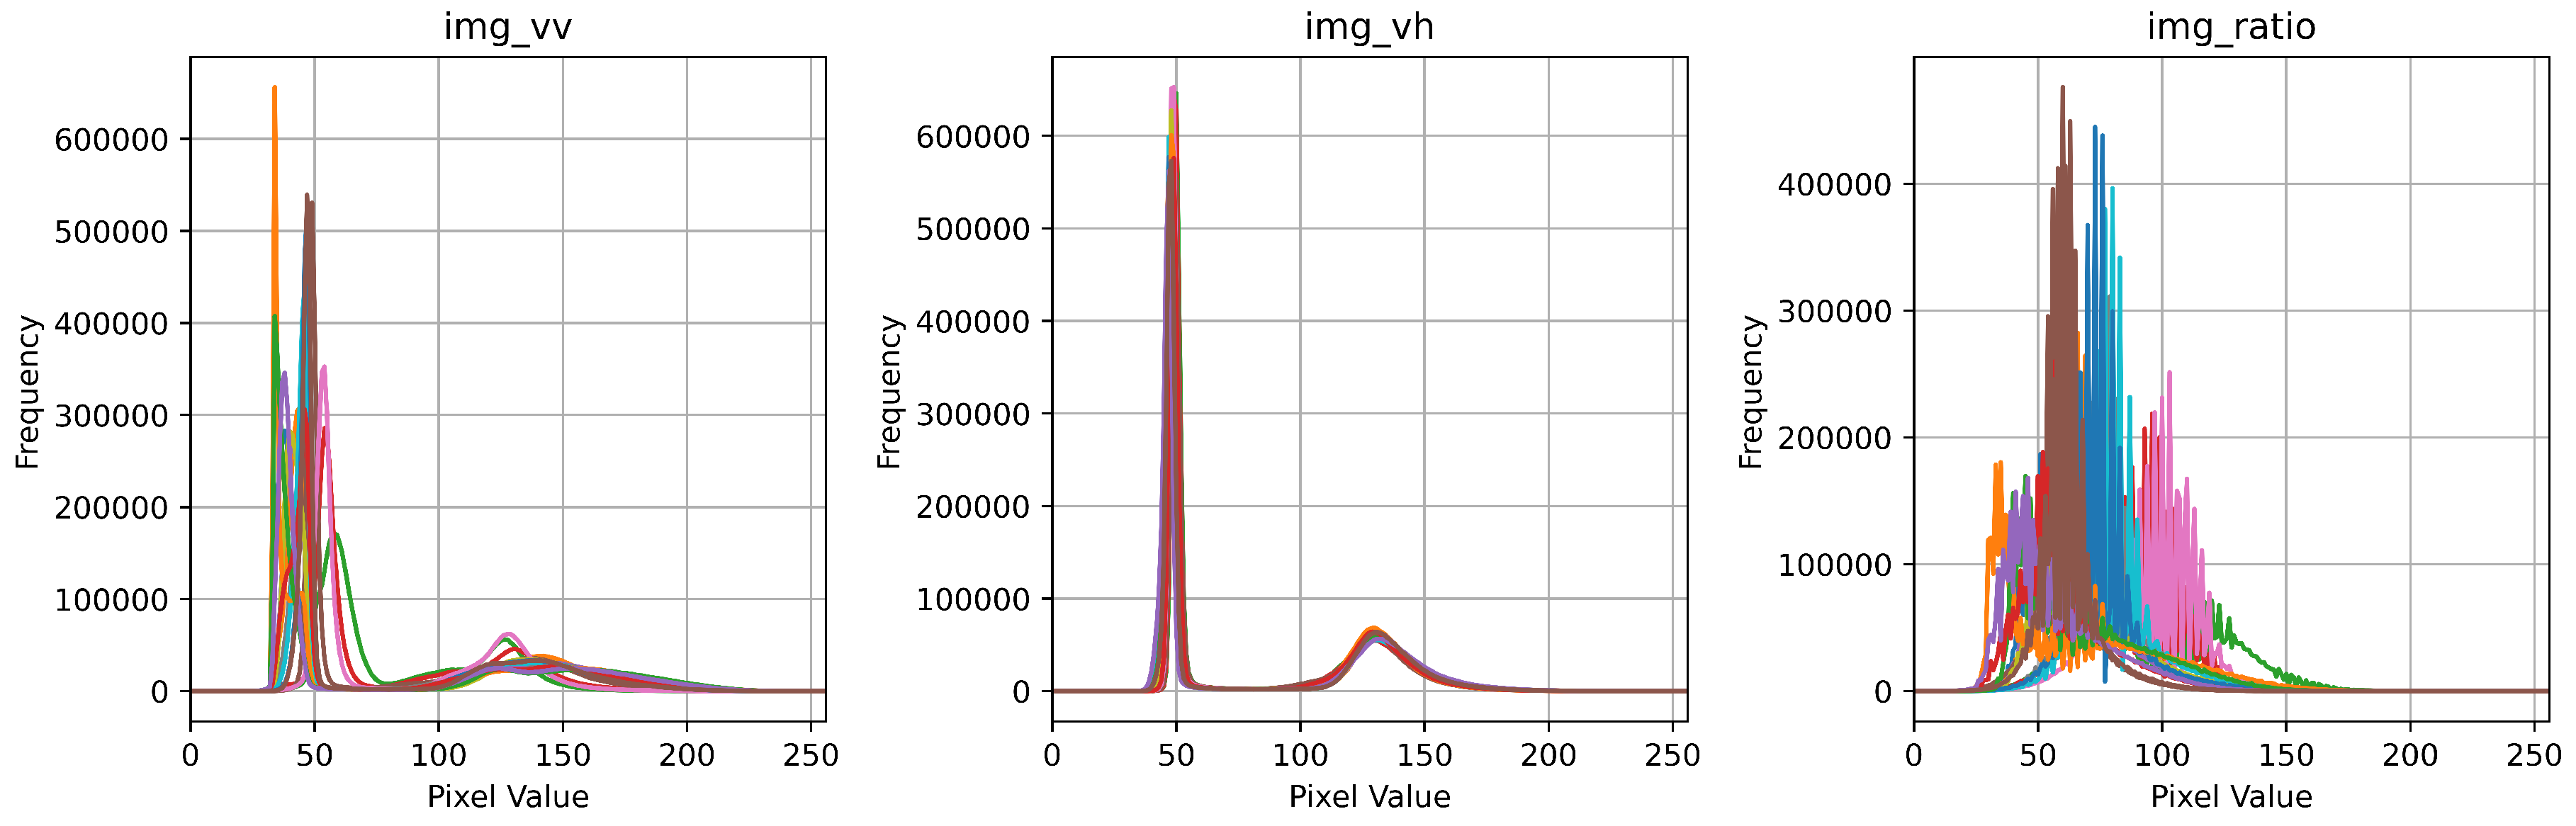
Figure 7.
SAR images rescaled and filtered). Polarizations (left) and (right). Noisy (top) and despeckled (down).
Figure 7.
SAR images rescaled and filtered). Polarizations (left) and (right). Noisy (top) and despeckled (down).
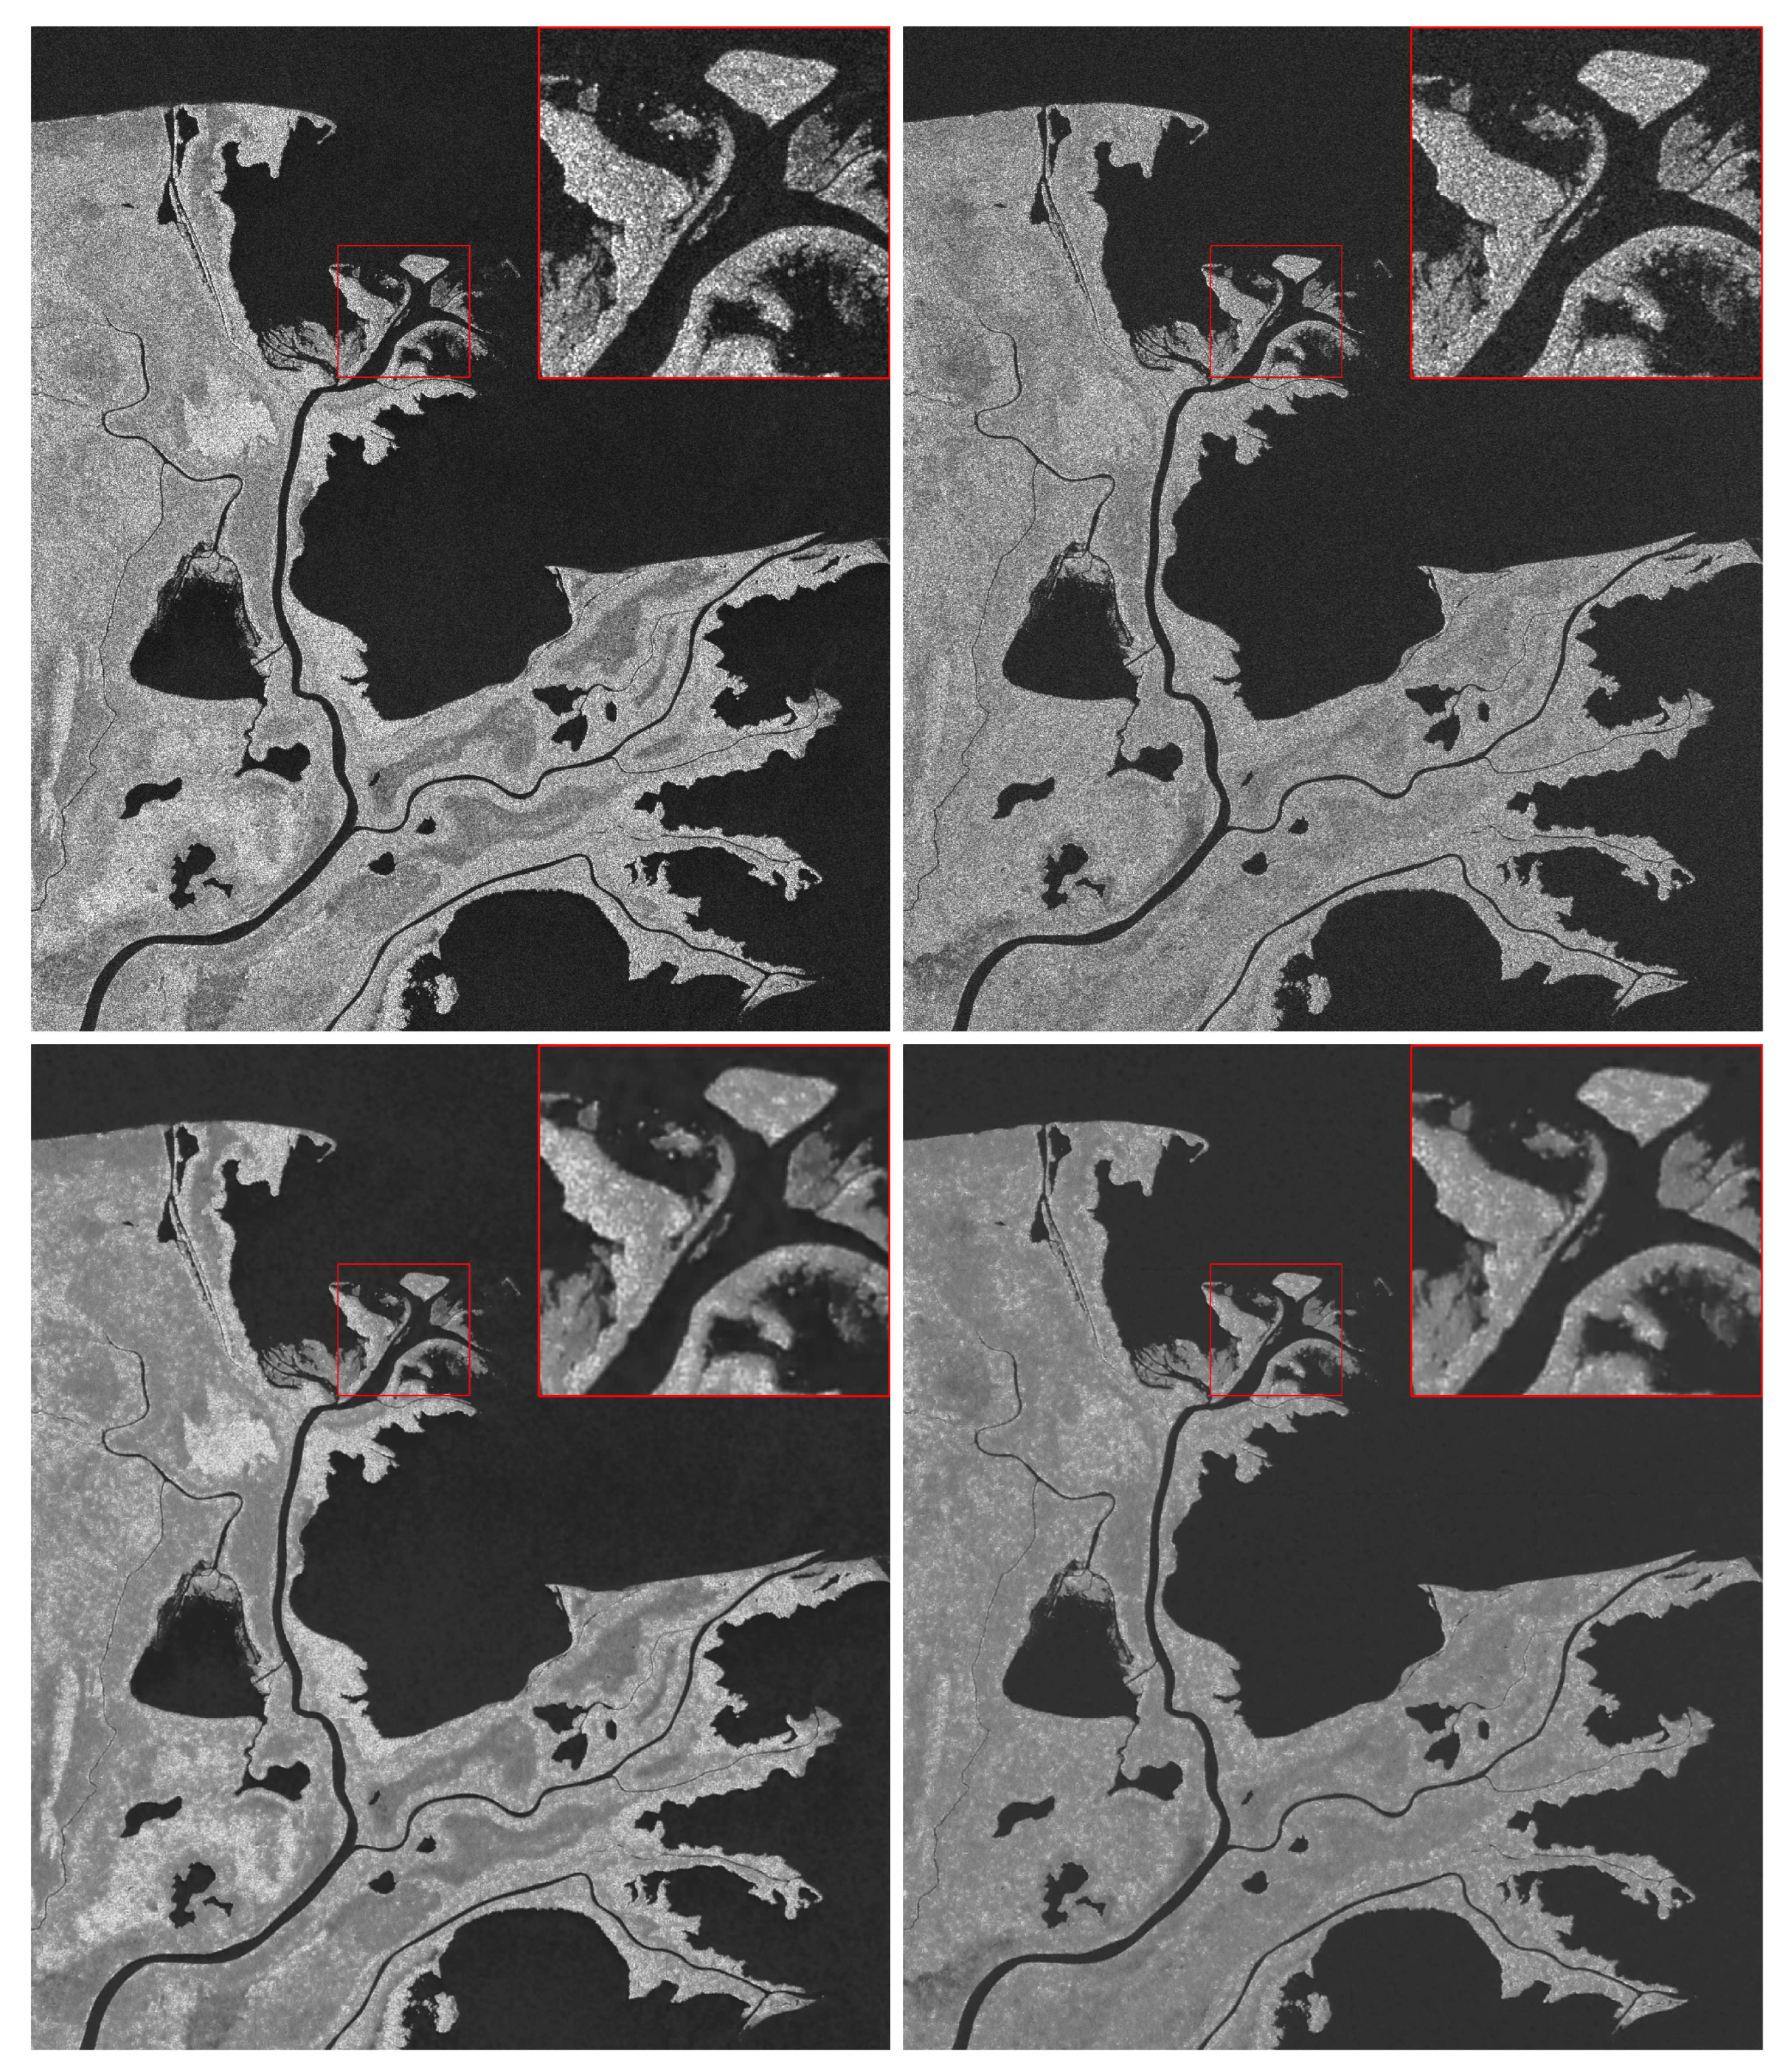
Figure 8.
Composition (left) and classification of one sample (right).
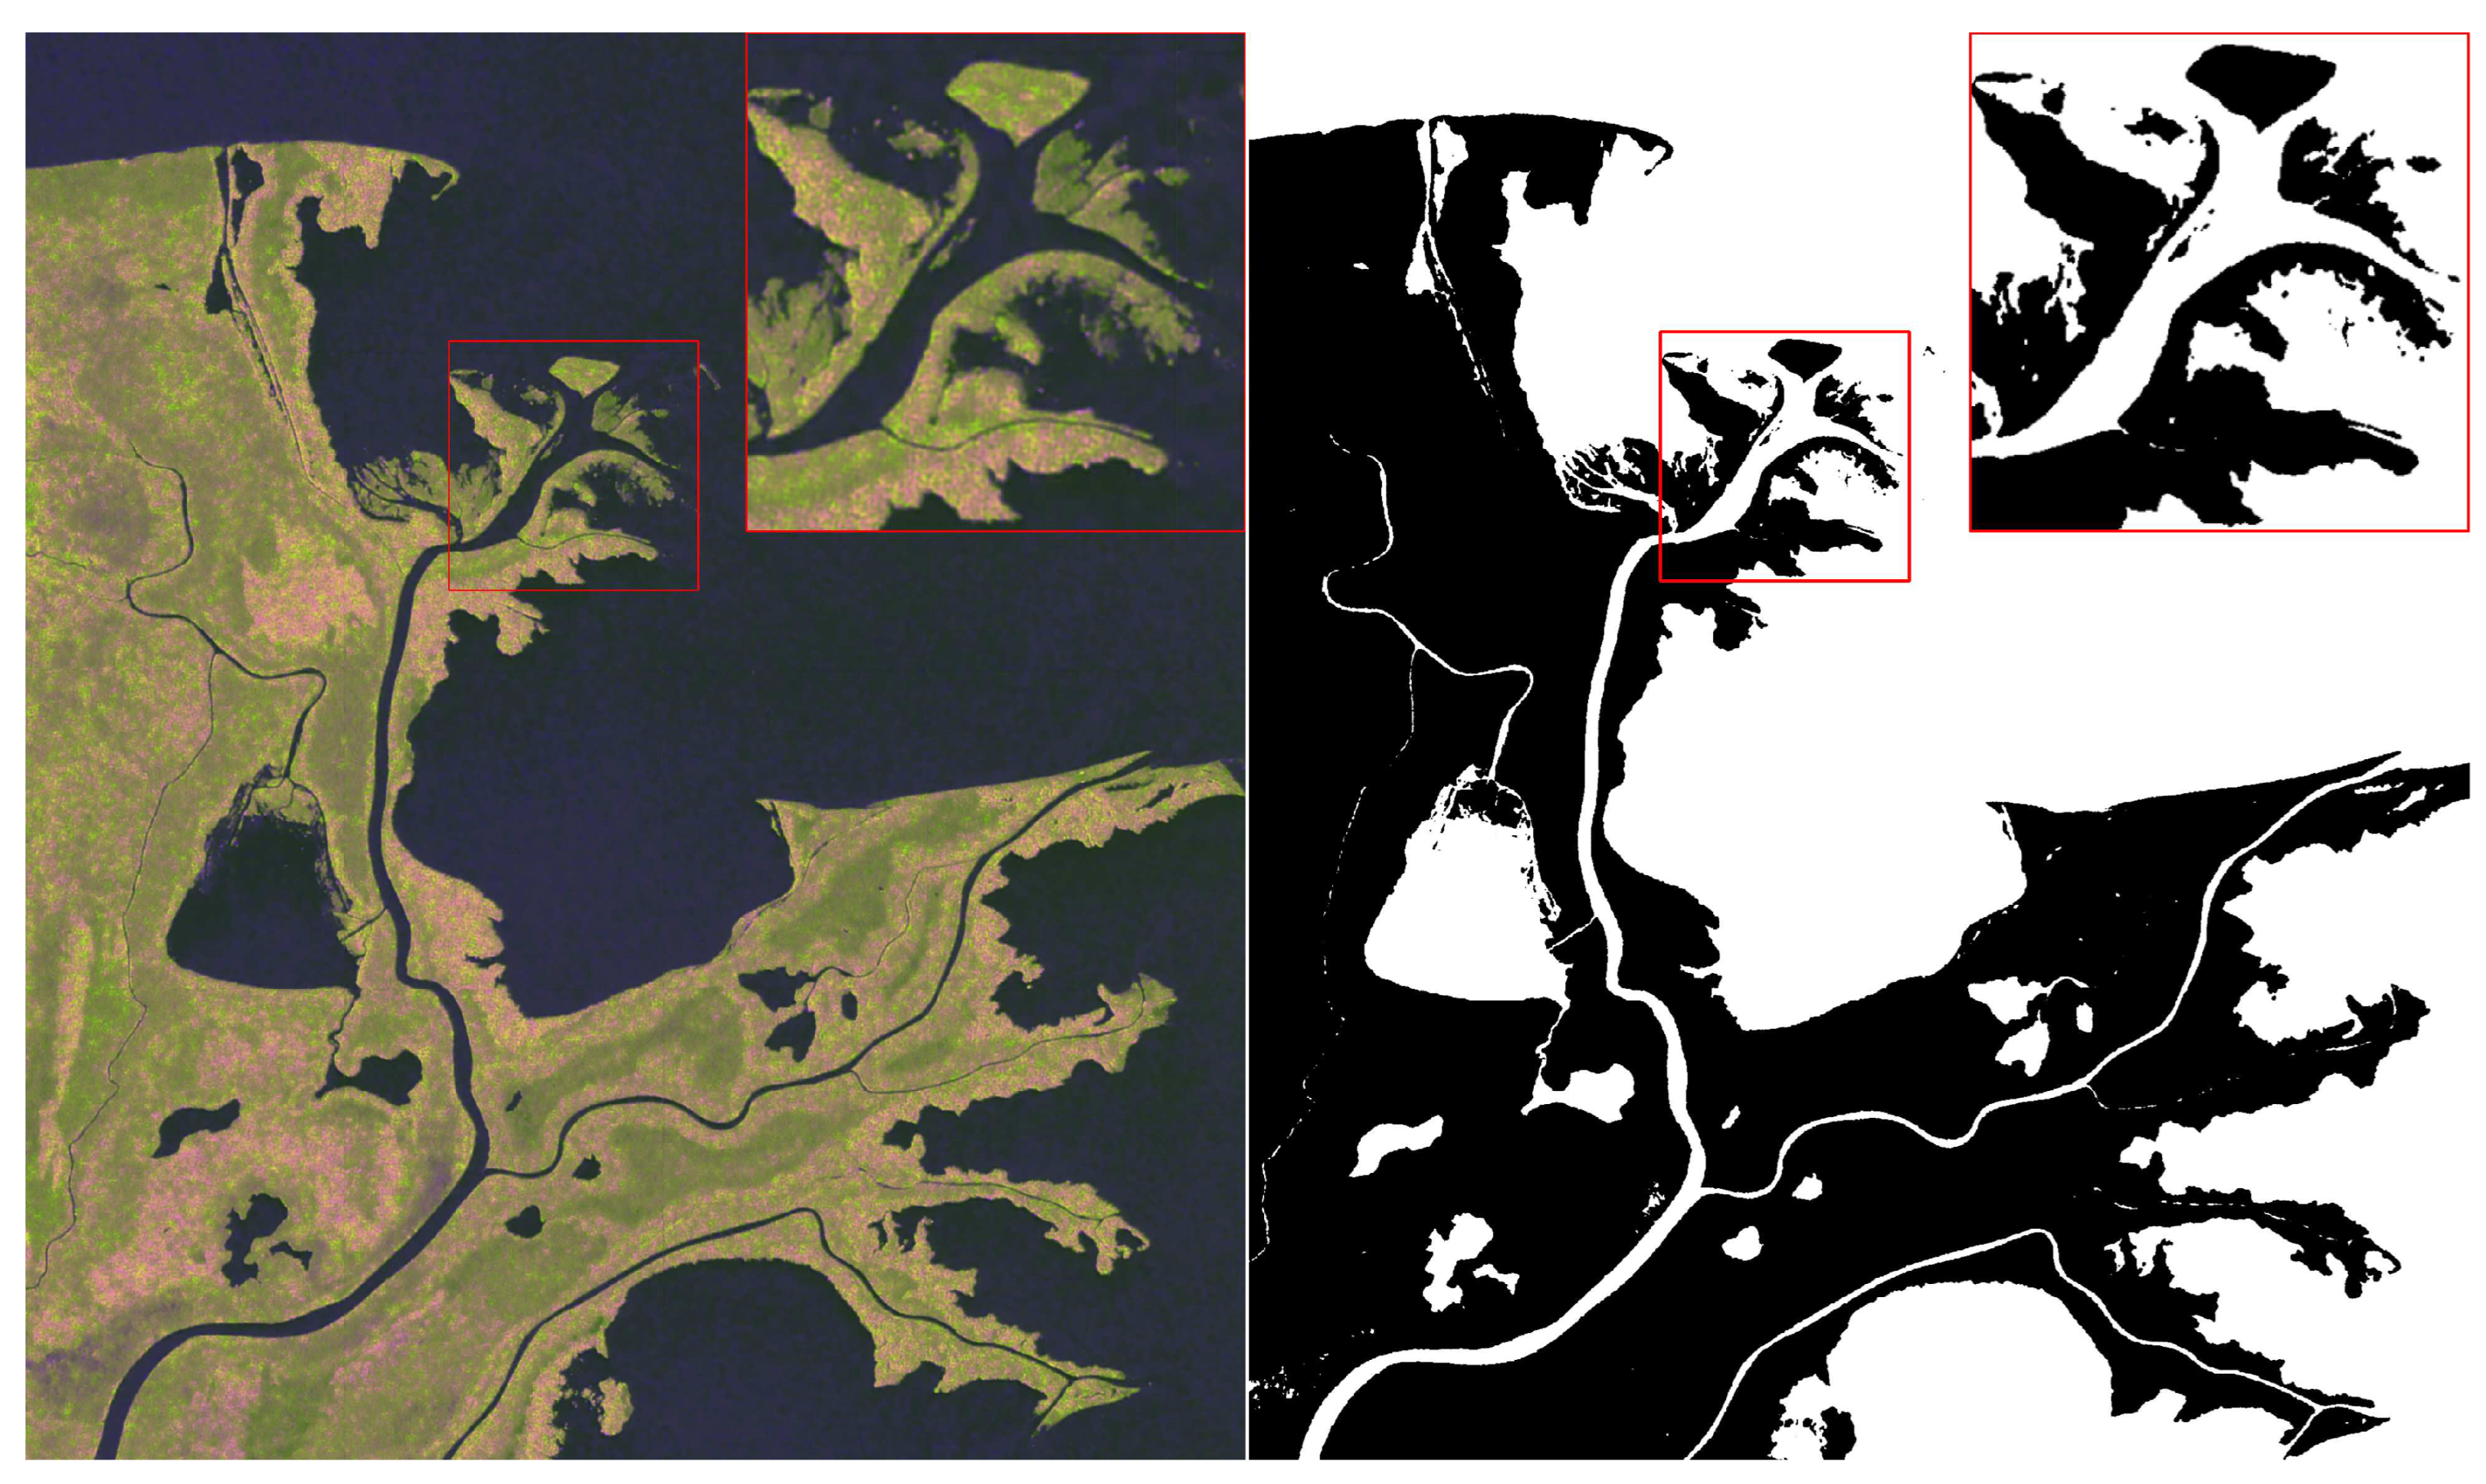
Figure 9.
Heatmap of the sixteen classified images.
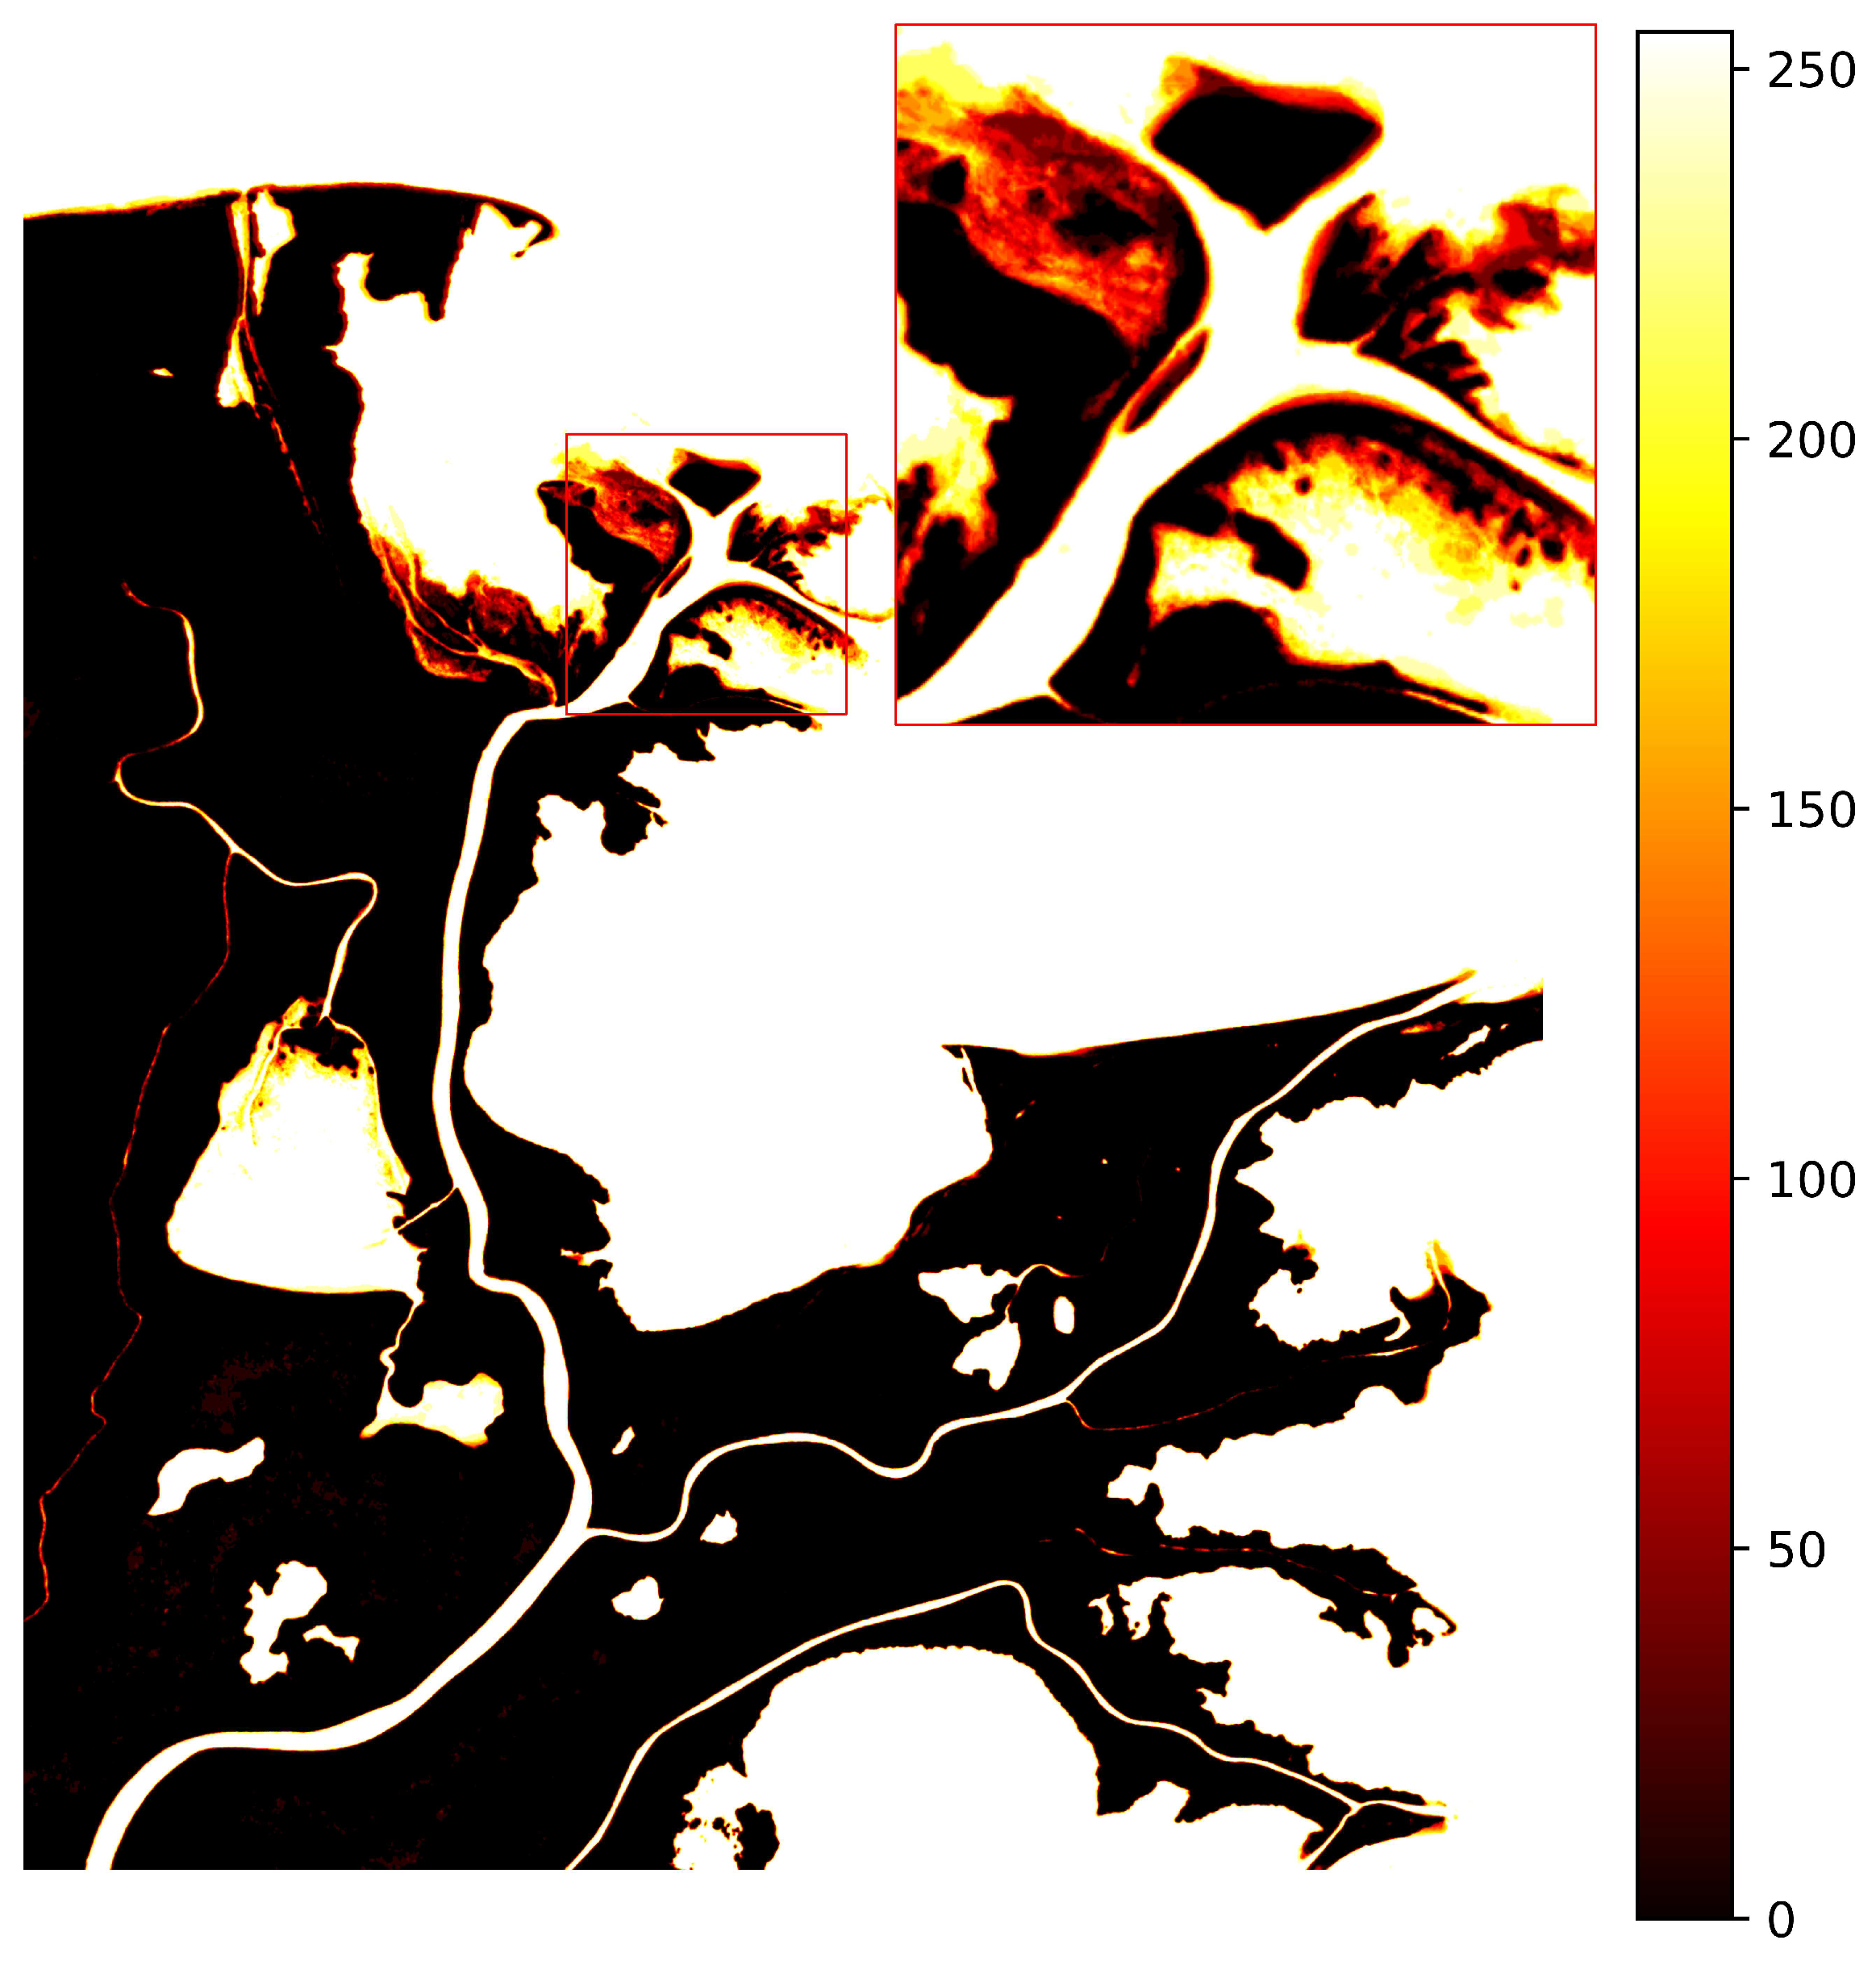
Figure 10.
Detection of progradation (green areas) and erosion (red areas) in 20160611 Vs 20161214 (left) and 20210627 Vs 20220228 (right).
Figure 10.
Detection of progradation (green areas) and erosion (red areas) in 20160611 Vs 20161214 (left) and 20210627 Vs 20220228 (right).
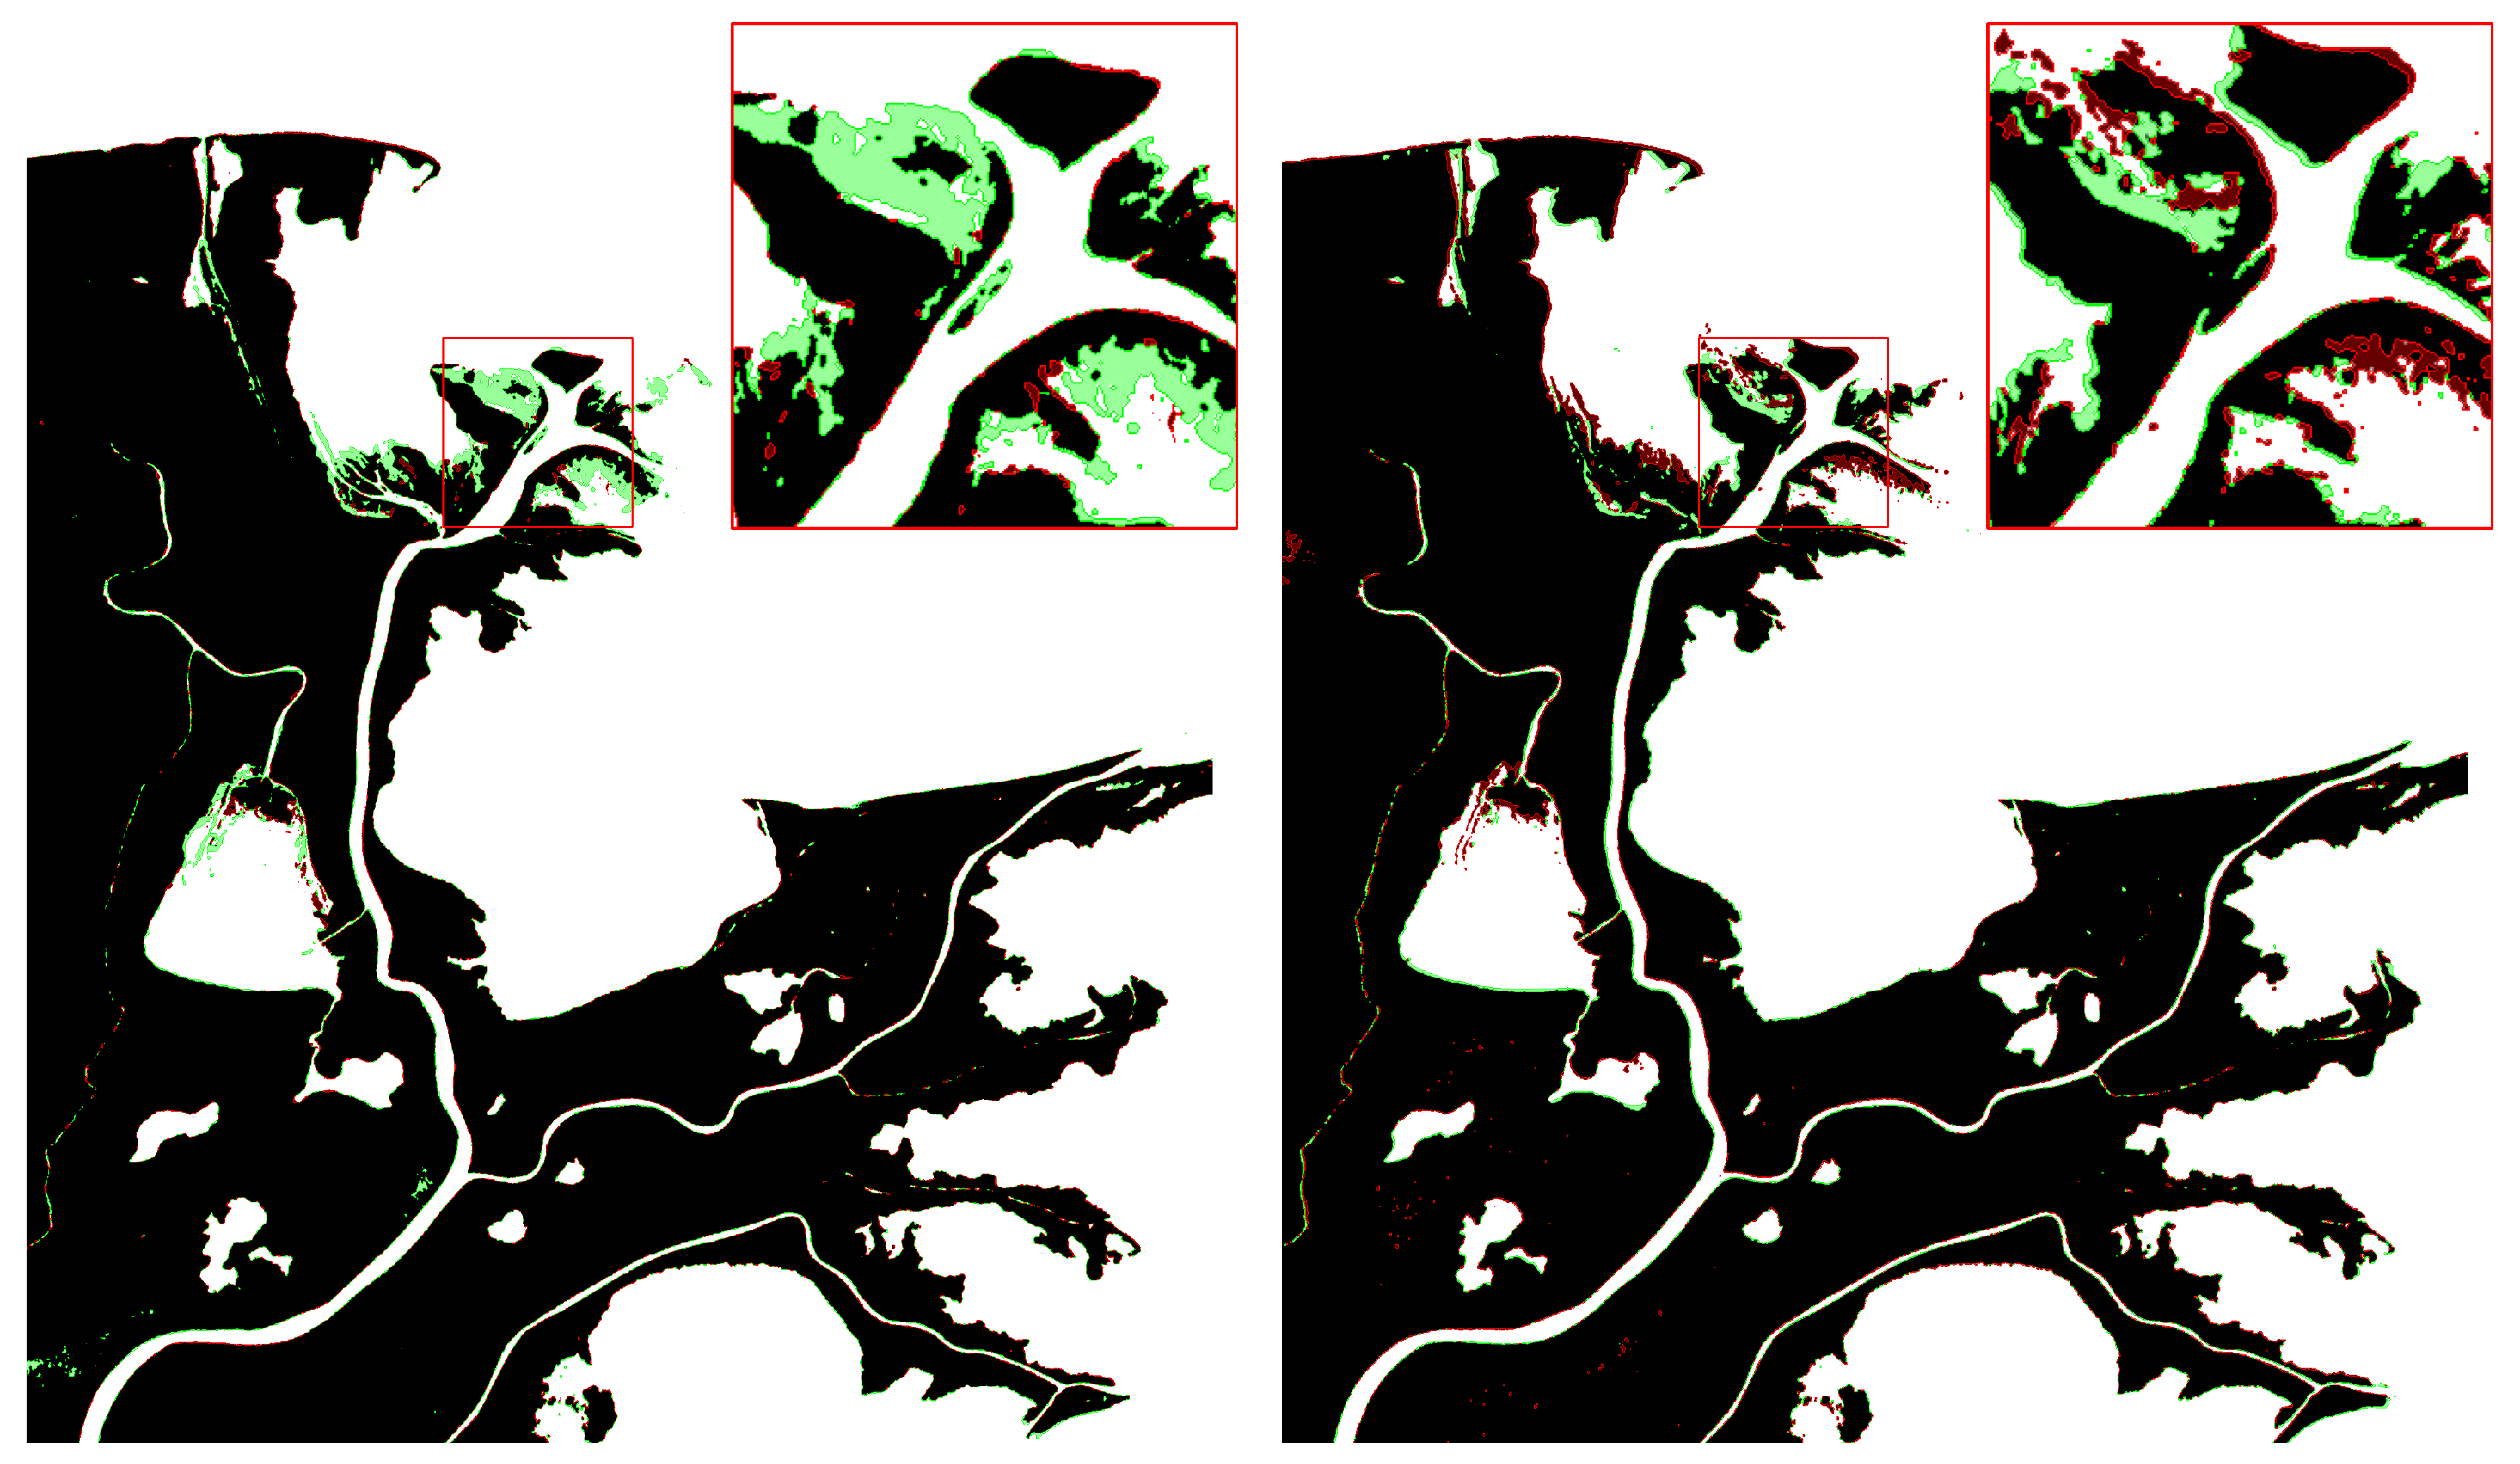
Figure 11.
Measurement of erosion and progradation in vs ONI from 2016 to 2023 in the region of interest. Dry seasons from December to February in gray rectangular overlays and wet seasons with no overlay.
Figure 11.
Measurement of erosion and progradation in vs ONI from 2016 to 2023 in the region of interest. Dry seasons from December to February in gray rectangular overlays and wet seasons with no overlay.
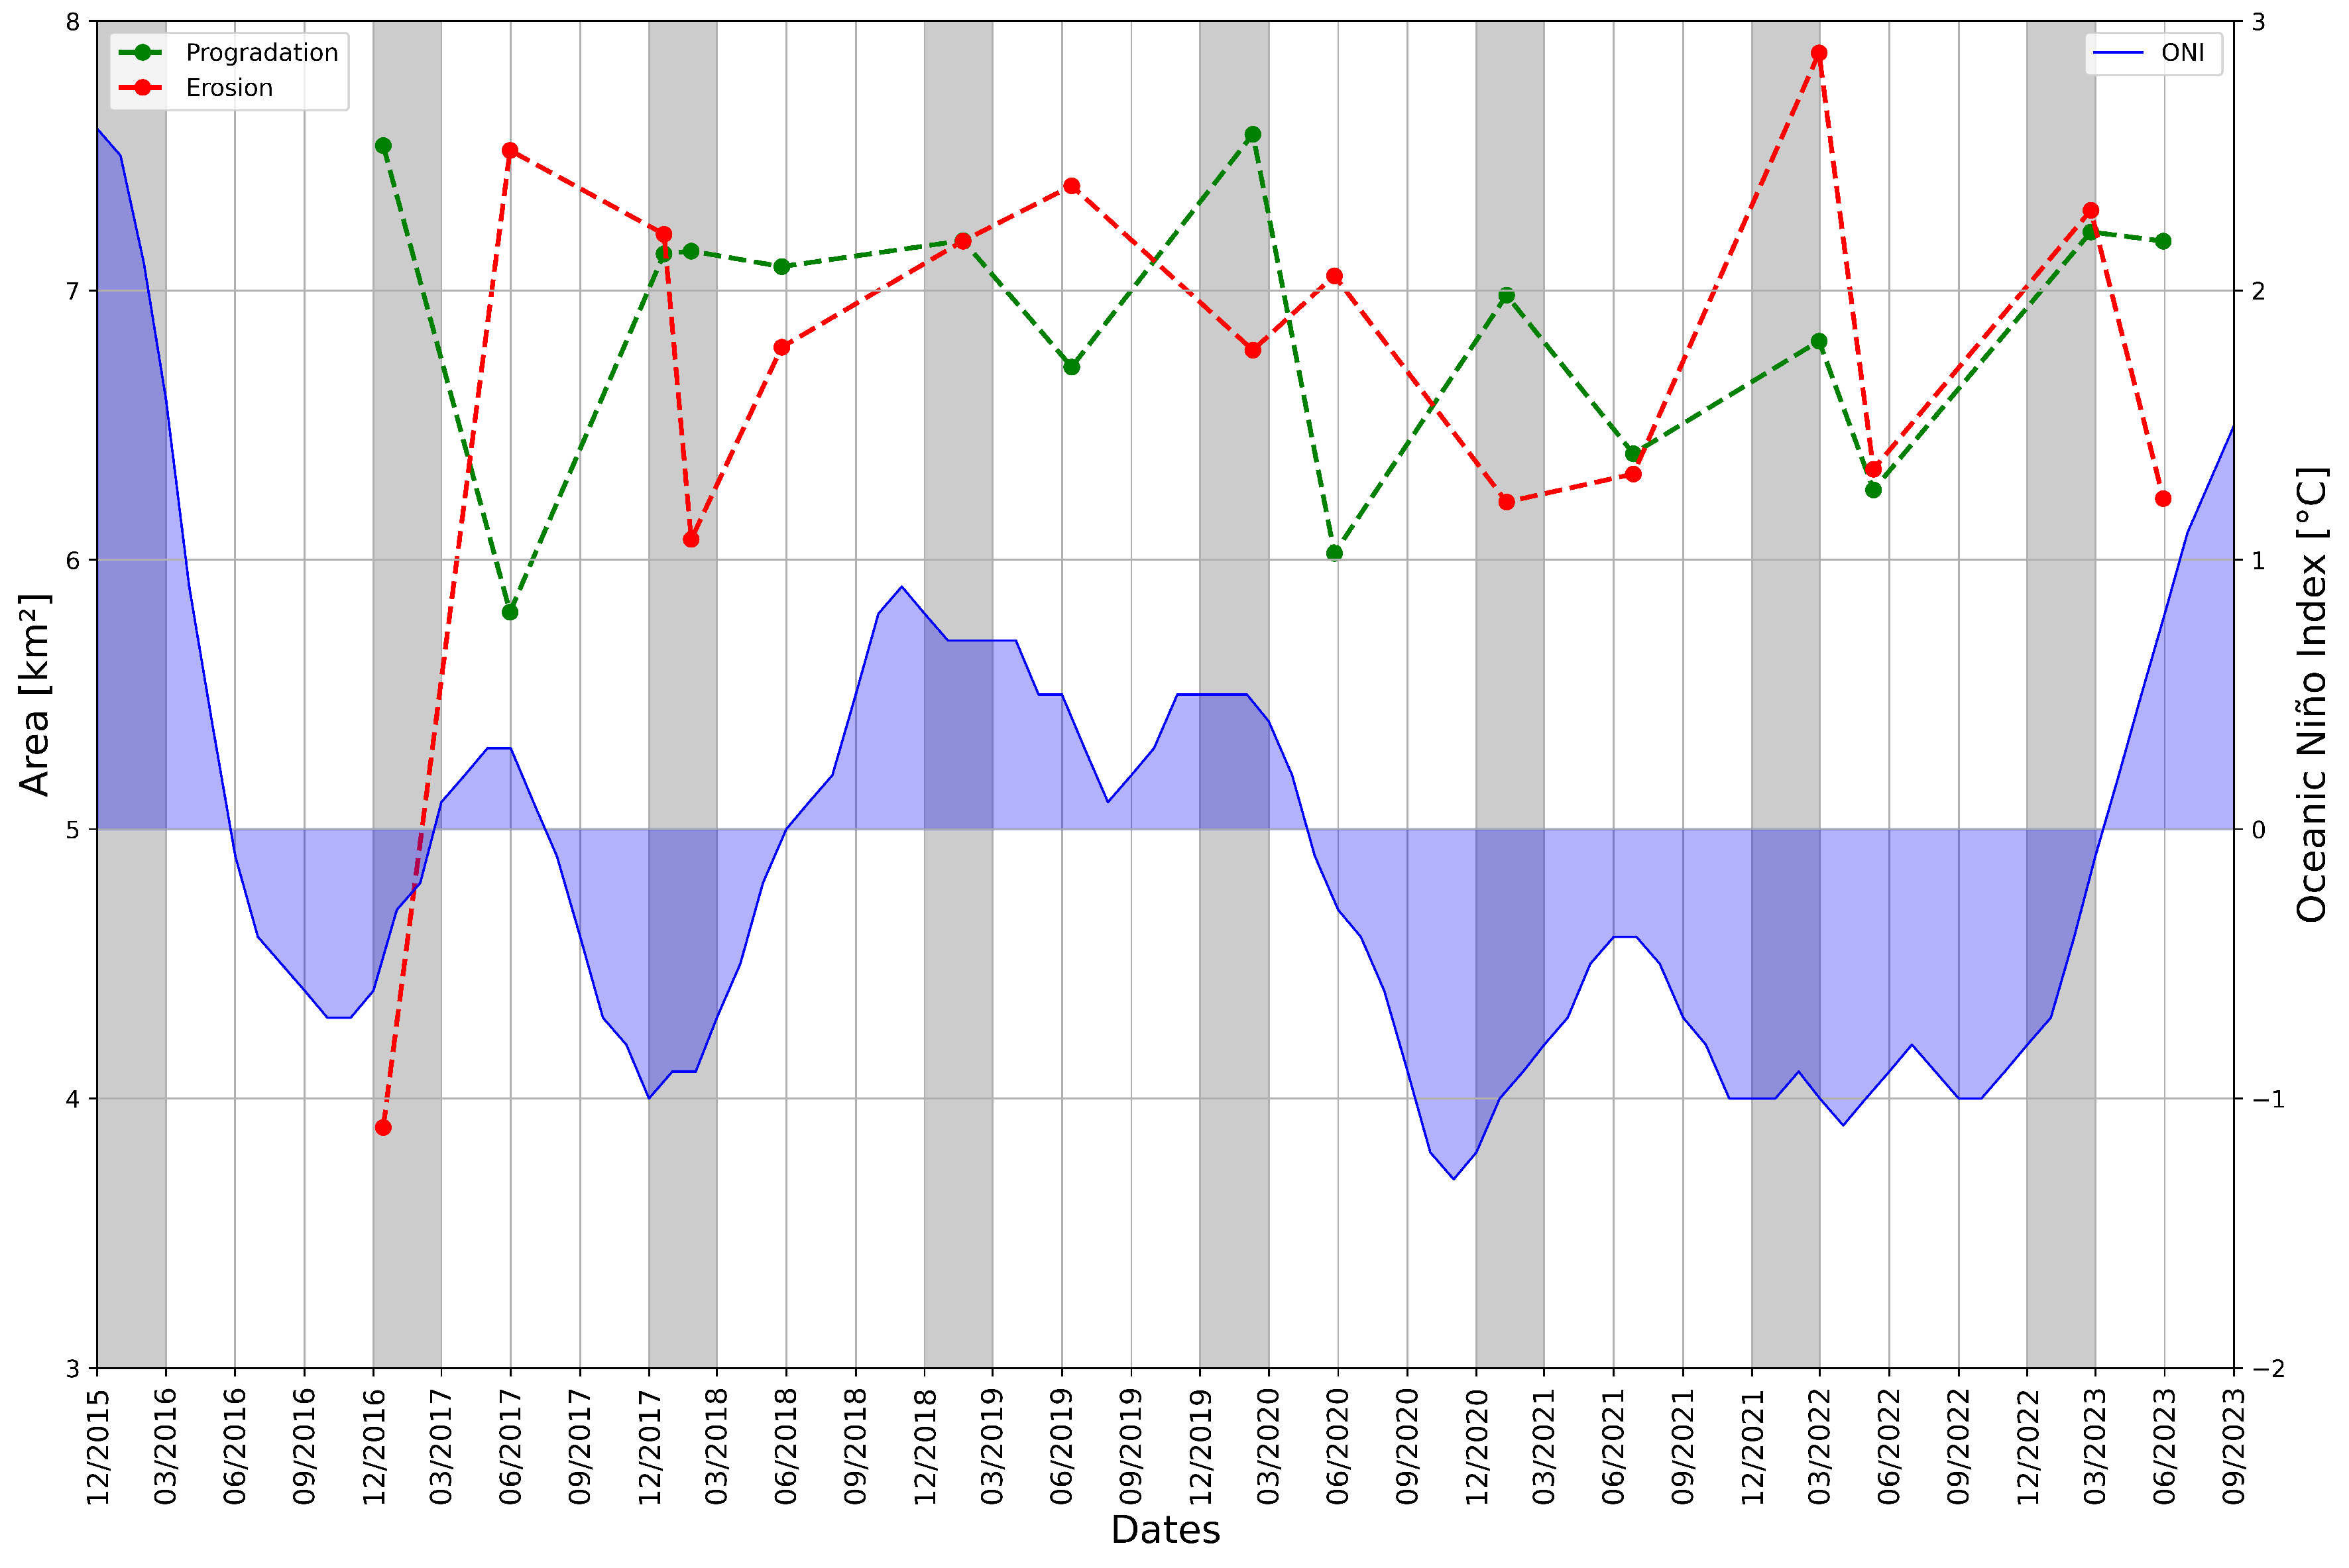
Figure 12.
Global Surface Water (GSW) results for the region of interest [28].
Figure 12.
Global Surface Water (GSW) results for the region of interest [28].
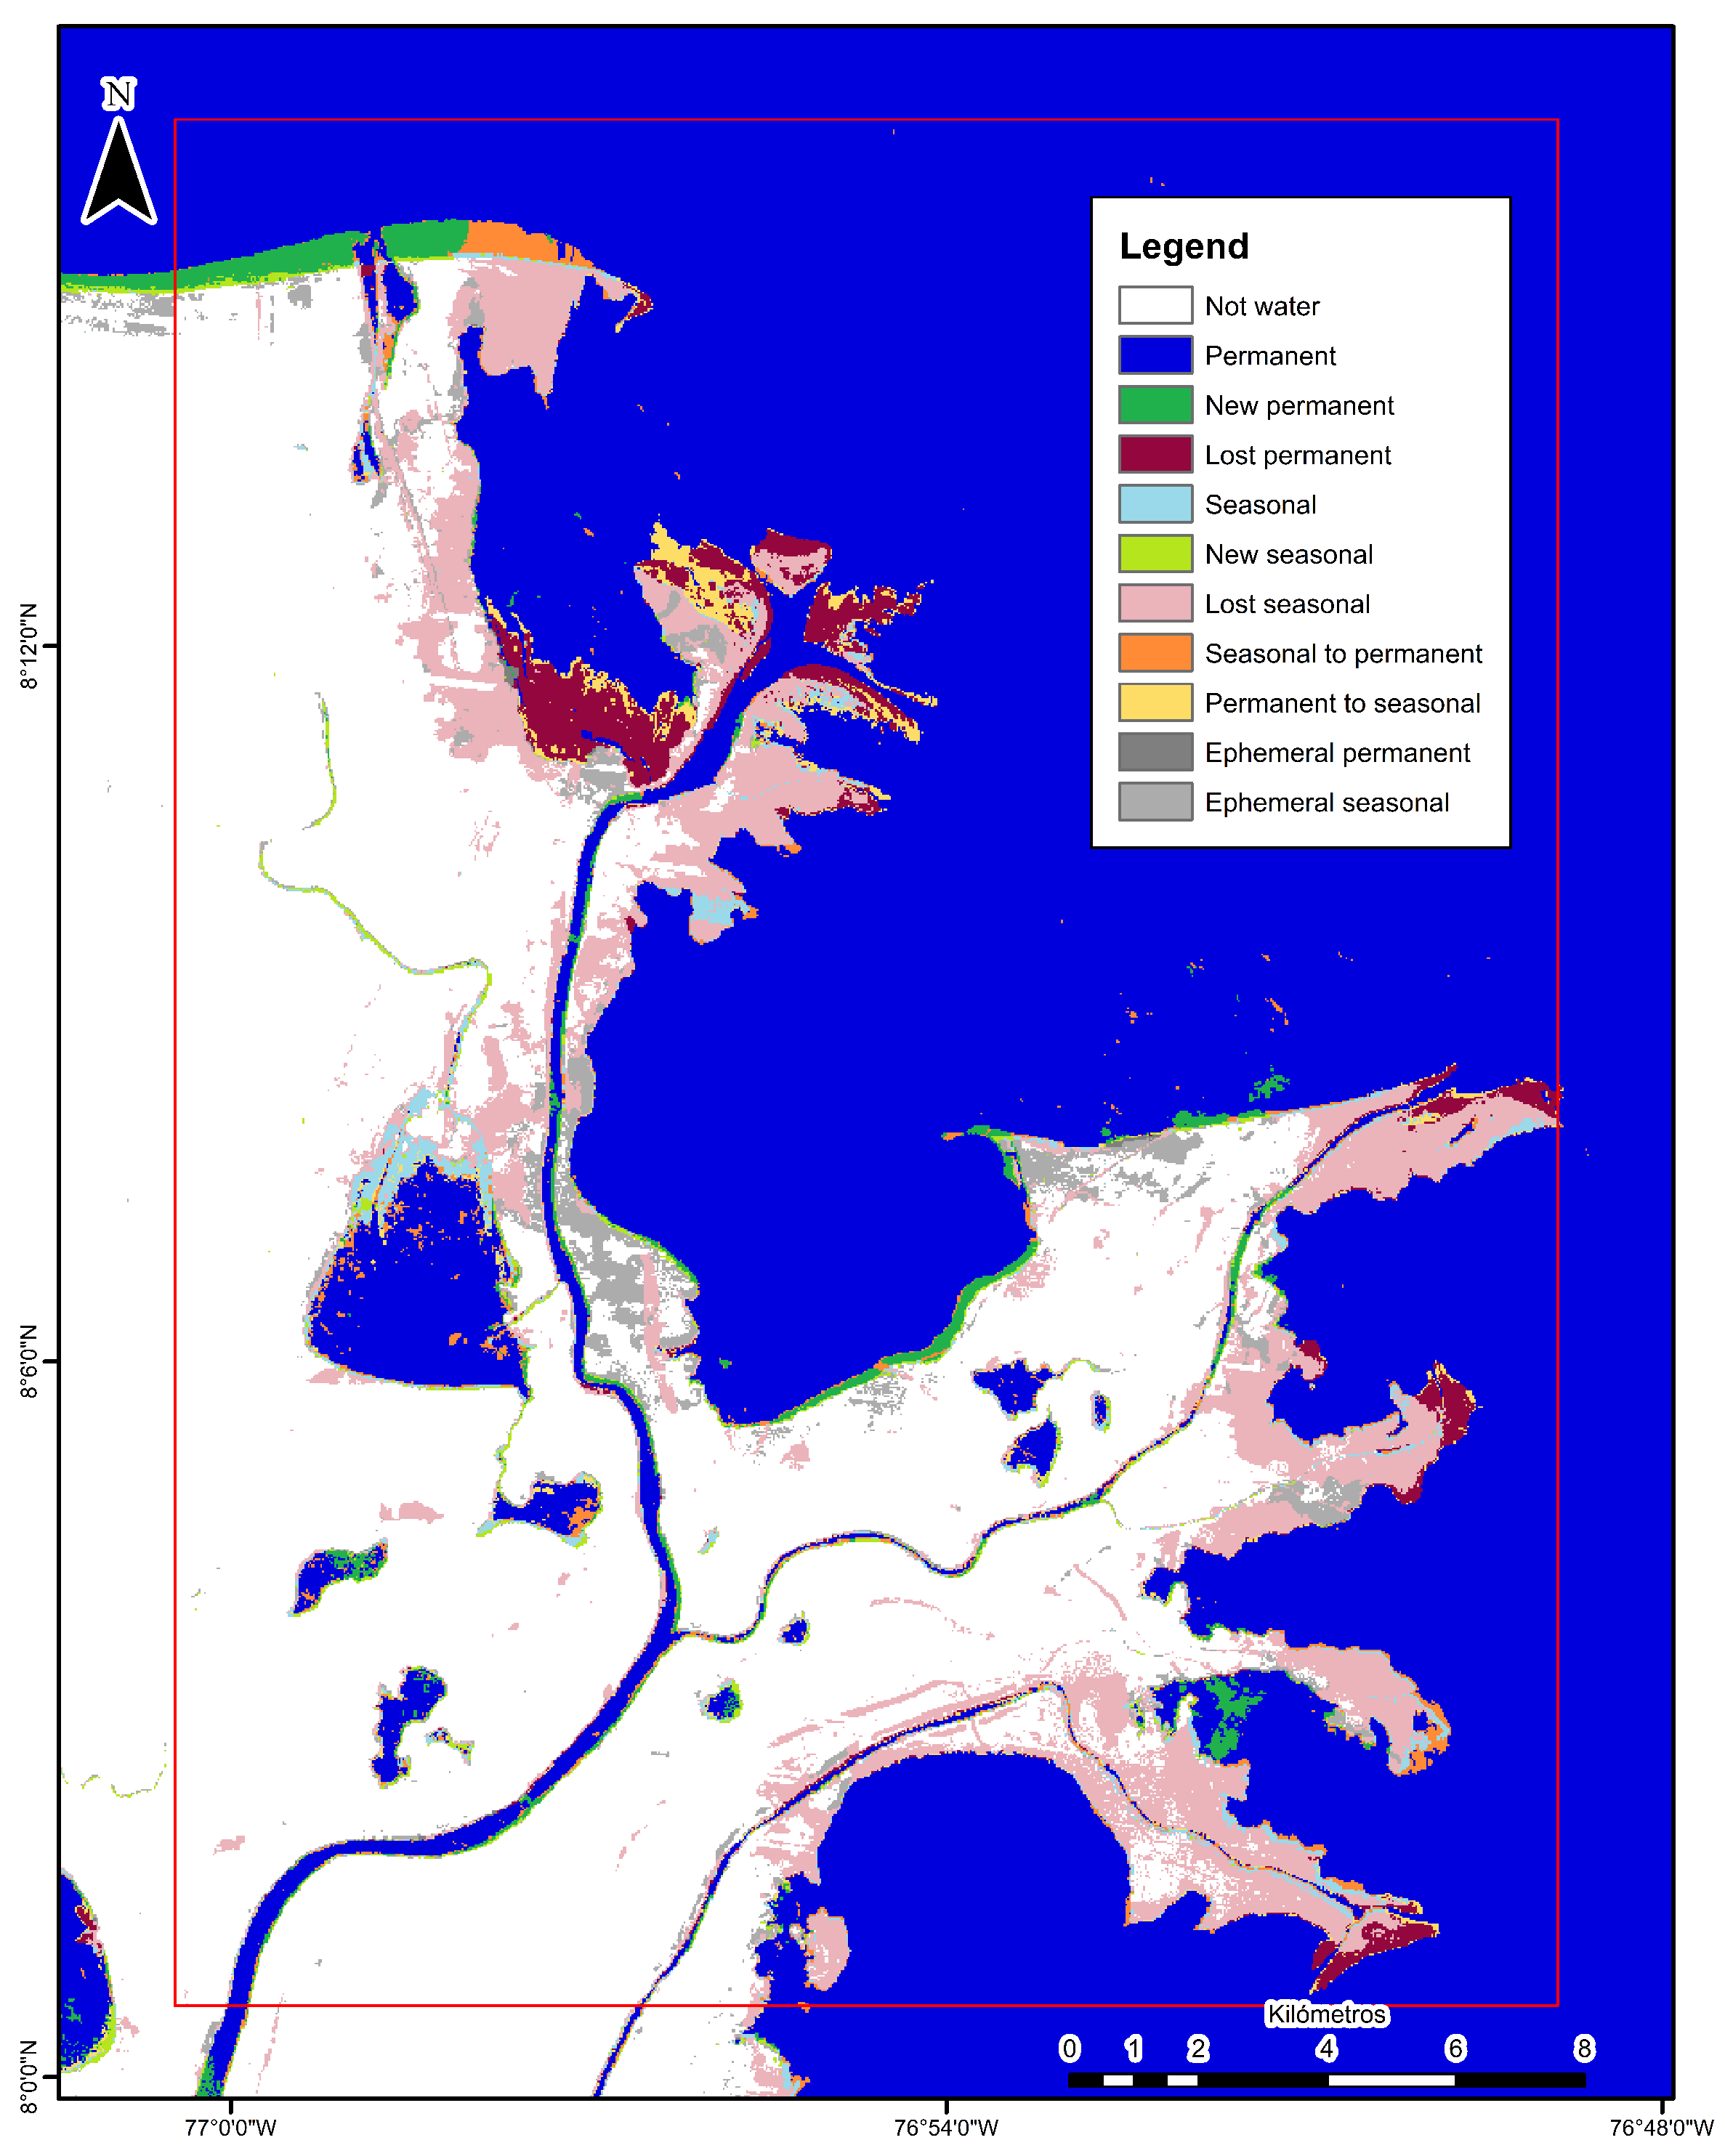

Table 1.
Measurement and comparison of areas of erosion and progradation from 2016 to 2023.
| Date | Season | Prograd Area [km2] |
Eros Area [km2] |
|---|---|---|---|
| 20161214 | dry | 7.62 | 3.93 |
| 20170531 | wet | 5.87 | 7.60 |
| 20171221 | dry | 7.21 | 7.28 |
| 20180126 | dry | 7.22 | 6.14 |
| 20180526 | wet | 7.16 | 6.86 |
| 20190121 | dry | 7.26 | 7.26 |
| 20190614 | wet | 6.79 | 7.47 |
| 20200209 | dry | 7.66 | 6.85 |
| 20200527 | wet | 6.09 | 7.13 |
| 20210110 | dry | 7.06 | 6.28 |
| 20210627 | wet | 6.46 | 6.39 |
| 20220228 | dry | 6.88 | 7.96 |
| 20220511 | wet | 6.33 | 6.40 |
| 20230223 | dry | 7.29 | 7.37 |
| 20230530 | wet | 7.26 | 6.29 |
Disclaimer/Publisher’s Note: The statements, opinions and data contained in all publications are solely those of the individual author(s) and contributor(s) and not of MDPI and/or the editor(s). MDPI and/or the editor(s) disclaim responsibility for any injury to people or property resulting from any ideas, methods, instructions or products referred to in the content. |
© 2023 by the authors. Licensee MDPI, Basel, Switzerland. This article is an open access article distributed under the terms and conditions of the Creative Commons Attribution (CC BY) license (http://creativecommons.org/licenses/by/4.0/).
Copyright: This open access article is published under a Creative Commons CC BY 4.0 license, which permit the free download, distribution, and reuse, provided that the author and preprint are cited in any reuse.


