
Submitted:
28 November 2023
Posted:
29 November 2023
You are already at the latest version
Abstract
Chicken collagen is a promising raw material source to produce gelatins and hydrolysates. Gelatins and hydrolysates can be prepared biotechnologically using proteolytic enzymes produced by submerged fermentation of genetically modified microorganisms. By choosing the appropriate process conditions, such changes can be achieved at the molecular level of collagen, making it possible to prepare products with targeted properties for advanced cosmetic, pharmaceutical, medical or food applications. The research aims to investigate: i) antioxidant activity (DPPH and ABTS) in model samples of chicken collagen products (gelatin and hydrolysates); ii) distribution of molecular weights by the GPC-RID analysis method; iii) functional groups and configuration of polypeptide chains related to molecular level properties using FTIR; iv) the microbiological properties on SDA, PCA, TSA and VRBL microbial populations using MALDI method. Antioxidant activity towards ABTS radicals of more than 80% was found for all samples. The molecular weights of all gelatin samples showed typical α- and β-chains. FTIR analysis confirmed that the samples showed all typical vibrational regions for collagen cleavage products, Amide A and B, Amide I, II, and III at characteristic values. Microbiological analysis of the prepared samples showed no undesirable bacteria that would limit advanced applications of the prepared products. Gelatins and hydrolysates from chicken stomachs represent a promising alternative to products made from standard collagen tissues of terrestrial animals.
Keywords:
antioxidant activity
; biotechnology
; functional groups
; hydrolysate
; microbial population
; molecular weight
; gelatin
1. Introduction
The properties of collagen are influenced by the origin and source from which it is obtained [1]. Collagen has three typical molecular fractions: α-, β-, and γ-chains; the α-chain consists of one polymer chain with a molecular weight of 80–125 kDa, the β-chain consists of two α-chains with a molecular weight of 160–250 kDa, and the γ-chain consists of three α-chains with a molecular weight of 240–375 kDa [1,2,3]. The individual chains are linked to each other by covalent and hydrogen bonds. The collagen fractions obtained by collagen processing are influenced by the production process, which may affect the amino acid structure (e.g., deamination of asparagine to aspartic acid or deamination of glutamine to glutamic acid) and, subsequently, the arrangement of the chains in the collagen itself [4,5,6]. In practice, acidic or basic processes are used, but proteolytic enzymes are also suggested. Enzyme technologies bring many advantages, notably lower processing temperatures and extraction times and a low environmental burden [7,8,9]. Bioactive proteins with antioxidant properties produced by controlled enzymatic hydrolysis from animal tissues are used in pharmaceutical, cosmetic, medical, and food research [10,11,12,13]. Antioxidants are molecules capable of inhibiting or quenching reactive oxygen forms while inhibiting the oxidation of molecules that can produce free radicals [14,15]. Free radicals are the main factors that can accelerate glycation. Glycation is the process by which glucose molecules bind to various serum proteins in the body. These molecules can also cause oxidative stress, leading to other diseases [11,14,16,17].
The presence of microorganisms in products of animal origin is an essential parameter for their further applications. The bacteria most frequently detected are Enterobacteriaceae, especially Salmonella and Escherichia coli. Further, other potential pathogens, such as Listeria monocytogenes, Staphylococcus aureus, and Bacillus cereus, are investigated [18,19,20,21]. Salmonella is a group of facultatively anaerobic, gram-negative, rod-shaped bacteria found in the intestinal tract. The primary source is poultry eggs and their products; therefore, the detection of Salmonella tends to be a priority for poultry products. Salmonella enterica subsp. enterica serovars cause gastrointestinal tract infections and are important human pathogens [18,19,20,21,22]. Escherichia coli is a gram-negative, non-sporulating, facultatively anaerobic rod-shaped bacterium. It is present in the intestines of livestock, mainly cattle, sheep, and pigs, but can also occur in poultry. Therefore, Escherichia coli is also analyzed in these products, as the bacterium can cause intestinal diarrhoeal disease, which can be dangerous for human body dehydration [18,19,20,21,23]. Listeria monocytogenes is a rod-shaped, gram-positive, and non-sporulating bacterium. It occurs in livestock but also in their breeding environment. The typical symptoms in humans are digestive problems [18,19,20,21,24]. Bacillus cereus is an endemic, facultatively aerobic, gram-positive, beta-hemolytic bacterium found in foods of plant origin (starch, cereals, potatoes, etc.). As with the previous bacterium, it mainly causes problems in the digestive tract [18,19,20,21,25]. Staphylococcus aureus is a gram-positive, toxin-producing, resistant bacterium found on human and animal skin and mucous membranes. The bacterium can cause inflammation and life-threatening sepsis [18,19,20,21,26].
Currently, most available gelatins are made from mammals of porcine or bovine origin. However, there is a growing interest in alternative sources of raw materials, where poultry or fish by-products, which represent up to 30% or 75% (30% is skin and bone) of the total weight, are proposed. The main disadvantage of fish gelatins is the poor physico-chemical properties compared to traditional gelatins [2,3,27]. When comparing poultry and fish gelatins, the properties of collagen are influenced by the imino acid content (proline and hydroxyproline) and molecular weight distribution, with poultry gelatins showing better viscoelastic and rheological properties [1,2,3,27]. Gelatin is a very versatile biopolymer with a wide range of industrial applications, characterized by good film-forming ability, transparency, non-toxicity, and biocompatibility. It, therefore, can be used as a drug carrier [1,2,3,12,28]. It can be used not only in the food industry to produce confectionery or edible films that can extend the shelf life of fresh food but also to produce pharmaceutical capsules to protect bioactive substances. More recently, gelatine has been used in the biomedical field to develop scaffolds for wound healing and regeneration, to produce bioinks for 3D printers, in the nutritional field, and to produce antioxidants and antimicrobial products [1,2,3,4]. Gelatin films form an effective barrier against oxygen, carbon dioxide, and volatile compounds. The barrier properties can be controlled in a suitable way (crosslinking), which makes them particularly favored for packaging applications [13,15]. For some applications, their hydrophilicity is a limiting factor. Hydrophilicity can be reduced by introducing hydrophobic substances (plasticizers, lipids, fatty acids, waxes, etc.) into their structure. The hydrophobic substances will promote barrier and antioxidant properties that affect the shelf life of the products [13,17,29,30].
Poultry stomachs are an unused by-product in some countries, contributing to environmental pollution. However, this tissue contains collagen, which can be used with high added value to extract gelatins and hydrolysates [31,32]. The literature does not currently report processing poultry stomachs into gelatins using proteolytic enzymes. However, procedures for enzymatic cleavage of collagen from poultry skins [33], bones [34,35], livers [36], feet [30,31], and by-products remained after production of mechanically deboned chicken meat [37] are known.
2. The Objectives and Hypothesis of the Work
The study aims to determine the antioxidant activity, molecular weight, functional groups, and microbiological composition of gelatins prepared from poultry stomachs by enzymatic method. Subsequently, the results will be compared with available products, and areas of industrial application of the prepared gelatins will be suggested. This study builds on previously published articles by the authors [27,31,32,37,38]. Scientific hypothesis: Poultry gelatins extracted according to the study by Prokopova et al. [32] are safe and suitable for application in the food and pharmaceutical industry (packaging materials and coatings) as an adequate substitute for commercial gelatins. It is further expected that α-chains (molecular weight around 100–150 kDa) and β-chains (molecular weight around 200–250 kDa) will be represented in the gelatins. FTIR spectra will contain characteristic vibrational peaks for the gelatins, Amide A and B, Amide I, II, and III.
3. Results
3.1. Calculation of the Result of Extracted Gelatin
The given values of the parameters of the prepared gelatins were reported in the study [32], and it is expected that their values below, especially gel strength and dynamic viscosity, may influence the properties of the prepared gelatins. The ash content of the gelatins ranged from 0.44±0.02 to 0.81±0.02%. The average value of gel strength was 241±4 Bloom. The lowest dynamic viscosity was 1.0±0.4 mPa.s, and the highest was 3.4±0.3 mPa.s. The gelling and melting points were, on average, 19.0±2.0 °C, and 32.0±1.0 °C, respectively. The digestibility was determined to be 100% for all gelatin samples.
3.2. Antioxidant Activity
Table 1 shows the results of scavenged DPPH/ABTS free radicals for each concentration (2, 4, 6, 8, and 10 mg/ml) of the gelatin samples.
The antioxidant activity increased with increasing solution concentration (2–10 mg/ml). The values of scavenged free radicals for the gelatin solution of 2 mg/ml concentration for DPPH and ABTS were, on average, 71±1 and 82±1%, respectively; the values for the gelatin solution of 4 mg/ml concentration for DPPH and ABTS were on average 75±2 and 86±2%, respectively. The values of scavenged free radicals for the 6 mg/ml gelatin solution concentration for DPPH and ABTS were, on average, 80±1 and 90±1%, respectively. The values of scavenged free radicals for the 8 mg/ml gelatin solution concentration for DPPH and ABTS were, on average, 84±1 and 92±1%, respectively. For a gelatin solution of 10 mg/ml concentration, the scavenged free radicals for DPPH and ABTS were, on average, 87±1 and 95±1%, respectively. At the same time, with lower gel strength and viscosity, the antioxidant activity was higher for each sample.
3.3. Molecular Weight
Table 2 shows molecular weight values for individual gelatin samples, including the polydispersity index (PDI).
Values of the molecular weight of the peak maxima (Mp) are in the range from 17.5 (exp. No. 7) to 57.5 (exp. No. 6) kDa. The weight–average molecular weight (Mw) values were very different. The values of samples 2, 3, 5, 6, and 9 were >50.0 kDa; samples no. 1, 4, 7, and 8 were <50.0 kDa. The highest Mw (105.1 kDa) was measured on sample No. 6, and the lowest Mw (24.4 kDa) was measured on sample No. 7. The values of number–average molecular weight (Mn) were in the range from 5.3 (exp. No. 7) to 9.6 (exp. No. 6) kDa. The polydispersity index (PDI) expresses the distribution of molecular weights in a given gelatin sample. It is a non-uniformity of particle size, and it is valid that PDI=1 monodisperse system and PDI>1 polydisperse system [39,40]. The highest PDI was found for samples 3 and 6 (with a mean value of 1.05±0.07), whereas the lowest PDI was found for samples 1 and 7 (with a mean value of 4.50±0.14). Thus, samples No. 3 and 6 had higher particle size non-uniformity than samples No. 1 and 7. The PDI ranged from 5.1 to 9.0 for the other samples.
Table 3 shows the individual percentages of molecular weights in gelatin samples divided into the three basic chain types in collagen products: α, β a γ-chains; further at molecular weights lower than α-chains and higher than γ-chains. All typical chains were found in all gelatin samples. The lower collagen fractions of 0–80 kDa are the most represented in the samples, averaging 65±5%. In samples 1, 2, 7, and 9, α-chains of >10% were found; in samples No. 3, 4, 5, 6, and 8, α-chains of <10% were found. Gelatin No. 1 and 2 contained the highest percentage of β-chains (8.3 and 8.2%, respectively), and the highest percentage of γ-chains was detected in gelatin No. 4 (8.4%). Also, collagen fractions >375 kDa were found in almost all gelatin samples (except sample No. 1) with an average percentage of 12±6%. The viscosity and gel strength partly influence the molecular weight and its distribution [2]. The lowest viscosity and gel strength were found in exp. No. 7, and the highest viscosity (corresponding to the highest gel strength) was found in samples 3 and 6. All types of α-, β- and γ-chains affect the final gelatin properties. The longer the peptide chain length, the better the polypeptide network arrangement and the better the gel quality [3]. If β- or γ-chains are missing or present in small amounts in the gelatin, this is because of hydrolysis and cleavage of peptide bonds. Samples 1, 4, 7, and 8 show lower molecular weights. These gelatin samples also had lower gel strength and viscosity than the viscosity and gel strength. This phenomenon may be because of higher degradation of α- and β- chains caused by enzymatic hydrolysis. Gelatins with low molecular weight, due to the effect of enzymatic cleavage, are of lower quality [41,42] in contrast to gelatins No. 2, 3, 5, 6, and 9 with higher gel strength, higher viscosity, and higher molecular weight, which have an overall higher quality.
3.4. Functional Groups
Figure 1 describes the FTIR spectra of wavenumbers (1/cm) dependence on absorbance (–) for gelatins No. 1, 2, and 3 samples. For further comparison, Table 4 gives numerical results of the peak regions for the tested gelatins, including referenced characteristic vibrational peak regions [43,44,45,46,47,48,49]. From Figure 1, it can be seen that lower absorbance was observed for gelatins No. 1 and 3 compared to gelatin No. 2. This phenomenon may be caused by different numbers and types of amino acids, as shown by the studies [3,7,8,10,16,29].
Table 4 describes the tabulated values for Amide A of 3440–3300 1/cm; for gelatin samples No. 1, 2, and 3, the Amide A values were 3282, 3275, and 3290 1/cm in the given order. The values represent N–H stretching, and the data show that the measured Amide A peak values for all gelatin samples were less than those reported in the literature [43,44,45,46,47,48,49]. Amide A peak values are related to N–H stretching linked to each other by hydrogen bonding, corresponding to the primary structure of collagen. Compared to the higher tabulated values, the lower values indicate fewer amino groups in the gelatin samples, possibly related to lower degradation during the enzymatic treatment process. The reference values for Amide B are 3080–2899 1/cm; for gelatin samples No. 1, 2, and 3, Amide B values were found to be 2937, 2933, and 2927 1/cm in the given order. Amide B peak is related to –CH2 asymmetrical stretch. Thus, the Amide B band corresponds to the asymmetric vibration and stretching of the =C–H group, and there is also vibration and stretching of the NH3+ groups. The measured values correspond to the referenced values, and it is valid that the value of the Amide B band decreased with increasing extraction temperature; this indicates interactions between NH3+ groups and peptide chains in collagen. The reference values for the Amide I peak are 1700–1600 1/cm; for gelatin samples No. 1, 2, and 3, the Amide I values were found to be 1640, 1643, and 1639 1/cm in the given order. The vibrational mode of Amide I is given by C=O extension associated with CN stretching, CCN deformation, and in-plane NH bending. The band is typical of the helical structure of gelatin. All measured values agree with literature reports [43,44,45,46,47,48,49]. The reference values for Amide II are 1580–1500 1/cm; for gelatin samples No. 1, 2, and 3, the values of Amide II were found to be 1515, 1517, and 1510 1/cm in the given order. Amide II is determined by an inter-phase combination of CN extension and bending of the N–H peptide group. Compared with the reference values, the measured values are within the required interval. The reference values are for Amide III 1350–1200 1/cm; for gelatin samples No. 1, 2, and 3, the Amide III values were found to be 1241, 1240, and 1238 1/cm in the given order. The Amide III band represents the extension of the amide bonds’ CN and N–H deformation.
Figure 2 describes the FTIR spectra of the dependence of wavenumbers (1/cm) on absorbance for samples of gelatins No. 4, 5, and 6. The progression of the data shows that the gelatins are very similar. For further comparison, Table 5 shows the numerical results of the peak vibrational regions for the given gelatins, including characteristic peak regions from the literature [43,44,45,46,47,48,49]. Figure 2 shows that the highest absorbance was observed for gelatin No. 6 compared to gelatin No. 4 and no. 5, respectively. This phenomenon is likely caused by different numbers and types of amino acids [3,7,8,10,16,29].
The reference values for Amide A are 3440–3300 1/cm; for gelatin samples No. 4, 5, and 6, the Amide A values were found to be 3289, 3272, and 3277 1/cm in the given order. For all gelatine samples, the measured peak Amide A values were less than those reported in the literature [43,44,45,46,47,48,49]. The lower values found (compared to the higher reference values) indicate a lower number of amino groups in the gelatin samples, which may be related to lower degradation during the enzymatic treatment. The reference values for Amide B are 3080–2899 1/cm; for gelatin samples 4, 5, and 6, Amide B values were found to be 2938, 2932, and 3929 1/cm in the given order. The measured values correspond to the reference values, and it is valid that the value of the Amide B band decreased with increasing extraction temperature; this indicates interactions between NH3+ groups and peptide chains in collagen. The reference values for the Amide I peak are 1700–1600 1/cm; for gelatin samples no. 3, 4, and 5, the Amide I values were found to be 1636, 1643, and 1637 1/cm in the given order. All measured values agree with the literature [43,44,45,46,47,48,49]. The reference values for Amide II are 1580–1500 1/cm; for gelatin samples 4, 5, and 6, the values of Amide II were 1515, 1522, and 1517 1/cm in the given order. Compared with the reference values, the measured values are within the required interval. The reference values for Amide III are 1350–1200 1/cm; for gelatin samples 4, 5, and 6, the Amide III values were found to be 1236, 1240, and 1238 1/cm in the given order.
Figure 3 describes the FTIR spectra of wavenumbers (1/cm) dependence on absorbance (–) for gelatins No. 7, 8, and 9 samples. The data show that the gelatins are very similar. For further comparison, Table 6 presents the numerical results of the peak regions for the tested gelatins, including characteristic peak regions from the literature [43,44,45,46,47,48,49]. Figure 3 shows that the highest absorbance was observed for gelatin No. 7 compared to gelatin No. 8 and 9, respectively. This phenomenon will likely result from different numbers and types of amino acids [3,7,8,10,16,29].
Table 6 describes the reference values for Amide A of 3440–3300 1/cm; for gelatin samples No. 7, 8, and 9, the Amide A values were found to be 3276, 3286, and 3290 1/cm in the given order. The measured peak Amide A values for all gelatin samples were less than those reported in the literature [43,44,45,46,47,48,49]. The lower values observed (compared to the higher reference values) indicate a lower number of amino groups in the gelatin samples, which may be related to degradation during the enzymatic treatment process. The reference values for Amide B are 3080–2899 1/cm; for gelatin samples No. 7, 8, and 9, the Amide B values were found to be 2936, 2934, and 2925 1/cm in the given order. The measured values correspond to the reference values, and it is clear that the Amide B band decreased with increasing extraction temperature; this indicates the interaction between NH3+ groups and peptide chains in collagen. The reference values are 1700–1600 1/cm for the Amide I peak, and Amide I values of 1641, 1645, and 1644 1/cm were observed for gelatin samples No. 7, 8, and 9, in that order. All measured values are following the literature [43,44,45,46,47,48,49]. The reference values for Amide II are 1580–1500 1/cm; for gelatin samples No. 7, 8, and 9, the values of Amide II were found to be 1519, 1525, and 1525 1/cm in that order. Compared with the reference values, the measured values are within the required interval. The reference values for Amide III are 1350–1200 1/cm; for gelatin samples No. 7, 8, and 9, the Amide III values were found to be 1245, 1242, and 1235 1/cm in the given order.
3.5. Microbiological Properties
Table 7 lists the individual gelatin samples and the microorganisms detected in them; bacterial values >1700 are listed here because bacterial values <1700 are not reliable identification [18]. No Salmonella, Listeria monocytogenes, or Escherichia coli were detected in any samples. In sample No. 4, another coliform bacterium of Enterococcus, Enterococcus faecium, was detected. Nor was Staphylococcus aureus detected in any of the gelatin samples, but a bacterium from the same genus of Staphylococcus, Staphylococcus hominis, was detected in sample No. 5. Bacillus cereus was the most present bacterium and was found in sample No. 1, 2, 5, 7 and 11. In addition, Brevibacillus agri was detected in sample No. 1. In sample No. 2, Brevibacillus agri and Bacillus flexus were detected. In sample No. 3, two types of Acinetobacter were detected: radioresistens and baumannii. In sample No. 4, two more bacteria, Bacillus flexus and Brevibacillus agri were found. Sample No. 5 contained, in addition to Staphylococcus hominis, Bacillus cereus, and Acinetobacter baumannii. No microorganisms with >1700 score value were present in sample No. 6. Acinetobacter radioresistens was found in sample No. 7. Acinetobacter baumannii was found in samples No. 8 and 9; sample No. 9 also contained Brevibacillus agri. Samples No. 10, 11, and 12 were the most heavily contaminated with Pseudomonas oryzihabitans, Bacillus flexus, Acinetobacter baumannii, Ralstonia pickettii, Bacillus cereus, and Acinetobacter radioresistens. Yeasts and fungi were not detected, were isolated, and there was a partial increase in the growth medium, but yeast and fungi values were <1700 score value, thus not reliable identification.
Enterococcus faecium was the bacterium identified in gelatin No. 4 and could cause infections. Since only gelatine No. 4 was contaminated and Enterococcus faecium is present in the intestinal microflora, it is likely that this sample was contaminated by careless handling. However, at a temperature of at least 70 °C applied for 30 min, the Enterococcus faecium is destroyed (sterilization of the sample) [50,51,52].
4. Discussion
4.1. Antioxidant Activity
According to the study [14], where gelatin from yellowfin tuna skin was extracted using citric acid, ABTS antioxidant activity was higher than DPPH. For ABTS, the antioxidant activity was about 90% for peptides >30 kDa, about 95% for peptides 10–30 kDa, about 95% for peptides 3–10 kDa, and about 90% for peptides <3 kDa; on average, the antioxidant activity of ABTS was 93±3%. For DPPH, the antioxidant activity was about 50% for peptides >30 kDa, about 85% for peptides 10–30 kDa, about 60% for peptides 3–10 kDa, and about 65% for peptides <3 kDa; on average, the antioxidant activity of DPPH was 65±15%. Compared with the proposed study, gelatin from chicken stomachs was measured to have higher antioxidant activity for DPPH and comparable for ABTS. In the study [16], fish gelatin was extracted from mackerel using acetic acid, and then the gelatin was tested for antioxidant activity using DPPH. It was found that the size of the scavenged free radicals is, on average, less than 50%. The experimentally obtained gelatin was compared with commercially available pork gelatin, and here, the activity averaged around 70%. Gelatin from Nile tilapia extracted by the enzyme [15] showed antioxidant activity values, with DPPH averaging 33%. In both studies [15,16], the antioxidant activity was significantly lower than in the proposed study.
In the study [53], acetic acid extracted fish gelatin from cobia skin. The fish gelatin showed DPPH antioxidant activity of around 65% at a solution concentration of 1 mg/ml for 10 kDa peptides, around 90% for 5 kDa peptides, and around 60% for 3 kDa peptides. In the case of a 5 mg/ml solution, about 45% for 10 kDa peptides, about 55% for 5 kDa peptides, and about 65% for 3 kDa peptides, respectively. For fish gelatin from Hypophthalmichthys molitrix extracted with acetic acid [17], the DPPH antioxidant activity was tested. Solutions of a concentration of 0.10 mg/ml had DPPH around 30%, for the 0.20 mg/ml solution around 65%, and for the 0.40 mg/ml solution around 90%. The study shows that the antioxidant activity also increased with increasing DPPH concentration. In the proposed study, the DPPH antioxidant activity was measured to be 79±1% on average. Almost in all cases, the antioxidant activity is higher in the proposed study, except for peptides of 5 kDa with DPPH of around 90% [53] and for a solution of 0.40 mg/ml concentration with DPPH of around 90% [17]. In these two cases, the antioxidant activity is higher than in the proposed study.
The study [10] tested the DPPH antioxidant activity of commercial fish gelatin. The measured DPPH antioxidant activity was deficient, around 4%. Subsequently, the gelatin was modified by temperature annealing, and it was found that the antioxidant activity increased with increasing temperature (120, 140, and 160 °C) to 13, 19 and 24%, in that order. In fish gelatin extracted with the enzyme from cobia skin [11], the DPPH antioxidant activity was verified for 4, 8, and 12 mg/ml solutions. In that order, the antioxidant activity increased with increasing gelatin concentration to 20, 45, and 60%. In the studies [10,11], deficient antioxidant activity was measured compared to 79±1% found in this study.
In the study [12], gelatin film prepared from tilapia skin was tested. The DPPH antioxidant activity was about 15%, and the ABTS antioxidant activity was about 80%. As part of the study, to increase the antioxidant activity (especially for DPPH), essential oils (ginger, turmeric root, and plai) were added to each gelatin sample. They found that in all cases, there was an increase in the antioxidant activities of both DPPH and ABTS, which increased with increasing protein concentration. Another study tested commercially available fish gelatin prepared from tilapia skin [13]. Regarding gelatin films with 20 or 30% glycerol, the DPPH antioxidant activity was found to be unmeasurable. For ABTS, they found that the antioxidant activity of the gelatin film with 20 and 30% glycerol was about 28 and 75%, respectively. Subsequently, essential oils (bergamot, kaffir lime, lemon, and lime) were added to the single gelatin films, and in all cases, the antioxidant activity was improved. In both studies [12,13], the DPPH antioxidant activity is significantly lower than the proposed study (79±1%). The same is true for the ABTS antioxidant activity, which is also higher in the proposed study (89±1%).
Chicken gelatins allow for more efficient scavenging of free radicals in the presence of residual free –NH2 groups in their structure, thus forming a more stable macromolecule with higher gel strength and viscosity [14,30,41]. The higher the percentage share of free radical scavenging, the better the antioxidant activity.
4.2. Molecular Weight
In the study [1], the molecular weight of the α-chain was measured in the interval from 35 kDa to 120 kDa. The extraction conditions influenced the observed molecular weight. For salmon skin extracted with acetic acid (pH 3–5), a lower molecular weight was found at lower pH due to different-sized gelatin fragments produced by hydrolytic cleavage. At the same time, it was found that the molecular weight is also related to the gel strength, i.e., the higher the gel strength, the higher the molecular weight of the chains. This is related to the size and diversity of the protein chain, the higher content of free hydroxyl groups (which play a role in forming hydrogen bonds and helical structure during gel setting), the amino acid composition, and the concentration of gelatin solution. In the proposed study, α-chains were higher, up to 160 kDa. In the study [3], where gelatin from sea bass skin was extracted with acetic acid, the band intensities of the α1- and α2-chains were identified as around 120 kDa and around 220 kDa for the β-chains. The molecular weight decreased slightly with increasing extraction temperature (45 and 55 °C), which can be explained by the partial degradation induced by the thermal process. In the present study, the molecular weights for α-chains were 124 kDa, and for β-chains were up to 260 kDa.
The study [47] focused on extracting gelatins from chicken feet using acetic acid and determined molecular bands of around 125 kDa corresponding to α-chains and 180 kDa corresponding to β-chains. The study also mentions an ultrasound extraction, with a shift in the molecular weights of gelatins to 130 and 198 kDa, respectively. Another part of the experiment included testing commercially available bovine gelatin with band intensities for α1-chains around 155 kDa, for α2-chains around 135 kDa and β-chains around 195 kDa. In almost all cases, higher molecular weights were found for the gelatins prepared from chicken stomachs, according to this study. Only when compared with commercially available bovine gelatine the molecular weight of the α-chain was different (bovine gelatine 155 kDa, chicken gelatine 124 kDa).
In the study [5] focusing on the extraction of gelatins from black-bone chicken skin and feet using NaOH, the band intensities for α1-chains and α2-chains were determined to be around 135 kDa and 120 kDa for black-bone chicken feet gelatin and at around 140 kDa and 125 kDa for α1-chains and α2-chains, respectively, for black-bone chicken skin. Gelatin from yellowfin tuna skin [14] treated with acetic acid showed molecular weights of around 130 kDa for α1-chain, around 115 kDa for α2-chain, and around 250 kDa for β-chain. The molecular weight values of the two studies discussed [5,14] are similar to those presented here from gelatins prepared from chicken stomachs. In the study [16], where they extracted gelatin from mackerel scad skin using CH3COOH, the band intensities of the α1- and α2-chains were found to be around 130 and 100 kDa, respectively, and around 200 kDa for the β-chains. Gelatin from chicken stomachs showed higher molecular weights. In the study [8], where gelatin was extracted from cobia skin and croaker skin using sulfuric acid, it was found that the gelatins contained α-chains (about 116 kDa), β-chains (about 215 kDa) and γ-chains (about 250 kDa). Similarly, gelatin from chicken stomachs showed higher molecular weights for both α-, β- and γ-chains; the values were 124, up to 260, up to 400 kDa.
The molecular weight was studied on chicken feet gelatin extracted with acetic acid [30], and the α1-, α2-, and β-chains were found to be 150, 135, and 210 kDa, respectively. The study [12] focused on commercial fish gelatin from tilapia skin; the band intensities for α1- and α2-chains were around 150 kDa and 135 kDa, respectively. Gelatin from chicken stomachs showed higher molecular weights for both α- and β-chains. The values were 124 kDa and up to 260 kDa. For the gelatins extracted using 0.00–0.05% CH3COOH from bigeye snapper and brownstripe red snapper [54], all characteristic α1-, α2-, β-, and γ-chains were detected in the prepared gelatins, with molecular weights in the corresponding order of 116, 102, 205 and 250 kDa for the bigeye snapper, and of 120, 110, 210 and 260 kDa for brownstripe red snapper. It was observed that the intensity of the bands was reduced with increasing acid concentration during gelatin extraction. Fish salmon gelatin [49] treated with acetic acid showed molecular weights of α-chain around 120 kDa, β-chain around 245 kDa, and γ-chain around 375 kDa. In the study [55] aimed at comparison of hoki skin gelatin and commercially available beef and pork gelatin, molecular weights for α-chains around 100 kDa and β-chains around 190 kDa were found for all samples at a concentration of 1.13 mg/ml. With decreasing concentrations of the solutions (0.75 and 0.38 mg/ml, respectively), the molecular weight increased slightly for all three sample types. In the studies [49,54,55], lower molecular weights were measured when compared with the proposed study, in which molecular weights for α-, β- and γ-chains were found to be 124, up to 260, and up to 400 kDa, respectively.
On commercial fish gelatin [10], the Mn was 6.60 kDa, Mw 26.00 kDa, and PDI 3.96. Subsequently, the fish gelatin was modified by annealing at 120, 140, and 160 °C temperatures. The Mn, Mw, and PDI parameters were lower with increasing temperature. For Mn, there was a decrease to 4.10, 1.70 and 1.40 kDa, respectively. For Mw, there was a decrease to 12.20, 4.10, and 2.80 kDa, respectively, and for PDI, there was a decrease to 2.98, 2.36, and 2.06, respectively, each time for a given temperature. Compared with the weights obtained from gelatins prepared from chicken stomachs, the values of Mn, Mw (7.23, 57.96 kDa), and PDI (7.61) were higher.
4.3. Functional Groups
In the study [3], where the extraction of gelatins from seabass skin using acetic acid is described, it was found that the gelatins showed very similar spectra. At higher extraction temperatures (45 and 55 °C, respectively), the intensity of the bands shifted slightly towards higher wavenumbers. The Amide A band was found at 3289–3304 1/cm for both 45 and 55 °C and the Amide B band was found at 3070–3079 1/cm for 45 °C and a band at 3071–3079 1/cm was observed at 55 °C. The Amide I band was observed at 1643–1645 and 1644–1645 1/cm, respectively, and the Amide II and Amide III band was always observed to be the same for both temperatures, namely 1540–1543 and 1233–1234 1/cm. In the proposed study, the Amide A band was observed on average at 3282 1/cm, and Amide B at approximately 2932 1/cm, a lower value than in [3]. The different amino acid compositions in gelatins can explain this phenomenon. In comparison with the study [3], where acetic acid was used for extraction, enzyme treatment of the raw material was used in the proposed study. Amide I, II, and III values were close to the submitted study.
In the study [16], where fish gelatin from mackerel was extracted with acetic acid, the authors found all the characteristic peaks of Amide A (3405 1/cm), Amide B (2927 1/cm), Amide I (1659 1/cm), Amide II (1545 1/cm) and Amide III (1239 1/cm). Compared with the presented study, the average peak values of Amide A were lower (3282 1/cm), and those of Amide B were higher (2932 1/cm). In the presented study, the peak values of Amide I, II, and III were 1641, 1516, and 1239 1/cm. The study [7] focusing on the comparison of commercial pork (PG) and beef (BG) gelatins with sharri fish skin gelatin extracted with acetic acid reports the intensity of individual bands for fish gelatin extracted at 80 °C as follows: Amide A 3318 1/cm, Amide B 2926 1/cm, Amide I 1663 1/cm, Amide II (1546 1/cm) and Amide III not found. The intensity of the sharri fish skin gelatin bands was higher when compared with both BG and PG gelatins. The Amide A band was found at 3441 1/cm, and the Amide B band at 2935 1/cm. This difference may be explained by the different numbers and types of amino acids in the gelatine fractions due to different extraction procedures (enzymatic versus acetic acid). In addition, fish gelatins have lower amounts of proline, hydroxyproline, and glycine; this may also affect the intensity of the observed peaks [1,2,3,7,41].
FTIR spectra were studied on commercial bovine gelatin (BG) and extracted chicken feet gelatin [30] using acetic acid, and it was found that both gelatins contained all peaks in the given order: Amide A 3290 and 3340 1/cm, Amide B 2950 and 2930 1/cm, Amide I 1660 and 1680 1/cm, Amide II 1550 and 1580 1/cm and Amide III was identical for both (1250 1/cm). In the present study, the average peak values of Amide A, B, I, II, and III were 3282, 2932, 1641, 1516, and 1239 1/cm, respectively. From the above data, all the peaks for chicken feet gelatin and BG were higher than those in the present study. Increased intermolecular interactions in different types of collagen can explain this phenomenon. In the study [47], chicken feet gelatin was extracted using acetic acid; the values of vibrational peaks were lower than in the present study; this phenomenon can be explained by the fact that the gelatin was extracted by ultrasonic treatment.
The study’s authors [43] extracted chicken feet gelatin using 1.5, 3.0, and 4.5% acetic, citric, and lactic acids, respectively. All gelatins were determined to contain the characteristic Amide A and B, Amide I, II, and III peaks. For the gelatins extracted with acetic acid, the average values were, in this order, 3342, 2930, 1665, 1558 and 1239 1/cm; for the gelatins extracted with citric acid, 3340, 2931, 1667, 1569 and 1242 1/cm; for lactic acid, 3316, 2930, 1665, 1583 and 1245 1/cm. The average values of FTIR spectra increased with increasing concentration of all acids. When comparing the acids, it was found that the acids show similar FTIR spectra. In the presented study, the average peak values of Amide A and B, I, II, and III were 3282 and 2932, 1641, 1516, and 1239 1/cm. Comparing the present study with that of [43], it can be stated that the peak values of Amide A, Amide I, II, and III were always lower; for Amid III, identical values were observed compared to gelatins extracted with acetic acid. For Amide B, the opposite trend was observed in all cases. This difference can be explained by different gelatin extractions (enzymatic versus acid).
In the study [44], gelatin from chicken feet using acetyl acid was extracted and compared with commercial beef gelatin. The poultry gelatin samples showed spectral values of Amide A 3400 1/cm, Amide B 2924 1/cm, Amide I 1652 1/cm, Amide II 1540 1/cm and Amide III 1241 1/cm. For bovine commercial gelatin, the spectra were, in order, 3400, 2921, 1651, and 1557 1/cm, and Amide III was not found. In the presented study, the average peak values of Amide A and B, I, II, and III were found as follows: 3282 and 2932, 1641, 1516, and 1239 1/cm. The values of the individual peaks, except for Amide B, were consistently lower in the presented study compared to the study [44]. The difference in Amide B is likely the result of different numbers of amino groups and NH3+ interactions between peptide chains; this may cause different absorbance of the samples.
4.4. Microbiological Properties
As part of the microbiological analysis, when colonies of bacteria with typical growth on selected growth mediums were isolated from gelatine samples, the following bacteria were detected in the gelatine samples: Enterococcus faecium, Staphylococcus hominis, Bacillus cereus, Brevibacillus agri, Bacillus flexus, Acinetobacter radioresistens, Acinetobacter baumannii, Pseudomonas oryzihabitans, and Ralstonia pickettii. No representatives of the genus Salmonella were detected in any of the samples. Neither were Listeria monocytogenes, Staphylococcus aureus and Escherichia coli detected, which, together with the presence of Salmonella, would not allow the application of gelatine in the food, pharmaceutical, medical, and cosmetic industries [18,19,20,21,22,23,24,25,26]. All identified bacteria in the gelatine samples are inhibited at temperatures above >70 °C. Samples of gelatins contaminated with undesirable bacteria must only be heated above this temperature to sterilize the sample [21,56,57,58].
5. Materials and Methods
5.1. Apparatus, Tools and Chemicals
Kern 770 electronic analytical laboratory scales, Kern 440-47 electronic laboratory scales (Kern GmbH, Bensheim, Germany), heating plate Schott Garate with magnetic stirrer (Schott, Berlin, Germany), LT2 and LT3 Kavalier shaker (Kavalier, Praha, Czech Republic), IKA C MAG HS7 hot plate stirrer (IKA–Werke, Staufen im Breisgau, Germany), desiccator (Merci, Brno, Czech Republic), EBA 20 centrifuge, centrifuge MPW–215 (Verkon, Praha, Czech Republic), UV–VIS spectrofotometr Helios 3 Thermo Spectronic, differential refractometer Waters model 2414 (Mettlet–Toledo, Ltd., Praha, Czech Republic), Siemens freezer (Siemens, Praha, Czech Republic), microjet microwave autoclave (The Rodwell Autoclave Company, London, UK), vortex mixer mini analog (OHAUS Europe GmbH, Nänikon, Switzerland), microflex MALDI–TOF including equipment and evaluation software (Matrix–Assisted Laser Desorption/Ionization Time of Flight MS Biotyper), FTIR Bruker ALPHA (Bruker GmbH, Vienna, Austria), Memmet ULP 400 dryer, Memmert cultivator (Memmert GmbH + Co. KG, Büchenbach, Germany), WTB Binder E-28-TB1 dryer (Binder, Baddechenstedt, Germany), Lambda Life laminar box (Lambda Life, Ltd., Bratislava, Slovak Republic), Proline Prospenser dispenser including bottle (FISHER Slovakia, Ltd., Bratislava, Slovak Republic), Waters HPLC Breeze analytical device (Waters Chromatography Europe B.V., Etten–Leur, Nizozemsko), OHpak SB-806M HQ analytical column, OHpak SB–804 HQ analytical column (300x8 mm, 13µm) (Altmann Analytik GmbH & Co. KG, Munich, Germany).
Measuring cylinders 25 ml, 200 ml, 250 ml, 500 ml, and 1000 ml, Erlenmayer flask 0.5 l.0 a 2.0 l, pipettes, 250 ml glass bottles with caps, beakers of various sizes, volumetric flasks of different sizes, Petri dishes, test tubes of various sizes, silicone gloves, gas burner, tweezers (Merci, Brno, Czech Republic), syringes with distilled water, laboratory spoons and rods, funnels, Eppendorf tube racks, disposable syringes, screw cap vials (Verkon, Praha, Czech Republic), self-sealing LDPE bags, foil (McPen, Děčín, Czech Republic), magnetic stirrer (IKA–Werke, Staufen im Breisgau, Germany), Eppendorf box (Bruker GmbH, Vienna, Austria), hockey-stick cell spreaders, inoculation needles, inoculation needle holder (P–LAB Ltd., Praha, Czech Republic), BOSH mixer (BOSH, Gerlinger Schillerhöhe, Germany).
Distilled water, ethanol, formic acid, acetonitrile, 0.1 mol/l phosphate buffer pH 6.8 (Faren Ltd., Uherské Hradiště, Czech Republic), DPPH (2,2–diphenyl–1–picrylhydrazyl), ABTS (2,29–azinobis–(3-ethylbenzothiazoline-6-sulfonic acid)), pullulan (Merck KGaA, Darmstadt, Germany), TSA (Tryptic Soy Agar), PCA (Plate Count Agar), VRBL (Violet Red Bile Agar), SDA (Sabouraud Dextrose Agar), α–cyano–4–hydroxycinnamic acid (Merck KGaA, Darmstadt, Germany), own gelatine samples.
5.2. Samples of Extracted Gelatins
Gelatins were prepared from chicken stomachs according to the study of Prokopova et al. [32]. The extraction of the gelatins was modeled by the Taguchi design, a method of multifactorial experiments; it allows statistical evaluation and exploration of the influence of independent variables (processing factors) on dependent variables [59]. Two factors at three levels were chosen: factor A – the amount of enzyme added (0.10, 0.15, and 0.20%), and factor B – the extraction temperature (55.0, 62.5, and 70.0 °C). The extraction time was constant, 45 min. Nine samples of gelatins of the first fractions were prepared; a list of the gelatin samples with the technological conditions of the extraction process is given in Table 8. The gelatin samples were ground to a fine powder using a blender and stored in the dark in a desiccator at a laboratory temperature of 20.0±2.0 °C [32].
5.2.1. Antioxidant Activity
The purpose of determining the antioxidant activity of the samples was to establish to what extent the hydrolysis process affects the antioxidant activity. Furthermore, it will investigate whether the concentration of gelatin solution influences antioxidant activity. It is assumed that as the concentration of gelatin increases, the amount of scavenged free radicals will also increase. The amount of scavenged free radicals is expected to increase with lower molecular weight, gel strength, and viscosity. These assumptions are based on previous studies on a similar topic [14,15,16,17,53]. Antioxidant activity was determined using 2,2–diphenyl–1–picrylhydrazyl (hereafter referred to as DPPH) and 2,29–azinobis–3–etylbenzotiazolin–6–sulfonic acid (hereafter referred to as ABTS).
DPPH radicals are purple-colored free radicals that require an electron or proton (H+) transfer process from an antioxidant-rich sample to transform. This phenomenon causes the dark-colored solution to turn colorless or slightly yellowish [13,14,15]. In contrast, the ABTS system represents a radical with a nitrogen center, which has a blue-green coloration of the antioxidant compound upon reduction, the solution with ABTS changes to a non-radical form from colored to colorless. The ABTS method tends to determine a higher antioxidant activity than the method involving DPPH. This is possibly caused by the fact that the ABTS method tends to detect both hydrophobic and hydrophilic compounds, but the DPPH method only detects hydrophobic compounds [12,13,14]. Gelatins display hydrophilic properties; through electrostatic interactions, hydrogen bonds are formed between the –NH2 group of gelatins and the –OH group of water, and this affects radical scavenging, especially for DPPH, which detects only hydrophobic compounds [13,14,30].
The study’s methodology was based on preparing chicken gelatine samples of different concentrations in distilled water. The gelatins were weighed, distilled water was added, and the whole system was heated to 45.0±2.0 °C to dissolve the gelatins. A total of 5 solutions at different concentrations were prepared for each gelatin fraction (2, 4, 6, 8, and 10 mg/ml). The preparation of the mixture solution for measurement consisted of mixing 500 µl of the gelatin sample solution with 500 µl of 95% ethanol and 125 µl of 0.2 mM DPPP or ABTS solution. The mixture was stirred in a circular motion, centrifuged at a rotational speed of 2000 rpm on a centrifuge for 3 min to settle the impurities and crystals, and then incubated in the dark at a laboratory temperature of 20.0±2.0 °C for 30 ± 1 min. The absorbance of the samples was then measured at 517 nm on a Helios 3 Thermo Spectronic UV-VIS spectrophotometer.
Calculations to determine the scavenging activities of the protein fractions towards DPPH or ABTS radicals were performed according to equations (1) and (2):
where AC represents the absorbance of the DPPH solution without gelatin samples, AB represents the absorbance of the gelatin samples with ethanol and distilled water without DPPH, and AS represents the absorbance of the gelatin samples in distilled water.
where AC represents the absorbance of the ABTS solution only without the gelatine samples, AB represents the absorbance of the gelatine samples with ethanol and distilled water without ABTS, and AS represents the absorbance of the gelatine samples in distilled water.
5.2.2. Molecular Weight Distribution
The molecular weight distributions of gelatin samples were determined by gel permeation chromatography with refractometric detection (GPC–RID), and the individual values were compared with available literature [2,3,39,40,41,42]. The molecular weights for gelatins are assumed to contain at least one α-chain and a β-chain of about 110–120 kDa and 190–210 kDa, respectively.
The analytical method consisted of weighing a 2.00±0.01 mg powdered sample on an analytical scale, which was dissolved in 1 ml of 0.1 mol/l phosphate buffer in a sealed vial at a laboratory temperature of 20.0±2.0 °C for 4 hours. The resulting concentration of the analyte in the solution was 2 mg/ml. The Waters HPLC Breeze analytical apparatus was injected with 100 µl of the sample, the measurement process was carried out at 40.0±1.0 °C, and the solution flow rate was 1 ml/min. The system was calibrated using pullulan standards in the 667–344000 Da range. Table 9 summarizes the determined molecular weights, including the polydispersity index.
5.2.3. Functional Groups
The FTIR spectroscopy’s objective was to analyze the peak regions (Amide A and B, Amide I, II, and III) for each gelatin sample and compare with the available literature [3,7,8,10,16,29,43,44,45,46,47,48,49]. The gelatins are expected to contain the typical peaks of Amide A and B, Amide I, II, and III.
The spectra of each powdered gelatin sample were measured using FTIR Bruker ALPHA. The measurements were performed using the ATR method, with the platinum crystal always oriented on the side facing the lamp during photo exposure. As a control sample, the background without gelatin was used. The samples were exposed to infrared light ranging from 400 to 4000 1/cm. A total of 32 scans were taken during one measurement. The work was carried out in the laboratory at a constant temperature of 20.0±2.0 °C. Table 10 shows the characteristic FTIR peak vibrational regions for powdered gelatins [3,10,16,45].
5.2.4. Microbiological Properties
The objective was to determine the mass spectra using a micro-flex LT MALDI–TOF mass spectrometer (Desorption/Ionization Time of Flight MS Biotyper method) and identify the microorganisms in the gelatins.
The methodology is based on the study by Gal et al. [18] with partial modifications of the procedure. As part of the microbiological composition of the gelatins, the following microbial populations were evaluated: SDA, PCA, TSA, and VRBL. The gelatin samples’ coliform bacteria (VRBL), yeasts, and fungi (SDA) were monitored. The overall number of bacteria cultured on TSA and viable cells cultured on PCA were determined. Growth mediums were prepared according to the manufacturer’s instructions (Merck KGaA, Darmstadt, Germany). A gelatin sample of 5.00±0.01 g was hydrated in 45.0±0.5 ml of distilled water at 37.0±1.0 °C. The sample thus prepared was inoculated on a growth medium in an amount of 100 µl. The cultivation was performed on SDA at 25.0±0.5 °C for 7 days, PCA samples were cultivated at 30.0±0.5 °C for 24 h, and TSA and VRBL samples were cultivated at 37.0±0.5 °C for 24 h. Under the above conditions, colonies grown on medium were repeatedly aseptically inoculated and cultivated on growth medium PCA, SDA, TSA, and VRBL. Samples were prepared for analysis on the MALDI-TOF Matrix-Assisted Laser by mixing the bacterial culture with 300 µl of sterile distilled water and 900 µl of 96% ethanol. Subsequently, the samples were centrifuged for 2 min at 14000 rpm. After centrifugation, the supernatant was removed, and the pellets were re-centrifuged. The supernatant was removed, and the pellets were dried. The pellets were dissolved in 30 µl of 70% formic acid and 30 µl of acetonitrile. The suspension was centrifuged at 14000 rpm for 2 min, and 1 µl of the supernatant was applied to a MALDI plate. After drying, each sample was recoated with 1 µl 2–cyano–3–(4–hydroxyphenyl) acrylic acid and dried again. The resulting samples were isolated by nitrogen laser. The results were evaluated by the MALDI Biotyper 3.0 identification database (Matrix–Assisted Laser Desorption/Ionization Time of Flight MS Biotyper).
The mass spectra were generated automatically using a Microflex LT MALDI–TOF mass spectrometer operating in a linear positive mode in the mass range of 2 to 20 kDa. Before the actual measurement, the apparatus was calibrated using the Bruker bacterial test standard. The identification criteria used to evaluate the data obtained are shown in Table 11 [18].
5.3. Statistical Analysis
All data were processed and evaluated for antioxidant activity using Microsoft Office Excel (Denver, USA, 2010). For molecular weight, the data were processed using Empower software (Colorado, USA, 2014). For FTIR analysis, data were processed, and graphical dependencies of wavenumbers (1/cm) on absorbance (–) for all gelatin samples were evaluated using Microsoft Office Excel (Denver, USA, 2010).
6. The Practical Relevance of the Work
The ideal solution to the growing demand for gelatins is offering another alternative raw material source, such as poultry collagen [31,32]. When comparing the individual gelatin samples, the antioxidant activity was more than 69% for the DPPH samples and more than 80% for the ABTS samples. Biomolecules with solid antioxidant properties can be widely used in the cosmetic and pharmaceutical industries. Here, collagen products can be used to research and develop anti-aging matrices, new pharmaceuticals, and hemostatic agents and to produce packaging and coating materials. In the food industry, the higher antioxidant activity allows the application of gelatins prepared from chicken stomachs to produce edible packaging and coatings [10,11,12,13,14,15,17]. When comparing individual gelatin samples and molecular weights, it was found that samples with lower gel strength and lower viscosity also had lower molecular weights. Gel strength and viscosity influence the quality of gelatine and are a predetermining factor for its application. Gelatins with a gel strength >350 Bloom are suitable for applications in the pharmaceutical and medical industries, gelatins with a gel strength of 100–350 Bloom in the food industry, and gelatins with a gel strength <100 Bloom usually for technical applications. The lower molecular weight is caused by higher degradation of the chains in collagen because of enzymatic hydrolysis. FTIR spectroscopy confirmed all the characteristic peak regions: Amide A and B, Amide I, II, and III, which are typical for gelatins. At the same time, all peaks were in the characteristic vibrational regions. Microbiological analysis showed that chicken gelatins are not defective and can be applied in the food, pharmaceutical, medical, or cosmetic industries. After performing all the analyses, gelatins from chicken stomachs using biotechnological procedures are suitable for application in the food, cosmetic, pharmaceutical, and medical industries. In the food industry, gelatins are suitable for producing packaging materials and edible films. In the cosmetic industry, collagen hydrolysates might produce anti-aging creams and gels. In the pharmaceutical and medical industry, gelatines could be used as carriers for new drugs and to produce products based on hemostatic agents. Chicken gelatine could also be used to manufacture bioplastics and thus replace conventional synthetic materials [42].
7. Conclusions
Gelatin from chicken stomachs offers considerable potential for new applications in producing packaging materials, edible films, anti-aging creams, and gels as a pharmaceutical carrier and for products based on hemostatic agents. This new resource is a contribution to the circular economy concept, it contributes to the protection of the environment when disposing of slaughterhouse waste and valorizing input raw materials. Enzymatic hydrolysis allows less wasting of water and raw material, reduces processing time, saves energy, and thus eliminates undesirable environmental aspects.
Author Contributions
Conceptualization, Aneta Prokopová; methodology, Aneta Prokopová; software, Jana Pavlačková; validation, Pavel Mokrejš; formal analysis, Robert Gál; investigation, Pavel Mokrejš; resources, Robert Gál; data curation, Pavel Mokrejš; writing—original draft preparation, Aneta Prokopová; writing—review and editing, Pavel Mokrejš; visualization, Jana Pavlačková; supervision, Anna Hurajová; project administration, Robert Gál; funding acquisition, Anna Hurajová.
Funding
This research was funded by the Internal Grant Agency of the Faculty of Technology, Tomas Bata University in Zlin, ref. No. IGA/FT/2023/008; and by the Ministry of Education, Youth and Sports of the Czech Republic – programme DKRVO (RP/CPS/2022/002).
Institutional Review Board Statement
Not applicable.
Informed Consent Statement
Not applicable.
Acknowledgments
The authors thank David Dohnal (Přerov, the Czech Republic) for editing the manuscript.
Conflicts of Interest
The authors declare no conflict of interest.
References
- Díaz-Calderón, P.; Flores, E.; González-Muñoz, A.; Pepczynska, M.; Quero, F.; Enrione, J. Influence of extraction variables on the structure and physical properties of salmon gelatin. Food Hydrocoll. 2017, 71, 118–128. [Google Scholar] [CrossRef]
- Cho, S.H.; Jahncke, M.L.; Chin, K.B.; Eun, J.B. The effect of processing conditions on the properties of gelatin from skate (Raja Kenojei) skins. Food Hydrocoll. 2006, 20, 810–816. [Google Scholar] [CrossRef]
- Sinthusamran, S.; Benjakul, S.; Kishimura, H. Characteristics and gel properties of gelatin from skin of seabass (Lates calcarifer) as influenced by extraction conditions. Food Chem. 2014, 152, 276–284. [Google Scholar] [CrossRef] [PubMed]
- Lv, L.CH.; Huang, Q.Y.; Ding, W.; Xiao, X.H.; Zhang, H.Y.; Xiong, L.X. Fish gelatin: The novel potential applications. J. Funct. Foods 2019, 63, 103581. [Google Scholar] [CrossRef]
- Saenmuang, S.; Phothiset, S.; Chumnanka, CH. Extraction and characterization of gelatin from black-bone chicken by-products. Food Sci. Biotechnol. 2020, 29, 469–478. [Google Scholar] [CrossRef] [PubMed]
- Hafidz, R.M.R.N.; Yaakob, C.M.; Amin, I.; Noorfaizan, A. Chemical and functional properties of bovine and porcine skin gelatin. Int. Food Res. J. 2011, 18, 787–791. [Google Scholar]
- Saidi, S.G.; Rahman, M.S.; Guizani, N. Fourier transform infrared (FTIR) spectroscopic study of extracted gelatin from shaari (Lithrinus microdon) skin: Effects of extraction conditions. Int. Food Res. J. 2012, 19, 1167–1173. [Google Scholar]
- Silva, R.S.G.; Bandeira, S.F.; Pinto, L.A.A. Characteristics and chemical composition of skins gelatin from cobia (Rachycentron canadum). LWT – Food Sci. Technol. 2014, 57, 580–585. [Google Scholar] [CrossRef]
- Zhuang, Y.L.; Sun, L.P.; Zhao, X.; Hou, H.; Li, B.F. Investigation of gelatin polypeptides of jellyfish (Rhopilema esculentum) for their antioxidant activity in vitro. Food Technol. Biotechnol. 2010, 48, 222–228. [Google Scholar]
- Ho, T.C.; Lim, J.S.; Kim, S.J.; Kim, S.Y.; Chun, B.S. In vitro biodegradation, drug absorption, and physical properties of gelatin-fucoidan microspheres made of subcritical-water-modified fish gelatin. Marine Drugs 2023, 21, 287. [Google Scholar] [CrossRef]
- Yang, J.I.; Ho, H.Y.; Chu, Y.J.; Chow, Ch.J. Characteristic and antioxidant activity of retorted gelatin hydrolysates from cobia (Rachycentron canadum) skin. Food Chem. 2008, 110, 128–136. [Google Scholar] [CrossRef] [PubMed]
- Tongnuanchan, P.; Benjakul, S.; Prodpran, T. Physico-chemical properties, morphology and antioxidant activity of film from fish skin gelatin incorporated with root essential oils. J. Food Eng. 2013, 117, 350–360. [Google Scholar] [CrossRef]
- Tongnuanchan, P.; Benjakul, S.; Prodpran, T. Properties and antioxidant activity of fish skin gelatin film incorporated with citrus essential oils. Food Chem. 2012, 134, 1571–1579. [Google Scholar] [CrossRef] [PubMed]
- Nurilmala, M.; Hizbullah, H.H.; Karnia, E.; Kusumaningtyas, E.; Ochiai, Y. Characterization and antioxidant activity of collagen, gelatin, and the derived peptides from yellowfin tuna (Thunnus albacares) skin. Marine Drugs 2020, 18, 98. [Google Scholar] [CrossRef] [PubMed]
- Ngo, D.H.; Qian, Z.J.; Ryu, B.M.; Park, J.W.; Kim, S.K. In vitro antioxidant activity of a peptide isolated from Nile tilapia (Oreochromis niloticus) scale gelatin in free radical-mediated oxidative systems. J. Funct. Foods 2010, 2, 107–117. [Google Scholar] [CrossRef]
- Herawati, E.; Akhsanitaqwim, Y.; Agnesia, P.; Listyawati, S.; Pangastuti, A.; Ratriyanto, A. In vitro antioxidant and antiaging activities of collagen and its hydrolysate from mackerel scad skin (Decapterus macarellus). Marine Drugs 2022, 20, 516. [Google Scholar] [CrossRef]
- Wu, J.; Chen, S.; Ge, S.; Miao, J.; Li, J.; Zhang, Q. Preparation, properties and antioxidant activity of an active film from silver carp (Hypophthalmichthys molitrix) skin gelatin incorporated with green tea extract. Food Hydrocoll. 2013, 32, 42–51. [Google Scholar] [CrossRef]
- Gál, R.; Čmiková, N.; Prokopová, A.; Kačániová, M. Antilisterial and antimicrobial effect of Salvia officinalis essential oil in beef sous-vide meat during storage. Foods 2023, 12, 2201. [Google Scholar] [CrossRef]
- Lorenzo, J.M.; Munekata, P.E.; Dominguez, R.; Pateiro, M.; Saraiva, J.A.; Franco, D. Main Groups of Microorganisms of Relevance for Food Safety and Stability: General Aspects and Overall Description. In Innovative Technologies for Food Preservation, 1st ed.; Barba, F.J., Sant’Ana, A.D.S., Orlien, V., Koubaa, M., Eds.; Elsevier Inc.: London, United Kingdom, 2018; pp. 53–107. [Google Scholar] [CrossRef]
- Jensen, G.B.; Hansen, B.M.; Eilenberg, J.; Mahillon, J. The hidden lifestyles of Bacillus cereus and relatives. Environ. Microbiol. 2003, 5, 631–640. [Google Scholar] [CrossRef]
- Clerck, E.D.; Vanhoutte, T.; Hebb, T.; Geerinck, J.; Devos, J.; Vos, P.D. Isolation, characterization, and identification of bacterial contaminants in semifinal gelatin extracts. Appl. Environ. Microbiol. 2004, 70, 3664–3672. [Google Scholar] [CrossRef]
- Coburn, B.; Grassl, G.A.; Finlay, B.B. Salmonella, the host and disease: a brief review. Immunol. Cell Biol. 2007, 85, 112–118. [Google Scholar] [CrossRef] [PubMed]
- Gomes, T.A.T.; Elias, W.P.; Scaletsky, I.C.A.; Guth, B.E.C.; Rodrigues, J.F.; Piazza, R.M.F.; Ferreira, L.C.S.; Martinez, M.B. Diarrheagenic Escherichia coli. Braz. J. Microbiol. 2016, 47, 3–30. [Google Scholar] [CrossRef] [PubMed]
- Gasanov, U.; Hughes, D.; Hansbro, P.M. Methods for the isolation and identification of Listeria spp. and Listeria monocytogenes: a review. FEMS Microbiol. Rev. 2005, 29, 851–875. [Google Scholar] [CrossRef] [PubMed]
- Rasko, D.A.; Altherr, M.R.; Han, C.S.; Ravel, J. Genomics of the Bacillus cereus group of organisms. FEMS Microbiol. Rev. 2005, 29, 303–329. [Google Scholar] [CrossRef] [PubMed]
- Deurenberg, R.H.; Stobberingh, E.E. The evolution of Staphylococcus aureus. Infect. Genet. Evol. 2008, 8, 747–763. [Google Scholar] [CrossRef] [PubMed]
- Prokopová, A.; Pavlačková, J.; Mokrejš, P.; Gál, R. Collagen Hydrolysate prepared from chicken by-product as a functional polymer in cosmetic formulation. Molecules 2021, 26, 2021. [Google Scholar] [CrossRef] [PubMed]
- Rather, J.A.; Akhter, N.; Ashraf, Q.S.; Mir, S.A.; Makroo, H.A.; Majid, D.; Barba, F.J.; Khaneghah, A.M.; Dar, D.N. A comprehensive review on gelatin: understanding impact of the sources, extraction methods, and modifications on potential packaging applications. Food Packag. Shelf Life 2022, 34, 100945. [Google Scholar] [CrossRef]
- Rasli, H.I.; Sarbon, N.M. Effects of different drying methods on the rheological, functional and structural properties of chicken skin gelatin compared to bovine gelatin. Int. Food Res. J. 2015, 22, 584–592. [Google Scholar]
- Fatima, S.; Mir, M.I.; Khan, M.R.; Sayyed, R.Z.; Mehnaz, S.; Abbas, S.; Sadiq, M.B.; Masih, R. The optimization of gelatin extraction from chicken feet and the development of gelatin based active packaging for the shelf-life extension of fresh grapes. Sustainability 2022, 14, 7881. [Google Scholar] [CrossRef]
- Mokrejš, P.; Mrázek, P.; Gál, R.; Pavlačková, J. Biotechnological preparation of gelatines from chicken feet. Polymers 2019, 11, 1060. [Google Scholar] [CrossRef]
- Prokopová, A.; Mokrejš, P.; Pavlačková, J.; Gál, R. Preparation of gelatin from broiler chicken stomach collagen. Foods 2023, 12, 127. [Google Scholar] [CrossRef] [PubMed]
- Razavizadeh, R.S.; Farmani, J.; Motamedzadegan, A. Enzyme-assisted extraction of chicken skin protein hydrolysates and fat: Degree of hydrolysis affects the physicochemical and functional properties. J. Am. Oil Chem. Soc. 2022, 99, 621–632. [Google Scholar] [CrossRef]
- Dong, Z.Y.; Li, M.Y.; Tian, G.; Zhang, T.H.; Ren, H.; Quek, S.Y. Effects of ultrasonic pretreatment on the structure and functionality of chicken bone protein prepared by enzymatic method. Food Chem. 2019, 299, 125103. [Google Scholar] [CrossRef] [PubMed]
- Dong, X.B.; Li, X.; Zhang, Ch.H.; Wang, J.Z.; Tang, Ch.H.; Sun, H.M.; Jia, W.; Li, Y.; Chen, L.L. Development of a novel method for hot-pressure extraction of protein from chicken bone and the effect of enzymatic hydrolysis on the extracts. Food Chem. 2014, 157, 339–346. [Google Scholar] [CrossRef] [PubMed]
- Huang, J.; Lu, F.; Wu, Y.; Wang, D.; Xu, W.; Zou, Y.; Sun, W. Enzymatic extraction and functional properties of phosphatidylcholine from chicken liver. Poultry Sci. 2022, 101(6), 101689. [Google Scholar] [CrossRef] [PubMed]
- Mokrejš, P.; Gál, R.; Pavlačková, J. Enzyme conditioning of chicken collagen and taguchi design of experiments enhancing the yield and quality of prepared gelatins. Int. J. Mol. Sci. 2023, 24, 3654. [Google Scholar] [CrossRef] [PubMed]
- Mokrejš, P.; Gál, R.; Pavlačková, J.; Janáčová, D. Valorization of a by-product from the production of mechanically deboned chicken meat for preparation of gelatins. Molecules 2021, 26, 349. [Google Scholar] [CrossRef] [PubMed]
- Rogošić, M.; Mencer, H.J.; Gomzi, Z. Polydispersity index and molecular weight distributions of polymers. Eur. Polym. J. 1996, 32, 1337–1344. [Google Scholar] [CrossRef]
- Yu, H.; Huang, N.; Wang, Ch.; Tang, Z. Modeling of poly(L-lactide) thermal degradation: Theoretical prediction of molecular weight and polydispersity index. J. Appl. Polym. Sci. 2003, 88, 2557–2562. [Google Scholar] [CrossRef]
- Abedinia, A.; Nafchi, A.M.; Sharifi, M.; Ghalambor, P.; Oladzadabbasabadi, N.; Ariffin, F.; Huda, N. Poultry gelatin: Characteristics, developments, challenges, and future outlooks as a sustainable alternative for mammalian gelatin. Trends Food Sci. Technol. 2020, 104, 14–26. [Google Scholar] [CrossRef]
- Rigueto, C.V.T.; Rosseto, M.; Alessandretti, I.; Oliveira, R.D.; Wohlmuth, D.A.R.; Menezes, J.F.; Loss, R.A.; Dettmer, A.; Pizzutti, I.R. Gelatin films from wastes: A review of production, characterization, and application trends in food preservation and agriculture. Food Res. Int. 2022, 162, 112114. [Google Scholar] [CrossRef]
- Chakka, A.K.; Ali, A.M.M.; Sakhare, P.Z.; Bhaskar, N. Poultry processing waste as an alternative source for mammalian gelatin: extraction and characterization of gelatin from chicken feet using food grade acids. Waste Biomass Valor. 2017, 8. [Google Scholar] [CrossRef]
- Almeida, P.F.; Lannes, S.C.S.; Calarge, F.A.; Farias, T.M.B.; Santana, J.C.C. FTIR characterization of gelatin from chicken feet. J. Chem. Chem. Eng. 2012, 6, 1029–1032. [Google Scholar]
- Muyonga, J.H.; Cole, C.G.B.; Duodu, K.G. Fourier transform infrared (FTIR) spectroscopic study of acid soluble collagen and gelatin from skins and bones of young and adult Nile perch (Lates niloticus). Food Chem. 2004, 86, 325–332. [Google Scholar] [CrossRef]
- Cebi, N.; Dogan, C.E.; Mese, A.E.; Ozdemir, D.; Arıcı, M.; Sagdic, O. A rapid ATR-FTIR spectroscopic method for classification of gelatin gummy candies in relation to the gelatin source. Food Chem. 2019, 277, 373–381. [Google Scholar] [CrossRef] [PubMed]
- Widyasari, R.; Rawdkuen, S. Extraction and characterization of gelatin from chicken feet by acid and ultrasound assisted extraction. Food Appl. Biosci. J. 2014, 2, 85–97. [Google Scholar] [CrossRef]
- Santana, J.C.C.; Gardim, R.B.; Almeida, P.F.; Borini, G.B.; Quispe, A.P.B.; Llanos, S.A.V.; Heredia, J.A.; Zamuner, S.; Gamarra, F.M.C.; Farias, T.M.B.; Ho, L.L.; Berssaneti, F.T. Valorization of chicken feet by-product of the poultry industry: high qualities of gelatin and biofilm from extraction of collagen. Polymers 2020, 12, 529. [Google Scholar] [CrossRef] [PubMed]
- Enrione, J.; Char, C.; Pepczynska, M.; Padilla, Ch.; González-Muñoz, A.; Olguín, Y.; Quinzio, C.; Iturriaga, L.; Díaz-Calderón, P. Rheological and structural study of salmon gelatin with controlled molecular weight. Polymers 2020, 12, 1587. [Google Scholar] [CrossRef]
- Sinel, C.; Augagneur, Y.; Sassi, M.; Bronsard, J.; Cacaci, M.; Guérin, F.; Sanguinetti, M.; Meignen, P.; Cattoir, V.; Felden, B. Small RNAs in vancomycin-resistant Enterococcus faecium involved in daptomycin response and resistance. Sci. Rep. 2017, 7, 11067. [Google Scholar] [CrossRef]
- Pidot, S.J.; Gao, W.; Buultjens, A.H.; Monk, I.R.; Guerillot, R.; Carter, G.P.; Lee, J.Y.H.; Lam, M.M.C.; Grayson, M.L.; Ballard, S.A.; Mahony, A.A.; Grabsch, E.A.; Kotsanas, D.; Korman, T.M.; Coombs, G.W.; Robinson, J.O.; Gonçalves da Silva, A.; Seemann, Z.; Howden, B.P.; Johnson, P.D.R.; Stinear, T.P. Increasing tolerance of hospital Enterococcus faecium to handwash alcohols. Sci. Transl. Med. 2018, 10. [Google Scholar] [CrossRef]
- Siepert, B.; Reinhardt, N.; Kreuzer, S.; Bondzio, A.; Twardziok, S.; Brockmann, G.; Nöckler, K.; Szabó, I.; Janczyk, P.; Pieper, R.; Tedin, K. Enterococcus faecium NCIMB 10415 supplementation affects intestinal immune-associated gene expression in post-weaning piglets. Vet. Immunol. Immunopathol. 2014, 157, 65–77. [Google Scholar] [CrossRef]
- Razali, A.N.; Amin, A.M.; Sarbon, N.M. Antioxidant activity and functional properties of fractionated cobia skin gelatin hydrolysate at different molecular weight. Int. Food Res. J. 2015, 22, 651–660. [Google Scholar]
- Jongjareonrak, A.; Benjakul, S.; Visessanguan, W.; Tanaka, M. Skin gelatin from bigeye snapper and brownstripe red snapper: chemical compositions and effect of microbial transglutaminase on gel properties. Food Hydrocoll. 2006, 20, 1216–1222. [Google Scholar] [CrossRef]
- Mohtar, N.F.; Perera, C.; Quek, S.Y. Optimisation of gelatine extraction from hoki (Macruronus novaezelandiae) skins and measurement of gel strength and SDS–PAGE. Food Chem. 2010, 122, 307–313. [Google Scholar] [CrossRef]
- Tewari, A.; Abdullah, S. Bacillus cereus food poisoning: international and Indian perspective. J. Food Sci. Technol. 2015, 52, 2500–2511. [Google Scholar] [CrossRef] [PubMed]
- Giraffa, G. Enterococci from foods. FEMS Microbiol. Rev. 2002, 26, 163–171. [Google Scholar] [CrossRef] [PubMed]
- Verma, T.; Chaves, B.D.; Howell Jr., T.; Subbiah, J. Thermal inactivation kinetics of Salmonella and Enterococcus faecium NRRL B-2354 on dried basil leaves. Food Microbiol. 2021, 96, 103710. [Google Scholar] [CrossRef] [PubMed]
- Zhang, J.Z.; Chen, J.C.; Kirby, E.D. Surface roughness optimization in an end-milling operation using the Taguchi design method. J. Mater. Process. Technol. 2007, 184, 233–239. [Google Scholar] [CrossRef]
Figure 1.
FTIR spectra of gelatin samples No. 1, 2 and 3.
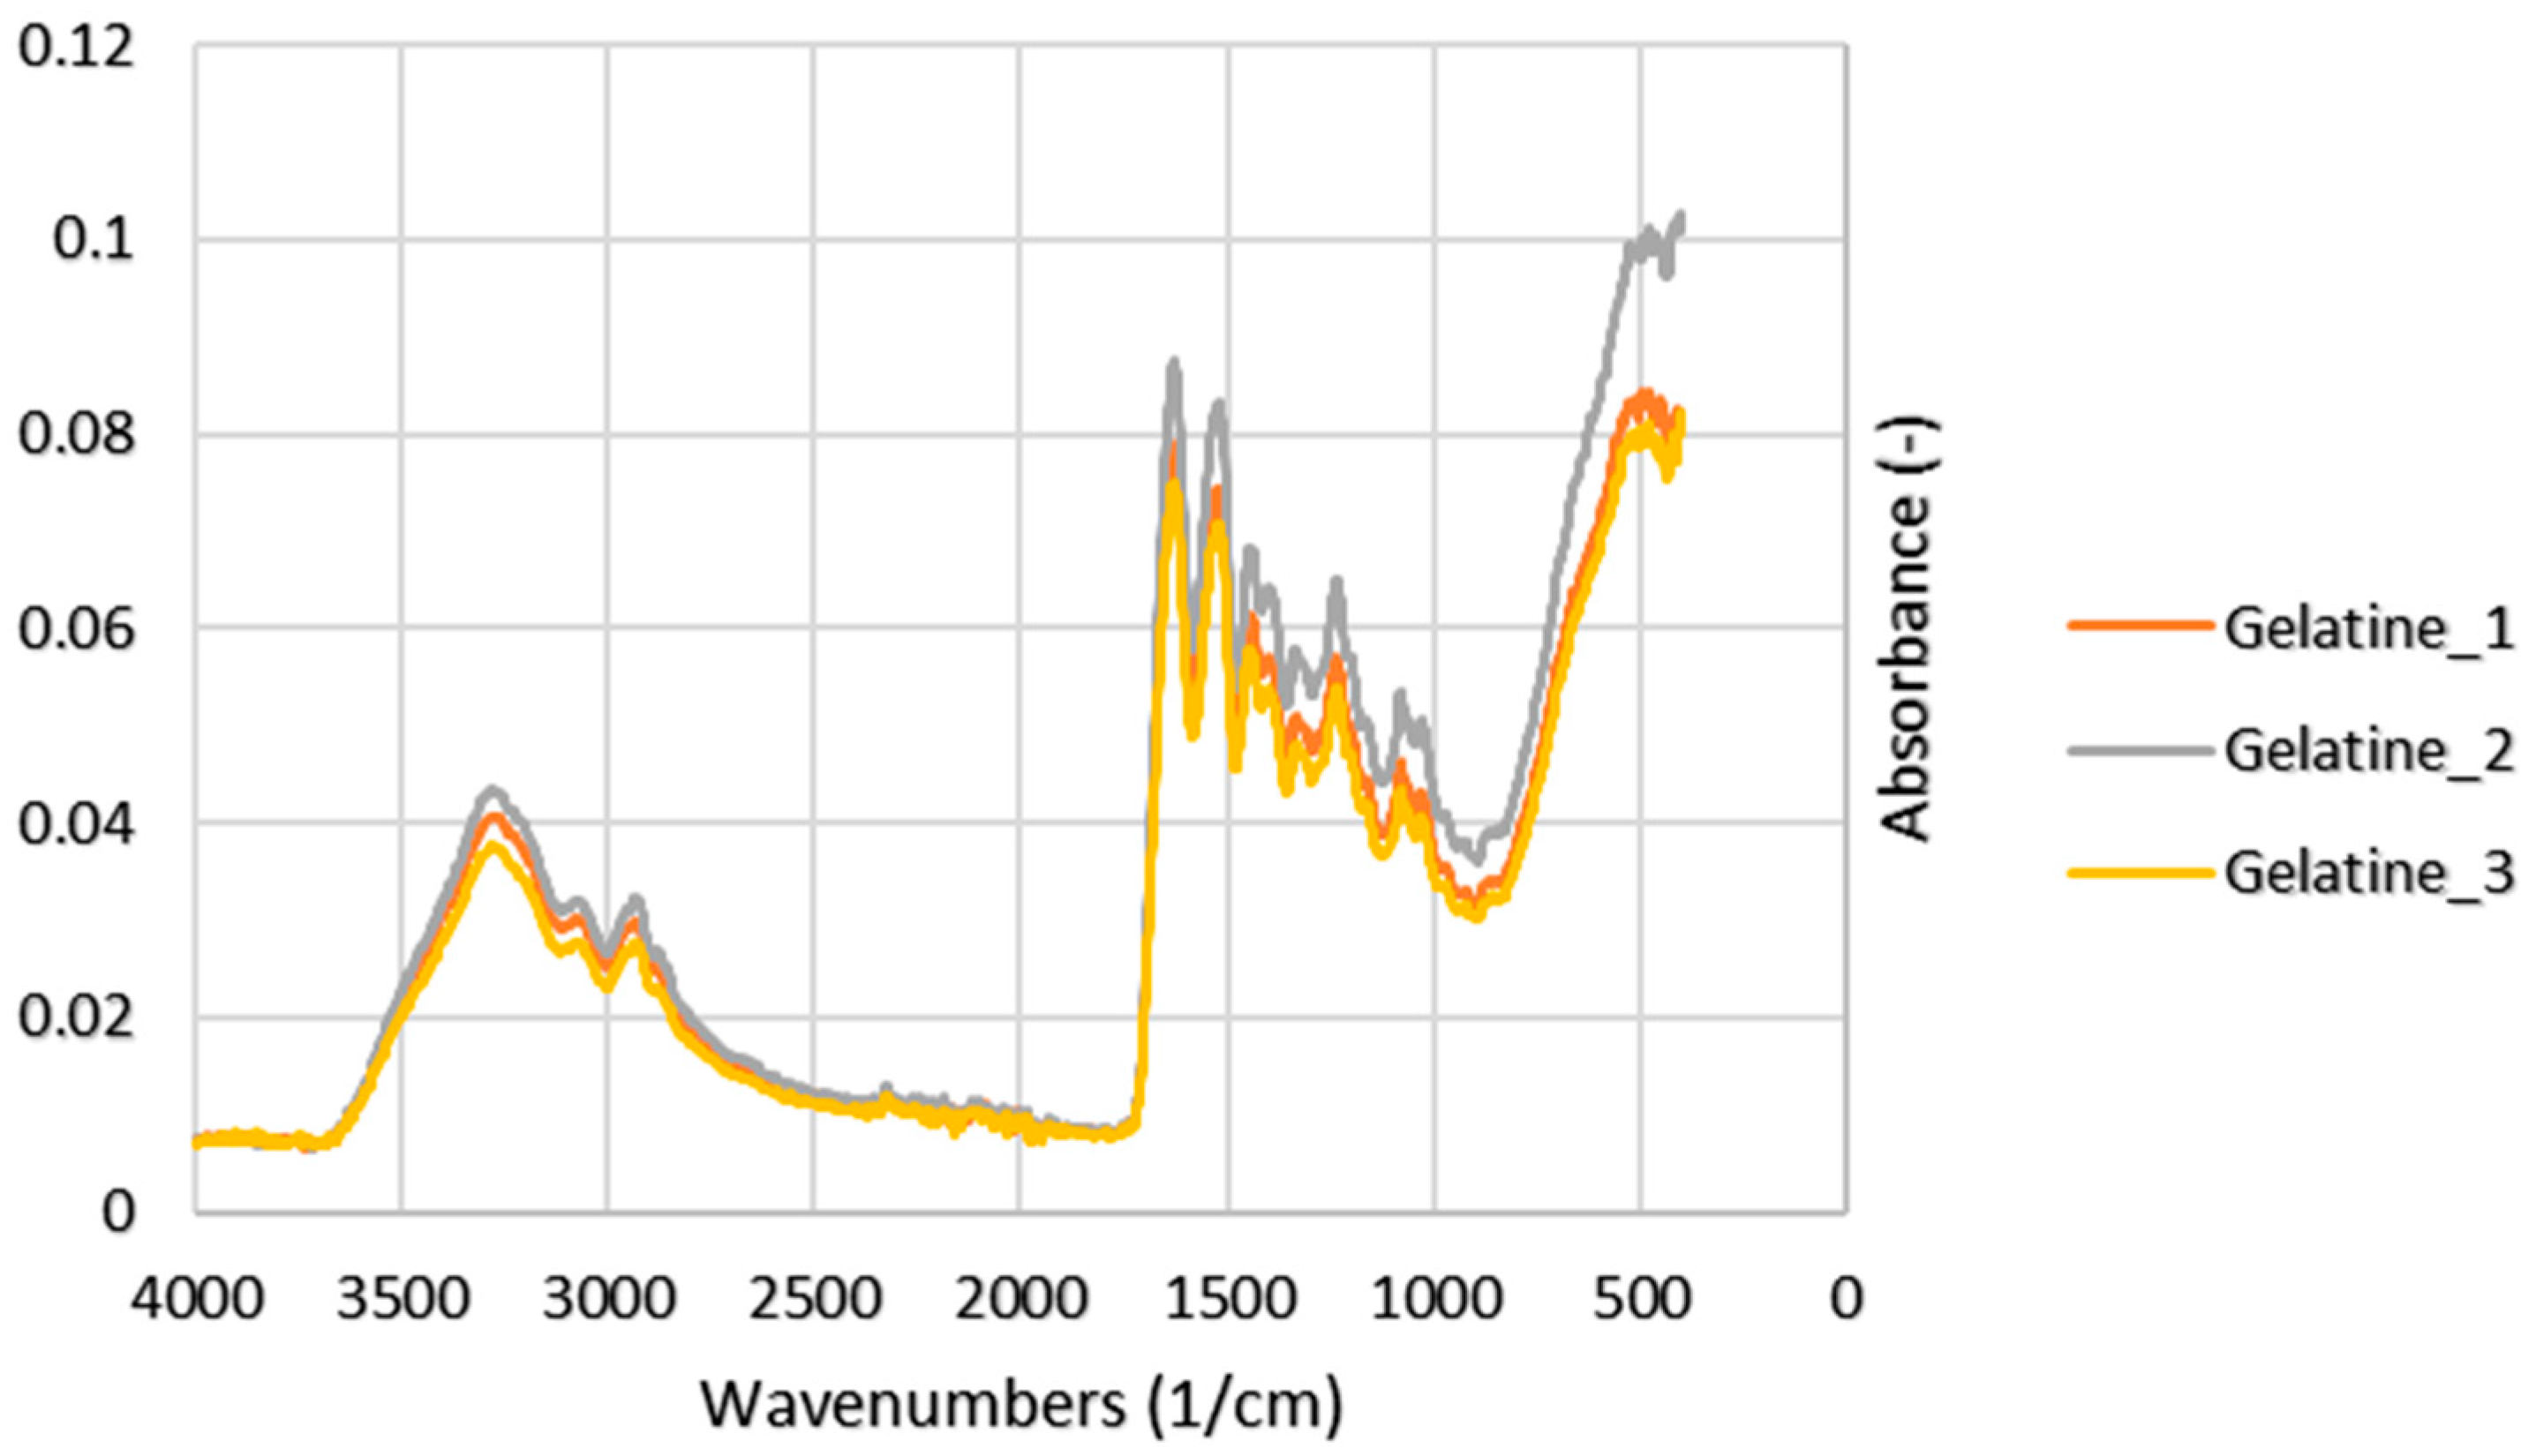
Figure 2.
FTIR spectra of gelatin samples No. 4, 5, and 6.
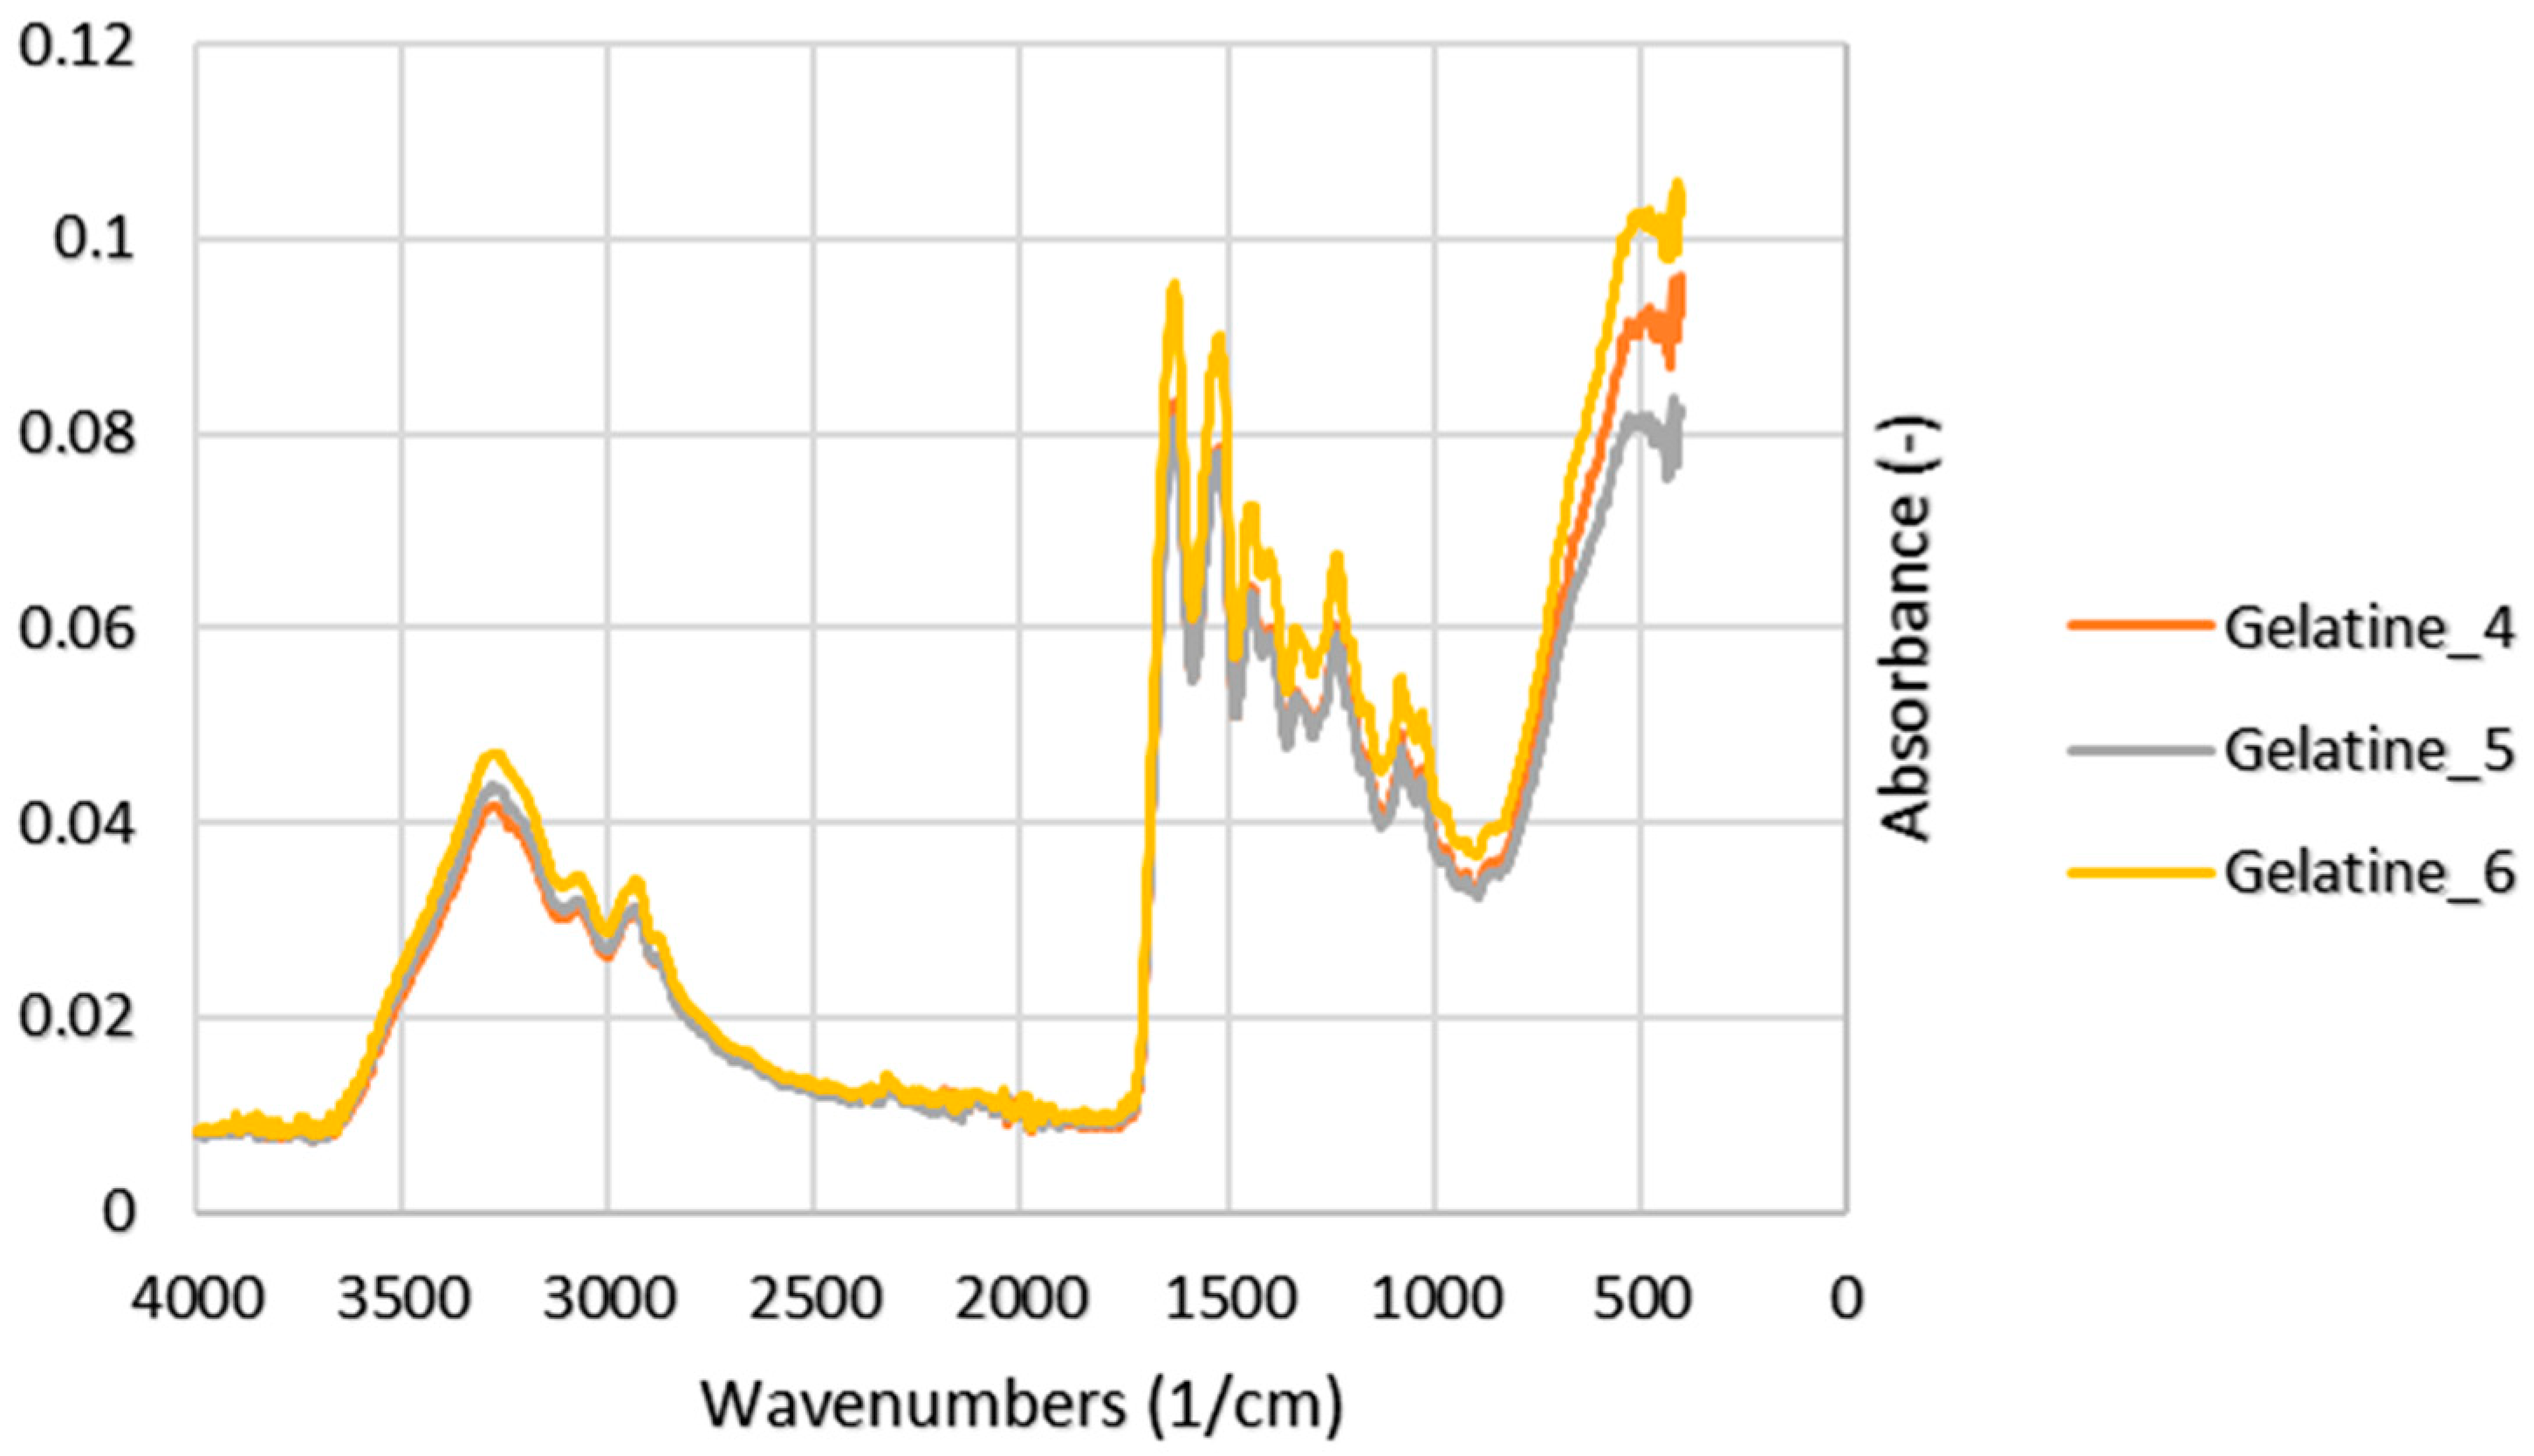
Figure 3.
FTIR spectra of gelatin samples No. 7, 8, and 9.
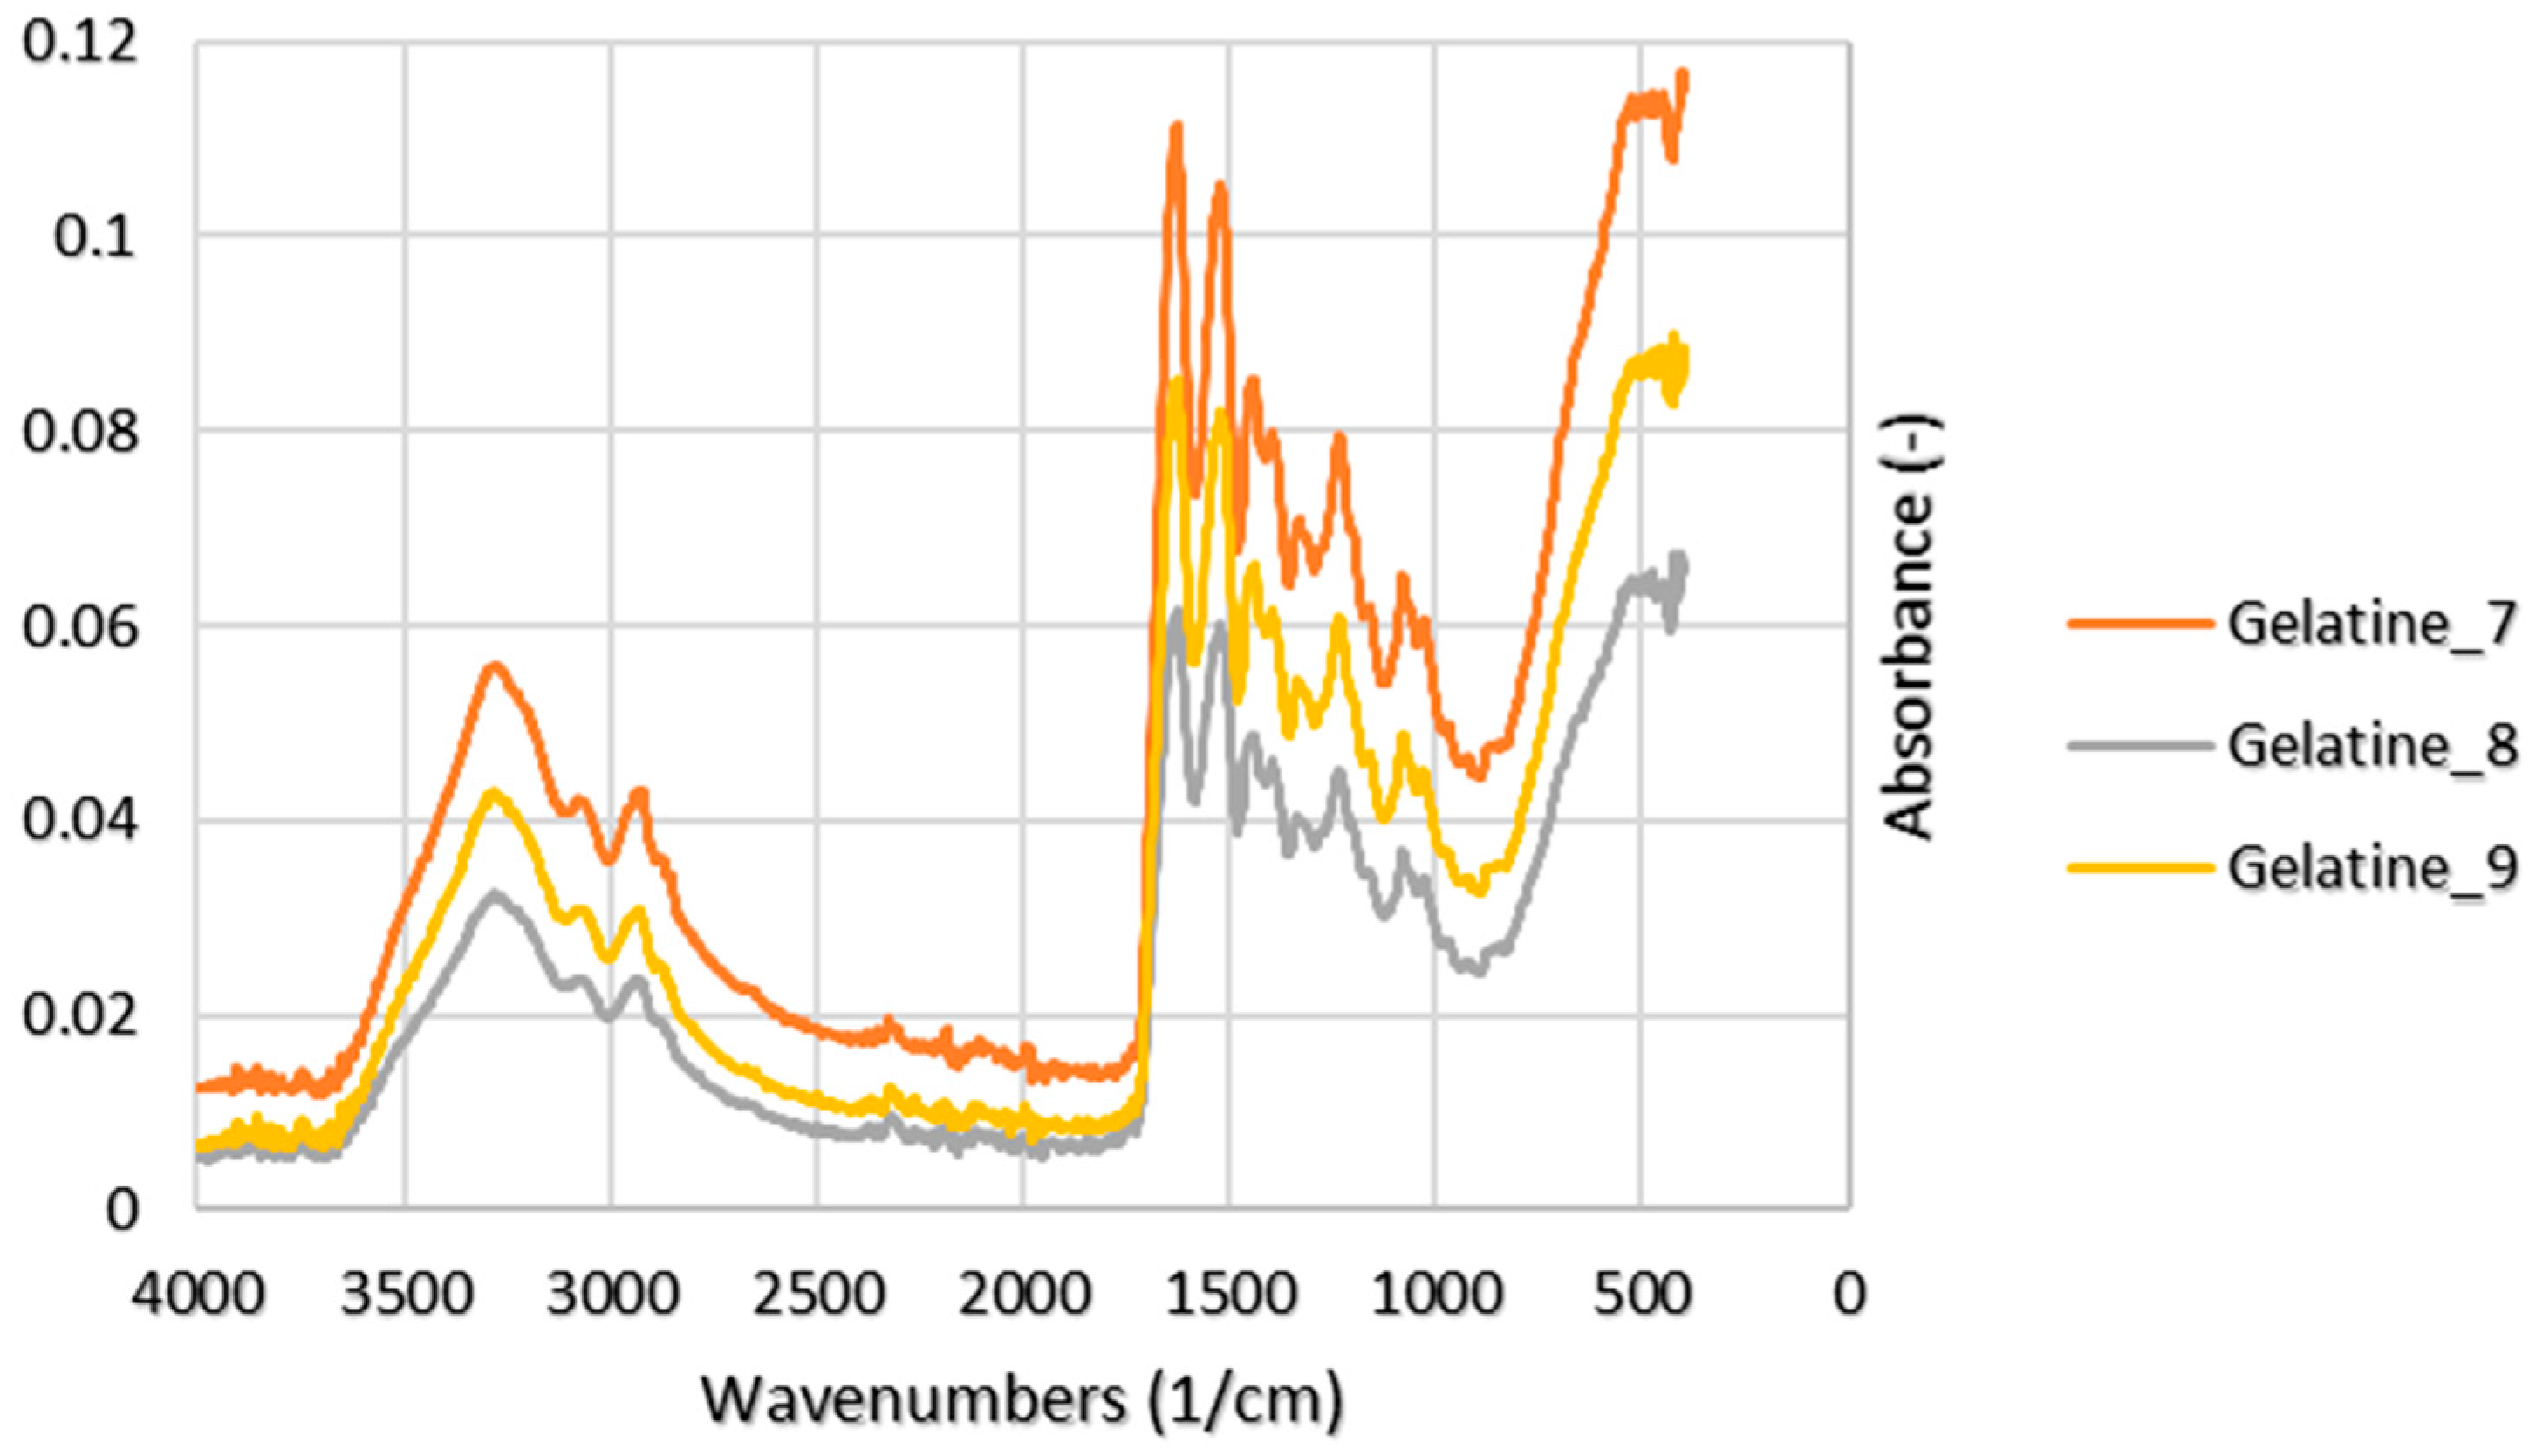

Table 1.
Values of scavenged free radicals for DPPH/ABTS in gelatin solutions at concentrations of 2, 4, 6, 8, and 10 mg/ml.
Table 1.
Values of scavenged free radicals for DPPH/ABTS in gelatin solutions at concentrations of 2, 4, 6, 8, and 10 mg/ml.
| Exp. No. |
DPPH (%) | ABTS (%) | ||||||||
|---|---|---|---|---|---|---|---|---|---|---|
| Gelatins concentration (mg/ml) | ||||||||||
| 2 | 4 | 6 | 8 | 10 | 2 | 4 | 6 | 8 | 10 | |
| 1 | 72 ± 1 | 76 ± 1 | 82 ± 1 | 85 ± 2 | 87 ± 2 | 84 ± 2 | 87 ± 2 | 91 ± 2 | 93 ± 1 | 97 ± 1 |
| 2 | 71 ± 1 | 72 ± 2 | 80 ± 1 | 82 ± 1 | 87 ± 1 | 83 ± 2 | 85 ± 1 | 88 ± 2 | 93 ± 1 | 94 ± 1 |
| 3 | 71 ± 2 | 76 ± 2 | 82 ± 1 | 82 ± 2 | 86 ± 1 | 80 ± 1 | 85 ± 1 | 88 ± 1 | 93 ± 2 | 95 ± 1 |
| 4 | 72 ± 2 | 77 ± 2 | 82 ± 1 | 85 ± 2 | 87 ± 1 | 84 ± 1 | 88 ± 2 | 91 ± 1 | 93 ± 2 | 96 ± 1 |
| 5 | 69 ± 1 | 76 ± 1 | 77 ± 2 | 82 ± 1 | 85 ± 1 | 80 ± 2 | 87 ± 2 | 90 ± 2 | 91 ± 1 | 96 ± 1 |
| 6 | 69 ± 1 | 74 ± 1 | 78 ± 1 | 84 ± 1 | 87 ± 2 | 82 ± 1 | 84 ± 2 | 91 ± 1 | 90 ± 1 | 95 ± 1 |
| 7 | 71 ± 1 | 77 ± 1 | 82 ± 2 | 84 ± 1 | 87 ± 1 | 84 ± 2 | 88 ± 1 | 90 ± 1 | 93 ± 2 | 95 ± 1 |
| 8 | 72 ± 1 | 76 ± 2 | 79 ± 2 | 84 ± 1 | 87 ± 2 | 82 ± 1 | 88 ± 2 | 90 ± 2 | 93 ± 1 | 95 ± 2 |
| 9 | 70 ± 1 | 74 ± 2 | 77 ± 1 | 84 ± 1 | 87 ± 2 | 80 ± 1 | 86 ± 1 | 88 ± 1 | 92 ± 1 | 94 ± 1 |
| ±SD | 71 ± 1 | 75 ± 2 | 80 ± 1 | 84 ± 1 | 87 ± 1 | 82 ± 1 | 86 ± 2 | 90 ± 1 | 92 ± 1 | 95 ± 1 |
Table 2.
Molecular weight values for individual gelatin samples, including PDI.
| Exp. No. | Mp 1 (kDa) | Mw 2 (kDa) | Mn 3 (kDa) | PDI (–) |
|---|---|---|---|---|
| 1 | 18.4 | 24.5 | 5.6 | 4.4 |
| 2 | 41.0 | 65.1 | 8.3 | 7.9 |
| 3 | 44.1 | 94.9 | 8.6 | 11.1 |
| 4 | 18.8 | 30.5 | 6.0 | 5.1 |
| 5 | 19.2 | 57.3 | 6.4 | 9.0 |
| 6 | 57.5 | 105.1 | 9.6 | 11.0 |
| 7 | 17.5 | 24.4 | 5.3 | 4.6 |
| 8 | 18.7 | 45.8 | 7.0 | 6.5 |
| 9 | 38.7 | 74.0 | 8.3 | 8.9 |
1 Molecular weight of the peak maxima. 2 Weight–average molecular weight. 3 Number–average molecular weight.
Table 3.
Values of molecular weights (%) typical for α, β, γ-chains of gelatin samples.
| Exp. No. | ML 1 (%) | Mα 2 (%) | Mβ 3 (%) | Mγ 4 (%) | MH 5 (%) |
|---|---|---|---|---|---|
| 1 | 76.2 | 11.7 | 8.3 | 3.8 | 0.0 |
| 2 | 64.7 | 10.1 | 8.2 | 6.1 | 10.9 |
| 3 | 60.3 | 9.3 | 6.7 | 6.7 | 17.0 |
| 4 | 67.8 | 9.5 | 7.4 | 8.4 | 6.9 |
| 5 | 62.2 | 9.6 | 7.9 | 6.9 | 13.4 |
| 6 | 59.9 | 9.3 | 6.5 | 7.4 | 16.9 |
| 7 | 64.6 | 10.4 | 7.0 | 7.9 | 10.1 |
| 8 | 63.4 | 9.5 | 7.5 | 6.7 | 12.9 |
| 9 | 58.3 | 10.4 | 7.9 | 6.5 | 16.9 |
| ±SD | 65.0±5.0 | 10.0±1.0 | 7.0±1.0 | 7.0±1.0 | 12.0±6.0 |
1 ML represents the values of molecular weights 0–80 kDa. 2 Mα represents the values of molecular weights 80–160 kDa, typical predominantly for α-chains. 3 Mβ represents the values of molecular weights 160–250 kDa, typical for β-chains. 4 Mγ represents the values of molecular weights 250–375 kDa, typical for γ-chains. 5 MH represents the values of molecular weights >375 kDa.
Table 4.
Results of FTIR peak regions for gelatins no. 1, 2 and 3, including characteristic peak regions for gelatins.
Table 4.
Results of FTIR peak regions for gelatins no. 1, 2 and 3, including characteristic peak regions for gelatins.
| Exp. No. | Peak | Wavenumbers (1/cm) | Reference (1/cm)1 | Note |
|---|---|---|---|---|
| 1 | 3282 | 3440–3300 | N–H stretching | |
| 2 | Amide A | 3275 | ||
| 3 | 3290 | |||
| 1 | 2937 | 3080–2899 | CH2 asymmetrical stretch | |
| 2 | Amide B | 2933 | ||
| 3 | 2927 | |||
| 1 | 1640 | 1700–1600 | C=O stretching | |
| 2 | Amide I | 1644 | ||
| 3 | 1639 | |||
| 1 | 1515 | 1580–1500 | N–H bending | |
| 2 | Amide II | 1517 | ||
| 3 | 1510 | |||
| 1 | 1241 | 1350–1200 | N–H bending and C–N stretching | |
| 2 | Amide III | 1240 | ||
| 3 | 1238 |
Table 5.
Results of FTIR peak regions for gelatins No. 4, 5, and 6, including characteristic peak regions for gelatins.
Table 5.
Results of FTIR peak regions for gelatins No. 4, 5, and 6, including characteristic peak regions for gelatins.
| Exp. No. | Peak | Wavenumbers (1/cm) | Reference (1/cm)1 | Note |
|---|---|---|---|---|
| 4 | 3289 | 3440–3300 | N–H stretching | |
| 5 | Amide A | 3272 | ||
| 6 | 3277 | |||
| 4 | 2938 | 3080–2899 | CH2 asymmetrical stretch | |
| 5 | Amide B | 2932 | ||
| 6 | 2929 | |||
| 4 | 1636 | 1700–1600 | C=O stretching | |
| 5 | Amide I | 1643 | ||
| 6 | 1637 | |||
| 4 | 1515 | 1580–1500 | N–H bending | |
| 5 | Amide II | 1522 | ||
| 6 | 1517 | |||
| 4 | 1236 | 1350–1200 | N–H bending and C–N stretching | |
| 5 | Amide III | 1240 | ||
| 6 | 1238 |
Table 6.
Results of FTIR peak regions for gelatins No. 7, 8 and 9, including characteristic peak regions for gelatins.
Table 6.
Results of FTIR peak regions for gelatins No. 7, 8 and 9, including characteristic peak regions for gelatins.
| Exp. No. | Peak | Wavenumbers (1/cm) | Reference (1/cm) 1 | Note |
|---|---|---|---|---|
| 7 | 3276 | 3440–3300 | N–H stretching | |
| 8 | Amide A | 3286 | ||
| 9 | 3290 | |||
| 7 | 2936 | 3080–2899 | CH2 asymmetrical stretch | |
| 8 | Amide B | 2934 | ||
| 9 | 2925 | |||
| 7 | 1641 | 1700–1600 | C=O stretching | |
| 8 | Amide I | 1645 | ||
| 9 | 1644 | |||
| 7 | 1519 | 1580–1500 | N–H bending | |
| 8 | Amide II | 1525 | ||
| 9 | 1525 | |||
| 7 | 1245 | 1350–1200 | N–H bending and C–N stretching | |
| 8 | Amide III | 1242 | ||
| 9 | 1235 |
Table 7.
Detected microorganisms in gelatin samples including the score value for the microorganism.
Table 7.
Detected microorganisms in gelatin samples including the score value for the microorganism.
| Exp. No. | Organism | Score value | Exp. No. | Organism | Score value |
|---|---|---|---|---|---|
| 1 |
Brevibacillus agri Bacillus cereus |
1997 3 1755 3 |
6 | - | - |
| 2 |
Bacillus cereus Bacillus flexus Brevibacillus agri |
2265 2 2093 2 1995 3 |
7 |
Bacillus cereus Acinetobacter radioresistens |
2239 2 1758 3 |
| 3 |
Acinetobacter radioresistens Acinetobacter baumannii |
2431 1 2004 2 |
8 | Acinetobacter baumannii | 2359 1 |
| 4 |
Enterococcus faecium Bacillus flexus Brevibacillus agri |
2065 2 1835 3 1708 3 |
9 |
Acinetobacter baumannii Brevibacillus agri |
2121 2 2012 2 |
| 5 |
Acinetobacter baumannii Staphylococcus hominis Bacillus cereus |
2071 2 1801 3 2106 2 |
|||
1 Highly probable species identification (2300–3000). 2 Secure genus identification, probable species identification (2000–2299). 3 Probable genus identification (1700–1999).
Table 8.
Gelatin samples with the technological conditions of the extraction process [32].
Table 8.
Gelatin samples with the technological conditions of the extraction process [32].
| Exp. | Factor A | Factor B | Exp. | Factor A | Factor B |
|---|---|---|---|---|---|
| No. | Enzyme (%) | Temperature (°C) | No. | Enzyme (%) | Temperature (°C) |
| 1 | 0.10 | 55.0 | 6 | 0.15 | 70.0 |
| 2 | 0.10 | 62.5 | 7 | 0.20 | 55.0 |
| 3 | 0.10 | 70.0 | 8 | 0.20 | 62.5 |
| 4 | 0.15 | 55.0 | 9 | 0.20 | 70.0 |
| 5 | 0.15 | 62.5 |
Table 9.
Types of molecular weights and PDIs determined by GPC–RID analysis.
| Molecular weight species | Unit | Note |
|---|---|---|
| Mp | kDa | Molecular weight of the peak maxima |
| Mw | kDa | Number-average molecular weight |
| Mn | kDa | Weight-average molecular weight |
| PDI | – | Polydispersity index |
Table 10.
Characteristic FTIR peak vibrational regions for powdered gelatins.
| Peak | Reference (1/cm)1 | Note |
|---|---|---|
| Amide A | 3440–3300 | N–H stretching |
| Amide B | 3080–2899 | CH2 asymmetrical stretch |
| Amide I | 1700–1600 | C=O stretching |
| Amide II | 1580–1500 | N–H bending |
| Amide III | 1350–1200 | N–H bending and C–N stretching |
Table 11.
Identification criteria for gelatine samples [18].
Table 11.
Identification criteria for gelatine samples [18].
| Score | Note |
|---|---|
| 2300–3000 | Highly probable species identification |
| 2000–2299 | Secure genus identification, probable species identification |
| 1700–1999 | Probable genus identification |
| <1700 | Not reliable identification |
Disclaimer/Publisher’s Note: The statements, opinions and data contained in all publications are solely those of the individual author(s) and contributor(s) and not of MDPI and/or the editor(s). MDPI and/or the editor(s) disclaim responsibility for any injury to people or property resulting from any ideas, methods, instructions or products referred to in the content. |
© 2023 by the authors. Licensee MDPI, Basel, Switzerland. This article is an open access article distributed under the terms and conditions of the Creative Commons Attribution (CC BY) license (http://creativecommons.org/licenses/by/4.0/).
Copyright: This open access article is published under a Creative Commons CC BY 4.0 license, which permit the free download, distribution, and reuse, provided that the author and preprint are cited in any reuse.


