Submitted:
27 November 2023
Posted:
29 November 2023
You are already at the latest version
Abstract
Background: Sungkai plant (Peronema canescens Jack.) is one of the medicinal plants widely grown in Indonesia. In recent years, Sungkai (Peronema canescens Jack) leaves have sparked particular interest for their health benefits. In this study, microencapsulation was conducted on an ethanol extract of Sungkai leaves (Peronema canescens Jack.) using three types of coating materials (maltodextrin, inulin, and Arabic gum) at various concentrations. Objectives: to determine the best microencapsulation formulation using maltodextrin, inulin, and Arabic gum at various concentrations. Methods: Microencapsulation was performed using the extrusion method. Characterization of the best microencapsulant was done by measuring physico-chemical, morphological, and IR properties, and antioxidant activity testing was done using the 2,2-diphenyl-1-picrylhydrazyl (DPPH) method. Results: Microencapsulant A1 has better physico-chemical properties compared to other microencapsulant samples. The results of the morphological analysis of sample A1 using SEM showed a smooth surface with a slightly round shape, as well as minimal wall folds and cracks, indicating that the product has good stability. The results of the functional group analysis of sample A1 using FTIR also showed that the ethanol extract of Sungkai leaves was well encapsulated. Conclusions: The best formulation to make microencapsulant of ethanol extract of Sungkai leaves is formulation A1 using Arabic gum dressing material.
Keywords:
Peronema canescens Jack
; Microencapsulation
; Maltodextrin
; Arabic gum
; Inulin
1. Introduction
One of the medicinal plants that grows in Indonesia is the Sungkai plant (Peronema canescens Jack). Peronema canescens Jack (P. canescens) in Jambi Province is ethnobotanically used for various therapies such as antidemam, antioxidan, and immunostimulant [1]. This plant is traditionally used by the community in medicine or health care, such as bruising medicine, fever medicine, cold medicine, worming medicine, and mouthwash [2]. P. canescens contains bioactive compounds that play as antidiaberics [3], antihyperurisemia [4], anti-inflammatory [5], potential anticancer [6], and immunostimulant [7]. Other studies mention that P. canescens has potential bioactivity as an antibacterial and antioxidant. This potential is related to the content of secondary metabolite compounds possessed by P. canescens plants, such as alkaloids, terpenoids, phenolics, flavonoids, tannins, and saponins [5].
However, bioactive compounds in extracts that are still in liquid form have several disadvantages, such as a high organoleptic impact due to the bitter and sour taste of some compounds, low solubility, a tendency to oxidize, and a limited shelf life, reducing the utilization of bioactive compounds [8]. Therefore, some kind of processing or delivering system as an alternative is needed that can overcome this problem, to ensure their effectiveness and target function. Encapsulation is an effective method that improves the phytochemical stability by entrapping the core material with the coating agent [9].
Albeit, he application of encapsulation technology continues to experience developments, such as nanoencapsulation and microencapsulation. Microencapsulation is one of the methods used to protect active substances, improve their physico-chemical properties, and protect them from unpleasant flavors and aromas or adverse environmental conditions [10]. The extrusion method is one of the most popular and simple methods in microencapsulation technology. The advantages of this method compared to other methods are that it is easy to perform, does not require high temperatures, has gentle formulation conditions that ensure higher cell viability, does not use harmful solvents, and can be performed under aerobic and anaerobic conditions [11].
Biopolymers are oftentimes as coating materials for microencapsulation of various bioactive compounds because they have attractive physico-chemical properties [12]. The selection of a coating material that can avoid compositional changes due to damage to the bioactive compounds in the extract is a crucial point for the success of the microencapsulation process [13]. Coating materials such as inulin, maltodextrin, and Arabic gum are recognized as safe and have been used for the stability of bioactive compounds [14]. Maltodextrin is a polysaccharide class compound consisting of β-D-glucose units obtained by acid or enzyme hydrolysis of some starches (corn, rice, potato, starch, or wheat). Maltodextrin has high solubility in water, has a neutral taste, is colorless, has low viscosity, and is easily obtained [15]. Inulin is a polymer of fructose units linked by a terminal glucose unit at the end of the chain. Inulin has activity as an anticytotoxic and immunomodulator. In addition, inulin also behaves as a prebiotic and stimulates the activity of beneficial microflora in the colon. Since its release only occurs in the gut, inulin can be used to protect bioactive compounds in extracts that are susceptible to degradation along the human digestive tract [15,16,17]. Arabic gum is a complex heteropolysaccharide composed of D-glucuronic acid, L-rhamnose, D-galactose, and L-arabinose, including about 2% protein. Arabic gum is often used as a dressing in microencapsulation technology because it has good emulsification properties, high solubility, and low viscosity in aqueous solutions. In addition, it provides good retention of volatile substances and effective protection against oxidation [15]. These three biopolymers were chosen to be used as coating materials in this microencapsulation study of an ethanol extract of P. canescens leaves extract due to their functional properties. The purpose of this study was to determine the best microencapsulation formulation using maltodextrin, inulin, and Arabic gum
2. Results
2.1. Phytochemical Screening
The ethanol extract of Sungkai leaves is known to be positive for flavonoids, steroids, tannins, phenolics, saponins, and alkaloids based on the findings of phytochemical screening (Table 1). The results of previous studies also reported positive results for the same group of compounds [18]. The total phenolic content was determined in this study using the Folin-Ciocalteau method with gallic acid solution as the standard. The total phenolic content can be determined from the linear regression equation obtained from the gallic acid standard calibration curve, which can be seen in Figure 1.
The connection between absorbance and gallic acid standard solution concentration (mg/L) is depicted in Figure 1. For the typical solution of gallic acid, the linear regression equation is y = 0,0047x + 0,000322 with R2 = 0.998. To calculate the total phenolic content of Sungkai leaf extract, use this equation. The total phenolic content of the ethanol extract of Sungkai leaves is calculated to be 71,828 mg GAE/g extract based on the data. The determination of total phenolic content aims to see the correlation between antioxidant activity and total phenolic content. By giving one electron from a free radical's unpaired electron so that there are fewer free radicals, polyphenolic substances are known to be able to suppress autooxidation through a radical capture process.
LC-MS/MS test was carried out on the crude extract of sungkai leaves from ethanol solvent. Liquid Chromatography Mass Spectrometry (LC/MS-MS) is an analytical technique that combines the physical sepa-ration capabilities of liquid chromatography with the detection specificity of mass spectrometry. Liquid chromatography separates the components of the sample, and then the charged ions are detected by a mass spec-trometer. LC-MS data can be used to provide information about the mo-lecular weight, structure, identity, and quantity of specific sample com-ponents. Compounds are separated on the basis of relative interactions with the chemical layer of the particles (stationary phase) and solvent elution through the column (mobile phase). The results of LC/MS-MS data analysis will produce a chromatogram in the form of a peak height plot, and the molecular weight of the compounds contained in the extract will be obtained so that you can know the number of compounds contained in each sample. From Table 2, there are 15 active compounds are found in sungkai leaf extract. The 15 compounds obtained will then be screened using the SWISSADME web-server (http://www.swissadme.ch/)
2.2. Microencapsulation yield
One of the quantity metrics used to gauge a microencapsulation process' efficiency and effectiveness is yield. The per cent yield value of P. canescens leaves ethanol extract microcapsules can be seen in Table 2. The highest yield value of P. canescens leaves ethanol extract microencapsulant was obtained in sample A1 at 94.625 ± 0.625%, while the lowest yield was obtained in sample M3 at 89.325 ± 0.650%. The difference in yield is influenced by the water content of a food ingredient. The smaller the water content, the smaller the weight of water contained in the material. If water is removed, the material will be more compact and lighter, thus affecting the yield of the final product [19]. In addition, the amount of extract that is successfully coated also greatly affects the yield value of microencapsulated products. The greater the amount of extract that is successfully coated, the greater the per cent value of product yield [20].
2.3. Water Solubity of Microencapsulantsi
The product's water solubility impacts the release of active compounds after applying microencapsulants. A good microencapsulant is expected to have a high aqueous solubility value. The data for the microencapsulants of an ethanol extract of sungkai leaves in water are shown in Table 4 as a per cent solubility. According to Table 3, sample A1 with Arabic gum dressing material had a maximum microencapsulate solubility per cent in water of 98.95%, whereas sample M1 with maltodextrin dressing material had a maximum of 99.38%. This outcome aligns with previous research findings: micro encapsulants with maltodextrin as a dressing material are more soluble in water compared to microencapsulated prepared using Arabic gum and inulin as dressing materials [16].
The solubility of microencapsulants decreased with each rise in carboxymethylcellulose (CMC) content, according to research on variations in CMC concentration. The increase in CMC content raises the viscosity, which slows down the drying process and raises the water content. Due to the high water content of the microencapsulant, it is challenging to disseminate the material in water since it has a propensity to cling together, preventing the formation of pores. The microencapsulant is unable to absorb a lot of water as a result. Additionally, because the granules are big and adhere to one another between the granules, materials with a high water content have a limited surface that can be wetted [21].
2.4. Stability of Microencapsulants
The stability test was conducted on extracts that had not been encapsulated and those that had been encapsulated with various coatings. Figure 2 displays the outcomes of the stability test on P. canescens leaf extract. From Figure 2, it can be seen that the ethanol extract that has not been microencapsulated has a percentage of total phenolic content reduction of 2.695% every unit of time. The percentage of decrease in total phenolic content can be seen from the slope of the regression equation, which is 2.695. The negative sign indicates a decrease in phenolic content. These results also show that each increase in the number of heating days will cause a decrease in total phenolics of 2.695% in P. canescens extract. These results indicate that phenolic compounds in the ethanol extract that are not microencapsulated have poor stability when heated. Storage of samples in an oven at 600C can reduce the levels of phenolic compounds in the material because bioactive compounds such as phenolics can be damaged at temperatures above 500C.
Figure 2 demonstrates that the ethanol extract of P. canescens leaves that has been encapsulated has higher phenolic stability than the extract that has not been encapsulated. The findings of this study are consistent with those of previous studies, who found that microencapsulating extract can both increase its shelf life and safeguard its active ingredients [22,23,24].
2.5. Microencapsulation Efficiency
The encapsulation efficiency is shown in Table 4. The greater the value of microencapsulation efficiency, the lower the loss of compounds during the storage process. The effectiveness of microencapsulation depends on various factors, such as polymer concentration and solubility and the solvent evaporation rate during the microencapsulation process. The largest microencapsulation efficiency value of P. canescens leaves ethanol extract was obtained in the A1 microencapsulant sample, which amounted to 80,09 ± 0,105%. At the same time, the lowest microencapsulation efficiency value was obtained in A3 and M3 microencapsulant samples, which amounted to 63.50% (Table 4). The test data also showed that increasing CMC concentrations caused a decrease in microencapsulation efficiency.
The type of dressing material greatly affects the encapsulation efficiency. Arabic gum is a dressing material because it has good emulsifying properties and can form a coating due to its protein content [25]. Arabic gum is a better dressing material than maltodextrin in the encapsulation process of Cocoa pod extract (Theobroma cacao L.). This is because maltodextrin has a very low emulsifier and layer-forming ability, which can lead to a lack of microencapsulation efficiency [23].
2.6. Morphology of Microencapsulant
Using SEM (Scanning Electron Microscopy), the morphological structure of the best microencapsulant products from each Arabic gum, inulin, and maltodextrin dressing material can be observed at 2500 and 5000 magnification variations. Figure 3 displays a picture of the microencapsulant's morphological structure.
Using maltodextrin (M1) and inulin (I1) dressing materials during the microencapsulation process resulted in particles of various sizes, an irregular surface structure, and deep depressions in the walls. A better microencapsulant surface structure was obtained using Arabic gum (A1) as a dressing material. This result allows the microencapsulated with Arabic gum dressing material to have better stability. Microencapsulants should have a homogeneous and smooth surface with a slightly rounded shape with minimal folds and wall cracks [17]. Microencapsulants with rough surfaces are more sensitive to oxidation reactions than those with smooth surfaces [17]. This result is supported by the data from the microencapsulant stability test results, which show that A1 microencapsulant has better stability compared to I1 and M1 microencapsulants.
2.7. IR – Microencapsulant Spectrum
Fourier-Transform Infra Red (FTIR) analysis was used to identify the functional groups in secondary metabolite compounds from ethanol extracts, coatings, and microencapsulant products. The wavelengths used in this study ranged from 4000 to 500 cm-1. The results of the FTIR characteristics of sungkai leaf ethanol extract, coatings, and microencapsulant products can be seen in Figure 4. The results of the interpretation of the functional groups of the microencapsulant, the ethanol extract, and the of the coating material are shown in Table 5.
The results of the FTIR spectra analysis in Table 5 indicate that the peaks appearing at wavelengths 2850–2970 and 1340–1470 cm-1 are likely to indicate the presence of C-H Alkane functional groups. At wavelengths of 675–995 cm-1, a peak appears, which is likely to indicate the presence of the C-H Alkene functional group. Peaks at wavelengths of 690–900 cm-1 are likely to indicate the presence of C-H functional groups in aromatic rings, which usually appear at wavelengths of 3010–3100 and 690–900 cm-1. Peaks at wavelengths of 3200–3600 cm-1 indicate the presence of hydrogen-bonded O-H alcohol/phenol functional groups, which usually appear at these wavelengths. Peaks at wavelengths of 2500–2700 cm-1 may indicate the presence of O-H functional groups in carboxylic acid monomers or hydrogen bonds in carboxylic acids. A peak appears at wavelengths of 3300–3500 cm-1 which may indicate the presence of N-H amine or amide functional groups [26,27].
Peaks appear at wavelengths of 1610–1680 cm-1 which may indicate the presence of C=C alkene functional groups. Peaks appear at wavelengths of 1180–1360 cm-1 which may indicate the presence of C-N amine or amide functional groups that usually appear at these wavelengths. Peaks appear at wavelengths of 1050–1300 cm-1 which may indicate the presence of C-O alkokol, ether, carboxylic acid, or ester functional groups. The peak that appears at a wavelength of 1690–1760 cm-1 is likely to indicate the presence of the C=O aldehyde, ketone, carboxylic acid, or ester functional group. And the peak that appears at a wavelength of 1370 cm-1 is likely to indicate the presence of the NO2 functional group of nitro compounds that usually appear at a wavelength of 1300–1370 cm-1.
The C≡C alkyne functional group, which is formed from tween-80 and glutaraldehyde, is absorbed in the form of a broad peak with variable strength in the area of 2106 and 2158 cm-1 in the encapsulated ethanol extract of sungkai leaves [28]. The ethanol extract of sungkai leaves has been perfectly encapsulated or physically trapped in the tween-80-glutaraldehyde complex, according to the interpretation of the spectra shown in Table 5, so that the functional groups present in the extract are also present in the microencapsulant product.
2.8. Antioxidant activities
An antioxidant activity test was conducted on three microencapsulants with the best physico-chemical characteristics using the DPPH method spectrophotometrically to determine the antioxidant activity based on the IC50 value obtained from measuring the absorbance value. According to Table 6, ascorbic acid, used as a positive control, had an IC50 value of 5.695 (mg/L), meaning that 5.695 (mg/L) of ascorbic acid is needed to reduce the concentration of DPPH by 50%. According to this number, ascorbic acid has highly potent antioxidant activity. Strong group IC50 is between 50 and 100 mg/L, medium group IC50 is between 101 and 150 mg/L, and weak group IC50 is between 150 and 200 mg/L. A chemical is stated to have extremely strong antioxidant activity if the IC50 value is less than 50 mg/L [29].
3. Discussion
The encapsulation is known as one of the most widely used techniques to protect bioactive compounds from various environmental factors and even helps to increase the efficiency of drug delivery systems effectively [30], moisture, and light; hence, it can extend the shelf life of the product and avoid damage [24,30]. The process of forming encapsulation methods on the scale of microparticles proved to be more effective and efficient, especially in drug doses and the reaction speed in reaching the target cell. One of the factors that influence encapsulation technology is the type and ratio of coating material, concentration and structure of the active substances, emulsion properties, and drying process variables, which are important factors to be considered in the encapsulated powder's physical and chemical properties [31].
Arabic gum belongs to a protein coating material that has good layer-forming, binding, and emulsifying properties that boost yield [32]. Maltodextrin has a low surface activity, which leads to a subpar microencapsulation procedure [33]. Treatment of variations in a carboxymethylcellulose (CMC) concentration showed a decrease in per cent yield with each increase in CMC concentration. The increase in CMC content causes the diffusivity of water (the ability of water to move) to decrease so that the efficiency of extract coating decreases.
Treatment of the type of coating material showed that the encapsulation efficiency with gum arabic coating material was greater than that of maltodextrin, even inulin coating material. The type of coating material greatly influences the efficiency of the encapsulation process. Gum arabic is a coating material because it has good emulsifying properties and can form a layer/film [34]. The good emulsifying properties of gum arabic are due to its protein content. Gum arabic is a better coating material than maltodextrin in the microencapsulation process of cardamom oleoresin [35].
A1 with Arabic gum dressing material had a maximum microencapsulant solubility percent in water of 98.95%, whereas sample M1 with maltodextrin dressing material had a maximum of 99.38%. According to previous studies, the higher the maltodextrin concentration, the higher the solubility value [36]. This happens because maltodextrin has the property of being able to bind hydrophobic substances. Besides, maltodextrin is a polysaccharide soluble in water to form a uniformly dispersed solution. The hydroxyl groups in maltodextrin will interact with water when the material is dissolved. The added maltodextrin can bind water in the material and maintain the water content so that a large amount of maltodextrin added will affect the yield. The increase in yield, along with the proportion of maltodextrin, indicates that maltodextrin has a better ability to coat extracts, in this case, the ability to form emulsions, film formation, and flexibility in coating extracts [27,37,38].A1 microencapsulant has the highest stability and a percentage decrease in total phenolic content ranging from 0.1773% to 0.1773% per time unit, is known from this investigation. When compared to other microencapsulants, microencapsulant A1 is the most effective at protecting phenolic chemicals. This is because microencapsulants with good oxidation protection are created when 90% Arabic gum and 10% CMC are combined. Previous studies claimed that by raising viscosity, thickening agents can improve the stability of the coating substance. However, if thickening agents are added in excess, the extract will not be adequately covered, allowing for fast destruction due to inadequate protection [23].
The FTIR spectrum shows a wide absorption band at wave numbers 3200-3600 cm-1 which indicates a loosening of the O-H (hydroxyl) and wave numbers at 2850-2970 and 1340-14700 cm-1 indicate stretching the C-H bond. The encapsulation formulation and the coating material have almost the same spectrum, the peak appearing at a wavelength of 675-995 cm-1, which indicates the presence of the C-H Alkene functional group, which usually appears at a wavelength of 675-995 cm-1. The FT-IR spectra of Tween-80 showed a major band of C-H at 675-995 cm-1, and the transmittance value decreased in the encapsulation results. Meanwhile, the major band in maltodextrin at 1050-1300 cm-1 C-O stretching, the same band appears in all encapsulates; this is the same as previous research [39]. Theoretically, the occurrence of a cross-linking reaction between Ca2+ and maltodextrin affects the intensity of the asymmetry, and symmetry COO- stretching was observed at 1594 cm-1, and a weak symmetric peak was presented at 1400–1500cm-1 Also a peak appearing at a wavelength of 1733 cm-1 indicates the presence of the C=O Aldehid/ketone/carboxylic acid/ester functional group, which usually appears at a wavelength of 1690-1760 cm-1. The results of the comparison of the FT-IR spectra between the coating and the encapsulation results show that an encapsulation is formed, and it can be seen that all the spectra present in the encapsulation material appear on the encapsulation.
It is shown that antioxidant test results of an ethanol extract of P. canescens leaves that have been microencapsulated have IC50 values ranging from 121.176–139.503 mg/L. Microencapsulant A1 has the highest IC50 value compared to other microencapsulants. The antioxidant activity test results of each microcapsulant can be attributed to the amount of secondary metabolite compound content in the extract. Based on Table 6, it is known that A1 microencapsulant encapsulates more phenolic compounds contained in the extract. Antioxidant activity is influenced by total phenolic, which is a compound that can donate many hydrogen atoms to neutralize DPPH radicals.
Maltodextrin is stable against oxidising compounds but has poor emulsification capacity and stability and low oil retention. Maltodextrin can also reduce viscosity and has the property to prevent oxidation so that the antioxidants will be well enveloped [22,40]. The concentration of the dressing also plays an important role in the encapsulation process. Too high amount of dressing makes the emulsion dense, which makes the atomisation process difficult. The too-high dressing also causes puffing or ballooning and particle cracking. At a certain concentration of maltodextrin addition, the antioxidant quality and the ability to capture free radicals will be better [41].
The treatment of dressing type showed that gum arabic had greater antioxidant activity than maltodextrin. The use of maltodextrin dressing has high oxidation resistance properties. It can reduce the viscosity of the emulsion combined with other dressings with better emulsifying properties that cause antioxidants in the encapsulate to be enveloped and well protected [42].
Gum arabic binder has better emulsifying properties than maltodextrin. Antioxidant activity is also influenced by the properties of gum arabic binder, which can form texture, form film, bind and emulsify well so that gum arabic can maintain the core material of the product because the gum arabic binder can form a layer that can protect the core material from the process of destructive changes [12,43,44]. The antioxidant activity of the encapsulate is related to the total phenol content. A high total phenol content of the encapsulate will result in high antioxidant activity as well. Hence, the ability of the antioxidant to donate electrons in terms of suppressing the development of free radicals is also higher. Protection using the encapsulation process can prevent degradation due to light or oxygen radiation and slow evaporation, then will minimise the loss of antioxidants due to oxidation [45]
4. Materials and Methods
4.1. Chemicals
The main material used in this study was Sungkai leaves (Peronema canescens Jack.) obtained from Pamuatan Village, Kupitan District, Sijunjung Regency, West Sumatra Province, Indonesia. Other materials used were FeCl3, 2N sulfuric acid, Dragendorff reagent, Lieberman-Burchard reagent, HCl, Mg powder, HCl, tween-80, distilled water, maltodextrin (Lihua Starch), CMC (Sigma), Inulin (Pep'D), Arabic gum (Orlife), CaCl2 (Pudak Scientific), Glutaraldehyde (Sigma-Aldrich), Gallic acid (Sigma), Folin-Ciocalteu reagent, Na2CO3 (Emsure®), Ascorbic acid (Emsure®), methanol p. a (Emsure®), DPPH (Sigma-Aldrich), The equipment used in this research is glassware (Pyrex®), Fourier-Transform infrared spectroscopy (Alpha II-Bruker), a UV-Vis spectrophotometer (Thermo-Fischer), and a SEM-EDX JEOL JSM-6510LA.
4.2. Preparation and Extraction
Sungkai leaves are selected in good condition, wet sorted, then washed to separate the test material from dirt, and dried for 7 days [46]. Furthermore, the simplisia was pulverized using a grinder and obtained 2,500g of simplisia powder, and the yield obtained was 10%. The extraction process of P. canescens leaves was carried out by maceration using 96% ethanol solvent at 37°C to prevent damage to compounds contained in Sungkai leaves, such as phenolics. The process of separating extracts and solvents is carried out using a vacuum rotary evaporator at temperatures below the boiling point of the solvent to minimize damage to bioactive compounds due to high temperatures [47]. The ethanol extract of Sungkai leaves obtained from Sungkai leaves was 303 g, and the yield obtained was 12,12%. The crude extract of sungkai leaves from ethanol solvent was analyzed using LC/MS-MS. The results of the LC/MS-MS data analysis obtained a chromatogram in the form of a peak height plot, and the molecular weight of the compounds contained in the extract can be obtained so that you can know the number of compounds contained in each sample.
4.3. Phytochemical and Total Phenolics
Phytochemical screening was carried out to qualitatively test the compounds contained in the ethanol extract of Sungkai leaves, such as flavonoids, tannins, alkaloids, saponins, steroids, and phenolic compounds, following the procedures of previous studies [48]. A gallic acid standard solution was made by dissolving 10 mg of gallic acid in a 10 mL volumetric flask using methanol solvent, thus obtaining a concentration of 1000 mg/L in the mother solution. Then the 1000mg/L mother liquor was diluted into several concentrations, namely 20; 40; 60; 80; and 100 mg/L. Determination of total phenolic content by the Folin-Ciocalteu method A total of 0.5 mL of sample (standard solution and test solution) was put into a 10 mL volumetric flask, 0.5 mL of Folin-Ciocalteau reagent was added, and the flask was allowed to stand for 5 minutes. Then 1 mL of 20% sodium carbonate was added and diluted with distilled water until the limit mark. The mixture was incubated for 2 hours. The absorbance was then measured at a wavelength of 750 nm [29]. Based on the absorbance values obtained, a calibration curve was made and a linear regression equation for the standard solution was obtained. The total phenolic content of each test solution was determined from the linear regression equation of the standard solution. Total phenolic content is expressed in mg Galic Acid Equivalent (GAE)/g sample.
4.4. Microencapsulation
The microencapsulation process of the ethanol extract of Sungkai leaves was carried out using the extrusion method by following the procedure of the study [28]. The dressing mixture was put into 100 mL of 850C distilled water, then 1 mL of tween-80 and 1g of dried sungkai leaf extract were added. After homogenization, the solution was dripped into a 0.2 M CaCl2 solution with ethanol solvent (70%). The formed granules were allowed to stand for 15 min, after which they were filtered. Crosslinking was done with glutaraldehyde crosslinkers. The gel beads were soaked in glutaraldehyde solutions for 5 min. The gel beads were drained and dried to a constant weight.
4.5. % Yield.
The calculation of percent yield is done by calculating the overall weight of the microencapsulant product and the total weight of the microencapsulant material, which are then calculated using the following equation:
Where, %R: Yield product; W0: Microencapsulated weight (g); WT: total weight of microencapsulated material (g)
4.6. Water Solubility
One gram of microencapsulant was weighed and then dissolved in 20 milliliters of purified water. Then filter paper was used for filtration. Before use, the filter paper was weighed and heated for 30 min at 105°C. After the filtration procedure was completed, the filter paper and the remaining material were dried once again in the oven at 105 °C for 1 hour. It was then weighed after cooling for 15 min in a desiccator.
Where, a: weight of sample used (g); b: weight of filter paper (g); c: weight of filter paper and residue (g); d: moisture content of the sample (%).
4.7. Stability and Efficiency
Stability: A total of 1 gram of microencapsulant was placed in a vial bottle and stored at 60°C for 12 days. Total phenolic content was measured on days 0, 6, and 12. Product stability was observed against storage temperature and time by measuring total phenolic content.
Microencapsulation efficiency is the ratio of total encapsulated phenolic content (a) to total phenolic content before encapsulation (b).
Where, ME: microencapsulation efficiency; a: total phenolics successfully encapsulated; b: total phenolics before encapsulation.
4.8. Morphology Analysis and IR Spectrum
Maltodextrin, inulin, Arabic gum, carboxymethylcellulose, and microencapsulants had their infrared spectra recorded using Fourier-Transform infrared spectroscopy (Alpha II-Bruker) at wave numbers ranging from 500 to 4000 cm-1. Using a SEM-EDX JEOL JSM-6510LA, the morphology form of the microencapsulants produced by the microencapsulation method were examined.
4.9. Antioxidant Activity Test
Antioxidant activity testing was carried out by adding 3 mL of a 0.1 mM DPPH solution to samples at various concentrations. As a negative control in this test, 2 mL of methanol was added to 3 mL of DPPH solution. Do the work in a dark place that is not exposed to sunlight. Then the absorbance of each concentration of test solution and control was measured at a wavelength of 515 nm. (Šukele et al., 2023). The measured absorbance values were contrasted with those measured using methanol added to DPPH solution as a negative control and ascorbic acid as a positive control. The IC50 value, which indicates the concentration that provides 50% inhibition, was computed after the percent inhibition value, which displays the DPPH silencing activity, had been calculated.
5. Conclusions
The microencapsulants created by Formulation A1 had the best physico-chemical characteristics and antioxidant activity. The A1 microencapsulant had a homogenous, smooth surface and a slightly rounded shape as well as few wall folds and cracks, which suggested that the product would have higher stability, according to the results of morphological study performed using SEM. The ethanol extract of sungkai leaves was successfully encapsulated, according to the findings of functional group analysis using FTIR
Author Contributions
Conceptualization, I.L.T., M.L; methodology, F.F, I.L.T; software, R.D.P; validation, I.L.T and M.L.; formal analysis, I.L.T; investigation, F.F.; resources, F.F.; data curation, I.L.T; writing—original draft preparation, I.L.T and F.F; writing—review and editing, I.L.T.; visualization, F.F.; supervision, M.L; project administration, M.L; funding acquisition, M.L. All authors have read and agreed to the published version of the manuscript.
Funding
This research was funded by Faculty of Science and Technology, Universitas Jambi, for with contract number: 276/UN21.11/PT.01.05/SPK/2022 Tanggal 17 Mei 2022.
Data Availability Statement
Data is contained within the article.
Acknowledgments
The authors extended their appreciation to the research supporting project number 276/UN21.11/PT.01.05/SPK/2022, Universitas Jambi, Jambi, Indonesia for funding this research.
Conflicts of Interest
The authors declare no conflict of interest.
References
- Latief, M.; Lizawati; Tarigan, I.L.; Muhaimin; Sari, P.M. Screening of antibiotic candidates from nine medicinal plants Jambi Province. AIP Conference Proceedings 2023, 080004. [Google Scholar]
- Ningsih, A.; Ibrahim, A. Aktifitas Antimikroba Ekstrak Fraksi n-Heksan Daun Sungkai (Peronema canescens. JACK) terhadap Beberapa Bakteri dengan Metode KLT-Bioautografi. J. Trop. Pharm. Chem. 2013, 2, 76–82. [Google Scholar] [CrossRef]
- Latief, M.; Sari, P.M.; Fatwa, L.T.; Tarigan, I.L.; Rupasinghe, H.P.V. Antidiabetic Activity of Sungkai (Peronema canescens Jack) Leaves Ethanol Extract on the Male Mice Induced Alloxan Monohydrate. Pharmacol. Clin. Pharm. Res. 2021, 6, 64–74. [Google Scholar] [CrossRef]
- Latief, M.; Tarigan, I.L.; Sari, P.M.; Aurora, F.E. Aktivitas Antihiperurisemia Ekstrak Etanol Daun Sungkai (Peronema canescens Jack) Pada Mencit Putih Jantan. Pharmacon: J. Farm. Indones. 2021, 18, 23–37. [Google Scholar] [CrossRef]
- Tarigan, I.L.; Sutrisno, S.; Rumaida, R.; Aini, I.P.S.; Latief, M. Isolation of a Flavone Apigenin and a Steroids Squalene from Peronema canescens Jack Leaves with Anti-Inflammatory Activities. Pharmacogn. J. 2022, 14, 744–752. [Google Scholar] [CrossRef]
- Fikriansyah, M.; Nelson, N.; Latief, M.; Tarigan, I.L. Anticancer Activities of Seven Peronemins (A2, A3, B1, B2, B3, C1, and D1) from Peronema canescens Jack: A Prediction Studies. CHEMPUBLISH J. 2023, 7, 54–63. [Google Scholar] [CrossRef]
- Nurjannah, S.; Arum, D.; Tarigan, I.L.; Latief, M. ANTI-INFLAMMATORY PREDICTION OF PERONEMIN COMPOUNDS FROM SUNGKAI (Peronema canescens Jack) AND THEIR DERIVATIVES. AL ULUM J. SAINS DAN Teknol. 2023, 9, 59–66. [Google Scholar] [CrossRef]
- Bamidele, O.P.; Emmambux, M.N. Encapsulation of bioactive compounds by “extrusion” technologies: a review. Crit. Rev. Food Sci. Nutr. 2021, 61, 3100–3118. [Google Scholar] [CrossRef]
- Šeregelj, V.; Ćetković, G.; Čanadanović-Brunet, J.; Šaponjac, V.T.; Vulić, J.; Stajčić, S. Encapsulation and Degradation Kinetics of Bioactive Compounds from Sweet Potato Peel During Storage. Food Technol. Biotechnol. 2020, 58, 314–324. [Google Scholar] [CrossRef]
- Řepka, D.; Kurillová, A.; Murtaja, Y.; Lapčík, L. Application of Physical-Chemical Approaches for Encapsulation of Active Substances in Pharmaceutical and Food Industries. Foods 2023, 12, 2189. [Google Scholar] [CrossRef]
- Liliana, S.C.; Vladimir, V.C. Probiotic encapsulation. Afr. J. Microbiol. Res. 2013, 7, 4743–4753. [Google Scholar] [CrossRef]
- Peng, X.; Umer, M.; Pervez, N.; Hasan, K.F.; Habib, A.; Islam, S.; Lin, L.; Xiong, X.; Naddeo, V.; Cai, Y. Biopolymers-based microencapsulation technology for sustainable textiles development: A short review. Case Stud. Chem. Environ. Eng. 2023, 7. [Google Scholar] [CrossRef]
- Kang, Y.-R.; Lee, Y.-K.; Kim, Y.J.; Chang, Y.H. Characterization and storage stability of chlorophylls microencapsulated in different combination of gum Arabic and maltodextrin. Food Chem. 2019, 272, 337–346. [Google Scholar] [CrossRef]
- Todorović, A.; Šturm, L.; Salević-Jelić, A.; Lević, S.; Črnivec, I.G.O.; Prislan, I.; Skrt, M.; Bjeković, A.; Ulrih, N.P.; Nedović, V. Encapsulation of Bilberry Extract with Maltodextrin and Gum Arabic by Freeze-Drying: Formulation, Characterisation, and Storage Stability. Processes 2022, 10, 1991. [Google Scholar] [CrossRef]
- de Barros Fernandes, R.V.; Borges, S.V.; Botrel, D.A. Gum arabic/starch/maltodextrin/inulin as wall materials on the microencapsulation of rosemary essential oil. Carbohydr. Polym. 2014, 101, 524–532. [Google Scholar] [CrossRef]
- Lourenço, S.C.; Moldão-Martins, M.; Alves, V.D. Microencapsulation of Pineapple Peel Extract by Spray Drying Using Maltodextrin, Inulin, and Arabic Gum as Wall Matrices. Foods 2020, 9, 718. [Google Scholar] [CrossRef]
- Wyspiańska, D.; Kucharska, A.Z.; Sokół-Łętowska, A.; Kolniak-Ostek, J. Effect of microencapsulation on concentration of isoflavones during simulated in vitro digestion of isotonic drink. Food Sci. Nutr. 2019, 7, 805–816. [Google Scholar] [CrossRef]
- Latief, M.; Tarigan, I.L.; Sari, P.M.; Aurora, F.E. Antihyperuricemia Activity of Ethanol Extract of Sungkai Leaves- (Peronema canescens Jack ) in Male White Mice. Pharmacon J Farm Indones. 2021, 18, 23–37. [Google Scholar] [CrossRef]
- Ferreira, S.; Malacrida, C.R.; Nicoletti, V.R. INFLUENCE OF EMULSIFICATION METHODS AND SPRAY DRYING PARAMETERS ON THE MICROENCAPSULATION OF TURMERIC OLEORESIN. Emir. J. Food Agric. 2019, 31, 491–500. [Google Scholar] [CrossRef]
- Fuentes, Y.; Giovagnoli-Vicuña, C.; Faúndez, M.; Giordano, A. Microencapsulation of Chilean Papaya Waste Extract and Its Impact on Physicochemical and Bioactive Properties. Antioxidants 2023, 12, 1900. [Google Scholar] [CrossRef] [PubMed]
- Spada, J.C.; Marczak, L.D.F.; Tessaro, I.C.; Noreña, C.P.Z. Microencapsulation of β-carotene using native pinhão starch, modified pinhão starch and gelatin by freeze-drying. Int. J. Food Sci. Technol. 2012, 47, 186–194. [Google Scholar] [CrossRef]
- Tran, N.; Tran, M.; Truong, H.; Le, L. Spray-Drying Microencapsulation of High Concentration of Bioactive Compounds Fragments from Euphorbia hirta L. Extract and Their Effect on Diabetes Mellitus. Foods 2020, 9, 881. [Google Scholar] [CrossRef] [PubMed]
- Zen, M.B.; Putra, G.G.; Suhendra, L. Karakteristik Enkapsulat Ekstrak Kulit Buah Kakao (Theobroma cacao L.) pada Perlakuan Variasi Jenis dan Konsentrasi Bahan Penyalut. J. Rekayasa DAN Manaj. AGROINDUSTRI 2021, 9, 356–370. [Google Scholar] [CrossRef]
- Pourashouri, P.; Shabanpour, B.; Razavi, S.H.; Jafari, S.M.; Shabani, A.; Aubourg, S.P. Impact of Wall Materials on Physicochemical Properties of Microencapsulated Fish Oil by Spray Drying. Food Bioprocess Technol. 2014, 7, 2354–2365. [Google Scholar] [CrossRef]
- Piñón-Balderrama, C.I.; Leyva-Porras, C.; Terán-Figueroa, Y.; Espinosa-Solís, V.; Álvarez-Salas, C.; Saavedra-Leos, M.Z. Encapsulation of Active Ingredients in Food Industry by Spray-Drying and Nano Spray-Drying Technologies. Processes 2020, 8, 889. [Google Scholar] [CrossRef]
- Wei, N.S.; Sulaiman, R. Effect of Maltodextrin, Arabic Gum, and Beetroot Juice Concentration on the Powder Properties of Spray-Dried Beetroot-Skim Milk Mixtures. Acta Univ. Cibiniensis. Ser. E: Food Technol. 2022, 26, 209–224. [Google Scholar] [CrossRef]
- Yuliawaty, S.T.; Susanto, W.H. Effect of Drying Time and Concentration of Maltodextrin on The Physical Chemical and Organoleptic Characteristic of Instant Drink Noni Leaf (Morinda citrifolia L). J Pangan dan Agroindustri. 2015, 3, 41–51. [Google Scholar]
- Hertanti; Nuralang; Susanto, N.C.A.; Tarigan, I.L.; Nelson. Microencapsulation of Fermented Red Palm Oil with L. casei as Nutracetical Source. J. Rekayasa Kim Lingkung. 2022, 17, 138–151. [Google Scholar] [CrossRef]
- Šukele, R.; Lauberte, L.; Kovalcuka, L.; Logviss, K.; Bārzdiņa, A.; Brangule, A.; Horváth, Z.M.; Bandere, D. Chemical Profiling and Antioxidant Activity of Tanacetum vulgare L. Wild-Growing in Latvia. Plants 2023, 12, 1968. [Google Scholar] [CrossRef] [PubMed]
- Klojdová, I.; Milota, T.; Smetanová, J.; Stathopoulos, C. Encapsulation: A Strategy to Deliver Therapeutics and Bioactive Compounds? Pharmaceuticals 2023, 16, 362. [Google Scholar] [CrossRef]
- Timilsena, Y.P.; Haque, A.; Adhikari, B. Encapsulation in the Food Industry: A Brief Historical Overview to Recent Developments. Food Nutr. Sci. 2020, 11, 481–508. [Google Scholar] [CrossRef]
- Makouie, S.; Alizadeh, M.; Maleki, O.; Khosrowshahi, A. Optimization of wall components for encapsulation of Nigella sativa seed oil by freeze-drying. Indones. Food Sci. Technol. J. 2020, 3, 1–9. [Google Scholar] [CrossRef]
- Prince, M.V.; Thangavel, K.; Meda, V.; Visvanathan, R.; Ananthakrishnan, D. Effect of carrier blend proportion and flavor load on physical characteristics of nutmeg (Myristica frangrans Houtt.) oleoresin microencapsulated by spray drying. Int Food Res J. 2014, 21, 2039–2044. [Google Scholar]
- Siregar, T.M.; Margareta, M. Microencapsulation of Carotenoids from Red Melinjo (Gnetum gnemon L.) Peels Extract. J. Physics: Conf. Ser. 2019, 1351, 012031. [Google Scholar] [CrossRef]
- Krishnan, S.; Bhosale, R.; Singhal, R.S. Microencapsulation of cardamom oleoresin: Evaluation of blends of gum arabic, maltodextrin and a modified starch as wall materials. Carbohydr. Polym. 2005, 61, 95–102. [Google Scholar] [CrossRef]
- Ningsih, R.; Sudarno; Agustono. Agustono The Effect of Maltodextrin Concentration on the Characteristics of Snappers’ (Lutjanussp.) Peptone. IOP Conf. Series: Earth Environ. Sci. 2019, 236, 012127. [Google Scholar] [CrossRef]
- Musdalifa; Chairany, M.; Haliza, N.; Bastian, F. 37. Musdalifa; Chairany, M.; Haliza, N.; Bastian, F. Microencapsulation of three natural dyes from butterfly pea, Sappan wood, and turmeric extracts and their mixture base oncyan, magenta, yellow (CMY) color concept. Canrea Journal: Food Technol. Nutr. Culin. J. [CrossRef]
- Mahmoud, K.F.; Ali, H.S.; Amin, A.A. Nanoencapsulation of Bioactive Compounds Extracted from Egyptian Prickly Pears Peel Fruit: Antioxidant and Their Application in Guava Juice. Asian J. Sci. Res. 2018, 11, 574–586. [Google Scholar] [CrossRef]
- Wongverawattanakul, C.; Suklaew, P.O.; Chusak, C.; Adisakwattana, S.; Thilavech, T. Encapsulation of Mesona chinensis Benth Extract in Alginate Beads Enhances the Stability and Antioxidant Activity of Polyphenols under Simulated Gastrointestinal Digestion. Foods 2022, 11, 2378. [Google Scholar] [CrossRef] [PubMed]
- Kibici, D.; Kahveci, D. Effect of Emulsifier Type, Maltodextrin, and β-Cyclodextrin on Physical and Oxidative Stability of Oil-In-Water Emulsions. J. Food Sci. 2019, 84, 1273–1280. [Google Scholar] [CrossRef]
- Hartiati, A.; Mulyani, S. The Effect of Maltodextrin Concentration and Drying Temperature to Antioxidant Content of Sinom Beverage Powder. Agric. Agric. Sci. Procedia 2015, 3, 231–234. [Google Scholar] [CrossRef]
- Gupta, S.S.; Ghosh, M. Formulation development and process parameter optimization of lipid nanoemulsions using an alginate-protein stabilizer. J. Food Sci. Technol. 2015, 52, 2544–2557. [Google Scholar] [CrossRef] [PubMed]
- Akdeniz, B.; Sumnu, G.; Sahin, S. The Effects of Maltodextrin and Gum Arabic on Encapsulation of Onion Skin Phenolic Compounds. Chemical Engineering Transactions 2017, 57, 1891–1896. [Google Scholar] [CrossRef]
- Iesa, N.B.; Chaipoot, S.; Phongphisutthinant, R.; Wiriyacharee, P.; Lim, B.G.; Sringarm, K.; Burgett, M.; Chuttong, B. Effects of Maltodextrin and Gum Arabic Composition on the Physical and Antioxidant Activities of Dewaxed Stingless Bee Cerumen. Foods 2023, 12, 3740. [Google Scholar] [CrossRef] [PubMed]
- Zehiroglu, C.; Sarikaya, S.B.O. The importance of antioxidants and place in today’s scientific and technological studies. J. Food Sci. Technol. 2019, 56, 4757–4774. [Google Scholar] [CrossRef] [PubMed]
- Tarigan, I.L.; Kimia, M.; Muadifah, A.; Susanto, N.C.C.A.; Huda, C.; Farmasi, S.K.P.B. Antibacterial Activity of Ethyl Acetate and Cream Formulation of Coleus atropurpureus leaves Against Staphylococcus aureus. Pharm. J. Indones. 2021, 7, 1–8. [Google Scholar] [CrossRef]
- Isolation and Characterization of Ethyl Acetate Fraction from Abroma augusta L as an Anti-Inflammatory Agent. Makara J. Sci. 2021, 25, 6–107. [CrossRef]
- Latief, M.; Nelson, N.; Amanda, H.; Tarigan, I.L.; Aisyah, S. POTENTIAL TRACKING OF CYTOTOXIC ACTIVITIES OF MANGROVE PEREPATE (Sonneratia alba) ROOT EXTRACT AS AN ANTICANCER CANDIDATE. Pharmacol. Clin. Pharm. Res. 2020, 5. [Google Scholar] [CrossRef]
Figure 1.
Gallic acid standard calibration curve.
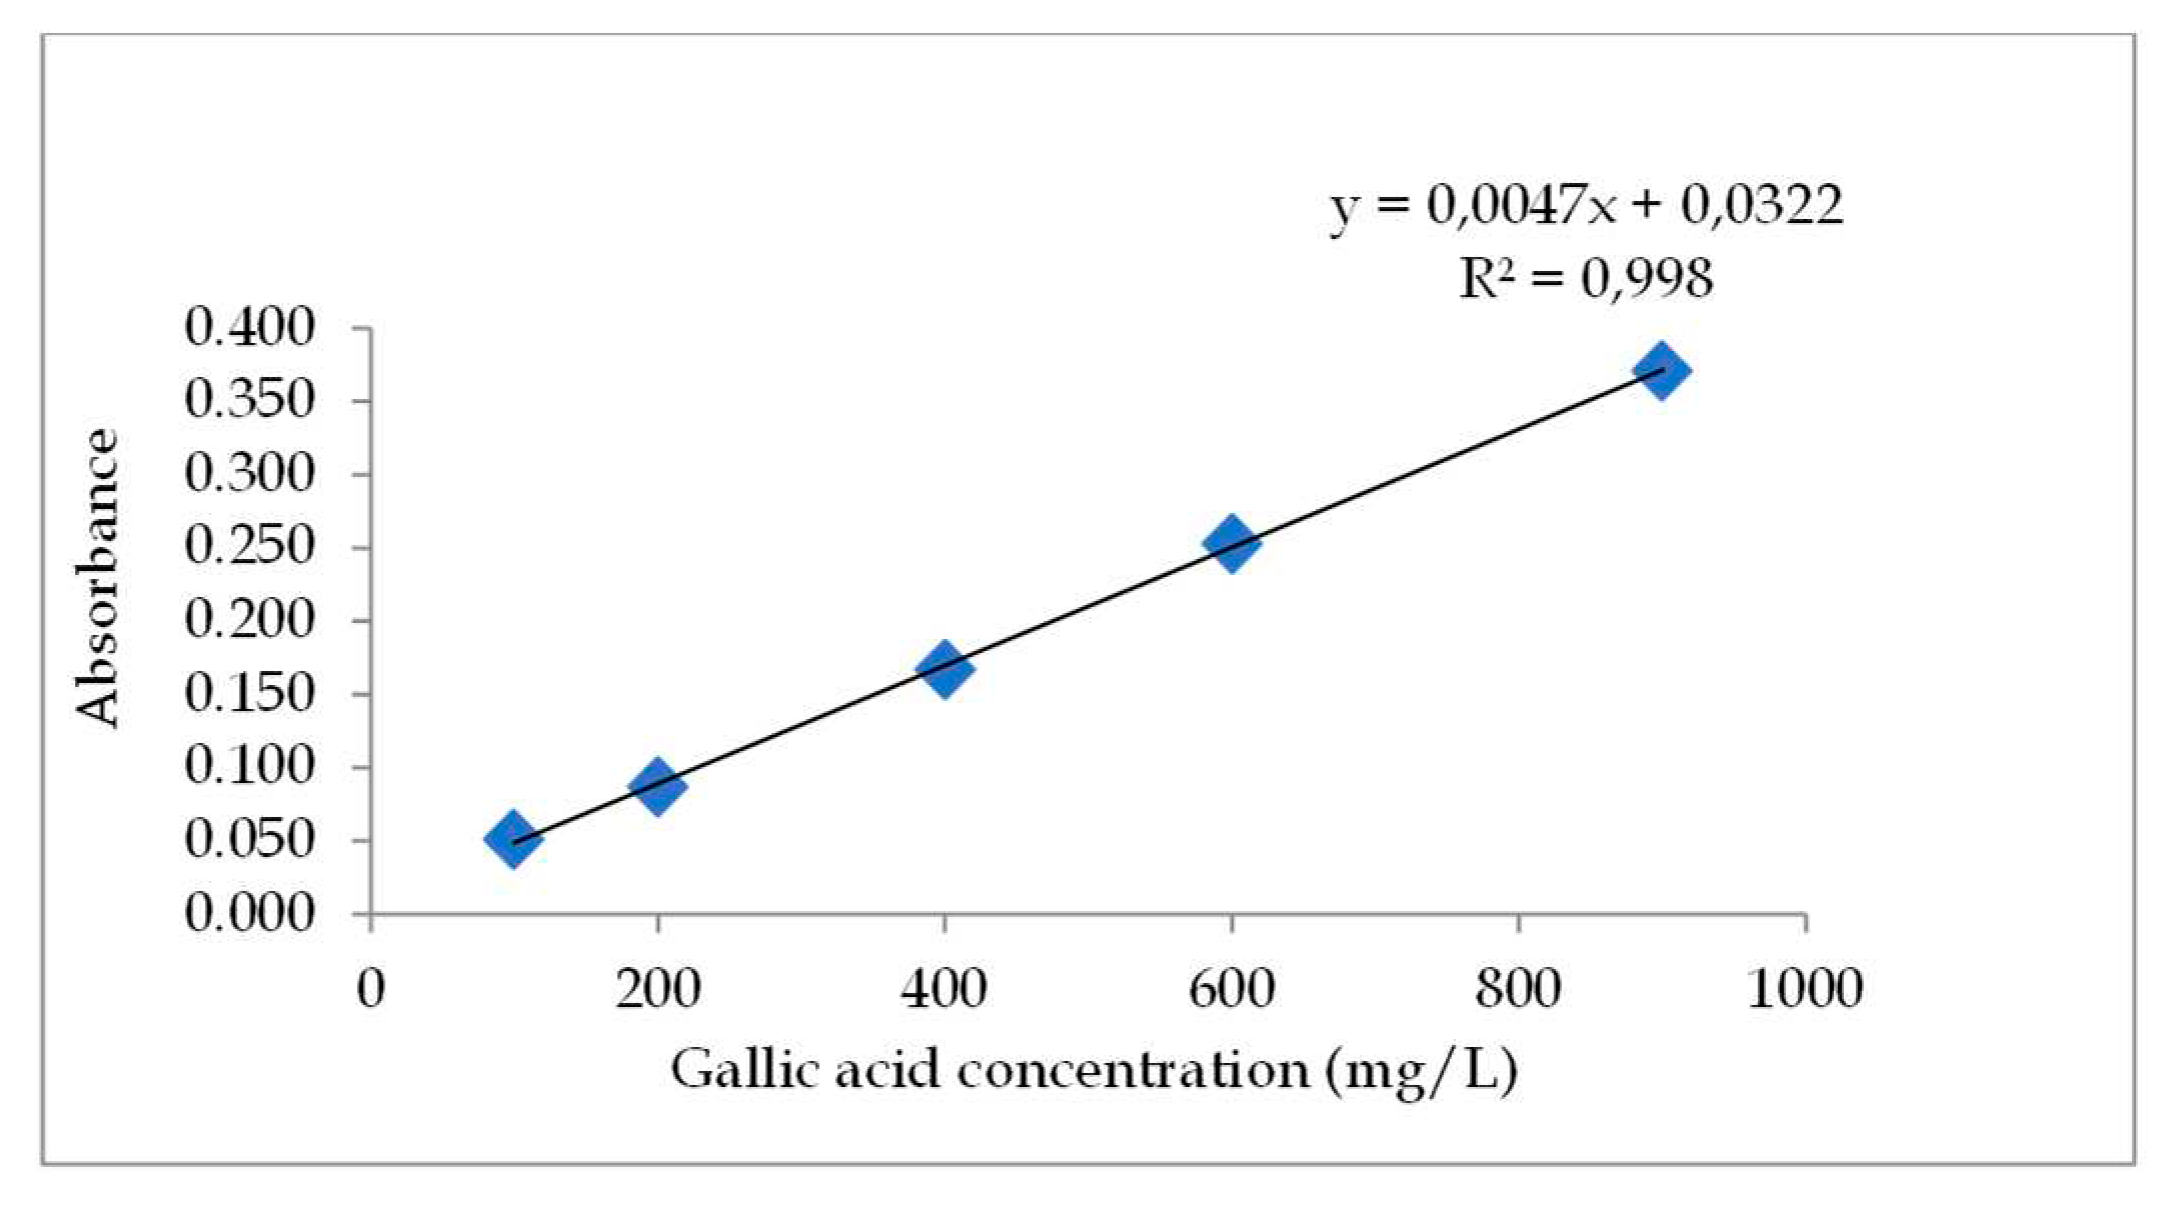
Figure 2.
Stability test results of extracts and microencapsulants (A) graph of extract stability test results; (B) graph of microencapsulant stability test results using Arabic gum dressing; (C) graph of microencapsulant stability test results using inulin dressing (D) graph of microencapsulant stability test results using maltodextrin dressing; (E) graph of best microencapsulant stability test results A1, I1, and M1.
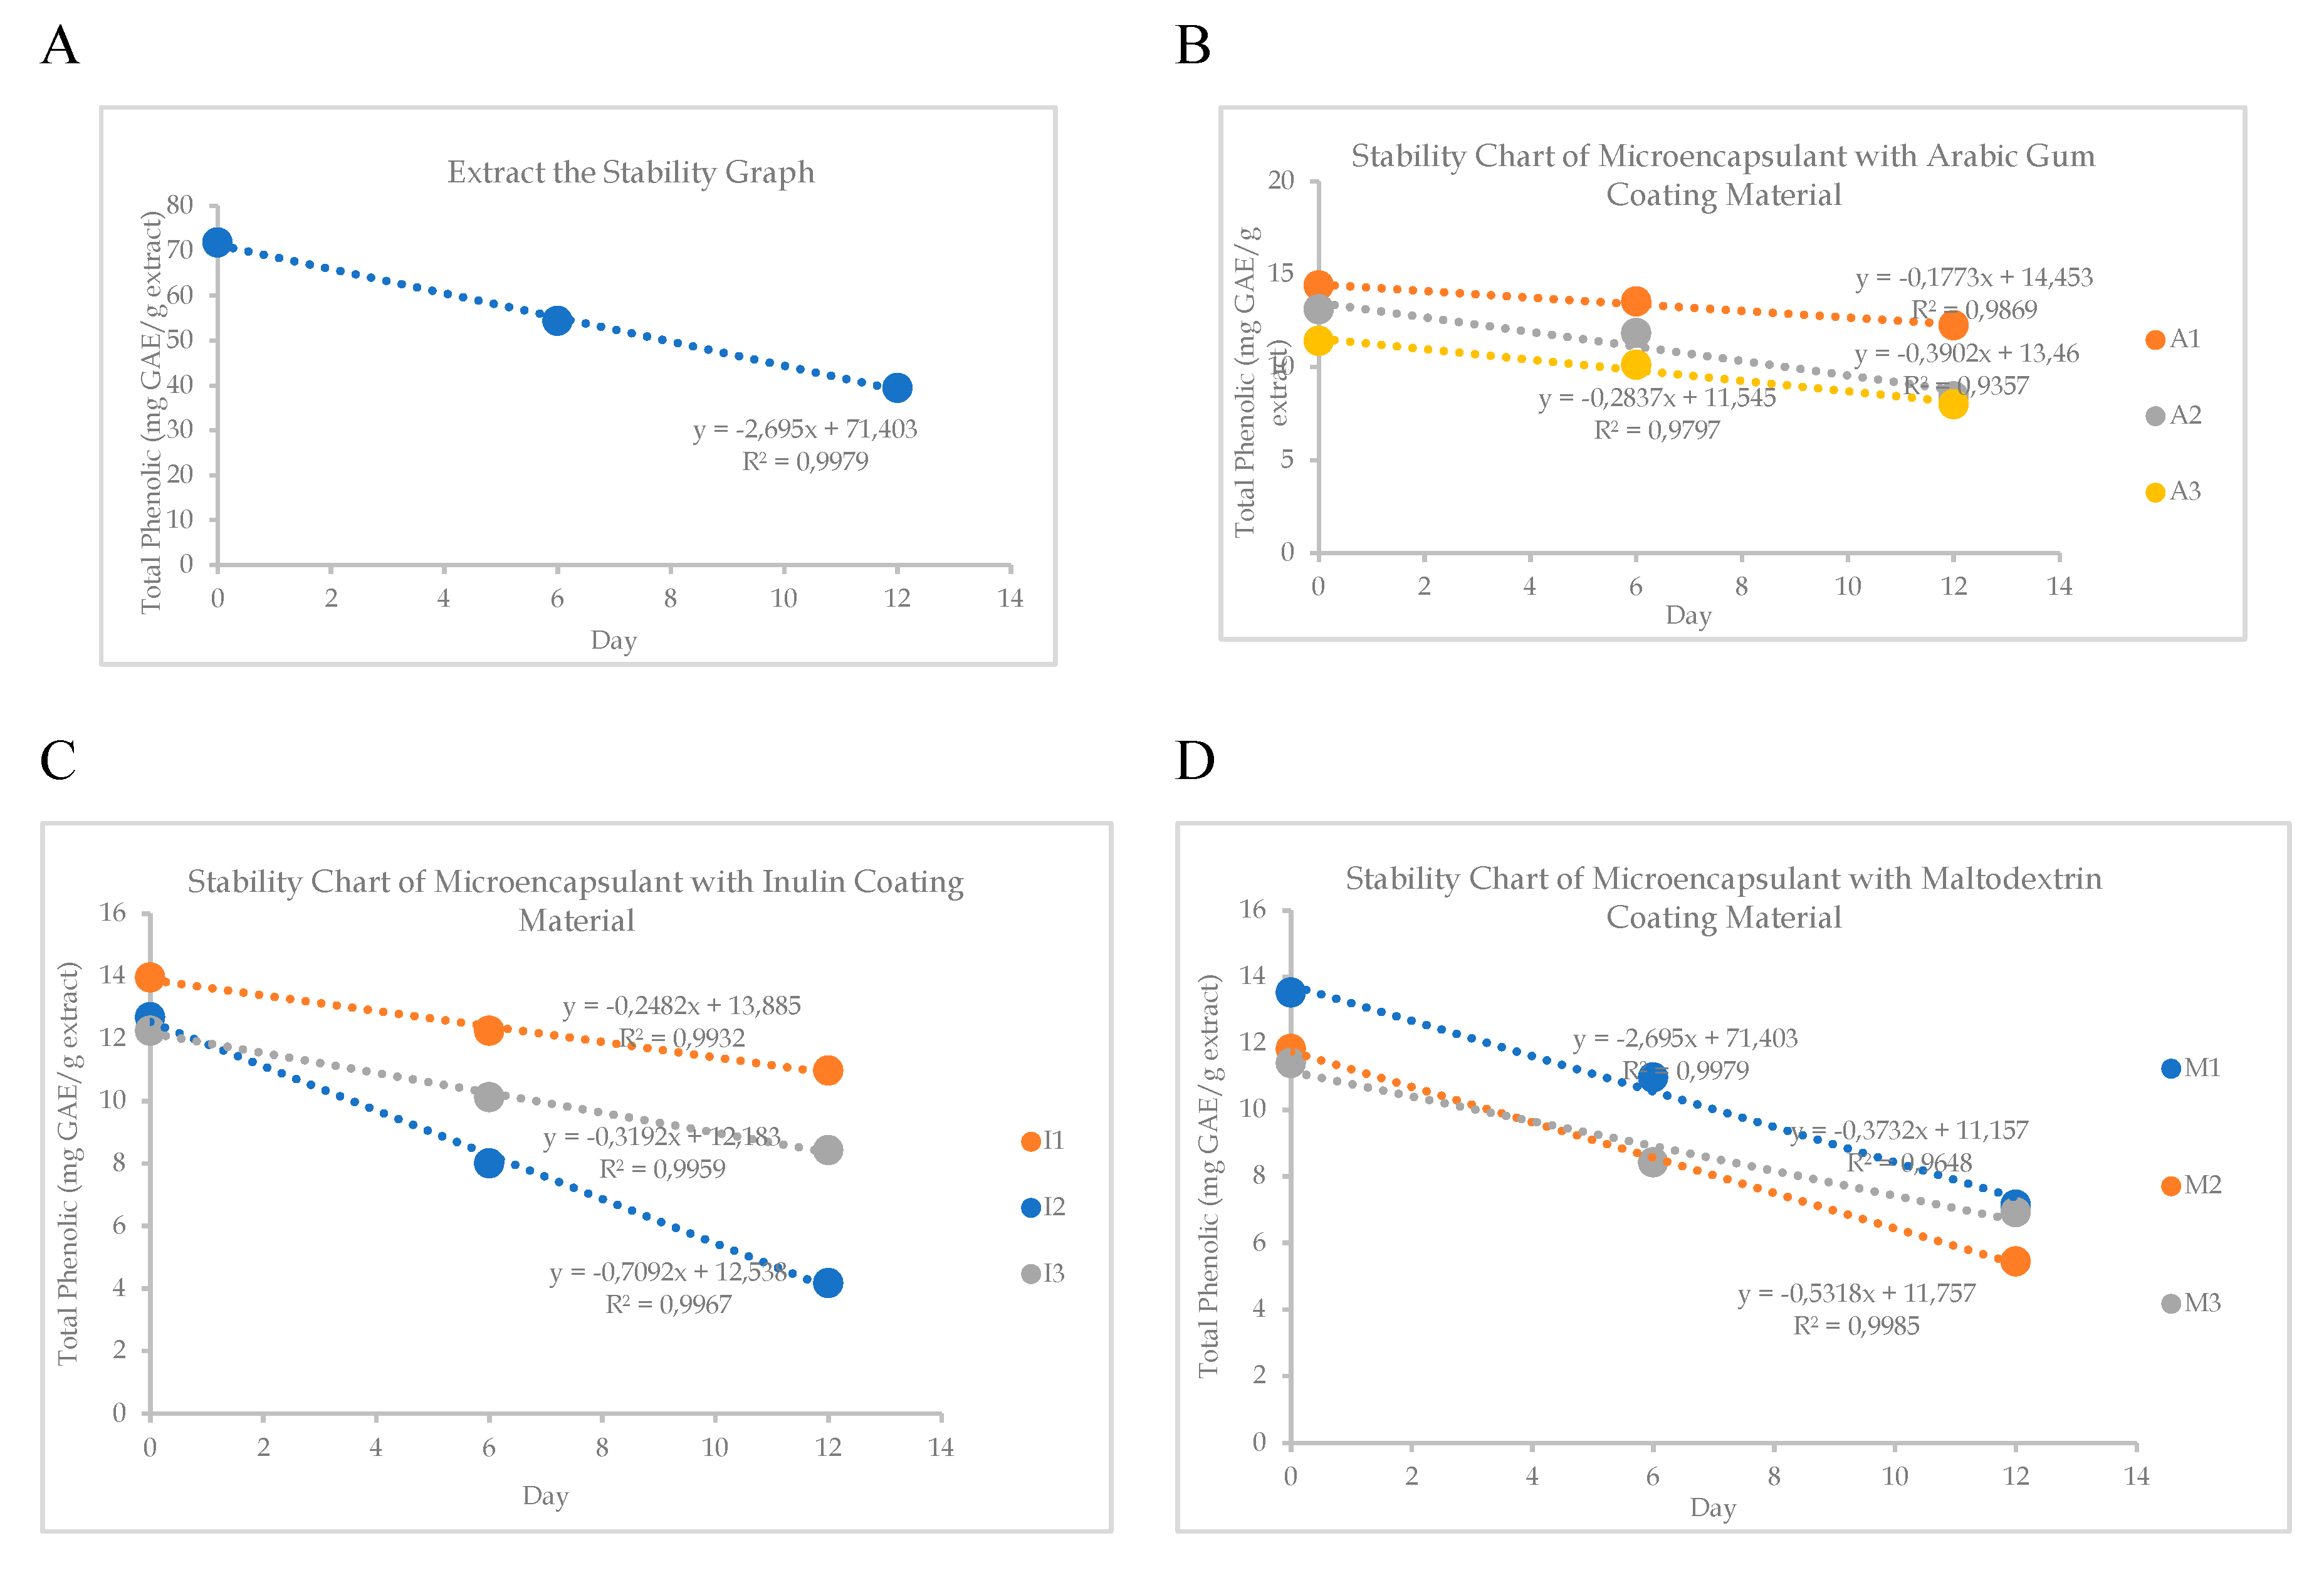
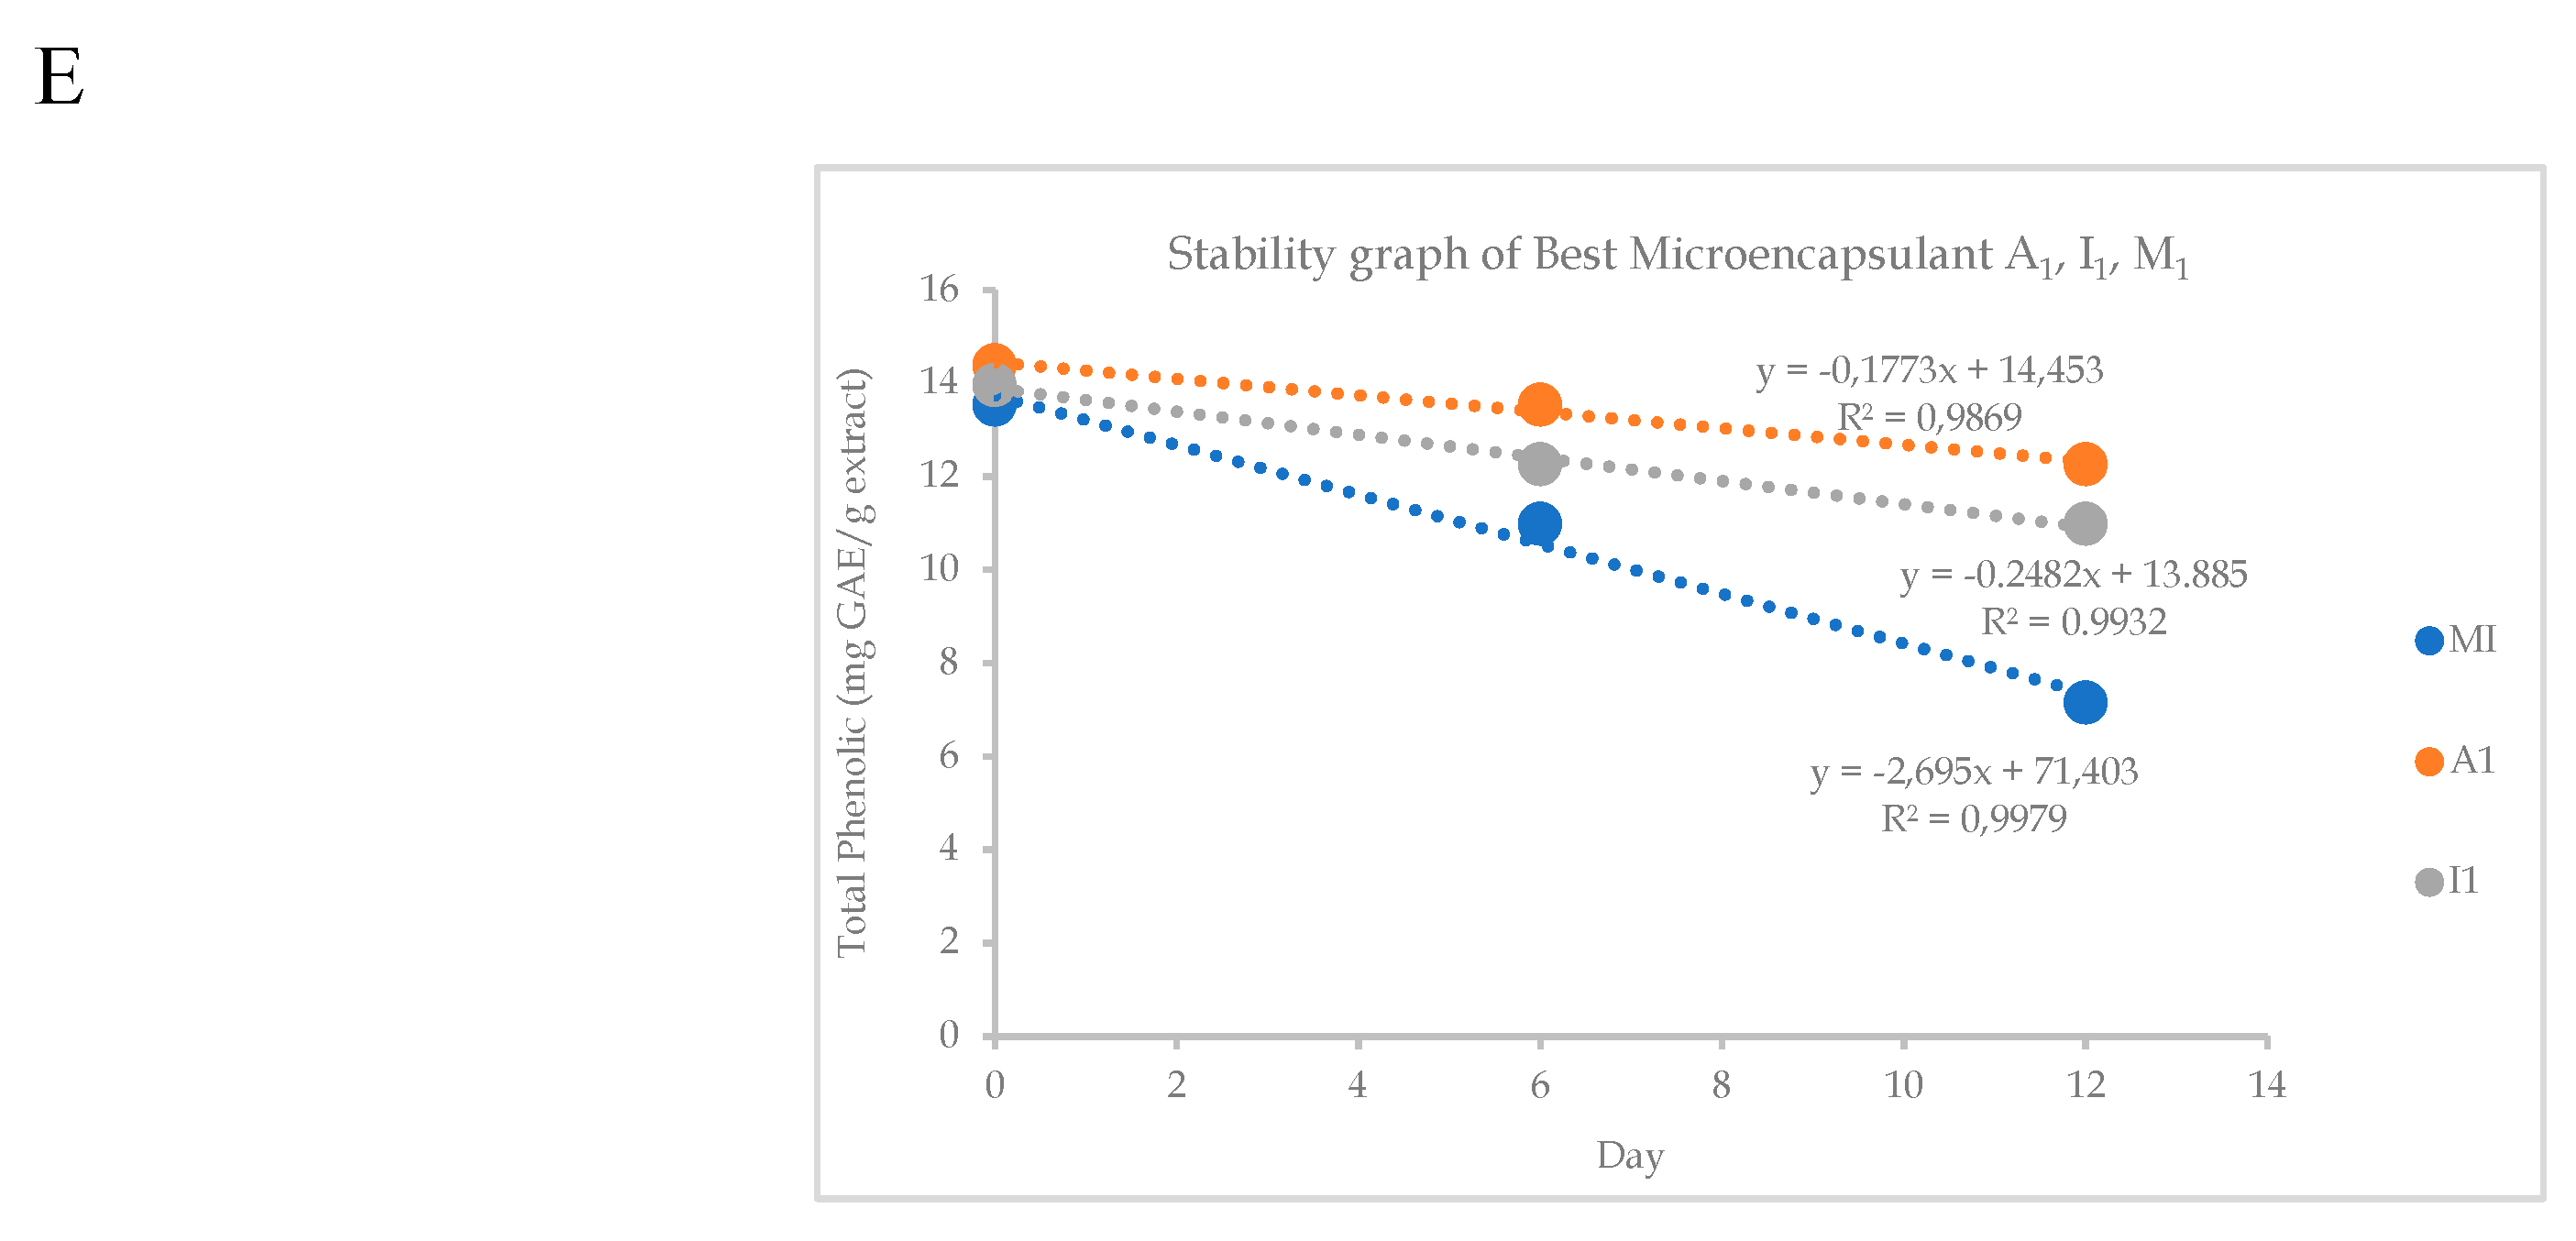
Figure 3.
SEM analysis results (A) Morphological structure of the microencapsulant A1 (B): Morphological structure of microencapsulant I1 (C) Morphological structure of microencapsulant M1.
Figure 3.
SEM analysis results (A) Morphological structure of the microencapsulant A1 (B): Morphological structure of microencapsulant I1 (C) Morphological structure of microencapsulant M1.
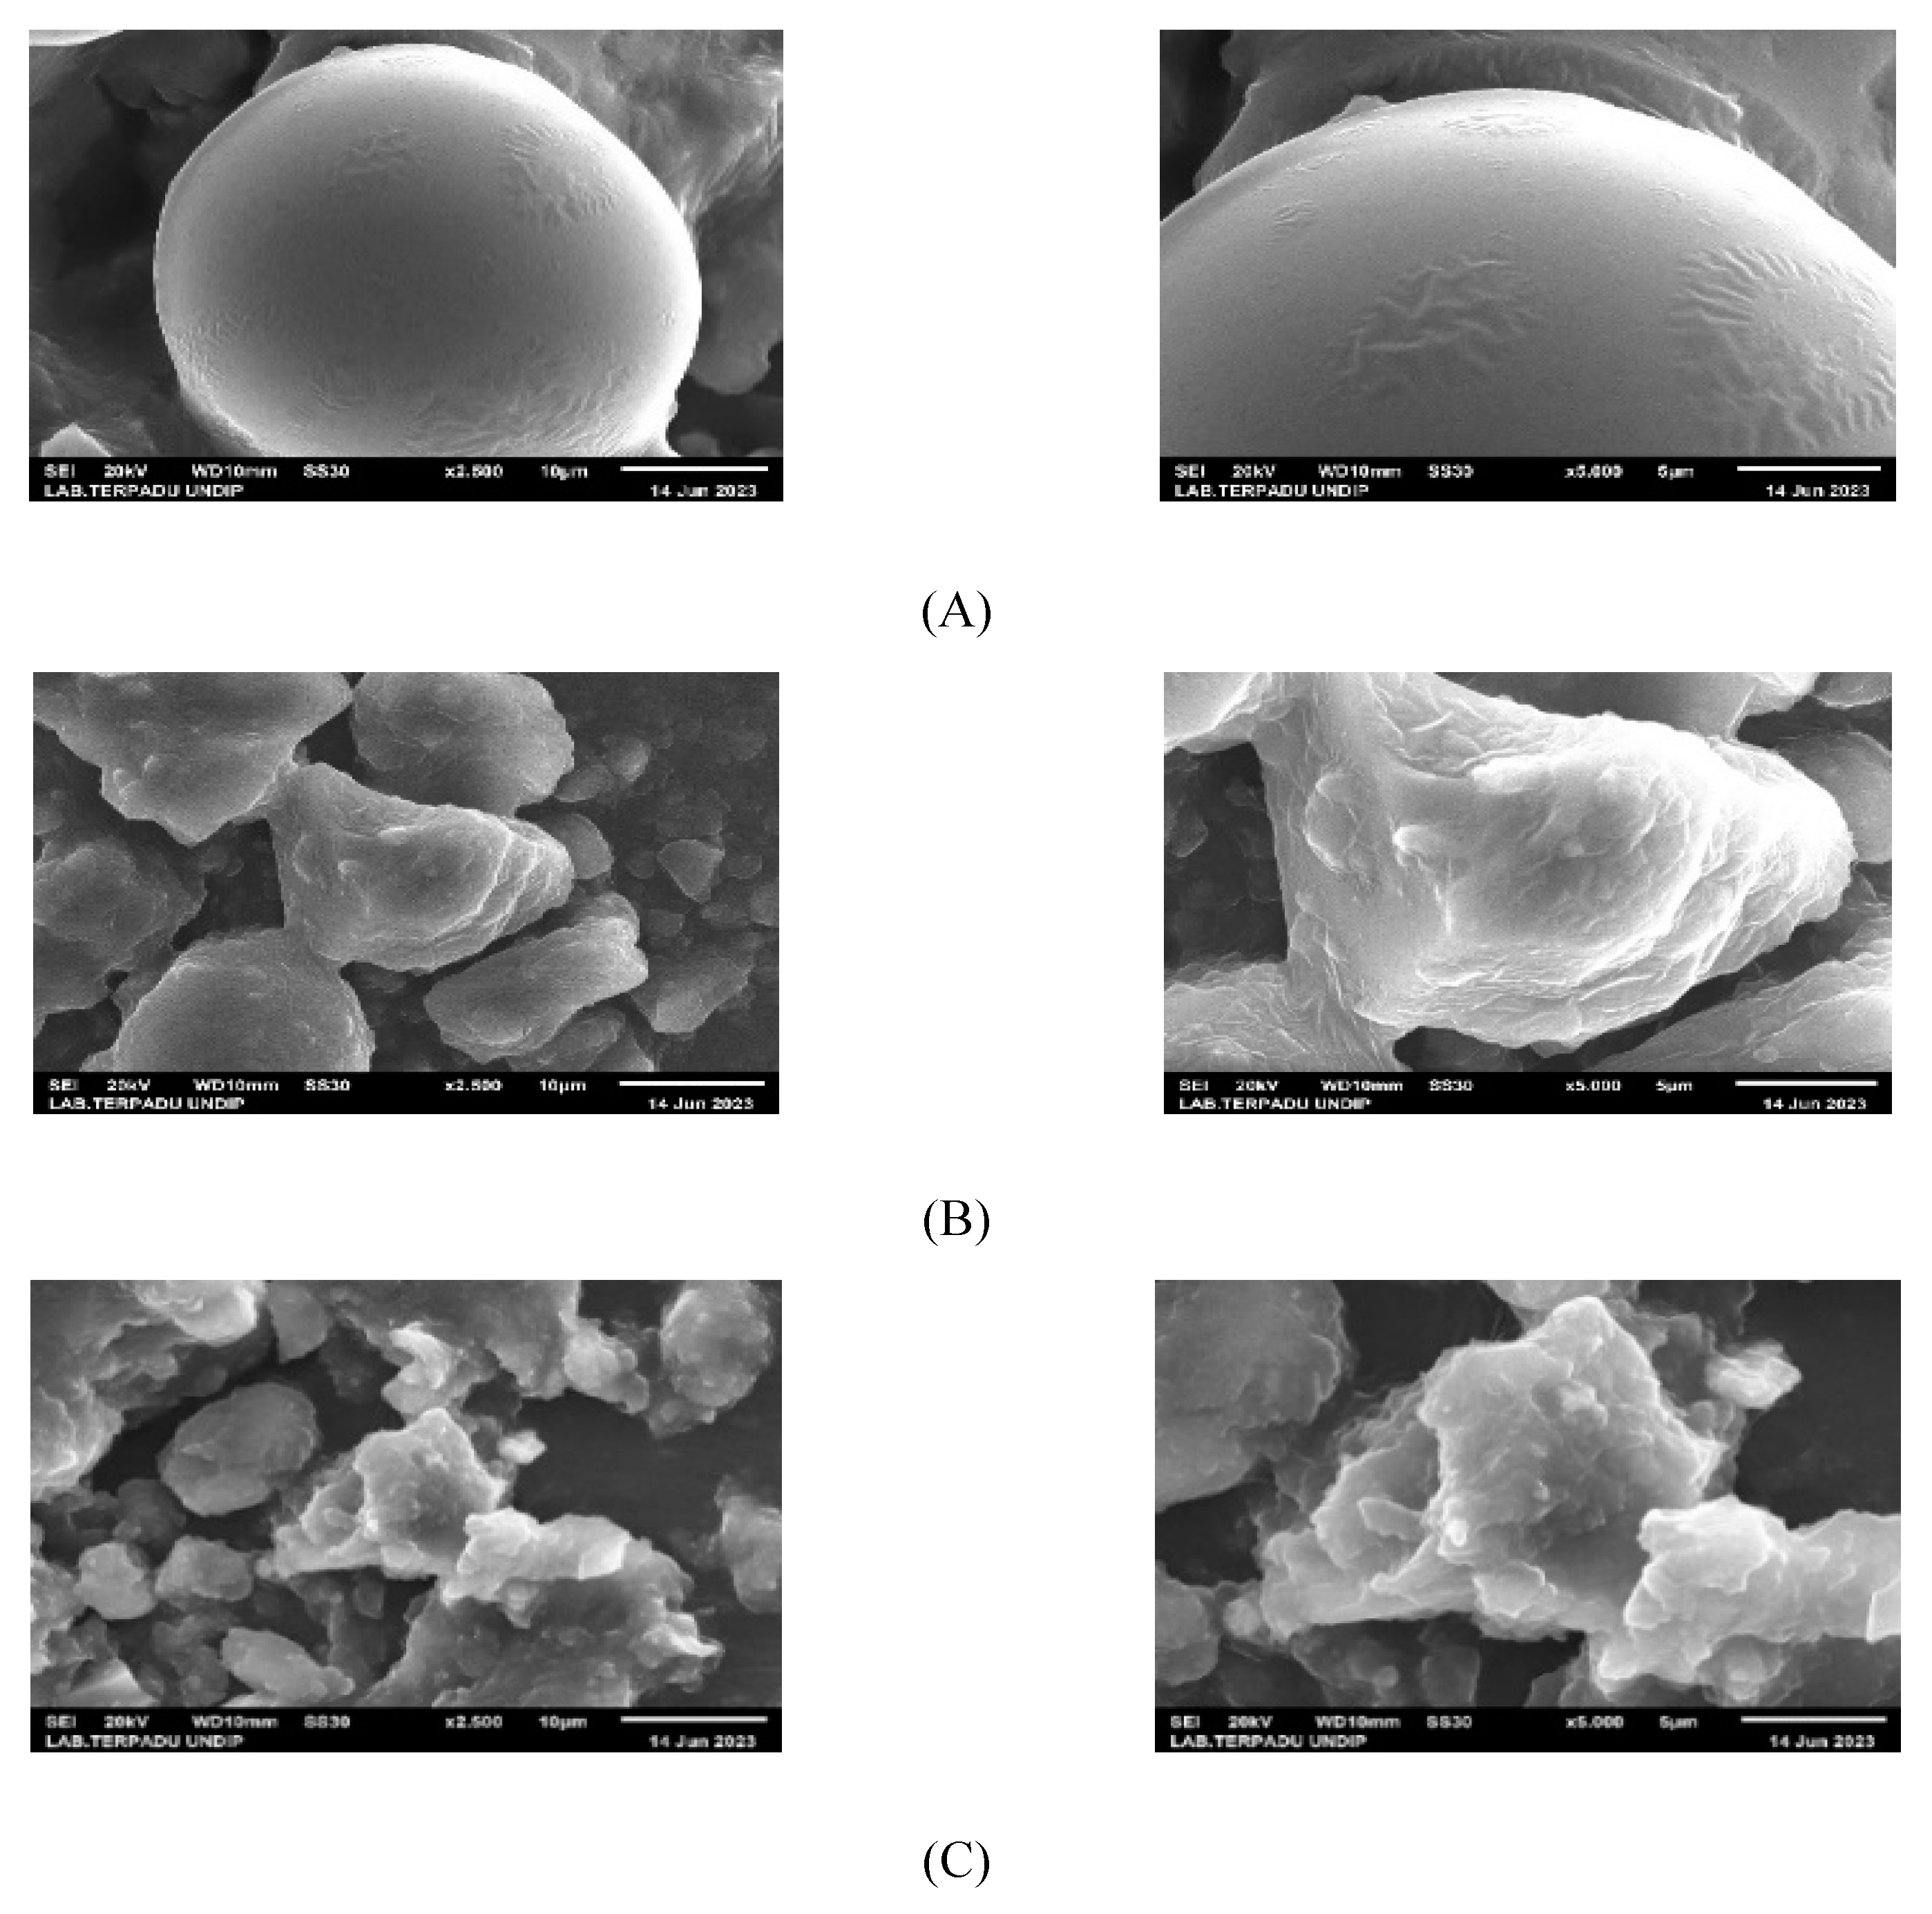
Figure 4.
IR spectrum of microencapsulant A1, I1, and M1.


Table 1.
Phytochemical Test Results of the Ethanol Extract and microencapsulation of P. canescens.
| Secondary metabolites | Extract | Microencapsulanted |
|---|---|---|
| Flavonoids | + | + |
| Tannins | + | + |
| Phenolics | + | + |
| Saponins | + | + |
| Triterpenoids | - | - |
| Steroids | + | + |
| Alkaloids | + | + |
Table 2.
LC-MS/MS Metabolite Profile Ethanol Extract of P. canescens.
| RT (min) | Measured m/z | Formula | Proposed metabolite |
|---|---|---|---|
| 13.318 | 375.1253 | C23H20O5 | 5-O-Methylchamanetin |
| 15.473 | 313.0555 | C13H14O9 | Salicyl Acyl Glucuronide |
| 14.036 | 693.1954 | C34H34N2O14 | Dexylosyl Pradimicin C |
| 13.45 | 399.1213 | C15H24N2O7S | Lactacystin |
| 13.809 | 383.1269 | C49H70N14O11 | Asn Asn Asn |
| 14.694 | 535.2431 | C25H40N2O7S | Lipoxin D4 |
| 16.491 | 699.609 | C49H78O2 | 22:5 Cholesteryl Ester |
| 20.994 | 607.272 | C31H42O12 | Clerodendrin A |
| 9.857 | 437.2138 | C19H28N6O6 | Arg Asp Phe |
| 3.654 | 317.0385 | C14H17Cl3N2 | Tetrahydro-azepinoquinolines |
| 17.928 | 295.1703 | C13H23N6S | (dimethyl-[2-[(4-pyrimidin-2- ylpiperazine-1- carbothioyl)amino]ethyl]azanium) |
| 17.568 | 293.1905 | C21H25O | 2-methylbuta-1,3-diene:styrene;hydroxide |
| 18.839 | 353.2475 | C16H37N2O4S | N,N-dimethylethanamine;dodecylazanide;sulfate |
| 21.354 | 621.2868 | C27H45N2O14 | (hydrogen peroxide;4-(4- oxocyclohexyl) cyclohexan-1- one;5-(7-oxooxepan-4-yl) oxepan-2-one) urea |
| 19.724 | 393.2782 | C19H41N2O4S | 2- [(4,4-Dimethyl-2-propan-2- ylhexanoyl) amino] ethyldimethyl-(4- sulfobutyl)azanium) |
Table 2.
Percent yield of microencapsulants.
| Samples | % Yield ± SEM |
|---|---|
| A1 | 94.625 ± 0.625 |
| A2 | 92.825 ± 0.650 |
| A3 | 91.612 ± 0.637 |
| I1 | 93.887 ± 0.612 |
| I2 | 91.637 ± 0.621 |
| I3 | 89.700 ± 0.725 |
| M1 | 93.162 ± 0.662 |
| M2 | 89.875 ± 0.675 |
| M3 | 89.325 ± 0.650 |
Table 3.
Water solubility of Microencapsulants.
| Sample | % Solubility ± SEM |
|---|---|
| A1 | 98.845 ± 0.105 |
| A2 | 97.565 ± 0.105 |
| A3 | 97.130 ± 0.340 |
| I1 | 96.300 ± 0.210 |
| I2 | 95.470 ± 0.160 |
| I3 | 94.925 ± 0.105 |
| M1 | 99.475 ± 0.105 |
| M2 | 98.060 ± 0.050 |
| M3 | 97.62 ± 0.260 |
Table 4.
Microencapsulation efficiency.
| Sample | Microencapsulation Efficiency (%) |
|---|---|
| A1 | 80.09 ± 0.105 |
| A2 | 72.98 ±.0.105 |
| A3 | 63.50 ± 0.260 |
| I1 | 77.71 ± 0.050 |
| I2 | 78.24 ± 0.340 |
| I3 | 70.61 ± 0.160 |
| M1 | 75.34 ± 0.210 |
| M2 | 65.86 ± 0.340 |
| M3 | 63.50 ± 0.050 |
Table 5.
IR spectrums of microencapsulant.
| No. | Functional groups | Wave number (cm-1) | |||||||
|---|---|---|---|---|---|---|---|---|---|
| a | b | c | d | e | f | g | h | ||
| 1 | Alkane (C-H) | 2871 | 2924 | 2857 | 2928 | 2920 | 2930 | 2924 | 2990 |
| 2 | Alkene (C-H) | 887 | 985 | 933 | 909 | 920 | 915 | 913 | 913 |
| 3 | Aromatic ring (C-H) | 690-900 | 690-900 | 690-900 | 690-900 | 690-900 | 690-900 | 690-900 | 690-900 |
| 4 | Hydrogen/ phenol bonded alcohol (O-H) | 3200-3600 | 3200-3600 | 3200-3600 | 3200-3600 | 3200-3600 | 3200-3600 | 3200-3600 | 3200-3600 |
| 5 | Alkene (C=C) | 1610 | 1613 | 1631 | 1610 | 1611 | 1630 | 1632 | - |
| 6 | Aromatic ring (C=C) | 1600 | 1603 | 1602 | - | - | - | 1606 | |
| 7 | Alkyne (C≡C) | 2150 | 2112 | 2150 | - | - | - | 2120 | 2110 |
| 8 | Amine/amide (C-N) | 1349 | 1348 | 1349 | 1255 | - | - | 1263 | 1322 |
| 9 | Alcohol/ carboxylic acids /esters (C-O) | 1288 | 1288 | 1735 | - | - | - | 1076 | 1052 |
| 10 | Aldehydes/ ketones/Carboxylic acid/ester (C=O) | 1734 | 1735 | 1735 | - | - | - | 1732 | - |
(a) A1 microencapsulant; (b) I1 microencapsulant; (c) M1 microencapsulant; (d) Arabic gum; (e) inulin; (f) maltodextrin; (g) ethanol extract of sungkai leaves; (g) carboxymethylcellulose (CMC).
Table 6.
Antioxidant activity of microencapsulated.
| Sample name | IC50 (mg/L) |
|---|---|
| A1 | 121.176 |
| I1 | 124.675 |
| M1 | 139.503 |
| Extract | 65.02 |
| Ascorbic acid | 5.695 |
Table 7.
Microencapsulation Formulation.
| Sample codes | Extracts (chenchen)(g) | Aquadest (mL) | Tween- 80(chenchen)(mL) | Arabic gum (chenchen)(g) | Inulin(chenchen)(g) | Maltodextrin(chenchen)(g) | CMC (g) |
|---|---|---|---|---|---|---|---|
| A1 | 1 | 100 | 1 | 2.7 | - | - | 0.3 |
| A2 | 1 | 100 | 1 | 2.4 | - | - | 0.6 |
| A3 | 1 | 100 | 1 | 2.1 | - | - | 0.9 |
| I1 | 1 | 100 | 1 | - | 2.7 | - | 0.3 |
| I2 | 1 | 100 | 1 | - | 2.4 | - | 0.6 |
| I3 | 1 | 100 | 1 | - | 2.1 | - | 0.9 |
| M1 | 1 | 100 | 1 | - | - | 2.7 | 0.3 |
| M2 | 1 | 100 | 1 | - | - | 2.4 | 0.6 |
| M3 | 1 | 100 | 1 | - | - | 2.1 | 0.9 |
Disclaimer/Publisher’s Note: The statements, opinions and data contained in all publications are solely those of the individual author(s) and contributor(s) and not of MDPI and/or the editor(s). MDPI and/or the editor(s) disclaim responsibility for any injury to people or property resulting from any ideas, methods, instructions or products referred to in the content. |
© 2023 by the authors. Licensee MDPI, Basel, Switzerland. This article is an open access article distributed under the terms and conditions of the Creative Commons Attribution (CC BY) license (http://creativecommons.org/licenses/by/4.0/).
Copyright: This open access article is published under a Creative Commons CC BY 4.0 license, which permit the free download, distribution, and reuse, provided that the author and preprint are cited in any reuse.


