
Submitted:
27 November 2023
Posted:
28 November 2023
You are already at the latest version
Abstract
The lack of a generalizable machine learning model for predicting the safety of food for 1
human consumption is a significant challenge for policymakers and responsible authorities. This 2
study provides a step-by-step guide to predict the results of seafood product import inspections, 3
focusing on identifying and understanding the critical factors that influence these results. By compar- 4
ing the performances of an ensemble of machine learning models, this study combines the strengths 5
of multiple algorithms to improve the predictive accuracy and gain insights into the key factors 6
impacting them. The ensemble model based on the soft voting technique achieves superior perfor- 7
mance to that based on the hard voting technique in terms of the recall and area under the curve 8
(AUC) scores. The study discovered that various characteristics, such as the exporting country ratio, 9
major product category, overseas manufacturer ratio, importer ratio, and seasonal variation, had a 10
substantial influence on the models’ decisions. This research guide for predicting seafood product 11
import inspection results could pave the path for other items to follow.
Keywords:
border inspection
; decision tree
; ensemble learning
; explainable artificial intelligence
; \begin{document}
1. Introduction
Food safety is deeply affected by the diversity of foods and their raw materials. In addition, the increasing trade openness of the global economy has resulted in increased food imports, emphasizing the significance of food risk management in protecting consumer health. Predictions and early warning are crucial to ensure food safety; in particular, food inspection prior to entry into the consumer market is a significant step in ensuring good food quality. However, with the exceptions of the United States (US) and the European Union (EU), there has been little research on the use of proactive inspections for high-risk food predictions as part of the border control for imported foods. Food safety can be maintained if governmental organizations use inspections to stop the entry of products with quality issues. In recent years, many nations have incorporated big data and machine learning techniques to enhance food safety management [1]. For example, based on adulteration/fraud notifications from the European Commission’s Rapid Alert System for Food and Feed (RASFF), Bouzembrak and Marvin[2] proposed a Bayesian network model that can forecast different types of food fraud involving imported goods of well-known product categories and origins. Their model could, therefore, provide guidance for EU enforcement efforts. In addition, in Taiwan, Wu [3] adopted an ensemble model to design risk prediction models to improve border inspection methods for foods that were imported. However, it remains difficult for organizations to identify and understand the critical factors that influence the results of such inspections. Despite several studies focused on using machine learning for predicting the results of inspections, there is a lack of information regarding the model decision and explainability, such as that found in the areas of water quality [4,5] and healthcare [6,7]. In the case of seafood product consumption in South Korea, the proportion of imports to exports was reduced in 2020 compared with that in 2019, with imports falling 5.4% in comparison to 2019 [8]. This was partly attributed to quality control inspections. To give decision makers valuable insights into the quality and safety of imported seafood products, they must understand the inspection results and their potential factors. Such information can help them make informed decisions regarding imports, ensuring that only high-quality products are allowed into the market. Such information can aid in the development of problem-solving strategies and potentially increase domestic production. Thus, the current study provides a step-by-step guide for predicting seafood product import inspection results, with an emphasis on identifying and comprehending the critical factors that influence these inspection results. For this, SHapley Additive exPlanations (SHAP) was employed [9]. In addition, this study combines the strengths of multiple algorithms to improve prediction accuracy and gain insights into the key factors influencing this accuracy by comparing the performances of various ensemble machine learning models. More specifically, ensemble models based on the use of hard- and soft-voting approaches were compared. Furthermore, this study outlines the methodology, data collection process, feature selection techniques, model training, and result interpretation processes, to allow readers to replicate the analysis and gain a deeper understanding of the influential factors involved in the prediction.
2. Literature Review
2.1. Data Sampling Method
Data sampling methods are necessary in machine learning and data analysis as they allow imbalanced datasets to be addressed, wherein one class has significantly fewer instances than the others. In this study, the non-conformity class contains fewer datasets than the conformity class. Consequently, this imbalance of datasets can lead to biased model performance and poor generalization, particularly in the context of classification tasks. Data sampling methods, therefore, aim to balance the class distribution by oversampling the minority class, undersampling the majority class, or generating synthetic samples [10]. Synthetic minority oversampling (SMOTE) is a popular and effective data sampling method [11]. SMOTE works by selecting examples in a feature space that are close together, drawing a line between the examples and drawing a new sample at a point along that line. More specifically, a random example from the minority class is selected first. For this example, the k of its nearest neighbors is determined (typically, k = 5). A randomly chosen neighbor is selected, and a synthetic example is created in the feature space at a randomly chosen point between the two examples. SMOTE techniques are also known to be selective. For example, numerous SMOTE extensions exist for oversampling methods. One popular method is the borderline-SMOTE, which involves selecting misclassified instances of the minority class, such as the k-nearest neighbor (KNN) classification model [12]. Instead of randomly generating new synthetic examples for the minority class, the borderline-SMOTE method generates synthetic examples only along the decision boundary between the two classes. In addition to the KNN model, another approach known as borderline-SMOTE Support Vector Machine(SVM) or SMOTE-SVM was introduced using the SVM algorithm to identify misclassifications on the decision boundary [13].
2.2. Voting Ensemble Model
A voting ensemble (also known as a "majority voting ensemble") is a machine learning ensemble model that combines predictions from multiple models. This technique can be used to improve the model performance, ideally outperforming any single model in the ensemble. A voting ensemble combines the predictions from multiple models. This method is suitable for classification; during classification, the predictions for each label are added, and the label with the most votes is predicted [14]. Two approaches are available to predict the majority votes for classification, namely hard voting and soft voting. As shown in Figure 1, hard voting entails adding up all the predictions for each class label and predicting the class label with the most votes. Meanwhile, soft voting averages the predicted probabilities (or probability-like scores) for each class label and predicts the class label with the greatest probability [15].
2.3. Explainable Artificial Intelligence
Artificial intelligence (AI) methods have achieved unprecedented levels of performance in solving complex computational tasks, making them vital for the future development of human society. In recent years, the sophistication of AI-powered systems has increased, rendering them almost devoid of human intervention in terms of their design and deployment. However, as black-box machine learning (ML) models become increasingly used in practice, the demand for transparency has increased, and the explanations supporting the output of the model become crucial. As humans are hesitant to adopt techniques that are not directly interpretable, tractable, or trustworthy, there is a requirement for ethical AI. In addition, although it is customary to consider that focusing solely on performance leads to unclear systems, improving the understanding of a system can lead to the correction of its deficiencies. For example, enhanced interpretability can improve ML models by ensuring impartiality during decision making, thereby providing robustness by highlighting potential adversarial perturbations, and ensuring that only meaningful variables infer the output. To avoid limiting the effectiveness of current AI systems, eXplainable AI (XAI) proposes creating a suite of ML techniques that produce more explainable models while maintaining a high learning performance. XAI draws insights from the social sciences and from the psychology of explanation to encourage humans to understand, trust, and effectively manage emerging generations of AI partners [16]. Among the various XAI techniques reported to date, SHAP is a powerful and widely used technique, which provides a principled and model-agnostic approach to explain the predictions of machine-learning models. It is based on the cooperative game theory and the concept of Shapley values, which originated in the field of economics. SHAP assigns a fair and consistent contribution score to each feature in a prediction, quantifying its impact on the model’s output. The core idea behind SHAP is the consideration of all possible feature combinations and computation of the differences in predictions when a specific feature is included or excluded, thereby capturing its individual effects. By averaging these differences over all possible combinations, the SHAP values provide a global explanation for the entire dataset. Additionally, SHAP values can be applied at the individual level, offering local explanations for each prediction, thereby rendering them highly valuable for understanding model behavior on a case-by-case basis.
3. Materials and Methods
3.1. Study Process
The study process was divided into four phases, as illustrated in Figure 2. Initially, data were collected from imported food declarations, with a specific focus on seafood products. The second phase involved data preprocessing, which ensured appropriate data quality and prepared the data for model construction. This phase included feature selection for both the categorical and continuous variables to filter out any unnecessary variables. The third phase split the structured dataset into training and testing sets. The data were imbalanced; therefore, the minority class was oversampled before being fitted to the defined model for training. The models were then evaluated, and the better model was selected to perform explainable AI to determine the importance of the variables.
3.2. Data Sources
The primary data source used in this study was an imported food declaration received from the Ministry of Food and Drug Safety of South Korea [17]. The dataset consists of a comprehensive range of product information, including dates, import/export companies, detailed product specifications, import weights, distribution methods, processing results, and inspection types. The received datasets ranged from 2018 to 2021. The total dataset size was 389,389, with 388,593 and 796 samples in the non-conform classes, respectively.
3.3. Data Preprocessing
To ensure sufficient data quality and structure for training, the data preprocessing phase was divided into three essential parts, namely non-conformity rate calculations, feature engineering, and missing value imputation. Table 1 presents the data attributes and derived metrics resulting from the non-conformity rate calculations and the feature engineering process. The report receipt dates were converted into months, weeks, and seasons. Spring ranges from March to May, Summer ranges from June to August, and Winter ranges from December to February.
The hit rate of each attribute, including non-conformity, was determined based on a range of variables, including the import shipper, exporting country, continent, overseas manufacturer, exporter, major product category, sub-product category, and product name. These attributes were individually utilized to calculate their respective hit rates, providing valuable insights into the occurrence of non-conformities and irregularities associated with each specific attribute. The non-conformity rate () can be calculated using the following formula:
where N(variable) is the total number of instances in which the variable is the same as the specific value of interest (the value for which the non-conformity rate must be calculated), while N(Non-conformities of variable) is the number of instances in which the variable is the same as the specific value of interest, and represents the non-conformities. After completing the calculation and feature engineering, the missing values were input as zero.
3.4. Model Construction
3.4.1. Feature Selection
The preprocessed data were subjected to a two-stage variable selection process, in which attributes were designated for inclusion in the model construction. In the first stage, a single-factor analysis was performed to identify factors that had statistically significant relationships with conformity or non-conformity during inspections. Different statistical tests were adopted depending on the variable type. The continuous variables, such as the total net weight, were analyzed using the ANOVA test, while the remainder of the variables, namely the categorial variables, were analyzed using the chi-squared test [18].
3.4.2. Spliting of the Data into Training and Testing Datasets
To acquire the optimal models, perform model validation, and evaluate the model performance, the study data was split into two groups— 80% for training and 20% for testing. After feature selection was constructed, the historical data used for modeling were divided into the test and training datasets and were subsequently oversampled to balance the training data as shown in Figure 3. The main purpose of resampling was to enhance the discriminatory ability of the model rather than to learn erroneous samples. Moreover, the test dataset deviated from the original data if sampling was performed before splitting the data. Consequently, the model learned noise from the data, resulting in inaccurate predictions. The dataset was oversampled using SVM-SMOTE-SVM, and the resampled training dataset was employed during model training to establish the most suitable model for the testing dataset and XAI. The resampled data for training consisted of 497,425 data points for the conform class and 248,603 for the non-conform class.
3.4.3. Modelling
Four types of models, namely, Decision Tree (DT) [19], Random Forest (RF) [20], Logistic Regression[21], and Naive Bayes (NB)[22], were used to create ensemble models for model training. Because non-conformity is considered a minority class, this study used cost-sensitive learning that considers the costs of different misclassifications [23]. Using the balanced method, the class weights were inversely proportional to the class frequencies in the training dataset. Using class weights, the model learned to minimize the total cost, not just the number of misclassifications. This can be beneficial in situations where misclassification costs are unevenly distributed. As mentioned above, two types of ensemble models were used in this study, namely soft and hard voting models. The performances of the soft and hard voting models were compared using both the resampled validation and the test datasets. XAI was then used to check the feature importance of each model (i.e., DT, RF, LR, and NB).
3.4.4. Model Evaluation
The model effects were measured and validated using a confusion matrix and model predictive performance indicators to select the optimal model and evaluate its performance. A confusion matrix was structured using the entries listed in Table 2, and the necessary predictive performance indicators were calculated using the numbers of true positives (TP), false positives (FP), true negatives (TN), and false negatives (FN). Predictive performance indicators included the area under the curve (AUC), the positive predictive value (PPV) (also known as precision), the F1 score, the recall, and the accuracy (ACR), which are defined in detail below.
- The accuracy rate (ACR) evaluates the model’s overall capacity to differentiate between conformity and non-conformity samples or the ability to accurately classify samples as conformity. However, owing to the lower proportion of non-conformities in our data, there was an imbalance in the samples considered herein. Because of its higher capacity for discriminating conformities, ACR may show bias in predicting conformities. To overcome this problem, the recall and PPV indicators have received greater attention during the evaluation of model performance. The ACR can be calculated using (2):
- The recall or sensitivity is the proportion of samples correctly labeled as non-conformity out of all non-conformity samples, as shown in (3):
- The positive predictive value (PPV), also known as precision, is the proportion of samples that the model classifies as non-conformity out of all samples, and is otherwise referred to as the non-conformity rate. The PPV can be calculated using (4):
- The F1 score, defined as the harmonic mean of the recall and PPV indicators, becomes crucial when dealing with imbalanced data. Higher TP values correlate with higher F1 scores, and the F1 score can be calculated using (5):
- The model’s classification accuracy can be measured from the area under the receiver operating characteristic (ROC) curve (AUC), wherein a larger AUC denotes a higher accuracy. More specifically, AUC = 1 represents a great classifier, 0.5 < AUC < 1 represents a model that outperforms random guessing, AUC = 0.5 represents a model that is similar to random guessing but lacks classification capacity, and AUC < 0.5 represents a classifier that performs worse than random guessing. According to the explanation above, recall and AUC scores play an important role in the model evaluation. The higher scores show that the higher chance model can correctly identify the non-conformity class.
3.5. Explainable AI
To understand the decisions made by the models, the Shapley approach was employed to determine features having a larger effect on the model’s prediction of conformity or non-conformity. Shapley is a widely used interpretability technique that assigns importance values to each feature based on its impact on the model’s predictions. By analyzing these important values, this study aims to gain insights into the underlying factors driving the model’s conformity or non-conformity predictions. In addition, this approach allows researchers to identify potential biases or inconsistencies in the decision-making process of a model. This study explored all models incorporated into the ensemble models to determine the common importance features. By comparing the important features across all ensemble models, this study aimed to identify features that consistently had a significant impact on the model’s predictions. This analysis provided a more robust understanding of the key factors driving the decision-making process of the model, whilst also helping validate the reliability of the ensemble models.
4. Results
4.1. Comparisions of the Ensemble Model Performance
Four different models, namely NB, DT, RF, and LR models, stacked together with class-weight cost-sensitive learning, were used to create both hard-voting and soft-voting ensemble models. These models were applied to forecast the inspection outcome after training and were used to predict the test data. The testing dataset contained 778,78 points of data consisting of 176 non-conformity classes and 77,702 non-conformity classes. Table 3 lists the performances of the various ensemble models.
With 75.57% of the votes, the soft voting method outperformed the hard voting method (44.32% of the votes) in terms of the recall score. In addition, soft voting received a higher AUC score of 87.49%, whereas hard voting only received a score of 72.07%. While soft voting received 99.35% in terms of its ACR score, hard voting received a slightly higher 99.69%. A similar result was observed for the PPV score, with hard voting receiving 35.62% of the vote and soft voting receiving 22.32%. Furthermore, hard voting received a higher F1 score of 39.49% than 34.46% for soft voting. These results indicate that overall, the soft voting method exhibited a superior performance in terms of the recall and AUC scores, while the hard voting method outperformed the soft voting method in terms of the ACR, PPV, and F1 scores. The goal of this study was to determine the best combination of recall and AUC scores to accurately detect non-conformity data, and based on this goal, soft voting produced superior results in predicting the inspection results. It therefore appears that soft voting is a suitable approach for accurately detecting non-conformity data and predicting inspection results with high recall and AUC scores.
4.2. Identification of the Importance of Features Using XAI
The SHAP values of each model used in the ensemble model were calculated to assess the significance of the features in model decision-making. Subsequently, the frequently prioritized attributes that influenced the model classification were identified. However, SHAP values are designed to work with additive models, such as linear models and tree-based models (e.g., decision trees, random forests, and gradient boosting machines). As the importance of the various features in these models is clearly defined, SHAP can provide thorough explanations for each prediction. Meanwhile, the NB model is a probabilistic classification algorithm built on the Bayes theorem and based on the assumption of feature independence. The term "naive" describes the belief that each feature is conditionally independent of the feature assigned a class label [24]. Consequently, different scores were obtained. Thus, the SHAP values presented in Figure 4a were used to calculate the feature importance, which corresponds to the DT model. The rank of each feature’s influence on the model is represented by the feature importance plots shown in Figure 4b,d, which correspond to the RF and LR models, respectively. In addition, the influence-scaled score from each feature and class is represented by the heatmap produced for the NB model (see Figure 4c). The data presented in Figure 4 clearly demonstrate that the features with a greater influence on a model’s choice include the exporting country ratio, the major category, the overseas manufacturer ratio, and the importer ratio. This suggests that the decision made by the model is more influenced by features with higher values. Furthermore, the NB model (Figure 4c) shows that the non-conformity decision of the model is highly dependent on the week and month of the year, the middle category of the product name and its ratio, the overseas manufacturer and importer, the exporting company, the product name and its ratio, and the export country. These factors play crucial roles in determining the non-conformity decisions made by the NB model. By considering various aspects, such as the week and month of the year, any potential seasonal variations that may impact product conformity were also considered. Moreover, factors such as the middle category of the product name and its ratio, overseas manufacturer, importer, exporting company, product name and its ratio, and the exporting country allow the analysis of the various dimensions that could contribute to non-conformity.
5. Discussion
In this study, four different models were employed, namely the NB, DT, RF, and LR models, which were stacked together using class-weight cost-sensitive learning to create both hard voting and soft voting ensemble models. These models were applied to forecast inspection outcomes after training, and their performances were evaluated by using the test dataset. Table 3 summarizes the performance metrics of the models. Among the two ensemble methods, soft voting outperformed hard voting in terms of the recall score, receiving 75.57% of votes compared to the hard voting method’s 44.32%. Additionally, the soft voting method achieved a higher AUC score of 87.49%, whereas the hard voting method obtained a score of 72.07%. However, hard voting achieved better results in terms of the ACR (99.69%, c.f., 99.35% for soft voting). Similarly, hard voting outperformed soft voting in the PPV and F1 scores, with scores of 35.62 and 39.49%, respectively; soft voting obtained scores of 22.32 and 34.46%, respectively. These findings suggest that the soft voting method performed better than the hard voting method in terms of the recall and AUC scores, thereby indicating that the soft voting ensemble is more effective in correctly identifying non-conformity data and predicting inspection outcomes. Thus, the soft voting approach may be more suitable in cases where the recall and AUC scores are more critical than the PPV and ACR scores. To gain insight into the decision-making process of each model in the ensemble, SHAP values were calculated for all models. Feature importance analysis using the SHAP values demonstrated that certain features had a significant influence on the model’s decision-making process. Notably, features such as the exporting country ratio, major product category, overseas manufacturer ratio, and importer ratio showed greater influence on the model decisions. These findings suggest that the decision-making processes of these models are affected considerably by higher feature values. Furthermore, analysis of the NB model revealed that several features played crucial roles in determining the non-conformity decisions. These influential features included the week and month of the year, the middle category of the product name and its ratio, the overseas manufacturer, the importer, the exporting company, the product name and its ratio, and the exporting country. The consideration of the week and month of the year by the NB model also indicates its sensitivity to potential seasonal variations that may affect product non-conformity. Moreover, the consideration of various dimensions, such as the middle category of the product name, the overseas manufacturer, the importer, the exporting company, the product name, and the exporting country, provides a comprehensive analysis of the factors contributing to non-conformity decisions.
6. Conclusions
In this study, the significant challenge of the lack of a generalizable machine learning model for predicting food safety during importing was addressed. The study focused on the prediction of seafood product import inspection results to identify and understand the critical factors that influence inspection outcomes. By comparing the performance of an ensemble of machine learning models, the strengths of multiple algorithms were combined to improve the predictive accuracy and gain insight into the key factors affecting inspections. Using four different models stacked together along with class-weight, cost-sensitive learning, both hard- and soft-voting ensemble models were created. After training and evaluating these models, it was found that the soft voting technique outperformed the hard voting method in terms of the recall and area under the curve (AUC) scores. The findings indicated that the soft voting ensemble method produced better performance in correctly identifying non-conformity data and predicting inspection outcomes when the recall and AUC scores are the most important. To gain a deeper insight into the decision-making process for each model, the SHapley Additive exPlanations (SHAP) values were calculated for all models. The analysis revealed that certain features significantly influenced the decisions made by the models. Furthermore, analysis of the SHAP values of the Naive Bayes (NB) model provided valuable information regarding the crucial factors contributing to non-conformity decisions. Thus, by considering various dimensions and potential seasonal variations, the NB model appeared to provide a more comprehensive analysis for identifying non-conformity. In the future, feature engineering techniques to create new relevant features, fine-tune the model hyperparameters, and increase the diversity of the ensemble models should be explored. Cross-validation techniques can also be used to validate the model performance and prevent overfitting, whereas data augmentation techniques could be employed to increase the size and diversity of the training dataset. Furthermore, collaboration with domain experts will provide valuable insights into feature selection, model design, and interpretation, leading to more accurate and reliable predictions. Overall, the described step-by-step guide for predicting the results of seafood product import inspections and the comparative analysis of different ensemble models provide valuable resources for policymakers and authorities. The described findings offer acceptable predictive accuracy and a deeper understanding of the influential factors that could support informed decision-making and enhance food safety before importing into the market.
Author Contributions
Conceptualization, formal analysis, writing—original draft preparation, visualization, software, S.K. ; conceptualization, project administration, K.-H.L; supervision, W.-S.C. All authors have read and agreed to the published version of the manuscript.
Funding
This research was supported by a grant (21163MFDS517-1) from the Ministry of Food and Drug Safety in 2023.
Institutional Review Board Statement
Not applicable
Informed Consent Statement
Not applicable
Data Availability Statement
The data presented in this study are available on request from the corresponding author. The data are not publicly available due to concerns related to the protection of participant privacy and confidentiality.
Acknowledgments
We would like to thank Editage (www.editage.co.kr) for English language editing.
Conflicts of Interest
The authors declare no conflict of interest
References
- Marvin, H.J.; Janssen, E.M.; Bouzembrak, Y.; Hendriksen, P.J.; Staats, M. Big data in food safety: An overview. Critical reviews in food science and nutrition 2017, 57, 2286–2295. [Google Scholar] [CrossRef] [PubMed]
- Bouzembrak, Y.; Marvin, H.J. Prediction of food fraud type using data from Rapid Alert System for Food and Feed (RASFF) and Bayesian network modelling. Food Control 2016, 61, 180–187. [Google Scholar] [CrossRef]
- Wu, L.Y.; Weng, S.S. Ensemble learning models for food safety risk prediction. Sustainability 2021, 13, 12291. [Google Scholar] [CrossRef]
- Park, J.; Lee, W.H.; Kim, K.T.; Park, C.Y.; Lee, S.; Heo, T.Y. Interpretation of ensemble learning to predict water quality using explainable artificial intelligence. Science of the Total Environment 2022, 832, 155070. [Google Scholar] [CrossRef] [PubMed]
- Hellen, N.; Sabuj, H.H.; Ashraful Alam, M. Explainable AI and Ensemble Learning for Water Quality Prediction. Proceedings of International Conference on Information and Communication Technology for Development: ICICTD 2022; Springer, 2023; pp. 235–250. [Google Scholar]
- Gong, H.; Wang, M.; Zhang, H.; Elahe, M.F.; Jin, M. An explainable AI approach for the rapid diagnosis of COVID-19 using ensemble learning algorithms. Frontiers in Public Health 2022, 10, 874455. [Google Scholar] [CrossRef] [PubMed]
- Saraswat, D.; Bhattacharya, P.; Verma, A.; Prasad, V.K.; Tanwar, S.; Sharma, G.; Bokoro, P.N.; Sharma, R. Explainable AI for healthcare 5.0: opportunities and challenges. IEEE Access 2022. [Google Scholar] [CrossRef]
- Ji-hyun, J.L. Last year, seafood exports increased by 5.85.4. Available online: https://www.foodnews.co.kr/news/articleView.html?idxno=72633 (accessed on 26 July 2023).
- Lundberg, S.M.; Lee, S.I. A unified approach to interpreting model predictions. Advances in neural information processing systems 2017, 30. [Google Scholar]
- Kotsiantis, S.; Kanellopoulos, D.; Pintelas, P.; others. Handling imbalanced datasets: A review. GESTS international transactions on computer science and engineering 2006, 30, 25–36. [Google Scholar]
- Chawla, N.V.; Bowyer, K.W.; Hall, L.O.; Kegelmeyer, W.P. SMOTE: synthetic minority over-sampling technique. Journal of artificial intelligence research 2002, 16, 321–357. [Google Scholar] [CrossRef]
- Han, H.; Wang, W.Y.; Mao, B.H. Borderline-SMOTE: a new over-sampling method in imbalanced data sets learning. In International conference on intelligent computing; Springer, 2005; pp. 878–887. [Google Scholar]
- Nguyen, H.M.; Cooper, E.W.; Kamei, K. Borderline over-sampling for imbalanced data classification. International Journal of Knowledge Engineering and Soft Data Paradigms 2011, 3, 4–21. [Google Scholar] [CrossRef]
- Bamhdi, A.M.; Abrar, I.; Masoodi, F. An ensemble based approach for effective intrusion detection using majority voting. TELKOMNIKA (Telecommunication Computing Electronics and Control) 2021, 19, 664. [Google Scholar] [CrossRef]
- Brownlee, J. Ensemble Learning Methods for Deep Learning Neural Networks - MachineLearningMastery.com — machinelearningmastery.com. Available online: https://machinelearningmastery.com/ensemble-methods-for-deep-learning-neural-networks/ (accessed on 26 July 2023).
- Arrieta, A.B.; Díaz-Rodríguez, N.; Del Ser, J.; Bennetot, A.; Tabik, S.; Barbado, A.; García, S.; Gil-López, S.; Molina, D.; Benjamins, R.; others. Explainable Artificial Intelligence (XAI): Concepts, taxonomies, opportunities and challenges toward responsible AI. Information fusion 2020, 58, 82–115. [Google Scholar] [CrossRef]
- Ministry of Food and Drug Safety. Available online: https://impfood.mfds.go.kr/ (accessed on 26 July 2023).
- St, L.; Wold, S.; others. Analysis of variance (ANOVA). Chemometrics and intelligent laboratory systems 1989, 6, 259–272. [Google Scholar]
- Myles, A.J.; Feudale, R.N.; Liu, Y.; Woody, N.A.; Brown, S.D. An introduction to decision tree modeling. Journal of Chemometrics: A Journal of the Chemometrics Society 2004, 18, 275–285. [Google Scholar] [CrossRef]
- Rigatti, S.J. Random forest. Journal of Insurance Medicine 2017, 47, 31–39. [Google Scholar] [CrossRef] [PubMed]
- LaValley, M.P. Logistic regression. Circulation 2008, 117, 2395–2399. [Google Scholar] [CrossRef] [PubMed]
- Sammut, C.; Webb, G.I. Encyclopedia of machine learning. Springer Science & Business Media, 2011. [Google Scholar]
- Ling, C.X.; Sheng, V.S. Cost-sensitive learning and the class imbalance problem. Encyclopedia of machine learning 2008, 2011, 231–235. [Google Scholar]
- Rish, I.; others. An empirical study of the naive Bayes classifier. IJCAI 2001 workshop on empirical methods in artificial intelligence; 2001; 3, pp. 41–46.
Figure 1.
Voting ensemble techniques explanation: (a) Hard voting and (b) soft voting.
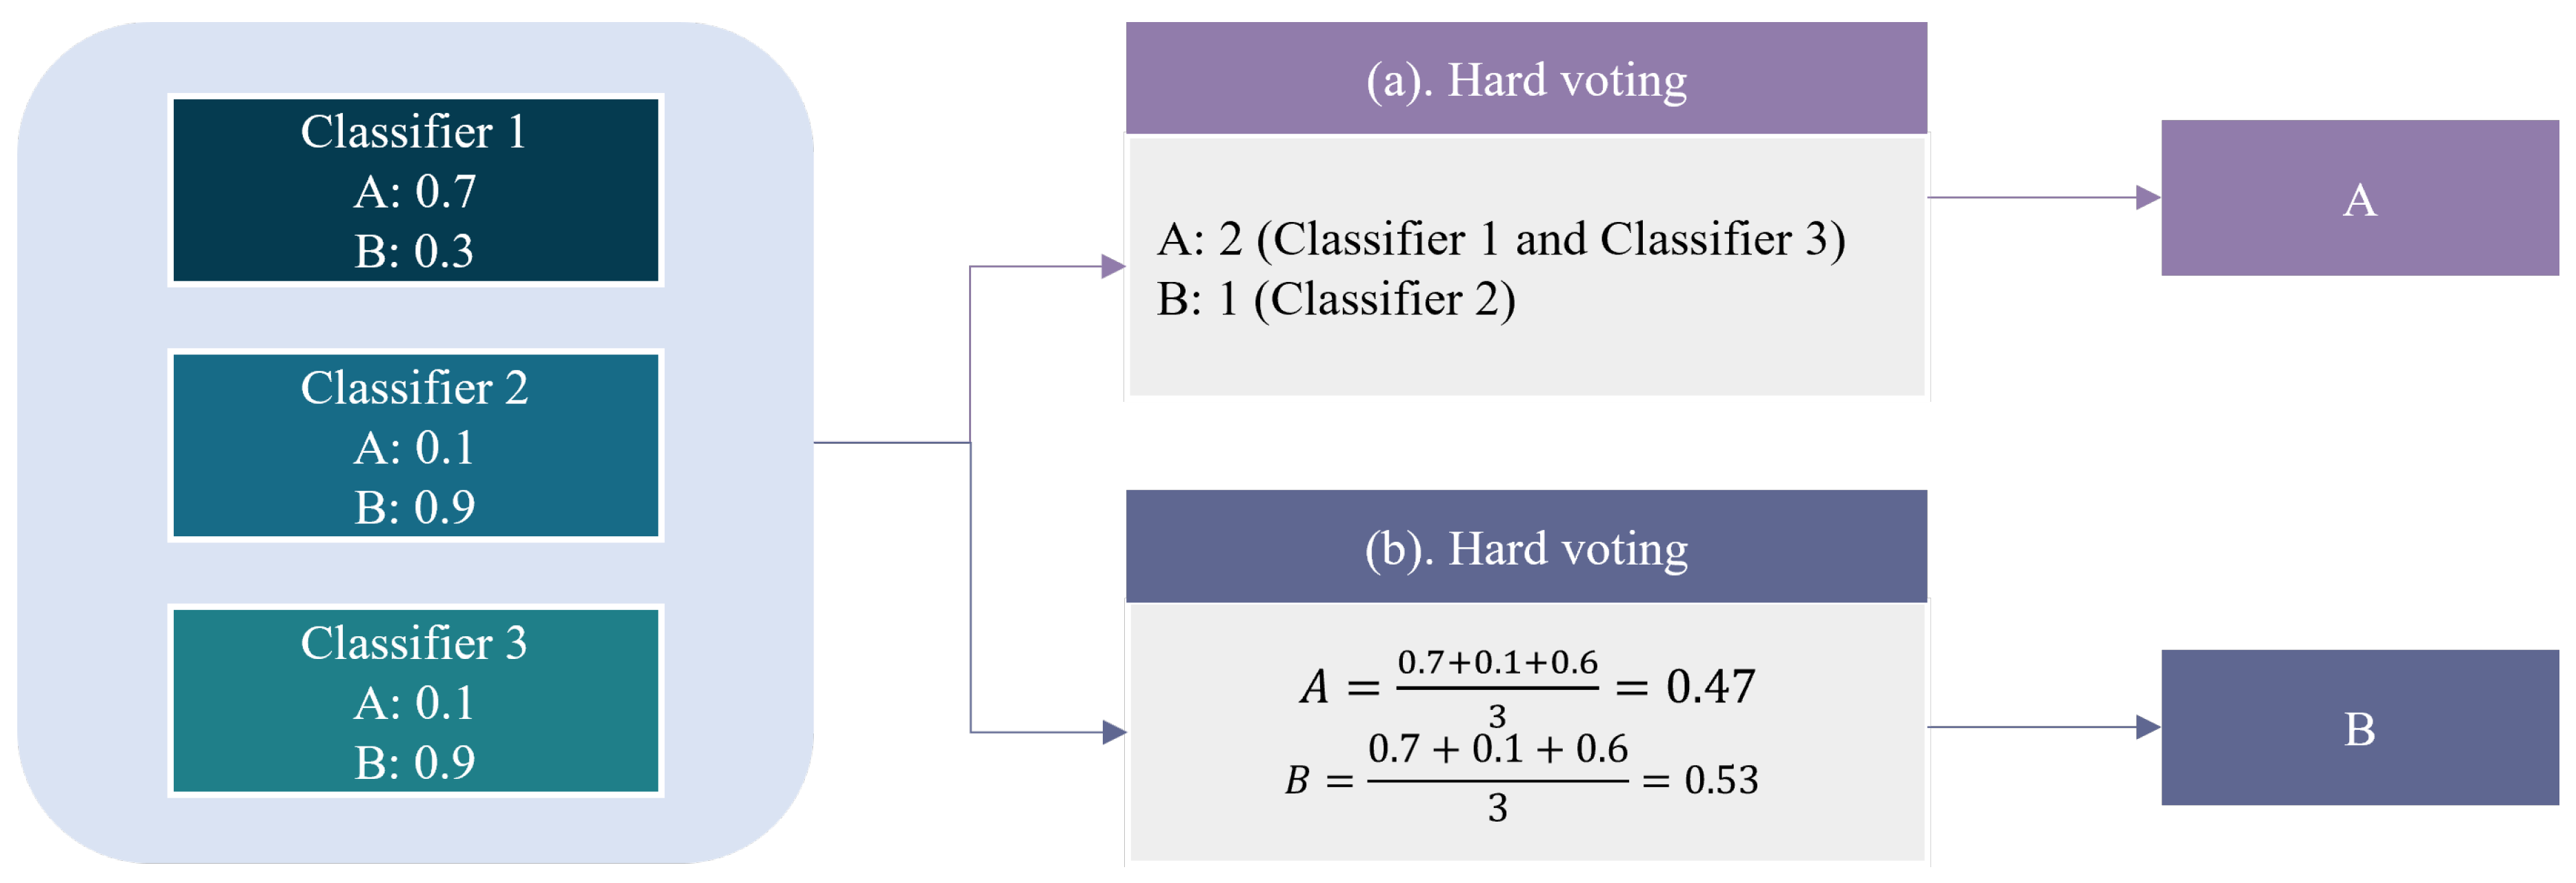
Figure 2.
The whole study process which includes four phases. Machine learning models use in the study are Decision Tree (DT), Random Forest (RF), Logistic Regression (LR), and the Naive Bayes (NB).
Figure 2.
The whole study process which includes four phases. Machine learning models use in the study are Decision Tree (DT), Random Forest (RF), Logistic Regression (LR), and the Naive Bayes (NB).
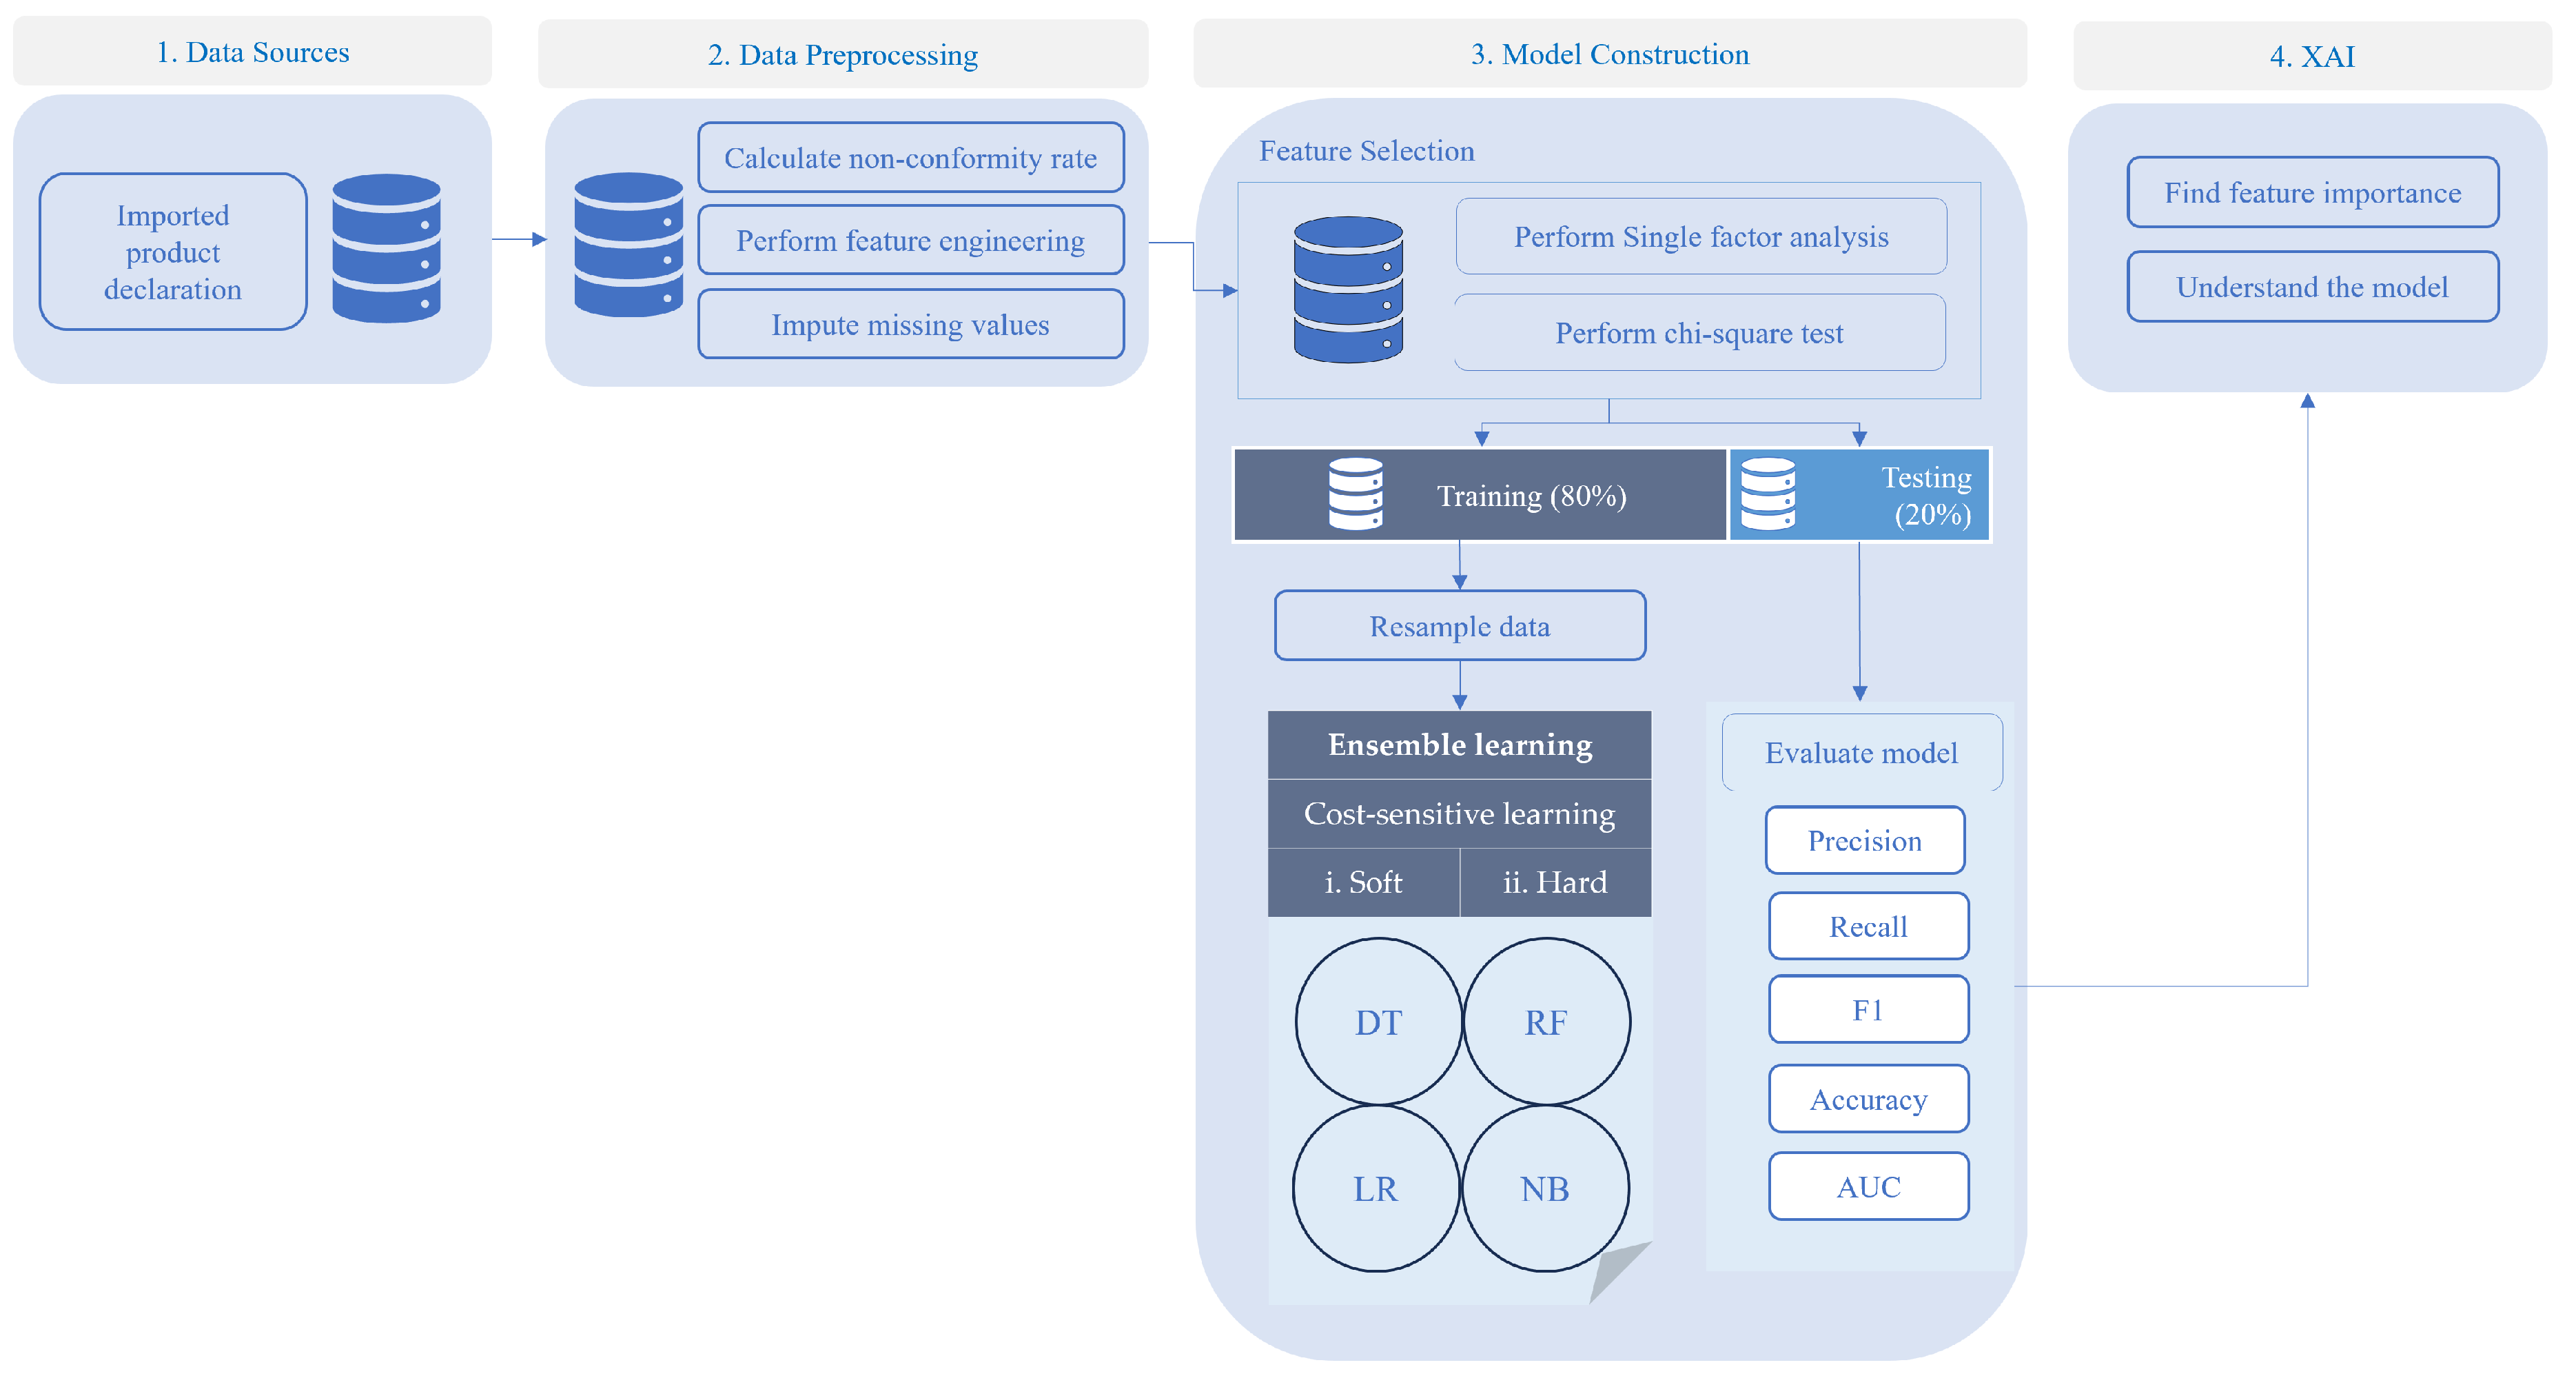
Figure 3.
Flowchart for the prediction model.
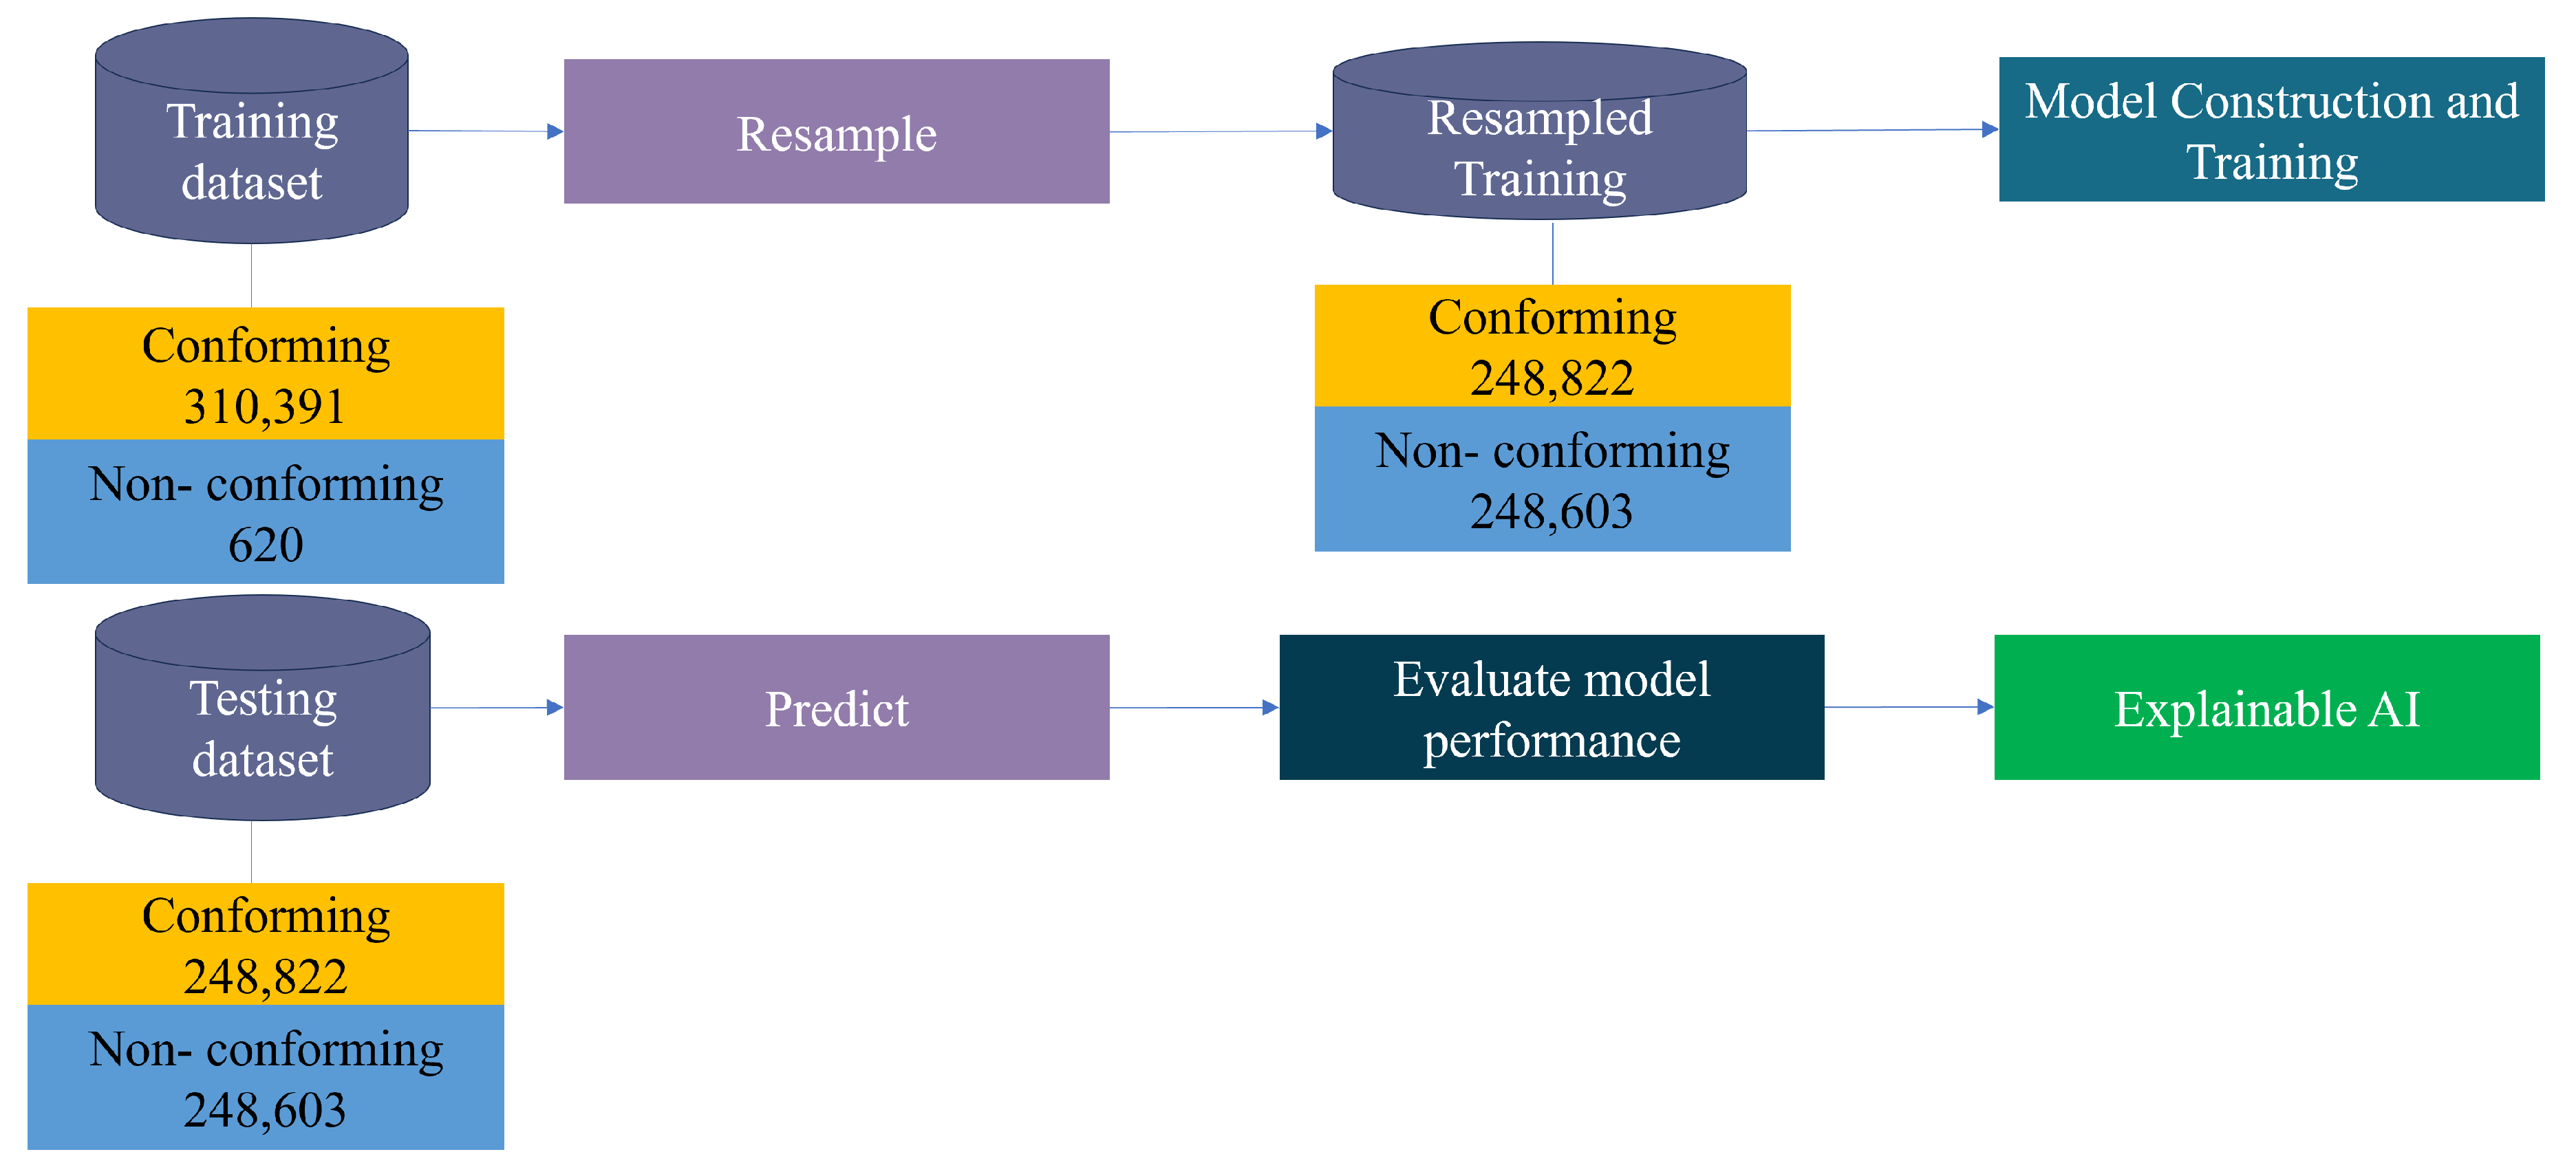
Figure 4.
SHAP values of the importance feature scores of the various models. (a) Importance features of the DT model, (b) importance features of the RF model, (c) importance features of the NB model, and (d) importance features of the LR model.
Figure 4.
SHAP values of the importance feature scores of the various models. (a) Importance features of the DT model, (b) importance features of the RF model, (c) importance features of the NB model, and (d) importance features of the LR model.
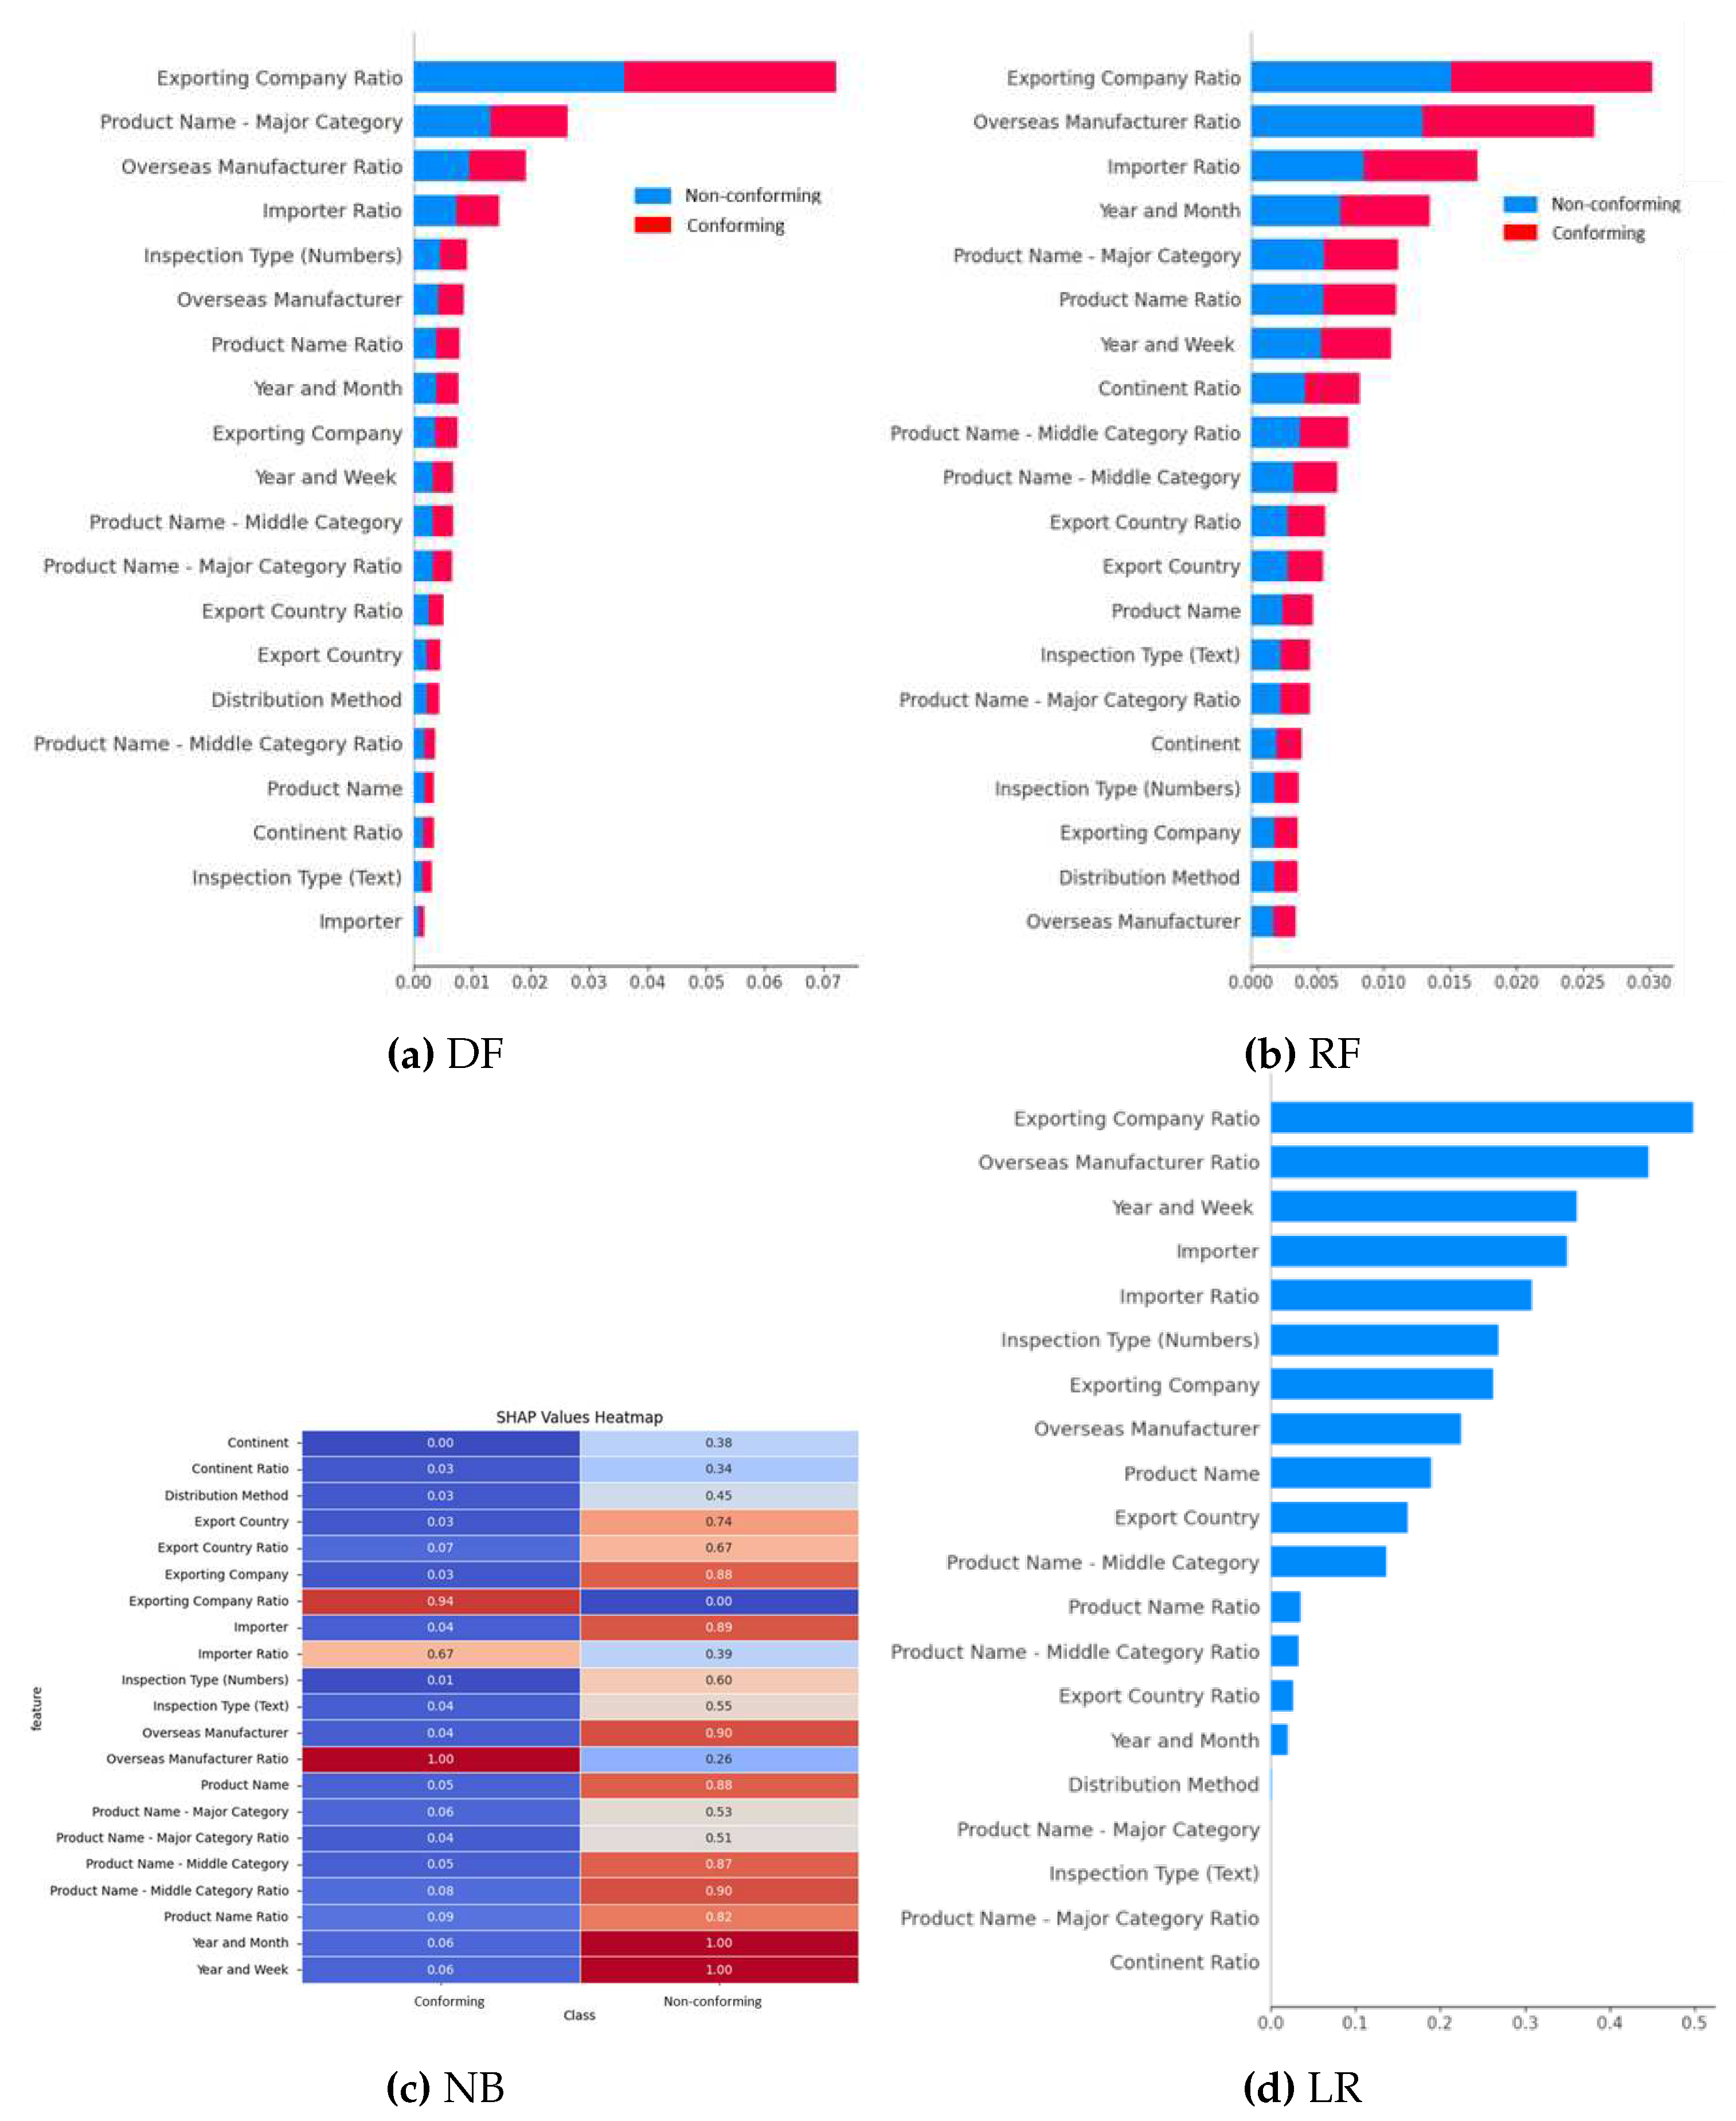

Table 1.
Description of Variables
| Original Variable | Derived Variable | Description |
|---|---|---|
| Receipt date | Month | Represents the year and month when the report was received. |
| Week | Represents the year and week when the report was received. | |
| Season | Spring, Summer, Fall, or Winter. | |
| Import Shipper | Import Shipper | The importer. |
| Import Shipper Failed Ratio | The previous failed ratio of the relevant importer. | |
| Exporting Country | Exporting Country | The country from which the product is being exported. |
| Continent | The continent of the exporting country. | |
| Exporting Country Failed Ratio | The previous failed ratio of the relevant exporting country. | |
| Continent Failed Ratio | The previous failed ratio of the relevant continent. | |
| Overseas Manufacturer | Overseas Manufacturer | The foreign company responsible for producing the goods. |
| Overseas Manufacturer Failed Ratio | The previous failed ratio of the relevant overseas manufacturer. | |
| Exporter | Exporter | The company or party that is responsible for exporting the goods from the originating country. |
| Exporter Ratio | The previous failed ratio of the relevant exporter. | |
| Major Product Category | Major Product Category | The major product category of the goods. |
| Major Product Category Failed Ratio | The previous failed ratio of the relevant major product category. | |
| Sub Product Category | Sub Product Category | The sub-product category of the goods. |
| Sub Product Category Ratio | The previous failed ratio of the relevant sub-product category. | |
| Product Name | Product Name | The specific name or description of the products being imported/exported. |
| Product Name Failed Ratio | The previous failed ratio of the relevant product name. | |
| Keywords | Search product name & non-conformity keywords. | |
| Total Net Weight | Total Net Weight | The total net weight of the products being imported/exported. |
| Distribution Method | Distribution Method | The distribution method. |
| Type of Inspection | Type of Inspection | The type of inspection conducted on the products. |
| Processing Result | Processing Result | The outcome or result of the inspection of the shipment. |
Table 2.
Definitions of Entry Types in the Confusion Matrix
| Entry Type | Definition |
|---|---|
| True Positive (TP) | Predicted inspection result for the product by model classification: non-conformity; actual inspection result: non-conformity |
| False Positive (FP) | Predicted inspection result for the product batch by model classification: non-conformity; actual inspection result: conformity |
| True Negative (TN) | Predicted inspection result for the product batch by model classification: conformity; actual inspection result: conformity |
| False Negative (FN) | Predicted inspection result for the product by model classification: conformity; actual inspection result: non-conformity |
Table 3.
Performances of the Ensemble Models
| Voting Method | ACR | Recall | PPV | F1 | AUC | TN | FP | TP | FN |
|---|---|---|---|---|---|---|---|---|---|
| Soft Voting | 99.35% | 75.57% | 22.32% | 34.46% | 87.49% | 77,239 | 463 | 133 | 43 |
| Hard Voting | 99.69% | 44.32% | 35.62% | 39.49% | 72.07% | 77,561 | 141 | 78 | 98 |
Disclaimer/Publisher’s Note: The statements, opinions and data contained in all publications are solely those of the individual author(s) and contributor(s) and not of MDPI and/or the editor(s). MDPI and/or the editor(s) disclaim responsibility for any injury to people or property resulting from any ideas, methods, instructions or products referred to in the content. |
© 2023 by the authors. Licensee MDPI, Basel, Switzerland. This article is an open access article distributed under the terms and conditions of the Creative Commons Attribution (CC BY) license (http://creativecommons.org/licenses/by/4.0/).
Copyright: This open access article is published under a Creative Commons CC BY 4.0 license, which permit the free download, distribution, and reuse, provided that the author and preprint are cited in any reuse.


