1. Introduction
Vibration monitoring has been an integral practice in assessing the health of rotating machinery and industrial processes for decades. Among various applications of vibration-based damage detection, monitoring rotating machinery has stood out as one of the most mature and successful endeavors [
1]. While the field of anomaly detection boasts an array of complex methodologies and advanced algorithms, it is crucial not to overlook the simplicity and efficiency embodied in the Random Forest (RF) model.
In recent years, the machining industry has increasingly turned to vibration monitoring to evaluate machine health and optimize processes [
2]. The vibrations emitted by machinery serve as early indicators, empowering operators to make critical decisions during machining operations or even before their commencement [
3]. Yet, the challenge of chatter, a disruptive self-excited vibration occurring between the tool and the workpiece, has persisted in machining for over a century [
4]. Chatter results in suboptimal surface finishes, reduced material removal rates, and potential damage to both machine tools and workpieces [
5].
Our research offers a fresh perspective on this age-old problem: the power of a meticulously designed RF classification model, emphasizing simplicity, as an effective alternative. This model can be easily comprehended and swiftly deployed on the shop floor.
This study makes a distinct contribution to the ongoing research in machining by exploring the potential of vibration-based features combined with time-series features as classifiers for the identification and prediction of chatter in machining processes. In a landscape where intricate methods dominate, our research boldly champions the idea of harnessing the straightforward RF classification model. Building on the foundation laid by Shevchik et al. in their predictive application of random forest models [
6], we acknowledge the existence of more advanced methodologies. However, our emphasis lies in demonstrating that the dependable RF model can yield remarkable results, especially in industrial settings where accessibility, speed, and interoperability are paramount. In an era that prizes computational speed and practicality, our research sets out to prove that innovation does not always necessitate complexity.
This perspective aligns chatter, a fault detectable through vibration data, with conventional fault diagnosis techniques, which typically entail feature extraction and fault identification [
7]. Although a range of signal processing techniques, including statistical analysis [
8], Fast Fourier Transforms (FFT) [
9], wavelet packet transform (WT) [
10], empirical mode decomposition (EMD) [
11], and sparse representation methods [
12], have been proposed for feature extraction, these methods often require substantial prior knowledge and may have limitations in complex, dynamic working environments.
Our research seeks to bridge the gap between advanced theory and practical application. By demonstrating that a simplified RF model can effectively classify chatter, we aspire to make this valuable tool more accessible to machinists and industry professionals. This approach retains the merits of precision and reliability while streamlining the process, reducing the reliance on extensive computational resources and specialized expertise.
In the subsequent sections, we delve into the methodology, experimental results, and implications of our findings. While the chatter detection field has seen the advent of more complex techniques, we argue that simplicity, as exemplified in the "keep it simple" approach, can be a form of sophistication that catalyzes broader applicability and accelerates progress in the machining industry.
1.1. Feature Extraction Approaches
In recent years, several feature extraction methods have emerged for predicting chatter in boring and milling operations. These methods can be categorized into traditional techniques, advanced methods, and specific applications.
1.1.1. Traditional Feature Extraction Methods
Traditional methods, including Autocorrelation (AC), Power Spectral Density (PSD), and Fast Fourier Transform (FFT), have been widely employed for vibration data analysis. FFT, in particular, is a common choice for analyzing data from rotating assets and detecting defects, misalignment, and looseness. However, traditional methods often face challenges related to their ability to handle non-stationary and complex signals.
Researchers have also explored combining multiple traditional feature extraction methods. For instance, Yesilli et al. utilized coordinated peaks in AC, PSD, and FFT plots as features for chatter classification in turning [
13]. However, determining which peaks are meaningful in FFT can be challenging due to signal variability across different machine setups and machining parameters.
1.1.2. Advanced Feature Extraction Techniques
In recent years, various feature extraction methods have been proposed for the prediction of chatter in the process of boring. Li et al. proposed an Empirical Mode Decomposition (EMD) based method, which involves decomposing vibration signals into intrinsic mode functions (IMFs) and determining feature vectors for the IMFs [
14]. Chen and Zheng used a Support Vector Machine (SVM) combined with Recursive Feature Extraction for the detection of chatter in milling operations [
15]. Both methods have been found to be effective but may contain inefficiencies, such as manual pre-processing required to identify informative decompositions [
16,
17].
Additional studies have leveraged advanced techniques such as stacked denoising autoencoders, entropy, and coarse-grained information for feature extraction in machining and grinding [
18,
19]. Li et al. combined multiscale power spectral entropy (MPSE), multiscale permutation entropy (MPE), and Laplacian scores for chatter prediction in milling operations [
20]. While these methods offer potential advantages, they also present challenges, including parameter selection and computational complexity.
1.1.3. Specific Application Cases
In the specific application of detecting issues with rotating assets, Aslan and Altinas proposed the use of FFT and spectral data for online chatter detection from spindle drive motor data [
21]. However, FFT’s assumptions of signal stationarity and linearity can limit its accuracy in real-world vibration signals that often contain non-stationary and transient events.
1.1.4. Challenges and Limitations
Each feature extraction method comes with its own set of challenges, including parameter selection, sensitivity to noise, and interpretation of results. Additionally, scalability issues can arise when analyzing large datasets with numerous features.
In the subsequent sections, we will present our proposed approach to overcome these challenges in vibration analysis of milling operations. Our method aims to harness the simplicity and efficiency of the Random Forest model while addressing the limitations of existing feature extraction techniques.
1.2. Approach and Research Contributions
In this study, we present a simple, yet innovative approach for predicting chatter in milling operations, capitalizing on the strengths of simulated data, advanced time-series feature extraction using FFT data features, and the simplicity and effectiveness of a random forest (RF) classification model. Our primary contribution lies in showcasing the utility of simulated data as a potent tool to overcome the limitations often encountered with small real-world datasets, resulting in a versatile chatter detection model applicable across various machining scenarios. By incorporating FFT vibration data features, we harness a well-established and industry-recognized method.
1.2.1. Leveraging Simulated Vibration Data
Our approach distinguishes itself by harnessing the power of simulated vibration data. This novel strategy obviates the need for resource-intensive and time-consuming real-world data collection, a common hurdle in previous studies. Moreover, our model’s adaptability extends beyond specific machining configurations, offering the capability to extrapolate to diverse setups. This work builds upon the foundation laid by prior research, such as the investigations conducted by Yesilli and Khasawneh, which employed traditional feature extraction techniques like FFT, autocorrelation, and power spectral density [
22].
1.2.2. Streamlined Feature Selection for Enhanced Model Efficiency
While earlier studies employed a range of features, including FFT, MPSE, MPE, or Laplacian scores, we streamline our approach by focusing solely on FFT and time-series data features. This strategic simplification aims to address the challenges associated with feature selection in chatter classification models. By reducing the feature set, we enhance the model’s comprehensibility, trim computational demands, and mitigate the risk of overfitting to the training data. This reduction aligns with our goal of achieving model generalizability, a principle emphasized by Jia et al. [
23].
1.2.3. Experimental Validation
In this section, we outline our experimental setup and the validation process for assessing the efficacy of our RF model in classifying chatter in machining processes. We describe the simulated data generation process and explain how this synthetic dataset emulates real-world machining conditions. We also detail the metrics and criteria we will employ to evaluate the performance of our RF model, including accuracy, precision, recall, and F1 score.
In summary, our study presents an efficient and versatile approach to chatter prediction, empowered by simulated data, FFT feature extraction, and the RF classification model. By emphasizing simplicity and feature selection precision, we not only advance the field of chatter detection but also offer a practical tool with broad applicability, simplified interpretability, and enhanced generalizability, thus addressing the current limitations and complexities inherent in the domain.
2. Materials and Methods
In this study, we introduce an innovative methodology for predicting chatter in milling operations, integrating simulated vibration data generated during milling with state-of-the-art time-series feature extraction techniques, primarily focusing on FFT data features, and employing a random forest (RF) model for classification. Our primary objective is to showcase the potential of simulated data in circumventing the limitations often associated with small real-world datasets, thereby producing a versatile chatter detection model applicable across a wide range of milling scenarios. By leveraging time series and FFT vibration data features, we harness a well-recognized and industry-accepted approach.
2.1. Cross-Validation Techniques and Dataset Size Importance
To ensure the robustness and reliability of our predictive model, we implemented cross-validation techniques, including k-fold cross-validation, which has been widely recognized for its benefits in assessing model performance. Cross-validation allows us to rigorously evaluate our model’s performance by partitioning the data into training and testing subsets multiple times, thereby reducing the risk of overfitting and providing a more comprehensive understanding of its predictive capabilities.
Additionally, we acknowledge the critical role of dataset size in machine learning model performance. Large and diverse datasets play a pivotal role in enhancing the model’s ability to generalize its predictions. The extensive dataset used in this study, along with the exclusion of the extrapolated data from the training set, reinforces the model’s potential to excel across a broad spectrum of machining scenarios.
2.2. Leveraging Simulated Vibration Data
A cornerstone of our approach is the utilization of simulated vibration data, a departure from resource-intensive and time-consuming real-world data collection. This innovative strategy ensures the development of a robust classifier model while also confirming adaptability to various machining configurations. Our work builds upon prior studies, such as those conducted by Yesilli and Khasawneh, which employed traditional feature extraction tools, including FFT, auto-correlation, and power spectral density [
18].
2.3. Data Description and Dataset Division
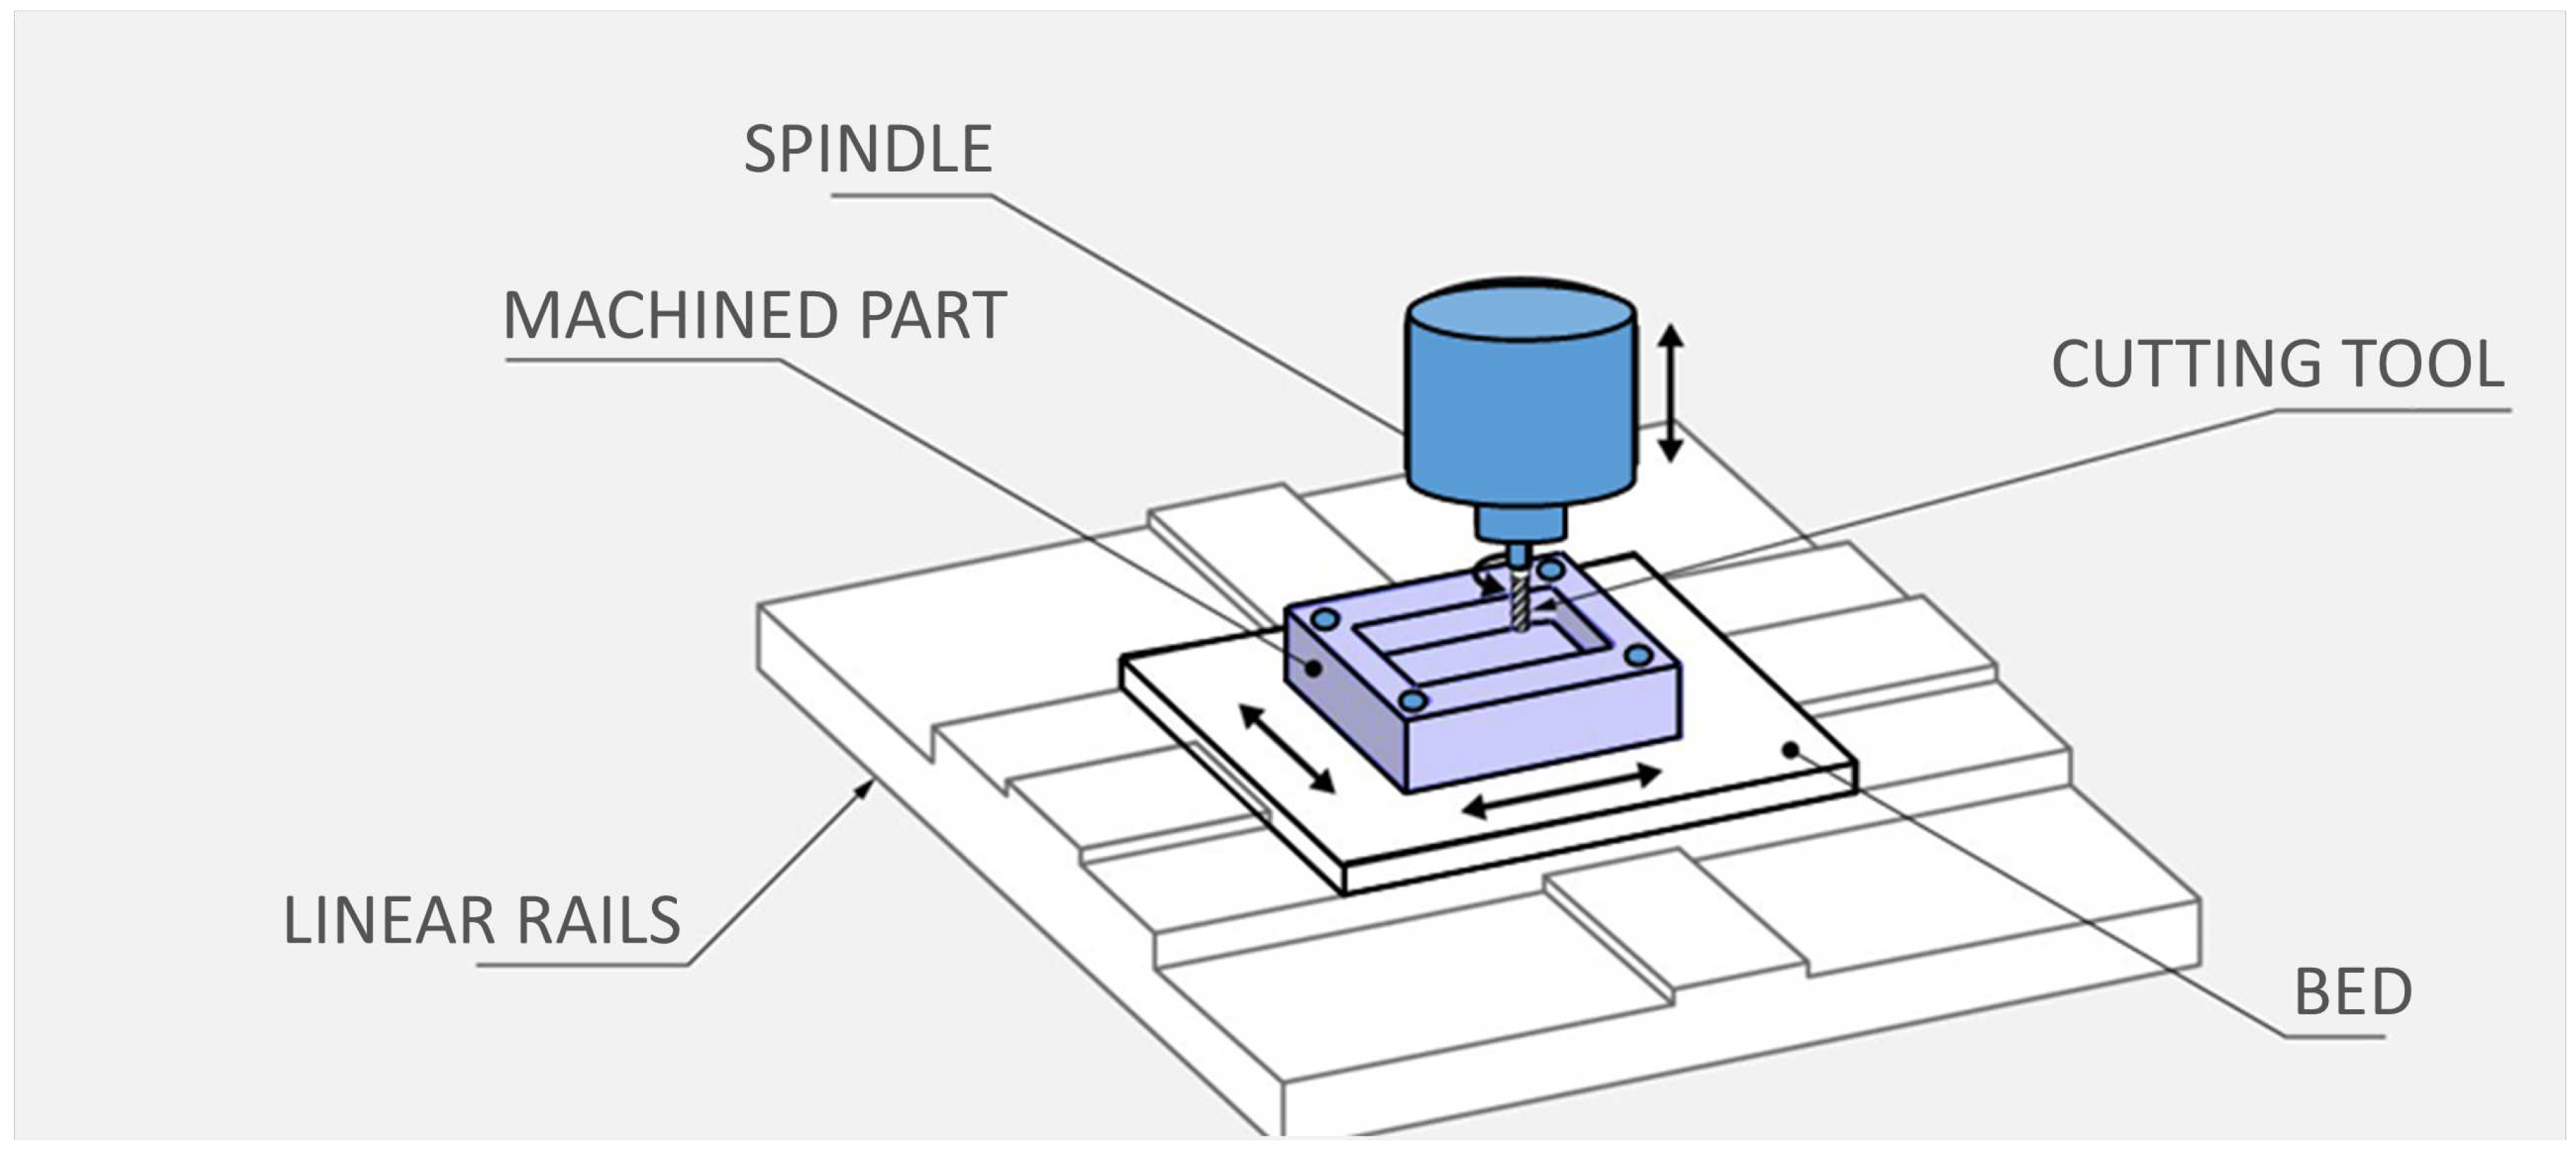
Our data source comprises simulated vibration data generated from a machining simulation model developed by Schmitz and Smith [
5]. This simulation closely emulates the conditions of a single milling machine, as seen in
Figure 1.
Figure A1 and
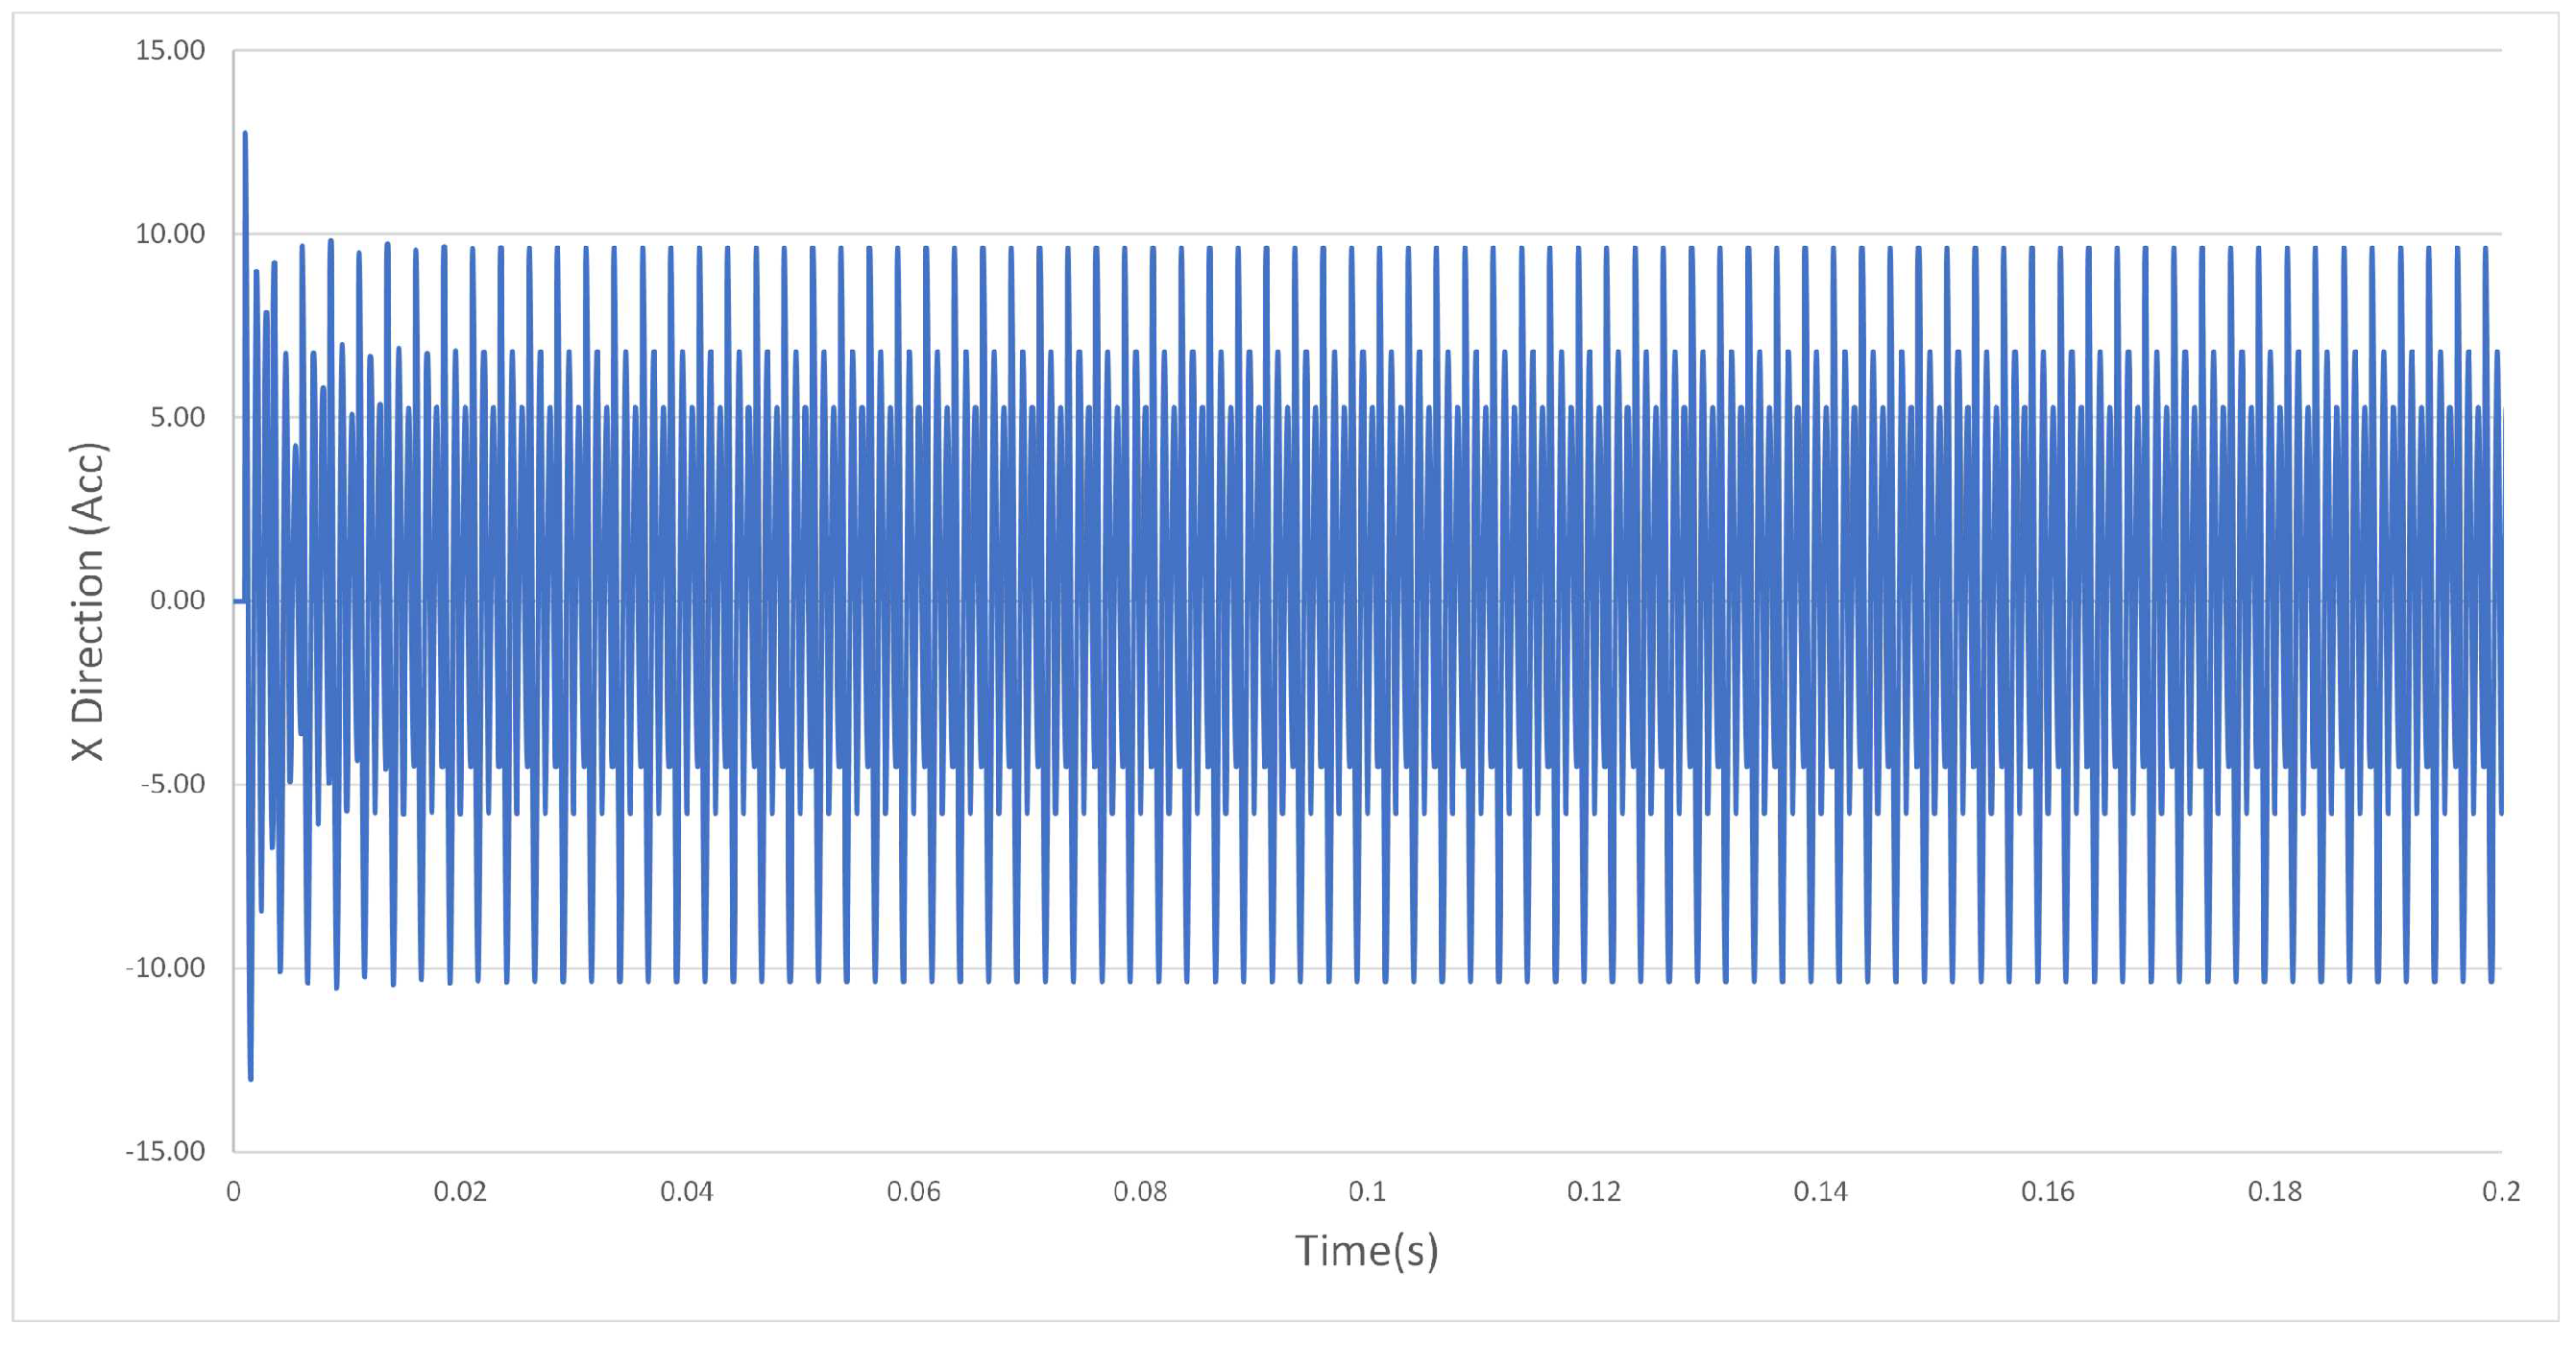
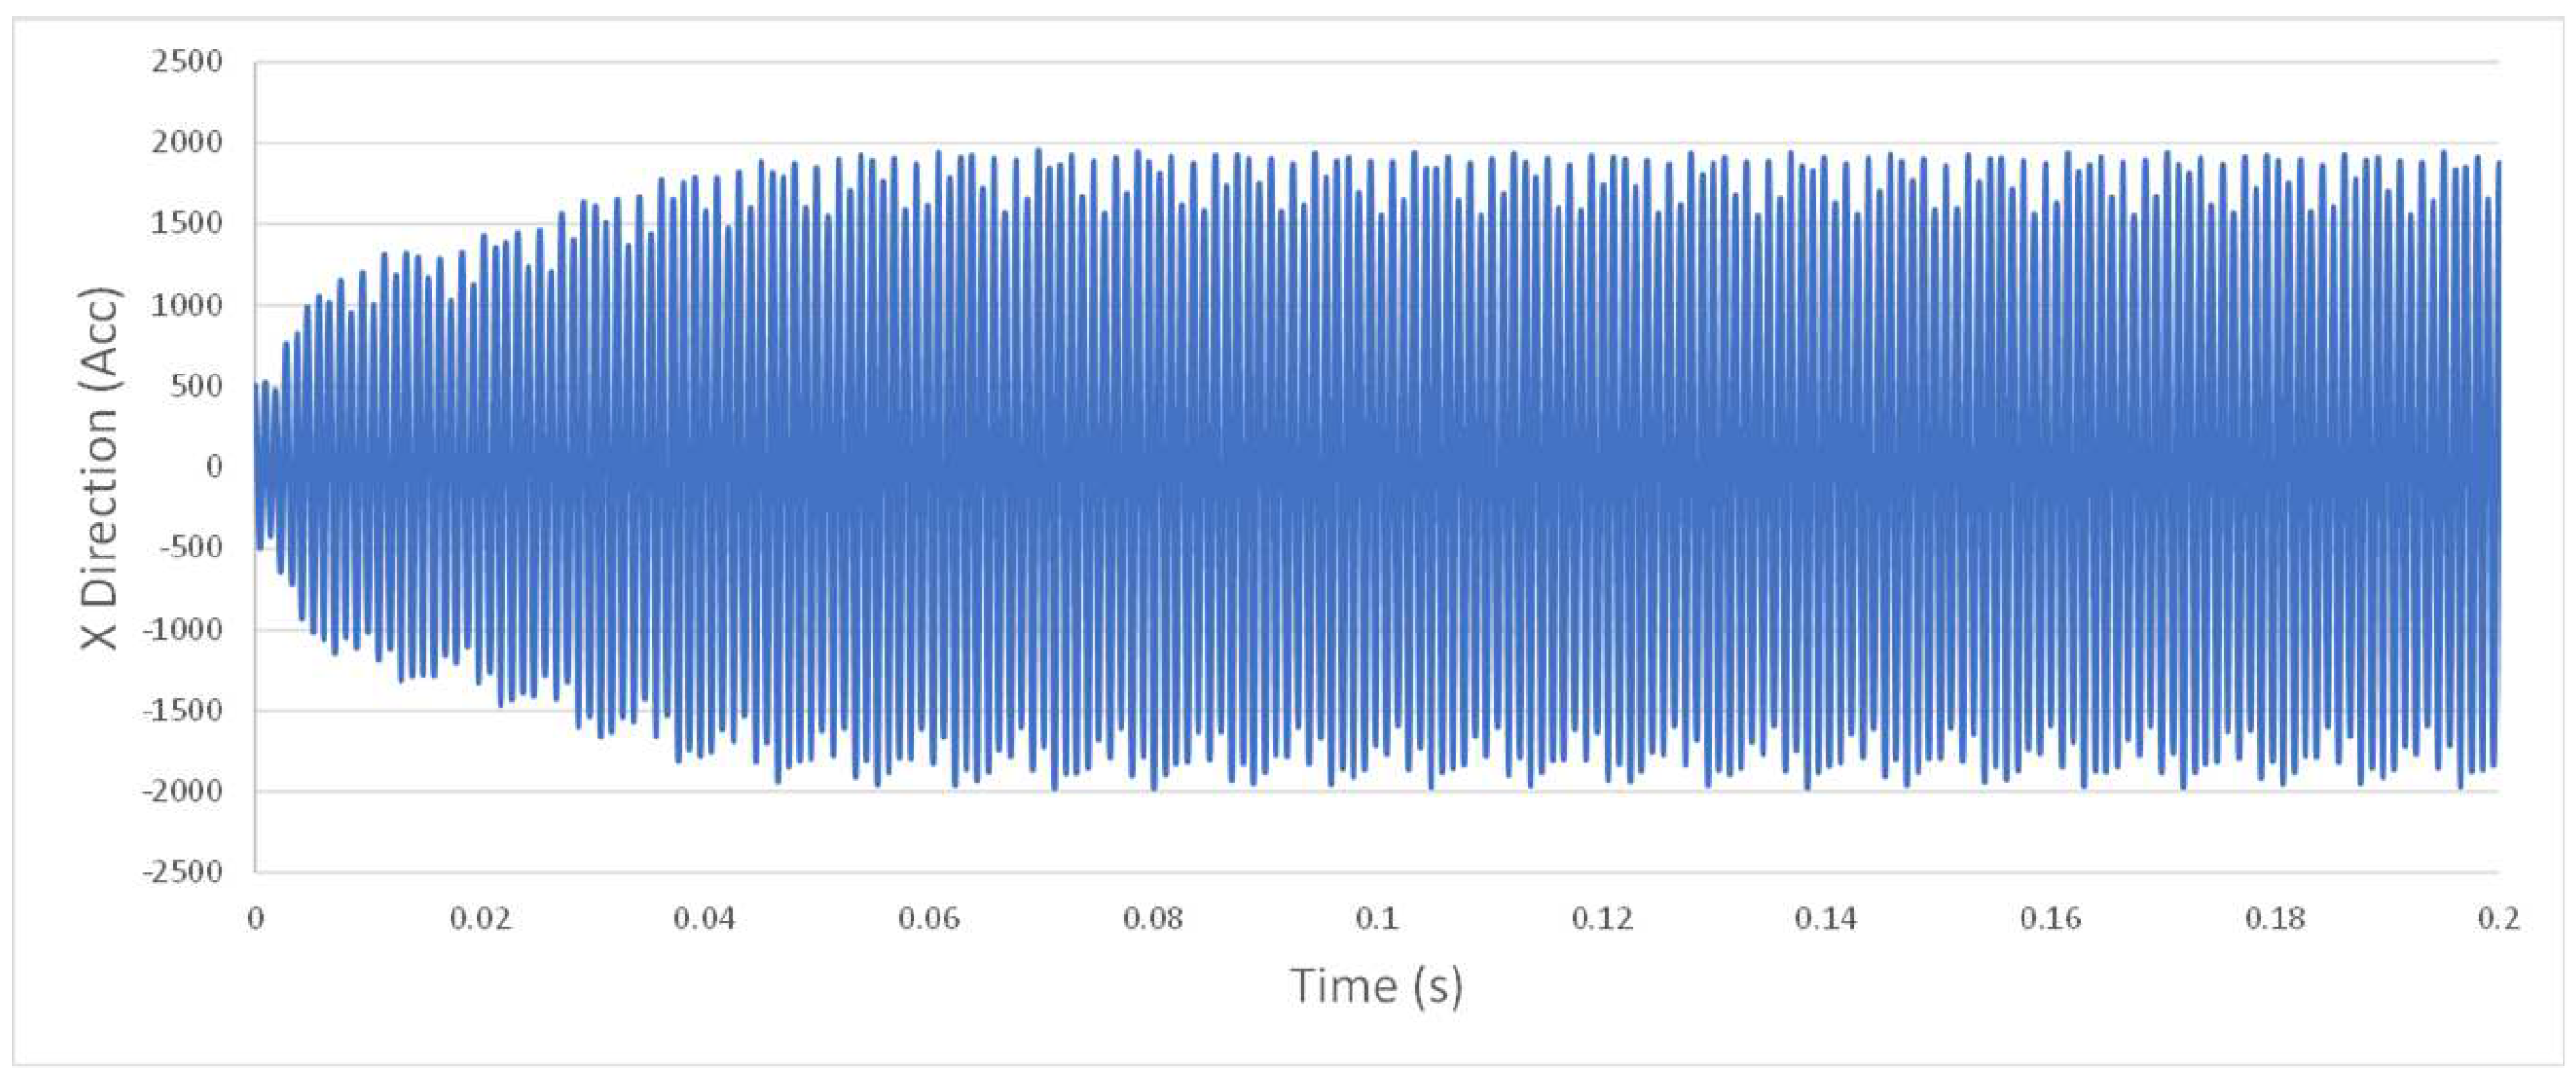
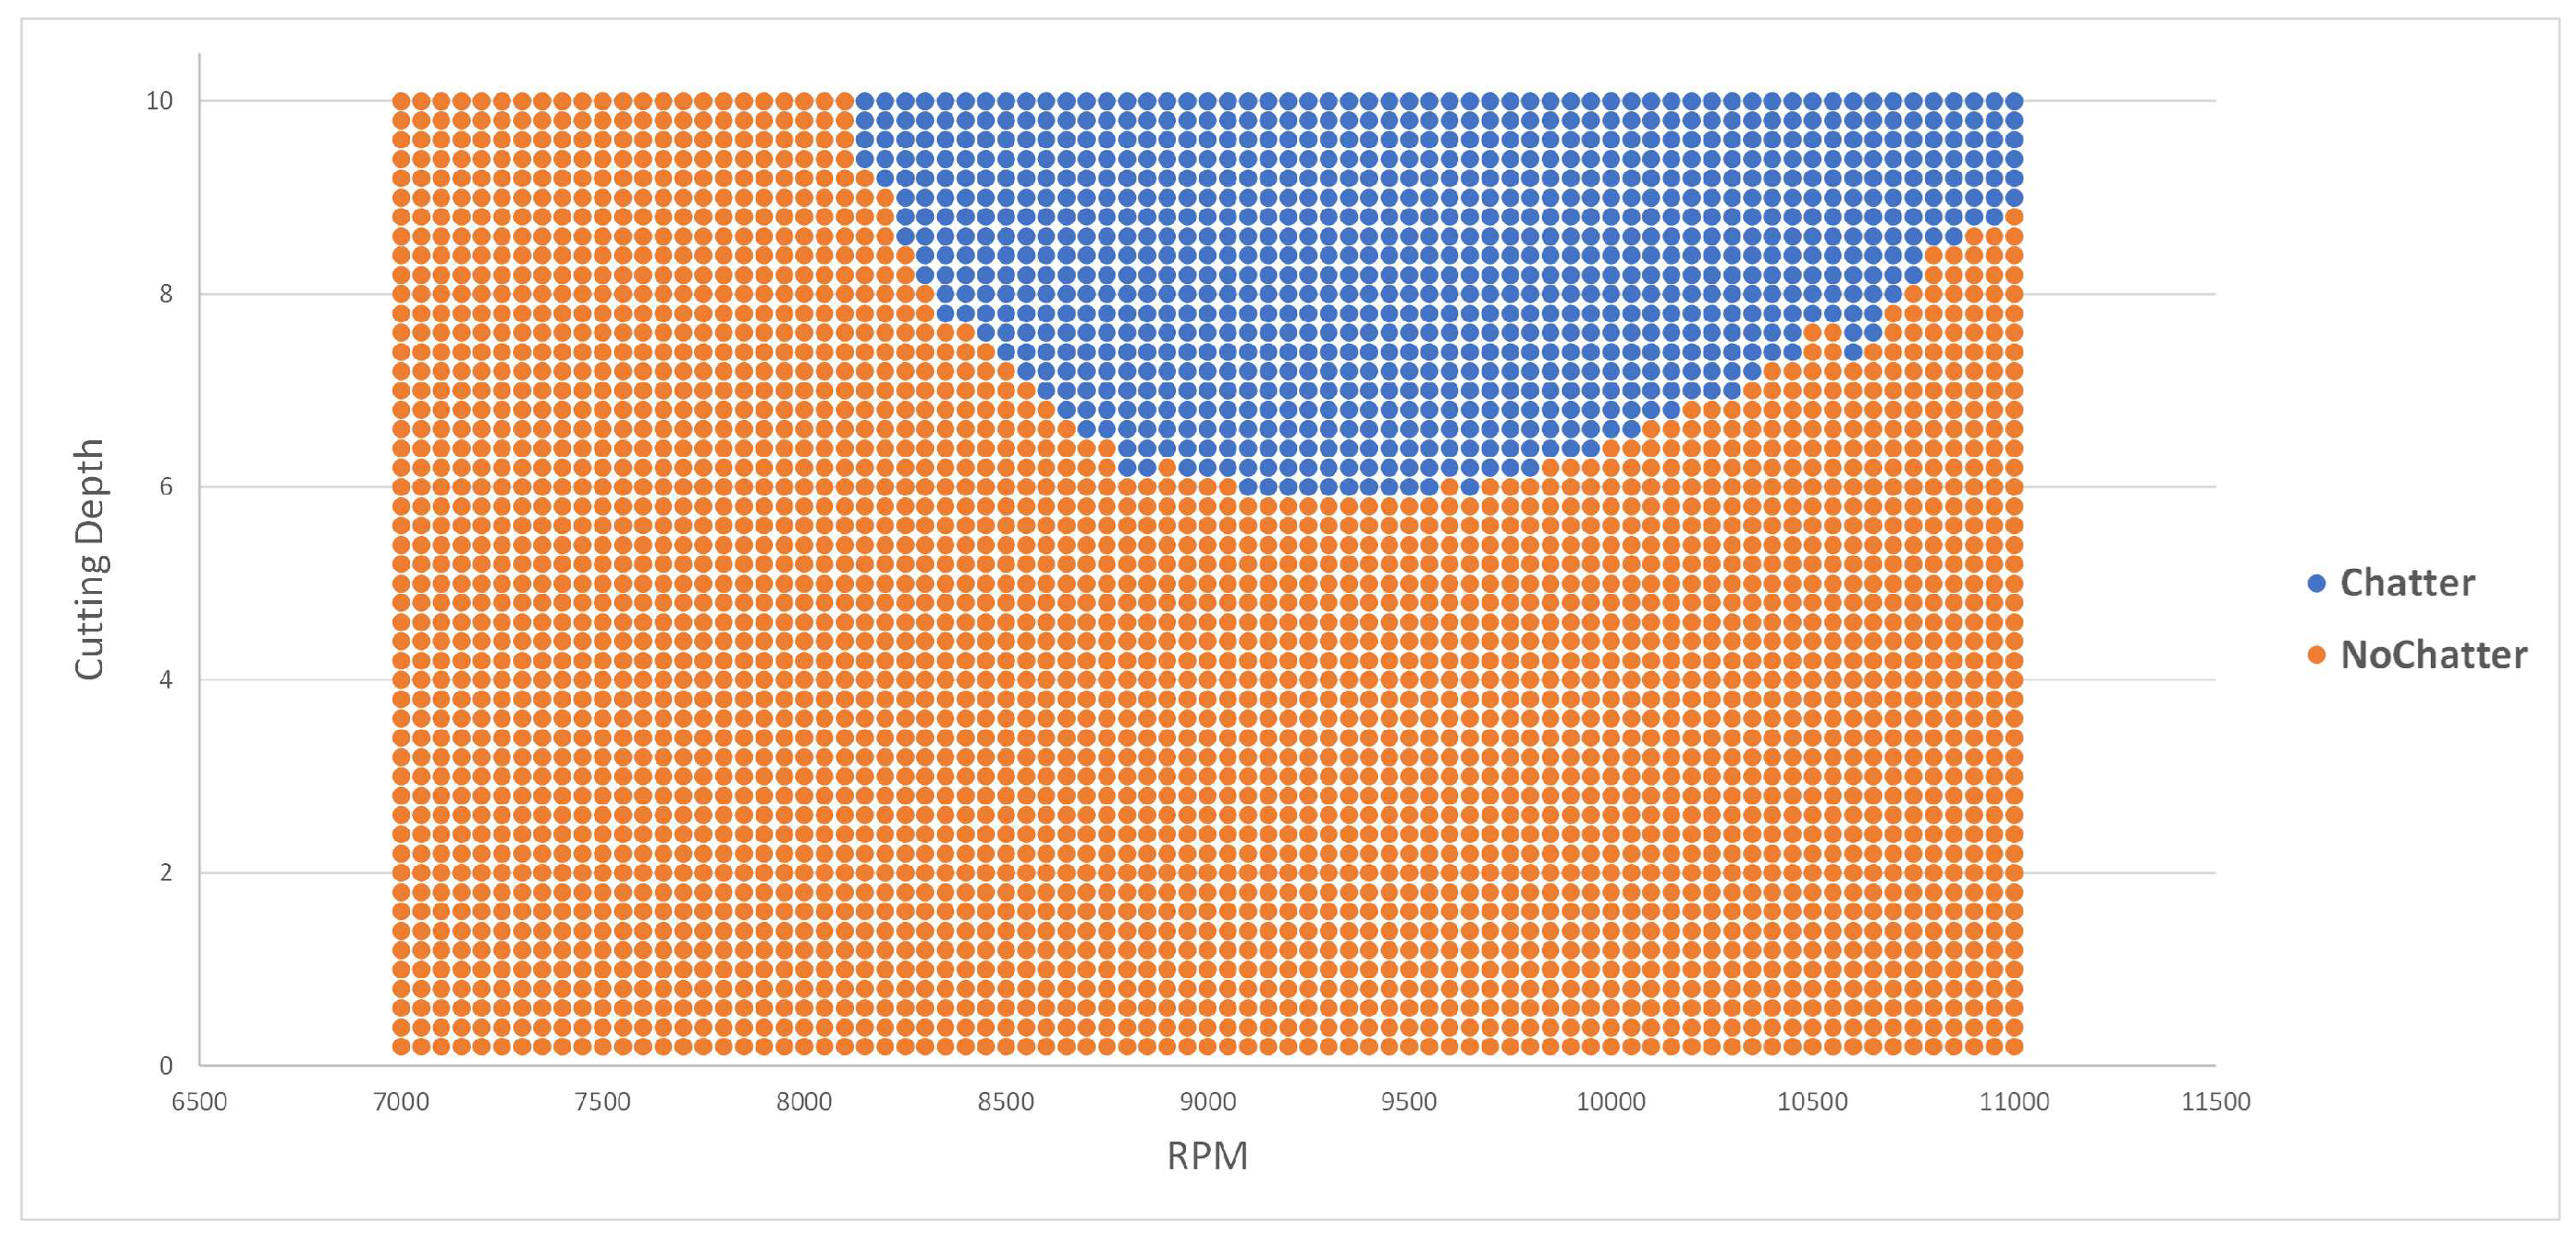
Figure A2 provide a visual representation of the raw vibration acceleration data for data sets with and without chatter. Notably, the most significant difference observed in the raw acceleration data between these two scenarios is the tenfold decrease in acceleration values during chatter. Furthermore,
Figure A3 and
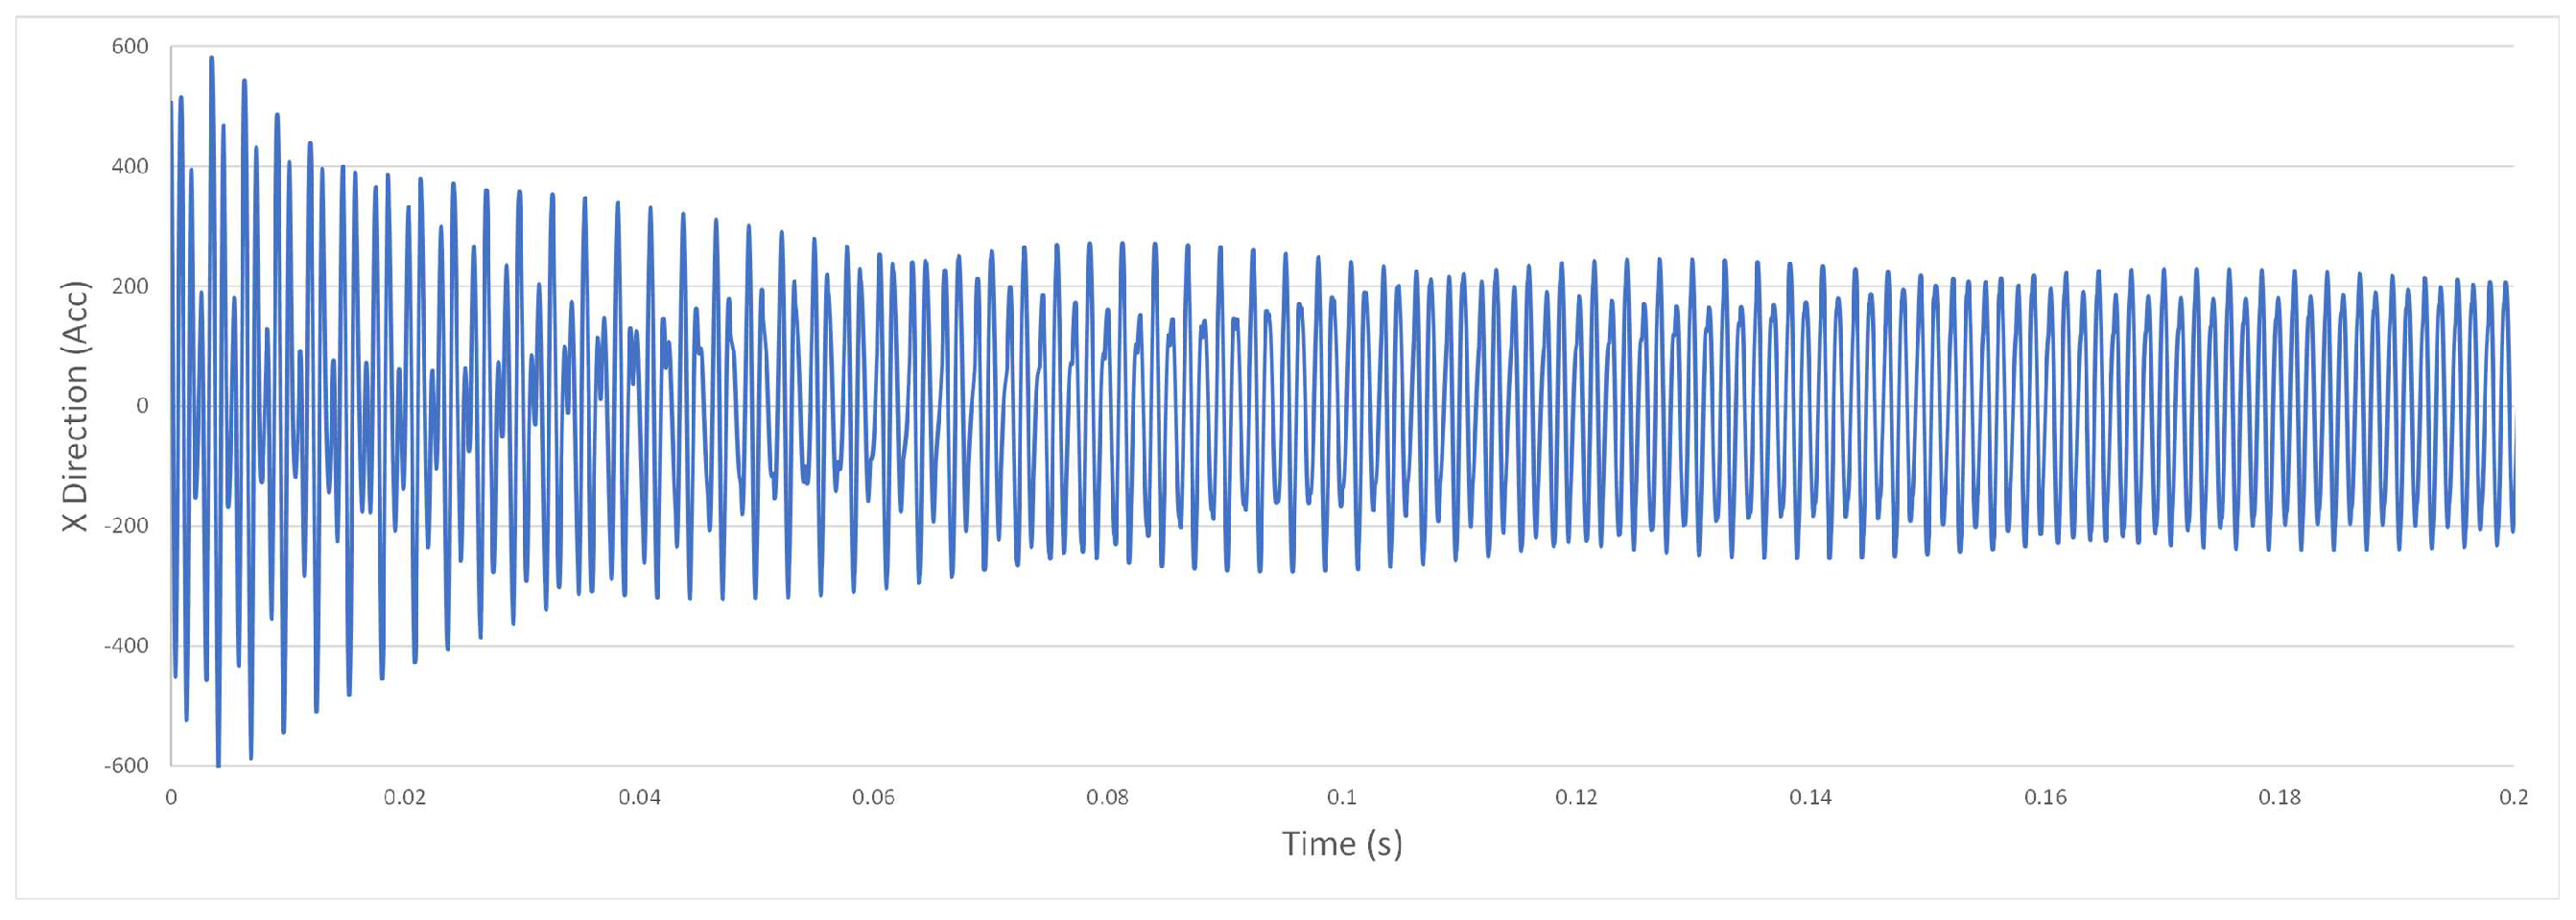
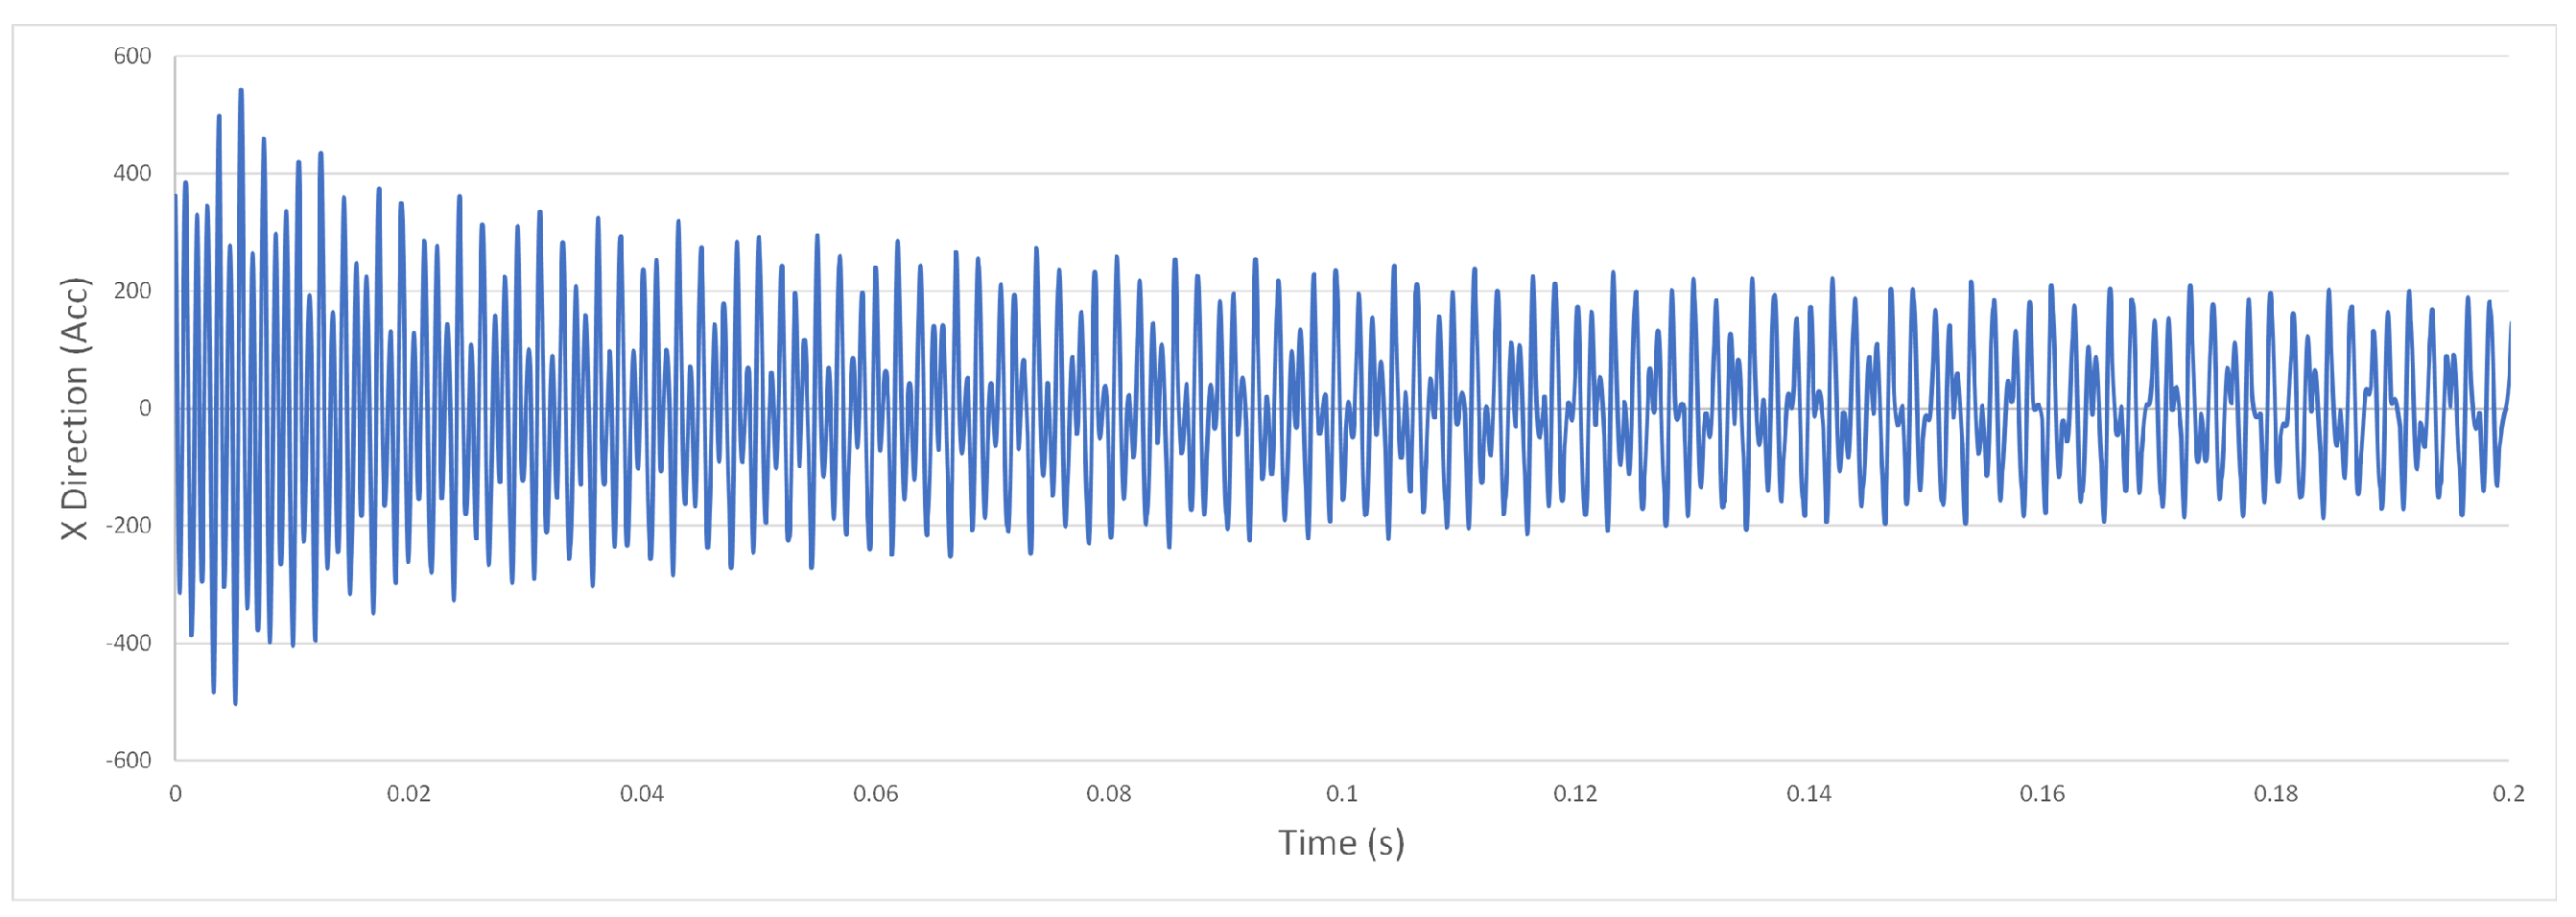
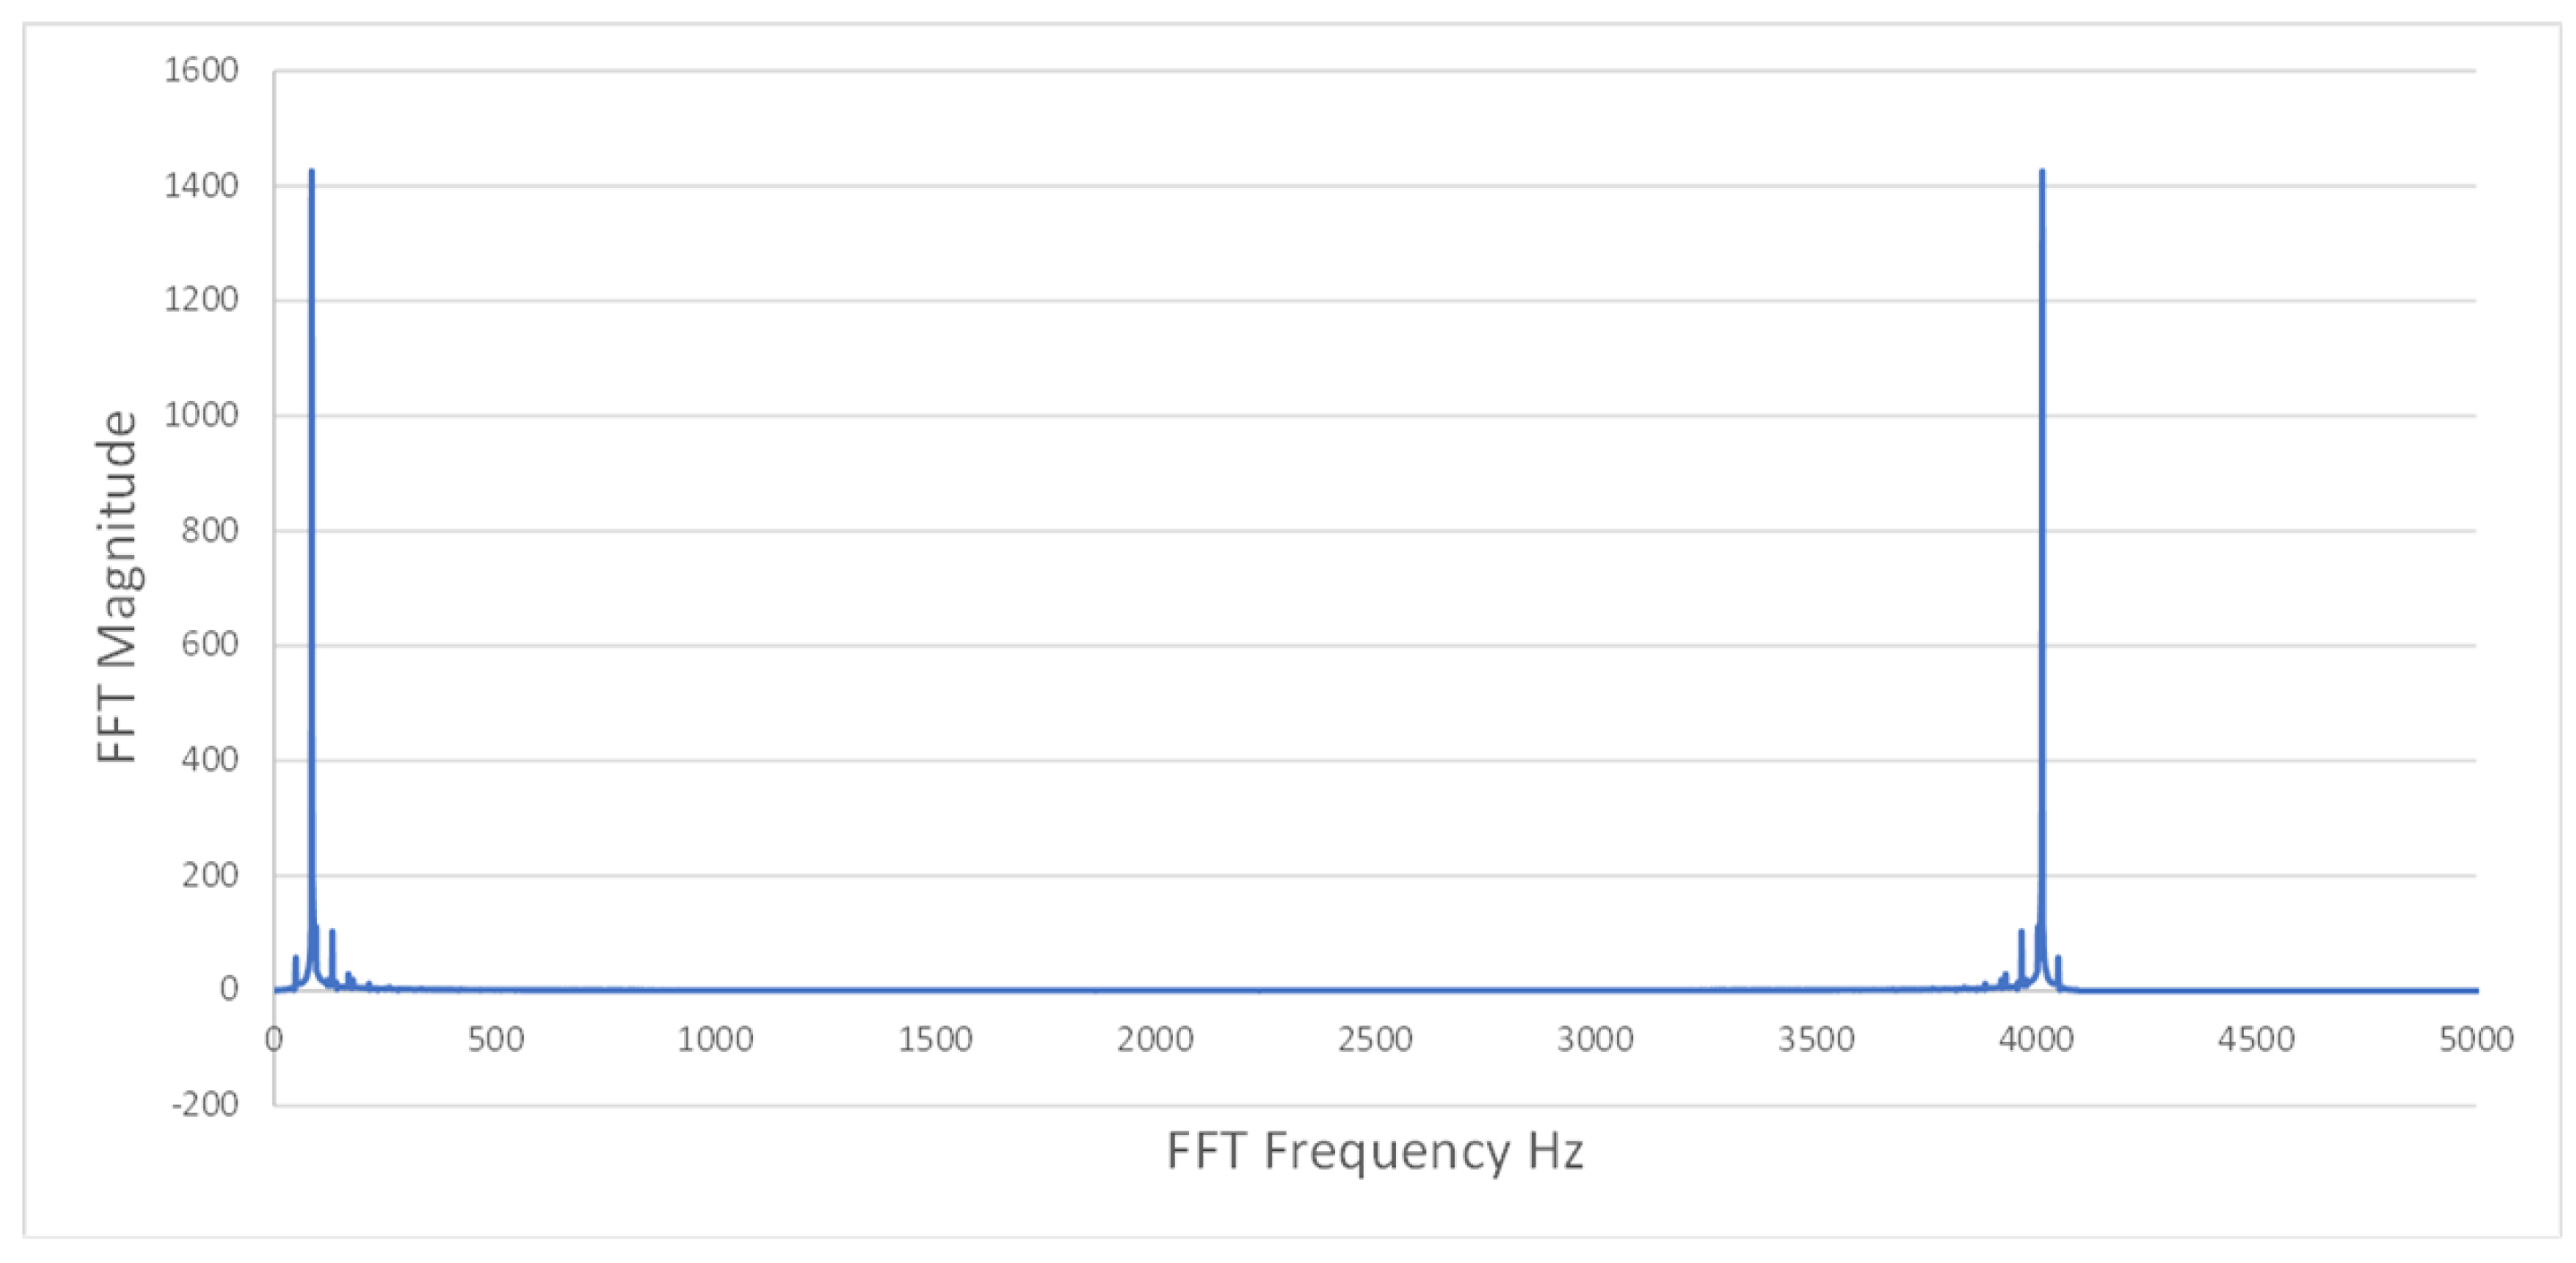
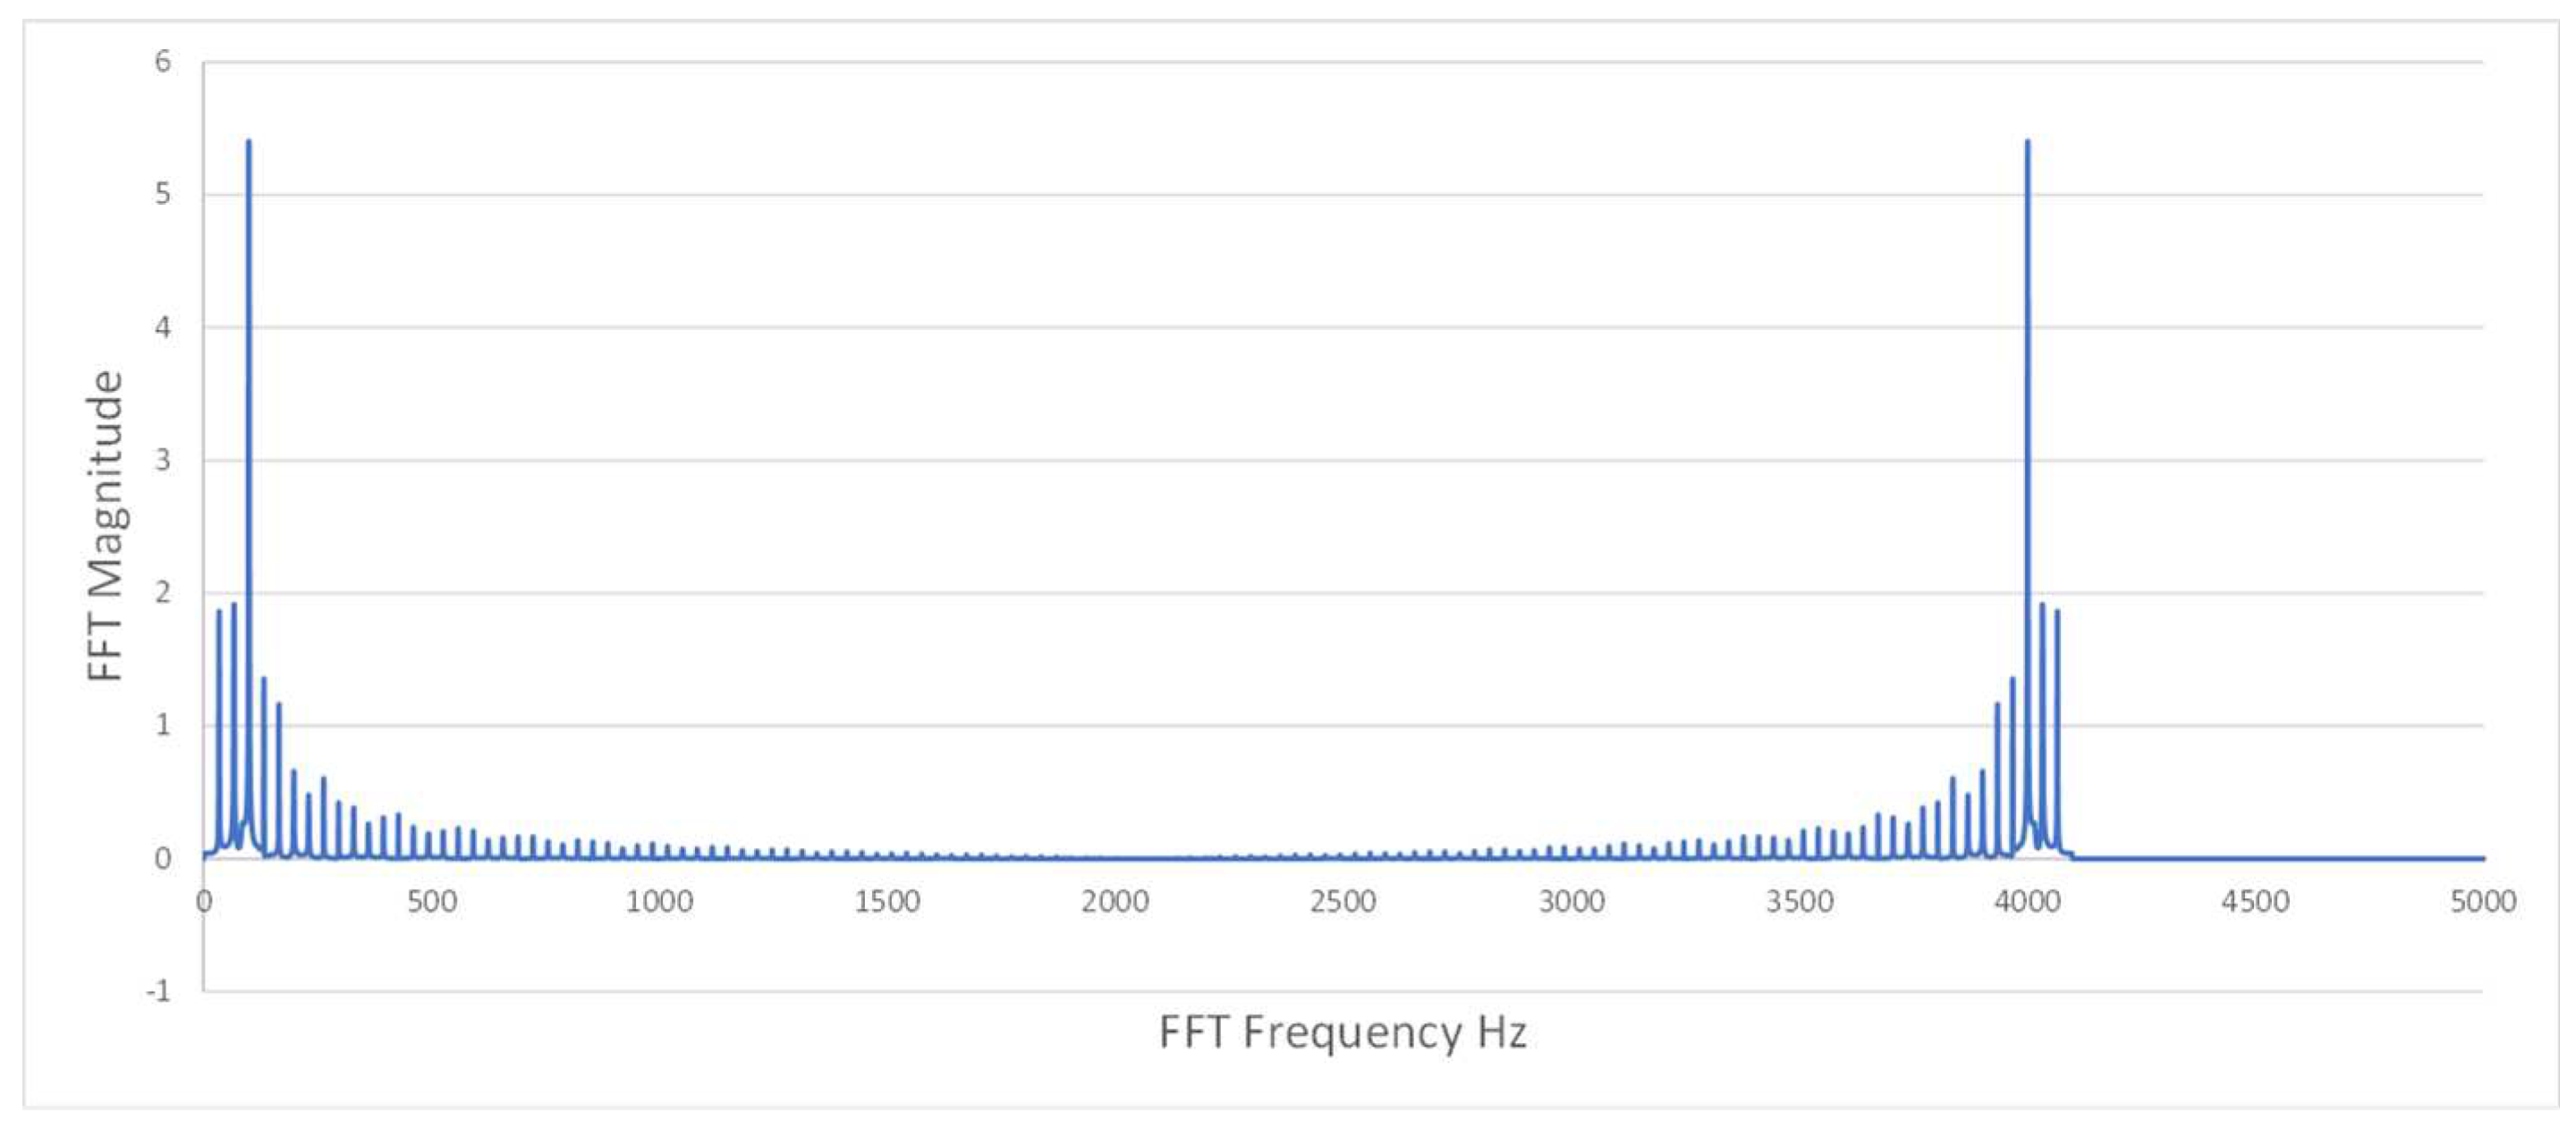
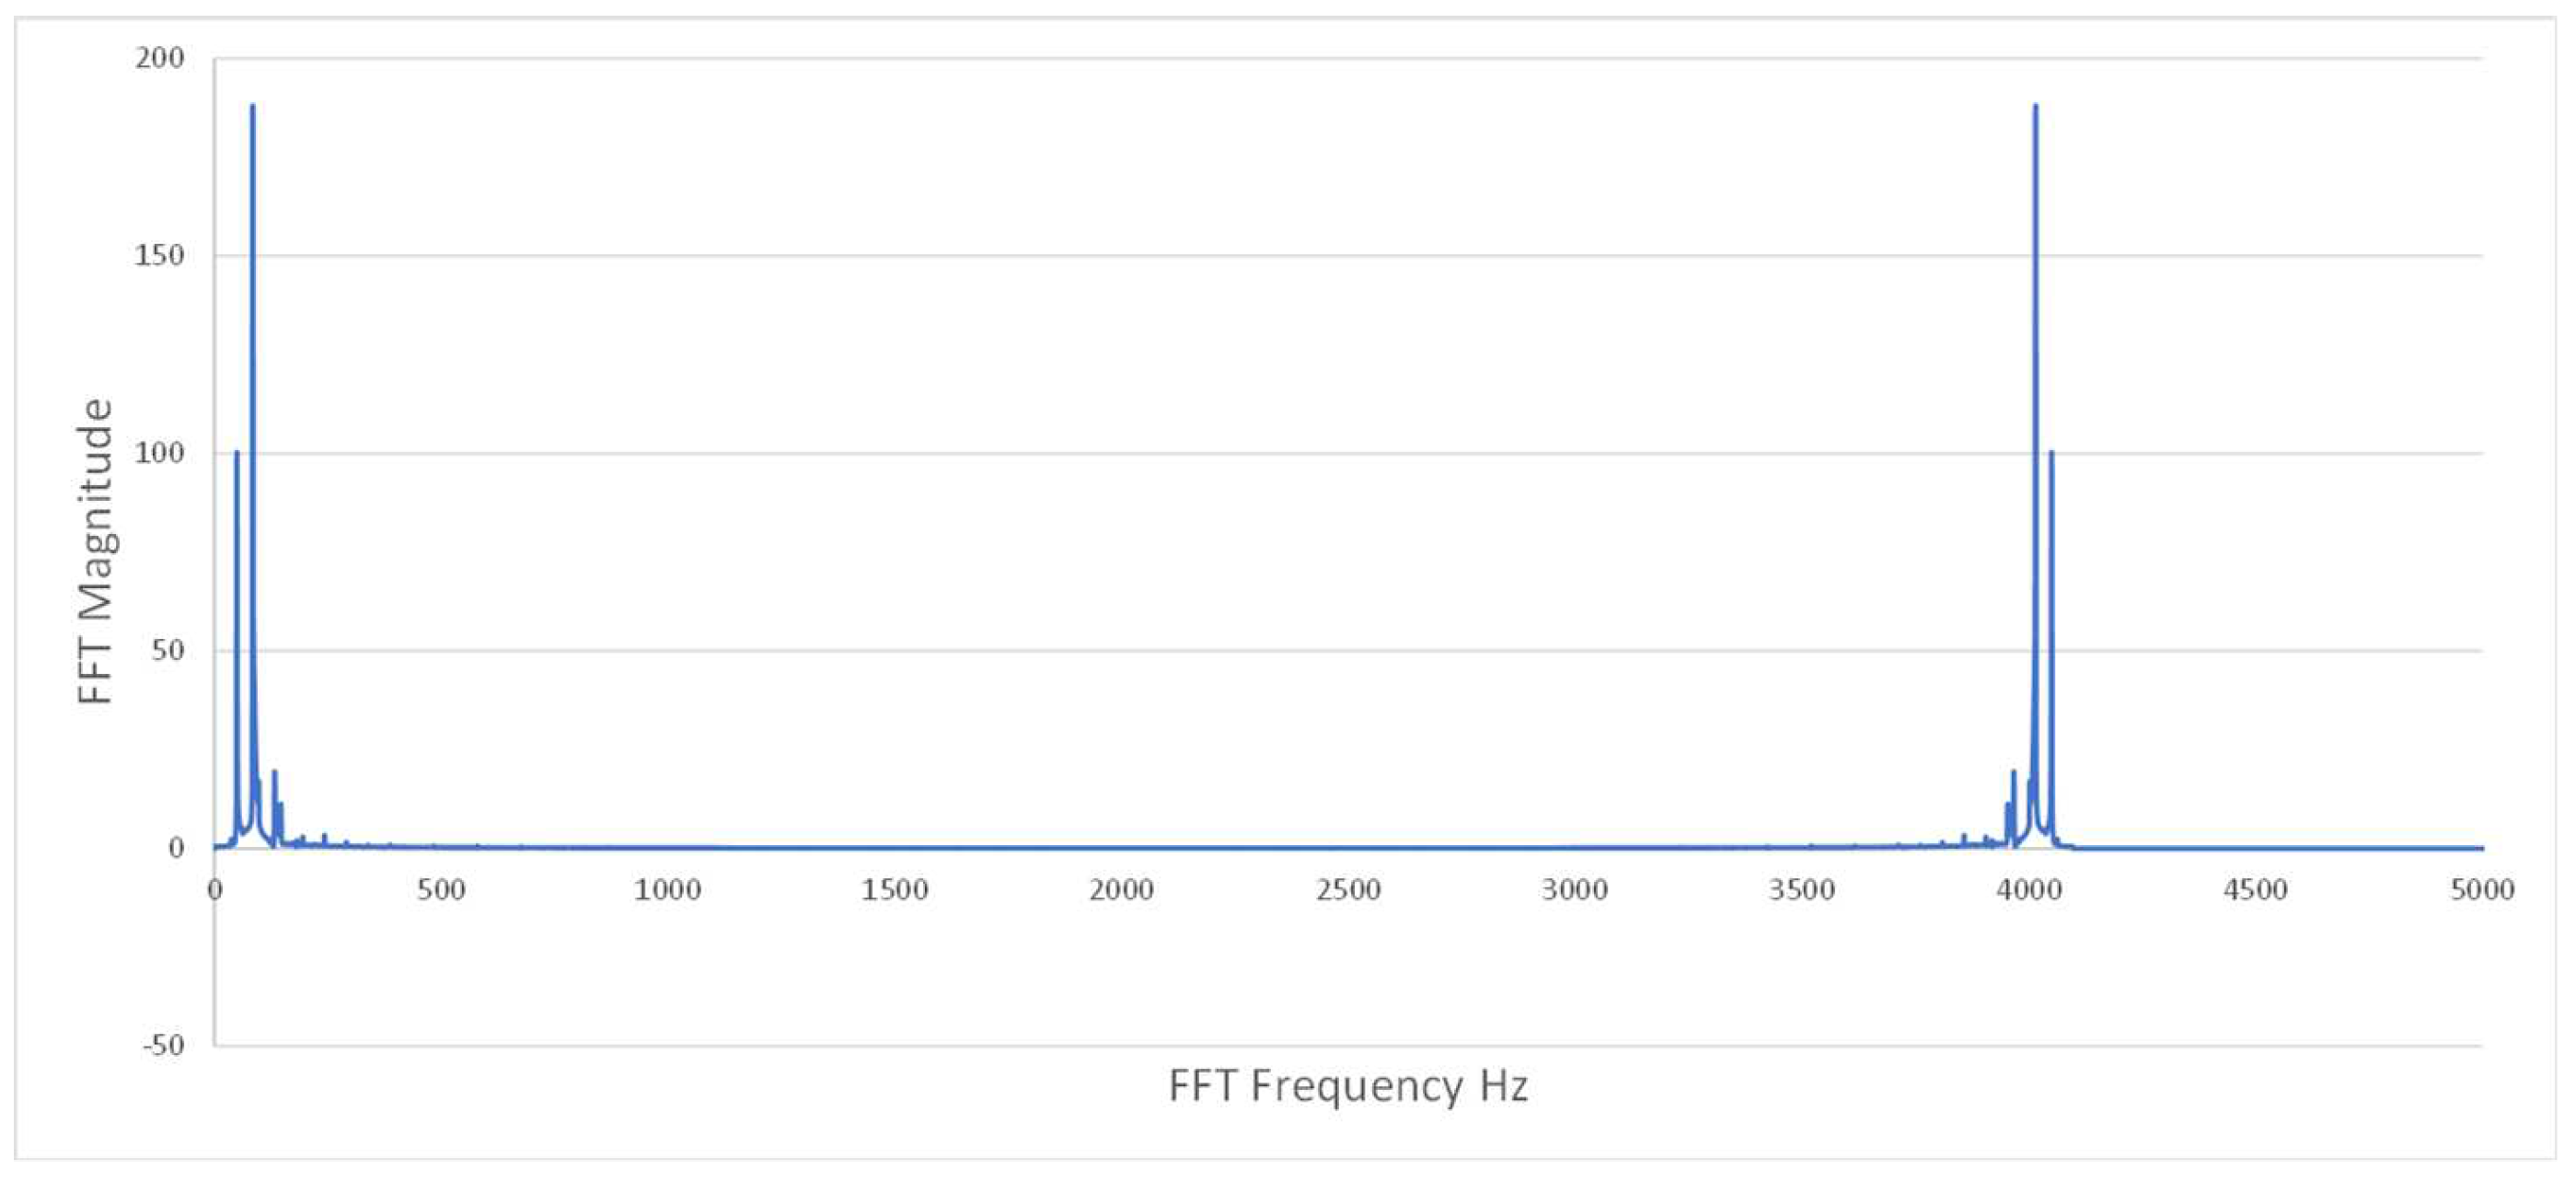
Figure A4 illustrate data runs that exist in the margin between stability and instability, a challenging area for chatter prediction. It is in this context that FFT and time-series features, particularly from TSFresh, play a crucial role in detecting stability within this dataset. The FFT highlights peak values at specific frequencies, aiding in the identification of machine issues. When combined with time-series features, these insights enable chatter classification both within and beyond the training dataset A and A0.
2.4. Data Sets A and A0
Data sets A and A0 are derived from the same machining tool setup, with variations in cutting depth and rotational speed of the machine tool-head. The cutting parameters remain consistent, with a cutting force of , feed per tooth of 0.1 mm/tooth, and a tool diameter of 10 mm equipped with four cutting teeth. Set A consists of 4000 data files, covering RPM settings ranging from 6,000 to 10,000 rpm in 50 rpm increments, with the cutting depth varying from 0.2 to 10 mm in 0.2 mm increments. Set A0 comprises 2500 data files, representing RPM settings from 10,050 to 12,000 rpm in 50 rpm increments, with the cutting depth varying from 10.2 to 15 mm in 0.2 mm increments. Notably, Set A0 serves as an extrapolated data set and is excluded from the training set for the RF classifier model.
2.5. Feature Extraction and Selection
To streamline feature selection and enhance model efficiency, we employed Recursive Feature Elimination (RFE), a technique that iteratively removes the least important features. This reduction in features optimizes the model’s interpretability, reduces computational demands, and mitigates the risk of overfitting.
Table 1 presents the FFT features extracted from each data set, while
Table 2 showcases the time-series features extracted from each data set. These feature data sets serve as inputs for the RF classification model.
2.6. Data Preprocessing
In the data preprocessing phase, we extracted relevant features from the raw vibration data collected during machining. Custom Python scripts were developed for extracting FFT features, while the TSFresh library was employed for extracting time-series features [
24]. The transformation of raw data sets A and A0 into feature data sets B and B0 was accomplished through the application of TSfresh and FFT techniques. The challenges of discerning stability and instability from FFT data alone are evident in
Figure A5–
Figure A8.
Table 2 displays the time-series features extracted from each data set. As a result of this feature extraction step, 846 features were generated. If we relied on all of these features, we would be at risk of overfitting and losing the generalizability of our model. Through RFE, 17 features were determined to be most important to the RF model. These 17 features could be divided into two groups: 10 FFT features and 7 time-series features. These feature data sets will be utilized as input for the RF classification model.
2.7. Model Development
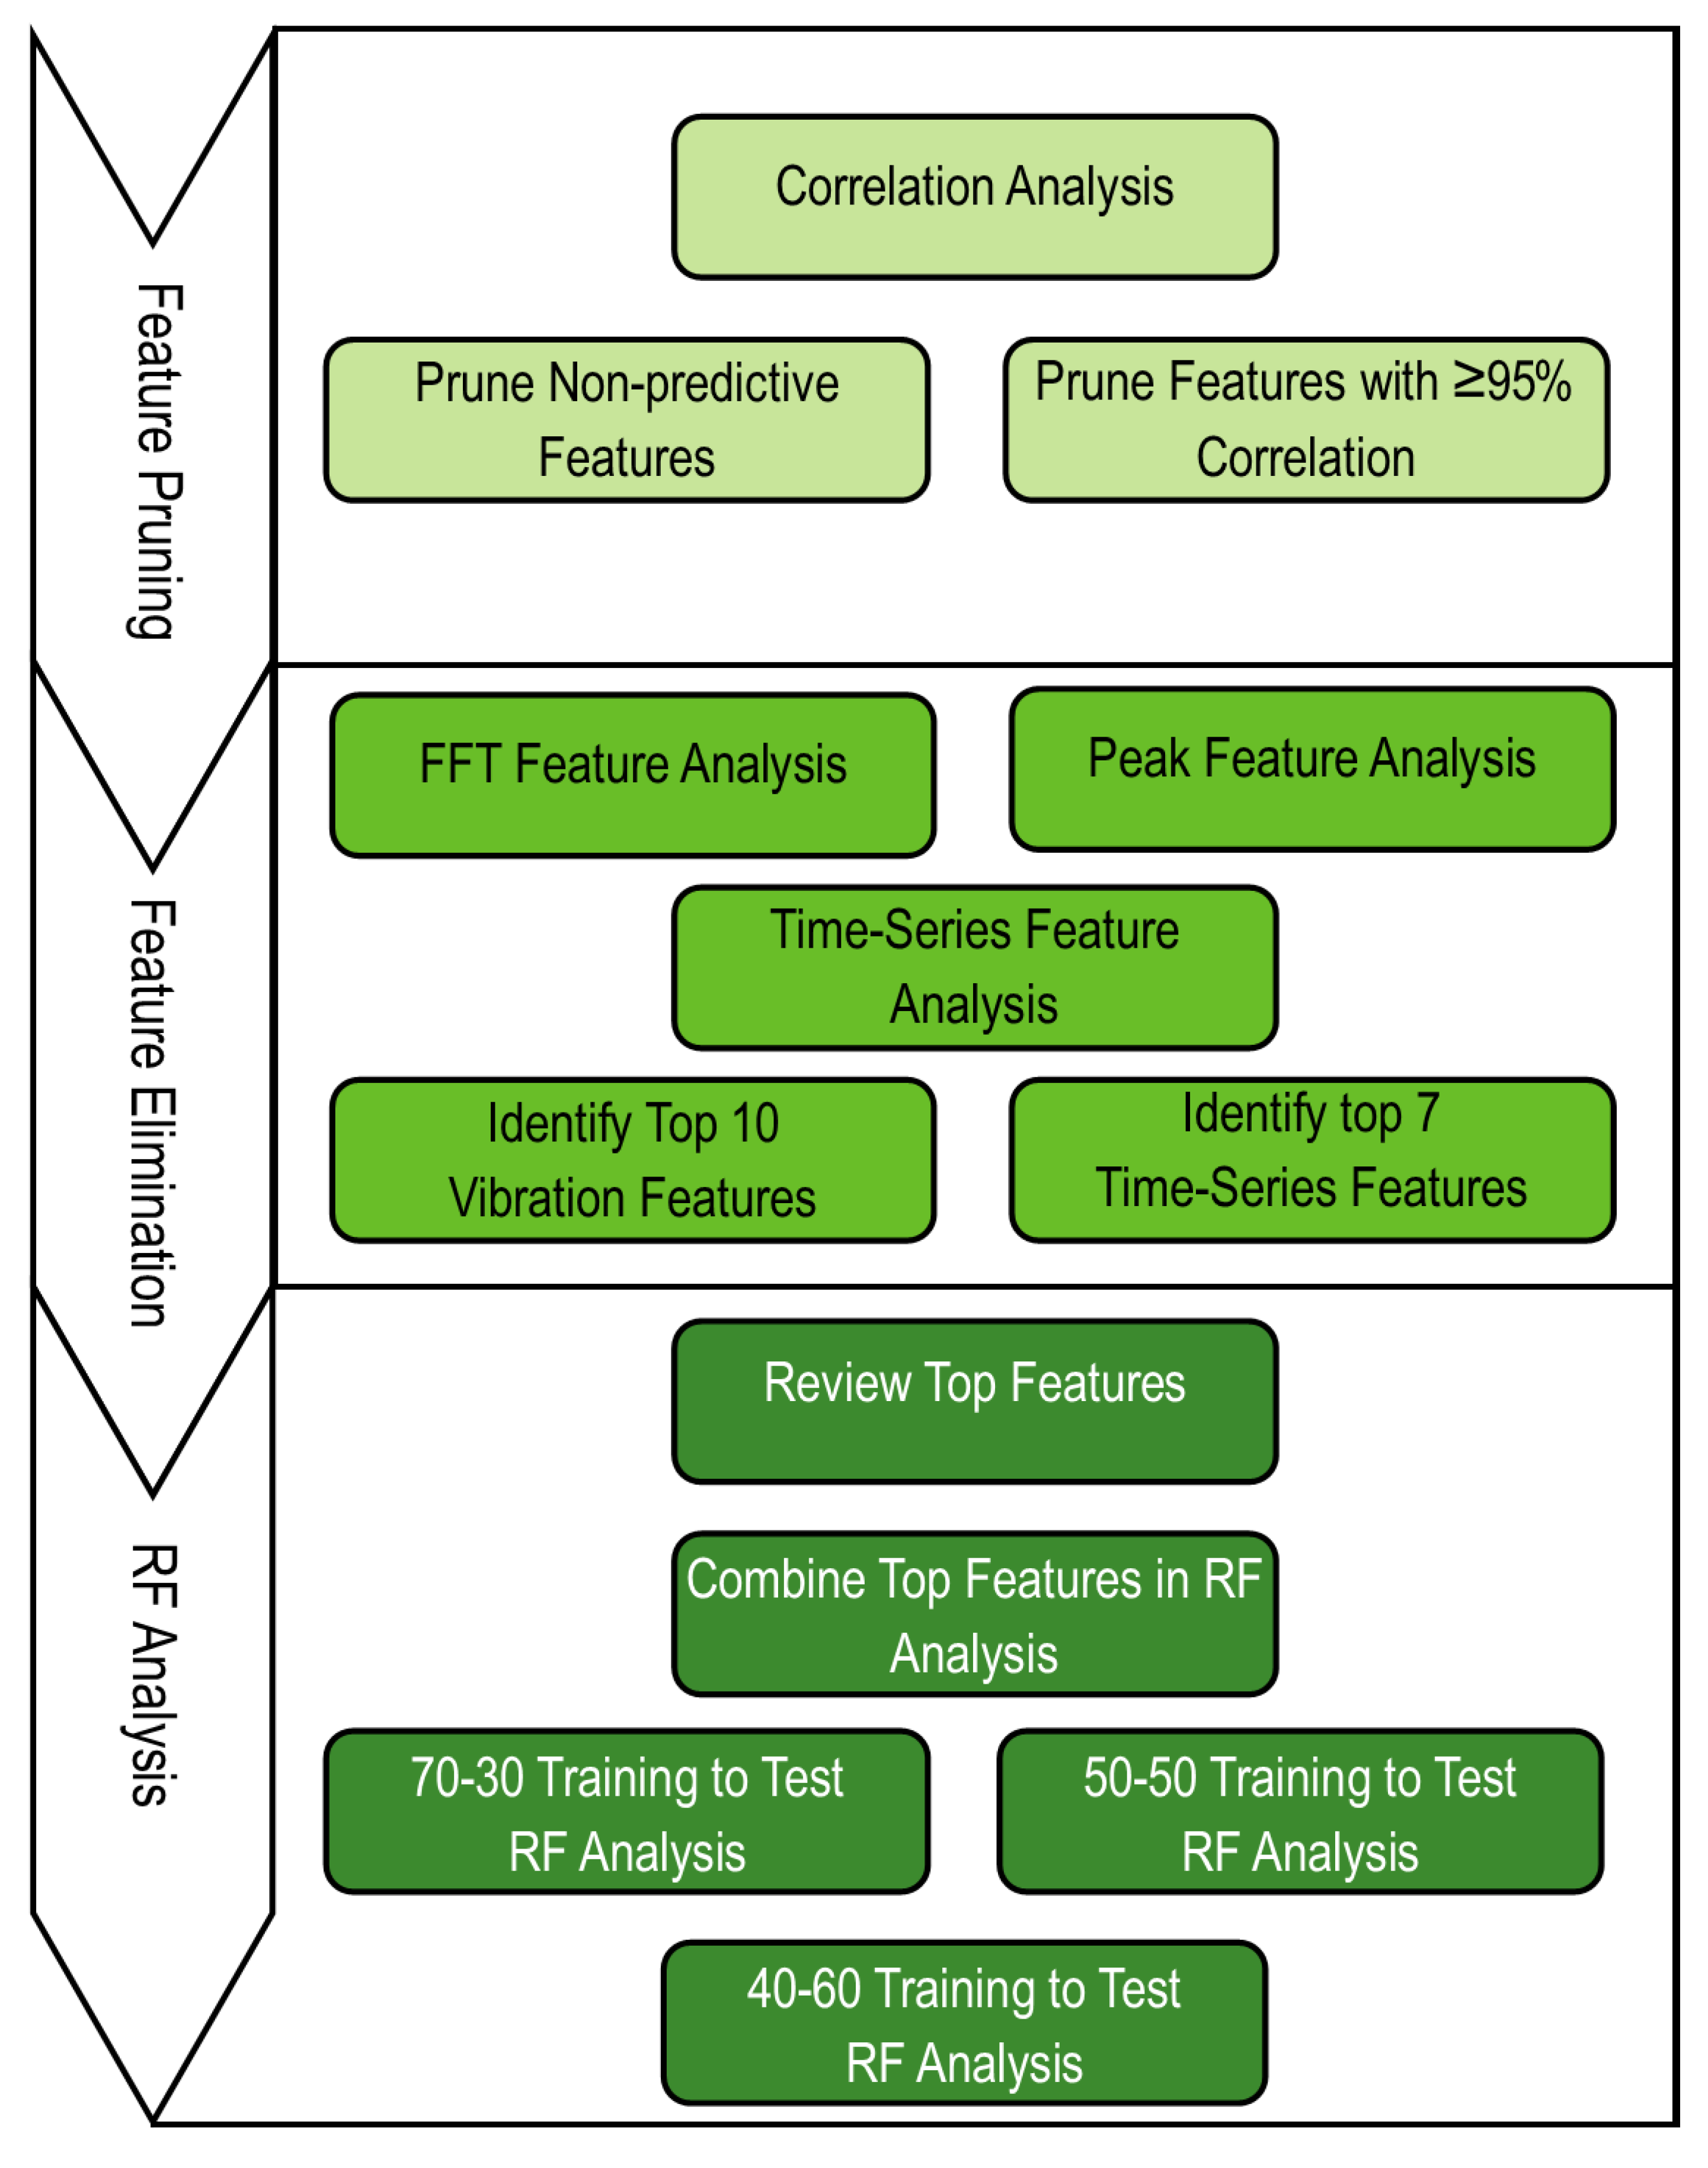
The methodology adopted in this research shares commonalities with prior efforts in feature generation, feature pruning, feature elimination, and random forest (RF) analysis.
Figure A9 provides an overview of our approach. The TSFresh package generated an extensive dataset of over 840 time-series features, many of which exhibited minimal relevance to our classification model. Some of these features, such as the aggregated Fast Fourier Transform (FFT), spectral centroid (mean), variance, skew, and kurtosis of the absolute Fourier transform spectrum, initially seemed promising but were subsequently identified as non-predictive when correlated with vibration data during machining. Employing Recursive Feature Elimination (RFE), we systematically removed these features, streamlining the feature list. This reduction not only reduced processing requirements but also improved analysis runtime and enhanced model accuracy.
2.8. Evaluation Metrics
In this section, we outline the key evaluation metrics employed to rigorously assess the performance of our random forest (RF) model for predicting chatter in milling operations. A thorough understanding of these metrics is essential to comprehending the effectiveness and practical implications of our model.
2.8.1. Area Under the Curve (AUC): A Robust Indicator
The Choice of Metric: To gauge the predictive accuracy of our chatter detection model, we chose Area Under the Curve (AUC) as the primary evaluation metric. AUC is particularly suitable for binary classification tasks, such as chatter (positive) and no chatter (negative) predictions. This metric has the unique advantage of considering the entire range of classification thresholds, providing a holistic assessment of model performance.
Interpreting AUC: AUC values range from 0.5 to 1.0. An AUC of 0.5 suggests that the model performs no better than random chance, while an AUC of 1.0 indicates perfect classification. Values greater than 0.5 demonstrate the model’s ability to distinguish chatter from no chatter with better-than-random accuracy. . Specifically, it quantifies the percentage at which the model correctly predicts chatter occurrences. For instance, a model with a 97% AUC score signifies a 97% accuracy rate in predicting chatter. This assessment allows us to ascertain the model’s generality and its potential to be effectively deployed across a broader spectrum of machining speeds and cutting depths.
2.8.2. Cross-Validation Techniques
Ensuring Robustness: To minimize the risk of overfitting and to verify the stability of our model’s performance, we employed k-fold cross-validation. This technique divides the dataset into multiple subsets (folds) for both training and validation. Cross-validation allows us to evaluate our model’s consistency across different data partitions, reinforcing the robustness of our findings.
2.8.3. Dataset Size Importance
Enhancing Model Performance: Large, diverse datasets significantly enhance model performance. The importance of dataset size in reducing model bias and improving generalizability cannot be overstated. Our study leverages the size and diversity of the dataset to ensure the practicality and applicability of our chatter detection model across a wide range of milling scenarios.
By incorporating AUC, along with cross-validation techniques, into our evaluation framework, we provide a thorough analysis of our RF model’s performance. These metrics collectively underscore the robustness and practical utility of our approach in addressing chatter prediction challenges in milling operations. Additionally, the significance of dataset size serves as a foundational element of our approach, amplifying the model’s potential to excel in real-world machining environments.
3. Investigation
This paper conducts three distinct studies to comprehensively assess the viability of key vibration and time-series features, the predictability of RF models within various datasets, and the generalizability of RF models through extrapolation.
Objective: To ascertain the consistency of essential features in machining vibration data for identical tool setups.
Identify and evaluate the top important features, denoted by set , for set
Determine intersection of feature sets, denoted by
Calculate the cardinal number, denoted as , representing the number of common features.
Objective: To assess the generalizability of RF models in predicting chatter for the same tool setups.
Construct RF models for each set
Evaluate model performance within each set using the Area Under the Curve (AUC) metric, denoted as and , with the model generation set followed by the evaluation set in the subscript.
Evaluate model performance across sets using the AUC metric, denoted as and , with the model generation set followed by the evaluation set in the subscript.
Objective: To investigate the generalizability of RF models in predicting chatter for extrapolated machining vibration data.
Develop RF models for set
Develop RF models for set
Assess model performance within each set using the AUC metric, denoted as , with the model generation set followed by the evaluation set in the subscript.
Evaluate model performance across sets and sets using the AUC metric, denoted as , , , and , with the model generation set followed by the evaluation set in the subscript.
These comprehensive studies enable a thorough examination of feature consistency, model performance, and generalizability across a range of datasets, contributing valuable insights to the field of chatter prediction in machining operations.
4. Results
4.1. Features and Descriptive Statistics
We utilized the TSFresh Python package to extract features, resulting in a total of 846 features, including both time-series and FFT-based vibration features. While vibration data analysis typically focuses on FFT features, time-series features are often overlooked in this context. To streamline our analysis, we performed feature reduction, ultimately selecting 17 features for use in developing our RF classification model.
4.2. Investigation Results
Study 1 aimed to identify crucial features within each dataset. Subsequently, Study 2 employed a ranking approach, incorporating random seed generation for each iteration, and utilized Recursive Feature Elimination (RFE) to remove less essential features. This process resulted in the selection of 7 time-series features and 10 vibration analysis features based on their importance. These 17 features were then used in Study 3, which applied the RF model to an extrapolated dataset.
4.2.1. Study 1 Results
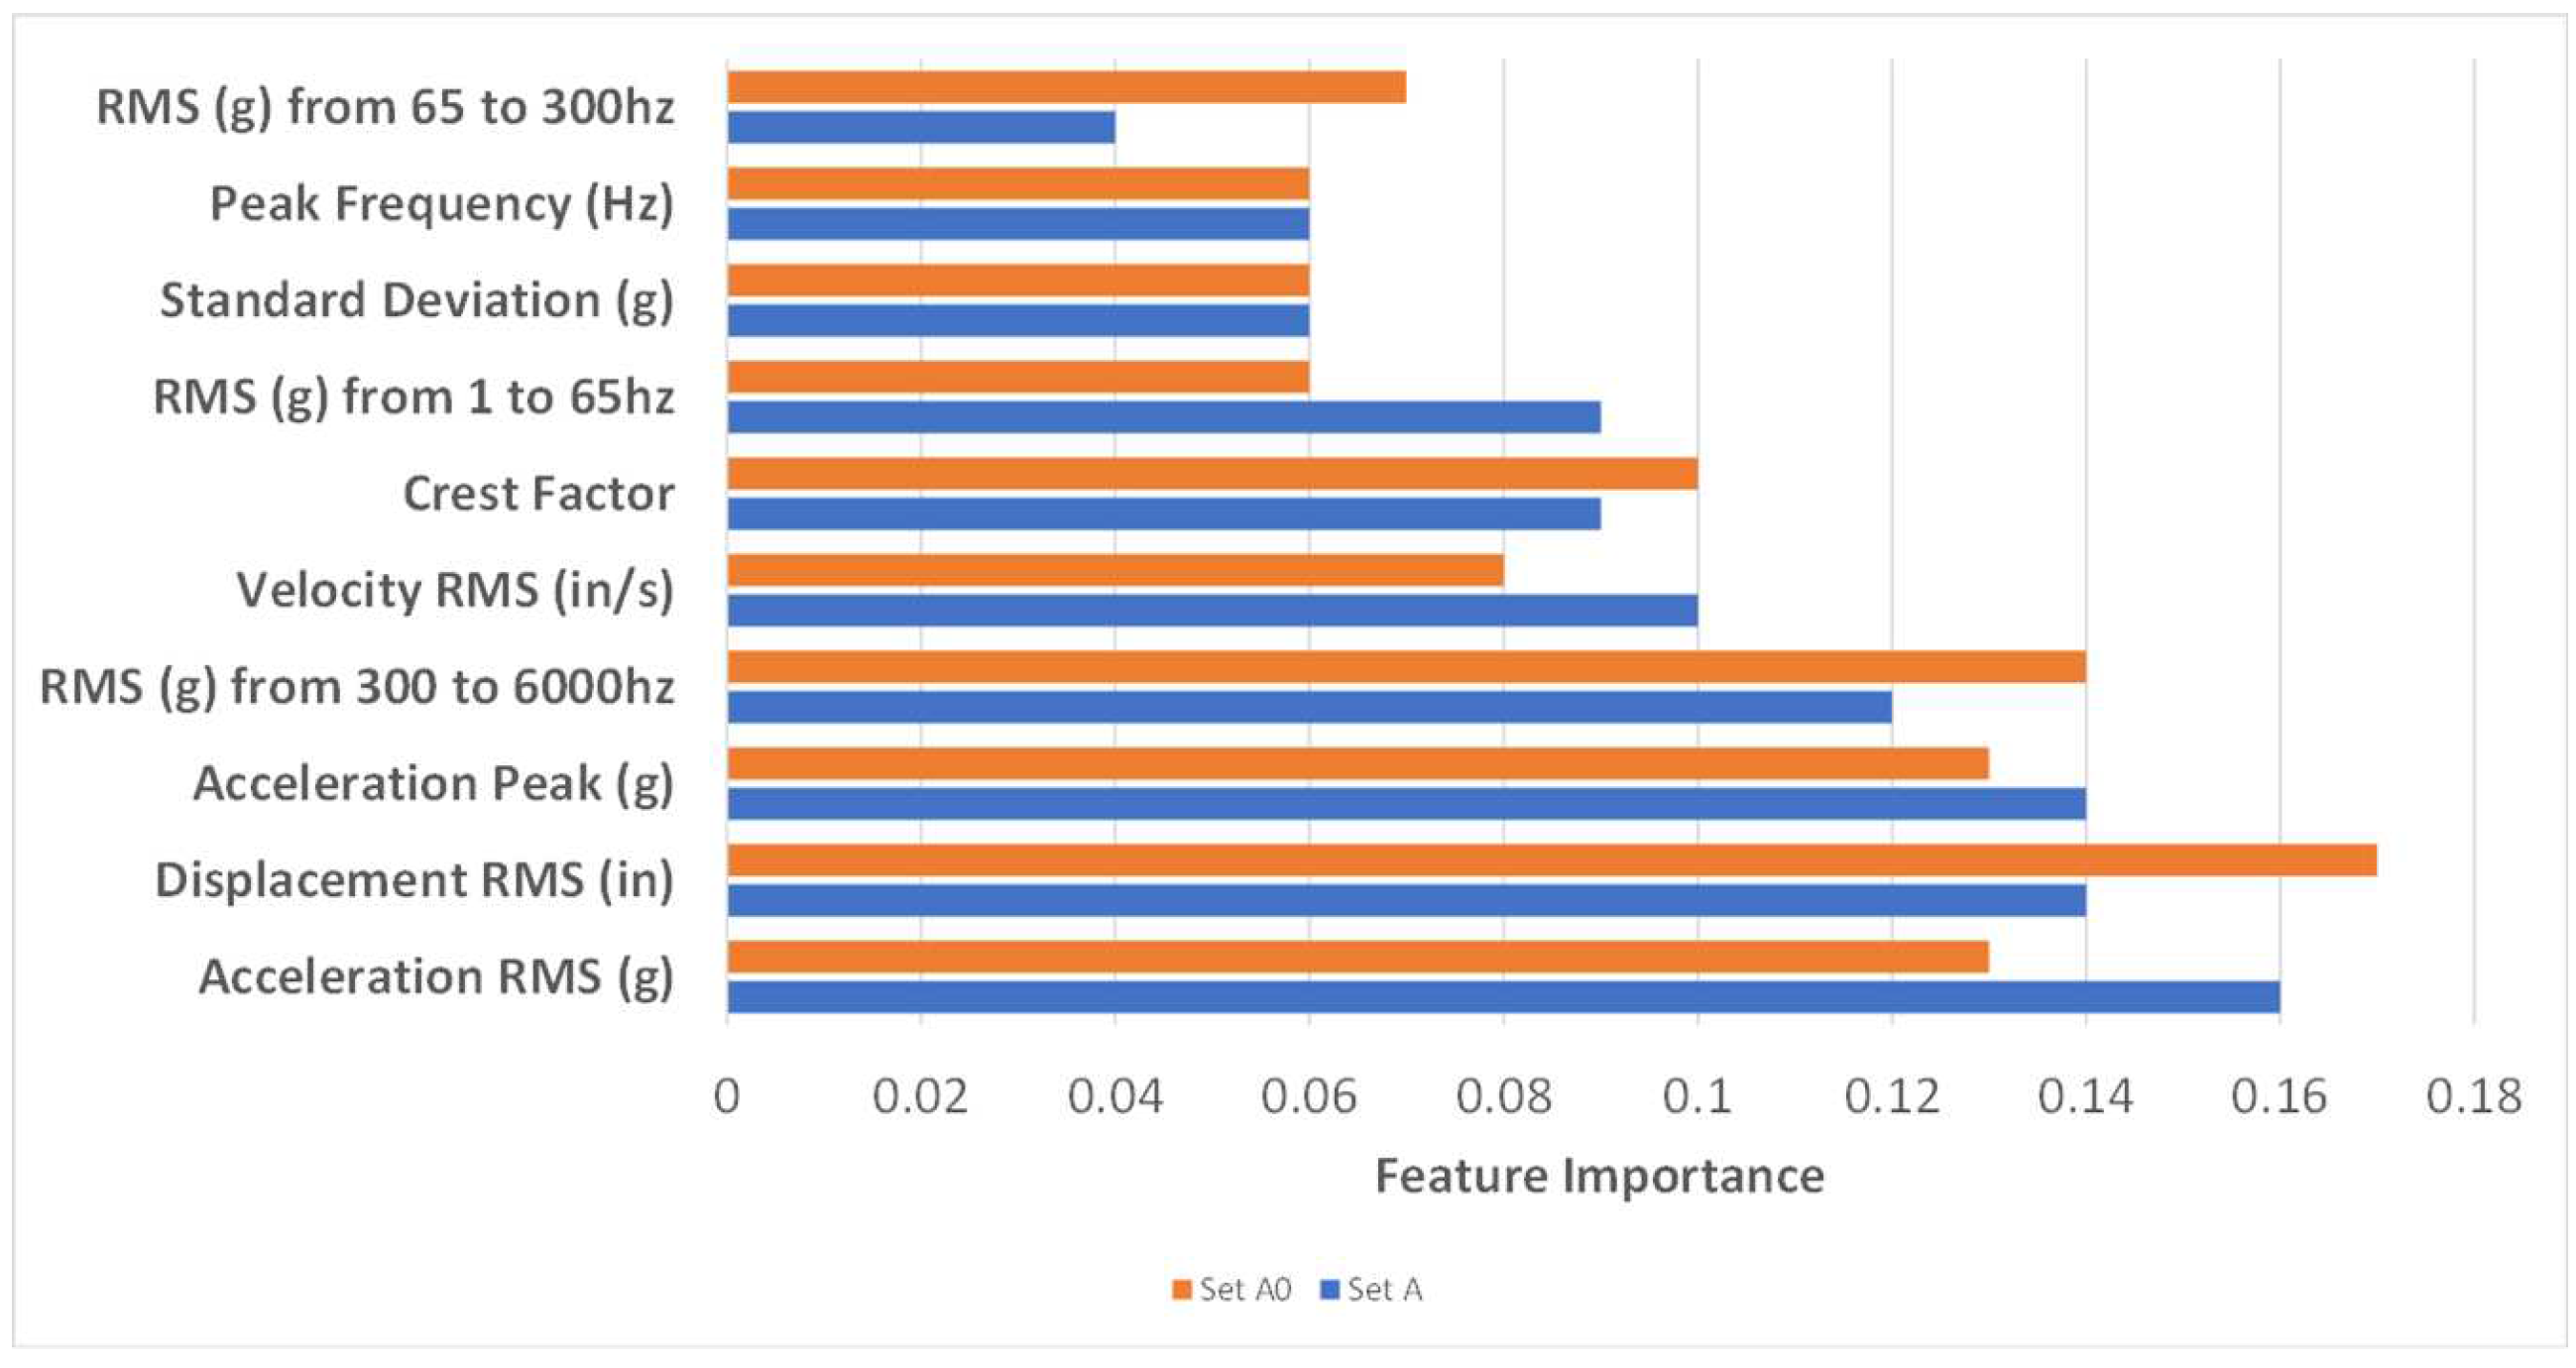
The results of Study 1 highlight the alignment of key features between sets
A and
.
Figure 3 and
Figure 4 illustrate the top features in both the vibration and time-series categories for sets
A and
. It is evident from these figures that the feature importance and top features closely match between sets
A and
.
4.2.2. Study 2 Results
Study 2 demonstrates the high predictability of the RF models within the datasets for classifying chatter. For Set A, all Area Under the Curve (AUC) values are above 0.997, as shown in
Table 3. Similarly, the results for Set A0, presented in
Table 4, exhibit a close relationship to Set A, achieving high classification accuracy across all feature groups. A 97% accuracy level in prediction instills confidence in the model’s performance for the dataset population.
, which describes predictability of vibration features within set A, is 1.000. , which describes predictability of time-series features within set A, is 0.995. The combined feature predictability for Set A as described by , is 1.000. This shows us that for this set of data the more important feature set is the vibration features and not the time-series features, but only slightly.
The predictability of vibration features within Set , as described by , is 0.992, while the predictability of time-series features within Set A, as described by , is 1.000. The combined feature predictability for Set A0, as described by , is 0.997.
4.2.3. Study 3 Results
Study 3 reveals favorable predictability of the RF models within dataset
B, as outlined in
Table 5. The predictability of vibration features within Set B, represented by
, is 0.824, while the predictability of time-series features within Set B
is 0.869. The combined feature predictability for Set B
stands at 0.879.
Study 3 also demonstrates the RF model’s ability to extrapolate data beyond the original training dataset’s range. This extrapolation includes machine tool rotations per minute and cutting depth values outside the training dataset’s range. Notably, the combination of vibration and time-series features yields the best generalizability results.
5. Discussion
In this section, we delve deeper into the outcomes and implications of our research, with a particular focus on the simplicity and efficiency inherent in our approach, and how these qualities make it a robust choice for practical industrial applications.
Our research harnessed the power of Recursive Feature Elimination (RFE) within Random Forest (RF) models, an approach that significantly simplifies the analysis of vibration data while maintaining high predictive accuracy. In employing the TSFresh time-series feature extraction package, we were initially faced with a vast number of features. Managing this volume posed a significant challenge, given that not all features are of equal significance in chatter prediction. However, RFE emerged as a valuable tool, one that efficiently identifies and selects essential features within the RF model.
The fusion of these selected features, drawn from both time-series and traditional FFT-based vibration analysis, has notably enriched the accuracy and generalizability of our model. By incorporating time-series data into our approach, we’ve achieved significant improvements in stability classification compared to previous research efforts. Notably, this improvement has been realized without resorting to more advanced techniques, emphasizing the simplicity of our approach.
Our study’s results underscored a robust correlation between feature importance and classification accuracy, evident in both sets A and A’. This finding underscores the effectiveness of RFE in uncovering pivotal features. Moreover, our RF model, initially developed with data from set A, demonstrated commendable generalizability when applied to the extrapolated data in set B, achieving an impressive 87% classification accuracy on data beyond the scope of the original training dataset. Considering the model’s successful application across varying tool speeds and cutting depths, the 10% drop in generalizability is a testament to its robustness. These results emphasize the potential of RF models for widespread use, even with the same tool setup under diverse operational conditions.
The strength of our simplified approach is readily apparent in practical industrial settings. While more complex methodologies may offer fine-grained analysis, they often come at the cost of increased computational demands and the need for specialized expertise. In contrast, our RF model, powered by FFT and time-series features, remains highly efficient, capable of rapid deployment on the shop floor, and accessible to industry professionals with varying levels of expertise. This accessibility is a key strength, particularly in today’s fast-paced industrial landscape, where speed and practicality are highly valued.
In summary, our research underscores the efficacy of a simplified yet innovative approach for accurate chatter detection in industrial machining processes. The efficiency and accessibility of our model, coupled with its capacity to excel in practical industrial environments, position it as a valuable tool for machinists and industry professionals alike. Our approach, founded on the simplicity of the RF model, bridges the gap between advanced theory and real-world application, emphasizing that innovation can thrive without resorting to complexity.
6. Conclusions
In the culmination of this study, we reaffirm the innovative nature of our approach, underlining its simplicity as a defining strength and a primary takeaway from our research. Our work offers an efficient yet straightforward solution to chatter detection in industrial machining processes.
Throughout this study, we have demonstrated the efficacy of a straightforward yet novel RF classification model in the precise categorization of simulated vibration data as stable or unstable during machining. This approach is not only innovative but also highly accessible, ensuring that the intricacies of advanced techniques are not prerequisites for effective chatter detection.
A central revelation of our research is the adaptability of the model to data that extends beyond the boundaries of the original training dataset. By utilizing simulated data, we have been able to swiftly generate a substantial volume of representative data, closely mimicking real-world scenarios. This adaptability and generalizability, we emphasize, should not be mistaken for complexity. In fact, our research underscores the effectiveness of simplicity.
The fusion of traditional FFT features with time-series characteristics stands as a testament to the added value of straightforward yet innovative approaches. This combination significantly improves the classification of machining vibration data’s stability, highlighting the merits of our approach when compared to more intricate methods.
As a final note, we urge future endeavors to follow our lead by embracing the simplicity of the RF model for chatter detection. We believe that this approach has the potential to provide valuable insights and solutions across diverse tooling setups and varying cutting force parameters, reiterating that innovation doesn’t always necessitate complexity. Such efforts, coupled with the deployment of simulated data models in real-world machining setups, hold the potential to enable real-time machine learning models during milling processes, ensuring optimal machining finishes. Our research encourages the industrial community to recognize that practical, effective solutions can be derived from novel but uncomplicated methodologies.
Author Contributions
Conceptualization, Matthew Alberts. and Tony Schmitz.; methodology, Matthew Alberts and Jamie Coble.; software, Tony Schmitz.; validation, Tony Schmitz, Jamie Coble. and Anahita Khojandi.; formal analysis, Matthew Alberts; resources, Jaydeep Karandikar; data curation, Matthew Alberts; writing—original draft preparation, Matthew Alberts; writing—review and editing, Tony Schmitz and Jamie Coble; supervision, Bradley Jared; funding acquisition, Y.Y. All authors have read and agreed to the published version of the manuscript.
Funding
The research leading to these results received funding in part from UT-Battelle, LLC, under contract DE-AC05-00OR22725 with the US Department of Energy (DOE). The US government retains and the publisher, by accepting the article for publication, acknowledges that the US government retains a nonexclusive, paid-up,irrevocable, worldwide license to publish or reproduce the published form of this manuscript, or allow others to do so, for US government purposes. DOE will provide public access to these results of federally sponsored research in accordance with the DOE Public Access Plan (
http://energy.gov/downloads/doe-public-access-plan). The authors also gratefully acknowledge seed funding from the University of Tennessee-Oak Ridge Innovation Institute (UT-ORII) to partially support this research.
Data Availability Statement
Data is unavailable at this time due to privacy restrictions.
Conflicts of Interest
No conflict of interest exist for any of the authors related to the conduction or publication of this work. All stated opinions and conclusions are solely those of the authors.
Appendix A. Figures
Figure A1.
Example vibration acceleration, stable.
Figure A1.
Example vibration acceleration, stable.
Figure A2.
Example vibration acceleration, unstable.
Figure A2.
Example vibration acceleration, unstable.
Figure A3.
Example vibration acceleration slightly below chatter line, stable.
Figure A3.
Example vibration acceleration slightly below chatter line, stable.
Figure A4.
Example vibration acceleration slightly above chatter line, unstable.
Figure A4.
Example vibration acceleration slightly above chatter line, unstable.
Figure A5.
Example FFT data indicating clear instability.
Figure A5.
Example FFT data indicating clear instability.
Figure A6.
Example FFT data indicating clear stability.
Figure A6.
Example FFT data indicating clear stability.
Figure A7.
Example FFT data slightly above chatter line, unstable.
Figure A7.
Example FFT data slightly above chatter line, unstable.
Figure A8.
Example FFT data slightly below chatter line, stable.
Figure A8.
Example FFT data slightly below chatter line, stable.
Figure A9.
The research approach includes feature pruning, recursive feature elimination, and RF analysis. Steps in this approach are provided with a generalized flow from top to bottom.
Figure A9.
The research approach includes feature pruning, recursive feature elimination, and RF analysis. Steps in this approach are provided with a generalized flow from top to bottom.
References
- Farrar, C.R.; Doebling, S.W. Damage detection II: field applications to large; Silva, J.M.M., Maia, N.M.M., Eds.; Modal Analysis and Testing, Nato Science Series; Kluwer Academic Publishers: Dordrecht, The Netherlands.
- Goyal, D.; Pabla, B.S. The vibration monitoring methods and signal processing techniques for structural health monitoring: a review. Archives of Computational Methods in Engineering 2016, 23, 585–594. [Google Scholar] [CrossRef]
- Carden, E.P.; Fanning, P. Vibration based condition monitoring: a review. Structural health monitoring 2004, 3, 355–377. [Google Scholar] [CrossRef]
- Quintana, G.; Ciurana, J. Chatter in machining processes: A Review. International Journal of Machine Tools and Manufacture 2011, 51(5), 363–376. [Google Scholar] [CrossRef]
- Schmitz, T.; Smith, K.S. Machining Dynamics: Frequency Response to Improved Productivity, 2nd, ed.; Springer: New York, NY, USA.
- Shevchik, S.A., Saeidi; Meylan, B.; Wasmer, K. Prediction of Failure in Lubricated Surfaces Using Acoustic Time–Frequency Features and Random Forest Algorithm. IEEE Transactions on Industrial Informatics 2017, 13, 1541–1553. [Google Scholar] [CrossRef]
- Wu, S.-D.; Wu, P.-H.; Wu, C.-W.; Ding, J.-J.; Wang, C.-C. Bearing Fault Diagnosis Based on Multiscale Permutation Entropy and Support Vector Machine. Entropy 2012, 14, 1343–1356. [Google Scholar] [CrossRef]
- Heng, R.B.W.; Nor, M.J.M. Statistical analysis of sound and vibration signals for monitoring rolling element bearing condition. Applied Acoustics 1998, 53, 211–226. [Google Scholar] [CrossRef]
- Rao, K.R.; Kim, D.N.; Hwang, J.J. Fast Fourier transform : algorithms and applications; Springer.
- Huo, Z.; Zhang, Y.; Francq, P.; Shu, L.; Huang, J. Incipient Fault Diagnosis of Roller Bearing Using Optimized Wavelet Transform Based Multi-Speed Vibration Signatures. IEEE Access 2017, 5, 19442–19456. [Google Scholar] [CrossRef]
- Ma, X.; Hu, J.; Zhang, L. EMD-based online Filtering of Process Data. Control Engineering Practice 2017, 62, 79–91. [Google Scholar] [CrossRef]
- Yang, J.; Wright, J.; Huang, T.S.; Ma, Y. Image Super-Resolution Via Sparse Representation. IEEE Transactions on Image Processing 2010, 19, 2861–2873. [Google Scholar] [CrossRef] [PubMed]
- Yesilli, M.; Khasawneh, F. On Transfer Learning of Traditional Frequency and Time Domain Features in Turning; Electrical Engineering and Systems Science, 2021. [Google Scholar]
- Li, X.; Yao, H.; Chen, Z.C. An effective EMD-based feature extraction method for boring chatter recognition. Applied Mechanics and Materials 2010, 34-35, 1058–1063. [Google Scholar] [CrossRef]
- Chen, G.S.; Zheng, Q.Z. Online chatter detection of the end milling based on wavelet packet transform and support vector machine recursive feature elimination. The International Journal of Advanced Manufacturing Technology 2017, 95, 775–784. [Google Scholar] [CrossRef]
- Konar, P.; Chattopadhyay, P. Bearing fault detection of induction motor using wavelet and Support Vector Machines (SVMs). Applied Soft Computing 11(6), 4203–4211. [CrossRef]
- Yesilli, M.C.; Khasawneh, F.A.; Mann, B.P. Transfer learning for autonomous chatter detection in machining. Journal of Manufacturing Processes 2022, 80, 1–27. [Google Scholar] [CrossRef]
- Wan, S.; Li, X.; Yin, Y.; Hong, J. Milling chatter detection by multi-feature fusion and adaboostsvm. Mechanical Systems and Signal Processing 2021, 156, 107671. [Google Scholar] [CrossRef]
- Gradisek, J.; Baus, A.; Govekar, E.; Klocke, F.; Grabec, I. Automatic chatter detection in grinding. International Journal of Machine Tools and Manufacture 2003, 43, 1397–1403. [Google Scholar] [CrossRef]
- Li, K.; He, S.; Li, B.; Liu, H.; Mao, X.; Shi, C. A novel online chatter detection method in milling process based on multiscale entropy and gradient tree boosting. Mechanical Systems and Signal Processing 2020, 135, 106385. [Google Scholar] [CrossRef]
- Aslan, D.; Aslan, Y. On-line chatter detection in milling using drive motor current commands extracted from cnc. International Journal of Machine Tools and Manufacture 2018, 132, 64–80. [Google Scholar] [CrossRef]
- M. C. Yesilli and F. A. Khasawneh, On transfer learning of traditional frequency and time domain features in turning, in Volume 2: Manufacturing Processes; Manufacturing Systems; Nano/Micro/Meso Manufacturing; Quality and Reliability, American Society of Mechanical Engineers, Sep 2020.
- Jia, W.; Sun, M.; Lian, J.; Hou, S. Feature dimensionality reduction: A Review. Complex Intelligent Systems 2022, 8, 2663–2693. [Google Scholar] [CrossRef]
- Christ, M.; Braun, N.; Neuffer, J.; Kempa-Liehr, A.W. Time series feature extraction on basis of scalable hypothesis tests (tsfresh – a python package). Neurocomputing 2018, 307, 72–77. [Google Scholar] [CrossRef]
|
Disclaimer/Publisher’s Note: The statements, opinions and data contained in all publications are solely those of the individual author(s) and contributor(s) and not of MDPI and/or the editor(s). MDPI and/or the editor(s) disclaim responsibility for any injury to people or property resulting from any ideas, methods, instructions or products referred to in the content. |
© 2023 by the authors. Licensee MDPI, Basel, Switzerland. This article is an open access article distributed under the terms and conditions of the Creative Commons Attribution (CC BY) license (http://creativecommons.org/licenses/by/4.0/).
