
Submitted:
14 November 2023
Posted:
23 November 2023
You are already at the latest version
Abstract
This article investigates the source of booming noise emanating from the tailgates of electric vehicles, along with proposed strategies to mitigate it. This study involved the measurement of booming noises during on-road vehicle tests to pinpoint their origins. Additionally, operational deflection shapes (ODS) were extracted from the tailgate vibration signals to gain insight into its dynamic behavior. Modal tests were conducted on the tailgate to determine its dynamic characteristics and compared with driving test results to reveal the mechanism responsible for tailgate-induced booming noise. It was established that such noise is primarily due to the tailgate modes resulting from a combination of rigid body motion in the fore-aft direction and deformation in the central section of the panel. An analytical model of the tailgate was developed using commercial finite element analysis software to propose measures for reducing booming noise. Experimental findings validated the model accuracy. Structural enhancements were implemented to enhance the panel stiffness and improve the connection between the vehicle and tailgate via bushings to dampen the booming noise resulting from tailgate motion. Under random force inputs, analytical results demonstrated a 13.8% reduction in maximum deformation in the tailgate model in the improved structural configuration with increased panel stiffness.
Keywords:
booming noise
; electric vehicle
; tailgate
; guide bumper
; inner panel
; noise reduction
1. Introduction
Booming noise, characterized by low-frequency noise generated within vehicles, results from various factors, including powertrain components, exhaust systems, and road-induced forces, which often lead to resonance. This constitutes an important research area in the field of vehicle noise, vibration, and harshness (NVH). In traditional internal combustion engine vehicles, vibrations and noise typically stem from engine combustion-induced harmonics, resulting in a range of noise-related challenges. Extensive studies have been conducted to address these issues from various perspectives.
However, with the transition from vehicles with internal combustion engines to electric vehicles in compliance with global environmental regulations, driving conditions have improved significantly in terms of vibration and noise. However, as the masking effect caused by engines diminishes, drivers demand even greater levels of quietness. Consequently, vibration and noise issues in electric vehicles, particularly in quiet environments, have become critical concerns. Addressing these issues in electric vehicles requires a significantly higher level of technological sophistication compared to vehicles with internal combustion engines. As a result, ongoing research to reduce the booming noise in electric vehicles is underway, often involving collaboration between automotive manufacturers and researchers in related fields.
Many studies on the booming noise in internal combustion engine vehicles have investigated various aspects of these vehicles. Despite the impending transition to electric vehicles, internal combustion engine vehicles continue to be integral to various aspects of our daily lives. Consequently, ongoing efforts are being made to mitigate the booming noise associated with these vehicles. Notably, Kim and Altinsoy [1] concentrated their research on booming noise emanating from engines and powertrain drivetrains. Selvaraj et al. [2] analyzed low-frequency noise and vibration problems in bus bodies, which stem from imbalances in large bus propeller shafts, using the operational deflection shapes (ODS) technique. Herrmann et al. [3] investigated the mechanisms behind the booming noise generated by coupling modes between the rear axle and vehicle body, which subsequently affect the fore-aft behavior of tailgates and the acoustics within the vehicle interior. Lim et al. [4] identified the origins of structure-borne and airborne booming noise originating from the rigid modes of air-conditioning pipes through transmission path analysis and ODS. Yang et al. [5] exposed the sources of booming noise resulting from secondary components located at the end of the exhaust pipe in hybrid vehicles, whereas Jawale et al. [6] studied the booming noise generated by hangers and engine mounts within the exhaust system. Additionally, Chatterjee et al. [7] identified the root causes of the booming noise generated by tailgate modes.
Various strategies have been employed to mitigate the booming noise emanating from internal combustion engine vehicles. Active control techniques that generate harmonics similar to those responsible for the drivetrain-induced booming noise have been employed to address this issue [1]. A thorough analysis of the noise source has led to adjustments in the contributions of primary noise transmission paths, resulting in significant improvements [4]. To reduce exhaust system noise, an approach to enhance transmission loss (TL) has been proposed. This method involves selecting the key design parameters using Helmholtz resonators and conducting acoustic simulations [5]. Moreover, noise sources have been identified, and experimental enhancements have been validated through modifications in the support positions of the exhaust system, optimization of the shape of the exhaust system components, and enhancement of the vibration transfer efficiency by optimizing the dynamic properties of the rubber compound [6]. Gupta et al. [8] conducted experiments aimed at isolating the vehicle and interior acoustic modes by examining their correlations. Oh et al. [9] and Kim and Altinsoy [10] applied active feedforward control techniques to reduce road and engine booming noise, respectively. Notably, they analyzed the sources and contributions of engine-induced booming noise using Transfer Path Analysis (TPA) as an initial step in the signal analysis for control. Wu et al. [11] applied a similar analysis method to investigate the cause of booming noise arising from the chassis pitch mode induced by the engine's rotational component, which was attributed to excessive suspension energy through the fifth torsional mode of the drivetrain and conducted research to address this issue. Herrmann et al. [12] developed predictive models for noise improvement by combining the chassis and interior acoustic models. These models were based on simulated road profiles from which sound pressure data were extracted and validated using experimental data. Several studies have focused on enhancing the quality of booming noise [13,14,15].
In recent years, as electric vehicles have gained increasing popularity, extensive research efforts have been directed towards minimizing the noise generated by these vehicles. These studies specifically focused on addressing the booming noise associated with the powertrains of electric vehicles. Li et al. [16] conducted experiments to validate structural optimization techniques for both the rotor and stator of an 8-pole 48-slot permanent magnet synchronous motor (PMSM) commonly used in electric vehicles. Their objective was to reduce the zeroth-order spatial electromagnetic force generated by a motor. They meticulously analyzed the origins of this force and attempted to reduce it. Li et al. [17] identified vibration issues stemming from the distortion in the air-gap magnetic field of a permanent-magnet brushless direct-current motor (BLDC motor). This distortion was attributed to the dynamic eccentricity within the rotor, which is a phenomenon arising from the electromechanical coupling specific to electric vehicles. Zeng et al. [18] employed various techniques, including order analysis, Operational Deflection Shapes (ODS), and Transfer Path Analysis (TPA) to determine whether the secondary component of the drivetrain of an electric vehicle was the primary source of vibration. They analyzed the coupling between the powertrain and rear axle, which induced vibrations, leading to overall resonance in the drivetrain. These vibrations were subsequently transmitted to the chassis through the mounts and V-rods. Holehouse et al. [19] developed a comprehensive finite element analysis model that encompasses the entire drivetrain. The accuracy of the model was validated using experimental data. They proposed an analytical approach to predict the noise levels induced by electromechanical couplings, with particular emphasis on the significance of the rotor properties. Sensitivity analysis during the modeling process proved to be instrumental. Deng et al. [20] created an analysis model for electric powertrain systems operating under varying speed conditions with a specific focus on NVH analysis. They improved the reliability of the model by incorporating experimental results related to the natural modes of the stator. The validity of the model was established by comparing the vibration and noise signals between the experimental and analytical outcomes. Furthermore, bearing force analysis using multibody dynamics simulations confirmed that the noise components induced by the stator teeth predominated, with minimal impact from the torque ripple. Ultimately, they predicted noise levels by measuring the sound pressure arising from the vibrations within the housing.
Studies have also been conducted on the booming noise generated by parts of electric vehicles other than powertrains. Park and Hwang [21] explored the booming noise originating from the rear cross member due to road-induced vibrations and introduced methods to construct a model for system-level analysis. Liao et al. [22] and Yu [23] conducted respective studies on the tailgates of sedans and sport utility vehicles (SUVs), and Liao et al. [24] conducted a similar study focusing on the noise generated from the roof and floor of hybrid vehicles. Various methods have been explored to reduce this booming noise. Park and Hwang elucidated the booming noise generation mechanism caused by the torsional mode of the rear cross member [21]. They applied topology optimization and multi-model optimization (MMO) and developed a conceptual design, presenting concrete design proposals applicable to actual implementation and production. Acoustic metamaterials were incorporated based on the band gap theory into the finite element analysis model of the vehicle’s tailgate to diminish the booming noise arising from the thin sheet metal components of the tailgate [22]. A carefully designed approach incorporating resonators to decouple the interaction between body modes and internal acoustics was proposed to reduce booming noise and was subsequently validated through experimental confirmation [23]. The internal noise distribution inside the vehicle was acquired to reduce noise generated by vibrations on the roof and floor of the vehicle [24]. Materials equipped with damping and absorption capabilities were attached to the roof and floor of the vehicle to experimentally confirm the noise reduction effects. Yin et al. [25] eliminated road noise using active noise control (ANC) through the application of an adaptive parallel filter method (APFM). Additionally, Qian et al. [26] and Zhang et al. [27] conducted research to improve the sound quality of booming noise in electric vehicles.
According to the author's investigation, most existing studies related to booming noise primarily focus on analyzing internal combustion engine vehicles, with broader research on electric vehicle NVH emerging only recently owing to the proliferation of electric cars. Nonetheless, few research instances specifically address the booming noise in electric vehicles, especially those related to tailgates. The afore-mentioned studies appear to cover the entirety of research conducted in this domain. As mentioned earlier, Liao et al. [22] proposed noise reduction methods by attaching acoustic metamaterials to the tailgate, whereas Yu [23] studied the tailgate but faced limitations involving additional weight and cost owing to the use of dynamic absorbers. Instead of introducing extra components such as absorbers, modifying the design of the tailgate panel and adjusting the boundary conditions between the panel and vehicle chassis, thus improving the system itself, presents a more efficient solution to mitigate booming noise with relatively less time and expense. Although the research objectives differed, similar problem-solving approaches were employed. Park and Hwang [21] sought solutions by enhancing the cross-member itself rather than attaching it, exemplifying this strategy.
To overcome these challenges, this study not only identified the causes of road-induced booming noise in electric cars but also proposed solutions by modifying the dynamic characteristics of the tailgate itself, eliminating the need for additional elements. Additionally, the research facilitated the investigation of booming noise by creating a finite element model of the tailgate during the preliminary design stage, a step before the finalization of the entire model. While previous research emphasized the necessity of models for pre-analyzing booming noise [12], most studies attempted problem analysis by interpreting finite element models encompassing the entire vehicle and tailgate [8,12,22,23]. Although modeling methods that target the entire completed system have the advantage of precision, they consume a significant amount of time and resources. Moreover, when interpreting based on the final model, numerous constraints arise during the modification process, given that most designs are already in their final stages. To address these limitations, we employed simplified tailgate finite element models suitable for the design phase, along with the careful selection of essential design factors that consider the vehicle body and boundary conditions. This approach allowed us to efficiently construct a model within an accuracy range suitable for analysis without exceeding the necessary precision. This enables the analysis of the dynamic characteristics related to booming noise before physical production, thereby reducing the time and cost required for modeling.
The remainder of this paper is structured as follows. In Section 2, the mechanism of booming noise generation was analyzed through experimental methods. The vehicle interior noise components were obtained through road tests and the ODS were acquired from the vibration signals of the tailgate. The relationship between the tailgate and the booming noise was identified. Additionally, the mechanism of booming noise generation was elucidated by selectively determining the major modes of the tailgate related to the booming noise through modal tests. In Section 3, commercial finite element analysis software (ANSYS) was used to present the modeling process of the tailgate, representing the modes related to booming noise. The modeling elements and properties of the tailgate were defined. Simultaneously, the coupling conditions of panels composed of inner, outer, and reinforcements were addressed. Based on the evaluation results of various boundary conditions with the vehicle body, the major boundary conditions were selected to construct the final analysis model, which was validated using the experimental results. In Section 4, design proposals for reducing booming noise in the tailgate were presented. The effects of the improvements were quantified by comparing the natural frequency changes and maximum deformations under random excitation between the existing and improved models. Finally, Section 5 summarizes the major findings of this study and provides conclusions and discussion.
2. Experimental Analysis
The subject of this study is the tailgate of an electric SUV, in which booming noise occurs, consisting of various components, each serving a different function. The structure of the tailgate, as shown in Figure 1, consists of trim, inner panel, outer panel, glass, and other components from inside the vehicle. The outer panel is combined with glass, garnishes, spoiler, lamps, and other elements. The inner and outer panels, which are responsible for the primary structural functions of the tailgate, are made of steel and have complex shapes, as shown in Figure 1. These shapes result from cross-sectional designs that increase the area moment of inertia at locations requiring localized stiffness reinforcement or considering combinations with other parts. In particular, the inner panel, which has numerous points of connection with the vehicle, experiences substantial localized static and dynamic loads. Therefore, although it has a cross-sectional structure that is resistant to bending, it relies not only on panel stiffness but also on reinforcements at points where the boundary conditions connecting the tailgate to the vehicle are attached to ensure resistance against bending. Moreover, the top of the outer panel of the tailgate is equipped with a spoiler to eliminate the air turbulence generated from the back of the vehicle, and at the central bottom, there is a taillight cover. Within the car, trims are integrated, whereas externally, garnishes and other interior/exterior elements are combined, all constructed from plastic materials.
The components of the tailgate are combined in various ways based on their functions and materials. As previously explained, owing to the loads from various structures connected to the vehicle, the inner panel is welded at specific locations with reinforcements to increase its stiffness. The outer panel is hemmed onto the reinforced inner panel. Hemming is a process in which the flange of the outer panel is folded over the edge of the inner panel and mechanically joined. It is used for hoods, tailgates, doors, etc., and is categorized diversely based on the way the panels are folded. Thus, the inner and outer panels enhance their stiffness along the outer boundary using hemming connections. The outer panel features an internal square-shaped opening at the top filled with glass. The glass edges are adhered to the outer panel using a structural adhesive. The assembled panel and glass constitute the primary structure of the tailgate. In contrast, the interior trims, garnishes, taillight cover, and other components mounted on the outer panel are made of lightweight plastic. These components do not significantly contribute to structural stiffness and are attached to the tailgate panel using plastic clips or bolts.
As shown in Figure 2, the assembled tailgate connects to the vehicle through various components. At the top corners of the tailgate, hinges support the tailgate's weight while also acting as pivot points when opening and closing the tailgate. On the left and right sides of the tailgate glass, gas lifts, and spindles are operated by a motor, allowing automatic opening and closing of the tailgate while also providing support and fixation at specific positions. Below are guide bumpers on the left and right sides that support the tailgate from the vehicle body when it is closed. Overslam bumpers are designed at the left and right corners of the lower part of the tailgate to prevent sudden impacts when the tailgate is abruptly closed. A latch-striker is fixed to the body at the center of the lower part of the tailgate, securing the tailgate in place. Additionally, along the contact boundary between the tailgate and body, weather strips prevent moisture infiltration and fulfill some functions related to NVH.
An experiment was conducted on an electric SUV equipped with a tailgate to assess the booming noise caused by the tailgate during driving tests. The experiment involved measuring the noise and vibrations while driving on rough roads at a constant speed. Microphones were used to measure the noise inside the vehicle. Accelerometers were attached to the exterior of the tailgate to capture vibration signals. By comparing these signals, the correlation between the interior vehicle noise during road driving and the tailgate vibration signals was determined.
The test conditions for analyzing booming noise and tailgate behavior based on the measured noise and vibration signals were as follows. The experimental vehicle was driven at a constant speed of 40 km/h for approximately 22 s on a test track designed to sustain continuous impact forces within the broadband range, following the standardized test methods of the automotive manufacturer. To capture the interior noise, microphones (378B02) from PCB Inc. were installed at the height of the headrest in the middle of the front and rear seats inside the vehicle, as shown in Figure 3. To understand the behavior of the tailgate, accelerometers were attached to 12 points marked with red dots on the tailgate, as shown in Figure 4, to acquire vibration signals. The accelerometers used in the experiment were 3-axis accelerometers (356A15) from PCB Inc., capable of measuring from 1.4 to 6.5 kHz. Noise and vibration signals were collected using a spectrum analyzer (LMS SCADAS Mobile SCM05) from SIEMENS Inc., and the gathered data were analyzed using data analysis software (Simcenter Testlab 2019.1) to assess the results using diverse approaches for noise, vibration, and durability testing.
The method used to identify the main components of the noise signal acquired during driving is as follows: the time response of the sound pressure level (SPL) from the microphone was transformed into the frequency domain using the Fast Fourier transform (FFT). Subsequently, the noise spectrum within the 60 Hz range was obtained to confirm the major components. To analyze the changes in the frequency components over time, spectra were continuously acquired over the driving duration and analyzed for variations. Using this method, the noise signal measured at the central area of the rear seat over time represents the frequency components of the noise, as shown in Figure 5. The color map illustrates how the frequency components of noise (x-axis) change over the driving time (y-axis), indicating the intensity of the sound pressure (Pa) through colors. The higher the sound pressure, the redder the color, whereas lower sound pressure is represented using shades of blue. The sound pressure utilized C-weighted SPL. This weighting was applied because A-weighting, which is commonly used in noise measurements, tends to underestimate low-frequency sound pressure based on the human auditory response curve. In cases such as this one, where low-frequency noise is a crucial measurement target, using the C-weighted SPL, which emphasizes the low-frequency range, for analysis is more reasonable.
By analyzing the characteristics of the noise signal following the method described earlier, it was observed that noise occurred in the frequency range of 20 Hz to 50 Hz (Figure 5). Owing to the irregular impact forces acting on the rough road track, the noise level varied over time. However, because the measurements were performed under constant-speed driving conditions, significant noise components appeared within specific frequency ranges and varied in their levels. The main noise components were identified at 28 Hz and 37 Hz. Comparing the SPL intensities, it was evident that the noise at 28 Hz dominated over 37 Hz. In addition, at approximately 25 Hz, the SPL was relatively low; however, the noise persisted consistently over specific periods of time. Summarizing these results, the frequency ranges where noise occurred can be summarized as 25 Hz, 28 Hz, and 37 Hz. In the subsequent experimental results, the behavior of the tailgate related to these frequency ranges is analyzed.
The main components of the tailgate vibration signal were identified using a method similar to that used to analyze the noise signal. When representing the frequency components of acceleration over time from the vibration signals measured on the left, center, and right panels beneath the tailgate glass simultaneously with the noise signals, it appears as shown in Figure 6. Similar to the noise analysis results, it was observed that the vibration signal, which was influenced by the irregular road surface acting in impact, varied in intensity over time. However, the identification of specific vibration components over time under constant-speed conditions allowed us to understand the major behavior of the tailgate. When examining the characteristics of the vibration signals based on measurement locations, it is evident that the 28 Hz component is prominent in the central part of the tailgate, and at approximately 25 Hz, the magnitude of the vibration signal is weaker than the 28 Hz component but persists consistently over a certain range. However, on the left and right sides, the 25 Hz and 28 Hz components are almost absent, whereas the 37 Hz and 43 Hz components are dominant. The ODS analysis method introduced next is utilized for a more systematic analysis.
ODS was employed to conduct a more in-depth analysis of tailgate behavior in the main frequency range. This refers to the deformed shape during operation and serves as an analytical technique for visualizing the movements occurring in real systems. In this study, it was utilized to visualize the tailgate behavior at specific frequencies during driving. It is commonly used to represent the real movements of a target either in the time domain or at specific frequencies. The analysis focused on studying the movements at particular frequencies using frequency spectra. To achieve this, auto-spectra and cross-spectra were acquired from the signals of both the reference accelerometer and the simultaneous measurement of the roving accelerometer. The movement of the roving location in relation to the reference position was visualized by integrating the magnitude information from the auto-spectra and the phase information from the cross-spectra. At each point where the motion data was desired, roving accelerometers were attached to obtain the signals. This study discerns how the actual system behaves by assigning the measured acceleration signals to the corresponding positions on the shape. Through this analytical method, the behavior of the tailgate in response to road-induced forces during driving, which lead to noise generation, was examined at specific frequencies.
The behavior of the tailgate in the frequency range in which noise occurred was analyzed using the ODS. The ODS results for the primary frequencies used to analyze the relationship between vibration and noise, based on the comparison of vibration signals depending on the noise signal components and the position of the tailgate, are shown in Figure 7. At 24.0 Hz, the tailgate exhibited an overall front-to-back movement, with the upper part dominating compared to the lower part. At 28.4 Hz, a rigid body movement of the tailgate in the front-to-back direction was observed, along with significant deformation and movement at the central part of the tailgate compared with other points. These movements can induce a booming noise through the expansion and contraction of air inside the vehicle compartment. The experimental results confirm that the noise occurring at approximately 25 Hz and 28 Hz is manifested by the behavior of the tailgate. Conversely, significant acceleration elements were detected at the edges of the tailgate, specifically at 38.6 Hz. ODS analysis of the tailgate in this frequency range revealed that in the region, movements in both longitudinal directions were seen in certain areas of the tailgate. However, the tailgate exhibited an overall twisting motion with phases alternating laterally and vertically. Although local expansions and contractions were observed in some regions of the tailgate, their contribution to the generation of booming noise is expected to be negligible.
Modal tests were conducted on a tailgate in its actual installed state to understand the relationship between the behavior of the tailgate during driving tests and its modes. Modal shapes represent the unique configurations of a system in the absence of external forces. Modal experiments were carried out within the 100 Hz range, where tailgate behavior was observed, as indicated by well-known modal analysis procedures. Accelerometers were attached to the glass of the tailgate, and at 50 specific points marked by red dots (Figure 8), impact hammers were applied sequentially to obtain the frequency response functions (FRFs) from the accelerometer output signals in response to the hammer input signals. This process allows the extraction of natural frequencies and mode shapes. The experiments utilized PCB's impact hammer (086D20). The test results obtained for the tailgate through the modal experiments are illustrated in Figure 9.
Summarizing the results of the tailgate modal tests, the following observations were made. The tailgate exhibits its primary mode at 23.7 Hz, characterized by a predominant back-and-forth translational motion of the upper part of the tailgate, with some bending deformations evident in the panels. In contrast, at the second mode, 28.6 Hz, the tailgate predominantly exhibited bending deformations, particularly at the central lower part of the tailgate, accompanied by some translational motion of the entire tailgate in the same direction. Conversely, the third mode at 37.6 Hz indicates a global twisting deformation of the tailgate in the fore-aft direction. Combining the findings from the modal experiments, it can be concluded that the predominant translational motion of the entire tailgate and the bending deformations of the tailgate panels at 23.7 Hz and 28.6 Hz could significantly impact the interior cabin noise, potentially contributing to interior noise. However, the twisting mode observed at 37.6 Hz is expected to have a comparatively minor effect on the interior noise of the vehicle.
The influence of the separable boundary conditions between the tailgate and the vehicle was experimentally analyzed. As shown in Table 1, the experimental setup was configured based on the presence or absence of removable boundary components, including guide bumpers, gas lifts, spindles, overslam bumpers, and weather strips. Case 1 represented the baseline condition with all connecting structures intact. Cases 2–5 involved the measurement of the natural frequencies of the tailgate after removing one component each from the initial setup, namely, the guide bumpers, gas lifts, spindles, over-slam bumpers, and weather strips. A comparison of the changes in dynamic characteristics when each boundary condition was removed from the initial state provided significant results. By comparing the natural frequency variations between Cases 1 and 2, where the guide bumpers were removed, a significant decrease in the first to third natural frequencies was observed. This result indicated a substantial impact of the guide bumpers on the dynamic characteristics, confirming their dominant influence. Conversely, in the experimental results of Cases 3–5, the changes were negligible compared to the baseline Case 1, suggesting their limited influence. In conclusion, the experimental analysis demonstrated that, among the various connecting structures between the tailgate and the vehicle, guide bumpers had the most significant impact on the dynamic characteristics of the tailgate.
By analyzing the results from the noise, vibration, and tailgate modal tests conducted to date, the origins of the booming noise within the vehicle while driving can be explained as follows. Through driving tests, significant noise frequencies originating from the rear-seat area were identified as 25 Hz, 28 Hz, and 37 Hz, with 28 Hz being the dominant component. Furthermore, examining the vibration signals of the tailgate measured simultaneously with the noise signals during the driving tests, clear vibration components at 25 Hz and 28 Hz were evident in the central part, while a component at 37 Hz appeared on the left and right sides. Comparing these observed tailgate behavioral characteristics obtained through ODS with the results of the modal tests yielded meaningful conclusions.
Upon examining the primary frequency ranges identified in the ODS of the tailgate to analyze the sources of the booming noise, several observations can be deduced. Generally, it manifests due to external forces acting on the system and its inherent modes. Examining the results of the tailgate, the behavior similar to natural modes was observed at 24.0 Hz and 28.4 Hz, where the tailgate exhibited significant back-and-forth movements. Additionally, at 38.6 Hz, the entire edge of the tailgate twisted, indicating that the twisting mode of the tailgate was expressed as the actual movement through it. When comparing the noise and vibration frequencies, similarities exist at 25 Hz, 28 Hz, and 37 Hz. Therefore, it can be assumed that the tailgate behavior influences booming noise generation dominantly in both frequency ranges. However, to clearly elucidate the mechanism of booming noise generation, not only the similarity in natural frequencies but also the tailgate behavior must be considered. The behavior of the tailgate, characterized by the complex deformation of the panel in both front and rear directions at 23.7 Hz and 28.4 Hz, is closely related to the expansion and contraction of the vehicle interior air space, thus having a significant connection with booming noise. However, at 38.6 Hz, the tailgate's behavior involves overall twisting, which has minimal potential to expand or contract the interior, making it less likely to contribute significantly to noise generation. Therefore, it is reasonable to conclude that the similarity in frequencies and booming noise occurrence is independent in this frequency range.
3. Dynamic Modeling
The process of constructing the finite element analysis model for analyzing the behavior of the tailgate causing booming noise is divided into two stages: the individual tailgate in a free-free state and the final model combined with the actual vehicle. The detailed process is as follows: considering the structure and function of each component constituting the tailgate, major modeling elements are selected, and these elements are simplified from the 3D model files using an appropriate procedure. The properties of the selected modeling elements were defined, and the assembly conditions between the parts constituting the tailgate were applied to construct the tailgate model. This model was then validated for its accuracy by comparing it with the tailgate test results conducted in a free-free condition. Additionally, the boundary conditions of the tailgate were defined by utilizing the modal test results of various coupling conditions between the tailgate and the vehicle body. Finally, the validated free-free state tailgate model is modified to incorporate the coupling conditions with the vehicle body, creating the analysis model for the tailgate in its actual installed state. The commercial finite element analysis software ANSYS Workbench 2022 R1's Mechanical and Modal modules were used in the modeling process.
3.1. The tailgate model with free-free boundary conditions
When constructing the tailgate model, the selection of the major components considers their structural characteristics. As introduced in Section 2, the tailgate is composed of trim, inner panel, outer panel, and glass from inside the vehicle. It includes structures in which components such as spoilers, garnishes, and taillight covers are attached to the outer panel. However, the essential elements embodying the structural characteristics of the tailgate are the inner and outer panels and the glass. The other parts have relatively low rigidity compared with steel or glass, performing auxiliary functions and making their exclusion from the modeling process feasible. However, spoilers and taillight covers possess significant mass and are attached to specific areas outside the tailgate. Excluding them from the model could oversimplify the model and potentially compromise its accuracy. Therefore, these components were included in the model. As a result, the free-free state tailgate model consists of the inner and outer panels, glass, spoiler, and taillight cover.
Before establishing the model, simplification of the 3D model is essential for efficient finite element modeling, instead of using the completed tailgate shape directly. The core structure of the tailgate, including the inner and outer panels, typically has a complex design to satisfy various requirements in the final design stage. However, these elements have minimal impact on the dynamic characteristics of the tailgate. Moreover, many elements can be created unnecessarily during the mesh generation process for analysis, thus disrupting the efficient modeling process. Additionally, to address this booming issue effectively, it is crucial to build a model using shapes available from previous design stages rather than the finalized model. Analyzing the potential booming improvements based on these shapes is essential. To avoid excessively compromising the accuracy of the model, the simplification of the tailgate panels focuses on the elements that play a significant role in the overall dynamic characteristics. Unnecessary holes were filled and features such as fillets were removed, resulting in a simplified model for analysis, as shown in Figure 10. During this process, the CATIA V5 3D modeling software was utilized.
The selection approach for the appropriate elements corresponding to the characteristics of the main modeling targets is as follows. Shell elements are applied for the simplified tailgate inner and outer panels, reinforcements, and glass, which have thin sheet structures and play a crucial role in the bending deformation acting on the tailgate surface. Shell elements are suitable modeling elements that adequately reflect the effects of bending deformation while using a minimal number of elements. Typically, when solid elements are used for thin sheets, a large number of elements may be required to accurately capture the bending stiffness, leading to unnecessarily long analysis times or inaccurate results. Therefore, selecting the shell elements and inputting appropriate cross-sectional information is desirable for addressing this issue. On the other hand, the spoiler and lamp, chosen as the main modeling elements of the tailgate, are attached to specific areas of the outer panel of the tailgate. A distributed mass is applied to model these components and they are integrated into the outer panel. The tailgate's inner and outer panels, as well as the reinforcements, are all made of steel material with the same Young's modulus of 200 GPa and a density of 7850 kg/m³. The actual thicknesses of the panels and reinforcements were applied for the required thickness of the shell elements. For the tailgate glass, the material properties of glass, including Young's modulus of 76 GPa and a density of 1853 kg/m³, were used, and the actual thickness was input to model it using shell elements. Similarly, the spoiler and taillight cover was constructed with a model similar to the actual tailgate using the corresponding masses specified in the design requirements.
Each modeling element of the tailgate was applied with appropriate bonding conditions to reflect the actual structure. Before combining the inner panel with the outer panel or the outer panel with glass, suitable bonding conditions were defined for the inner panel and reinforcements to account for their effects. As described in Section 2, the inner panel of the tailgate, with various structures for connection to the vehicle body, employs a thin panel form. Additional reinforcements were added to each structure connected to the vehicle body to reinforce the rigidity of the thin inner panel of the tailgate and suppress panel deformation. These structures include hinge reinforcements at the top of the tailgate, gas lift/spindle reinforcements, guide bumper reinforcements, and latch reinforcements at the bottom. During the actual modeling process, the modal analysis results of the panels showed significant differences in the natural frequencies and modes of the tailgate based on the presence or absence of reinforcements. Therefore, appropriate modeling of the interaction between the inner panel and the reinforcements is crucial. They are welded along the edges and attached to the inner panel. To reflect this, the bonding between the inner panel and those along the weld surfaces was established using the bonded condition in Contact (Figure 11).
The inner panel, strengthened with reinforcements, is connected to the outer panel using two different techniques: hemming and spot welding. The outer and inner panels are joined along the outer edges using hemming, allowing relative motion between the panels. To appropriately model this, the no-separation condition was applied, allowing relative movement between the panel surfaces. At the inner boundaries of the panel, where hemming and spot welding were used for strong bonding, a bonded condition suitable for welding was applied (Figure 12). The tailgate glass was strongly bonded to the outer panel using a structural adhesive along the boundaries. To represent this, a bonded condition was applied to couple the glass to the outer panel. Additionally, the spoiler, occupying a large area on top of the tailgate, and the taillight covers that extended horizontally to the bottom of the glass were bonded in their respective positions, creating the tailgate model.
Modal experiments were conducted on the separated tailgate from the actual vehicle to validate the completed tailgate model. The tailgate was suspended freely at the left and right hinge points to create a free-free condition. Near the hinges, the presence of plastic spoilers and garnishes rendered localized deformations unrelated to the structural rigidity of the tailgate panel, so to capture the overall modal shape of the tailgate, the modal tests were conducted from the glass surface below the spoiler. Following the methodology shown in Figure 8 of the previous section, accelerometers were attached to the glass, and 50 points marked with red dots were impacted with the impact hammer to obtain the frequency response functions (FRF). These measurements were then used to extract the modal shapes of the tailgate.
The results of the tailgate experiments under free-free conditions were compared with the analytical results to validate the tailgate model. From the experiments, the natural frequencies under free-free conditions were confirmed to be 19.1 Hz, 35.7 Hz, and 45.2 Hz (Figure 13). At 19.1 Hz, the lower sides of the tailgate exhibited torsional behavior in a direction perpendicular to the surface of the tailgate, while at 35.7 Hz, bending shapes were observed on the lower and lateral parts of the tailgate. At 45.2 Hz, significant deformation was observed in the central parts of the tailgate, both horizontally on the sides and vertically on the upper and lower portions, particularly emphasizing the deformation in the central region of the tailgate, perpendicular to its surface. The natural frequencies and mode shapes of the tailgate extracted under free-free conditions were compared with the modal analysis results of the model, as shown in Table 2. Using ANSYS Workbench 2022 R1 Modal, the natural frequencies of the tailgate under free-free conditions were found to be 20.8 Hz, 36.0 Hz, and 44.0 Hz, which closely matched the experimental results. To verify not only the natural frequencies but also the similarity in the mode shapes, the experimental and analytical results were compared from the glass to the bottom of the tailgate, excluding the top of the tailgate, where modal tests were not performed. The 1st to 3rd natural modes observed in the simulation directly correspond to the mode shapes obtained from the experiments. Therefore, it can be concluded that the individual tailgate model accurately reflects the actual behavior under free–free conditions.
3.2. The tailgate model mounted on the vehicle
After successfully validating the tailgate model under free-free conditions, the final version was developed by incorporating the connection components with the actual vehicle. In the previous section describing the tailgate structure, various connections and their functions between the vehicle and the tailgate were detailed. In summary, from the top to the bottom of the tailgate are the hinges, gas lifts and spindles, guide bumpers, overslam bumpers, and latches. Additionally, there is a weather strip that wraps around the entire contact surface between the tailgate and the vehicle body. Determining the specific method to apply this in the final model requires careful consideration.
These boundary conditions can be broadly classified into two categories based on their characteristics. By evaluating their impact using these attributes, it is possible to simplify the boundary conditions and achieve efficient modeling. It is conceivable to consider models that encompass all the various structures between the vehicle body and the tailgate; using a model with numerous parts can demand excessive analysis time and might pose challenges for practical use in the intermediate stages of the design process, diminishing the utility of the model. Hence, simplification is feasible within limits that do not compromise the accuracy of the model, thereby maximizing the advantages of the model. From this perspective, when categorizing the boundary conditions, the essential elements for the tailgate attachment include hinges and latches. The remaining components, such as gas lifts, spindles, guide bumpers, overslam bumpers, and weather strips, can be utilized considering their detachability. Following the procedures outlined in Section 2, the influence of these components was compared and analyzed. It was experimentally determined that among the various structures connecting the tailgate and the vehicle, the guide bumper significantly influenced the dynamic characteristics of the tailgate. In addition, within a range that did not significantly compromise the accuracy of the model, other elements were simplified or excluded to simplify the boundary conditions. A foundation was established for modeling, with the guide bumper as the focal point. Considering these results, the final tailgate model, validated through previous experiments under free-free conditions, was completed in the form of a tailgate model with the attached guide bumper.
As shown in Figure 14, the guide bumper consists of parts connected to the vehicle body and the tailgate. The portion connected to the vehicle body is composed of steel, fixed to the body, and surrounded by rubber. The section attached to the tailgate was made of plastic. Before simplifying the intricate structure of the guide bumper, a local coordinate system is defined based on the guide bumper as follows: consider the direction perpendicular to the surface where the guide bumper meets the tailgate as the z-axis, and when the tailgate is closed, the direction in which the rubber part of the guide bumper connected to the vehicle body and the plastic part of the guide bumper connected to the tailgate meet is defined as the x-direction. According to the right-hand rule, the y-axis becomes the direction perpendicular to both the x- and z-axes (Figure 14d).
Given the impact of the guide bumper's structure on the dynamic characteristics of the tailgate, the strategy for simplifying the intricately shaped guide bumper while considering the elements affecting the tailgate's dynamic behavior is outlined as follows: Based on the introduced structure of the guide bumper, it not only plays a role in providing stiffness for deformation in the z-direction, where the guide bumper surface contacts the tailgate surface but also has structural features that can resist rotation in the y-direction when the two surfaces are in contact. Therefore, the guide bumper is simplified by equivalent stiffness for translational stiffness in the z-direction and rotational stiffness in the y-direction, denoted as and , respectively.
To define the equivalent stiffness caused by the guide bumper, finite element analysis was conducted following these steps: To obtain the stiffness for translational movement in the z-direction, as depicted in Figure 15a and 15b, deformation occurring in the z-direction when the guide bumper was attached to the tailgate was simulated. The force generated on the opposite side, where it connects to the vehicle body, was extracted. The stiffness for translational movement in the z-direction was determined based on the relationship between force and displacement. Furthermore, as shown in Figure 15c and 15d, when the guide bumper experienced a rotational displacement in the y-direction upon contact with the tailgate, the equivalent rotational stiffness was obtained from the counteracting moment generated on the opposite side of the guide bumper connected to the vehicle body. The acquired stiffness values were then applied to the free-free model to construct a final tailgate model.
To validate the final tailgate model with boundary conditions applied to the previously validated free-free state of the tailgate, the measured mode shapes of the tailgate in the state connected to the actual vehicle, analyzed in Section 2, were compared with the modal analysis results of the final model. As shown in Table 3, the analysis results of the constructed tailgate model reveal 1st, 2nd, and 3rd natural frequencies of 21.5 Hz, 27.8 Hz, and 34.7 Hz, respectively. Rigid body modes in the fore-aft direction, along with the deformation modes of the tailgate, appear at the 1st mode (21.5 Hz) and 2nd mode (27.8 Hz). Notably, at the second natural frequency of 27.8 Hz, a significant deformation occurred at the central bottom part of the tailgate. This characteristic aligns with the tailgate modes obtained in the experimental setup described in Section 2. Additionally, the torsional mode observed at 34.7 Hz shows opposite phase displacements at all four corners, resembling the results obtained in the actual experiments and confirming the validity of the finalized model. Considering the mode shapes, the mode at 34.7 Hz exhibits localized deformation in some areas, potentially contributing to noise generation. However, because the dominant behavior involves the overall twisting of the tailgate, its contribution to noise generation is expected to be minimal. Therefore, the next section explores strategies for enhancing the first and second natural modes.
4. Booming noise reduction
In this section, we analyzed the improvement strategies to reduce booming noise using the validated tailgate model. To examine the influence of variables in the tailgate system related to booming noise generation, we compared the changes in the natural frequencies of the tailgate closely associated with booming by increasing Young's moduli of the inner and outer panels and the stiffness of the guide bumper. Through this analysis, we selected the major design variables closely related to booming and proposed improvement measures that can be realistically applied in the design process to suppress the mode shapes that induce booming noise. Additionally, to quantitatively compare the extent of booming noise generation caused by road-induced vibrations under typical driving conditions, we assessed the effectiveness of the improvements by simulating the reduction in the maximum displacement experienced by the tailgate in response to random road-induced inputs.
The influences of the design parameters included in the validated tailgate model, verified in Section 3, were compared and analyzed. Examining the primary parameters related to the tailgate model, there are Young's modulus of the inner panel , Young's modulus of the outer panel , and the equivalent stiffness of the guide bumper , reflecting the real vehicle mounting conditions. Here, Young's modulus of the inner panel represents the local modulus around the structurally vulnerable area, as shown in Figure 16. The natural frequencies of the tailgate were examined through modal analysis, with the selected three variables increased to 2 times their current values to observe the resulting changes. The first, second, and third natural frequencies of the tailgate based on the values of these variables are listed in Table 4, and the impact of the design parameters on the natural frequencies of the tailgate is compared. In the order of significant impact, the stiffness of the guide bumper had the most substantial influence, followed by Young's moduli of the outer panel and inner panel.
By analyzing the changes in the tailgate's natural frequencies related to booming noise generation based on variations in each parameter, the following observations were made. First, when the stiffness of the guide bumper was doubled from its current value (as shown in Table 4), the first, second, and third natural frequencies increased by 0 Hz, 2.4 Hz, and 4.6 Hz, respectively. However, considering the dominating torsional behavior of the tailgate in this frequency range, expecting significant improvements in the booming noise was difficult, even though the increase in the third natural frequency was the most substantial, aligning with the findings in Section 2. Instead, attention should be given to the significant 2.4 Hz increase in the second natural frequency, which has the potential to contribute significantly to booming noise. A comparison with other cases highlighted the need to develop improvement strategies based on this increase. Second, comparing the changes in the natural frequencies in the model where Young's modulus of the outer panel was increased (as shown in Table 4), the first, second, and third natural frequencies of the tailgate increased by 0.7 Hz, 1.6 Hz, and 1.4 Hz, respectively. It was feasible to expect an effect due to an increase in the second natural frequency. In particular, for the outer panel, where significant deformation occurred in the lower part of the panel, there was no specific reinforcement structure. It was not possible to expect an effect to reinforce the weakness similar to the reinforcements applied to the inner panel. Therefore, we explored approaches to suppress modes related to booming by considering the overall stiffness increase effect of the panel. Finally, when examining the changes in the first, second, and third modes of the tailgate owing to an increase in Young's modulus of the inner panel (as shown in Table 4), the effects of the modulus increase were found to be minimal, contrary to expectations. Despite attempting to enhance the stiffness of the vulnerable section at the lower center of the inner panel, where tailgate deformation predominantly occurs, the impact was minor. Therefore, it is challenging to anticipate significant improvements through an increase in the natural frequencies.
Summarizing the specific improvement strategies for the tailgate considering the impact of the analyzed key design factors, the following points can be noted. First, increasing the stiffness of the guide bumper can be effectively implemented by increasing its contact area, providing a corresponding effect without the need for complex changes in the components’ properties or significant alterations in the design. However, increasing Young's modulus of the outer panel improved the first and second modes. However, practically doubling the Young's modulus of the entire outer panel, which would require drastic changes in the panel's properties or thickness, is unrealistic because of concerns regarding cost and weight increases. Additionally, the outer panel is associated with the tailgate spoiler, lamps, and garnish and contributes to the overall design of the vehicle's rear. Consequently, implementing improvements using features such as reinforcements similar to the inner panel is challenging owing to various design constraints. Because applying improvement measures to the outer panel presents difficulties, a viable approach would be to focus on design changes near the central area of the inner panel, which is relatively free from design constraints within the vehicle. However, based on previous analysis results, increasing the Young's modulus in this area did not result in a significant improvement. Therefore, alternative solutions are required to address this issue.
A method for reinforcing the weak area in the inner panel of the tailgate was analyzed by modifying the panel shape, as shown in Figure 17. A reinforcing structure was introduced as a long horizontal rectangle located at the bottom, where deformation occurred in the tailgate modes. This structure, which fills some of the existing holes in the inner panel, connects the previously disconnected parts of the panel horizontally, thereby enhancing the stiffness of the panel against bending. To assess the improvement realistically, the modified section of the inner panel was maintained at the same thickness and properties as the original panel. Modal analysis was conducted on the improved tailgate, confirming an increase of 0.8 Hz from 21.5 Hz to 22.3 Hz in the first mode and an increase of 3.7 Hz from 27.8 Hz to 31.5 Hz in the second mode. This allowed for an analytical evaluation of the stiffening effect achieved through the shape modification of the tailgate inner panel.
The improvement in the natural frequencies using the major variables in the tailgate corresponds to the fore-aft behavior of the tailgate, which generates a booming noise. First, enhancement by increasing the stiffness of the tailgate guide bumper suppresses the rigid-body behavior in the fore-aft direction, thereby mitigating the relevant mode shapes and reducing the likelihood of booming noise. In addition, improvements involving increasing Young's modulus of the outer panel and structural modifications near the weak area in the lower central part of the inner panel, where dominant deformations occur, reinforce the stiffness of the vulnerable points in the tailgate by enhancing the overall stiffness of the tailgate panel. This reduced the possibility of booming noise caused by the tailgate.
To quantitatively assess the improvement effects on the dynamic characteristics of the tailgate under typical road-induced excitations, a random vibration analysis was conducted. As depicted in Figure 18, a base corresponding to the part connected to the vehicle, that is, the tailgate, was created. Random excitations were applied vertically to the base to simulate the forces induced by road driving, and the tailgate response was analyzed. The random analysis method adhered to the procedures outlined in Part 3 Mechanical loads of the International Organization for Standardization (ISO) 16750-3:2007 (E). The frequency range for random excitation was set from 1 Hz to 1,000 Hz, with an acceleration root mean square (RMS) of 27.8 m/s2 (Figure 19). Following the guidelines of ISO 16750-3, a Power Spectral Density (PSD) of the acceleration acted vertically on the base surface. The deformation at the maximum deflection point on the tailgate was compared across different models. The analysis was performed using a commercial finite element analysis software (Ansys 2022 R1) with a Random Vibration module. Rayleigh damping was applied during the damping value extraction process. The frequency range corresponding to the half-power bandwidth was computed using the tailgate frequency response function (FRF) obtained under real vehicle conditions. The damping ratios for the first and second modes were extracted based on the Q-factor. Mass coefficient , and stiffness coefficient were obtained and utilized as input values for the Ansys random vibration analysis conditions.
Applying the previously described random loading conditions to the improved tailgate models, the results can be summarized as follows: In the case of the enhancement model with reinforced horizontal structures in the inner panel, the maximum deformation of the tailgate decreased by 13.8%, from 22.4 mm to 19.3 mm. For the improvement model obtained by increasing the stiffness of the guide bumper, the result showed a decrease from 22.4 mm to 21.4 mm, indicating a 4.5% reduction. A comparison of these results with the 1st and 2nd modes of the tailgate yielded significant insights. When confirming the point in which the maximum deformation occurs due to random excitation Figure 18b, it appeared at the center of the lower part of the tailgate. This was closely related to the second mode shape of the tailgate. Therefore, structural improvements to the inner panel that can directly enhance the area where deformation predominantly occurs are effective. As observed earlier, these improvements significantly increased the second natural frequency compared with the first natural frequency. However, for the guide bumper located near the top of the tailgate, it was anticipated that applying direct structural enhancements to reduce the deformation occurring at the bottom might not have a significant effect compared to the former. This was confirmed through the analysis results.
Analyzing the primary behaviors of the tailgate based on experimental data and utilizing a simplified tailgate model focusing on essential aspects offers several advantages over existing methods. Utilizing a model that examines the fundamental elements related to booming noise in advance enables an analysis of the dynamic characteristics associated with booming noise generation, similar to real vehicle installations. Moreover, by utilizing a highly functional model in the preliminary design stages, compared to conventional approaches, it is possible to analyze and evaluate the potential for booming noise generation in advance, enabling designs that take this into account. Additionally, efforts to mitigate the booming noise caused by the tailgate involve analyzing the characteristics of the variables constituting the tailgate system and identifying crucial design factors instead of relying on additional systems such as the widely utilized dynamic absorbers in previous research. Analytically interpreting the effects of these variables, considering the booming behavior, allows for more fundamental improvement strategies to reduce the booming noise caused by the tailgate. This approach offers an efficient method to address this issue.
5. Conclusions
This paper proposes solutions to reduce the booming noise generated by the tailgate of an electric SUV by improving its dynamic characteristics. This study confirmed the noise generation by the tailgate by comparing the noise and vibration signals measured during real vehicle tests. The dynamic behavior during noise generation was obtained from ODS of the tailgate, including the rigid body and deformation in both the fore-aft directions. Furthermore, this study identified the cause of the booming noise by revealing that ODS occurring during noise generation are manifested by the tailgate modes. To mitigate the booming noise, a simplified finite-element analysis model of the tailgate, which simplifies the complex shape and various boundary conditions, was established and validated using the experimental results. Improvement strategies to suppress modes closely related to tailgate booming were proposed and validated, and the analytical results confirmed a reduction in the maximum displacement owing to irregular random input forces transmitted to the vehicle body during real road driving. The key findings of the study are summarized as follows: The results of analyzing the dynamic characteristics of the driving vehicle using the proposed dynamic model are summarized as follows:
- An analytical model capable of analyzing solutions to reduce booming noise by improving the tailgate dynamic characteristics was developed. The model's consistency was ensured through sequential modeling and validation from a free-free state to the tailgate's state in the vehicle.
- By comparing the impact of the major design factors closely related to tailgate booming, the factors were ranked in the following order: guide bumper stiffness, tailgate outer panel Young's modulus, and inner panel Young's modulus at weak points. As the effect of increasing the latter was minimal, a structural shape change was proposed as the solution. Securing rigidity through this modification demonstrated improvement effects.
- To quantitatively evaluate the actual improvement level of tailgate behavior related to booming under conditions similar to normal driving, a random analysis was conducted following certified methods. The results showed a 13.8% reduction in maximum displacement of the inner panel of the tailgate due to structural changes.
- In an effort to reduce tailgate booming noise, effective solutions have been proposed by analyzing significant variables related to the system without relying on additional elements such as dynamic absorbers. These solutions offer a fundamental approach to improving the tailgate-induced booming noise, setting them apart from previous studies.
- By utilizing the developed model in the design phase of the tailgate, it is possible to predict the tailgate behavior related to booming in advance, thereby reducing the time and costs for solving booming issues. In addition, proactive responses to reduce booming noise through applied design processes based on the analysis results are feasible.
Author Contributions
Conceptualization, J.C. and K.K.; methodology, J.C., D.K. and J.L.; experiment, D.K., J.L., M.C., and M.K.; investigation, D.K., and J.L.; modeling, D.K., S.J., M.C., and H.L.; validation, D.K., S.J., and K.K.; improvement evaluation, D.K., S.J., K.K., C.M., H.L. and M.K.; writing—original draft preparation, D.K.; writing—review and editing, M.C. and J.C.; supervision, J.C.; project administration, J.C.; funding acquisition, J.C. All authors have read and agreed to the published version of the manuscript.
Funding
This work was supported by Hyundai Motor Co., Ltd. and sponsored by the National Research Foundation of Korea (NRF) through a grant from the Korean Government (MEST) (NRF-2021R1A2C2007979) and the Korea Institute for Advancement of Technology (KIAT) grant from the Korea Government (MOTIE) (P0012769, HRD Program for Industrial Innovation).
Institutional Review Board Statement
Not applicable.
Informed Consent Statement
Not applicable.
Data Availability Statement
Not applicable.
Conflicts of Interest
The authors declare no conflicts of interest.
References
- Kim, S.; Altinsoy, M.E. Comprehensive active control of booming noise inside a vehicle caused by the engine and the driveline. IEEE Access 2022, 10, 49725–49737. [Google Scholar] [CrossRef]
- Selvaraj, K.; Padavala, P.; Rajamohan, K.; Medisetti, J.R. Experimental investigation of low-frequency noise and vibration in a bus. SAE Tech. Pap. 2020, 1, 5082. [Google Scholar]
- Herrmann, M.; Jöst, R.; Kehl, F.; Özkan, A.; Pless, S.; Gauterin, F. Importance of vehicle body elements and rear axle elements for describing road booming noise. Vehicles 2020, 2, 589–602. [Google Scholar] [CrossRef]
- Lim, S.; Joo, K.; Ahn, H.; Park, Y.; Kang, Y. Transfer characteristics of vehicle air conditioners’ booming noise. J. Mech. Sci. Technol. 2014, 28, 2025–2031. [Google Scholar] [CrossRef]
- Yang, M.; Zhao, T.; Liu, Y.; Liu, X.; Hou, H. A case study of interior booming noise control in an HEV. In Proceedings of the 2016 International Conference on Innovative Material Science and Technology (IMST 2016), Shenzhen, China, 19–21 August 2016. [Google Scholar]
- Jawale, P.; Karanth, N.V.; Gaikwad, A.A.; Mutalik, K. Low frequency in-cab booming noise reduction in the passenger car. SAE Tech. Pap. 2019, 26, 171. [Google Scholar]
- Chatterjee, J.; Talwar, H.; Garg, S. An experimental study of mechanism of body panel vibration in booming noise reduction of passenger vehicles. SAE Tech. Pap. 2016, 28, 198. [Google Scholar]
- Gupta, G.; Gautam, R.; Jain, C. Study of coupling behavior of acoustic cavity modes to improve booming noise in passenger vehicles. SAE Tech. Pap. 2014, 1, 1974. [Google Scholar]
- Oh, S.; Kim, H.; Park, Y. Active control of road booming noise in automotive interiors. J. Acoust. Soc. Am. 2002, 111, 180–188. [Google Scholar] [CrossRef] [PubMed]
- Kim, S.; Altinsoy, M.E. A complementary effect in active control of powertrain and road noise in the vehicle interior. IEEE Access 2022, 10, 27121–27135. [Google Scholar] [CrossRef]
- Wu, Y.; Li, R.; Ding, W.; Croes, J.; Yang, M. Mechanism study and reduction of minivan interior booming noise during acceleration. Shock Vib. 2019, 2019, 1–17. [Google Scholar] [CrossRef]
- Herrmann, M.; Kralicek, J.; Stein, W.; Gauterin, F. Describing road booming noise with a hybrid simulation model using a time segmentation of the excitation load approach. Vehicles 2021, 3, 469–479. [Google Scholar] [CrossRef]
- Lee, S.; Chae, H. The application of artificial neural networks to the characterization of interior noise booming in passenger cars. Proc. Inst. Mech. Eng., Part D: J. Automob. Eng. 2004, 218, 33–42. [Google Scholar] [CrossRef]
- Shin, S.; Ih, J.; Hashimoto, T.; Hatano, S. Sound quality evaluation of the booming sensation for passenger cars. Appl. Acoust. 2009, 70, 309–320. [Google Scholar] [CrossRef]
- Siano, D.; Panza, M.A. Sound quality analysis of the powertrain booming noise in a Diesel passenger car. In ATI 2017 - 72nd Conference of the Italian Thermal Machines Engineering Association, Lecce, Italy, 06–08 September 2017.
- Li, X.; Zhang, L.; Ying, H.; Huang, S.; Zhang, Q. Study of suppression of vibration and noise of PMSM for electric vehicles. IET Electr. Power Appl. 2020, 14, 1274–1282. [Google Scholar] [CrossRef]
- Li, Y.; Wu, H.; Xu, X.; Cai, Y.; Sun, X. Analysis on electromechanical coupling vibration characteristics of in-wheel motor in electric vehicles considering air gap eccentricity. Bull. Pol. Acad. Sci. Tech. Sci. 2019, 67, 851–862. [Google Scholar] [CrossRef]
- Zeng, M.; Tan, B.; Ding, F.; Zhang, B.; Zhou, H.; Chen, Y. An experimental investigation of resonance sources and vibration transmission for a pure electric bus. Proc. Inst. Mech. Eng., Part D: J. Automob. Eng. 2020, 234, 950–962. [Google Scholar] [CrossRef]
- Holehouse, R.; Shahaj, A.; Michon, M.; James, B. Integrated approach to NVH analysis in electric vehicle drivetrains. J. Eng. 2019, 3842–3847. [Google Scholar] [CrossRef]
- Deng, C.; Deng, Q.; Liu, W.; Yu, C.; Hu, J.; Li, X. Analysis of vibration and noise for the powertrain system of electric vehicles under speed-varying operating conditions. Math. Probl. Eng. 2020, 2020, 1–9. [Google Scholar] [CrossRef]
- Park, J.; Hwang, K. The methodology of the system-level topology optimization for road booming noise. SAE Tech. Pap. 2023, 1, 27. [Google Scholar]
- Liao, Y.; Huang, H.; Chang, G.; Luo, D.; Xu, C.; Wu, Y.; Tang, J. Research on low-frequency noise control of automobiles based on acoustic metamaterial. Materials 2022, 15, 1–18. [Google Scholar] [CrossRef]
- Yu, W. Analysis and optimization of low-speed road noise in electric vehicles. Wireless Commun. Mobile Comput. 2021, 2021, 1–15. [Google Scholar] [CrossRef]
- Liao, L.; Zuo, Y.; Meng, H.; Liao, X. Research on the technology of noise reduction in hybrid electric vehicle with composite materials. Adv. Mech. Eng. 2018, 10, 1–8. [Google Scholar] [CrossRef]
- Yin, L.; Zhang, Z.; Wu, M.; Wang, Z.; Ma, C.; Zhou, S.; Yang, J. Adaptive parallel filter method for active cancellation of road noise inside vehicles. Mech. Syst. Signal Process. 2023, 193, 1–21. [Google Scholar] [CrossRef]
- Qian, K.; Hou, Z.; Liang, J.; Liu, R.; Sun, D. Interior sound quality prediction of pure electric vehicles based on transfer path synthesis. Appl. Sci.-Basel 2021, 11, 1–21. [Google Scholar] [CrossRef]
- Zhang, S.; Li, Y.; Xu, L.; Cao, Y. Development of an active sound generation system for sound quality in EVs at constant speed combined with subjective evaluation. Appl. Sci.-Basel 2022, 12, 1–29. [Google Scholar] [CrossRef]
Figure 1.
Tailgate assembly.
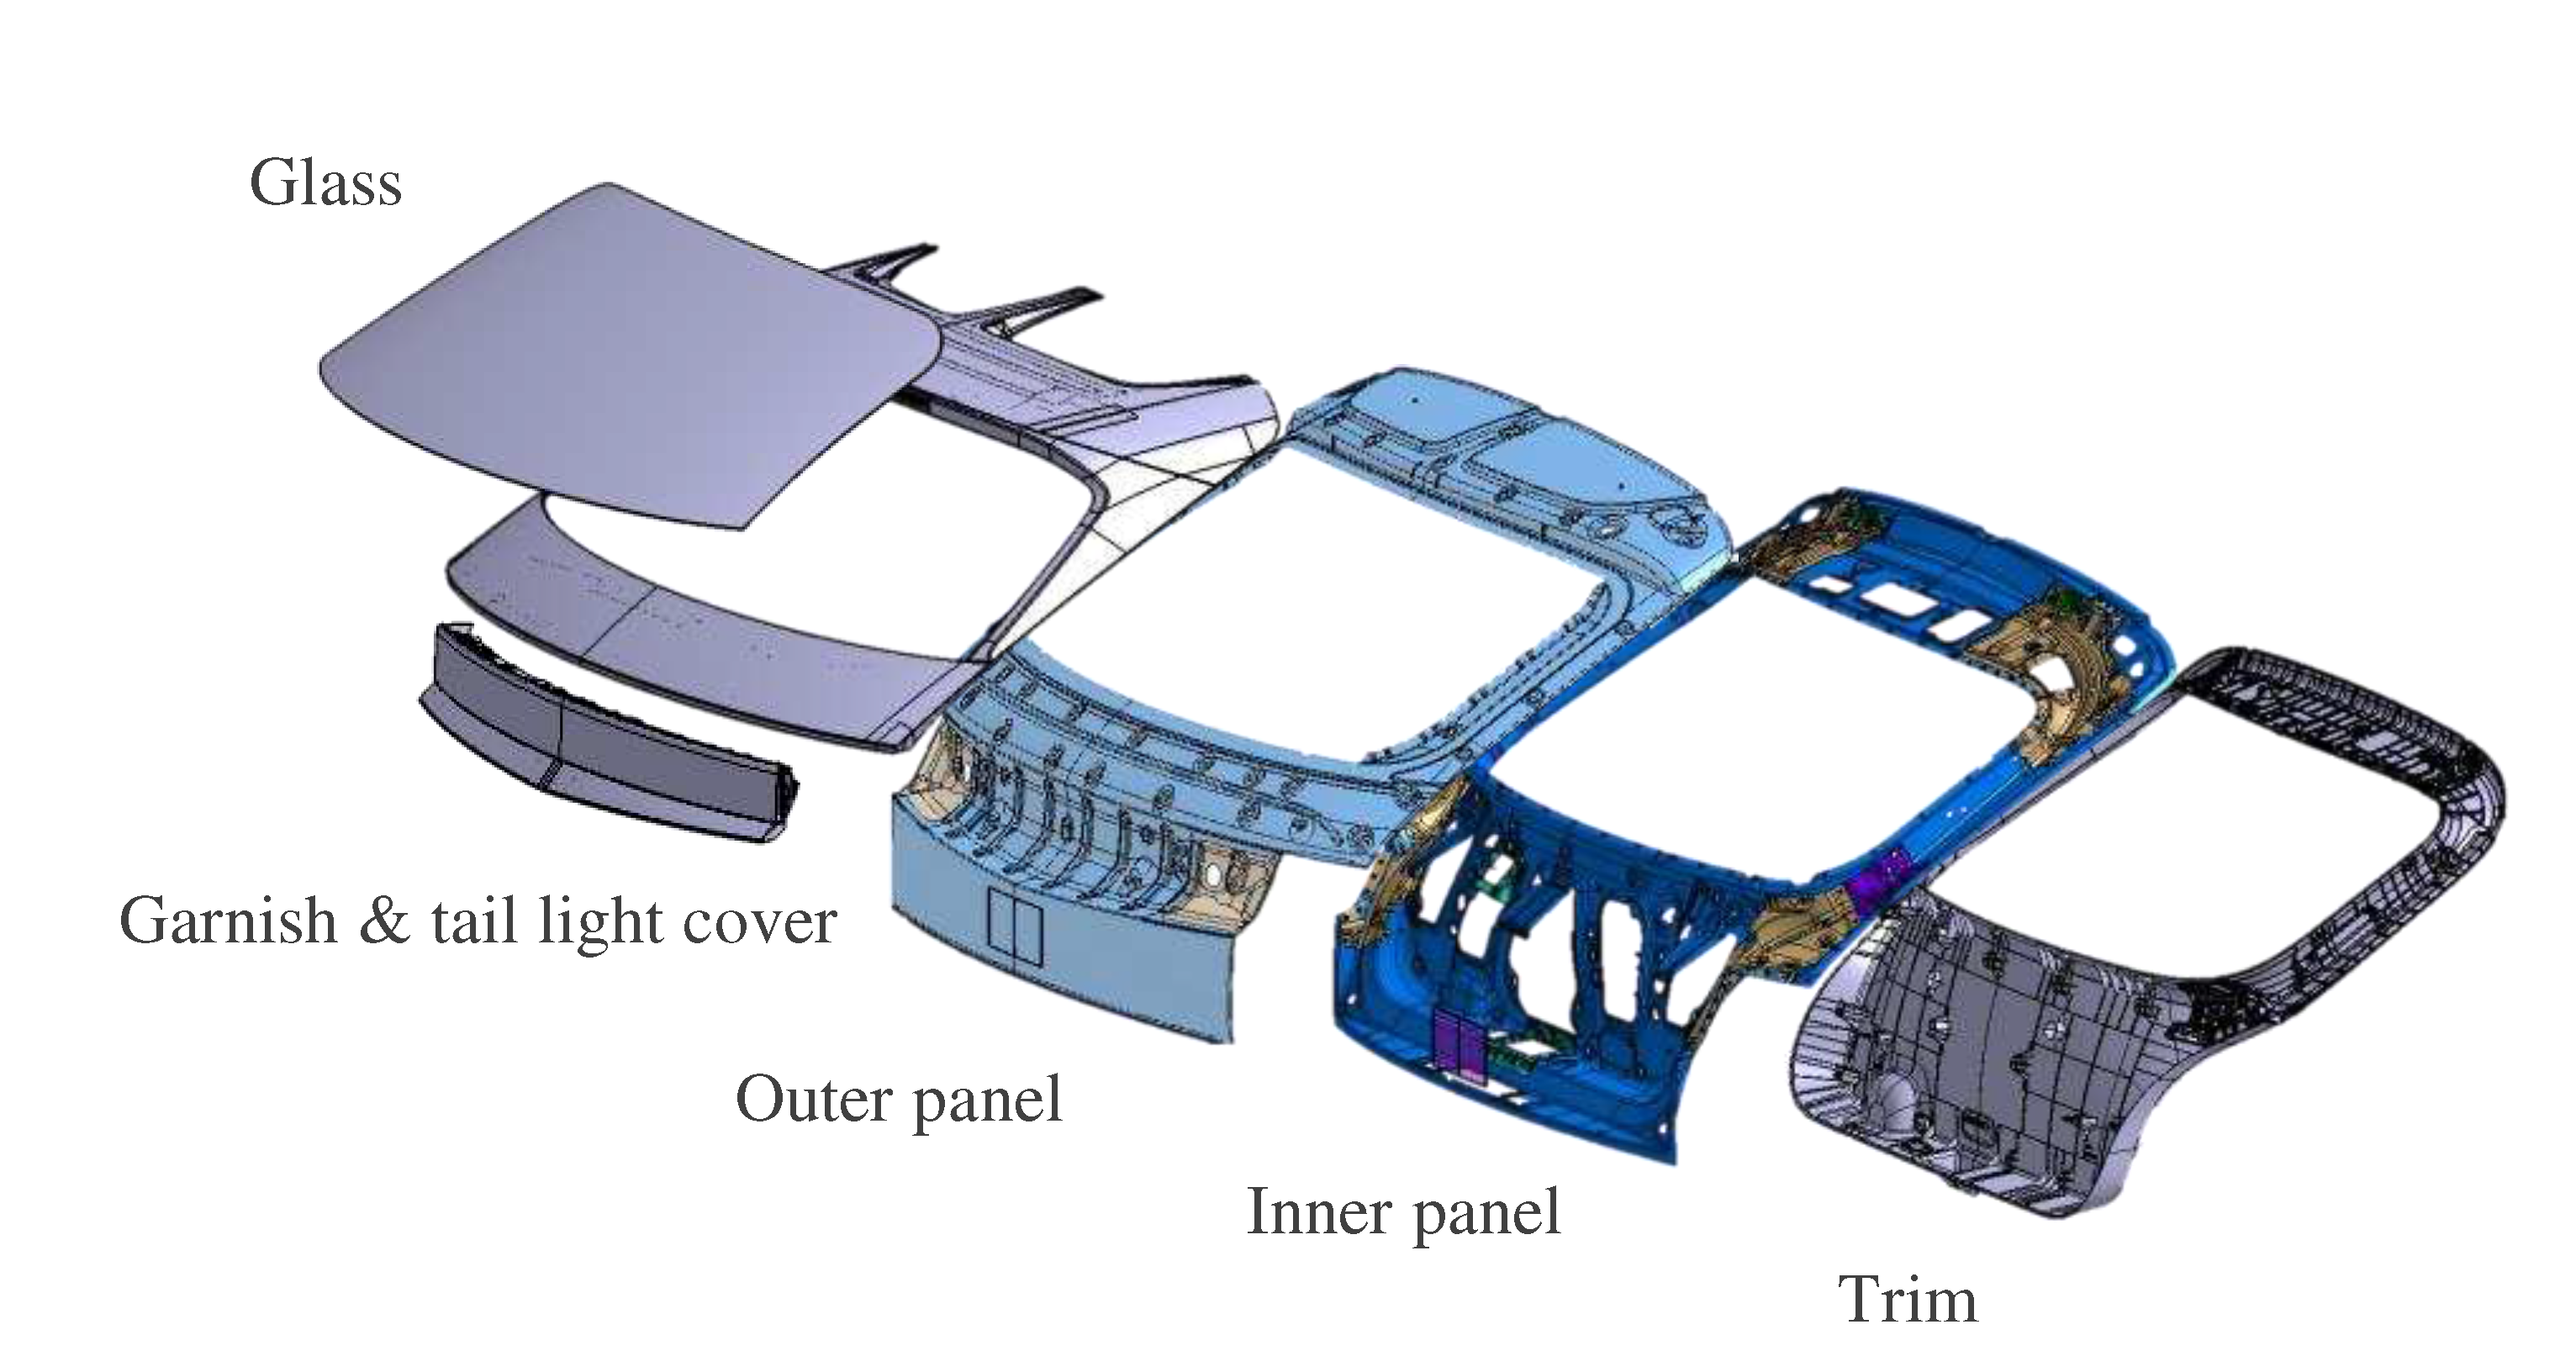
Figure 2.
Tailgate boundary conditions.

Figure 3.
The microphone positions for booming noise measurement.

Figure 4.
Measurement points of vibration signals.
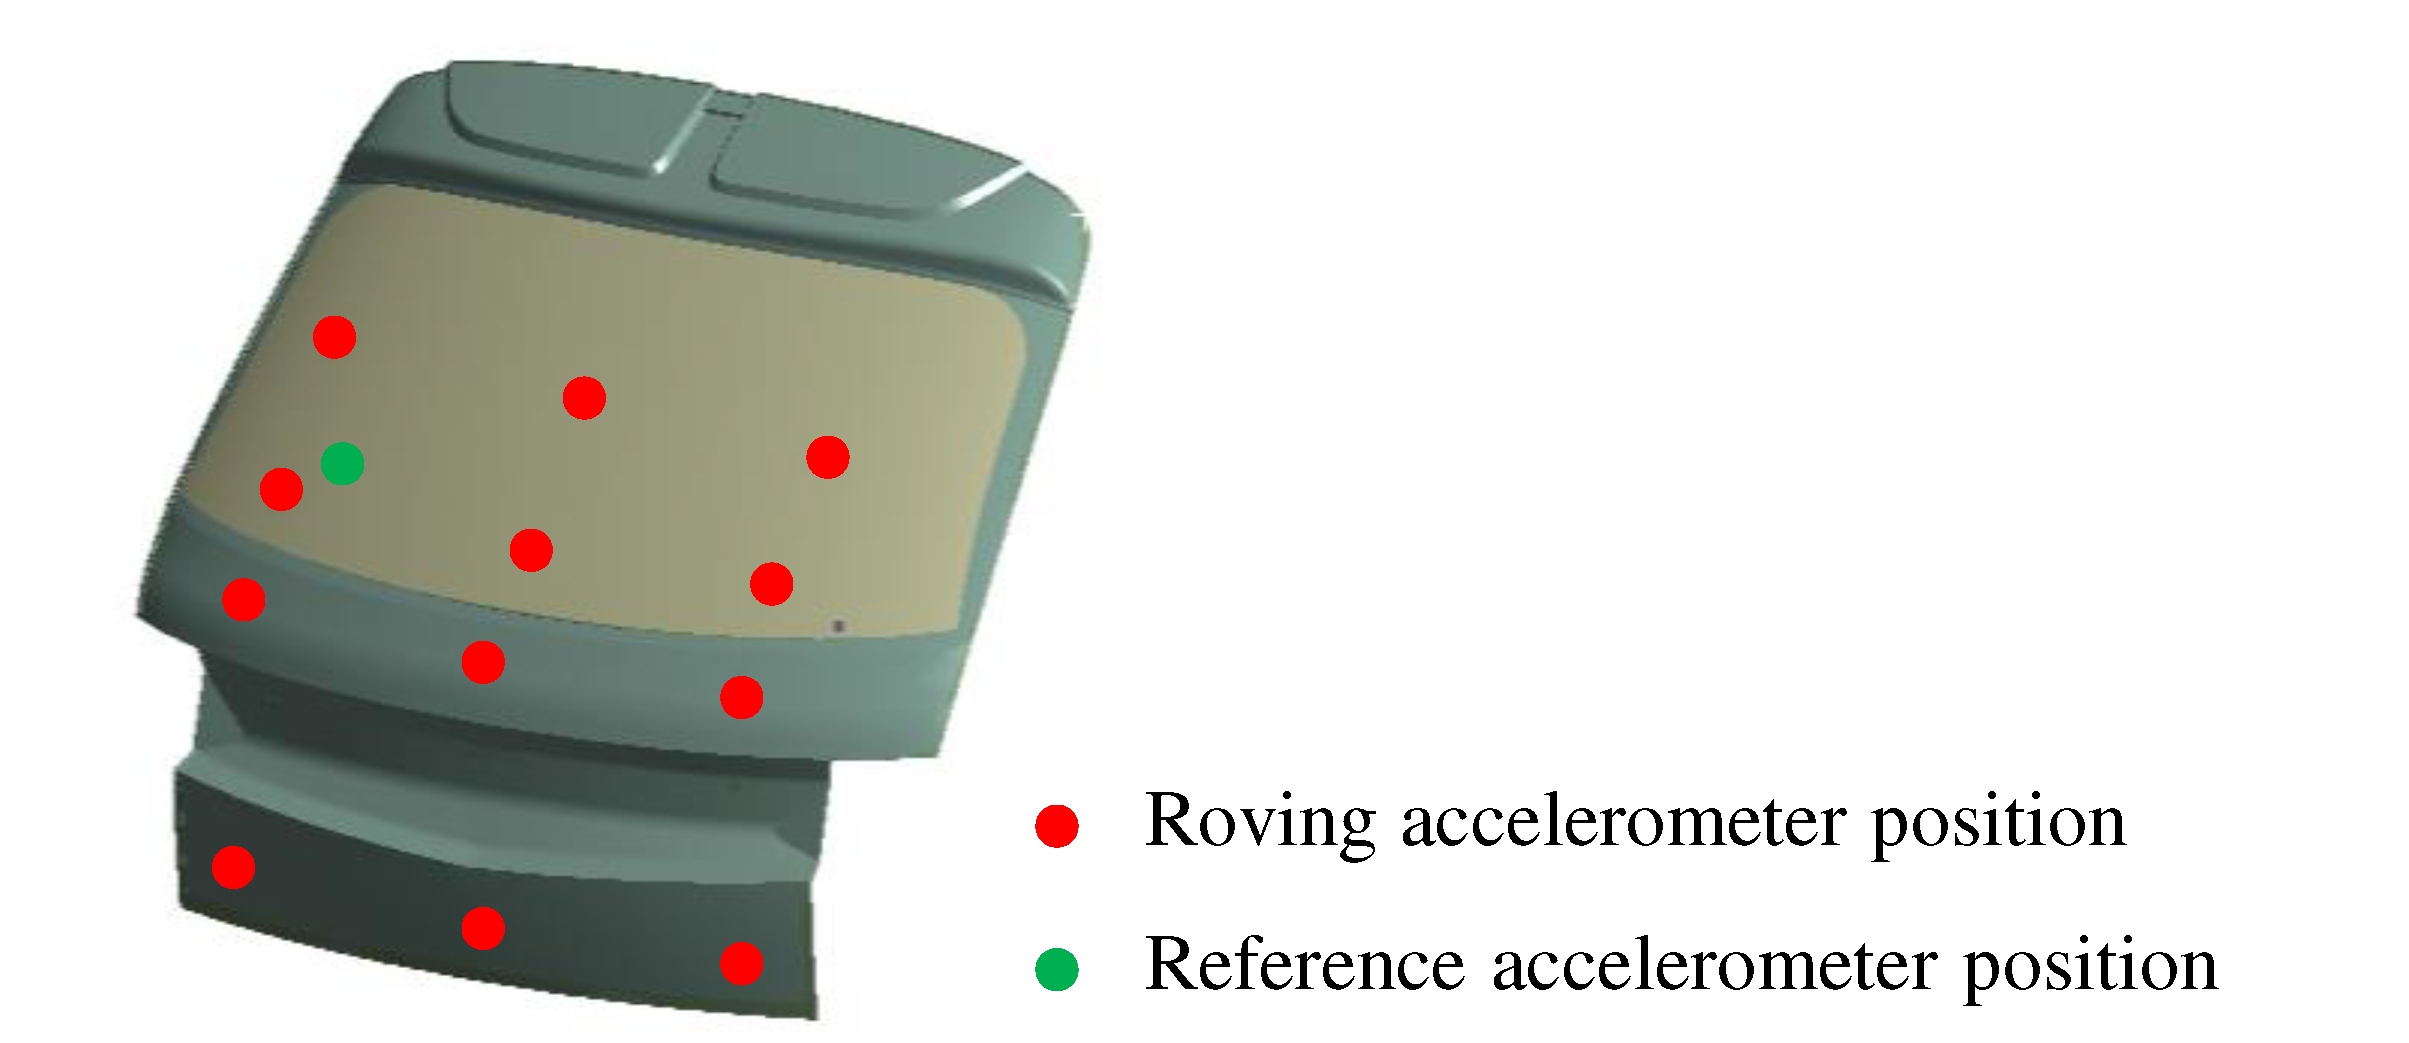
Figure 5.
C-weighted sound pressure level at the rear passenger position.
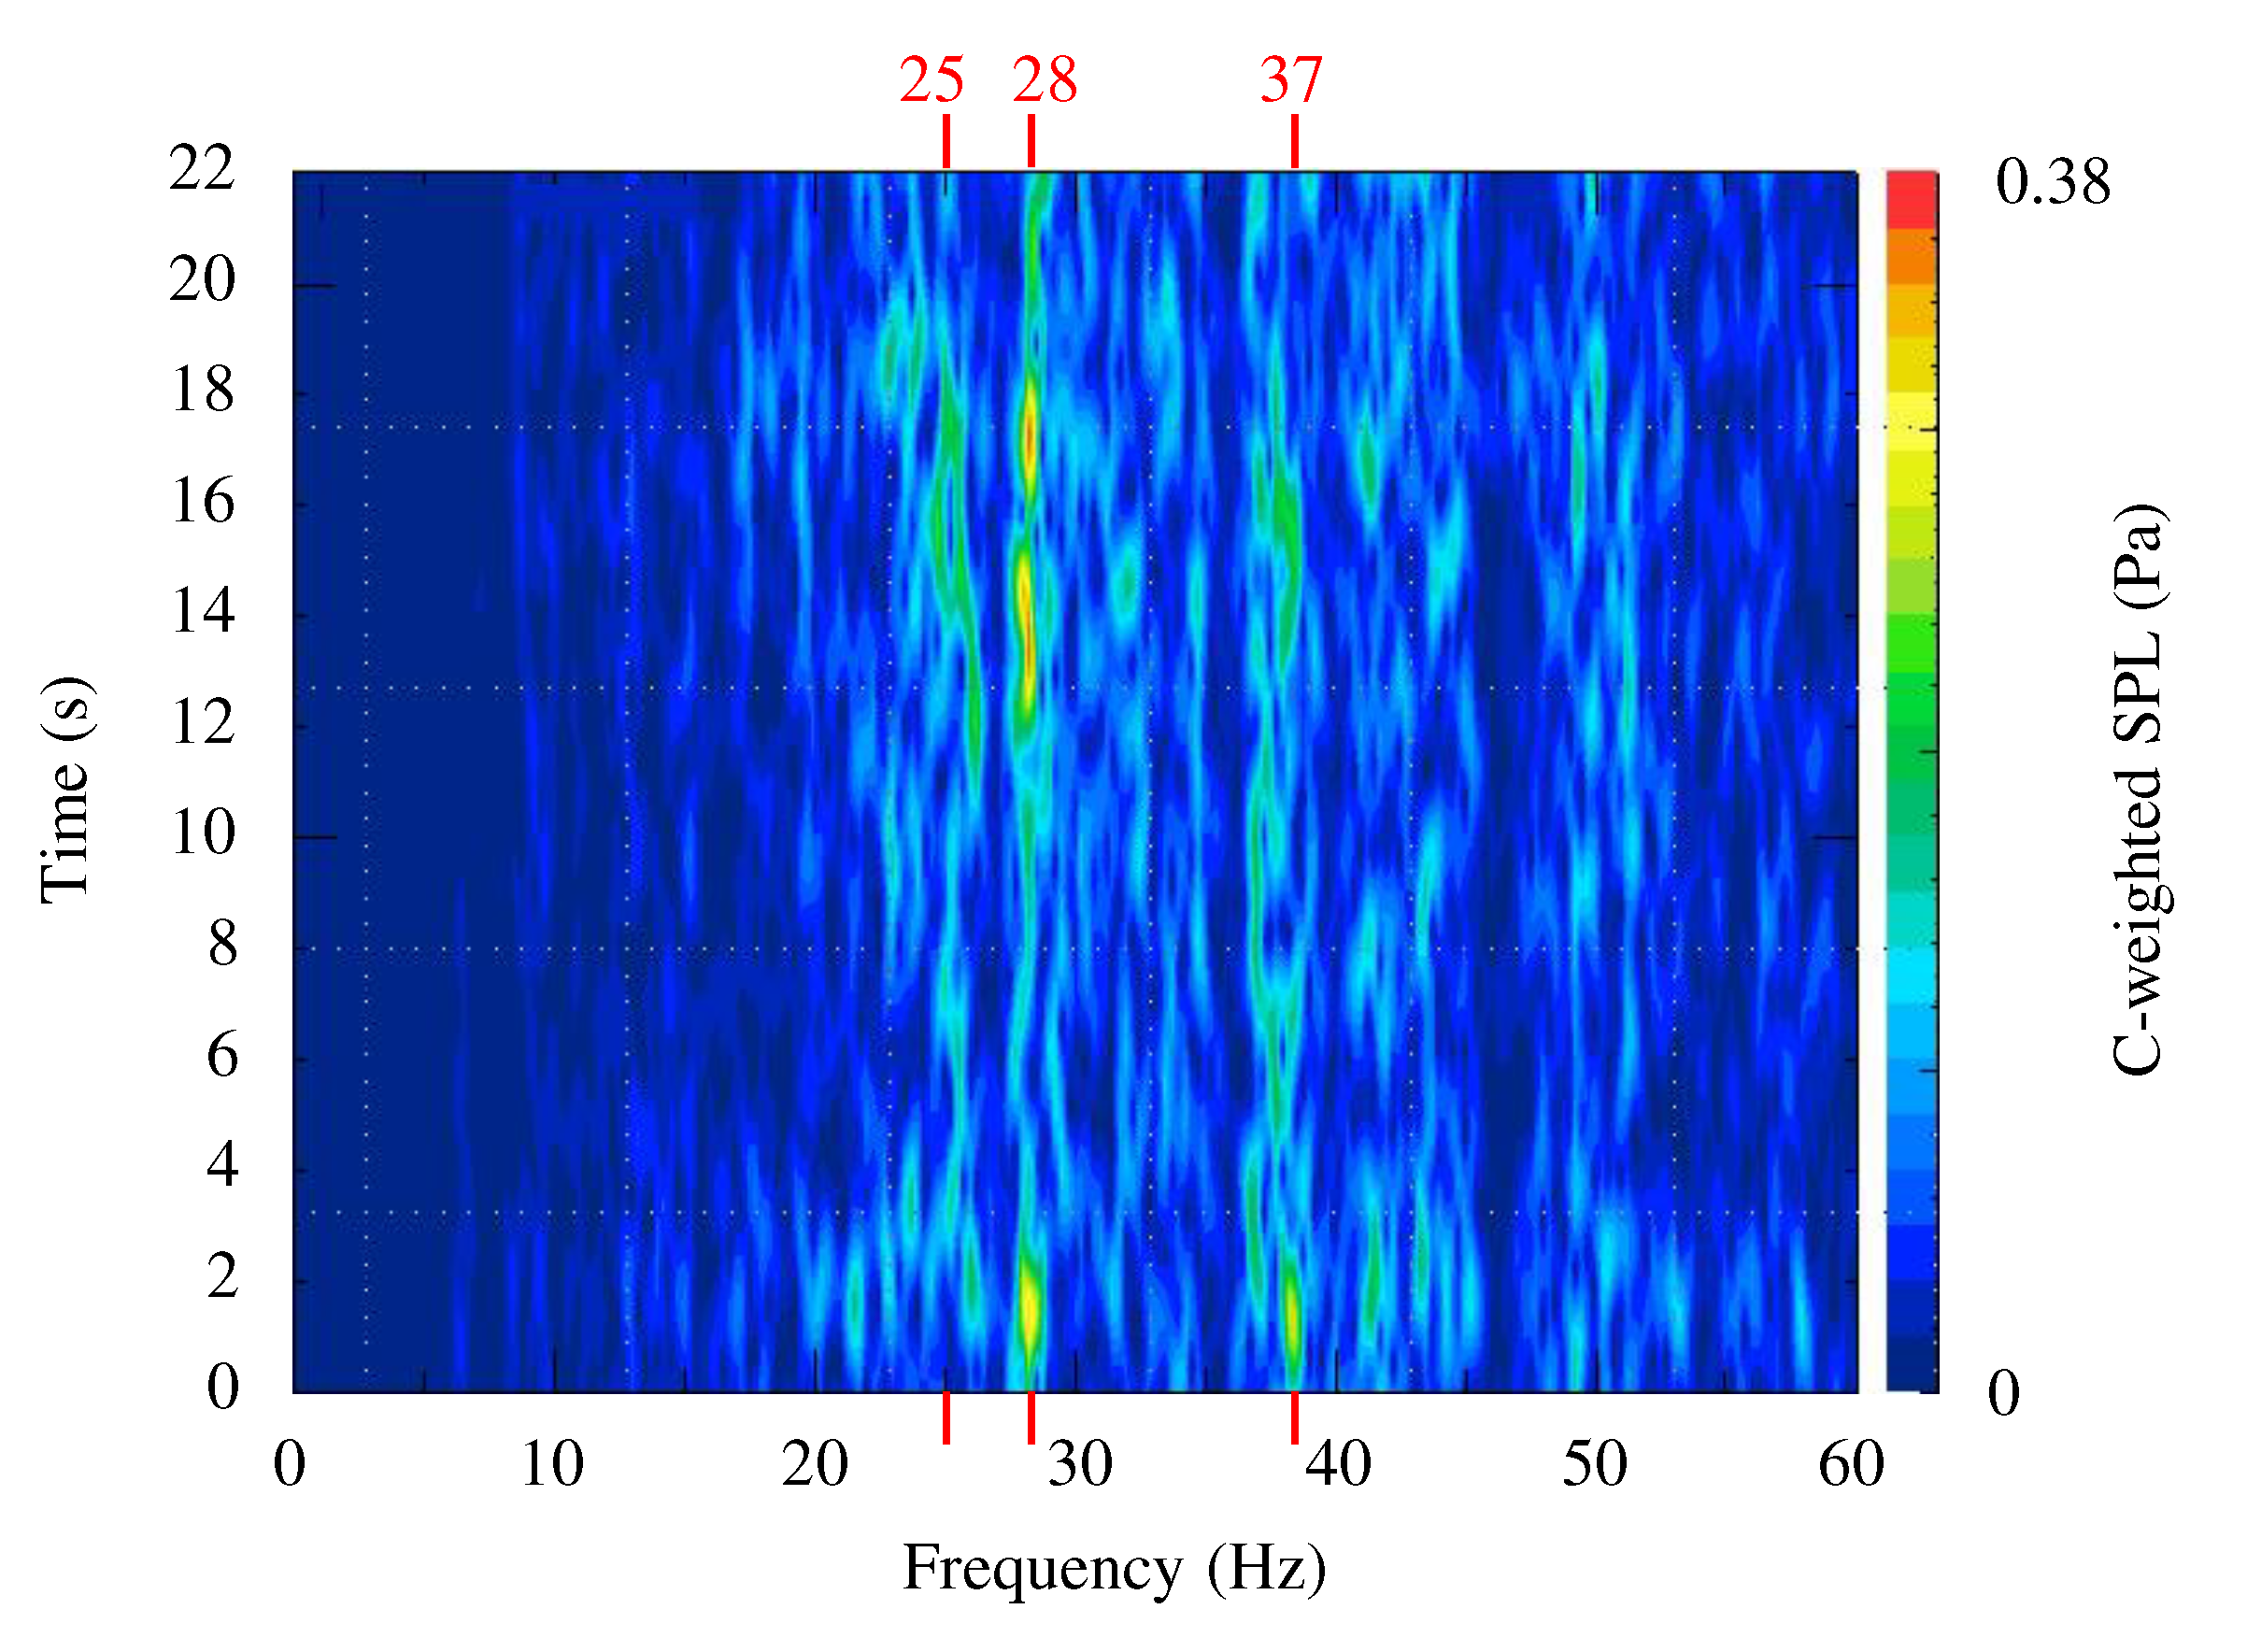
Figure 6.
The time spectrogram graphs of the vibration signals: (a) left; (b) middle; and (c) right.
Figure 6.
The time spectrogram graphs of the vibration signals: (a) left; (b) middle; and (c) right.
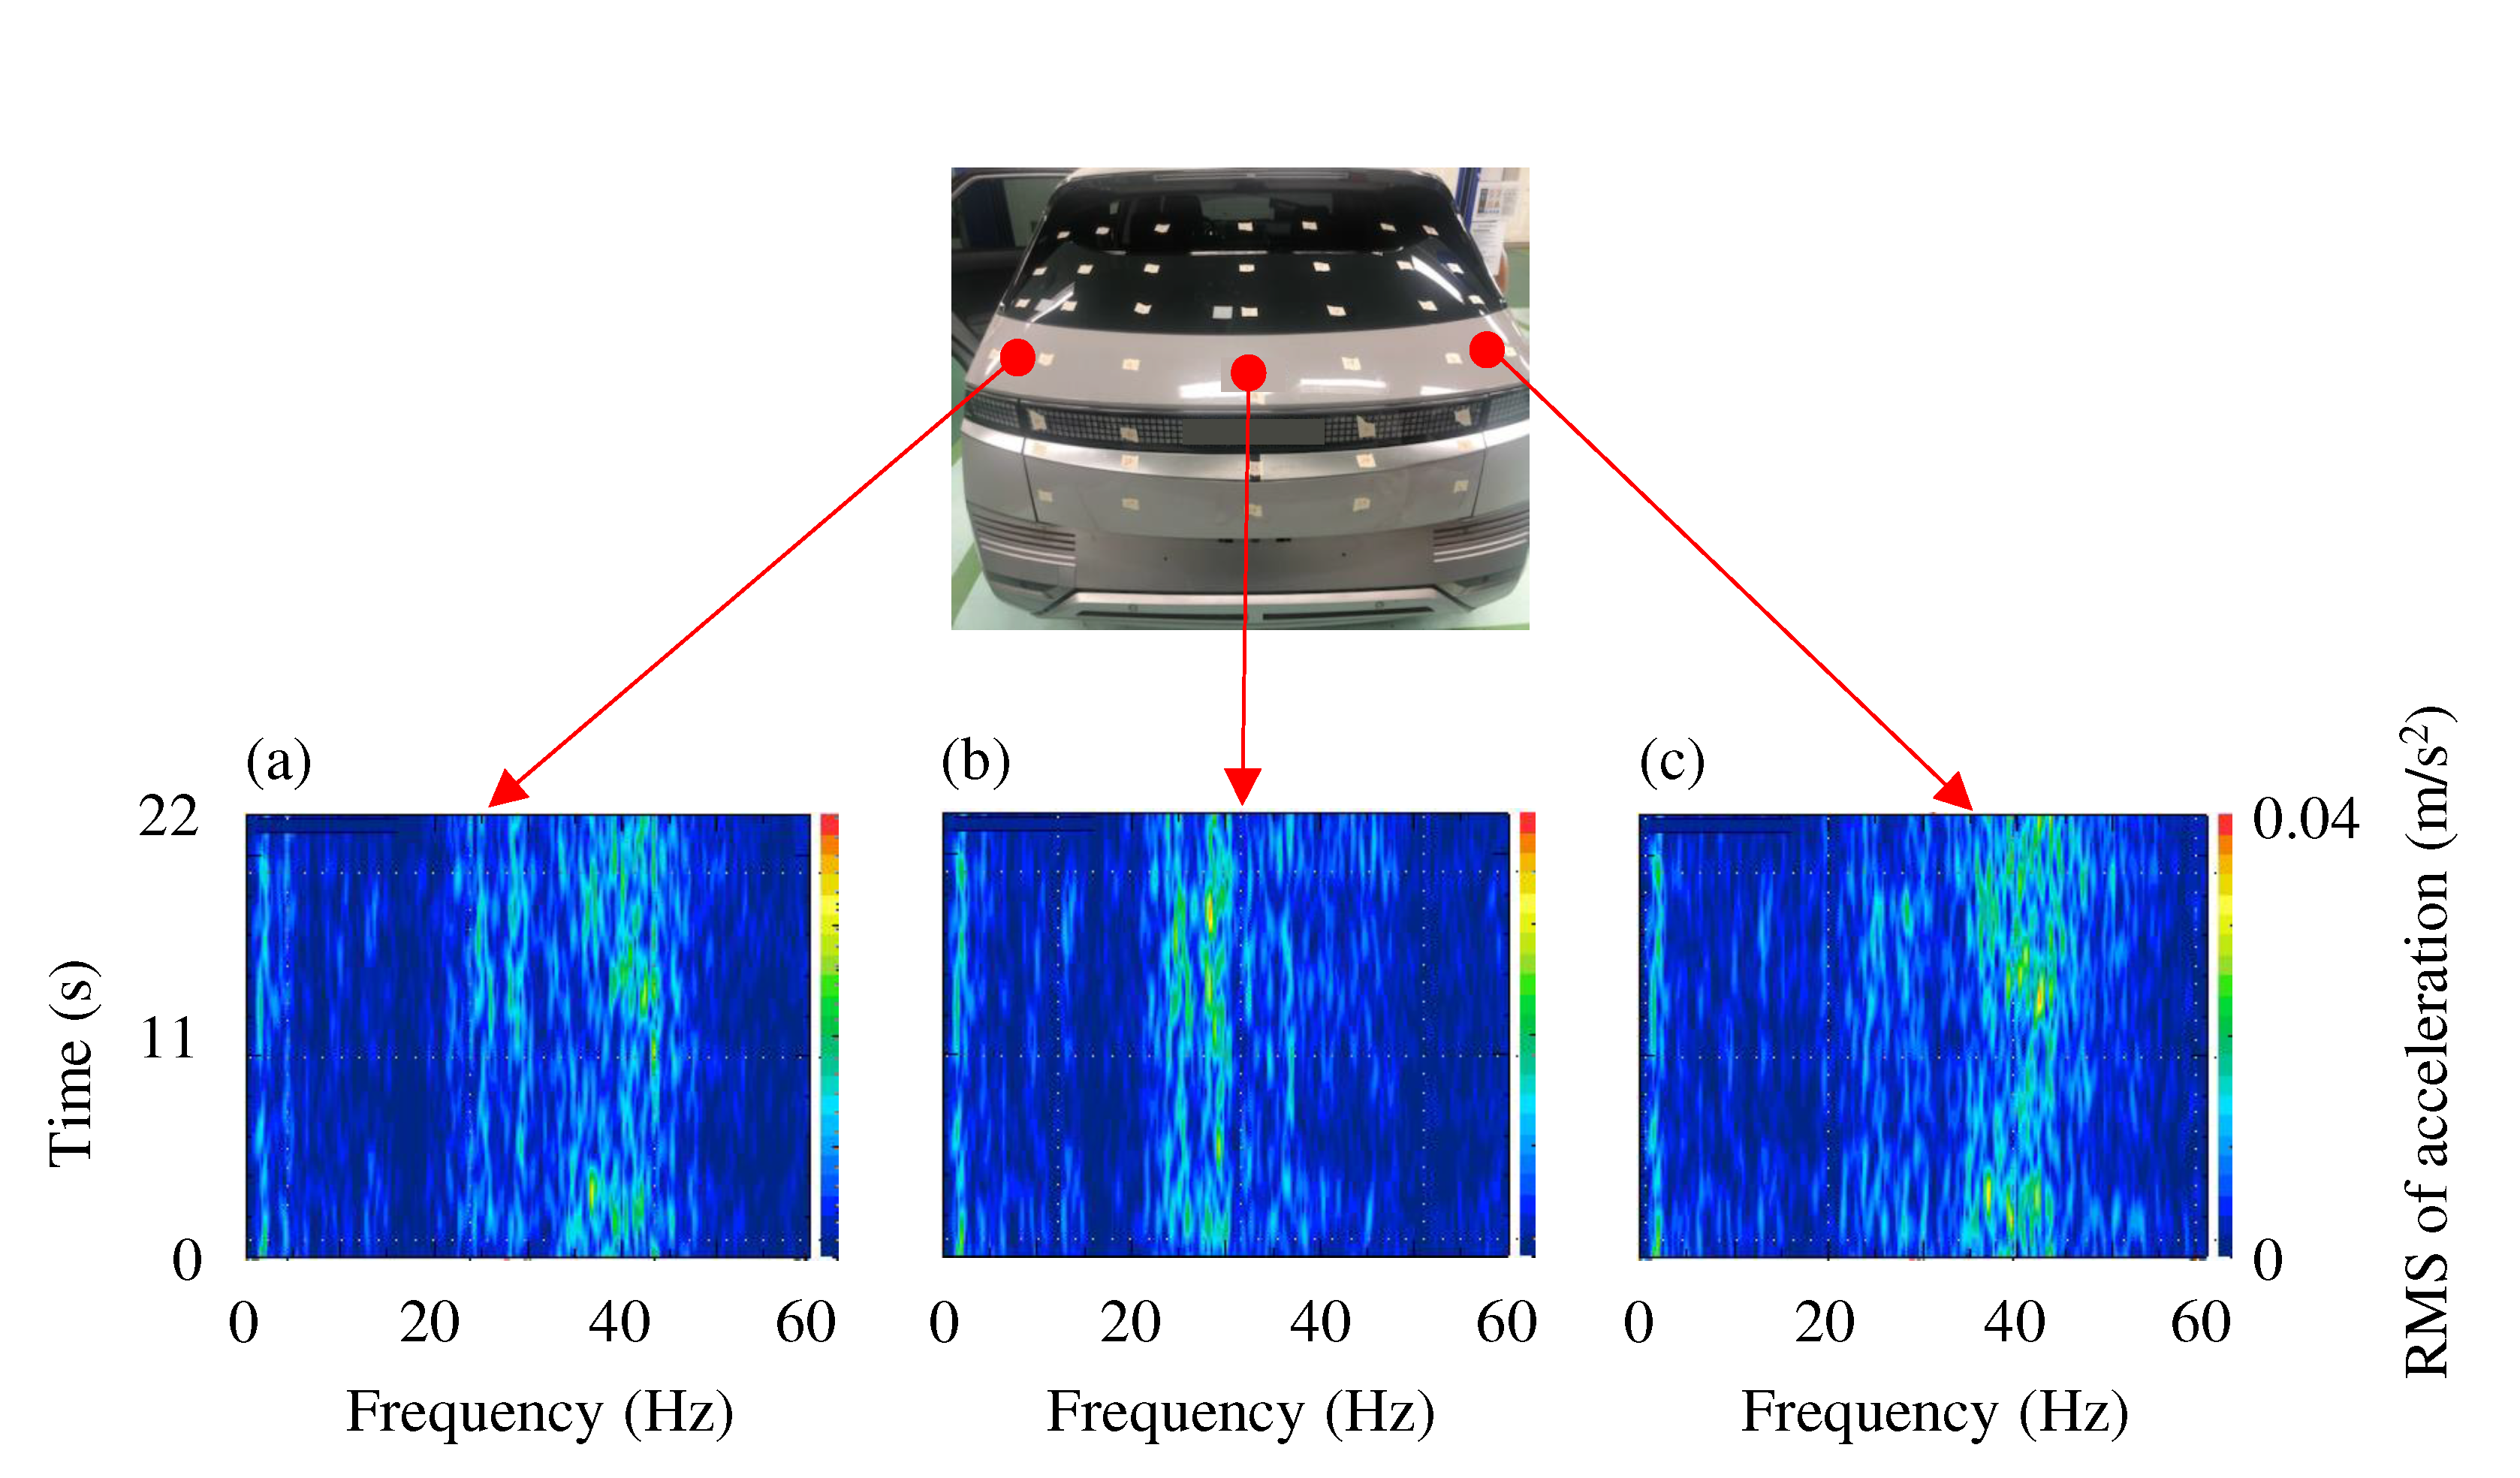
Figure 7.
Operational deflection shapes of the tailgate at the noise frequency: (a) 24.0 Hz; (b) 28.4 Hz; and (c) 38.6 Hz.
Figure 7.
Operational deflection shapes of the tailgate at the noise frequency: (a) 24.0 Hz; (b) 28.4 Hz; and (c) 38.6 Hz.
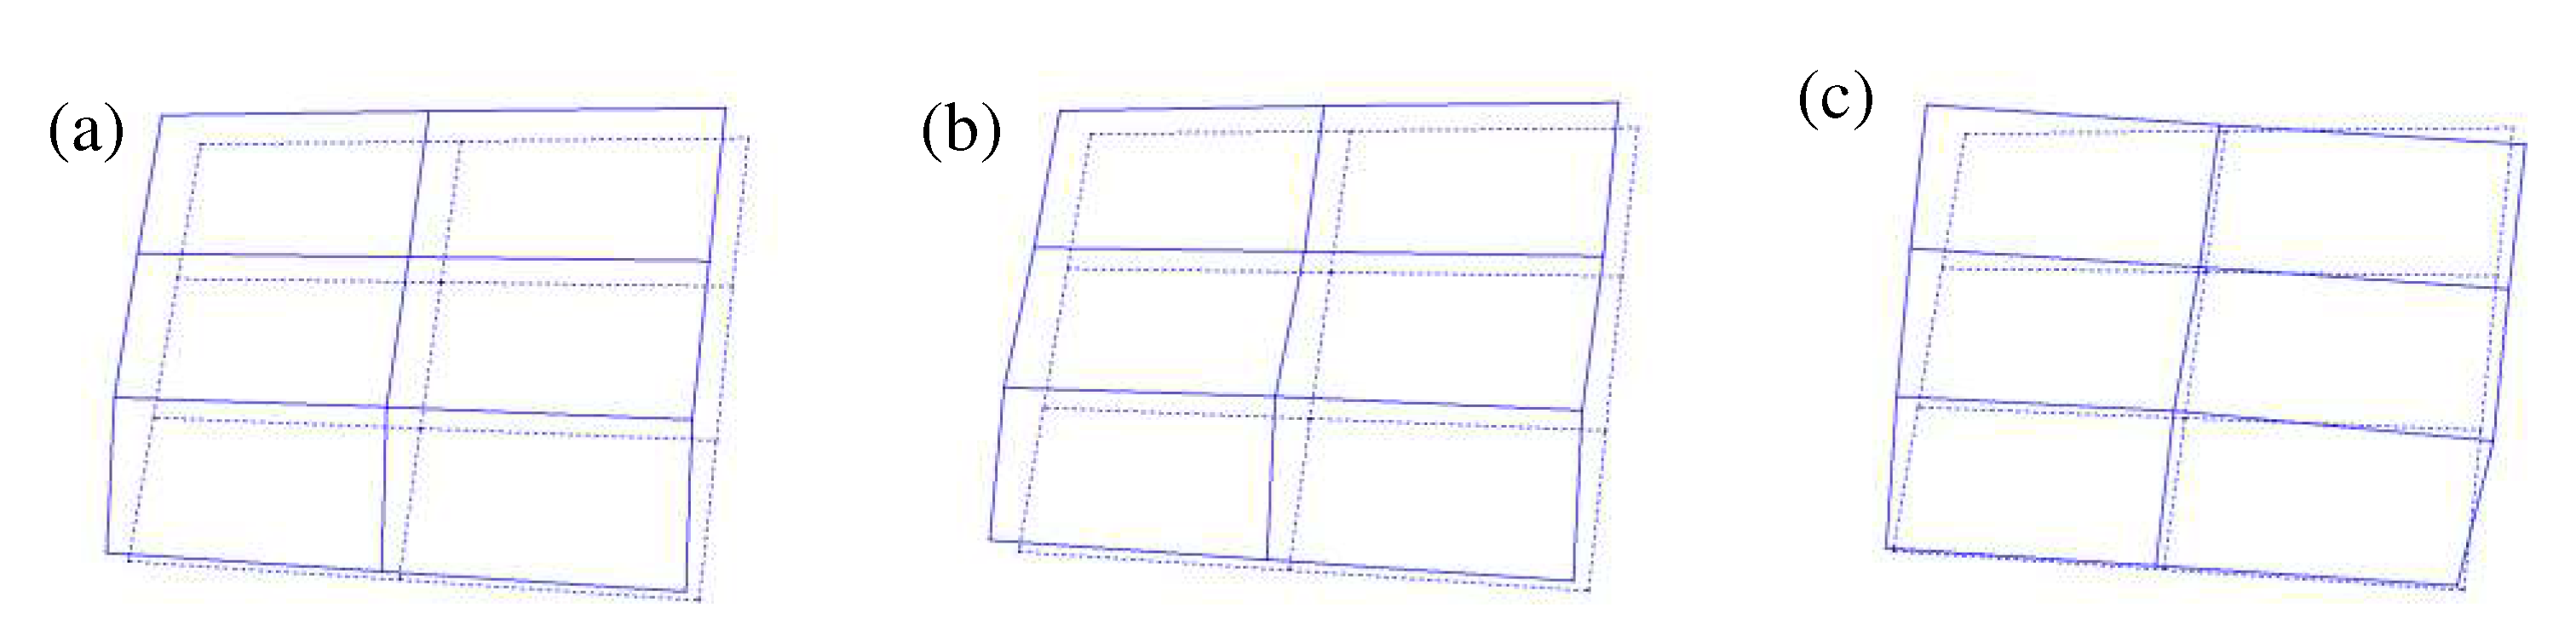
Figure 8.
Impact and measurement points for the experimental modal tests.
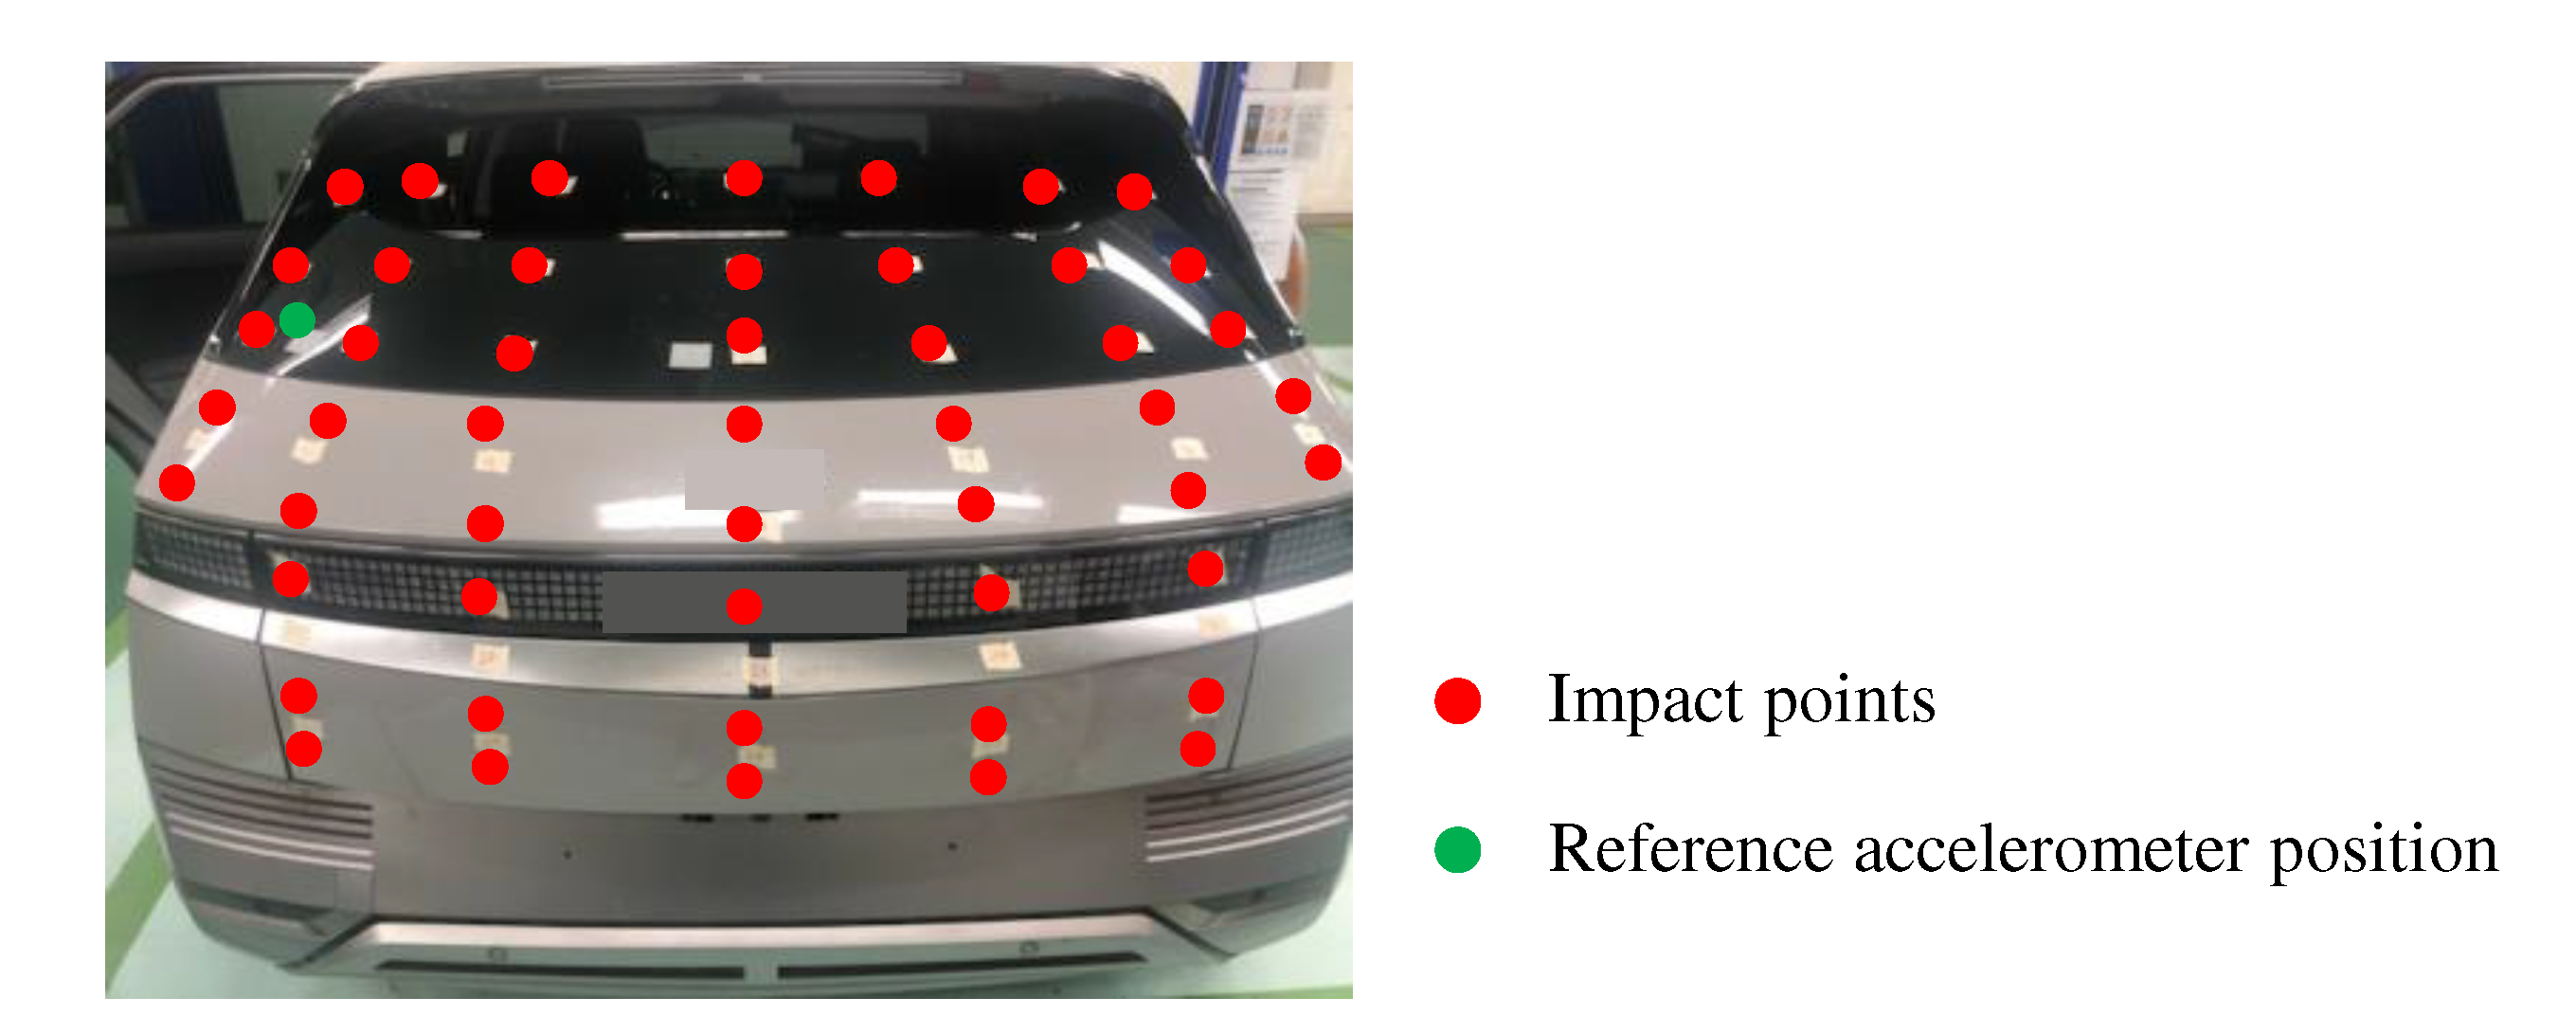
Figure 9.
Mode shapes of the tailgate: (a) 23.7 Hz; (b) 28.6 Hz; and (c) 37.6 Hz.
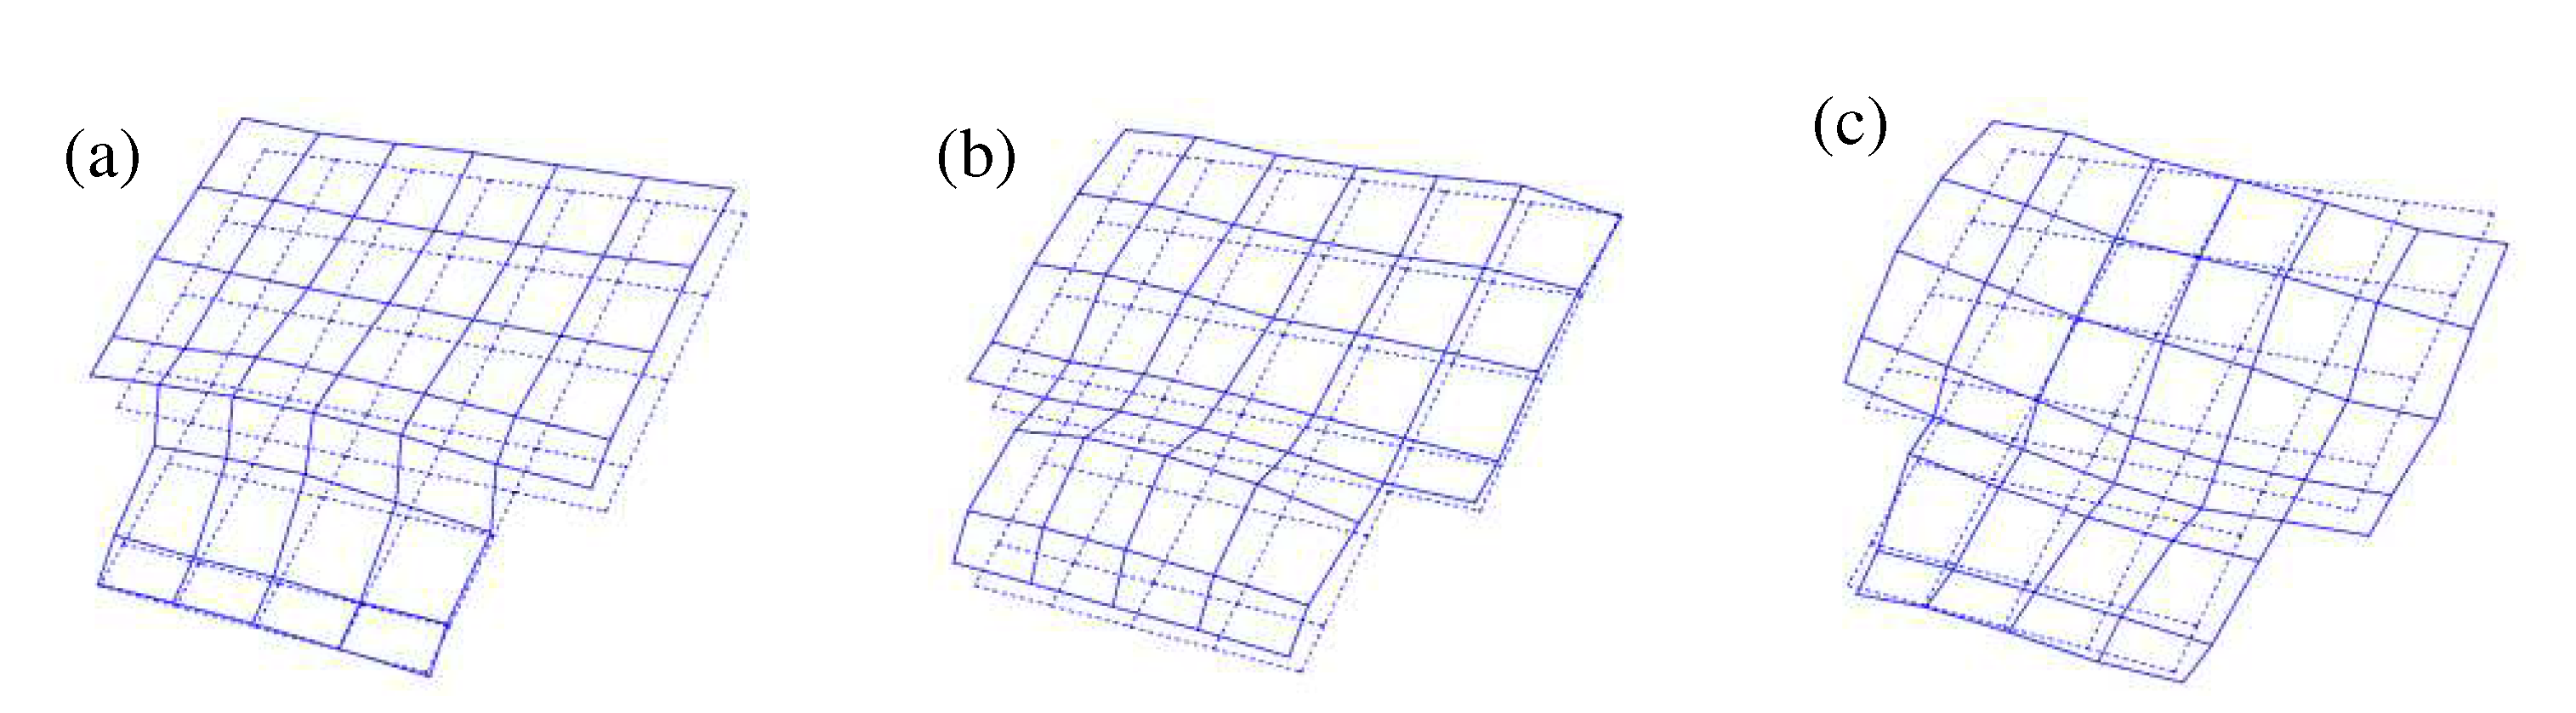
Figure 10.
Simplification of the tailgate 3D CAD model: (a) outer panel; and (b) inner panel.
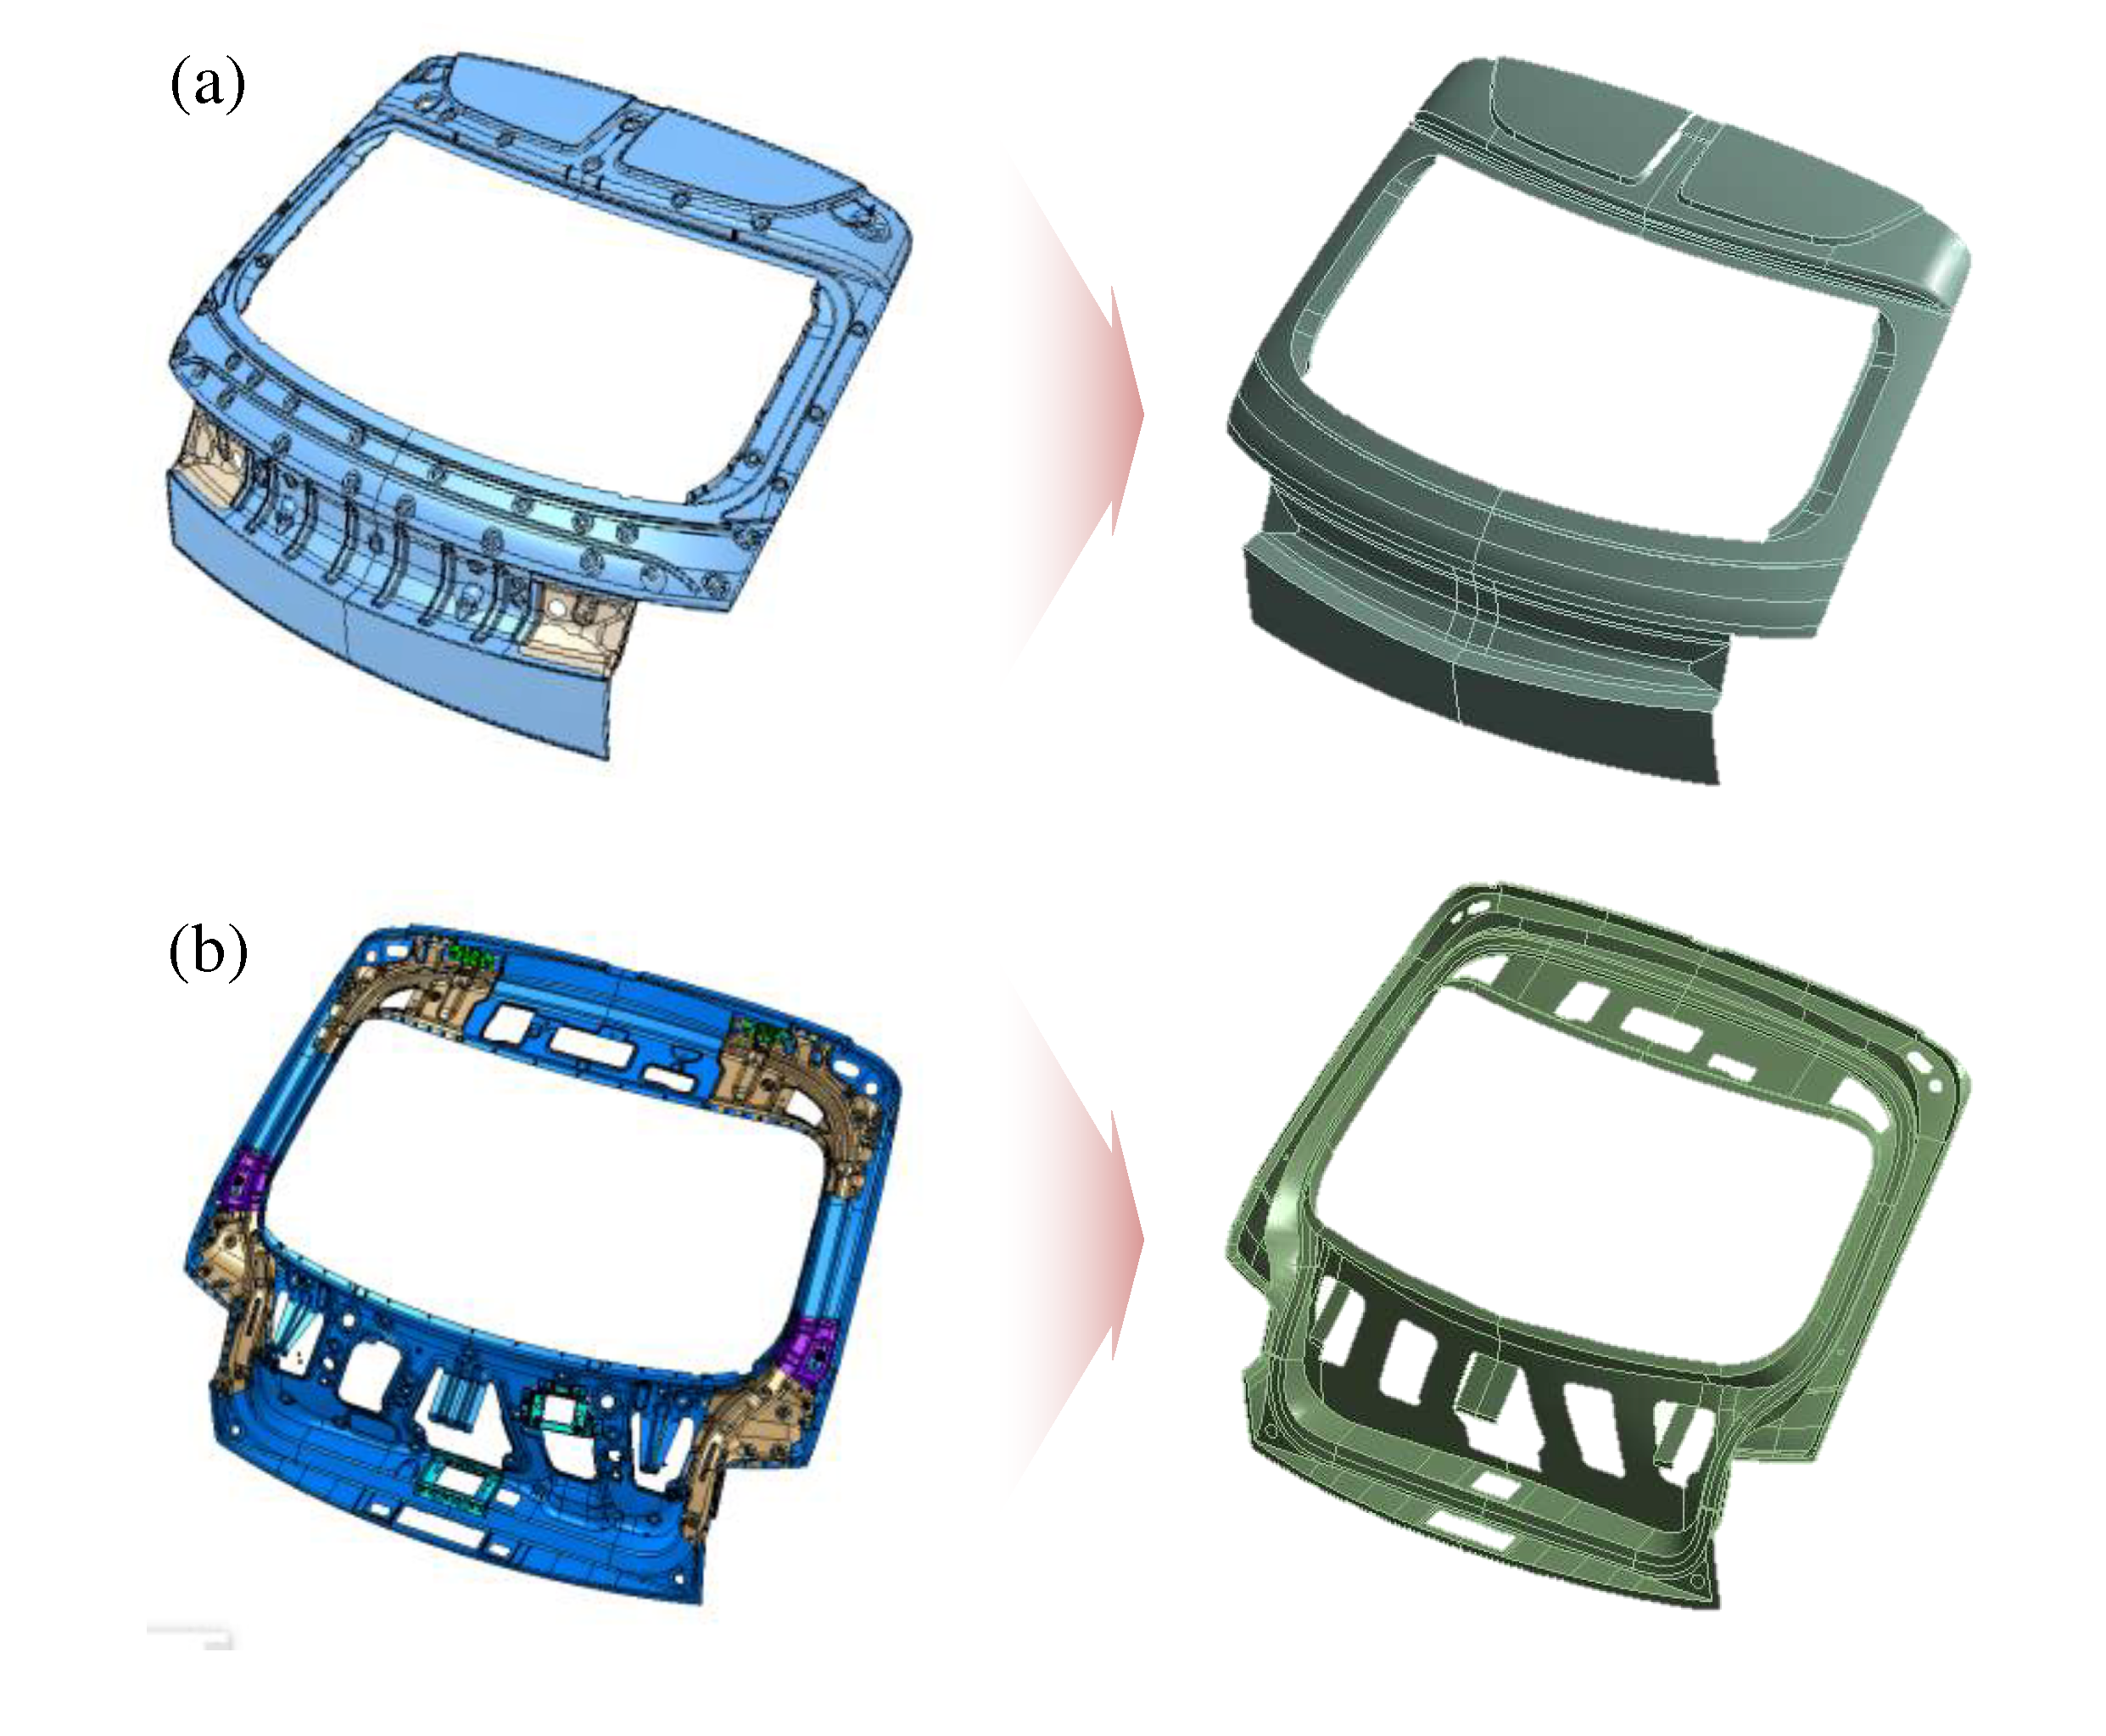
Figure 11.
Inner panel and reinforcement assembly with bonded contact.
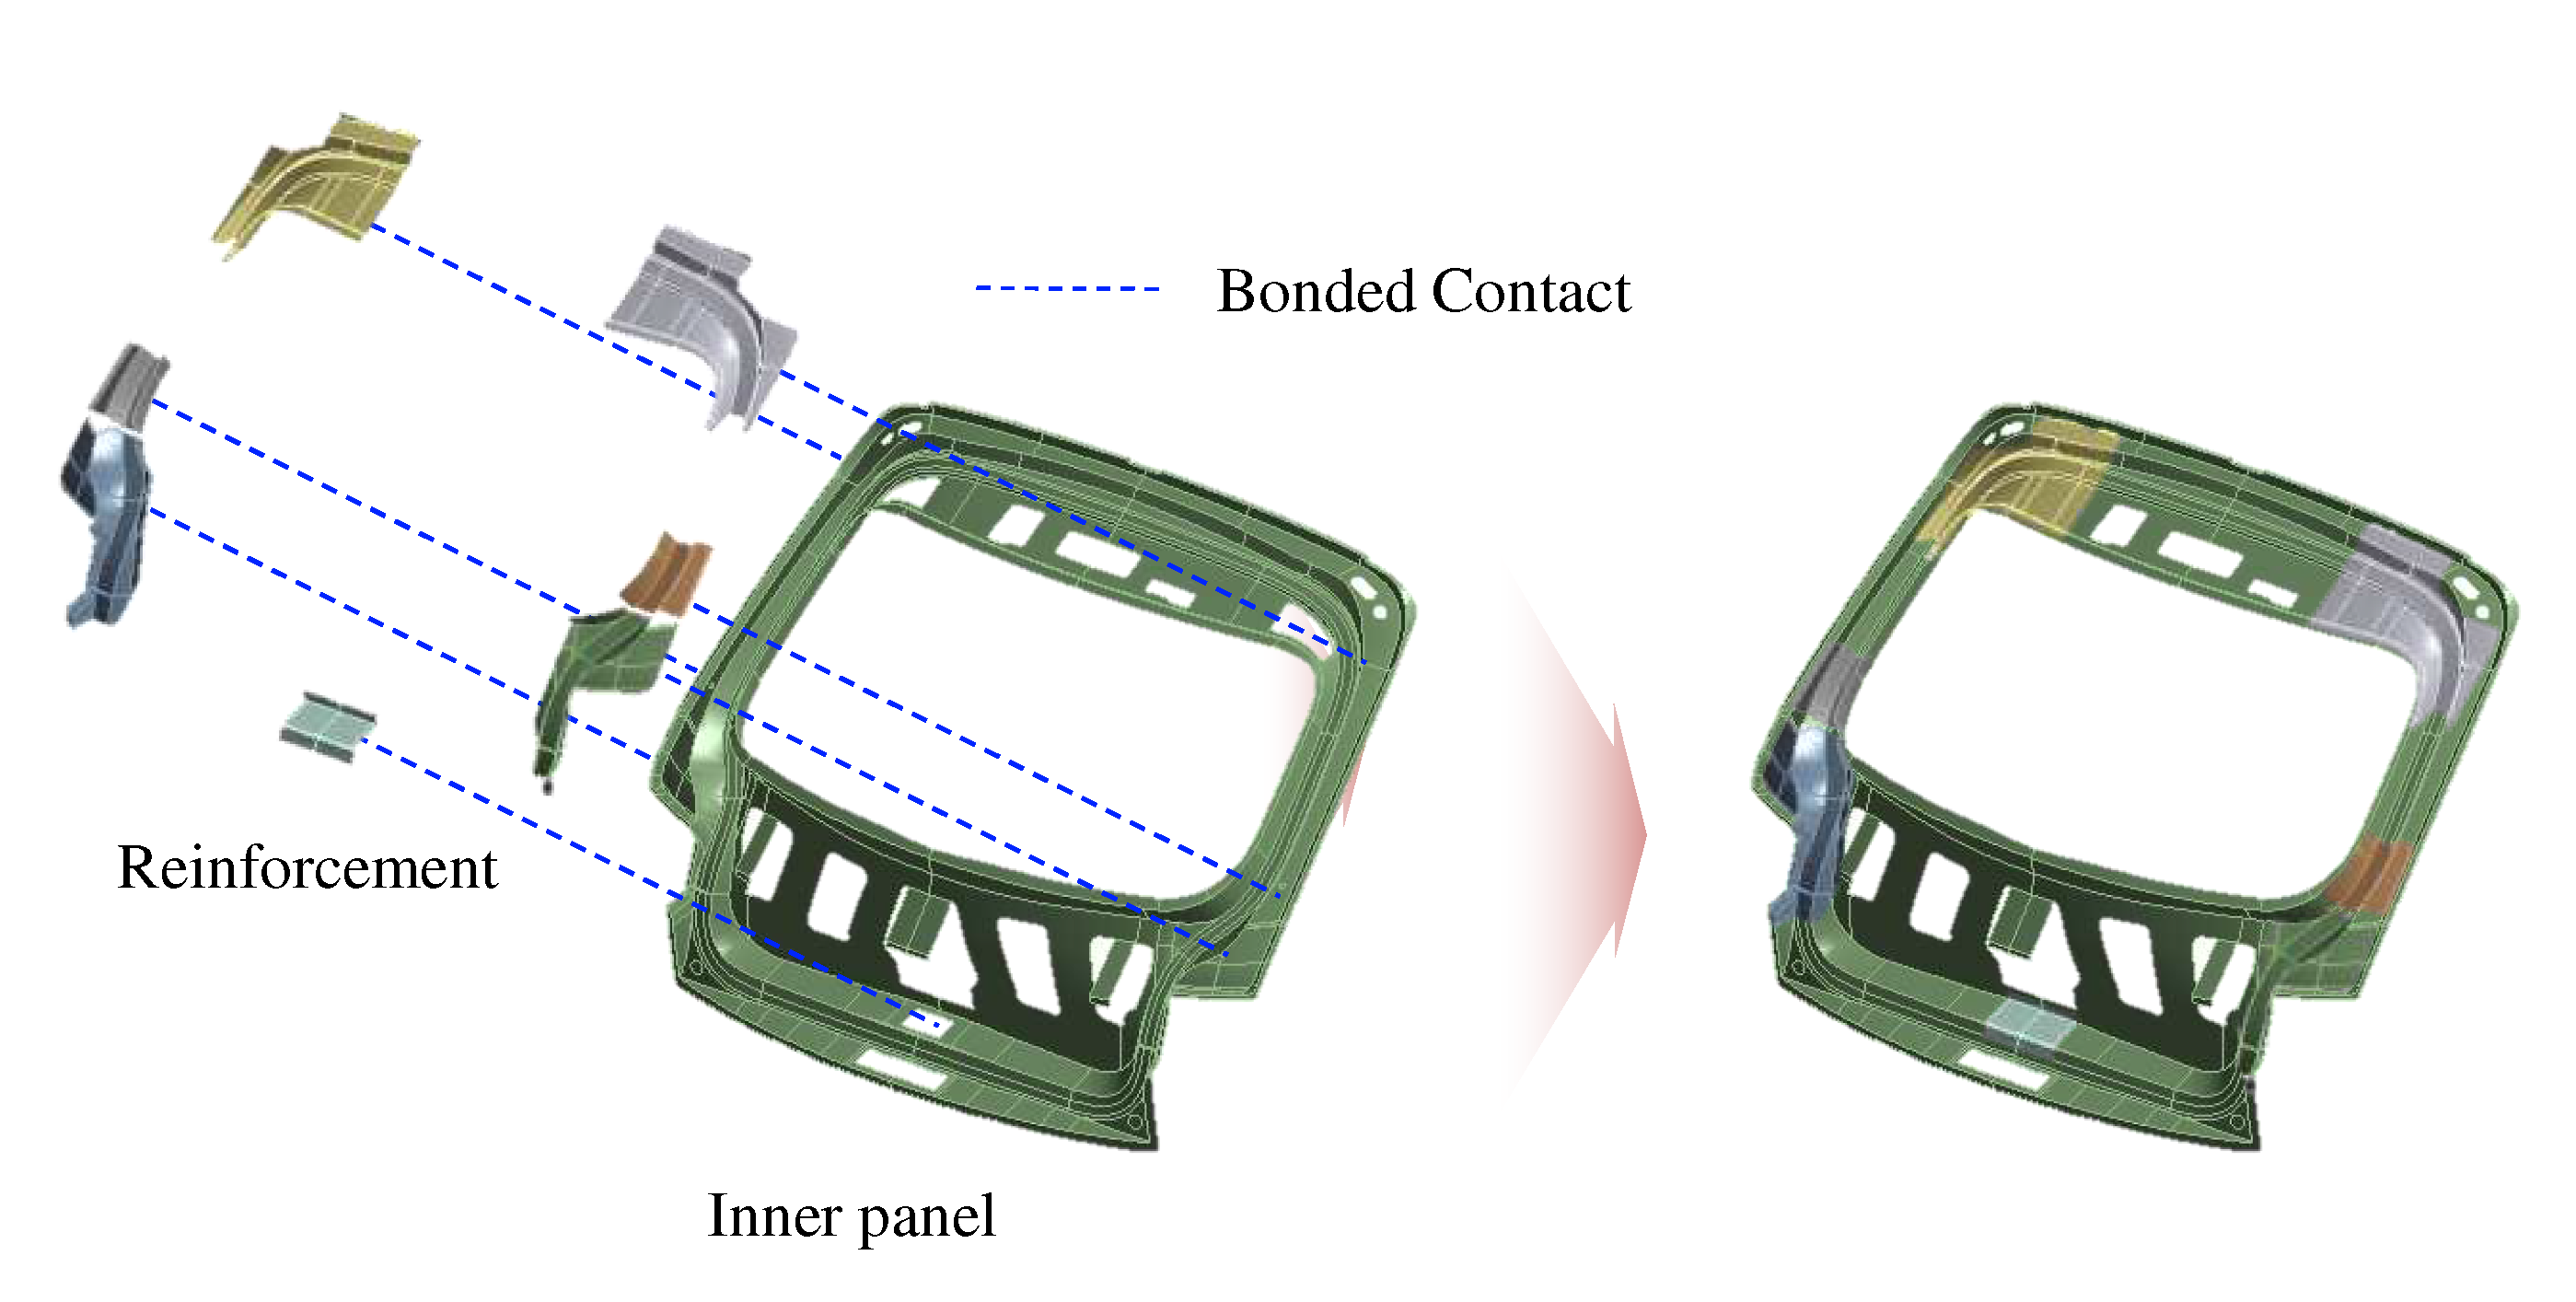
Figure 12.
Inner panel, outer panel, and glass assembly: (a) glass and outer panel assembly with bonded contact; and (b) outer panel and inner panel assembly with bonded contact and no separation.
Figure 12.
Inner panel, outer panel, and glass assembly: (a) glass and outer panel assembly with bonded contact; and (b) outer panel and inner panel assembly with bonded contact and no separation.
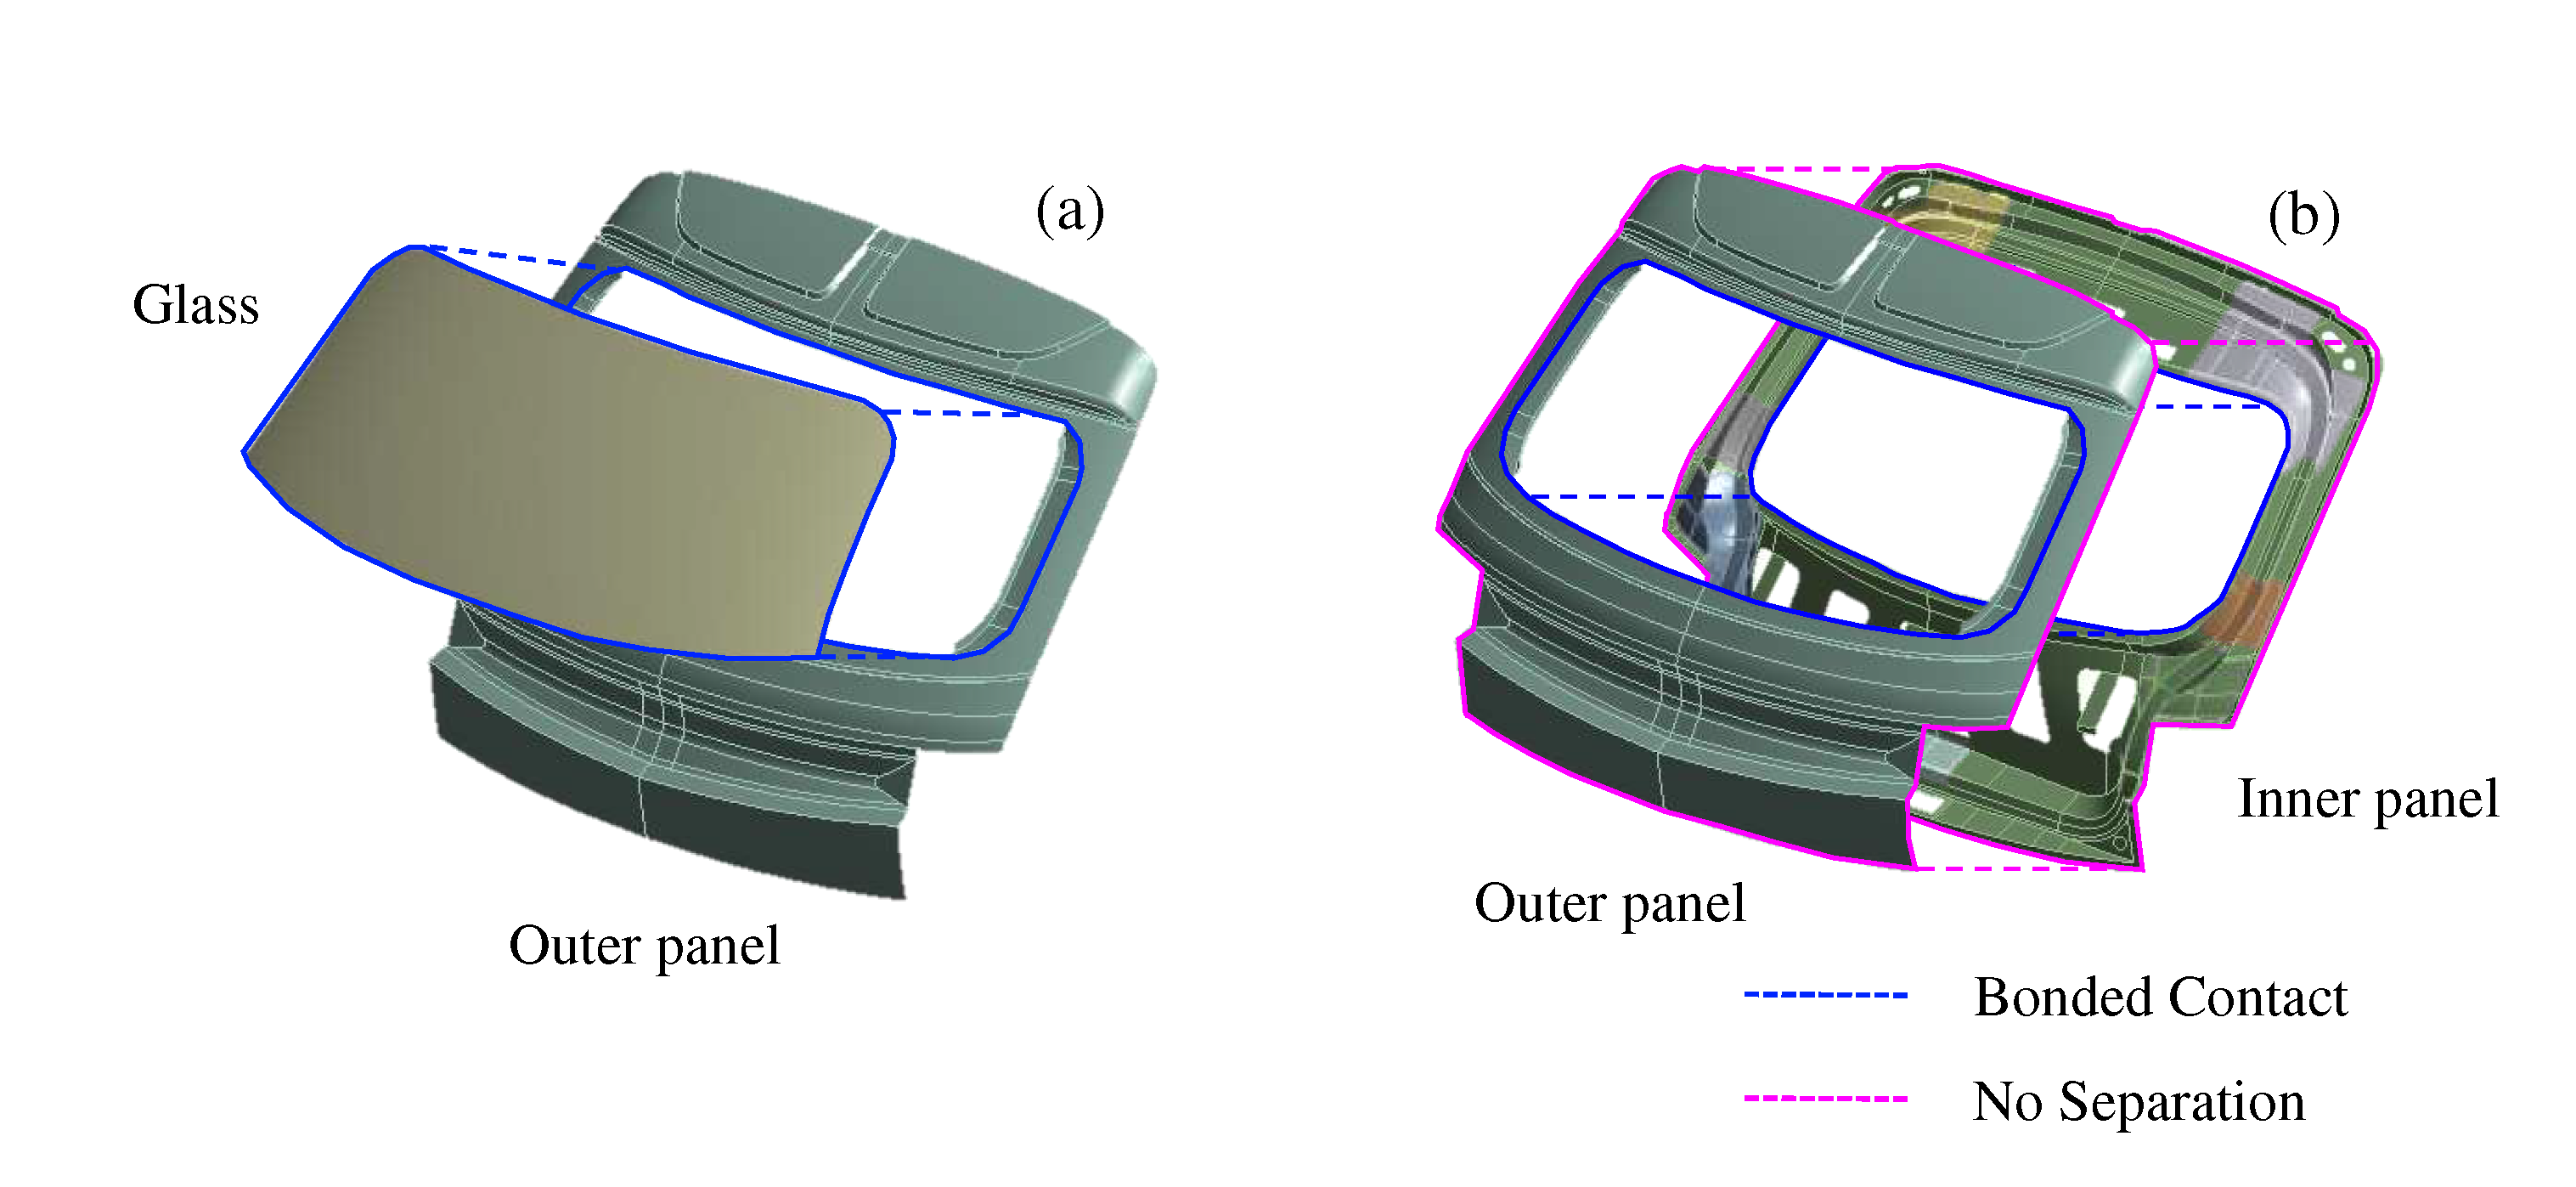
Figure 13.
Mode shapes of the tailgate under free-free boundary conditions: (a) 19.1 Hz; (b) 35.7 Hz; and (c) 45.2 Hz.
Figure 13.
Mode shapes of the tailgate under free-free boundary conditions: (a) 19.1 Hz; (b) 35.7 Hz; and (c) 45.2 Hz.
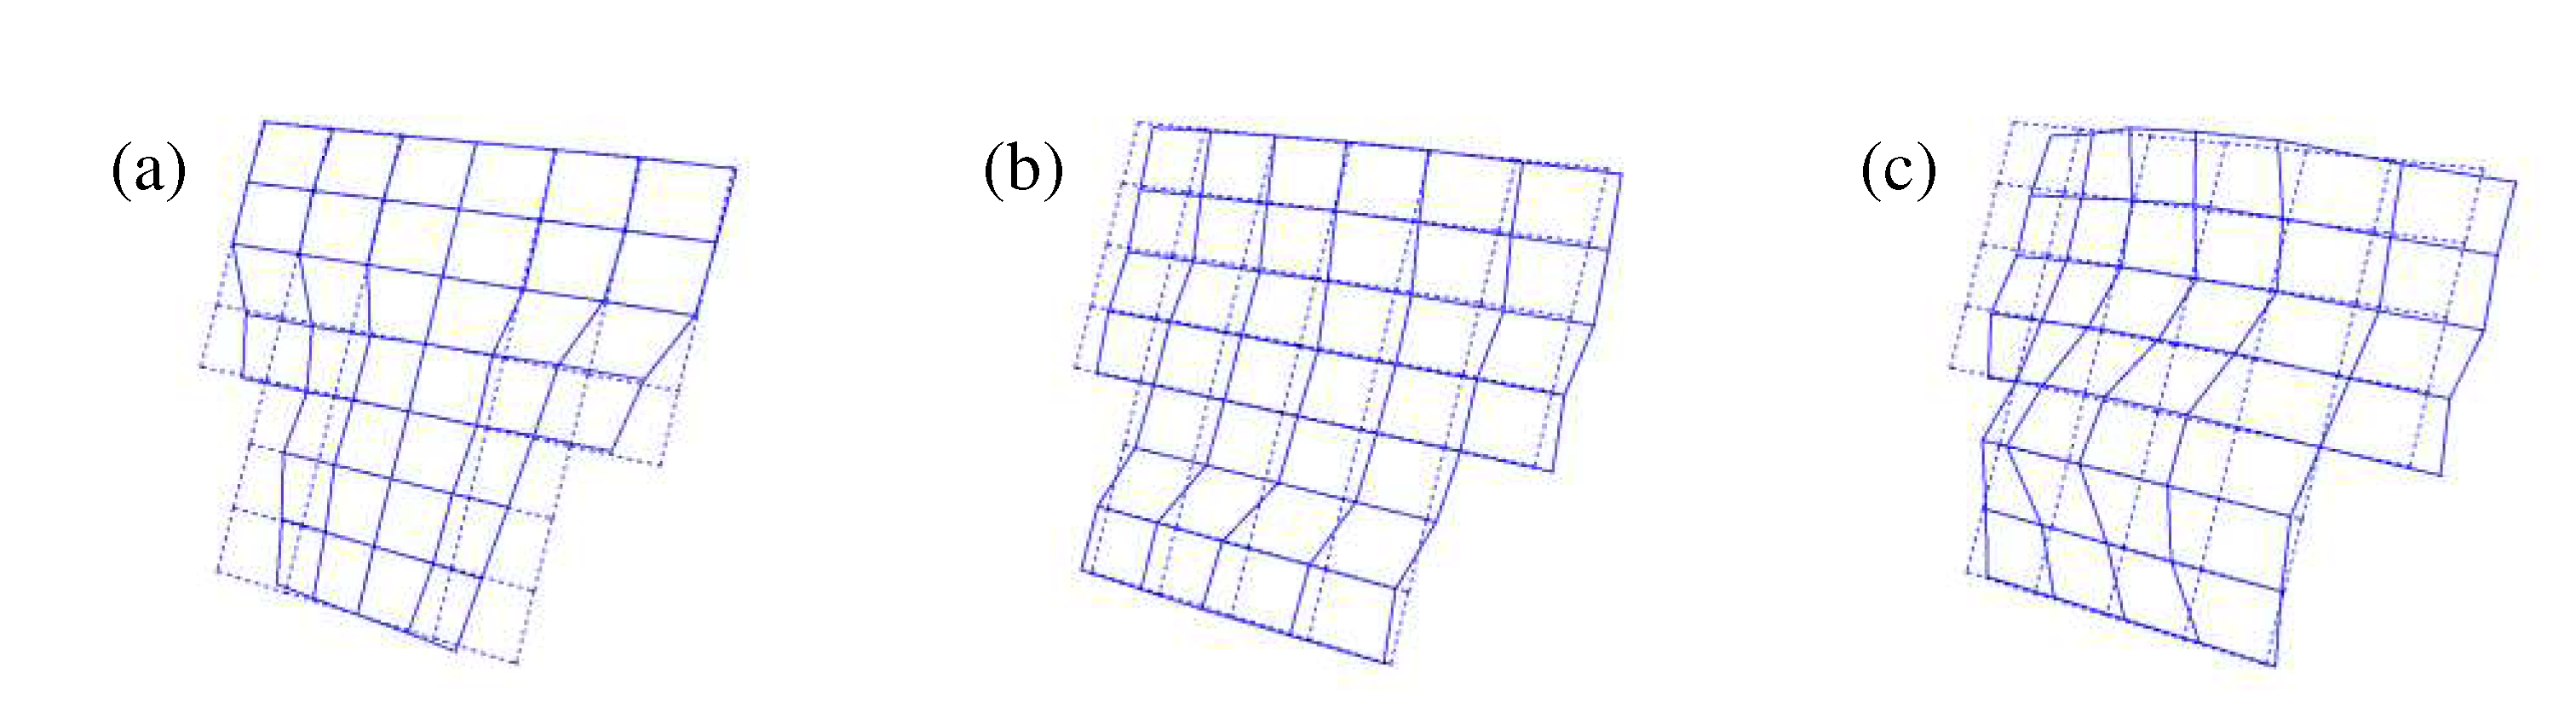
Figure 14.
Components of a guide bumper: (a) steel part; (b) rubber part; (c) plastic; and (d) guide bumper assembly.
Figure 14.
Components of a guide bumper: (a) steel part; (b) rubber part; (c) plastic; and (d) guide bumper assembly.
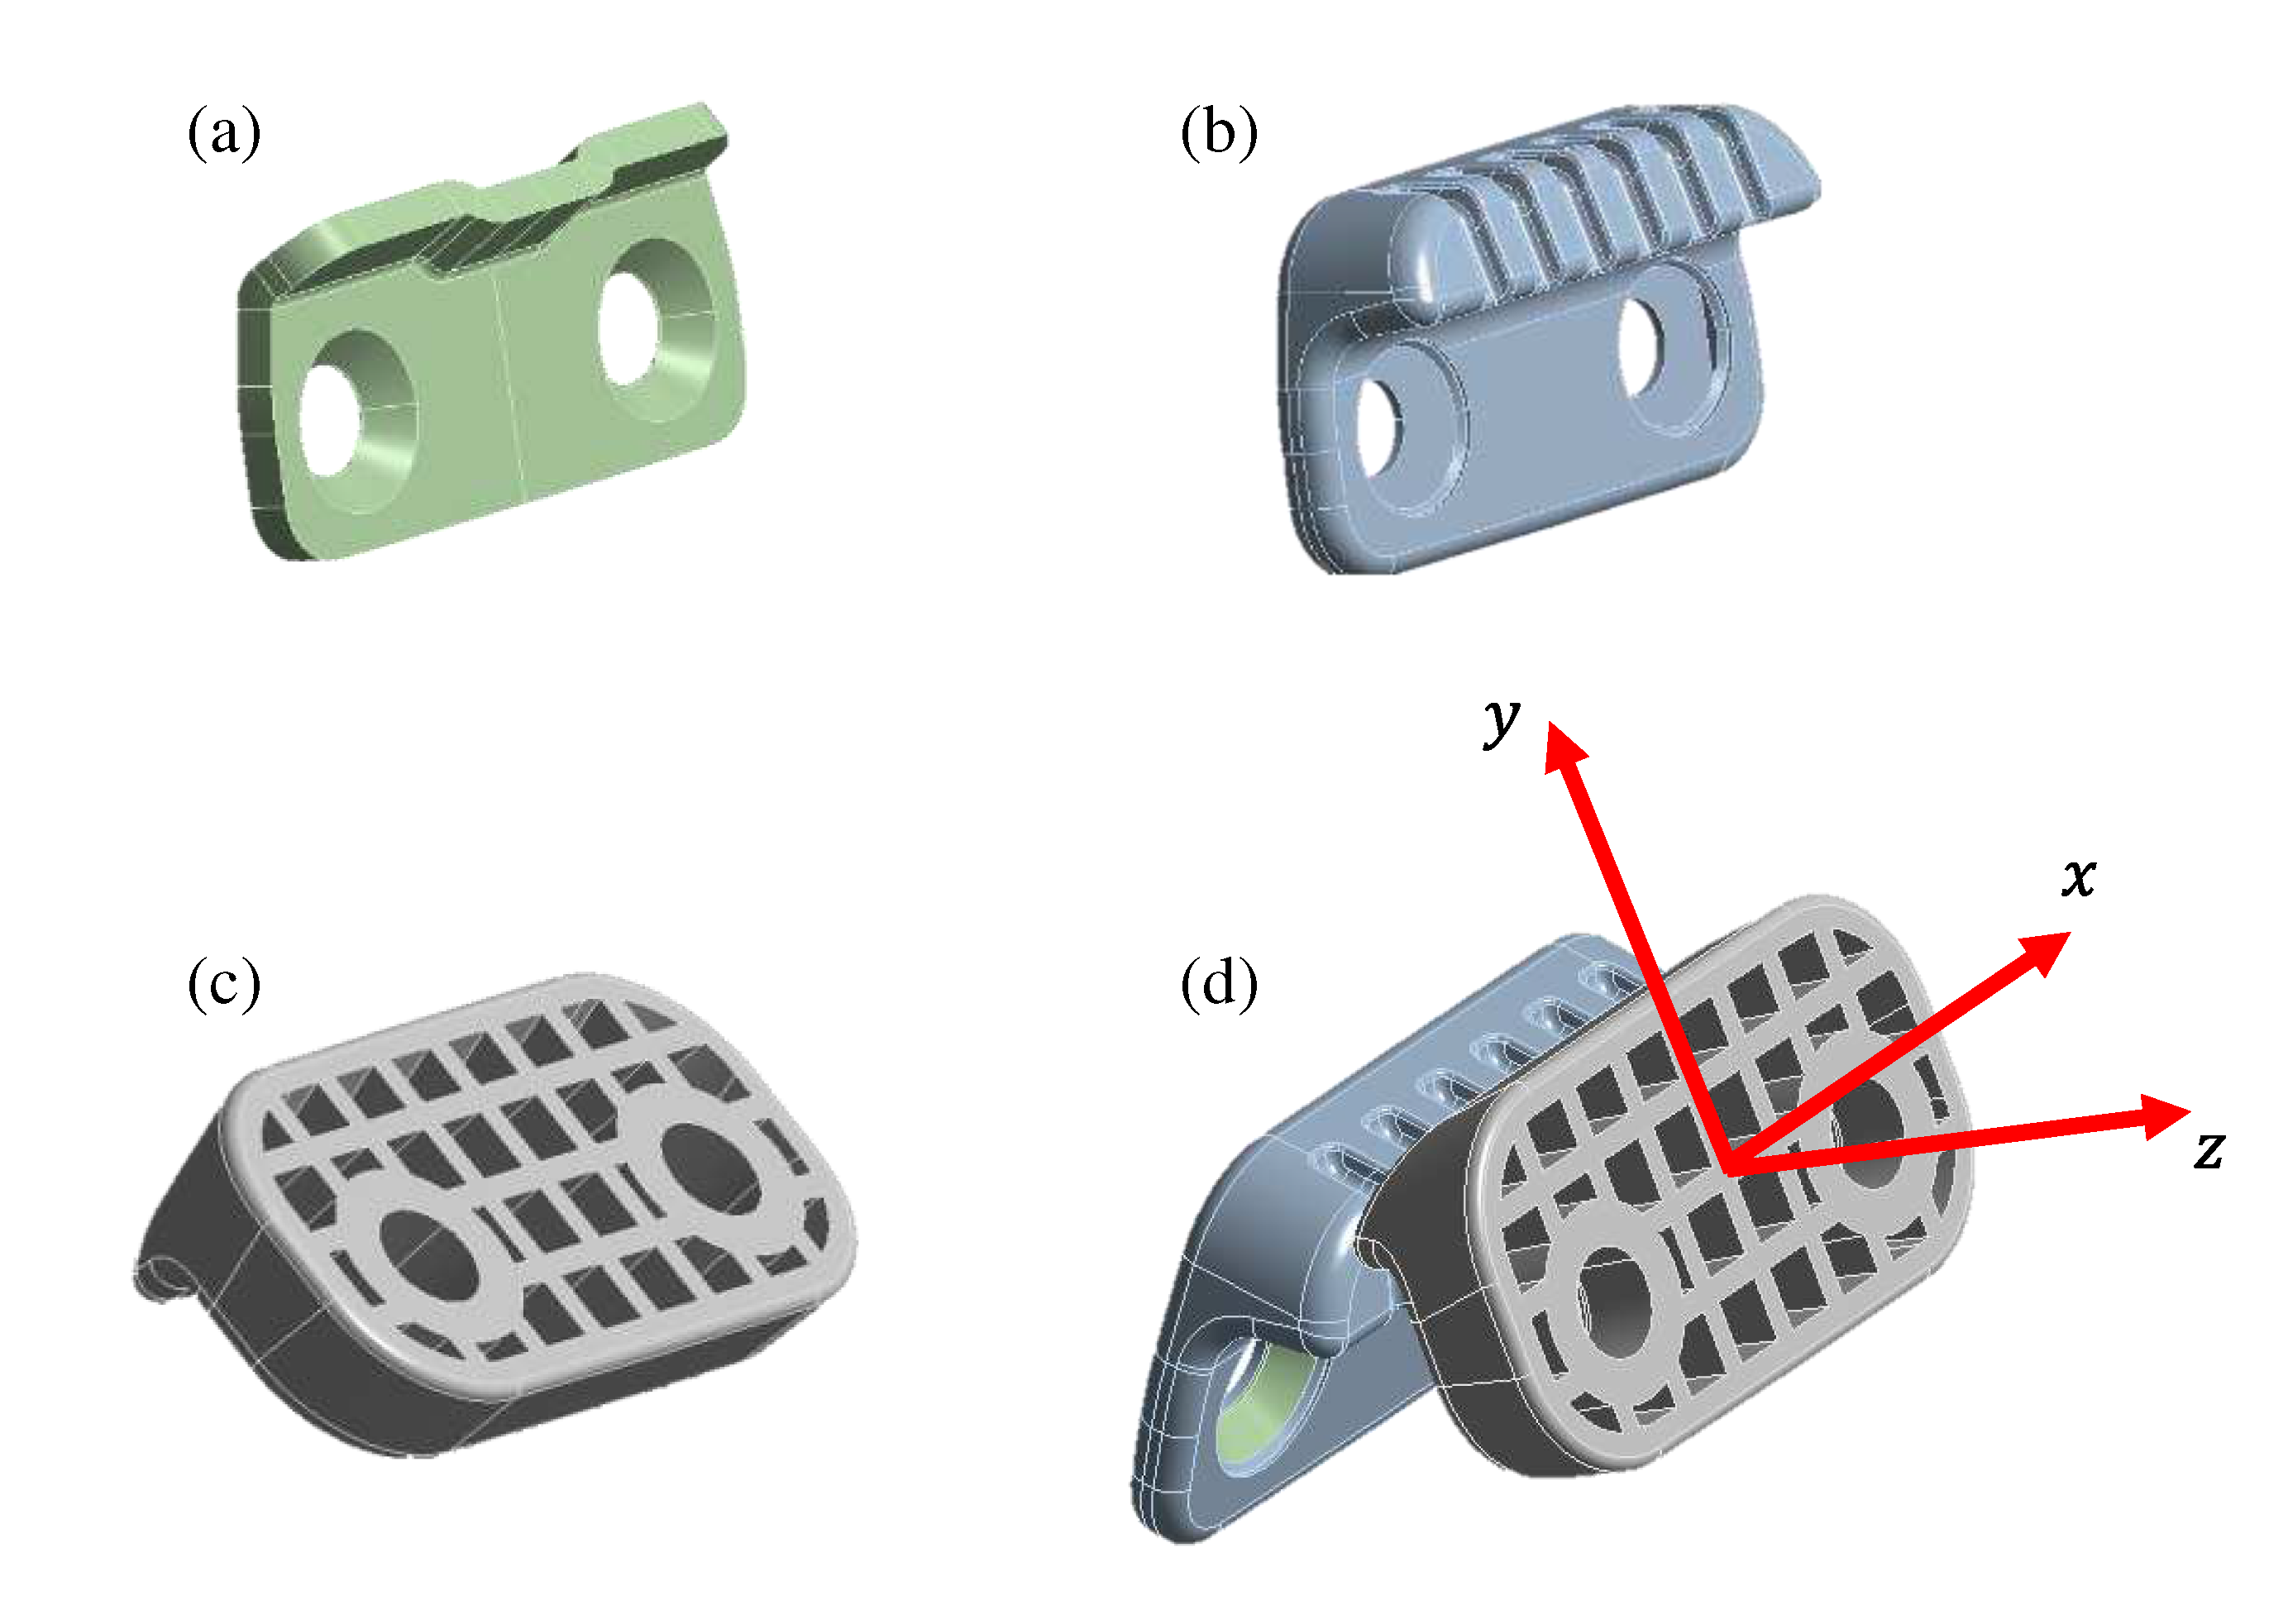
Figure 15.
The process of obtaining the equivalent stiffness of the guide bumper through simulation: (a) Simulation method for translational stiffness (); (b) Simulation result for translational stiffness; (c) Simulation method for rotational stiffness (); and (d) Simulation result for rotational stiffness.
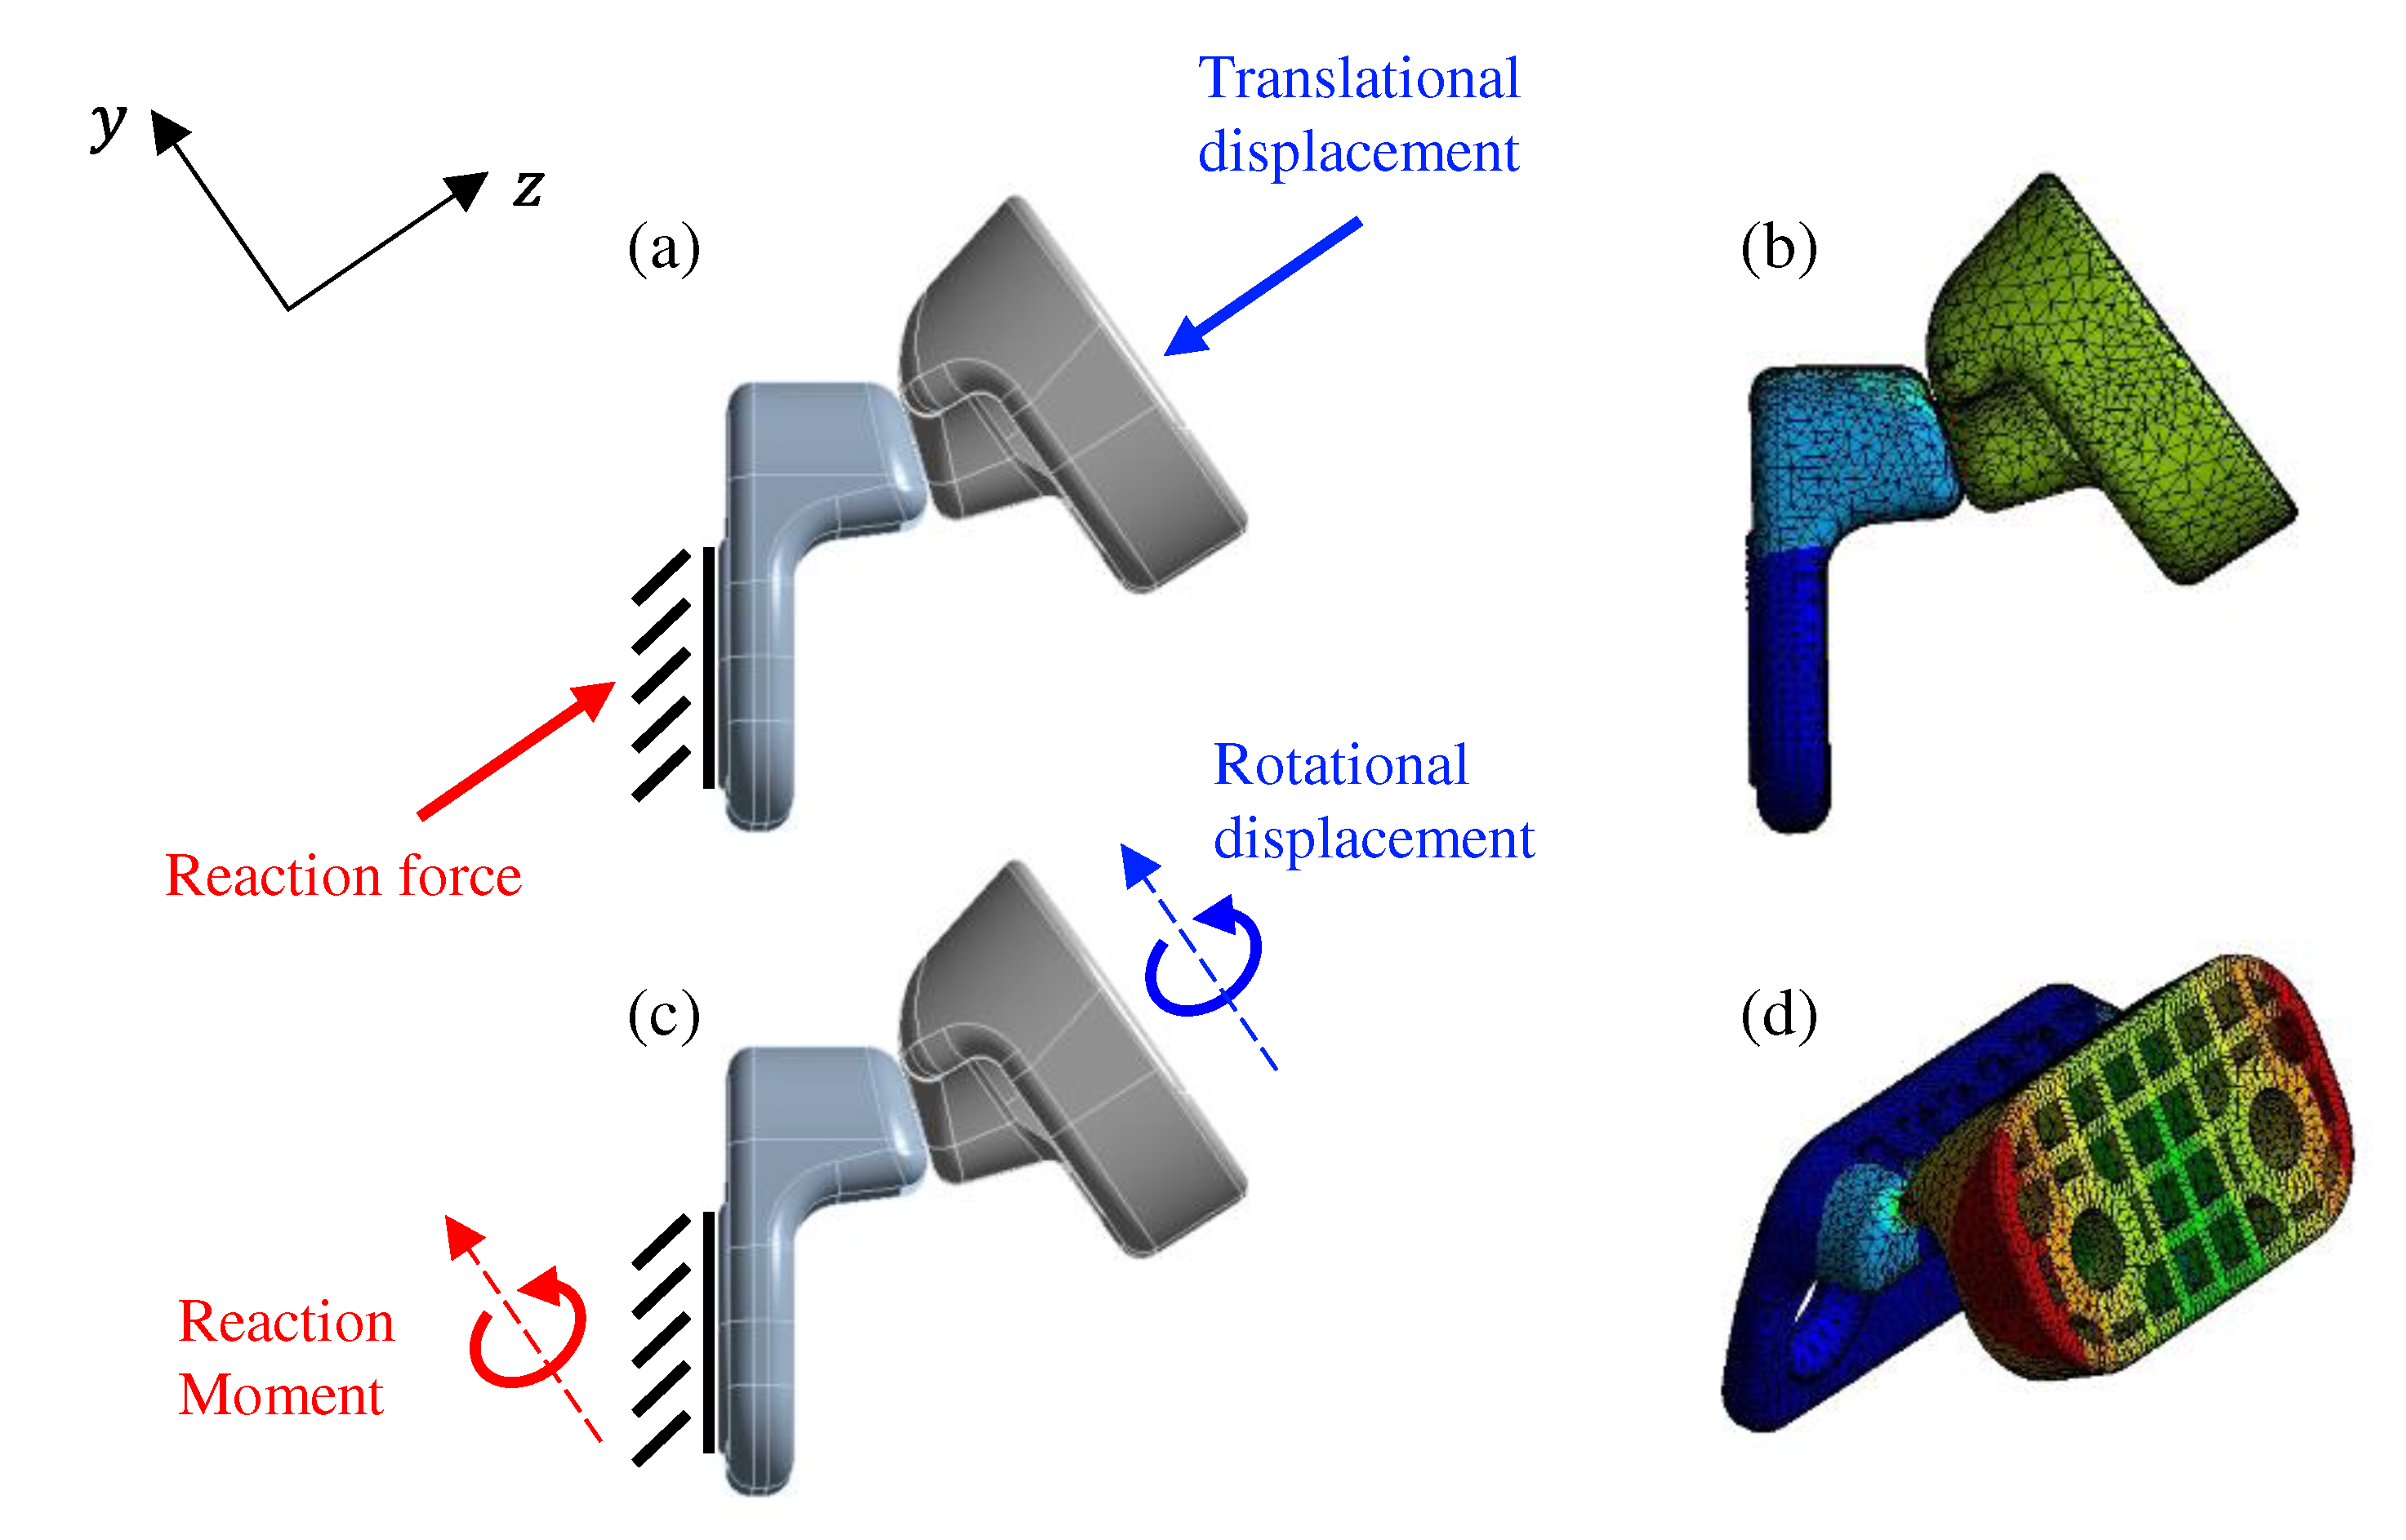
Figure 16.
Stiffness increase region to compensate for the lack of rigidity.
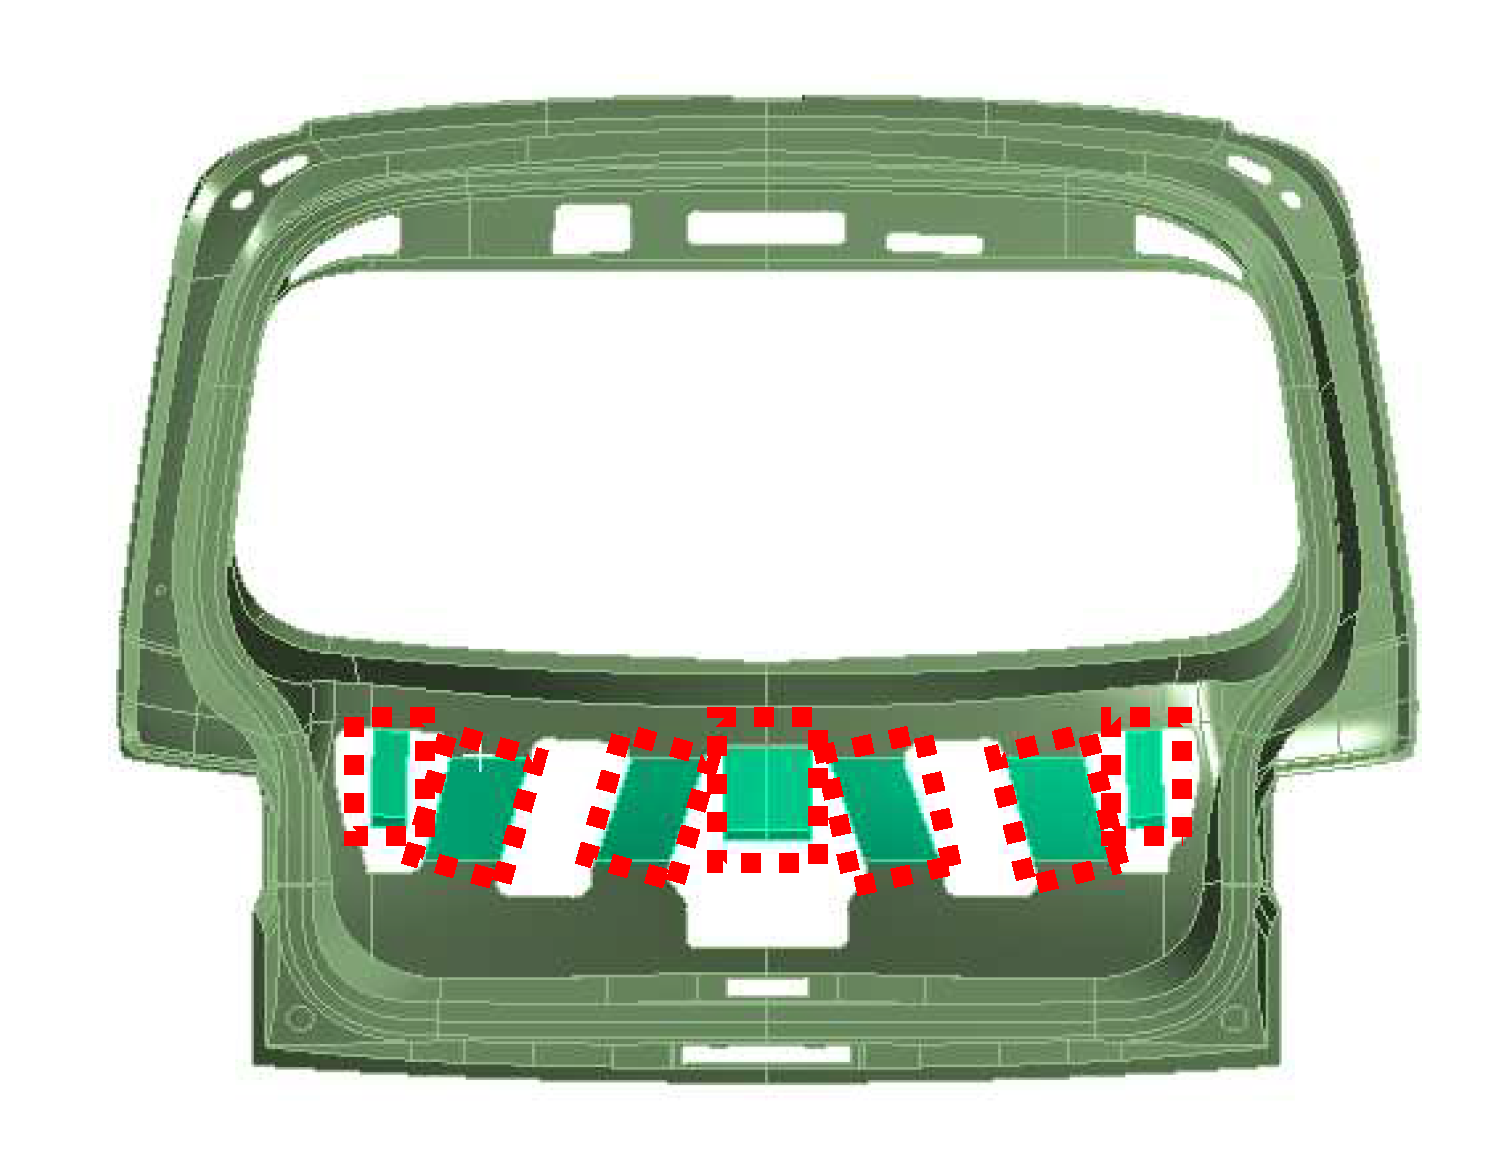
Figure 17.
Structural improvements of the tailgate inner panel: (a) Present design of the inner panel; and (b) Improved design for the inner panel.
Figure 17.
Structural improvements of the tailgate inner panel: (a) Present design of the inner panel; and (b) Improved design for the inner panel.
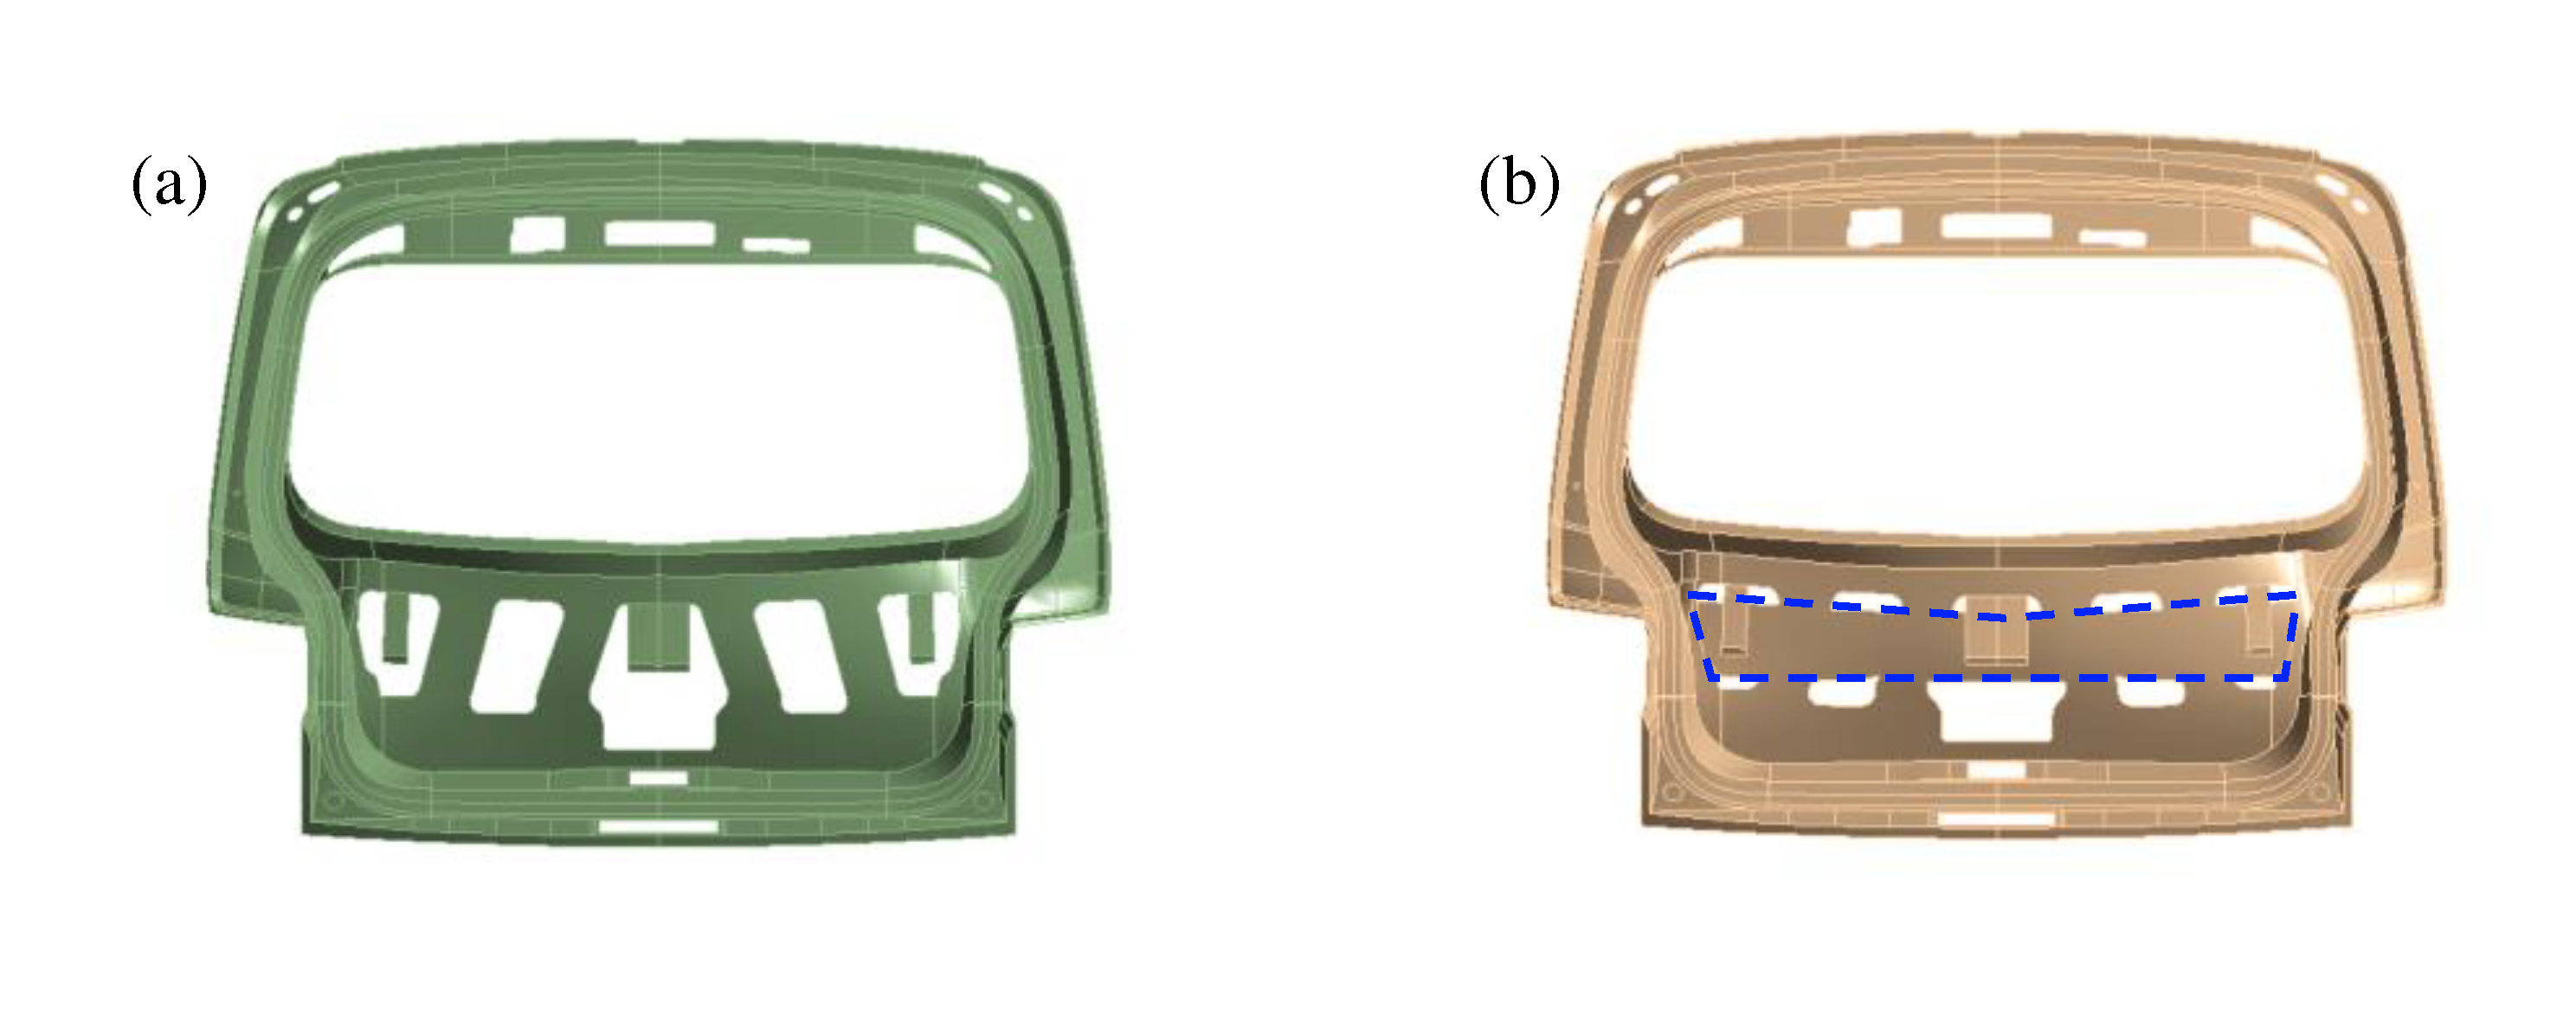
Figure 18.
Tailgate model subjected to random excitation forces: (a) Tailgate model with base excitation for random vibration analysis; and (b) Location of maximum deformation occurrence under random excitation forces.
Figure 18.
Tailgate model subjected to random excitation forces: (a) Tailgate model with base excitation for random vibration analysis; and (b) Location of maximum deformation occurrence under random excitation forces.
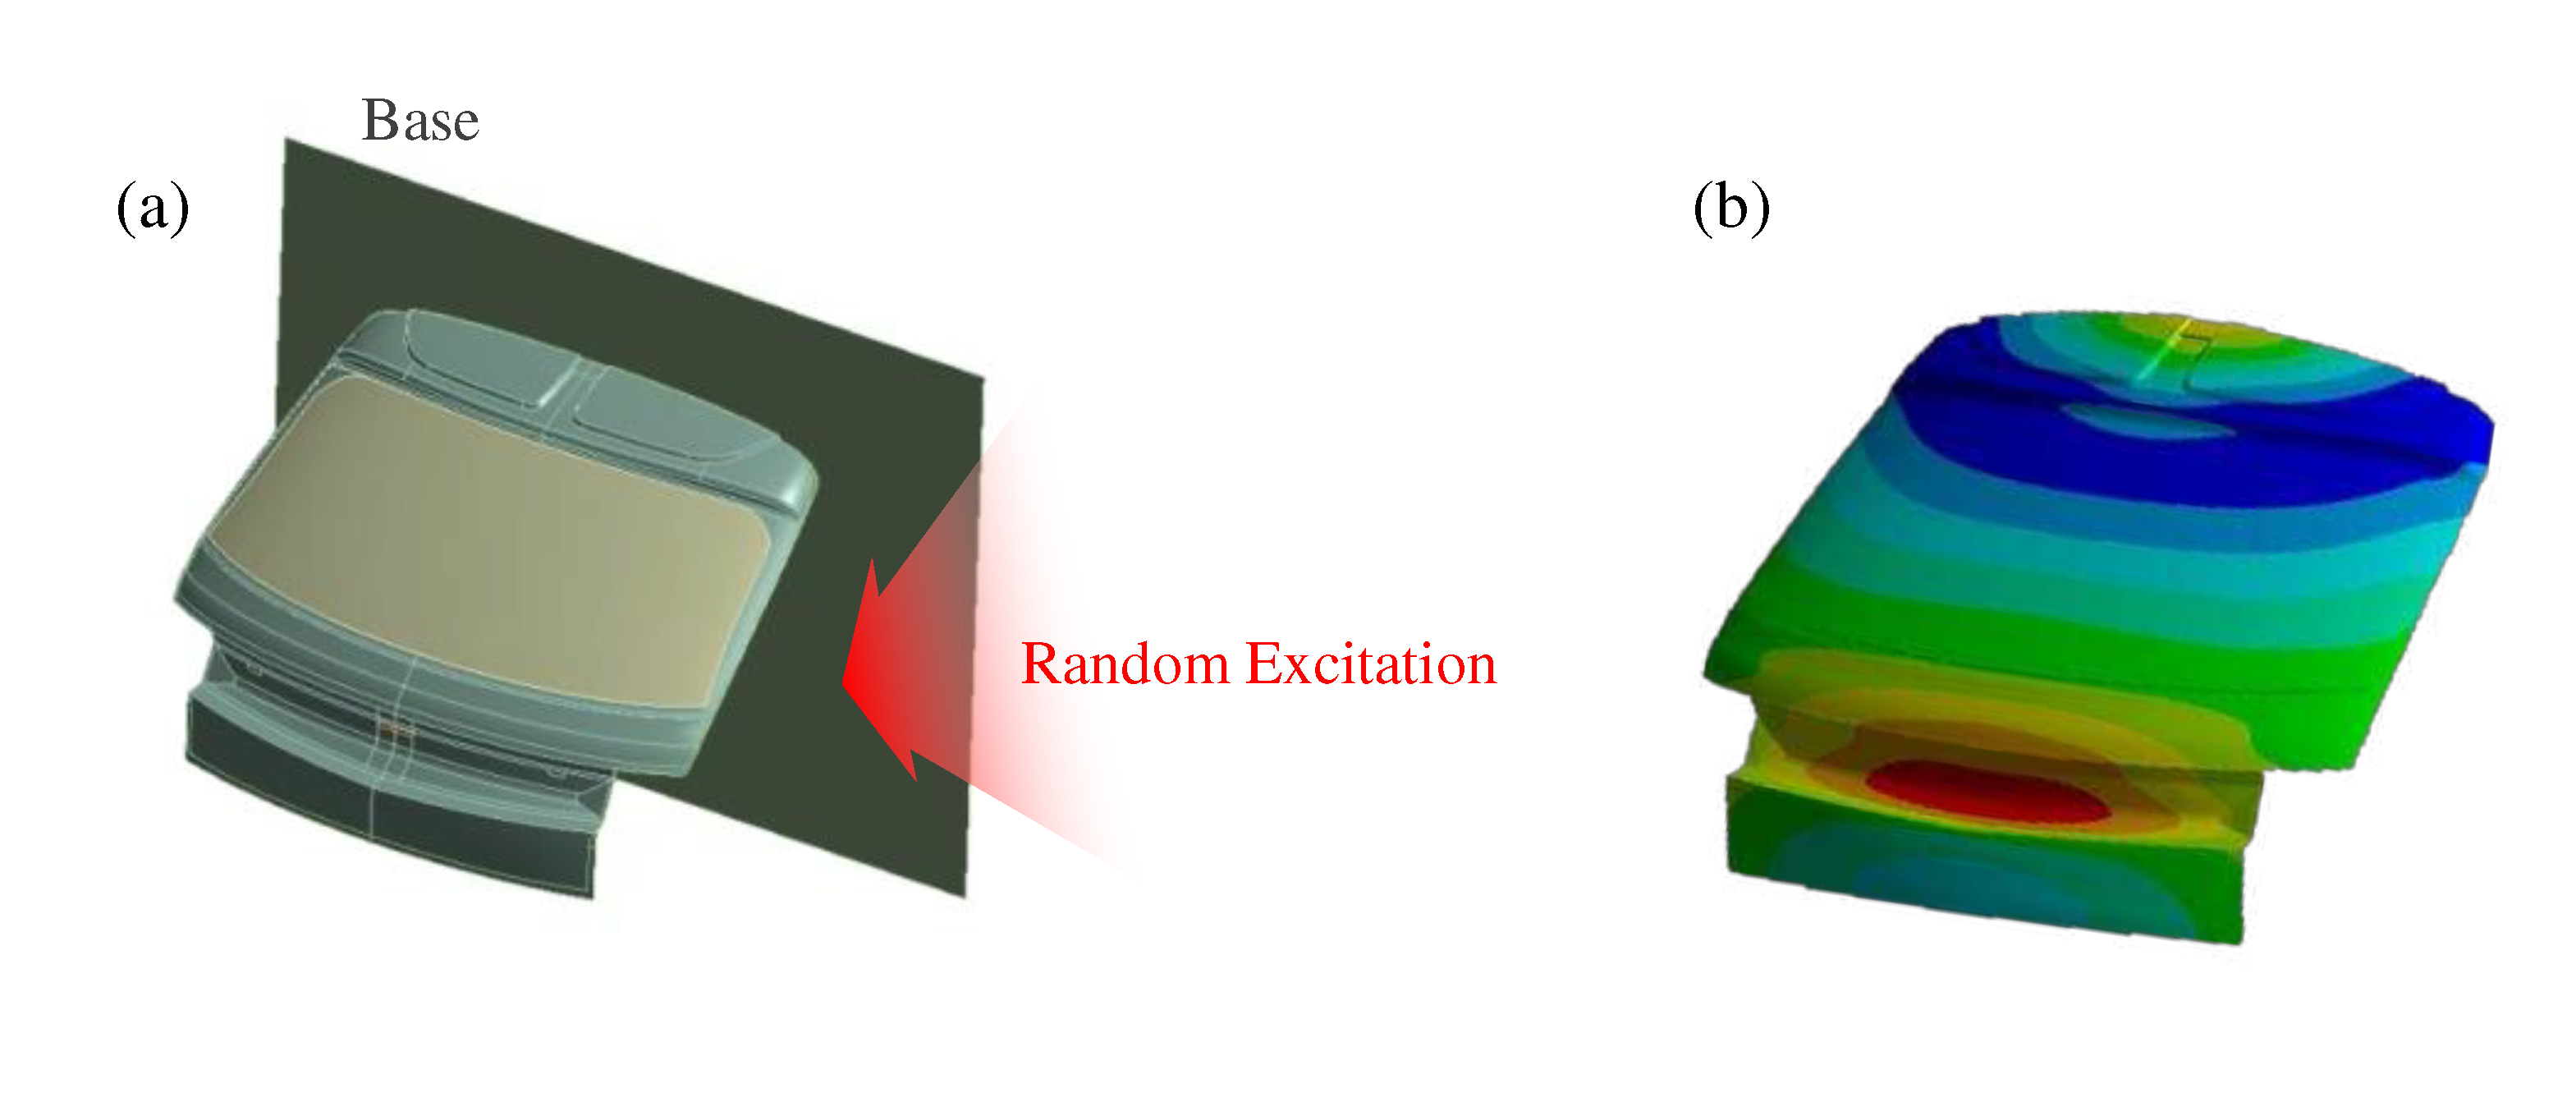
Figure 19.
Random excitation Power Spectral Density (PSD).
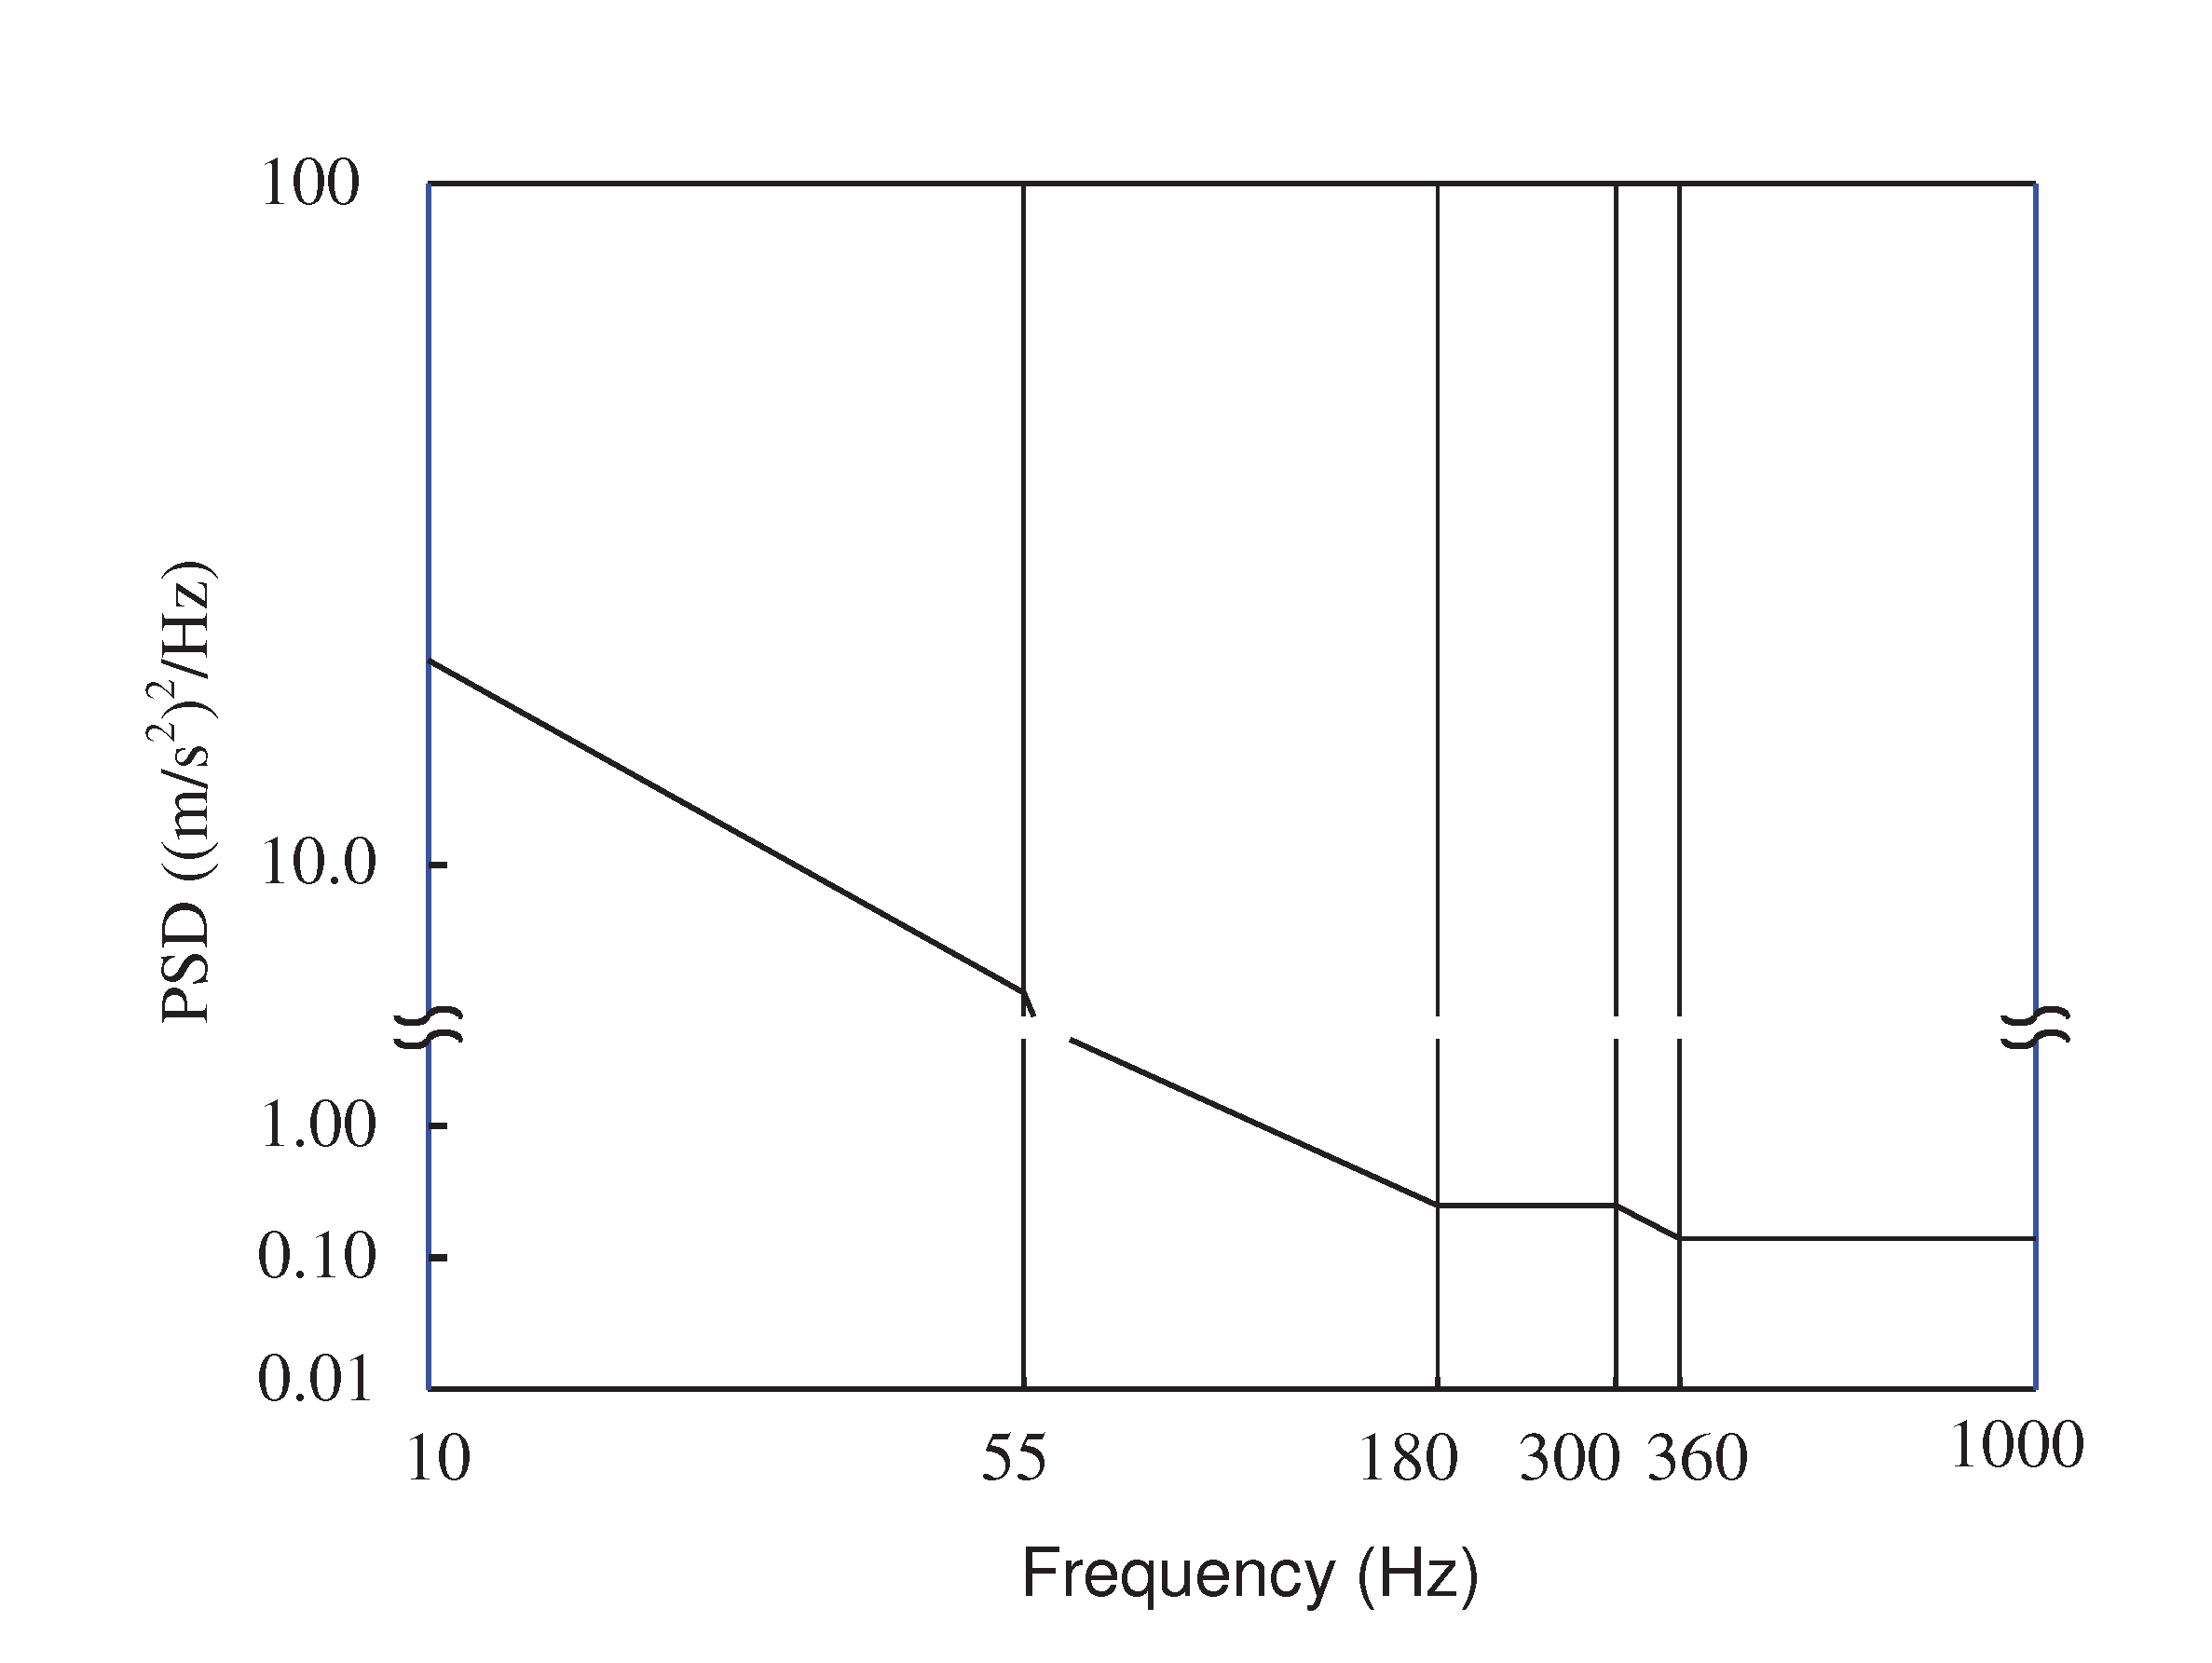

Table 1.
Tailgate natural frequencies according to changes in boundary conditions.
| Case | Removed Component | Natural frequency (Hz) | |
|---|---|---|---|
| 1st | 2nd | ||
| 1 2 3 4 5 |
None Guide bumpers Gas lift, spindle Over-slam bumpers Weather strip |
23.7 18.0 23.4 23.3 23.2 |
28.6 24.0 27.9 27.8 27.8 |
Table 2.
Comparison of the natural frequencies obtained by simulation and experiment under free-free boundary conditions.
Table 2.
Comparison of the natural frequencies obtained by simulation and experiment under free-free boundary conditions.
| Mode No. | Mode | Natural Frequency (Hz) | ||
|---|---|---|---|---|
| Simulation | Experiment | Difference | ||
| 1st 2nd 3rd |
Torsion Bending Pumping |
20.8 36.0 44.0 |
19 36 45 |
-1.8 0 1.0 |
Table 3.
Comparison of the natural frequencies obtained by simulation and experiment with the tailgate assembled onto the vehicle.
Table 3.
Comparison of the natural frequencies obtained by simulation and experiment with the tailgate assembled onto the vehicle.
| Mode No. | Mode | Natural frequency (Hz) | ||
|---|---|---|---|---|
| Simulation | Experiment | Difference | ||
| 1st 2nd 3rd |
Translation & bending Bending & Translation Torsion |
21.5 27.8 34.7 |
23.7 28.6 37.6 |
2.2 0.8 2.9 |
Table 4.
Increase in natural frequencies when tailgate model parameters are doubled.
| Case | Parameters doubled in value | Mode No. | Natural frequency (Hz) | |
|---|---|---|---|---|
| Simulation results | Difference | |||
| 1 | Young's modulus of the inner panel | 1st 2nd 3rd |
21.6 28.1 34.7 |
0.1 0.3 0 |
| 2 | Young's modulus of the specified region of the outer panel. | 1st 2nd 3rd |
22.2 29.4 36.1 |
0.7 1.6 1.4 |
| 3 | Guide bumper stiffness | 1st 2nd 3rd |
21.5 30.2 39.3 |
0 2.4 4.6 |
Disclaimer/Publisher’s Note: The statements, opinions and data contained in all publications are solely those of the individual author(s) and contributor(s) and not of MDPI and/or the editor(s). MDPI and/or the editor(s) disclaim responsibility for any injury to people or property resulting from any ideas, methods, instructions or products referred to in the content. |
© 2023 by the authors. Licensee MDPI, Basel, Switzerland. This article is an open access article distributed under the terms and conditions of the Creative Commons Attribution (CC BY) license (http://creativecommons.org/licenses/by/4.0/).
Copyright: This open access article is published under a Creative Commons CC BY 4.0 license, which permit the free download, distribution, and reuse, provided that the author and preprint are cited in any reuse.


