
Submitted:
21 November 2023
Posted:
22 November 2023
You are already at the latest version
Abstract
A rapid and efficient technique using an electronic nose based on a mass detector combined with headspace sampling (HS-SPME-MS e-nose) and chemometric tools was applied to classify beer samples between fresh and aged and between samples contained in aluminium cans or glass bottles, and to predict the shelf life of beer. The mass spectra obtained from the HS-SPME-MS e-nose contain information on the volatile compounds, recorded as the abundance of each ion at different mass-to-charge (m/z) ratios. The analysis was performed on 53 samples aged naturally for eleven months in the absence of light and with a controlled temperature of around 14° C +/- 0.5° C. Principal Component Analysis (PCA) was performed on the data, showing a grouping of samples between fresh and aged. Partial Least Square Discriminant Analysis (PLS-DA) allowed discriminating fresh from aged beers but was not able to discriminate samples packaged in aluminium cans or in glass bottles. Finally, Partial Least Square Regression (PLSR) was applied to build a prediction model and showed to be effective to predict beer shelf life.
Keywords:
HS-MS e-NOSE
; packaging
; prediction
; shelf life
1. Introduction
The aroma of beer is characterized by a complex mixture of volatile compounds that vary widely in nature and concentration levels. These chemical compounds are extracted from raw materials including malt, hops and yeast, during the brewing process. The role of each compound in the sensory perception of the product depends on the ratio between concentration level and sensory threshold, which affects directly their odour activity value [1].
Beer aroma is one of the most determinant factors of its quality. During its shelf life, beer is subjected to chemical reactions that can affect aroma resulting in decreased sensory quality. Due to its complexity, beer ageing is considered a major quality problem for the brewing industry since the rate of chemical reactions that occur during beer storage is determined by both internal factors (e.g. raw material, brewing techniques, oxygen content, pH, and key odorants precursors contents), and external factors (e.g. packaging, vibration, temperature and light) [2,3].
Generally, a sensory panel in combination with common analytical tools, such as gas chromatography, are used to evaluate beer aroma during its shelf life. Saison et. al [4] studied the effect of 26 staling compounds on aged beer flavour by determining their threshold values to elucidate the impact of these chemical compounds on beer flavour. The authors used an untrained and a trained panel to determine the threshold of added substances, and headspace solid-phase micro-extraction coupled to gas chromatography (HS-SPME/GC-MS) to determine the concentration of flavour compounds, and a trained panel of eight members to perform a sensory analysis in fresh and forced aged beers. Another example of the use of both techniques to evaluate the aroma during ageing can be found in Depraetere et. al [5], who studied the influence of oxygen on the beer staling process by analysing the impact of wort aeration on beer ageing. For this, pilsner and ale beers were produced with the classical wort aeration technique or using the yeast pre-oxygen process, and the staling of these beers was analysed in natural and forced aged beers by purge and trap gas chromatography-mass spectrometry (P&T GC-MS) and sensory analysis. Vanderhaegen et. al [6] also used P&T GC-MS and sensory analysis to study the evolution of chemical and sensory properties of top-fermented beers during ageing. The samples were subjected to different conditions of temperature and dissolved oxygen concentration and were aged for 6 months before the analysis. The changes in the concentration of acetate esters, ethyl esters, carbonyls, Maillard compounds, dioxotanes, and furanic esters were recorded after 6 months of ageing. In addition, a relationship between sensory evaluation and the presence of specific compounds was discussed. The authors proposed the 2-furfuryl ethyl ester as a good candidate to evaluate the thermal stress imposed on beer.
In a previous study [7], we applied gas chromatography with mass spectrometric detection (GC-MS) in combination with a sensory evaluation test to monitor and compare the evolution of the aroma profile in beer stored in aluminium cans and glass bottles during beer's natural aging. The results showed that olfactometrically panellists were able to distinguish beer by the type of container. On the other hand, the results from the instrumental analysis showed that the samples could not be differentiated by the type of container but by the ageing time. A prediction model built was capable of determining the ageing time of the samples with an error of 1.1 months. Since approaches based on chromatographic and sensory analysis are expensive and time-consuming and, in the case of sensory analysis, have the disadvantage of assessor fatigue and subjectiveness [8,9],we propose in this paper a faster alternative, centred on the use of an electronic nose (e-nose) based on the mass spectrometry (MS) detector. The electronic nose combined with headspace solid-phase microextraction (HS-SPME) is capable to analyse samples in a short time providing as a result a representative, diagnostic and generalised mass spectrometric fingerprint of the volatile fraction of the sample, without prior chromatographic separation [10]. The HS-SPME-MS e-nose technique consists of an aroma extraction system, which carries the volatile compounds extracted from the headspace of liquid samples to the ionization chamber of a mass spectrometer, in which they are fragmented [8,11]. The mass spectrum obtained from the fragments of all the volatile compounds is recorded as the abundance of each ion at different mass fragments (m/z) ratios.
The aim of this study was to investigate if the HS-SPME-MS technique is capable to classify beer according to the type of container, aluminium can or glass bottle, and the time of storage (fresh or aged). We also aimed to build a prediction model of beer shelf life and compared the results with those obtained in our previous study to confirm the efficiency of this faster technique.
2. Materials and Methods
2.1. Samples
For the study we used the same samples as described in [ref 7]. A total of 108 samples of commercial Lager beer style packaged in aluminium cans (54 samples) and glass bottles (54 samples) were used for the controlled natural ageing experiments. The samples were delivered directly from a local brewery, in the freshest conditions possible, with an alcohol content of 5.4% v.v. The samples were aged for 11 months in the absence of light at 14°C +/- 0.5° C.
Forty samples of the same beer brand were purchased in the freshest possible conditions (less than 1 month of packaging) in a local supermarket in both packages, aluminium cans and glass bottles. The samples were used to verify if the proposed method is also capable of differentiating the fresh samples from brewery and bought in a supermarket, and to create a better model to predict the aging time of samples. All beer samples were degassed by ultrasonication for 15 min before the analysis. All the samples were prepared and analysed in triplicate.
2.2. Headspace Solid-Phase Microextraction (HS-SPME)
The SPME holder, for manual sampling, and the polydimethylsiloxane (PDMS) 100 μm, carboxen-polydimethylsiloxane (Carboxen/PDMS) 75 μm and StableFlex divinylbenzene-carboxen-polydimethylsiloxane (DVB/CAR/PDMS) 50/30 μm fiber used in this investigation were purchased from Supelco (Bellefonte, PA). All the fibers were conditioned before use and thermally cleaned between analyses by inserting them into the GC injection port at the temperature recommended by the producer.
The conditions for headspace extraction were placing 5mL samples into 10mL glass vials with 1,7g of NaCl. The vials were hermetically capped with PFTE/silicone septa under atmosphere. To achieve equilibrium of volatile compounds between the liquid and the headspace, the samples were thermostated at 65°C for 1h and under constant stirring in the headspace autosampler.
2.3. Instrumental Analysis
Beer analyses were performed in an HS-MS from Hewlett-Packard (Waldborn, Germany), composed of an HP 7694 static headspace sampler, an HP 6890 gas chromatograph, and an HP 5973 quadrupole mass spectrometer with a diffusion pump. Because the function of the gas chromatograph was to transfer the volatiles from the headspace sampler to the MS detector, the apolar analytical column (HP-5MS) was kept at a suitable temperature to guarantee the transfer of volatiles in less than 5 minutes to the MS and to avoid the chromatographic separation. After samples were equilibrated, three millimetres of the headspace generated was then transferred to the injection port through the transfer line at 90°C. The injection was in splitless mode for 1.6 min at 250°C using an inlet of 1.5 mm i.d. An HP column (30m x 0.25mm x 0.25µm) was used. The oven temperature program that guarantees the transference of the volatiles in the shortest time (less than 5 min) to the MS was: 70°C (1min), 70°C , 180°C (2.5min). The carrier gas helium with a flow-rate of 1.6mL. The mass spectra were recorded by electronic impact (EI) ionization at 70 eV with a temperature of 230°C in the ion source and 150°C in the mass quadrupole. The mass-to-charge ratio range (m/z) used was 50-150. Because ethanol is the most abundant volatile compound (approx. 5%), ratios lower than 50 m/z were not analysed to avoid interference from ethanol.
2.4. Chemometric Methods
The mass spectra fingerprints obtained from the analysis contain chemical information on the volatile fraction of the sample analysed and are displayed on a plot that reports the mass fragments (m/z) within the selected mass range on the X-axis, and the ion abundances for the mass fragments on the Y-axis.
The data obtained were exported from the HS-MS e-nose software to an Excel table and were structured in a matrix of dimensions 53 rows (samples) x 100 columns (m/z ratios). The chromatographic values of the matrix were the values of the m/z ratios. Before the chemometric analysis, the matrix values were preprocessed, since the difference between the high and low peaks was significant, affecting the analysis. The pre-processing of the matrix was made by dividing the values of each m/z by the total sum of the m/z values contained in the matrix. Then, a second pre-processing applied to data was autoscaling (i.e. mean centring and standardization to unit variance).
First, Principal Component Analysis (PCA) was applied to the data matrix to visualize the data and to detect sample groups or trends. Then, Partial Least Squares Discriminant Analysis (PLS-DA) was used to discriminate between fresh and aged beers and between beers contained in aluminium cans or glass bottles. Finally, Partial Least Squares Regression (PLSR) was used to build a model relating the mass spectra to the ageing months, that is, to predict the freshness of the product during its shelf-life under optimal storage conditions and independently of the type of package used.
All calculations were performed using PLS Toolbox v8.7 (Eigenvector Research Inc., Eaglerock, USA) with MATLAB R2021a (The MathWorks, Natick, USA).
3. Results
3.1. Instrumental Analysis
Although there is no strict chromatographic separation with the HS-MS electronic nose, there is a delay during the transfer of the volatile fraction from the headspace to the mass spectrometer. Figure 1A shows this HS-MS time profile for a given beer sample, that is, the sum of the abundances of all ions present in the mass spectrum at every time point.
In turn, Figure 1B shows the e-nose mass spectrum obtained from the volatile fraction of the beer sample in Figure 1A. The mass spectrum is the sum of the abundances for every ion recorded in the time interval during the volatile transfer from the headspace to the mass spectrometer plotted against their mass-to-charge ratios (m/z). The range of m/z used in this study was restricted from 50 to 150 to avoid the effect of ethanol (m/z = 45 and 46), the main volatile compound in the samples, and because the main aromatic compounds in beer have fragment ions in that m/z range.
3.2. Chemometric Methods
3.2.1. Principal Component Analysis (PCA)
PCA was used for a preliminary visualization of the HS-MS data. This chemometric tool reduces the dimensionality of the original data matrix by compressing the information into a few new variables called Principal Components (PCs) and helps to reveal groups and trends in the data and point out outlier samples. The two main plots obtained from PCA are the score and loading plots, which respectively show the projection of the samples and variables onto the new PC space.
A first PCA was applied to the complete dataset and revealed the presence of outlier samples. After careful inspection of the data we observed that the spectrum of the samples was clearly different (lower abundance values) from the other samples of the same group, so we decided to remove 10 samples and perform the analyses. Figure 2 shows the PCA score plot of the new dataset for the first two PCs.
It can be observed that the two first PCs explain 80% of the original information. In Figure 2B the first principal component (PC1) shows a separation between fresh and aged samples, being the fresh samples from brewery located more in the center and the fresh samples bought in a supermarket more to the left of the plot. The six and eleven-month aged samples, in the right of the plot, presented a certain tendency to group among themselves. On the other hand, we can appreciate from the Figure 2A that there is no grouping between aluminum cans or glass bottles.
3.1.2. Partial Least Squares Discriminant Analysis (PLS-DA)
Based on the promising results of PCA, where some differentiation was observed between samples according to aging time, we decided to apply PLS-DA to check if we could discriminate the data set between fresh and aged samples, and between samples contained in aluminium cans or glass bottles.
PLS-DA is a discriminant method that is based on the Partial Least Squares Regression (PLSR) algorithm described below. To classify the samples, the PLS-DA model is built by correlating the matrix X of predictor variables (abundances at the different m/z ratios in this case) with a vector y of dummy variables, zeros and ones in a two-class problem, as in this work. In the first case, the value 0 was assigned to the fresh samples and the value 1 to the aged samples. In the second case, the value 0 was assigned to aluminium cans and the value 1 to glass bottles. The PLS-DA models were built with autoscaled spectra and validated using the random subsets cross-validation technique. The optimal number of latent variables (LVs) of the model was determined based on the minimum number of misclassified samples in the cross-validation set, resulting in models with 2 LVs (model fresh vs aged samples) and 2 LVs (model aluminium cans vs glass bottles). Figure 3 shows the results of the classification models. Figure 3B shows that PLS-DA allows discriminating fresh from aged beers, with a100% of correct classification for the validation set of samples. However, the PLS-DA model shown in Figure 3A was not able to discriminate samples packaged in aluminium cans or in glass bottles, with 14 misclassified samples in the validation set.
3.1.3. Partial Least Squares Regression (PLSR)
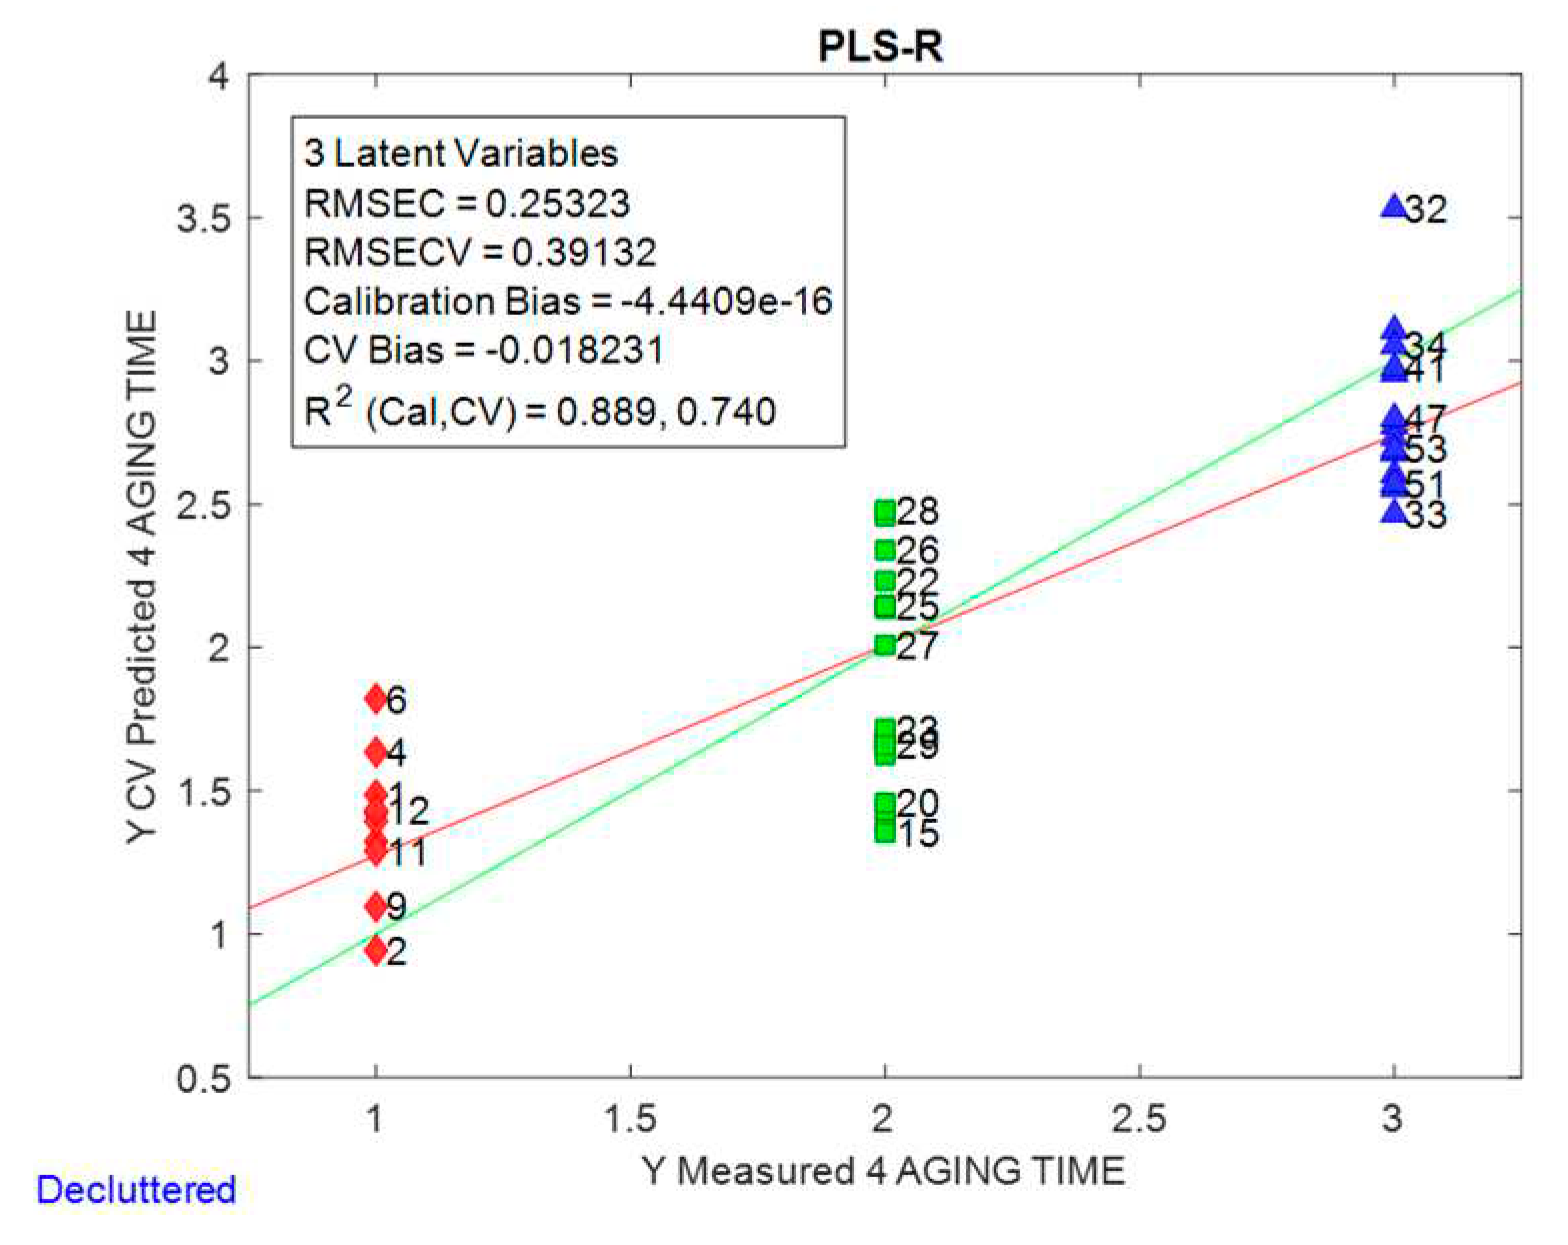
Finally, and in order to predict beer shelf life, PLSR was used. The best model was found using three aging classes: Class 1: 1 month (fresh beer), Class 2: 3 months-aged, and Class 3: 6 and 11 months-aged samples. A regression model was built between the X-matrix (abundances of the different m/z ratios) and a y-vector containing the ageing classes: Class 1, Class 2 and. Class 3. The model was cross-validated using random subsets. The optimal number of latent variables (LVs) of the model was determined based on the minimum value of the prediction error for the cross-validation set and expressed as the Root Mean Square Error of Cross Validation (RMSECV):
are the months predicted by the models, are the actual months, and nt is the number of samples in the cross-validation set. RMSECV is an approximation of the average error to be expected in future predictions when the calibration model is applied to unknown samples.
Figure 4 shows the plot of predicted vs actual values for the validation set and some parameters of the model. The average error that one could expect when predicting the ageing time of a beer using this model is around 0.39 months, for a model with 3 LVs. This means that with our model a beer aged less than 11 months can be safely predicted as being within its shelf life (1 year).
4. Discussion
By observing the chemometric results of PCA it could be seen that the samples clustered according to their freshness but not according to the type of packaging used (aluminum can or glass bottle), such as in our previous study mentioned above. This trend was assessed and verified by the PLS-DA models. Two PLS-DA models were developed to classify samples based on their shelf life aging (fresh vs aged) and on their type of packaging (aluminum can vs glass bottle). The results showed that PLS-DA model is able to classify samples based on their shelf life freshness with a success rate of 100%, but is not able to classify the samples based on their type of packaging, misclassifying 35% of the samples.
Both types of samples, those contained in aluminum cans and in glass bottles, were delivered from the brewery directly after packaging and in the same conditions and were kept in darkness at a controlled temperature of 14° C +/- 0.5° during the aging process. Some of them were bought in a supermarket where the samples were kept in the same conditions of light and temperature imposed by the supermarket. Therefore, this may explain why samples did not show a significant difference between them just because they were in different types of container.
Lorencová et. al [12] evaluated physicochemical parameters and organoleptic properties of Czech-type lager beer [11.00% (w/w) original wort extract; 4.60% (v/v) ethyl alcohol content] during a 12-month storage period (25 ± 2 °C), stored 12-month period in relation to the applied type of packaging (glass bottle, aluminum can, polyethylene terephthalate (PET) bottle and stainless steel beer keg). The organoleptic characteristics examined were off-flavors, carbonation level, fullness, bitterness intensity and overall rating. Furthermore, the physicochemical parameters studied during storage were CO2 concentration, color, turbidity (haze) and foaming stability. Generally, the type of packaging significantly influenced the physicochemical and organoleptic properties of the examined samples (P < 0.05). The more clear changes were observed in the CO2 content, color and turbidity. The aluminum can and stainless steel keg were found to be the most suitable types of packaging for beer storage. On the contrary, the PET bottle was found as the least appropriate for long-term storage period. The authors concluded that, from the sensory perspective, it could be assumed that aluminium cans, glass bottles and stainless-steel beer kegs are suitable packaging types for long-term storage of beer.
The PLSR model was implemented to predict the beer shelf life. It showed a determination coefficient of R2 = 0.740 and was able to predict the ageing time of a beer with an error of around 0.4 months. This prediction error is much lower than the 1.1 months obtained in our previous study. The results of the PLSR model showed the potential application of the HS-SPME-MS e-nose in assessing the freshness of a beer during its shelf life.
5. Conclusions
Standard methods for complete characterization and prediction of beer shelf life are time consuming, expensive, and require the work of experienced professionals. In this work, a faster and more efficient method, based on HS-SPME-MS e-nose and multivariate analysis, was proposed to classify beers as fresh or aged and to predict beer shelf life based on the changes occurred in the volatile matrix of the samples. PLS-DA was used to classify the samples into fresh and aged with very good classification results, and PLSR was used to create a model to predict beer shelf life. The results showed that HS-SPME-MS e-nose coupled to multivariate analysis seems to be a rapid, efficient and useful tool for discriminating beer samples based on the time of storage and to predict the shelf life of samples.
Author Contributions
Ana Carolina de Lima e Silva: Conceptualization, Investigation, Methodology, Writing - original draft, Writing - review & editing. Laura Aceña: Conceptualization, Investigation, Methodology, Supervision, Visualization, Validation, Writing - original draft, Writing - review & editing. Montserrat Mestres: Conceptualization, Investigation, Methodology, Supervision, Visualization, Validation, Writing - original draft, Writing - review & editing. Ricard Boqué: Conceptualization, Funding acquisition, Formal analysis, Software, Supervision, Validation, Writing - original draft, Writing - review & editing.
Funding
This research was funded by MCIN/AEI/10.13039/501100011033 grant number PID2019-104269RR-C33 and by the Secretaria d’Universitats i Recerca of the Departament d’Empresa i Coneixement de la Generalitat de Catalunya grant number 2021FI_B2 00851.
Acknowledgments
The authors acknowledge the support given by Antonio Fumanal Sopena to this research.
Conflicts of Interest
The authors declare no conflict of interest.
References
- Ghasemi-Varnamkhasti, M.; Mohtasebi, S.S.; Rodriguez-Mendez, M.L.; Lozano, J.; Razavi, S.H.; Ahmadi, H. Potential Application of Electronic Nose Technology in Brewery. Trends Food Sci. Technol. 2011, 22, 165–174. [Google Scholar] [CrossRef]
- Rodrigues, J.A.; Barros, A.S.; Carvalho, B.; Brandão, T.; Gil, A.M. Probing Beer Aging Chemistry by Nuclear Magnetic Resonance and Multivariate Analysis. Anal. Chim. Acta 2011, 702, 178–187. [Google Scholar] [CrossRef]
- Lima, A.C. De; Aceña, L.; Mestres, M.; Boqué, R. An Overview of the Application of Multivariate Analysis to the Evaluation of Beer Sensory Quality and Shelf-Life Stability. Foods 2022, 11, 2037. [Google Scholar] [CrossRef] [PubMed]
- Saison, D.; De Schutter, D.P.; Uyttenhove, B.; Delvaux, F.F.R.; Delvaux, F.F.R. Contribution of Staling Compounds to the Aged Flavour of Lager Beer by Studying Their Flavour Thresholds. Food Chem. 2009, 114, 1206–1215. [Google Scholar] [CrossRef]
- Depraetere, S.A.; Delvaux, F.; Schutter, D. De; Williams, I.S.; Winderickx, J.; Delvaux, F.R. The Influence of Wort Aeration and Yeast Preoxygenation on Beer Staling Processes. Food Chem. 2008, 107, 242–249. [Google Scholar] [CrossRef]
- Vanderhaegen, B.; Neven, H.; Coghe, S.; Verstrepen, K.J.; Verachtert, H.; Derdelinckx, G. Evolution of Chemical and Sensory Properties during Aging of Top-Fermented Beer. J. Agric. Food Chem. 2003, 51, 6782–6790. [Google Scholar] [CrossRef] [PubMed]
- de Lima, A.C.; Aceña, L.; Mestres, M.; Boqué, R. Monitoring the Evolution of the Aroma Profile of Lager Beer in Aluminium Cans and Glass Bottles during the Natural Ageing Process by Means of HS-SPME/GC-MS and Multivariate Analysis. Molecules 2023, 28, 2807. [Google Scholar] [CrossRef] [PubMed]
- Siadat, M.; Losson, E.; Ghasemi-Varnamkhasti, M.; Mohtasebi, S.S. Application of Electronic Nose to Beer Recognition Using Supervised Artificial Neural Networks. Proc. - 2014 Int. Conf. Control. Decis. Inf. Technol. CoDIT 2014 2014, 640–645. [Google Scholar] [CrossRef]
- Saevels, S.; Lammertyn, J.; Berna, A.Z.; Veraverbeke, E.A.; Di Natale, C.; Nicolaï, B.M. An Electronic Nose and a Mass Spectrometry-Based Electronic Nose for Assessing Apple Quality during Shelf Life. Postharvest Biol. Technol. 2004, 31, 9–19. [Google Scholar] [CrossRef]
- Liberto, E.; Bressanello, D.; Strocchi, G.; Cordero, C.; Ruosi, M.R.; Pellegrino, G.; Bicchi, C.; Sgorbini, B. HS-SPME-MS-Enose Coupled with Chemometrics as an Analytical Decision Maker to Predict In-Cup Coffee Sensory Quality in Routine Controls: Possibilities and Limits. Molecules 2019, 24, 4515. [Google Scholar] [CrossRef]
- Vera, L.; Aceña, L.; Guasch, J.; Boqué, R.; Mestres, M.; Busto, O. Characterization and Classification of the Aroma of Beer Samples by Means of an MS E-Nose and Chemometric Tools. Anal. Bioanal. Chem. 2011, 399, 2073–2081. [Google Scholar] [CrossRef]
- Lorencová, E.; Salek, R.N.; Černošková, I.; Buňka, F. Evaluation of Force-Carbonated Czech-Type Lager Beer Quality during Storage in Relation to the Applied Type of Packaging. Food Control 2019, 106, 1–8. [Google Scholar] [CrossRef]
Figure 1.
Mass spectrum obtained for a beer sample. (A) Global Spectrum - Time vs Abundance; (B) m/z ratio vs Relative Abundance.
Figure 1.
Mass spectrum obtained for a beer sample. (A) Global Spectrum - Time vs Abundance; (B) m/z ratio vs Relative Abundance.
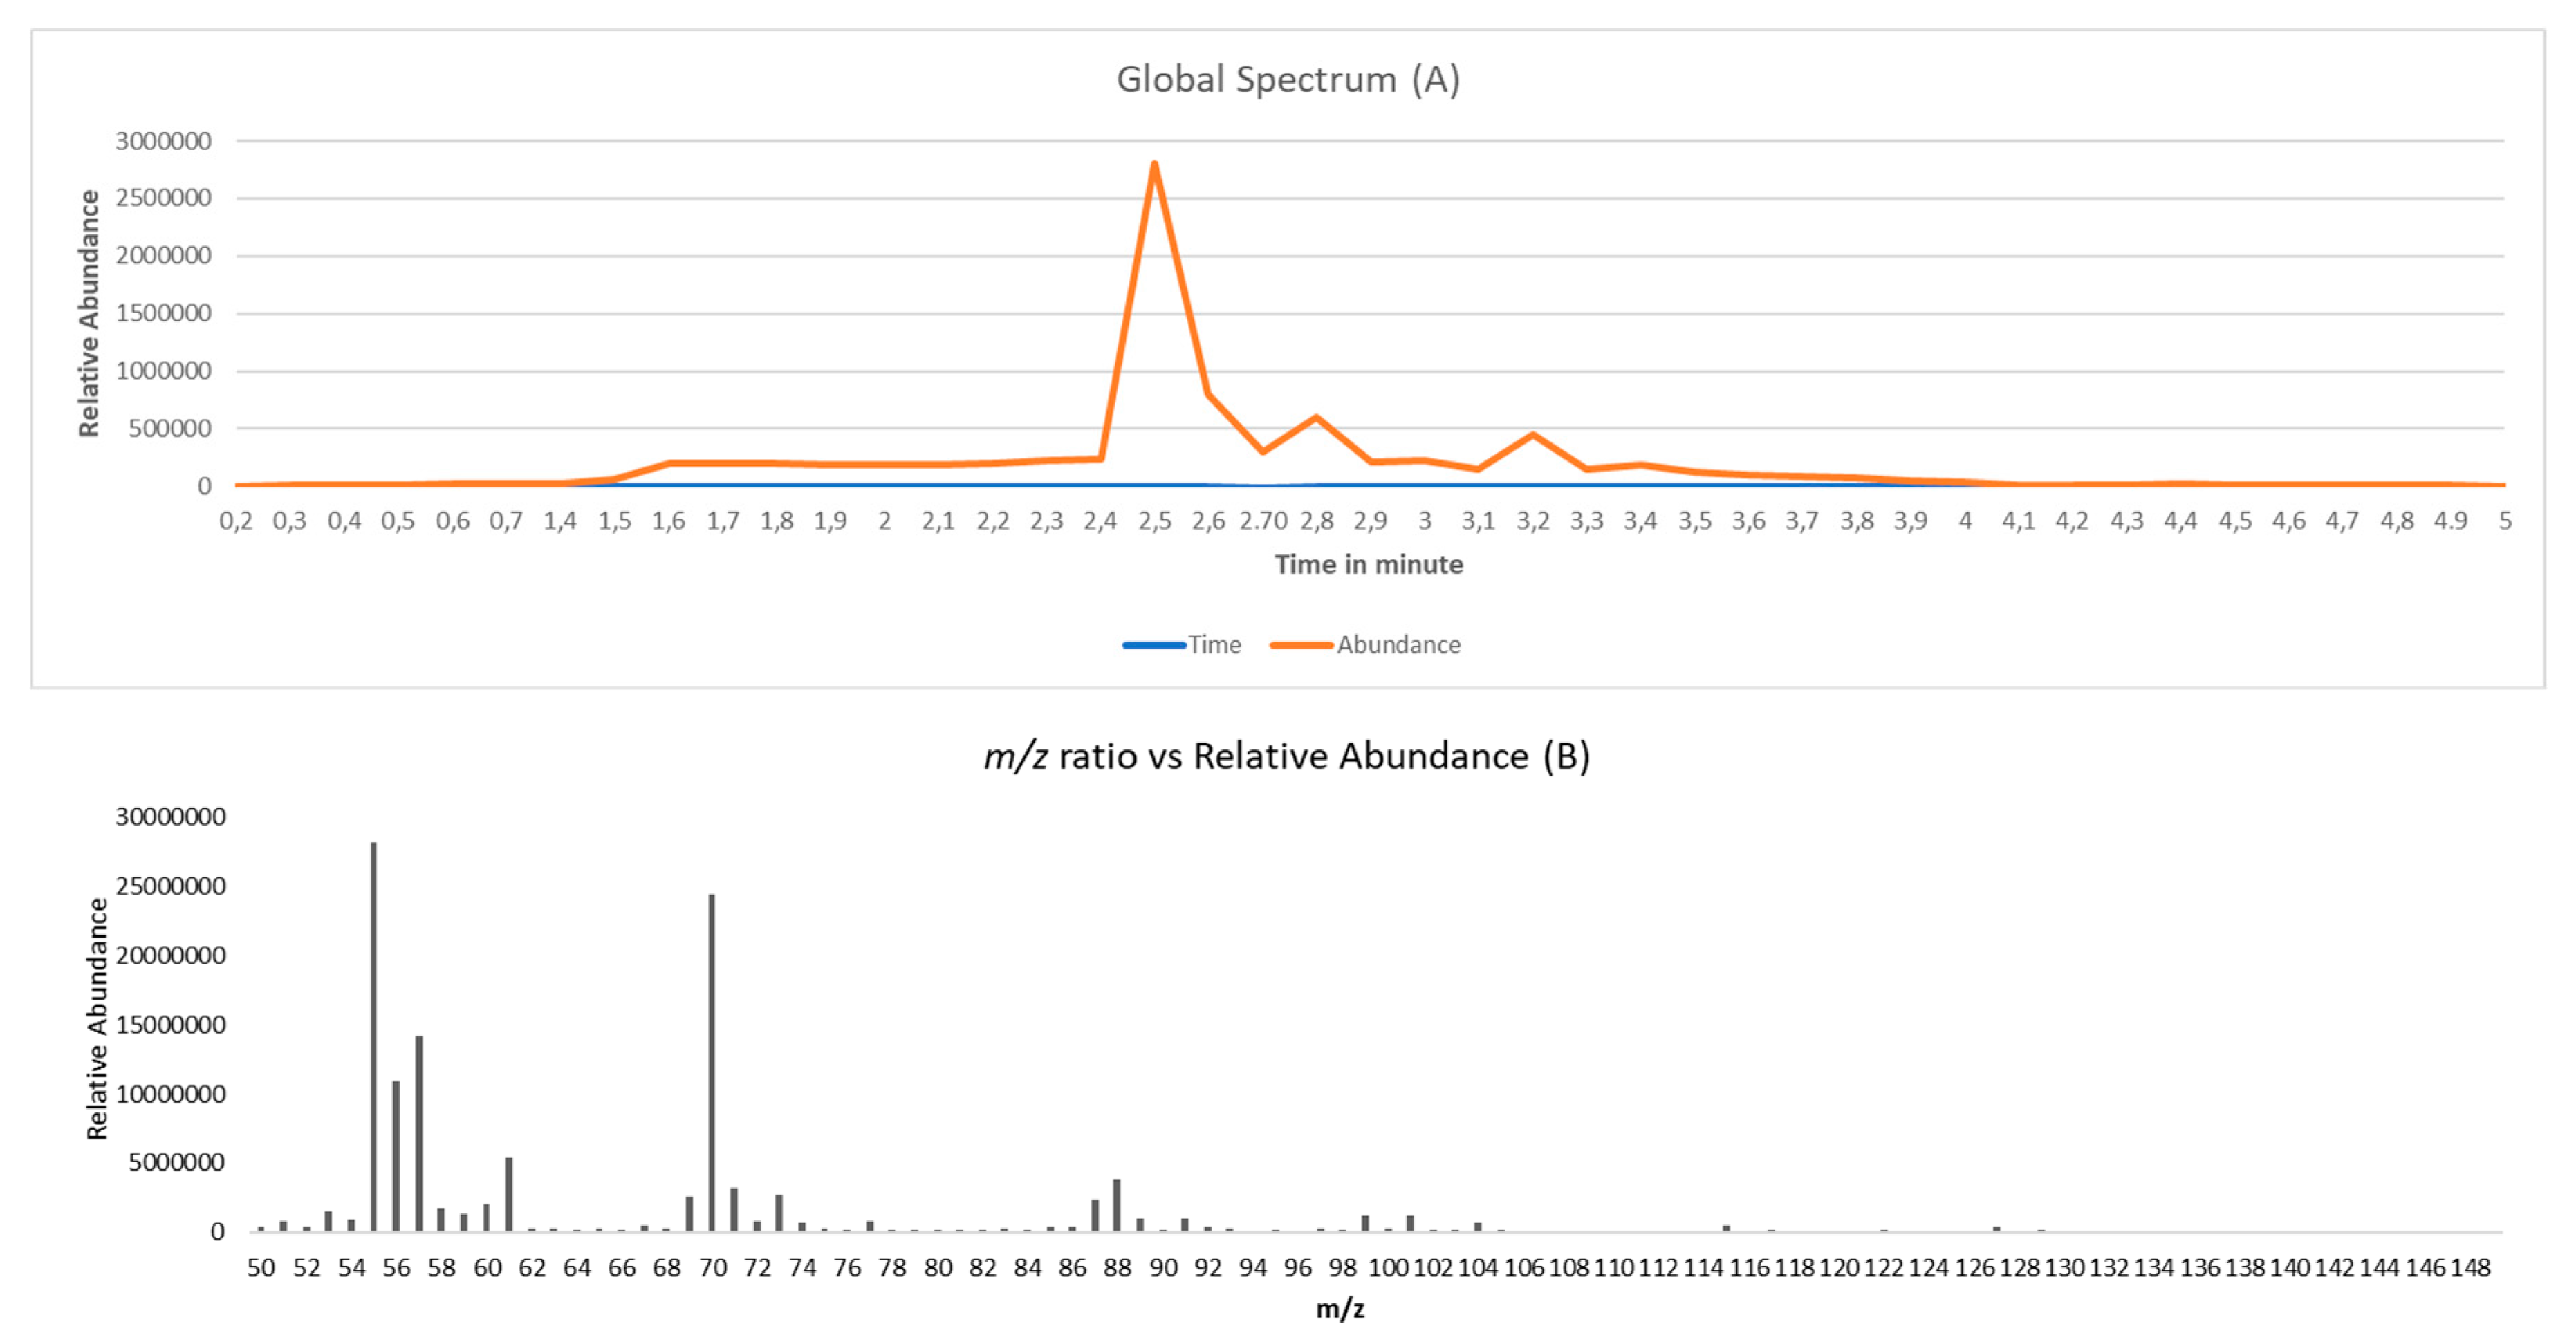
Figure 2.
Score plot of the first two principal components of the PCA model (A): Aluminium Can vs. Glass Bottle. PCA (B): Fresh Samples vs. Aged Samples.
Figure 2.
Score plot of the first two principal components of the PCA model (A): Aluminium Can vs. Glass Bottle. PCA (B): Fresh Samples vs. Aged Samples.
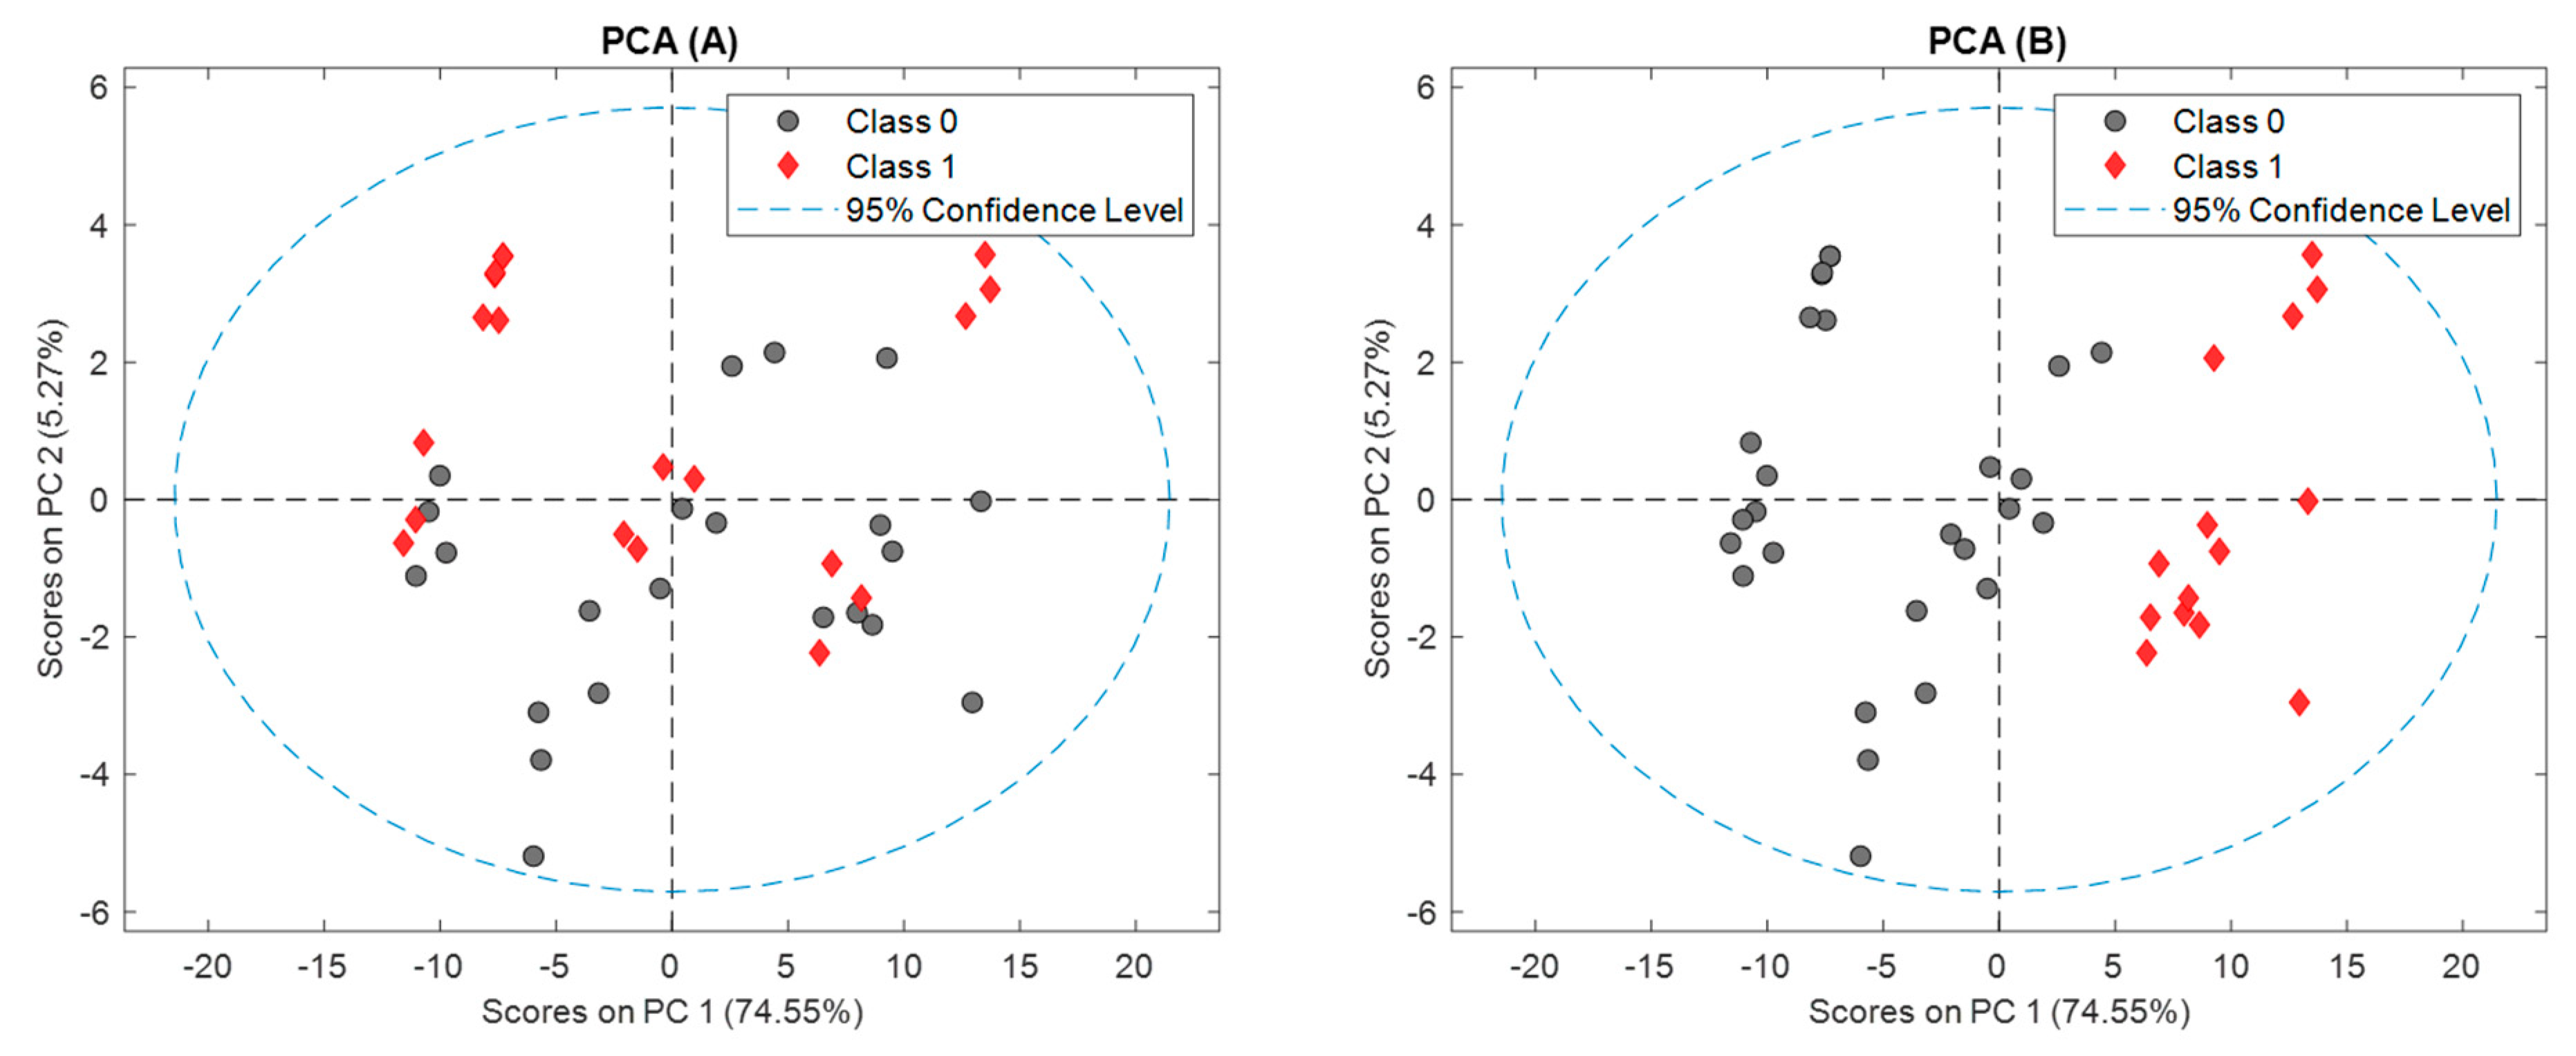
Figure 3.
Results of the PLS-DA models. (A) Aluminium Can vs. Glass Bottle; (B: Fresh samples vs. Aged samples.
Figure 3.
Results of the PLS-DA models. (A) Aluminium Can vs. Glass Bottle; (B: Fresh samples vs. Aged samples.
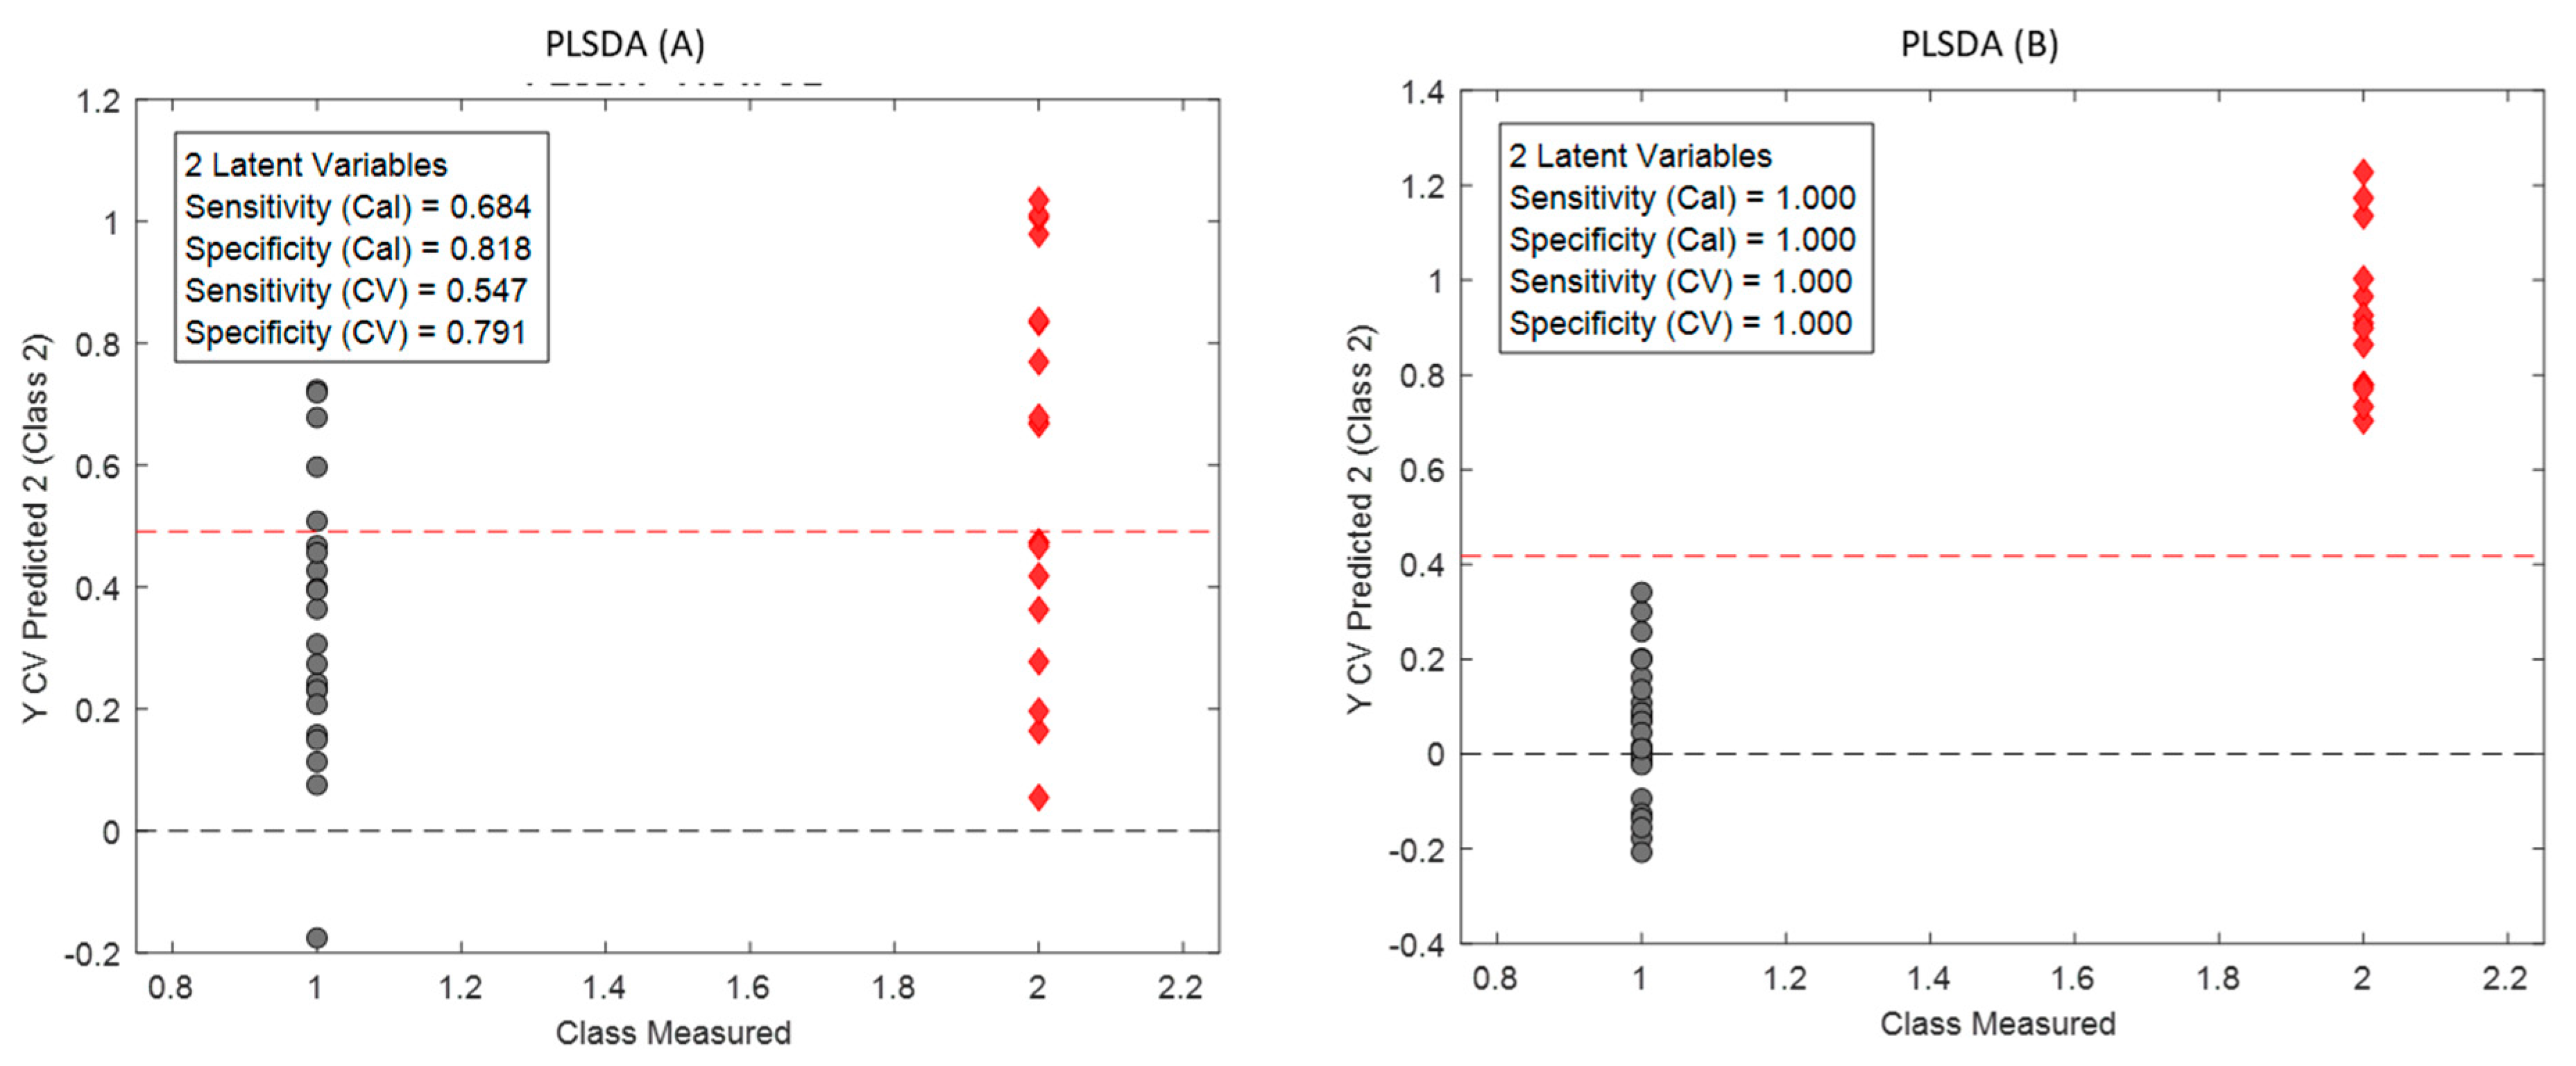
Figure 4.
Plot of predicted vs actual values for validation set and some paremeters of the model. Legend: 1 – Class 1 (1 fresh samples); 2: Class 2 (supermarket samples); and, Class 3 (6 + 11 months-aged).
Figure 4.
Plot of predicted vs actual values for validation set and some paremeters of the model. Legend: 1 – Class 1 (1 fresh samples); 2: Class 2 (supermarket samples); and, Class 3 (6 + 11 months-aged).
Disclaimer/Publisher’s Note: The statements, opinions and data contained in all publications are solely those of the individual author(s) and contributor(s) and not of MDPI and/or the editor(s). MDPI and/or the editor(s) disclaim responsibility for any injury to people or property resulting from any ideas, methods, instructions or products referred to in the content. |
© 2023 by the authors. Licensee MDPI, Basel, Switzerland. This article is an open access article distributed under the terms and conditions of the Creative Commons Attribution (CC BY) license (http://creativecommons.org/licenses/by/4.0/).
Copyright: This open access article is published under a Creative Commons CC BY 4.0 license, which permit the free download, distribution, and reuse, provided that the author and preprint are cited in any reuse.


