Submitted:
15 November 2023
Posted:
17 November 2023
You are already at the latest version
Abstract
Metals are particularly sensitive to some pollutant gases. Many museum showcases and store rooms present atmospheres that can corrode cultural heritage artefacts containing metals. Whilst numerous strategies have been reported to mitigate such situations, avoiding them is preferable. Several approaches to testing materials used in construction, fitting out or dressing are used. The relative merits and drawbacks will be discussed. Several parameters of the most widely used, the accelerated corrosion ‘Oddy’ test have been investigated. The influence of abrasive on subsequent corrosion of lead and copper coupons have been assessed. Quantification methods for tested coupons are reviewed. The influence of test duration and temperature were assessed through comparison with real life, long term experience of materials behaviour. Direct contact tests with the material tested touching the test material has been investigated. Several materials present in artefacts are known to potentially cause corrosion when enclosed with metals in other artefacts. A number of situations have been investigated with pollution and RH and some corrosion rate measurements. Ways to isolate artefacts or mitigate are explored and a decision support model has been developed.
Keywords:
pollution
; metal
; testing
; mitigation
1. Introduction
Metals are particularly sensitive to some pollutant gases. Many museum showcases and store rooms present atmospheres that can corrode cultural heritage artefacts containing metals. Whilst numerous strategies have been reported to mitigate such situations, avoiding them is preferable. Several approaches to testing materials used in construction, fitting out or dressing, are used. Probably the first was the accelerated corrosion test described by Oddy in 1973 [1]. It involves enclosing 2g of test material with silver, copper and lead coupons at 60°C and near 100% relative humidity, RH for twenty eight days. After the aging period, the amount of corrosion on the coupons is assessed visually. Various schemes are used, a common one is suitable for permanent use, suitable for temporary use and unsuitable for use. The test (and others developed) is probably best considered as indicating a risk from pollution. Whether that pollution leads to corrosion in the actual situation, depends on a number of factors. The loading of the material in the enclosure or store room; the temperature and relative humidity, RH and light levels for some materials. The air exchange rate of the showcase or room. The relationship between these factors and the concentration developed, are described by the Weschler and Shields equation [2]. Whether this concentration causes corrosion depends on the metals present, their composition and the RH. The amount of risk tolerated is probably institution dependent and should consider the location’s background corrosion rate. In a museum with extensive HVAc conditioning and chemical filtration the corrosion rate will be low, and that in enclosures should be lower. Whilst less well funded institutions with natural ventilation and no chemical filtration will on the whole, have higher room corrosion rates. A very large range of corrosion rates in heritage institutions has been reported [3]. In the latter situation a strict sifting of materials causing very slight amounts of corrosion in Oddy tests, could be considered excessive, as the artefacts will corrode at a certain rate anyway. Alternatively, perhaps protection by showcases is even more important, but different approaches to assessing an acceptable level of corrosion on the coupons exist.
The test method has been continuously improved [4,5,6]. One of the strengths of the test is it does not require expensive analytical equipment and could, in theory be undertaken by any reasonably equipped conservation facility. The empirical nature of the test is also beneficial; if a material causes corrosion it will be observed, and the identity of the problematic gases does not need to be known. Its main draw-back is the time required for the test (28 days) and its perceived variability in results. Many groups have modified the parameters of the test to suit their situation. For any test this will introduce an enormous amount of variability in response. Indeed, research has indicated the test results are sensitive to small variations in method [7]. With a well defined method, the two parameters that have most significant effects are the metal coupon preparation method and the assessment of the tested metal coupons. Korenberg introduced abrasive cloths into the method in 2017, replacing the previous glass bristle brush abrasion [6]. This has undoubted advantages, it appears to generate less lead dust and no sharp glass bristle fragments. The two methods were investigated by asking a group of experienced practitioners to prepare lead and copper coupons with both methods and then testing the surface roughness and relative corrosivity.
There have been attempts to improve the standardisation of the test, by using set equipment and pre-prepared metals [8]. Unfortunately, this is very likely to increase the cost per test, limiting its accessibility and reducing the numbers of materials tested. It may be that two types of tests are required, a simple, inexpensive version that can be widely used and a more controlled version, possibly using analytical instrumentation that can be used in larger institutions.
Several methods have been used to improve quantification of the corroded coupons. Reference photographs and descriptions were developed [9] and have been extended and refined [10]. The several analytical methods developed are summarised in Table 1. Some techniques have been used for coupons used to assess atmospheres and not from Oddy tests, but it is assumed the challenges are the same. Many analytical techniques suffer from a mismatch between the analytical area and the rectangular coupons used in the test. As the corrosion can be uneven, ideally the whole coupon surface needs to be analysed.
All the techniques listed have proved to be able to quantify corrosion, at least on some coupon types. The corrosion layers on silver are often very thin and require sensitive techniques to detect them. Clearly, such techniques will only be available in well-equipped laboratories. Chemical stripping is probably possible in many conservation facilities, although the solutions used are often toxic. Electrochemical stripping is more accessible than many of the other techniques, and frequently used in metal conservation. Cano et al have suggested the use of coulometric stripping as per ISO 11844 [29]. However, potentiodynamic stripping requires less capable (hence, less expensive and more accessible potentiostats) and does not necessarily require nitrogen purging, which most conservation facilities do not have access to. Lead is an issue with either technique (not covered by ISO 11844) with some corrosion products having general solubility in the stripping solutions and multiple peaks often being generated even from simple corrosion products. Experiments with silver and copper coupons and comparison with visual assessment have been caried out.
Several researchers have investigated analysing the gases emitted from a material and then determining if it will cause corrosion. Many showcase and store environments contain hundreds of gases. So far, 33 gases have been reported to cause problems with different heritage materials and this number has increased rapidly over the past two decades [30]. It is almost certain there are other gases, as yet unidentified that will be problematic and to work fully, this approach requires a perfect knowledge of what to avoid. An unfortunate example is the Piperodinol gases, emitted from two adhesives in showcases. It appears they were detected in emission tests, but as unreported as damaging, the materials were passed and caused significant issues in hundreds of showcases (31, 32). One of the two materials had already failed Oddy tests with copper. Some researchers have suggested using emission tests to screen materials, with those not emitting known problem chemicals then undergoing the longer Oddy tests.
Most of the emission tests, [33,34,35,36,37,38,39,40] measure room temperature and middle RH emissions. This could be considered a risk, as many of the species identified as problematic are deterioration products of the materials tested and may not be present in the freshly produced material.
Additionally, increasing sensitivity of detection methods to speed up the testing is a common theme [22]. Although MS is extremely sensitive, most configurations cannot detect formic acid and several researchers still use ion chromatography for acetic acid as well [34,41]. Even for very sensitive techniques, there is strong evidence that some materials do not emit the damaging gases until late on, even in accelerated aging [42]. If a gas isn’t present, it cannot be detected, or cause corrosion that can be detected, no matter how sensitive the technique. More sensitive analytical techniques, such as, SEM-EDX have been used on tests run at lower temperatures and RHs [22]. The test runs at 30°C and 60% RH for 14 days, but some have been reported at 22°C. Many situations in historic interiors have RH in excess of 60% and this will affect emission from materials [42]. One group of materials (Vinyls) surprisingly passed these tests, Curran et al reported acetic acid emission from these materials at levels that would be expected to corrode lead [43] and over twenty vinyls had been rated as temporary or worse with Oddy tests. This was investigated with an Oddy test for one material and a series of lower temperature tests, with a material supplied by Liverpool Museums. This had been rated as non corrosive towards lead in a SMART test. The material was enclosed with a cleaned lead coupon at 30 and 20°C and observed, and corrosion analysed when formed. The emission of acetic acid from a further series of vinyl samples passing SMART tests with lead was measured.
A series of investigations into corrosion on display or in storage have examined whether Oddy tested materials are present in the enclosure, its air exchange rate, analysis of some common gases, acetic and formic acid, hydrogen sulfide and ammonia. The corrosion products were also analysed along with the timeframe over which corrosion was observed. The, sometimes very long term, exposures were useful to investigate the success or otherwise of the Oddy tests used.
Even with comprehensive testing of showcase and display materials, certain object materials can have negative effects on other objects in some enclosures. This appears only intermittently in the literature and collections are put at risk from their custodians being unaware of the issue in all instances. A long list of reactions have been observed, and are collated.
Similar investigations into the situations with damage observed were undertaken. Whilst the responses of different metals to pollution are quite well documented, the likely amounts of pollution emitted from objects in different situations are largely unresearched.
A decision support model was developed in the MEMORI project [44]. This covers both assessment and mitigation options and a series of examples in these situations have been explored.
A very large number of interventions are possible. The in situ effectiveness depends on many factors. It is critical that after any mitigation, measurements are repeated to ensure it has had sufficient effect. A decision support model has been developed as a downloadable Powerpoint to guide a user through the options [44,45]. There is a series of spreadsheets to allow calculations to compare the likely effectiveness of options. An overall ‘mitigation decision support model ‘spreadsheet allows comparison between options from answers to twenty one simple questions, and depending on outcomes, running some of the afore-mentioned spreadsheets with the user’s environmental and enclosure data. The outcomes are ranked in terms of approximate likelihood of success, rough costs and indicative carbon footprints. More accurate carbon footprints can be developed from modified versions of the spreadsheets in the tools [46].
The measures are presented as a hierarchy, developed from Tetreault’s thoughts [47]. The higher level strategies are more robust and less likely to fail. The measures are shown in Table 2.
Removal is often impossible, especially if both materials occur in a single object. But within a showcase there is sometimes the possibility to select other non-reactive suitable objects, depending on the interpretation message and collection. Similarly blocking emissions is only infrequently possible, generally within enclosures such as glazed frames and Daguerreotype packets. Dilution through increasing air exchange rate can work in some, but not all situations. A simple tool to aid selecting and sizing the required air exchange rate has been developed [44]. The tool is based on the well validated Weschler and Shields equation [2]. The equation requires the material loading, its emission rate and deposition velocity, the showcase volume and air exchange rate. The volume is straightforward to determine, air exchange rates can be measured and the loading can usually be estimated. Emission rate data is limited, but growing and a selection of deposition velocities are tabulated in the tool.
Incorporation of sorbents passively can work with copper, iron and lead but is unlikely to be successful with silver. The use of pumps can overcome this in some situations with careful design of airflows. Lowering temperature can control the off-gassing from particularly problematic materials such as some plastics for storage situations.
2. Materials and Methods
2.1. Coupon Cleaning Tests
Five coupons of lead and copper were cleaned by experienced practioners from four institutions, with glass bristle brushes and micromesh. Three institutions had one practitioner each, one two. The coupons were transported in a Stewart Gastronorm box with dried silica gel (Gastronrom is a European standard for box sizes, btu Stewart have used the name for a ranger of polypropylene boxes).
Coupons from three institutions were analysed with a TraceiT profilometer. Three areas of each coupon were analysed by tracing 1500 lines each 5mm in length.
The coupons weighed (balance) and suspended from 0.05mm nylon monofilament around the rim of Bernadin Mason 250ml jars. The copper coupons were exposed to 50,000µg/m3 of acetic acid generated above a water solution at 30°C. The lead coupons were exposed to a 1000 µg/m3 of acetic acid. The tests were checked daily. When sufficient corrosion had developed, the coupons were removed and stored above dried silica gel for seven days. The coupons were weighed again and the corrosion products determined with external reflection and diamond ATR on a Bruker Alpha FTIR spectrometer.
2.2. Oddy Tests
Oddy tests were carried out to the methods described in 1995 and 2003 [5], with micromesh 1200 fabric used to clean coupons after 2017. Direct contact tests were carried out by modifying the most recent method. Smaller coupons (20 by 10mm) were cleaned as usual. They were wrapped in the fabric being tested or placed in direct contact with the powder coated metal pieces. Close contact was assured by placing in a polyethylene terephthalate fitting. The fitting is required for test-tube based tests, but can probably be omitted for flask or conical flask based tests. Fabric and powder coated samples were assessed as these are most likely to be in direct contact with artefacts.
For materials from showcases investigated for corrosion, where 2g was not available a miniaturised test was developed. This enclosed a small (5 by 5mm) sample of the metal observed to corrode, cleaned as before, in a 5ml glass vial (Fisherbrand 13mm crimp neck vial) with crimped aluminium lid, with Duran tube with 0.2ml water, and 0.2g of the text material. The Duran tube was placed between the sample and the metal coupon. The other test details were identical.
The sensitivity of the Oddy test with acetic and formic acid was determined by introducing 0.5ml of solution into a test with lead and running as normal. Solutions of 0.05, 0.1, 0.2, 0.4, 0.6, 0.8, 1 µg/L were used.
2.3. Coupon Assessment with Potentiodynamic Stripping
Silver and copper coupons from previous tests were analysed with a Palmsens 3 potentiostat, siler/silver chloride reference electrode and platinum counter electrode. Silver was placed in 1M sodium nitrate electrolyte, attached with a crocodile clip above the solution using the portion of the coupon that was in the stopper. Copper similarly in 1M sodium carbonate,1M sodium hydrogen carbonate solution. The potential was swept from 0 to -1.4V (vs SHE).
2.4. Lower Temperature Corrosion Tests
The Vinyl supplied by Liverpool Museums was cut into 2g pieces, equilibrated to 50% RH for 3 weeks and placed in Oddy type tests with lead (same containers, but at lower temperature and no added water). Tests were run at 30°C or 20°C in a Memmert HPP260eco environmental chamber.
2.5. Emission Tests
Tests were undertaken in a 250L stainless steel chamber controlled to 23 + 1°C and 50 + 2% RH in the Memmert environmental chamber. They were performed to BS EN ISO 16000 part 9. The air flow rate was set to 10ltrs per hour using a Cassela pump. This is a low value and approximates to an air exchange rate of 1 per day. The vinyl samples (40 by 60cm) were preconditioned at 23°C and 50% RH for 72 hrs before the tests. Air was sampled through 0.1M sodium hydroxide (120l at 2l/min, same type of pump) after 1, 4 and 24 and 72h. The sodium hydroxide solution was analysed with a Thermo ICS1100 ion chromatograph with AS12A column and 18mM sodium hydrogen carbonate and sodium carbonate solution. The results were used with the MEMORI AER tool to calculate the AER and surface loading combinations that would result in an acetic acid concentration exceeding 400µg/m3 which poses a risk to lead at 50% RH.
2.6. Corrosion Analyses
Instances of observed corrosion were analysed with attenuated total reflection Fourier transform Infra-red spectroscopy, ATR FTIR (Nicolet Avatar 360 with Inspect IR microscope with silicon ATR, or Bruker Alpha with diamond ATR), XRF (Bruker Tracer III/IV), x-ray diffraction, XRD (Phillips 1830/1840) and scanning electron microscopy with energy dispersive x-ray analyser, SEM-EDX (Joel 840).
Previous Oddy test results were consulted and any un-recognised materials were tested if samples could be taken. The Oddy test requires 2g of material which can be problematic from components of showcases and a miniaturised test using 0.2g was used.
Showcase or store room air exchange rates were measured using carbon dioxide tracer gas decay [48]. The air exchange rate of Daguerreotypes was measured using oxygen ingress. The Daguerreotype was flushed with nitrogen for eight hours and then placed in lab air. The oxygen concentration inside the Daguerreotype was continuously measured with a Presens Fibrox 4 oxygen system. The very small thickness of the SP-PSt3-NAU-D7-YOP spot allowed analysis inside the shallow Daguerreotype.
Acetic and formic acids and ammonia were analysed with Palmes diffusion tubes, exposed for four weeks. The acid diffusion tubes were based on potassium hydroxide sorbent and analysis with a Dionex 600 ion chromatograph with AS12A column and 18mM sodium carbonate/sodium bicarbonate eluent [49]. The tubes were exposed in quadruplicate. The ammonia tubes used sulfuric acid eluent. A Dionex 600 ion chromatograph was used with CS12 column and 18mM methane sulfonic acid eluent. In most instances hydrogen sulfide was analysed using Gradko Palmes diffusion tubes. One set of measurements were undertaken on archaeological ceramics and iron in Tedlar bags at 25 and 35°C, extracting a gas sample and analysing with Perkin Elmer 850 gas chromatograph with 1.8m 0.3mm diameter Teflon column with Carbopac B/1.5% XE60/1% H3PO4 and nitrogen carrier gas. This analysis quantified hydrogen sulfide (detection limit 0.01ng/m3), carbonyl sulfide (detection limit 0.05ng/m3) and carbon disulfide (detection limit 0.02ng/m3)
Mitigation of some of the instances investigated with increasing air exchange rate was investigated with the MEMORI AER-ventilation modelling spreadsheet [44,45]. The approaches towards pollution mitigation were investigated with the Mitigation decision support model spreadsheet for a subset of data with acetic or formic acid as the cause of corrosion and metals included in the MEMORI decision support model [44]. For one instance a fuller carbon footprint was developed, considering the embedded carbon and use over the showcases lifetime (set at 10 years) using the method described in [46].
3. Results and Discussion
3.1. Cleaning Tests
The arithmetic mean of surface roughness, Ra, were calculated for each area analysed. The results for copper are shown in Figure 1 and Figure 2. Those for lead in Figure 3 and Figure 4.
The roughness in the lateral direction was generally less than in the longitudinal direction, which is the last direction the coupons were cleaned in. HCP had much lower roughness and less variation with both techniques. MOL is higher and NHM higher still with GBB, lower with micromesh. The micromesh cleaned coupons showed a greater surface depth of scratches than those cleaned with glass bristle brushes for all three preparators.
Figure 3.
Arithmetic means for surface roughness of lead in directions down the coupon.
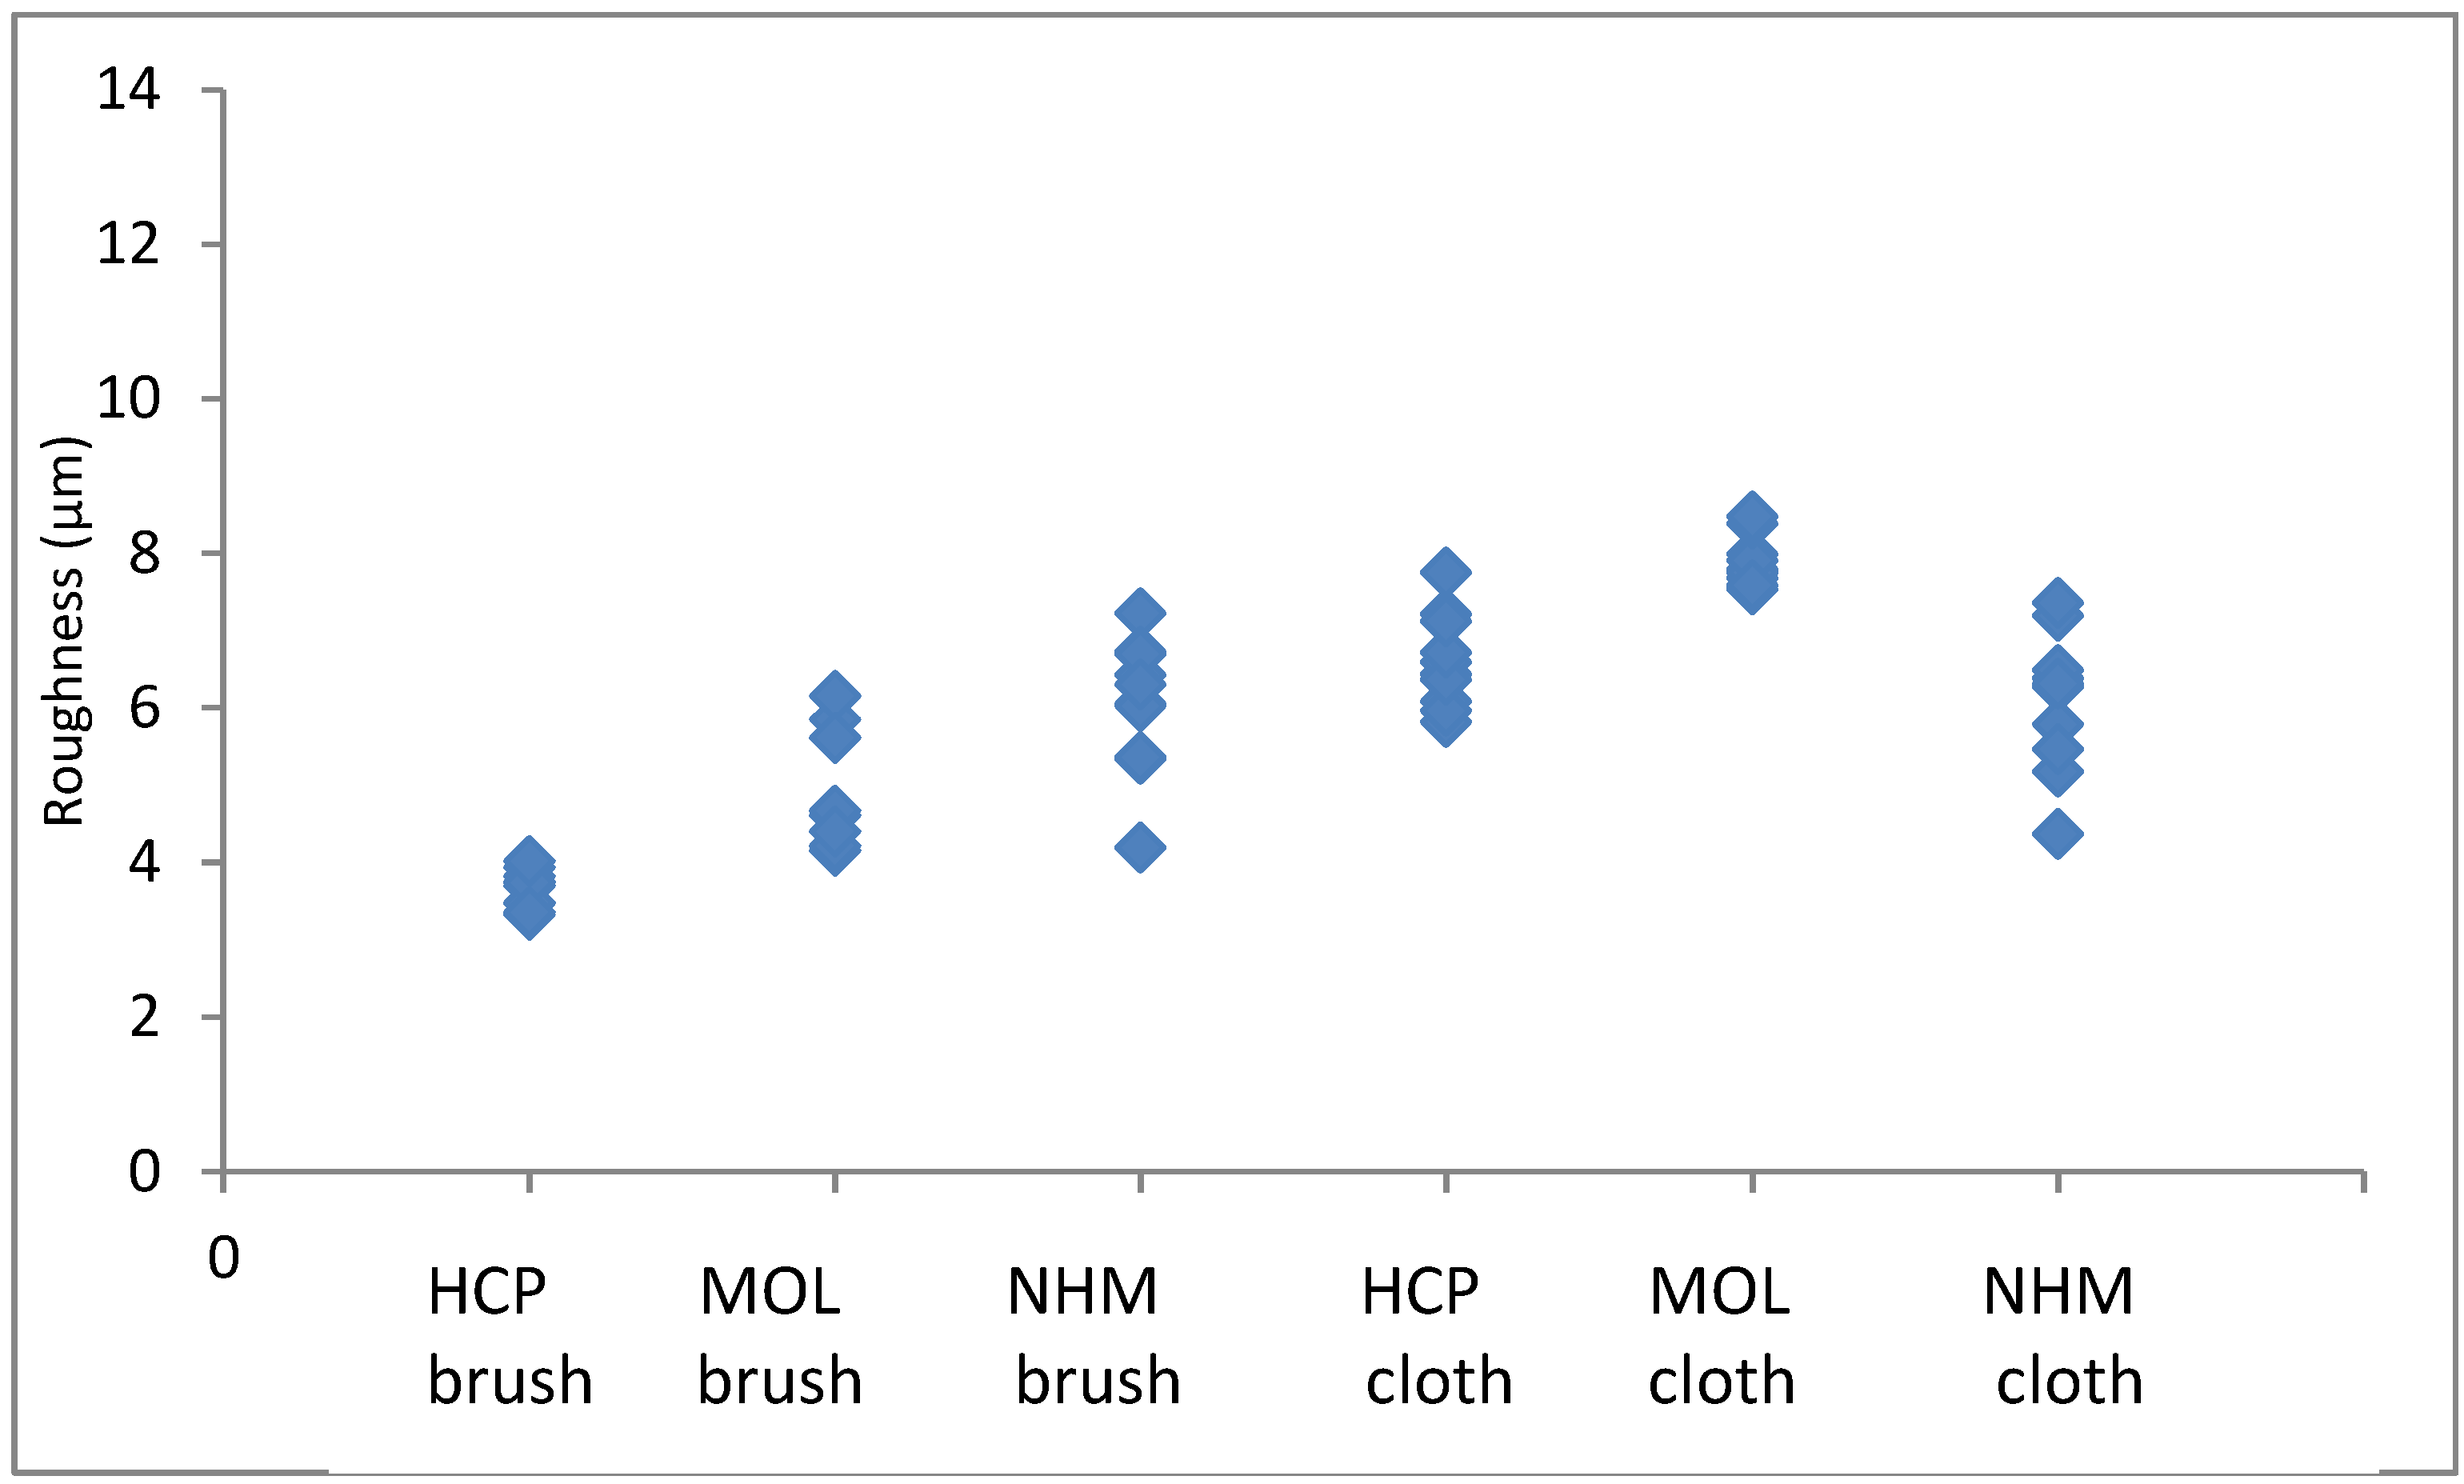
Figure 4.
Arithmetic means for surface roughness of lead in directions across the coupon.
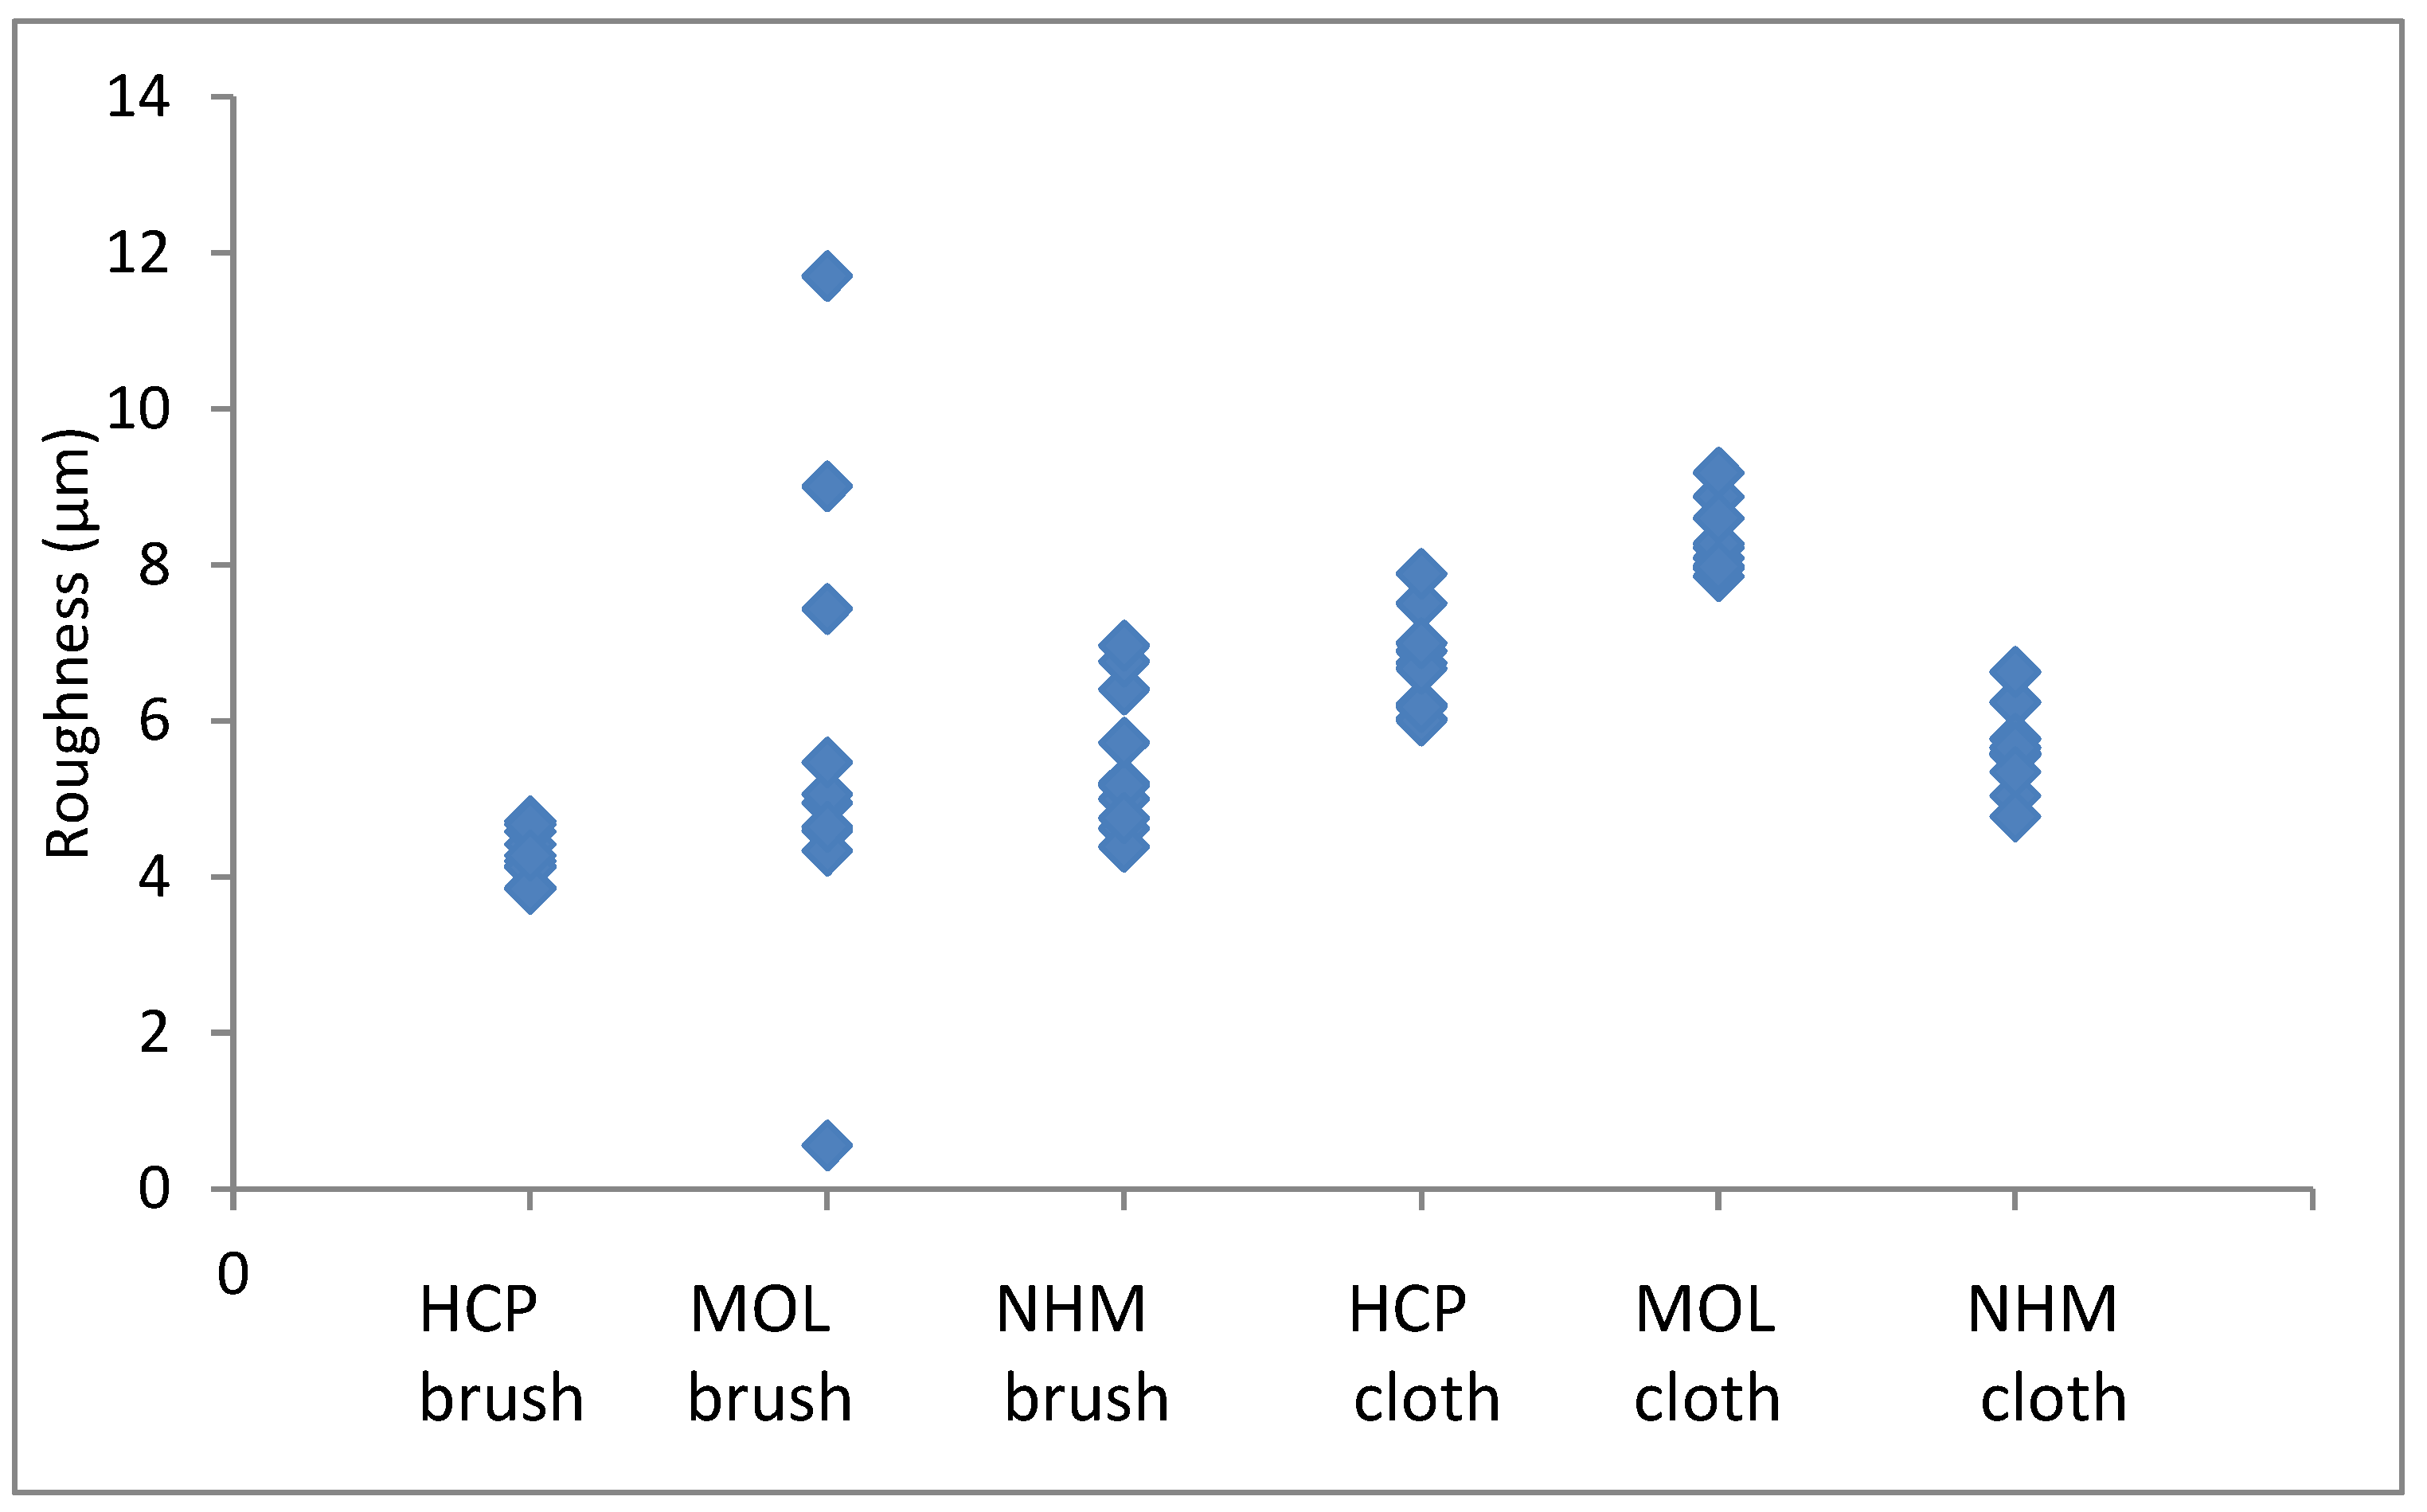
Again, the roughness in the lateral direction was generally less than in the longitudinal direction. The micromesh cleaned coupons showed a greater surface depth of scratches than those cleaned with glass bristle brushes for both NHCP and MOL. They seemed comparable for NHM. HCP had much tighter distribution for GBB prepared coupons, but this widened when microfibre cloth was used. The variation was quite similar for both methods of preparation.
The mass gains recorded with the lead and copper coupons cleaned with glass bristle brushes and abrasive cloth are shown in Figure 5 and Figure 6.
The coupons showed between 31 and 77% distribution in corrosion for a single preparator (max value-min value/max value), with EH and HCP showing lower values and NHM the highest. The micromesh cleaned coupons showed a greater degree of corrosion, than those cleaned with glass bristle brushes, except for NHM. The variation was mainly greater for the micromesh, certainly for HCP, MOL, EH1 and EH2. Cuprite and copper formate dihydrate were identified on all coupons.
Figure 6.
Corrosion formed on copper coupons exposed to 10000µg/m3 of acetic acid, cleaned with glass bristle brush and abrasive cloth at different locations.
Figure 6.
Corrosion formed on copper coupons exposed to 10000µg/m3 of acetic acid, cleaned with glass bristle brush and abrasive cloth at different locations.
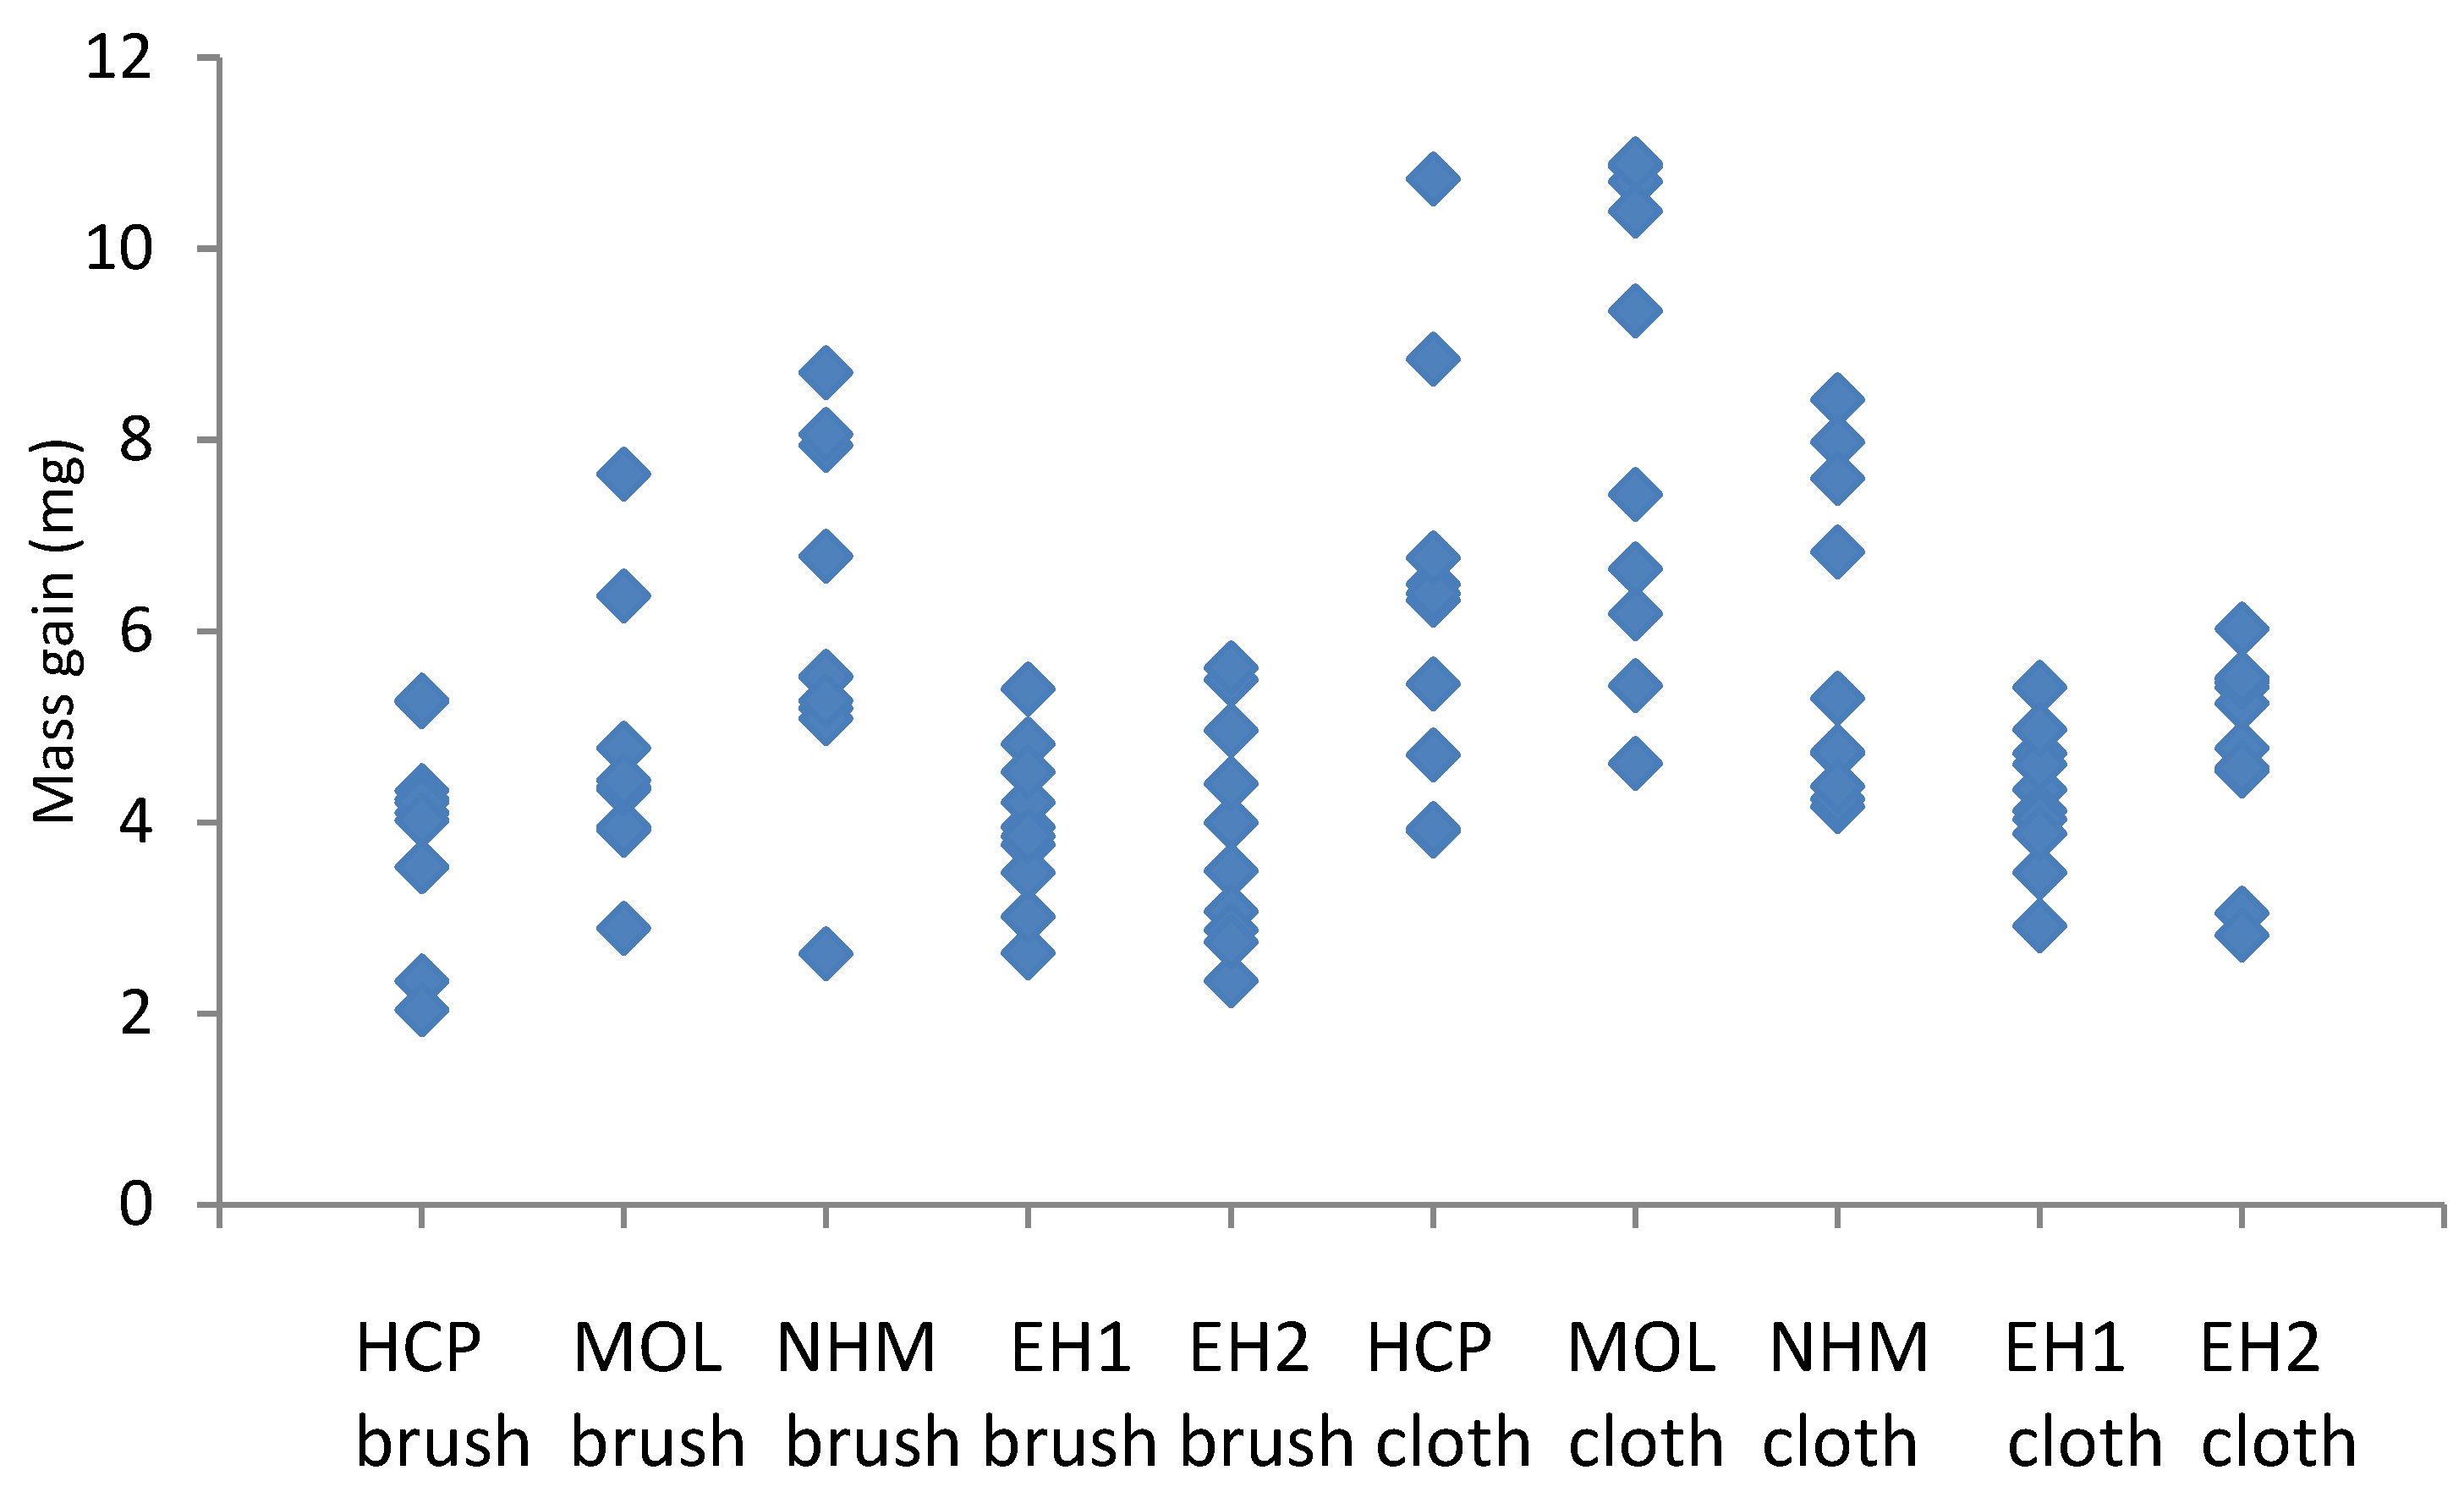
The coupons showed between 31 and 45% distribution in corrosion for a single preparator (max value-min value/max value). Again, the micromesh coupons generally showed a greater degree of corrosion than those cleaned with GBB, especially at HRP. At NHM they actually showed a lower degree of corrosion. The distributions for the lower corroded coupons HRP, EH1 and EH2 where much tighter (lower range) for GBB than for micromesh, with ranges 1.51, 2.15 and 1.76, cf . 2.89, 2.36 and 2.37. MOL and NHM appeared to have similar distributions for both techniques. Lead formate was identified on all coupons.
There was no fully consistent trend in the results considering all participants. It appears the preparation phase varies depending on the person undertaking the test. However, some preparators had much more consistent results so it is likely training could probably reduce the variation.
3.2. Oddy Tests
The results of the direct contact tests are shown in Table 3.
It is clear there are number of materials that pose a risk in direct contact with metal objects, that will not be identified with conventional accelerated corrosion tests. It appears there are non-volatile compounds that can accelerate corrosion in direct contact.
The acetic acid solution causes corrosion visible to the naked eye at 0.8µg/L, but not 1.0 µg/L. Formic acid at 0.4 µg/L, but not 0.6 µg/L. The acetic acid results correlate well with those reported by Stephens [50]. They are slightly lower, but that work only had divisions of 0.1 and 1µL/L.
3.3. Coupon Assessment with Potentiodynamic Stripping
The results for potentiodynamic stripping of silver coupons are shown in Figure 7, those of copper in Figure 8.
Generally the amount of corrosion increased between the visual assessment categories, however both metals had significant overlap regions across the permanent/temporary border. For silver this was also the case across the temporary/unsuitable border. Whilst for copper there was a clear boundary. There is a disagreement between the amount of corrosion measured and the visual assessment. In these instances, this was due to localised corrosion, a few spots or a band of corrosion at or near the edge of coupons. The small amount of corrosion present gave a low result when averaged over the whole coupon area. Cano and Diaz discussed the mismatch that occurs between visual observation and the amount of corrosion in their experiments with four materials [21]. It should be noted that most problematic instances of corrosion are initially identified by visual assessment and perhaps this should be weighted more strongly. A combined method is likely to be required with some visual assessment of how evenly distributed or localised corrosion is, followed by analysis. Different ranges would be needed for localised and evenly distributed corrosion on coupons.
3.4. Lower Temperature Tests
The vinyl sample supplied by Liverpool Museums failed duplicate Oddy tests with lead (and passed with silver and copper). White corrosion was visible through the glass vessel after 34 days at 30°C and 151 days at 20°C. The corrosion was identified as basic lead carbonate with XRD and FTIR. No other compounds were identified, but detection limits in mixtures are often estimated at around 20% with both techniques. This is very dependant on the compounds present.
3.5. Emission Tests
The emission results from the other vinyl samples are listed in Table 4.
All samples tested emitted acetic acid, despite passing the SMART tests with lead. The sample provided by Liverpool Museums had the highest concentration and this was over the low risk (observed corrosion in under two years) threshold [44]. Considering Tetreault’s reported lead corrosion rates, the behaviour is consistent, with visible corrosion appearing, but not for some period [23]. The ventilation rate calculations show all the tested vinyls would generate acetic acid concentrations that would pose a risk to lead under some circumstances. Many recent showcases have been built to an AER specification of 0.10 per day. The vinyls are used to hold graphics in showcases. The tests in Table 4 were for a temporary exhibition, lasting 6 months and two were actually used. Lead coupons added to the showcase to monitor that atmosphere showed no corrosion after this period at 50% RH. The test appears suitable for short term exhibitions, but risks corrosion for lead with longer term display or storage.
3.6. Observed Examples of Corrosion In Situ
Over 730 instances of corrosion were investigated. In just over 600 instances a material was identified as the likely source of the pollution. In stores, the very large number of objects and materials present, often made attribution impossible and these accounted for most of the 130 un-attributed instances. No instances of corrosion were attributed to a material that had passed the Oddy test for that particular metal. There where a number of instances were materials had failed Oddy tests and had still been used. There were also instances were a material passed with some metals and the documentation stated it could be used in that situation, provided certain metals were not introduced in future. It was exactly these later introduced metals that corroded. It is clear that robust systems need to be in place to ensure such information is retained and acted on. Organisations tend to take two approaches, a material must pass with everything or only the metals present on set up. The latter is often driven by time pressures, particularly for exhibitions. Figure 9 shows the number of instances investigated (within a single showcase) and Figure 10 the number of objects observed to be corroded in those instances.
The instances of object emissions causing corrosion on other objects are shown in Table 5.
The AER, pollutant concentrations and corrosion products are included. The number of objects observed to be affected is also tabulated for each location. Numbers in brackets are the author’s estimate of other reported instances. This is very difficult as much data is in grey literature or unrecorded, such as presentations. Also the number of objects effected is only very rarely reported in literature.
Table 6 lists those instances when it is thought the gases originated from the object with the metal corroding.
The sulfur gas analyses in the Tedlar bags enclosing the iron and ceramic object from the top row of Table 5 are shown in Table 7
There is some increased concentration of both hydrogen sulfide and carbonyl sulfide at 25°C and carbon disulfide from the ceramic. There is a very strong increase at 35°C. The copper objects were on display with no observed black spot corrosion for over 20 years. Extensive corrosion was observed after an exceptionally hot summer when the case temperature reached 35°C. The results of this experiment, correspond with those observations.
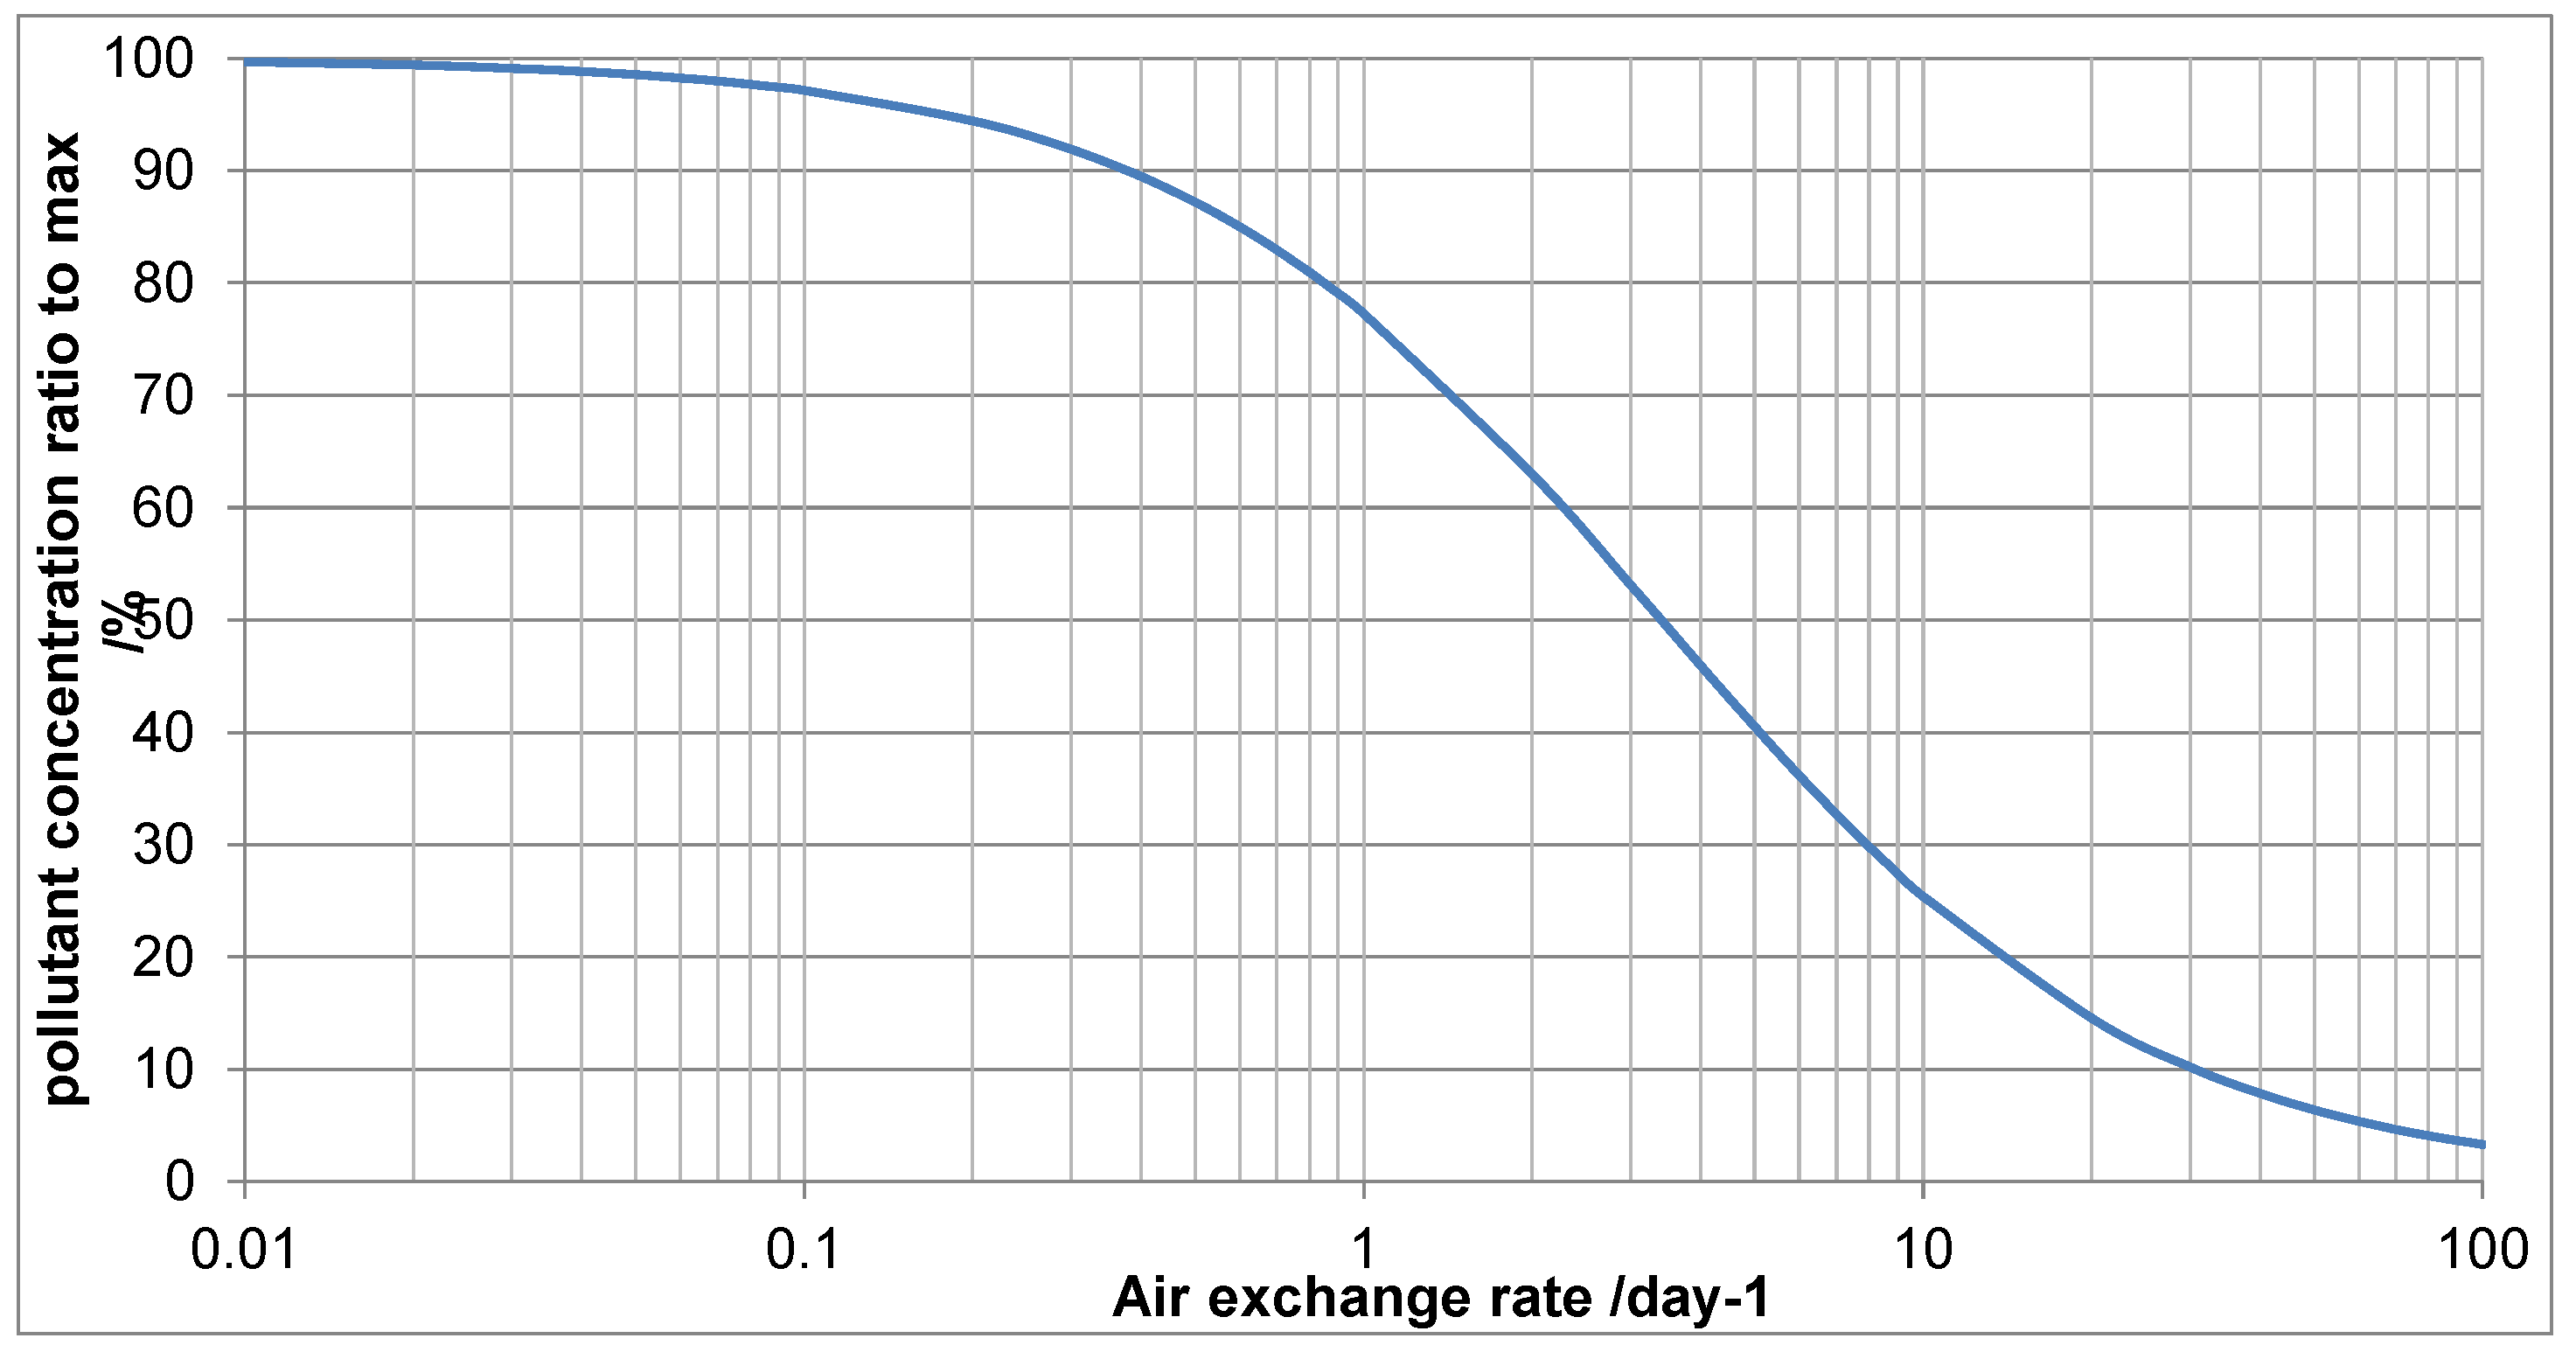
For the Japanese lacquer boxes in top showcase shown ventilation was considered as a mitigation. The air exchange rate was 0.87/day, the acetic acid concentration measured at 2564µg/m3. The showcase volume was 1.24m3 and the emissive surface of boxes estimated at 0.87m2. Figure 11 shows the output from the ventilation tool, using a surface deposition velocity of 0.15.
As can be seen the acetic acid and AER measurements fix a point on the graph. For the showcase parameters, 0.87/day is slightly over 74% of the maximum concentration (when AER =0, left hand side of Figure 8). This is equivalent to 2564µg/m3. Increasing ventilation to an AER of 4.00 would be expected to reduce the acetic acid concentration to 1334. Consulting the MEMORI table for lead at 50% RH, this is well above the 400 µg/m3 threshold for low risk of corrosion. Increasing further to above 19.40, drops this to below that 400 figure. This figure is extremely unlikely using passive ventilation and a small pump was fitted with air being drawn through a dust filter. The pump flow rate was set at 0.5L/min, to exceed the desired AER. Diffusion tube measurements showed the acetic acid concentration had reduced to 321 µg/m3. Small pumps are quite reliable and some for computers are guaranteed for several thousand hours. If the mitigation relies on such units a procedure is needed to identify when the pump or power does fail. In this instance the exhibition was only scheduled for nine months and the risk of failure thought to be vanishingly small.
For the lead corroded by a painted sign, the showcase volume was 0.82m3, the sign area 0.31 m2 and the AER 0.08/day, this generated a formic acid concentration of formic acid of 85 µg/m3. This is in the medium risk category on the MEMORI lead 50% chart. Figure 8 shows the output from the calculation for those showcase parameters.
Figure 12.
Effect of air exchange rate on formic acid concentration in 0.08 AER showcase with painted sign.
Figure 12.
Effect of air exchange rate on formic acid concentration in 0.08 AER showcase with painted sign.
Increasing the AER to 2.6/day would be expected to reduce the formic acid concentration to below 50 µg/m3, the low risk concentration. This could be achieved with passive ventilation.
The headline mitigation decision support tool results are shown in Table 8. As these are from objects as sources of pollution, in these instances inside showcases, no data for avoid (it is assumed the objects need to be in the showcase together for curatorial/presentation reasons) or block are included.
The tool generated an indication of which of the different approaches is most likely to succeed.
The support tool generates significant extra data about costs and indications about sustainability. Carbon footprints were extended beyond the indications in the tool. Results for the third row in Table 6 are shown.

Table 9.
In depth results from mitigation decision support tool and additional carbon footprin information from method [thickett].
Table 9.
In depth results from mitigation decision support tool and additional carbon footprin information from method [thickett].
| Action | possible | Success | Initial cost | Ongoing cost | Carbon footprint | Carbon footprint (kg CO2 eq) |
|---|---|---|---|---|---|---|
| Reduce RH passive (silica gel) | YES | 100 | Low-med | v.low | Low-med | 48 |
| Reduce RH active (Munters MG50 dehumidifier) | YES | 100 | Med | Low | Med | 113 |
| Reduce pollution avoid | NO | N/A | ||||
| Reduce pollution block |
NO | N/A | ||||
| Reduce pollution dilute passive | NO | N/A | ||||
| Reduce pollution dilute active | YES | 75 | v.low-low | Low | Med | 42 |
| Reduce pollution sorb | YES | 20 | Low-med | Low | 12 | |
| Reduce pollution filter | YES | 100 | Low-high | Low | Med | 106 |
The ventilation tool indicated an increased AER of 14.5 would be needed to reduce the acetic acid concentration to below 400µg/m3 at 50%RH. This was not considered feasible with passive ventilation. Calculations with silica gel indicated 8kg would keep the RH below 30% for 12 months, the 1039 µg/m3 of acetic acid is low risk at this RH. Similarly a Munters MG50 dehumidifer was shown with the dehumidifier tool to have sufficient capacity to keep the showcase below 30% in that room environment using 34kWhs of electricity per year. The dehumidifier will decrease the acetic acid concentration, but since it runs intermittently, the reduction is difficult to calculate. A Dynamax 5 pump has a sufficient flow rate to generate the required AER. The showcase is a permanent installation, the likely success was rated at 7%, due to the difficulty in recognising a pump failure. The estimated electricity was 32 kWhs per year. The case only had limited space for activated charcoal cloth, so the success likelihood was rated at only 20%. A Dynamax 5 filter pump was assessed at 100% likely success, due to the incorporated warning light for pump failure or filter exhaustion. The pump uses 42 kWhs per year. The carbon footprint is calculated from the green house gas equivalent of the electricity supply in the UK, the embedded carbon in the unit and the embedded carbon of any filters multiplied by the observed replacement rate [46].
4. Conclusion
The variability in preparation of lead and copper coupons has been assessed with both profilometry and controlled corrosion experiments. Some preparators show much lower variability, indicating that training could probably reduce this to a lower level.
The detection limits of formic acid and acetic acid were found to equate to very low solution concentrations of these species, indicating the very high sensitivity of the Oddy tests with lead to these common pollutants.
Initial experiments with potentiodynamic stripping have indicated it has potential for quantifying silver and copper Oddy coupons. Further work is required to develop suitable ranges and two sets at least will be required to accommodate localised corrosion phenomena.
One vinyl material tested caused corrosion in under 6 months at room temperature and the further five vinyls, assessed with emission testing, did emit acetic acid and this would cause corrosion in some instances. This emphasizes the need for some form of acceleration in testing for long term display and storage.
The investigated instances of corrosion on display provided very strong evidence of the positive effect of Oddy testing. A relatively small number of instances were attributed to objects and the situations described in terms of corrosion type, gas concentrations and air exchange rates.
The online ventilation tool developed has been shown to predict when this approach to lowering concentration will be effective and allow an AER target for assessing the approach. The online decision support model has ranked different approaches in terms of likely effectiveness, cost and rough carbon footprint. Further, more directed carbon footprint calculations were also carried out.
Supplementary Materials
The following supporting information can be downloaded at: www.mdpi.com/xxx/s1, Questions for mitigation decision support model
Author Contributions
Conceptualization, DT; methodology, DT, TB; formal analysis, DT,TB; writing—original draft preparation, DT; writing—review and editing, TB, DT. All authors have read and agreed to the published version of the manuscript.
Funding
none
Data Availability Statement
Data is available from the corresponding author.
Acknowledgments
The authors acknowledge the Capability for Collections Grant awarded from the World Class Laboratory funds by AHRC which acquired the environmental chambers and fume cupboards used for this work. Josep Grau-Brove allowed access to profilometry and Naomi Luxford undertook the analysis at UCL.
Conflicts of Interest
The authors declare no conflict of interest.
References
- Oddy, W.A. An unsuspected danger in display. Mus. J. 1973, 73, 27–28. [Google Scholar]
- Weschler, C.J.; Shields, H.C. A detailed study of the effects of ventilation, filtration and outdoor air on the composition of indoor air at a telephone office building. in: Indoor Airʹ87, Proceedings of the 4th International Conference on Indoor Air Quality and Climate, Berlin (West), 17-21 August 1987, Vol 3, Institute for Water, Soil and Air Hygiene, 1987, 142‐146.
- Sacchi, E.; Muller, C. Air quality monitoring at historic sites. ASHRAE J. 2005.
- Green, L.R.; Thickett, D. Testing materials for use in the storage and display of antiquities—a revised methodology. Stud. Conserv. 1995, 40. [Google Scholar]
- Robinet, L.; Thickett, D. A new methodology for accelerated corrosion testing. Stud. Conserv. 2003, 48, 263–26. [Google Scholar] [CrossRef]
- Korenberg, C.; Keable, M.; Phippard, J.; Doyle, A. Refinements Introduced in the Oddy Test Methodology. Stud. Conserv. 2018, 63. [Google Scholar] [CrossRef]
- Green, L.R.; Thickett, D. Interlaboratory comparison of the Oddy test, Conservation Science in the U.K., in: Preprints of the Meeting held in Glasgow, May 1993. James & James, London, pp. 111‐116.
- Heine, H.; Jeberien, A. Oddy Test Reloaded: Standardized Test Equipment and Evaluation Methods for Accelerated Corrosion Testing. Stud. Conserv. 2018, 63. [Google Scholar] [CrossRef]
- Thickett, D.; Lee, L.R. Selection of Materials for the Storage or Display of Museum Objects, The British Museum, 2004 Occasional paper No. 111.
- Oddy WIKI available online:. Available online: www.conservation-wiki.com/Oddy_Test_protocols~metropolitan (accessed on 15 nov 2023).
- Shen, J.; Shen, Y.; Xu, F.; Zhou, X.; Wu, L. Evaluating the suitability of museum storage or display materials for the conservation of metal objects: a study on the conformance between the deposited metal film method and the Oddy test. Environ. Sci. Pollut. Res. 2018, 25, 35109–35129. [Google Scholar] [CrossRef] [PubMed]
- Berger, O.; Yersin, P.B.; Yersin, J.M.B.; Hartmann, C.; Hildbrand, E.; Hubert, V.; Hunger, K.; Ramstein, M.; Wörle, M. Applications of micro-Raman spectroscopy in cultural heritage - examples from the laboratory for conservation research of the Collections Centre of the Swiss National Museums. Chimia 2008, 62, 882–886. [Google Scholar] [CrossRef]
- Kreislova, K.; Fiavlova, P.; Bohackova, T.; Majtas, D. Indoor corrosivity classification based on lead coupons. Kor. Och. Mat.. 2021, 65, 7–12. [Google Scholar] [CrossRef]
- Tingru, C. Atmospheric corrosion of copper and copper-based alloys in architecture. PhD, 2018, KTH Royal Institute of Technology, Stockholm, Sweden.
- Sheng, W.; Lingdong, K.; Zhisheng, A.; Jianmin, C.; Laimin, W.; Zhou, X. An Improved Oddy Test Using Metal Films. Stud. in Conserv. 2011, 56, 138–153. [Google Scholar]
- Long, E. R.; Bone, A.; Breitung, E. M.; Thickett, D.; Grau-Bové, J. Automated corrosion detection in Oddy test coupons using convolutional neural networks. Herit. Sci. 2022, 10. [Google Scholar] [CrossRef]
- Zhang, Y. Corrosion level classification methods for Oddy test coupons, UCL dissertation, University College London, 2023.
- Eremin, K.; Wilthew, P. Monitoring concentrations of organic gases within the National Museums of Scotland. SSCR Journal, 1998, 9, 15–19. [Google Scholar]
- Berndt, H. Assessing the detrimental effects of wood and wood products on the environment inside display cases. AIC preprints, 15th Annual Meeting, American Institute for Conservation, Vancouver, British Columbia. 1987, 22–33.
- Costa, V.; Dubus, M. Impact of the environmental conditions on the conservation of metal artifacts: an evaluation using electrochemical techniques. In Museum Microclimates, Copenhagen, Denmark 19-23 November 2007. 23 November.
- Cano, E.; Diaz, I. Quantitative Oddy test by the incorporation of the methodology of the ISO 11844 standard: A proof of concept. J. Cult. Herit. 2022, 57, 97–106. [Google Scholar]
- National conservation service. Product testing. Available online: at ncs.org.uk/producttesting.php, (accessed on 15 nov 2023).
- Tétreault, J.; Sirois, J.; Stamatopoulou, E. Studies of lead corrosion in acetic acid environments. Stud. Conserv., 1998, 43, 17–32. [Google Scholar] [CrossRef]
- Ramírez Barat, B.; Cano, E.; Molina, M.T.; Rodriguez-Barbero, M.A.; Rodrigo, J.A.; Menéndez, J.M. Design and validation of tailored colour reference charts for monitoring cultural heritage degradation. Herit. Sci. 2021, 9. [Google Scholar] [CrossRef]
- Ankersmit, H. A.; Doménech Carbó, A.; Tennent, N.H. Tarnishing of silver: evaluation by colour measurements, in: Proceedings of the International Conference on Metals Conservation: Metal 2001, ICOM-CC Metals Working Group and Western Australian Museum, Perth, I. D. MacLeod, J.M. Theile and C. Degrigny,, (eds.); Perth, Australia, 2004. 157-166.
- Cano, E.; López, M.F.; Simancas, J.; Bastidas, J.M. X-Ray Photoelectron spectroscopy study on the chemical composition of copper Tarnish products formed at low humidities, J. Electrochem. Soc. 2001, 148, E26–E30. [Google Scholar] [CrossRef]
- Hallett, K.; Thickett, D.; McPhail, D.; Chater, R. Application of SIMS to silver tarnish at the British Musuem, App. Surf. Sci. 2003, 203-204, 789–792. [Google Scholar] [CrossRef]
- Thickett, D. Oxygen depletion testing of metals. Her. 2021, 4, 2377–2389. [Google Scholar] [CrossRef]
- ISO 11844-2. Corrosion of Metals and Alloys - Classification of Low Corrosivity of Indoor Atmospheres - Part 2: Determination of Corrosion Attack in Indoor Atmospheres. 2020.
- Thickett, D. Review of analysis for cultural heritage conservation. Currr. Top. Anal. Chem. 2020, 12, 73–88. [Google Scholar]
- Diehl, J. Preventive conservation strategies in the re-opened collection of the Kunstkammer. Available online Iaq.dk/iap/iaq2016/diehl_2016.pdf (accessed on 15 nov 2023). 2023. [Google Scholar]
- Iperen, J.V; Keulen, H.v.; Keune, K.; Abdulah, K.; van Langh, R. Crystalline deposits in new display cases at the Rijksmuseum. Stud. Conserv. 2021, 66, 252–271. [Google Scholar]
- EN ISO 16000 series. Indoor air, ISO Geneva. 2012.
- Chiantore, O.; Riedo, C.; Poli, T.; Cotrufo, G.; Hohenstatt, P. Risk Assessment and Preservative Measures for Volatile Organic Compounds in Museum Showcases. Stud. Conserv. 2018, 63. [Google Scholar] [CrossRef]
- Beiner, G.G.; Lavi, M.; Seri, H.; Rossin, A.; Lev, O.; Gun, J.; Rabinovich, R. Oddy tests: Adding the analytical dimension. Collect. Forum 2015, 29, 22–36. [Google Scholar] [CrossRef]
- Leikach, D. An Assessment of the Use of Flame Retardant Plastics for Museum Applications. Mater. Sci. 2007. [Google Scholar]
- Samide, M. J.; Smith, G. D. Assessing the Suitability of Unplasticized Poly (Vinyl Chloride) for Museum Showcase Construction. J. Am. Inst. Cons. 2022, 61. [Google Scholar] [CrossRef]
- Samide, M.J.; Liggett, M.C.; Mill, J.; Smith, G.D. Relating volatiles analysis by GC–MS to Oddy test performance for determining the suitability of museum construction materials. Herit. Sci. 2018, 6. [Google Scholar] [CrossRef]
- Samide, M.J.; Smith, G.D. Analysis and quantitation of volatile organic compounds emitted from plastics used in museum construction by evolved gas analysis-gas chromatography-mass spectrometry. J. Chromatogr. A 2015, 1426, 201–208. [Google Scholar] [CrossRef]
- Stephens, C. H.; Buscarino, I.; Breitung, E. Updating the Oddy Test: Comparison with Volatiles Identified Using Chromatographic Techniques. Stud. Conserv. 2018, 63. [Google Scholar] [CrossRef]
- Lankester, P.; Thickett, D. Long-term provision of stable environments for metals conservation, ICOM CC, 2022, Helsinki 5-9 sept 2022.
- Thickett, D.; Lankester, P.; Odlyha, M. Assessing and predicting sustainability for maintaining silver collections. In Proceedings of the Interim Meeting of the ICOM-CC Metals Working Group Helsinki, Finland 5-9 September 2022. [Google Scholar]
- Curran, K.; Underhill, M.; Gibson, L.T.; Strlic, M. The development of a SPME-GC/MS method for the analysis of VOC emission from historic plastic and rubber materials. MicroChem, J., 2016, 124, 909–918. [Google Scholar] [CrossRef]
- MEMORI available online //memori.nilu.no (accessed on 15 nov 2023).
- English Heritage available online www.english-heritage.org.uk/learn/conservation/collections-advie-and-guidance SHOWCASES (accessed on 15 nov 2023).
- Thickett, D.; Lankester, P. : Odlyha, M. Assessing and predicting sustainability for maintaining silver collections. In Working towards a sustainable past, ICOM-CC, Valencia, 18-22 Septemeber 2023.
- Tetreault, J. Airborne pollutants in museums, galleries and archives. CCI, Ottawa, 2003.
- ISO Thermal performance of buildings determination of air change in buildings. ISO Geneva. 2000.
- Gibson, L.; Cooksey, B.G.; Littlejohn, D.; Tennent, N.H. A diffusion tube sampler for the determination of acetic acid and formic acid vapours in museum cabinets. Anal. Chim. Acta, 1997, 341, 11–19. [Google Scholar]
- Stephens, Catherine H.; Breitung, E.M. Impact of Volatile Organic Compounds (VOCs) from Acrylic Double-Sided Pressure-Sensitive Adhesives (PSAs) on Metals Found in Cultural Heritage Environments. Poly. Degrad. Stab. 2021, 193, 109738. [CrossRef]
Figure 1.
Arithmetic means for surface roughness of copper in directions down the coupon.

Figure 2.
Arithmetic means for surface roughness of copper in directions across the coupon.
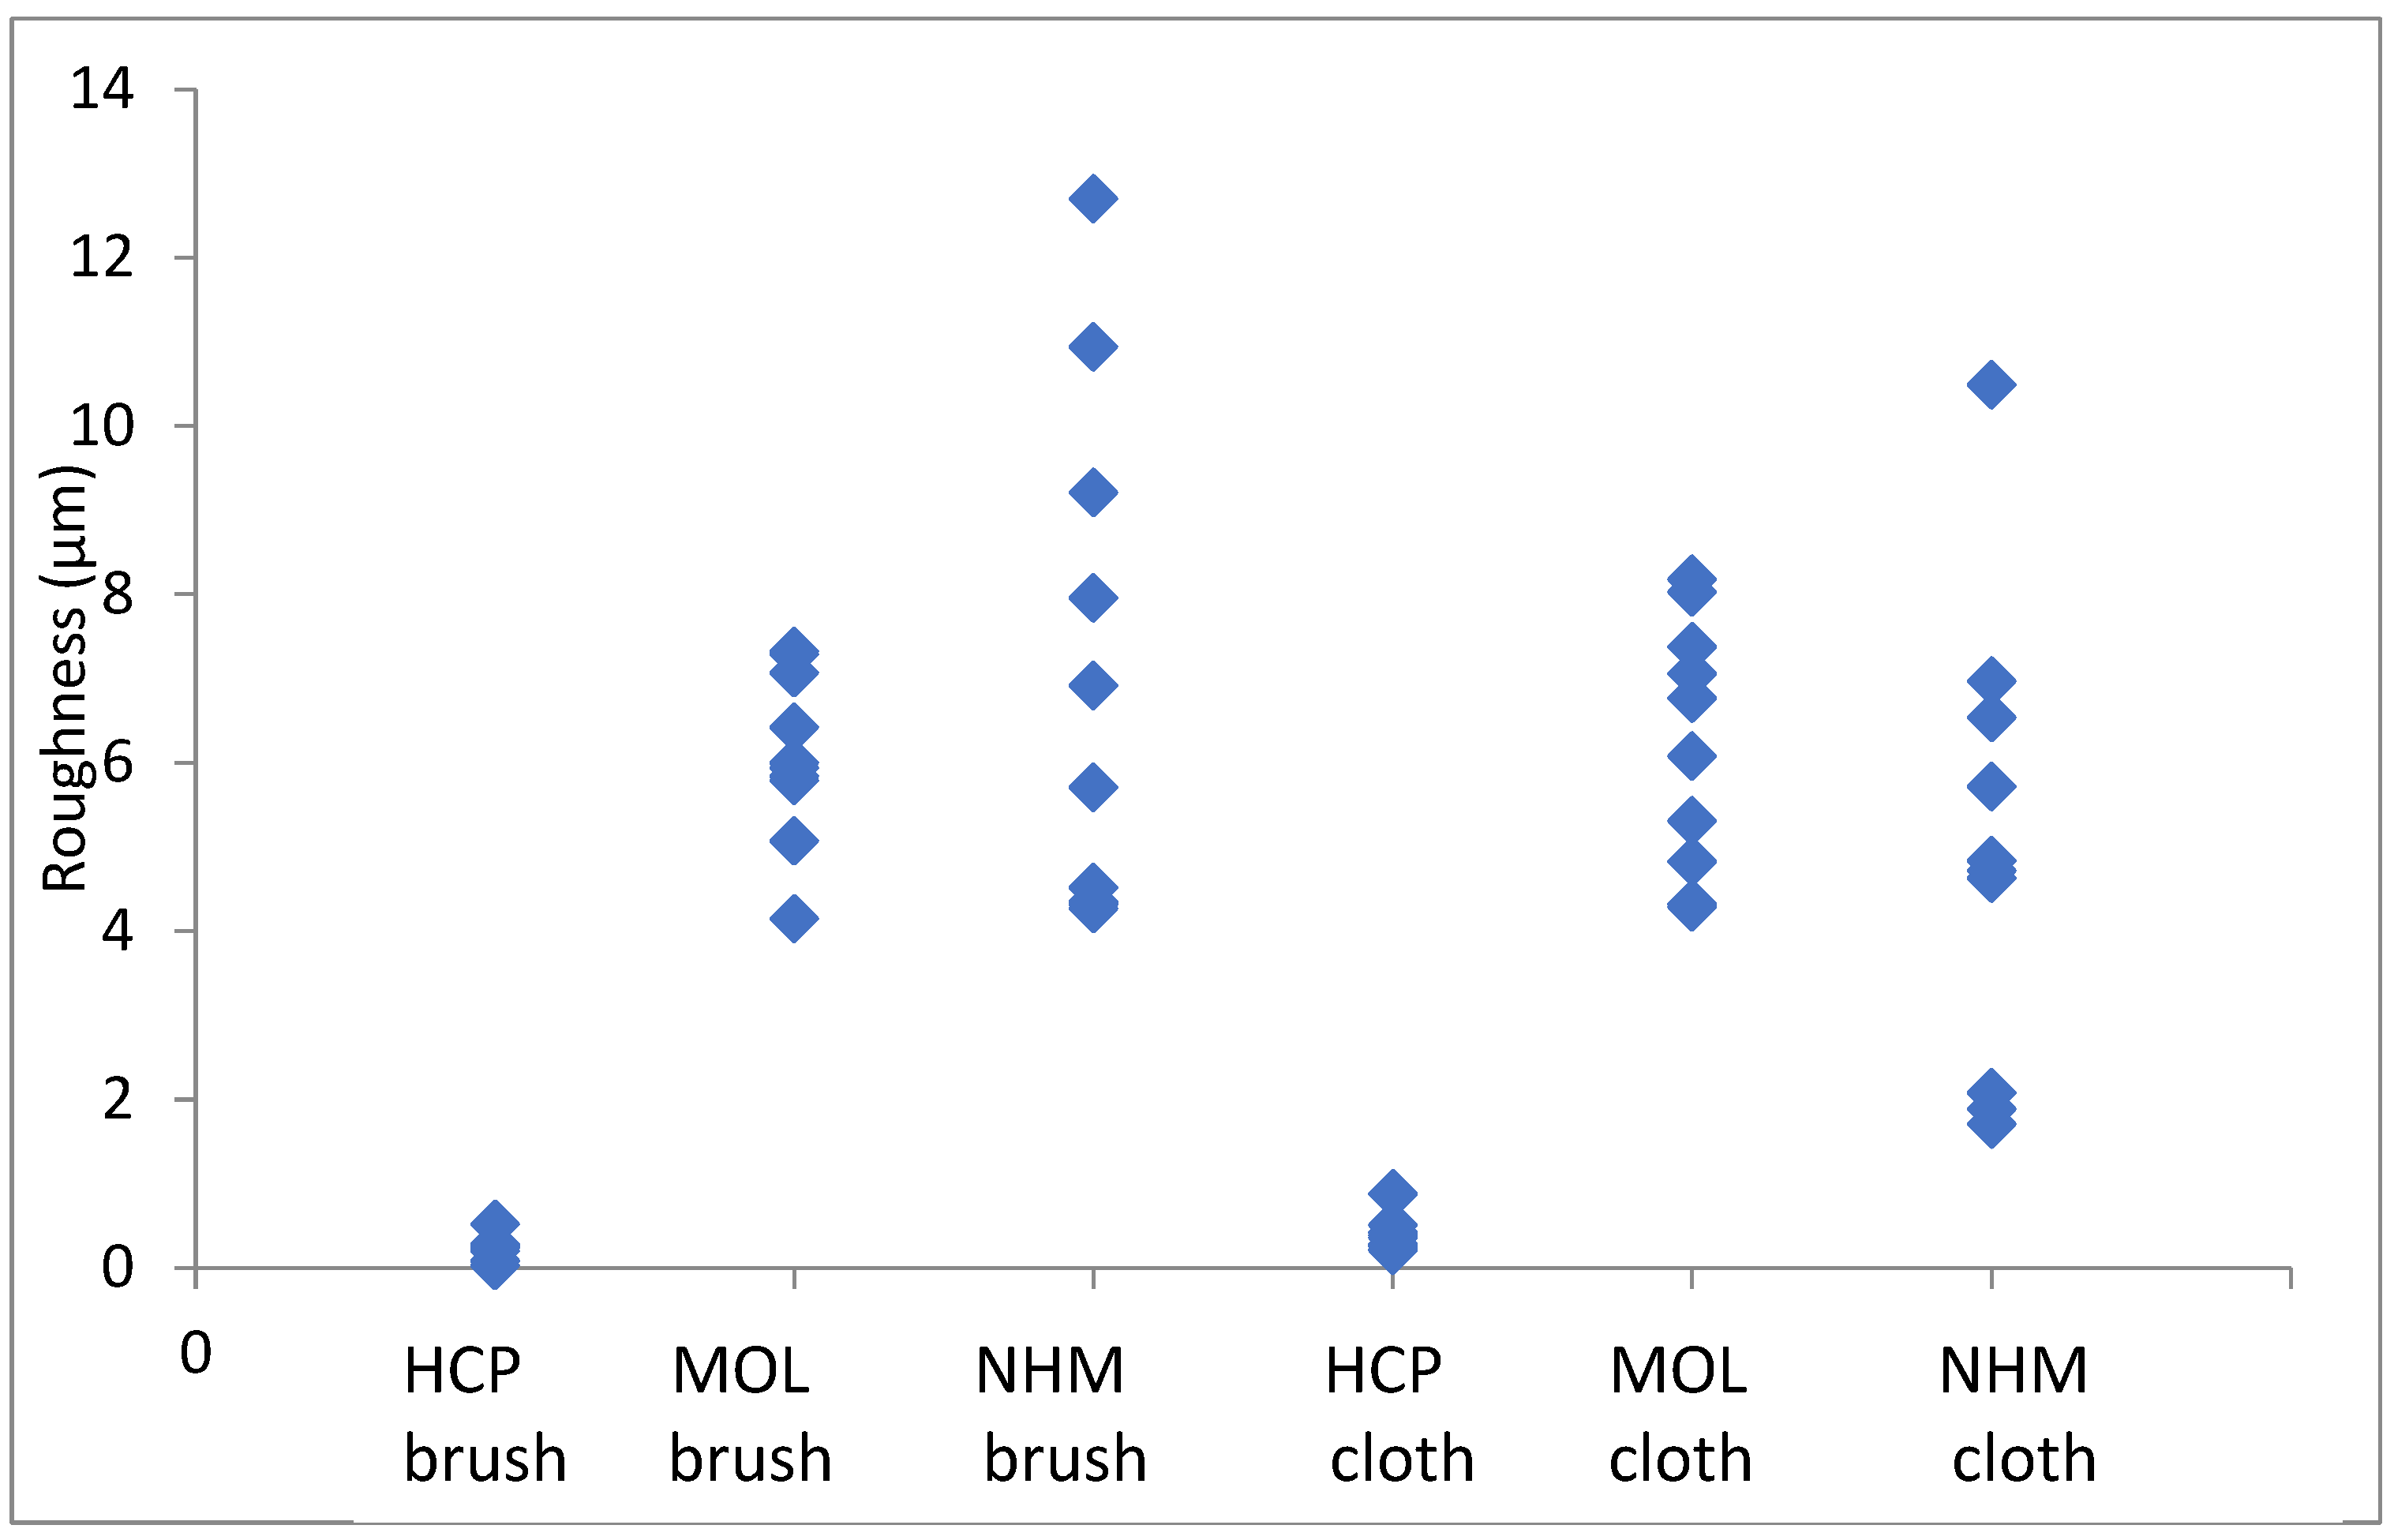
Figure 5.
Corrosion formed on lead coupons exposed to 1000µg/m3 of acetic acid, cleaned with glass bristle brush and abrasive cloth at different locations.
Figure 5.
Corrosion formed on lead coupons exposed to 1000µg/m3 of acetic acid, cleaned with glass bristle brush and abrasive cloth at different locations.
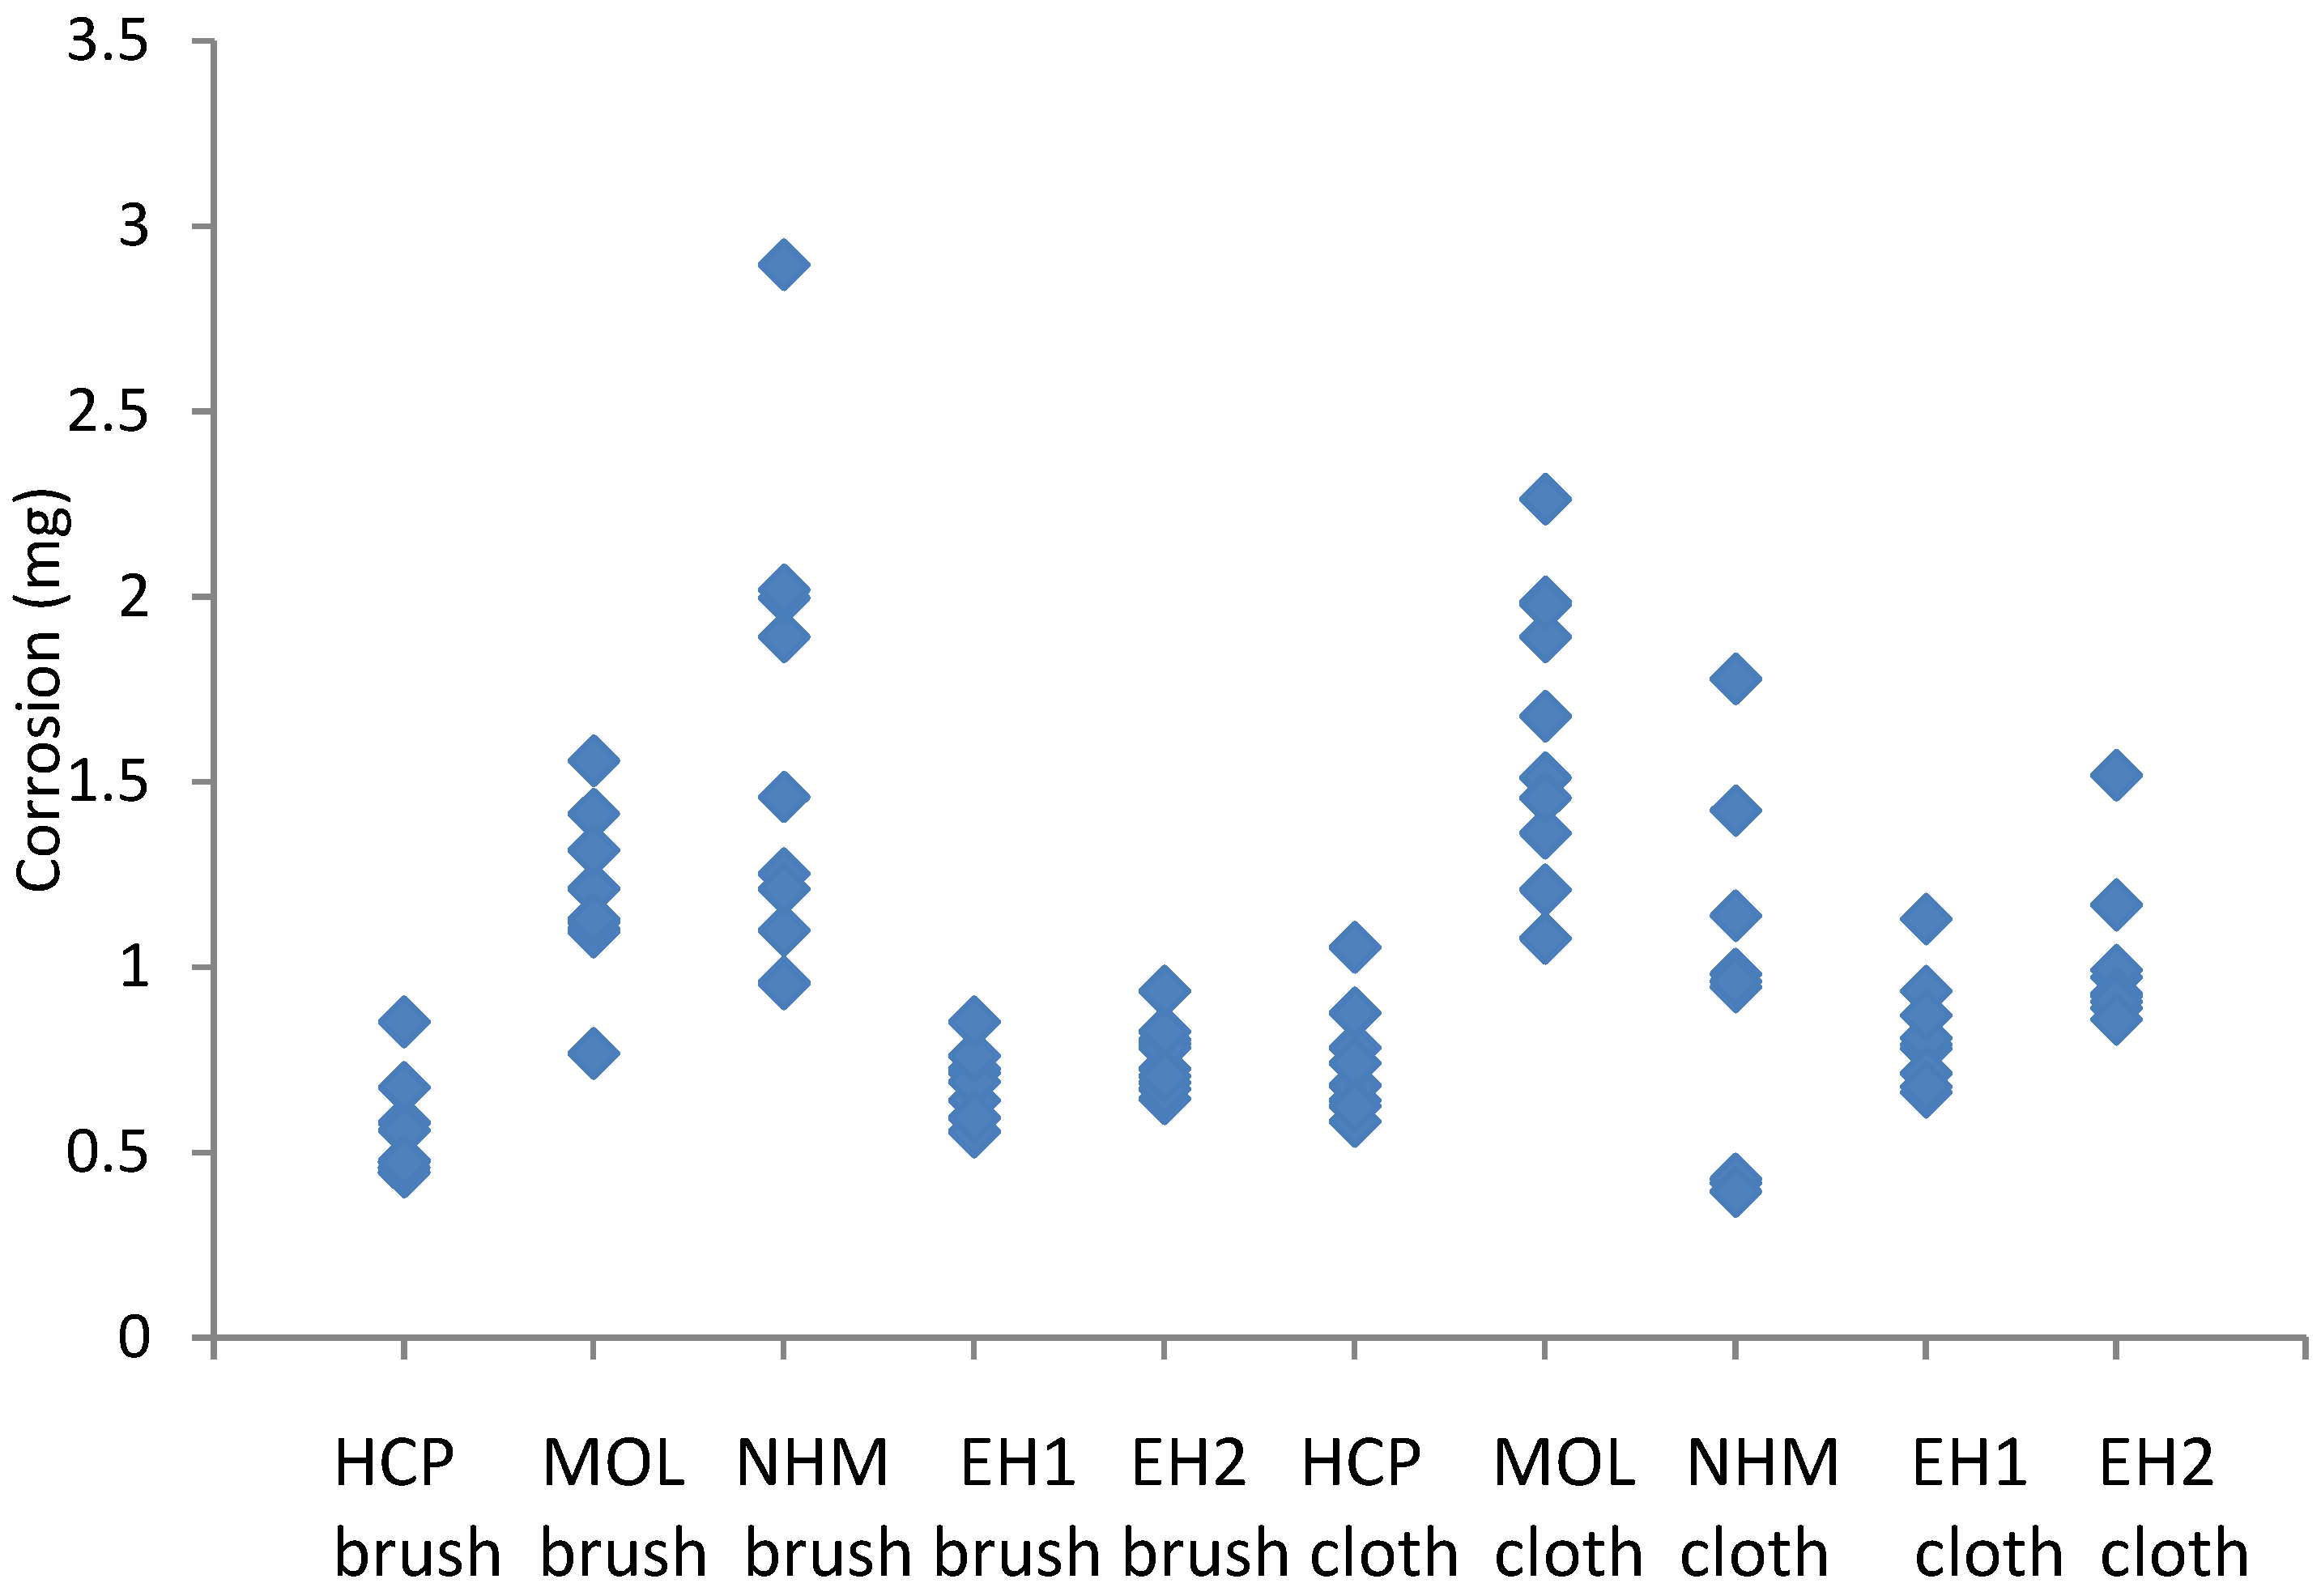
Figure 7.
Silver stripping results and visual ratings.
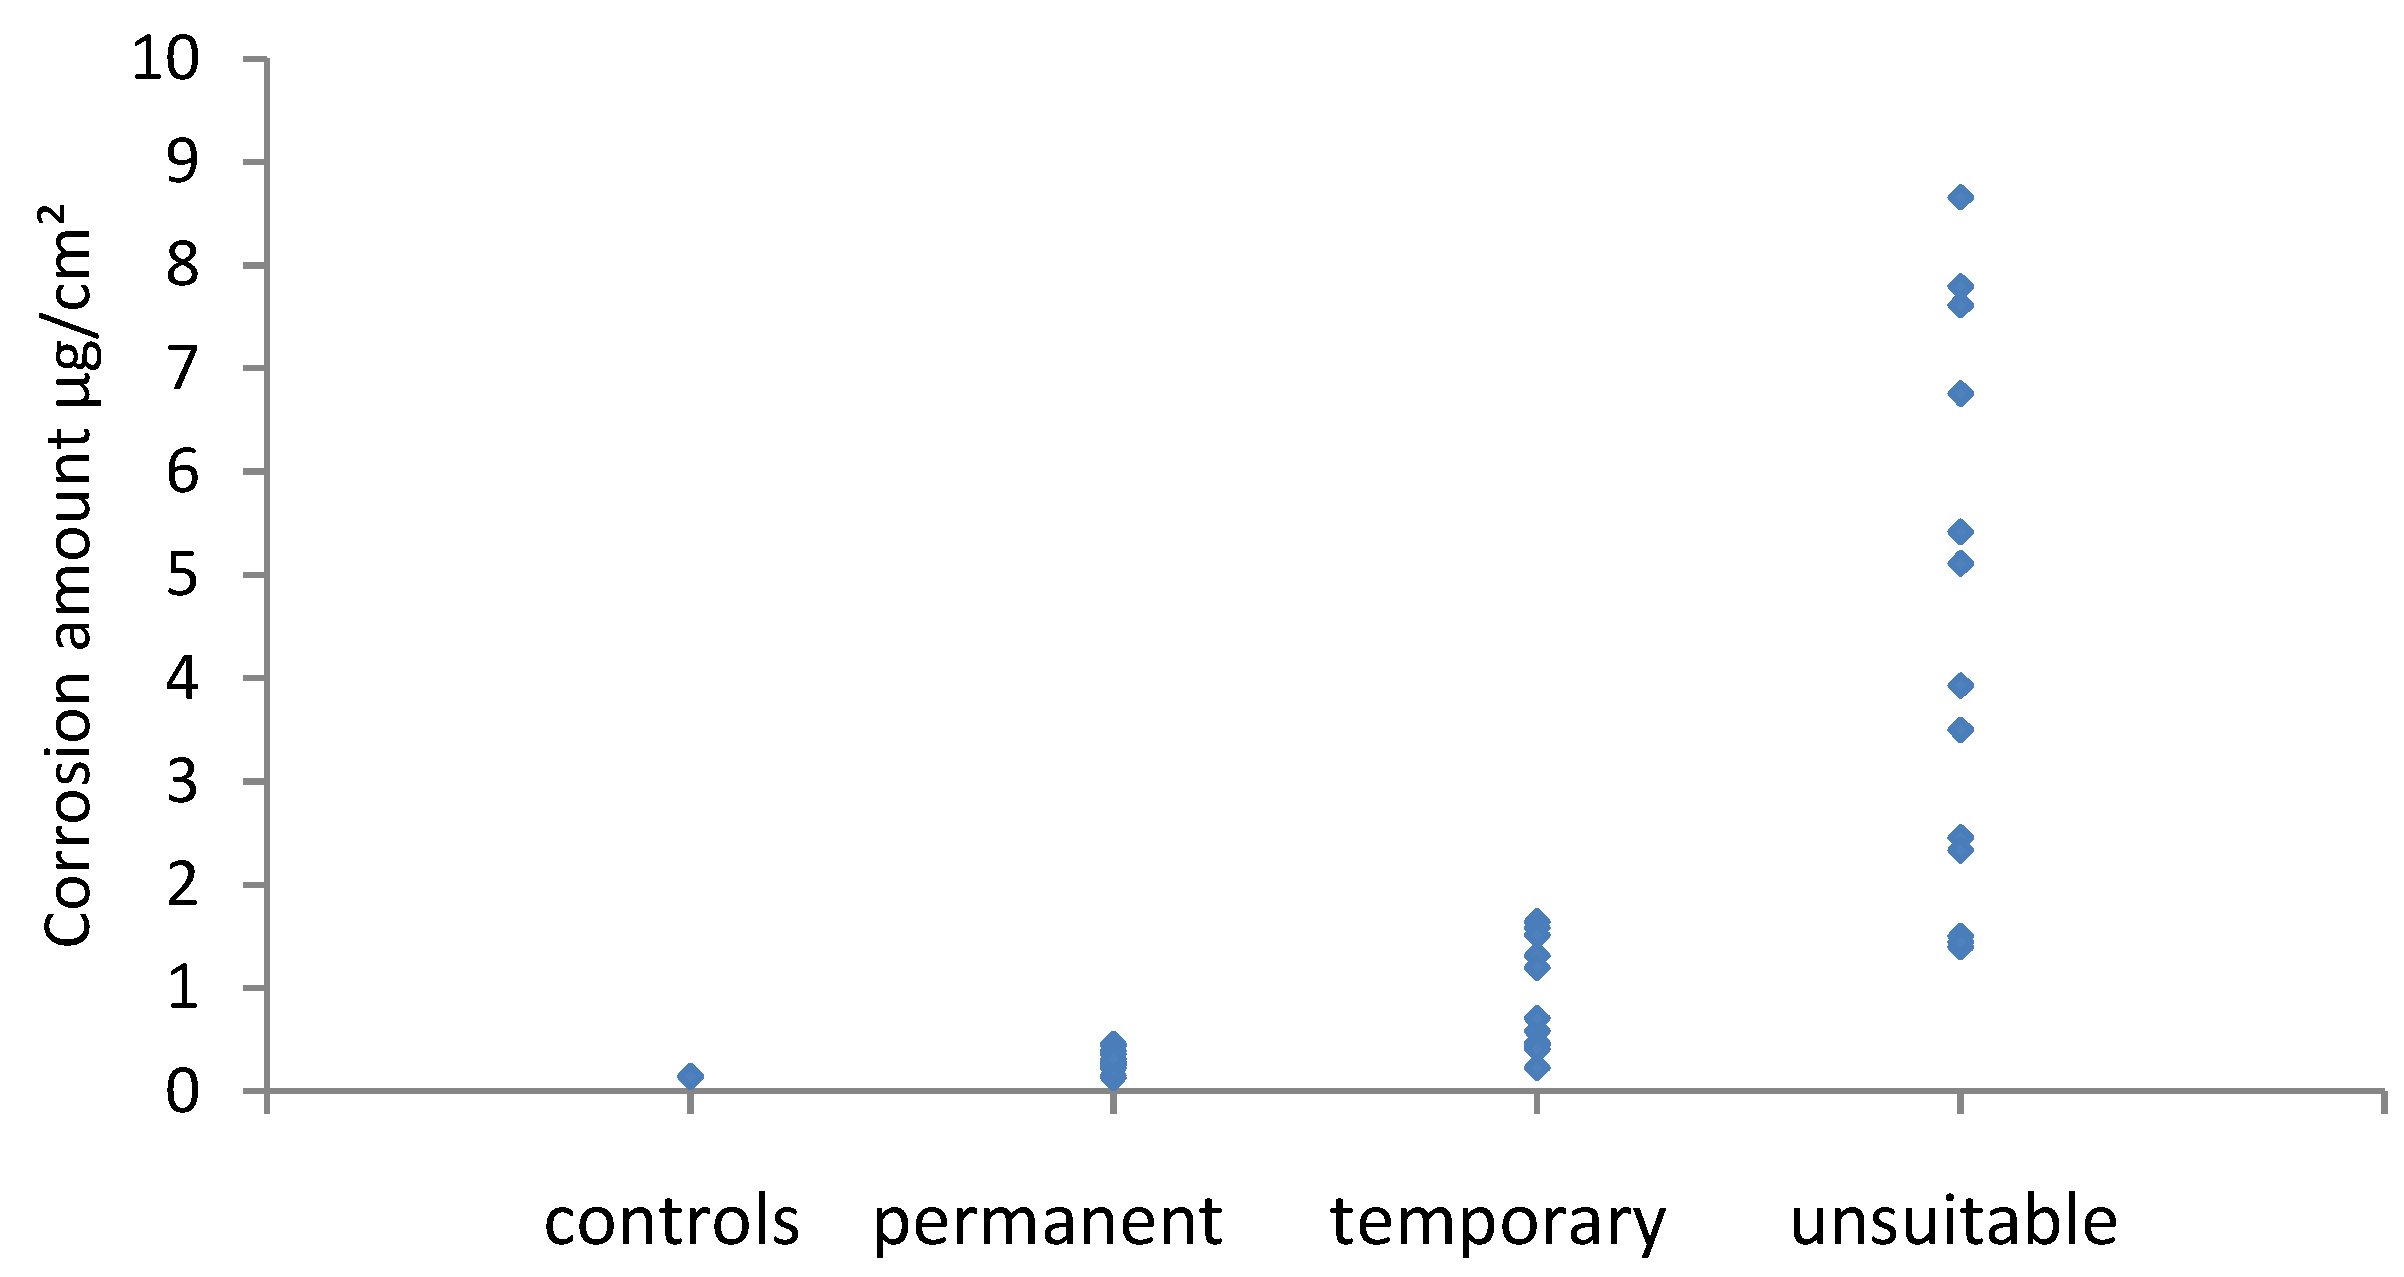
Figure 8.
Copper stripping results and visual ratings.
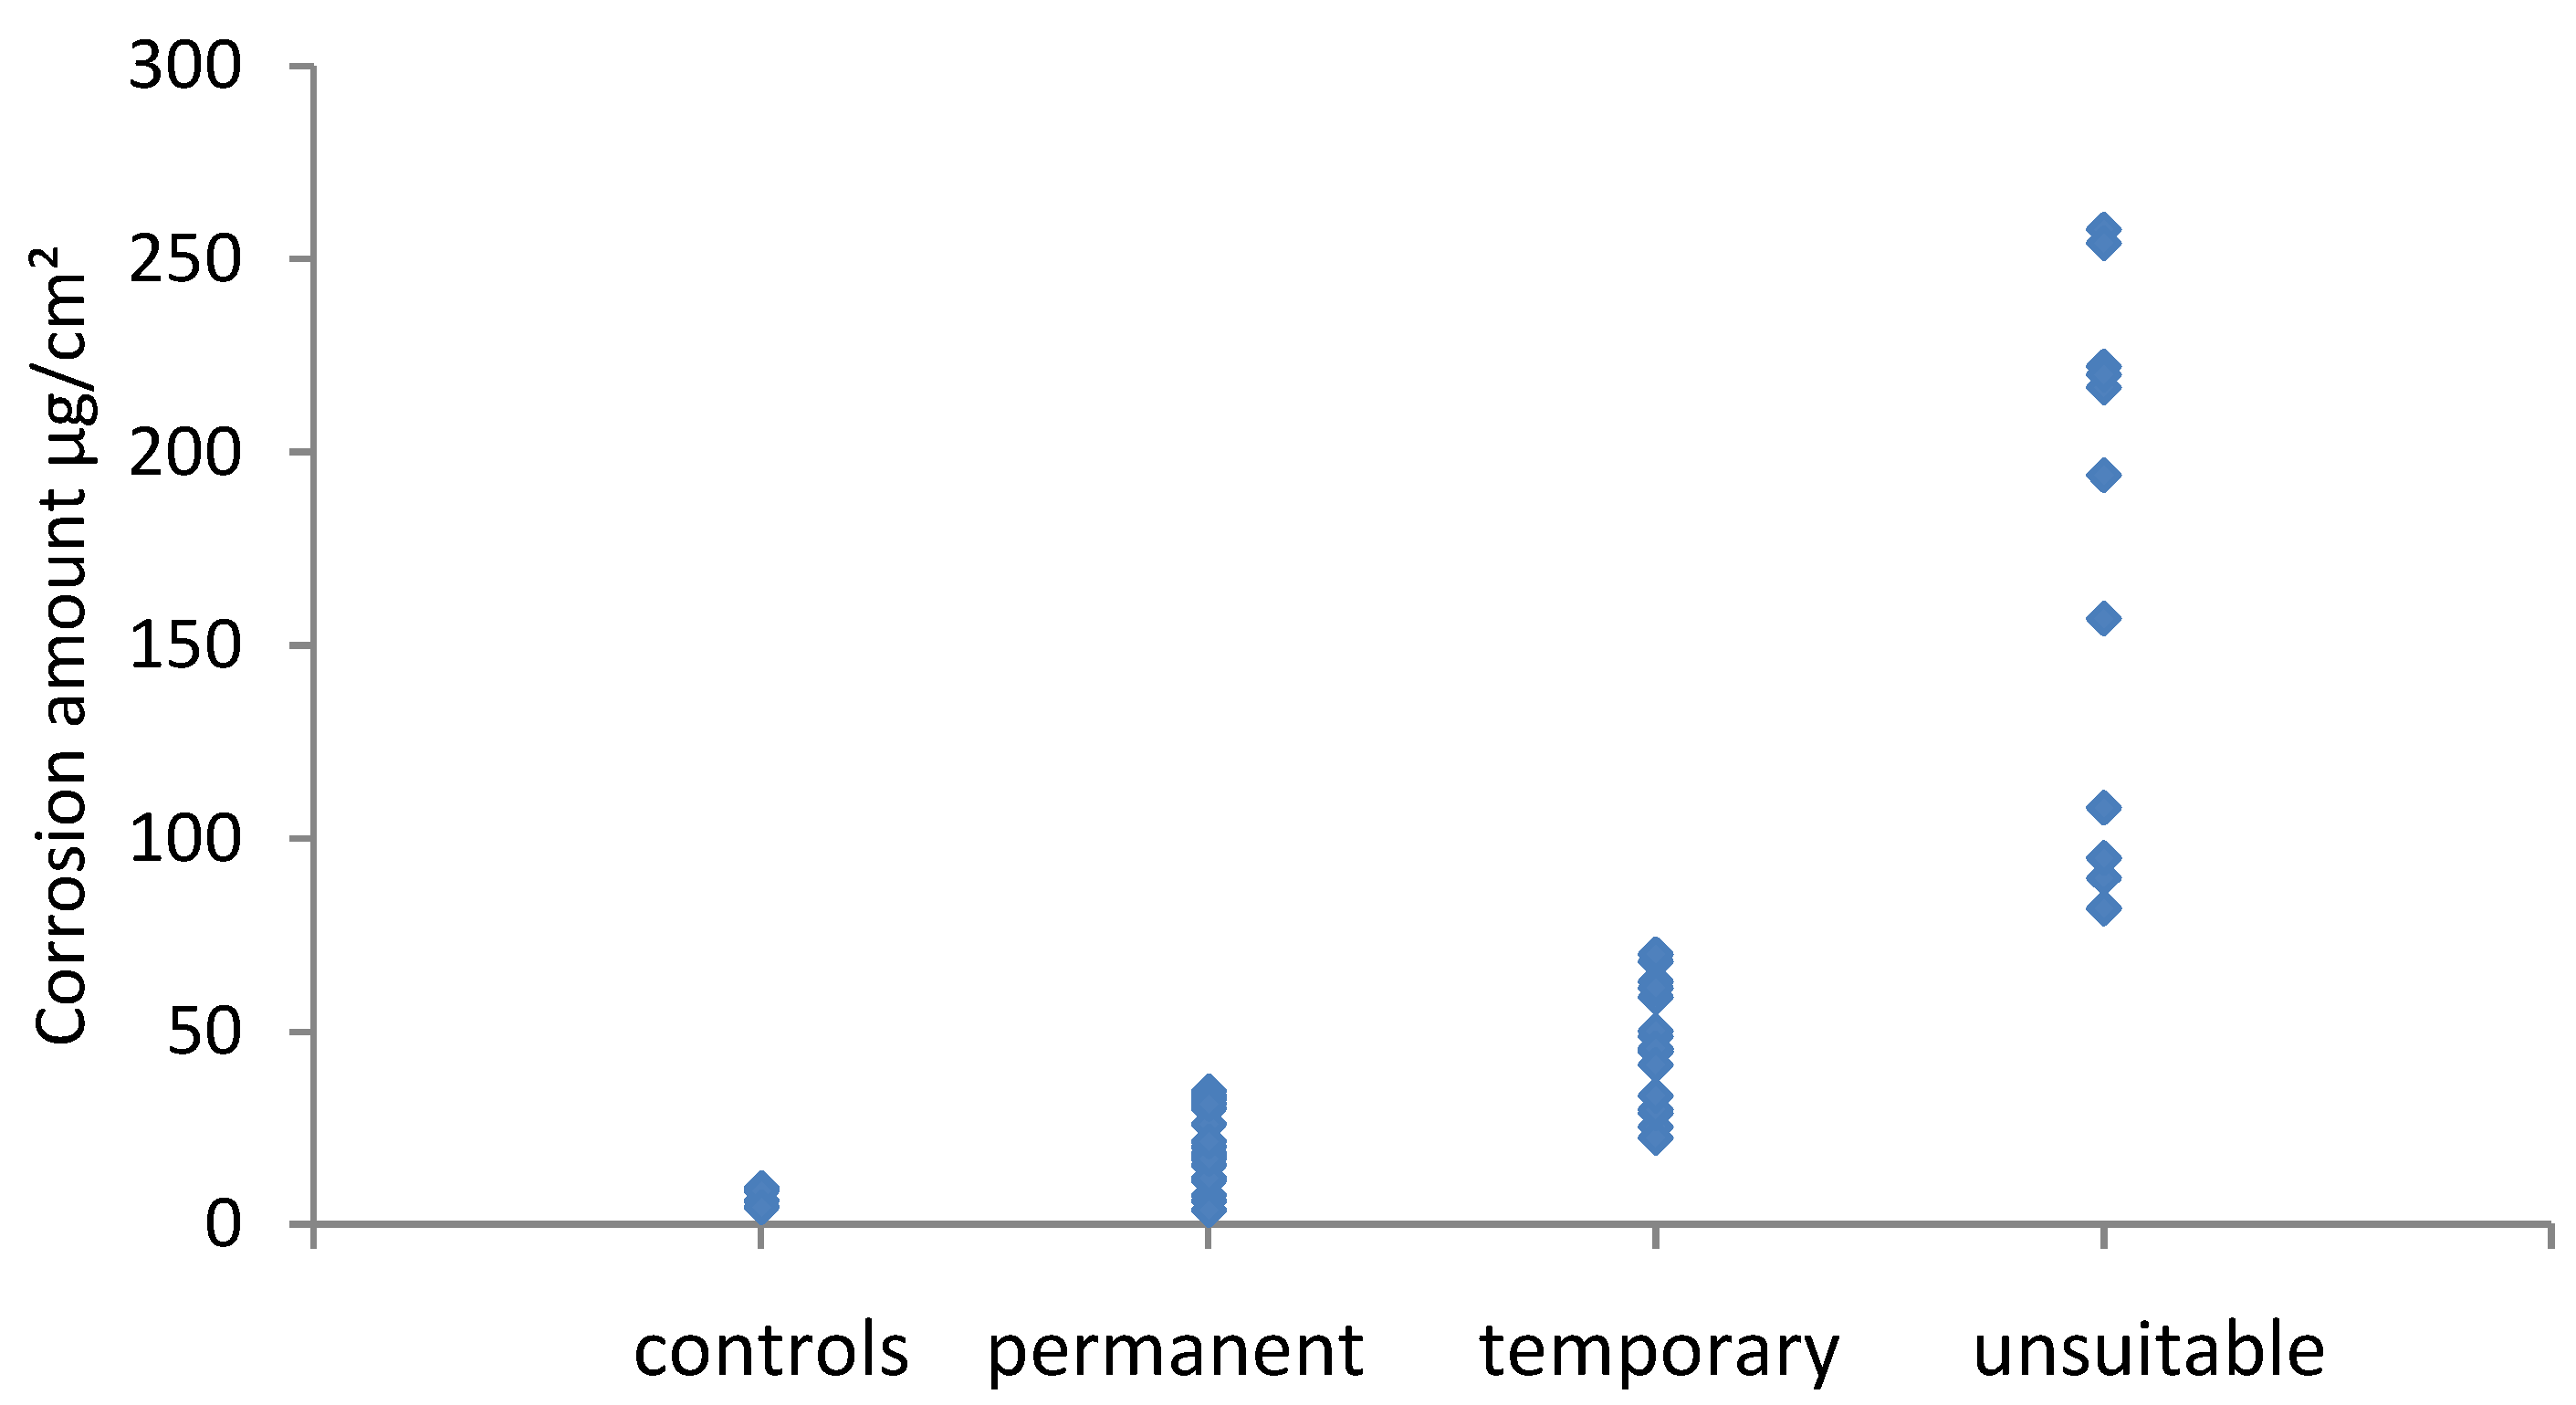
Figure 9.
Number of instances of observed corrosion.
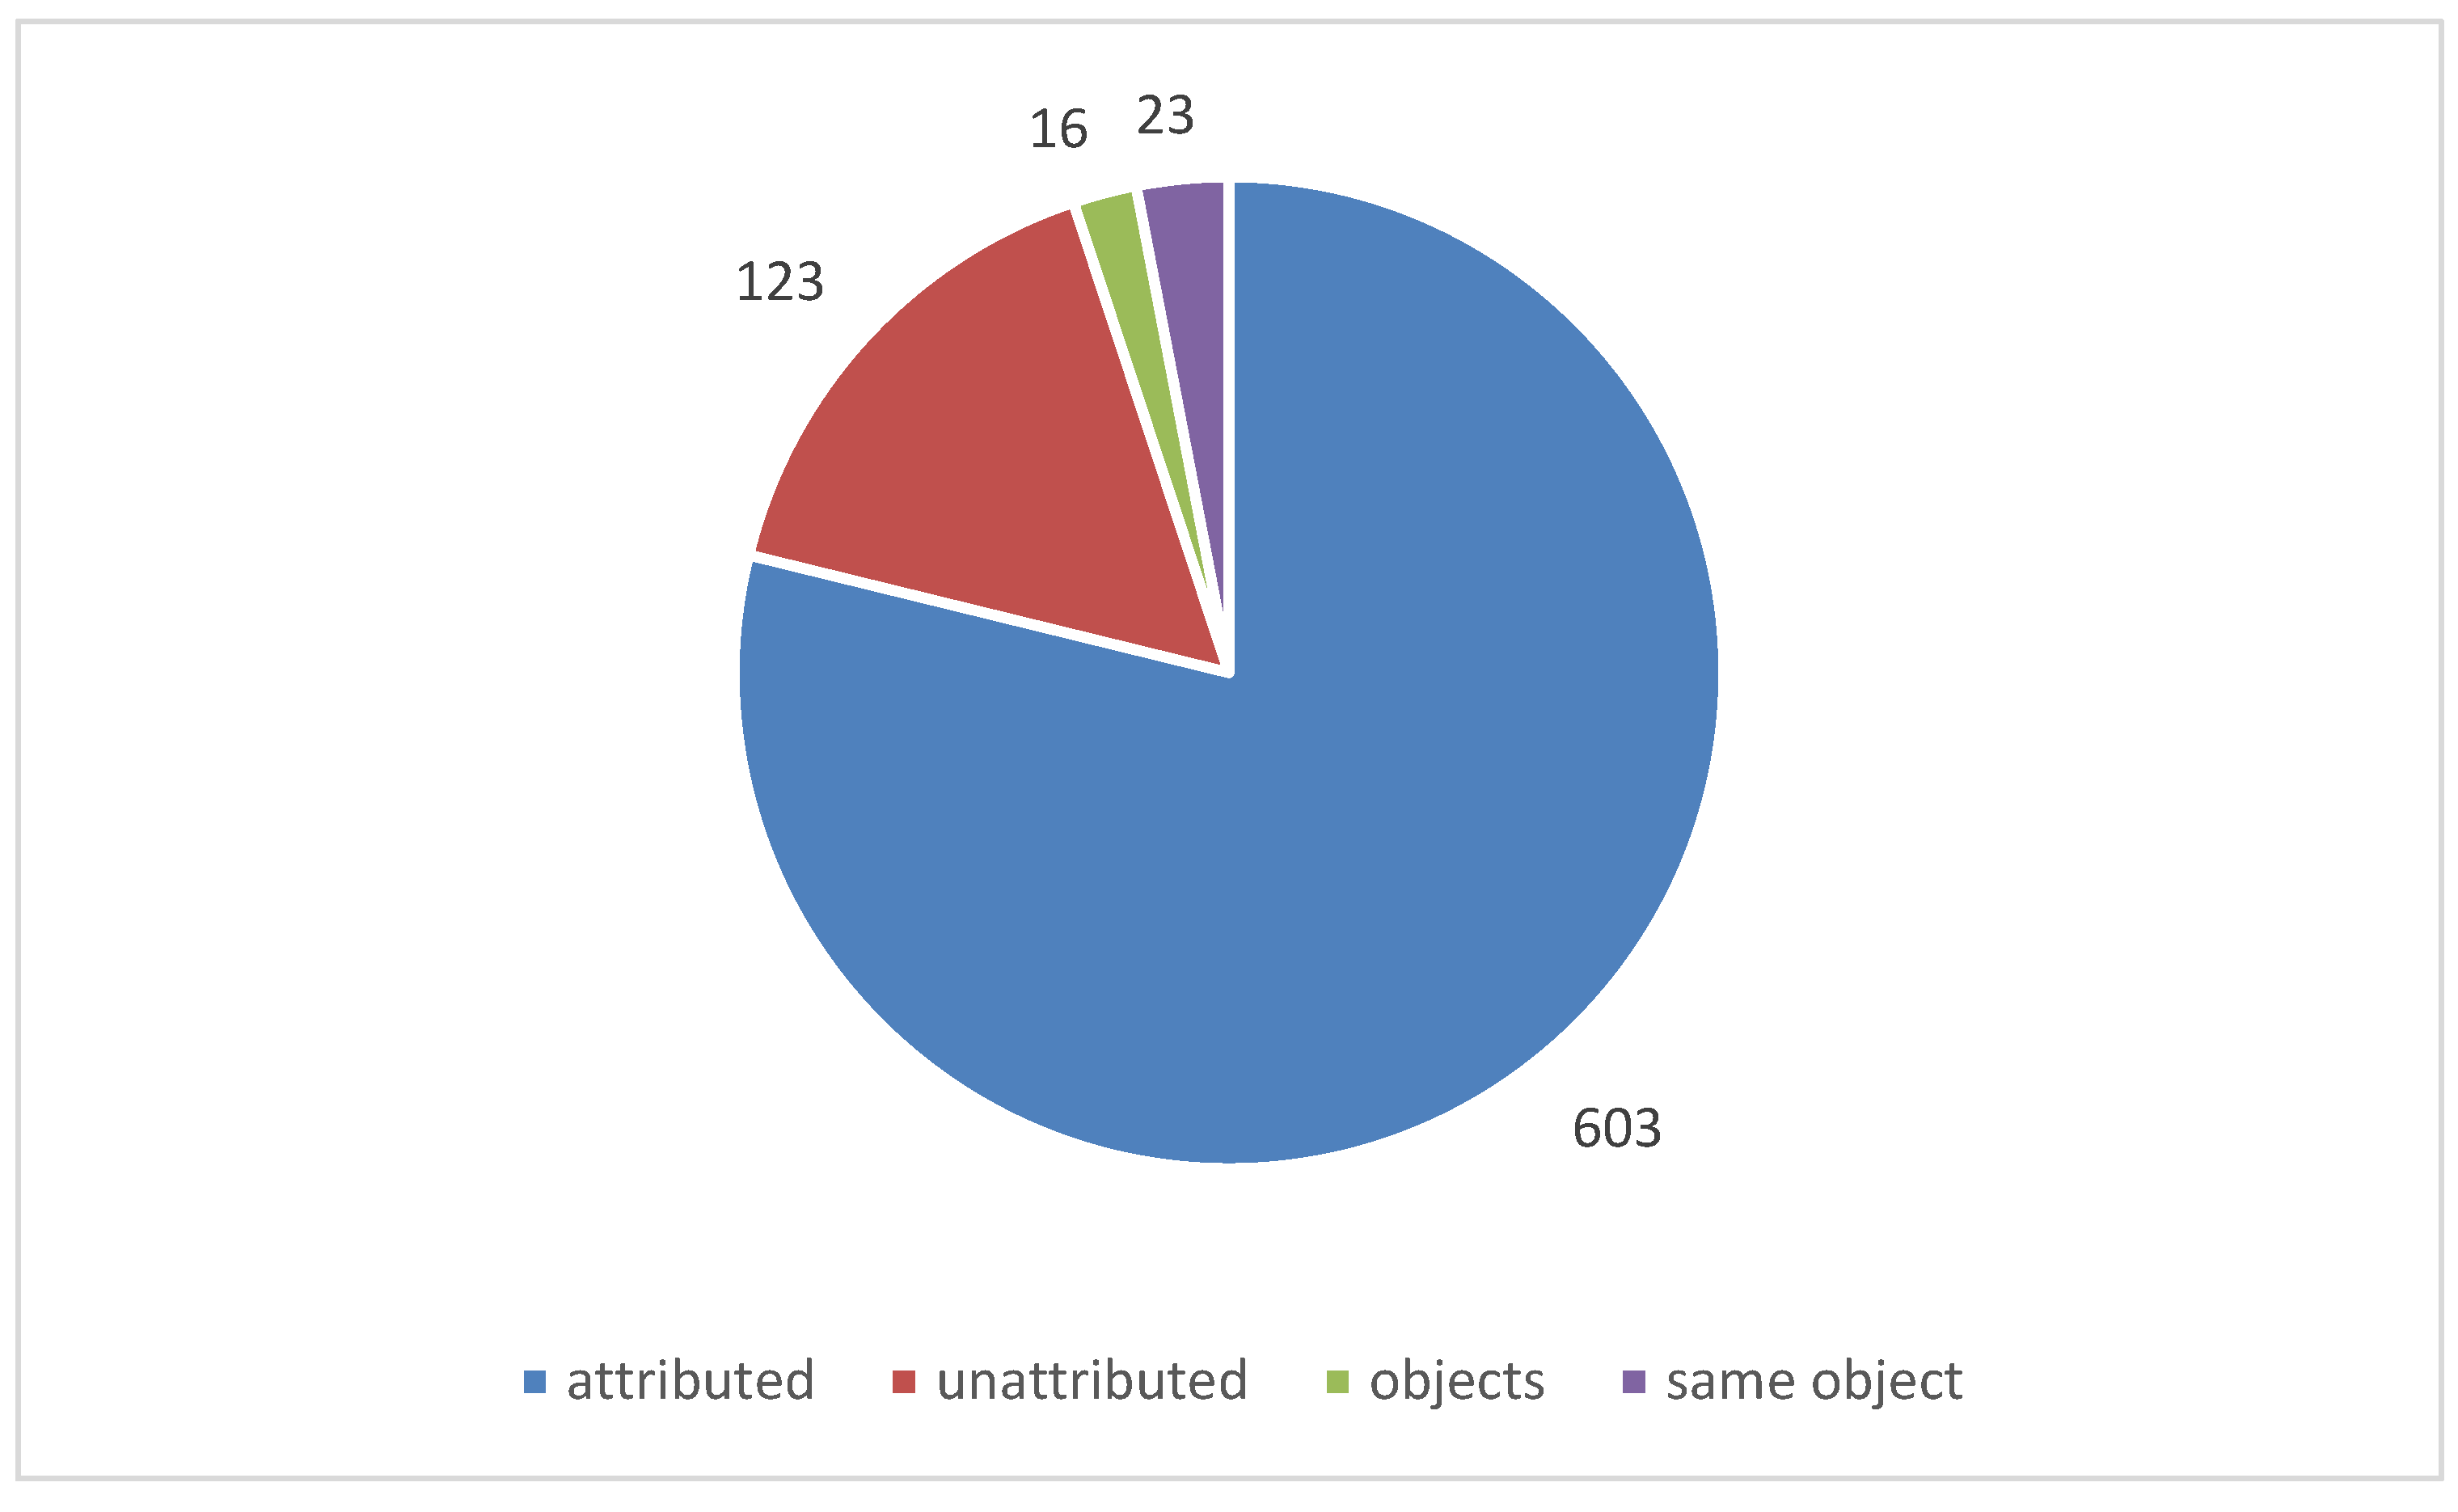
Figure 10.
Number of metal objects effected by corrosion.
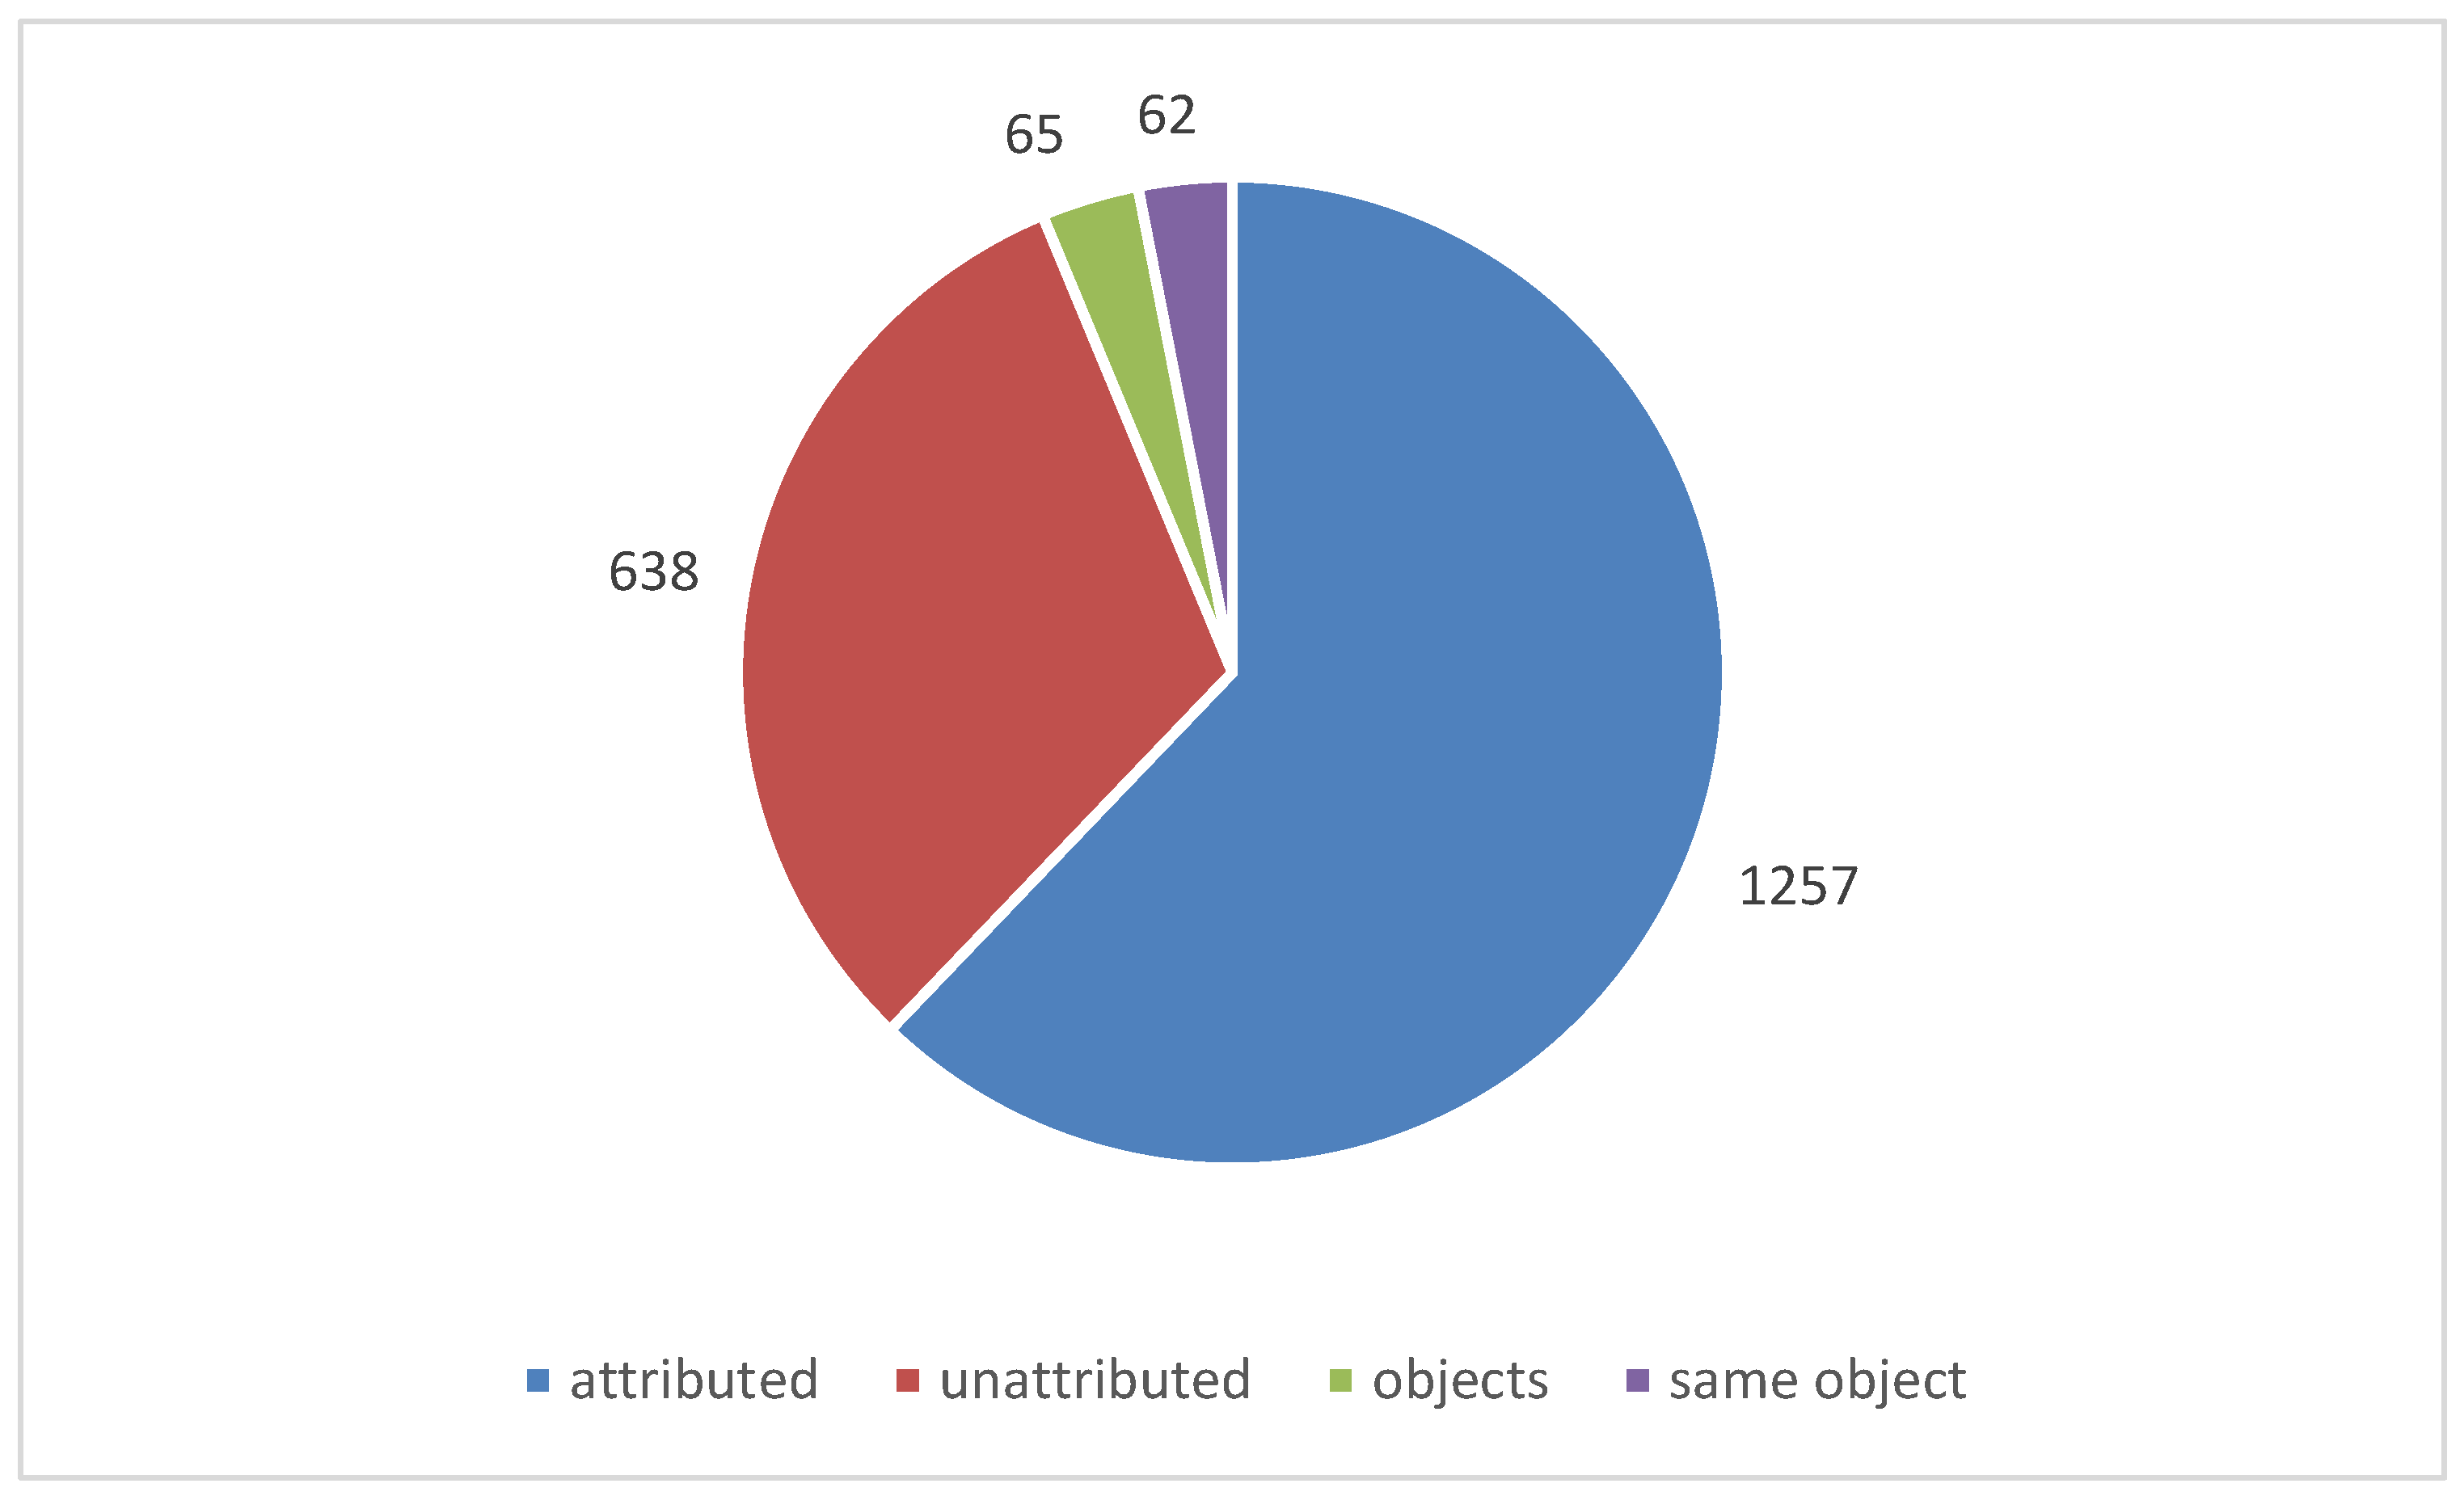
Figure 11.
Effect of air exchange rate on acetic acid concentration in 0.87 AER showcase with Japanese lacquer boxes.
Figure 11.
Effect of air exchange rate on acetic acid concentration in 0.87 AER showcase with Japanese lacquer boxes.
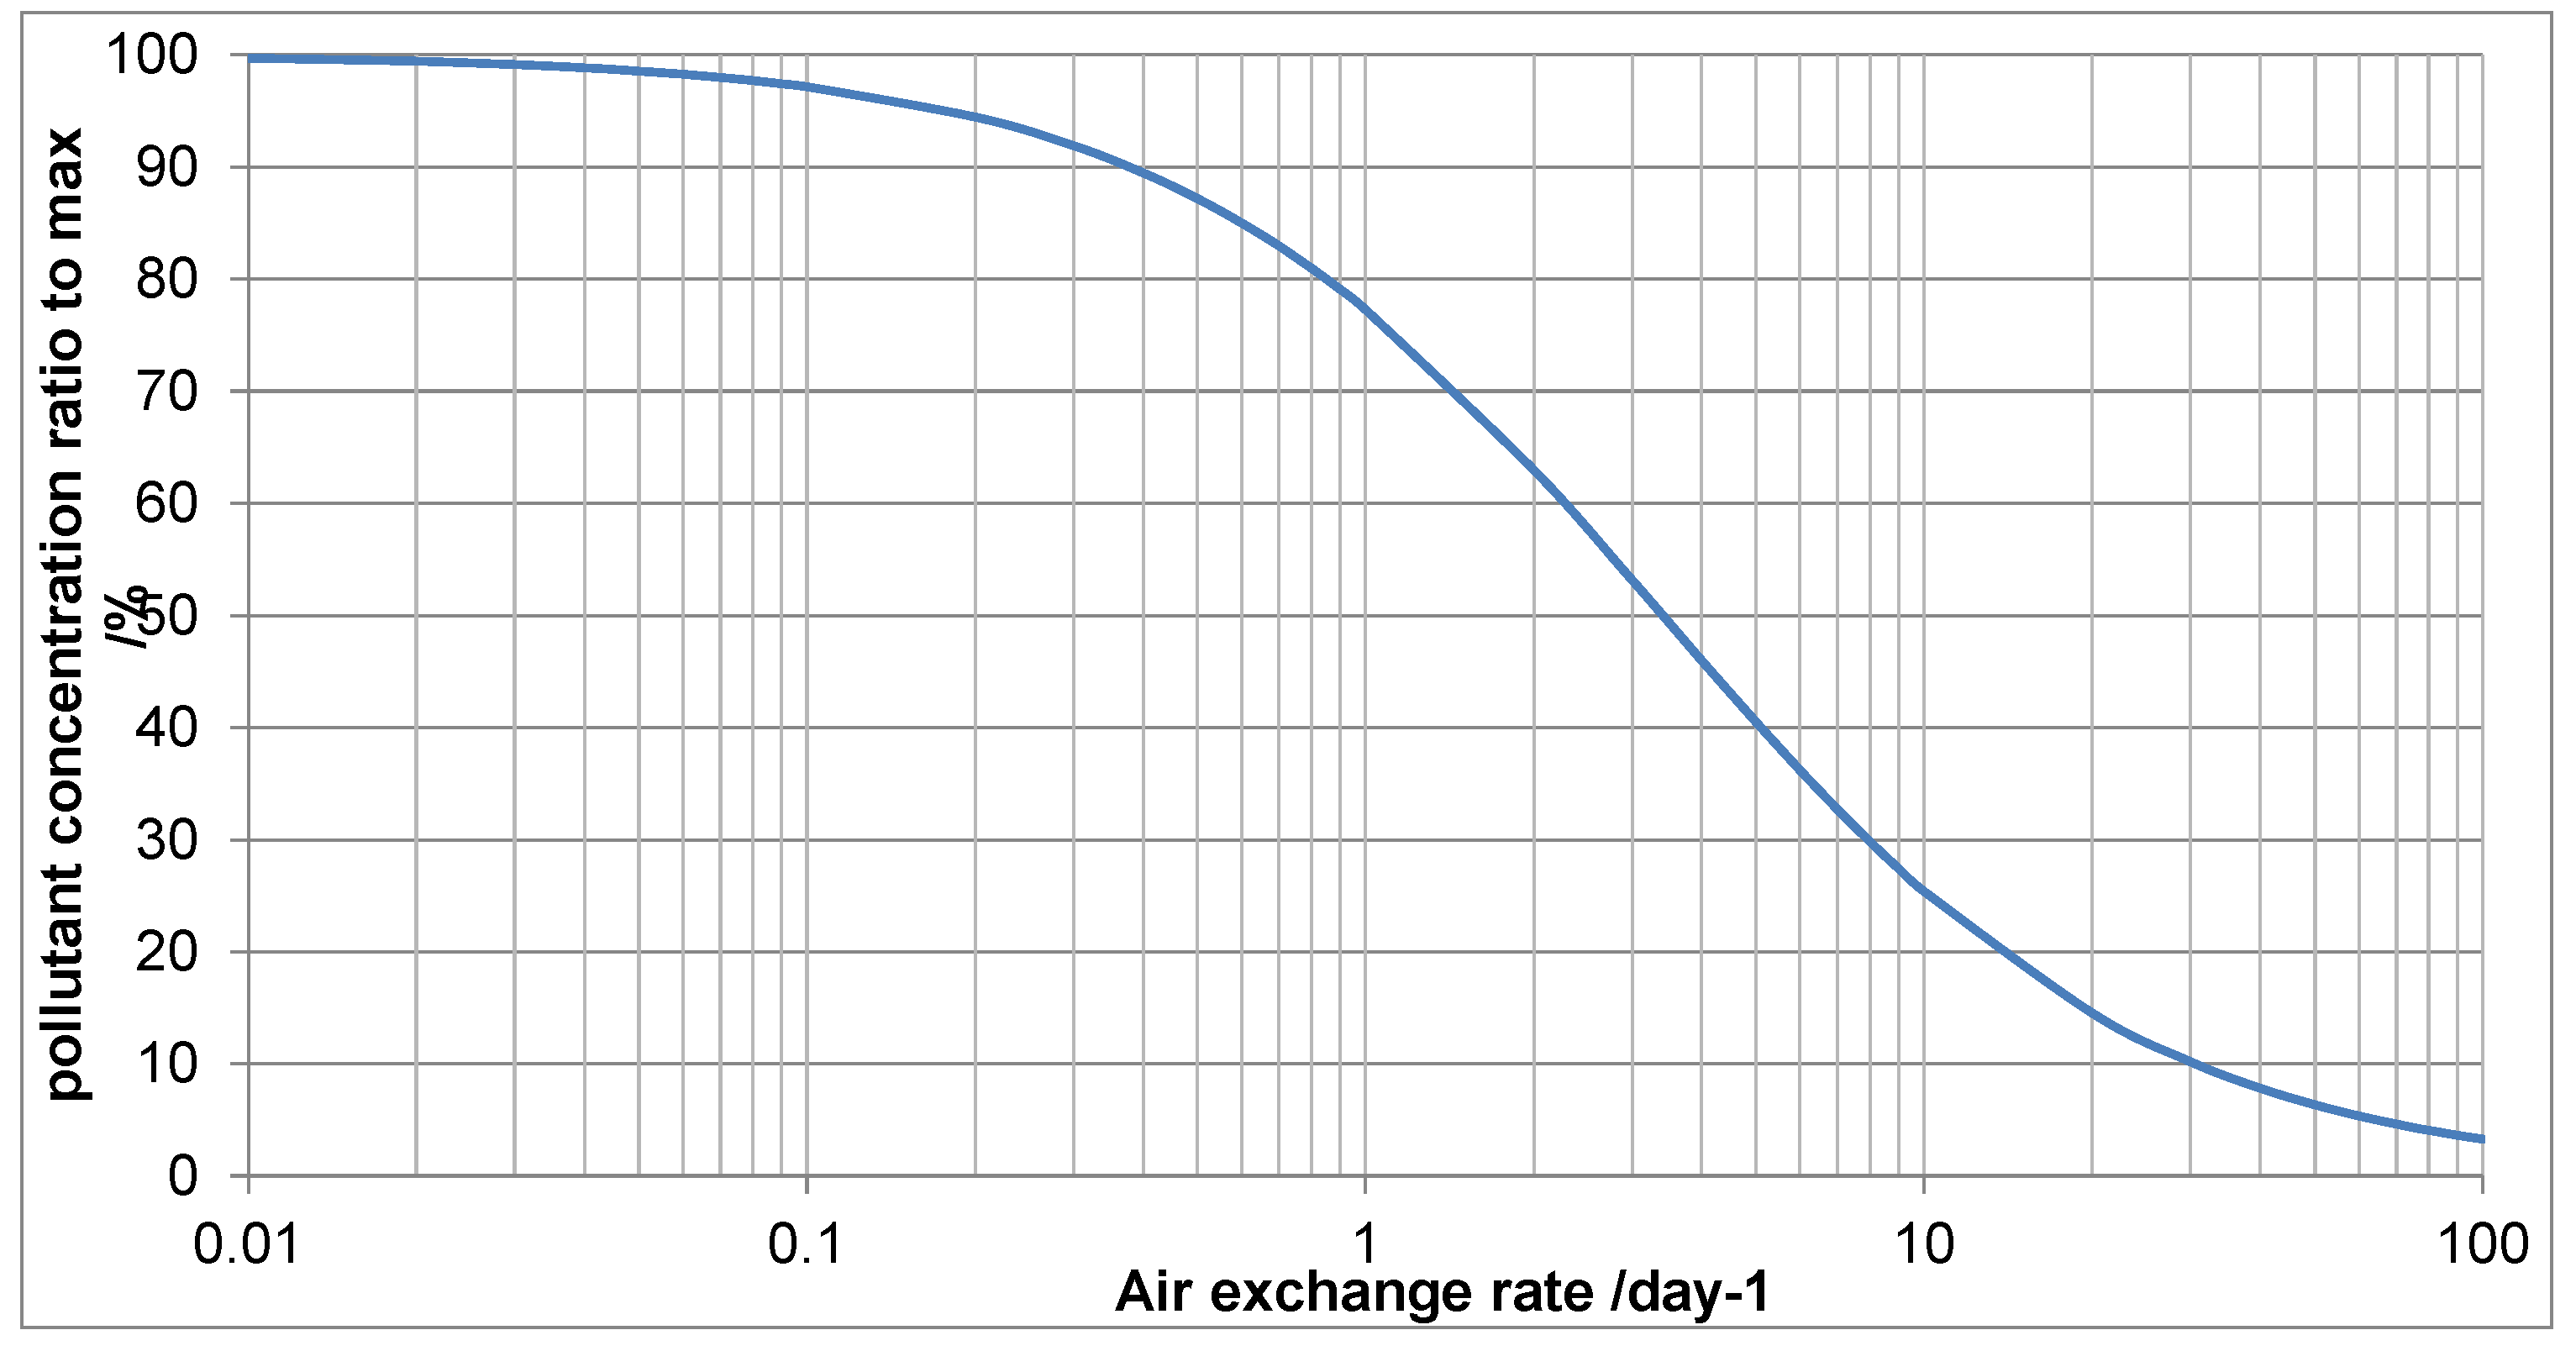
Table 1.
Techniques used or with potential to quantify corrosion on Oddy test coupons.
| Technique | Used for | Notes | Reference |
|---|---|---|---|
| XRD | All* | * Grazing angle is required for Ag | [11] |
| Raman | All | Analytical area often small, large numbers of measurements required for representative results | [12] |
| FTIR | Cu, Pb | [13,14] | |
| Image capture and analysis | Cu, Ag | [8,15] | |
| Image analysis of photographs | All | [16,17] | |
| Mass Gain | Cu, Pb | Issues with different corrosion products giving different mass gains | [18] |
| Chemical stripping (mass loss) | All | [19] | |
| Potentiodynamic stripping (mass loss) | Cu, Ag | [20] | |
| Coulometric stripping (mass loss) | Cu, Ag | [21] | |
| SEM | All | [22] | |
| Colorimetry | All* | Issues with early stages of Pb corrosion. | [23,24,25] |
| XRF | |||
| XPS | Ag | [26,27] | |
| Static SIMS | Ag | [27] | |
| Dynamic SIMS | Ag | [27] | |
| Oxygen depletion | Cu, Pb, (Fe) | Measurements of the test atmosphere and not the metal coupons. | [28] |
Table 2.
Main preventive conservation strategies for mitigating pollution damage.
| Method | Description | Notes |
|---|---|---|
| Remove | Remove or if testing do not use materials determined to pose a risk | |
| Block | Cover the emissive surfaces with an impermeable material | Can be difficult to determine all emissive surfaces or can be inaccessible. |
| Dilute (passive) | Increased ventilation through holes | Can be difficult to predict and can vary with atmospheric conditions. |
| Dilute (active) | Forced ventilation with pump | Difficult to determine if pump running. |
| Sorb (passive) | Little information on amount required, and difficult to calculate rate pollutant will sorb onto filter and hence replacement period. | |
| Sorb (active) | Forced filtered air with pump | Controlled flow rate, possible to predict replacement period. Some pumps have failure alarms |
Table 3.
Results from direct contact tests of materials that did not cause corrosion in Oddy tests.
| Material | Number tested | Additional percentage as T or U for materials that were P for copper, silver and lead in normal Oddy test | ||
|---|---|---|---|---|
| Copper | Silver | Lead | ||
| Powder coated steel | 10 | 10 | 10 | 10 |
| Various fabrics from tests | 50 | 16 | 22 | 18 |
| Baumann Unisono | 9 | 78 | 67 | 100 |
| Baumann Usus | 9 | 67 | 56 | 89 |
| Baumann Velos | 6 | 50 | 83 | 83 |
Table 4.
Results from emission tests of vinyls and calculations of when they woud exceed low risk threshold for lead and acetic acid at 50% RH. NA not applicable as value already exceeded under test conditions.
Table 4.
Results from emission tests of vinyls and calculations of when they woud exceed low risk threshold for lead and acetic acid at 50% RH. NA not applicable as value already exceeded under test conditions.
| Sample | Smart test number | Acetic acid concentration µg/m3) | Loading needed to exceed 400µg/m3 acetic acid at stated AER (per day) | ||||
|---|---|---|---|---|---|---|---|
| 0.10 | 0.20 | 0.40 | 0.60 | 0.80 | |||
| From Liverpool | Unknown | 493 | NA | NA | NA | NA | NA |
| white 8900 | 21/NCS001/070a1 | 130 | 23 | 32 | 50 | 69 | 87 |
| Black 8900 | 21/NCS001/071a1 | 87 | 34 | 48 | 75 | 103 | 131 |
| white 9800 | 21/NCS001/074a1 | 230 | 13 | 18 | 28 | 39 | 49 |
| Graphite 8900 | 21/NCS001/072a1 | 465 | NA | NA | NA | NA | NA |
| Black gloss 9800 | 21/NCS001/080a1 | 187 | 16 | 22 | 35 | 48 | 60 |
Table 5.
Instances of objects causing corrosion on metal objects.
| Metal corroding/source | Corrosion products | AER | Concentration (µg/m3) |
Number instances observed (reported) |
|---|---|---|---|---|
| OBJECTS EMITTING POLLUTION CAUSING CORROSION | ||||
| Cu/ arch wood, ceramics, iron | Copper sulfides/sulfates | 2.54 1.12 |
ND ND |
32, (hundreds) 4 |
| Ag/arch wood, ceramics | Silver sulfide | 0.89 | ND | 3 (12) |
| Lead, wood | Basic lead carbonate | 0.45 0.65 0.89 0.91 1.12 1.34 1.76 3.21 |
1234 (acetic) 824 (acetic) 1039 (acetic) 864 (acetic) 924 (acetic) 724 (acetic) 783 (acetic) 643 (acetic) |
1 (approx 150) 2 4 2 1 1 1 3 1 |
| Lead, paint | Lead formate | 0.12 | 840 (formic) | |
| Silver/leather | Silver sulfide | 1.78 | ND | 5 |
| Copper alloy/oil paint | Copper formate | 0.54 | 1612 (formic) | 2 |
| Copper alloy/wood | Copper acetate | 0.12 | 1724 (acetic) | 1 |
| Copper/ceramic | Copper hydroxide | 0.87 | 653 ammonia | 2 (2) |
Table 6.
Metal corrosion observed where the pollutant originated in the same object.
| Metal corroding/source in object – object type | Corrosion products | AER | Concentration (µg/m3) |
Number instances observed (reported) |
|---|---|---|---|---|
| Lead/wood – Topcali figure Japanese lacquer boxes |
Basic lead carbonate “ |
1.23 0.87 1.47 2.21 3.45 |
1047 Acetic 2564 Acetic 1254 1034 824 |
1 1 (64) 2 1 4 |
| Silver/wool – battens Osborne House, medals Wellington Arch, sword, rode, cap |
Silver sulfide “ “ |
26.73 0.40, 1.62 0.8, 1.2, 2.5 |
0.043 hydrogen sulfide <0.10 hydrogen sulfide <0.10 hydrogen sulfide |
23 (approx 140) 3, 1 1, 2, 1 |
| Iron/plastic, box of stencils | Iron nitrate | 6.72 | 431 Nitrate-nitric | 4 |
| Copper/plastic, necklace | Copper nitrate | 1.34 | 123 nitrate | 1 |
| Silver/felt Daguerretoypes/packets | Silver sulfide, Sodium formate on glass |
0.4 – 1.2* * Oxygen AERs |
9 | |
| Aluminium/plywood- drawers | Aluminium formate | 0.56 | 1200 formic 800 acetic |
7 (18) |
Table 7.
Sulfur gas concentrations determined inside Tedlar bags enclosing archaeological artefacts.
Table 7.
Sulfur gas concentrations determined inside Tedlar bags enclosing archaeological artefacts.
| sample | Gas concentration (µg/m3) | ||
|---|---|---|---|
| Hydrogen sulfide | Carbonyl sulfide | Carbon disulfide | |
| Empty bag | 0.043 | 0.425 | 0.014 |
| Ceramic 25°C | 0.184 | 2.481 | 0.351 |
| Ceramic 35°C | 0.653 | 6.482 | 1.347 |
| Iron 25°C | 0.248 | 1.234 | 0.012 |
| Iron 35°C | 0.813 | 8.439 | 0.015 |
Table 8.
Results of mitigation support tool for selected instances from Table 5.
Table 8.
Results of mitigation support tool for selected instances from Table 5.
| Measure possible, percentage likely to succeed | |||||||
|---|---|---|---|---|---|---|---|
| AER | conc | Dilute-passive | Dilute-active | sorb | Filter | ||
| Lead, wood | 0.45 |
1234 |
YES, 50 | YES, 100 | YES, 20 | YES, 100 | |
| Lead, wood | 0.65 | 824 | NO | YES, 100 | YES, 90 | YES, 100 | |
| Lead, wood | 0.89 | 1039 | YES, 80 | YES, 100 | YES, 70 | YES, 100 | |
| Lead, wood | 0.91 | 384 | YES, 20 | YES, 100 | YES, 20 | YES, 100 | |
| Lead, wood | 1.12 | 924 | NO | YES, 100 | NO | YES, 100 | |
| Lead, wood | 1.34 | 724 | NO | YES, 100 | YES, 10 | YES, 100 | |
| Lead, wood | 1.76 | 783 | NO | YES, 70 | NO | YES, 50 | |
| Lead, wood | 3.21 | 643 | NO | YES, 30 | YES, 70 | YES, 30 | |
| Lead, paint | 0.12 | 840 | YES, 50 | YES, 100 | NO | YES, 100 |
Disclaimer/Publisher’s Note: The statements, opinions and data contained in all publications are solely those of the individual author(s) and contributor(s) and not of MDPI and/or the editor(s). MDPI and/or the editor(s) disclaim responsibility for any injury to people or property resulting from any ideas, methods, instructions or products referred to in the content. |
© 2023 by the authors. Licensee MDPI, Basel, Switzerland. This article is an open access article distributed under the terms and conditions of the Creative Commons Attribution (CC BY) license (http://creativecommons.org/licenses/by/4.0/).
Copyright: This open access article is published under a Creative Commons CC BY 4.0 license, which permit the free download, distribution, and reuse, provided that the author and preprint are cited in any reuse.


