
Submitted:
16 November 2023
Posted:
16 November 2023
You are already at the latest version
Abstract
China Xihu Longjing tea famous for its good flavor and quality. However, the related metabolites information except flavonoids is largely deficient. Different processing methods of China Xihu Longjing tea fixing both by machine at first and second step(A1), first step by machine and second step by hand(A2), first step by hand and second step by machine(A3), both by hand at first and second step (A4) were compared using a UHPLC-QE-MS-based metabolomics approach. Liquid chromatography-mass spectrometry was used to analyze the metabolic profiles of the processed samples. A total of 490 metabolites (3 alkaloids, 3 anthracenes, 15 benzene and substituted derivatives, 2 benzopyrans, 13 coumarins and derivatives, 128 flavonoids, 4 furanoid lignans, 16 glycosides and derivatives, 5 indoles and derivatives, 18 isocoumarins and derivatives, 4 chalcones and dihydrochalcones, 4 naphthopyrans, 3 nucleosides, 78 organic acids and derivatives, 55 organooxygen compounds, 5 phenols, 109 prenol lipids, 3 saccharolipids, 3 steroids and steroid derivatives, 17 tannins) were identified. The different metabolism profiles were distinguished using PCA and OPLS-DA. There were differences in the types and contents of metabolites, especially flavonoids, furanoid lignans, glycosides and derivatives, organic acids and derivatives and organooxygen compounds. There was a positive correlation between flavonoid metabolism and amino acid metabolism. However, there was a negative correlation between flavonoid metabolism and amino acid metabolism, which had the same trend as prenol lipids metabolism, tannin.This study provides new valuable information for regarding differences in the metabolite profile of China Xihu Longjing tea processed based on machine fixing and manual fixing methods.
Keywords:
Xihu Longjing tea
; Processing method
; Quality
; Comparative metabolomics
; Chemical Composition
1. Introduction
China Xihu Longjing tea popular all over the world because of its unique flavor and quality. The traditional processing method of Xihu Longjing tea was stir-frying by hand, which had ten techniques of“Shaking, building, needing, pressing, shaking, grabbing, pushing, bucking, pressing and grinding”, required a high level of processing method and“See tea do tea” level [1]. The traditional method is not only inefficient, but also difficult to realize the scale and standardization of tea production [2]. With the development of industry, the need of efficiency, standardization and scale of processing method, and the shortage of labor force, machine frying had been introduced into the processing of Xihu Longjing tea. In recent years, the performance of flat-shaped tea frying machine, drum-type and reciprocating trough-type longjing tea pot machine had been gradually improved, and the level of mechanized processing method of Xihu Longjing tea had been continuously improved.
At present, Xihu Longjing tea machine processing and manual processing coexisted. Machine frying greatly improved the production efficiency of Xihu Longjing tea, but the taste and aroma of Xihu Longjing tea were still inferior to the quality of traditional hand-frying. Gong et al studied the effects of the whole-hand craft, the machine-hand craft and the whole-machine tea craft on the quality of spring (high-grade) Longjing tea, especially the combination of machine and hand in the shape of the product has reached even more than hand-fried high-grade Longjing tea quality [3]. Shen et al also compared the effects of all-craft craft, machine-hand combination craft and all-machine craft on the quality of high-grade Xihu Longjing tea [4]. The formation of tea quality was affected by many factors, including fresh leaf variety [5,6,7], green pot fixing method [8], Hui pot fixing method [9,10,11,12,13] , as well as brewing conditions [14,15], evaluation fixing methods [16,17], et al. The fixing was the key link in the formation of the flavor quality of Xihu Longjing tea. It is mainly used to stir-fry at high temperature so as to make the fresh grass gas in the raw material of the fresh leaves evaporate and the color and shape of the tea basically take shape, the water content of tea was reduced from 75% to 25% -30% . The research on the quality difference mechanism of Xihu Longjing tea based on different machine processing and manual processing methods was relatively weak.
The flavor quality of green tea was largely dependent on the fresh leaf materials and the processing method employed, with the latter being of particular importance [18]. In this context, the “non-fermenting” processing of green tea included spreading, fixing, shaping (rolling), and drying, and relies on the heats of the fixing and drying processes, in addition to the mechanical force of the shaping process, to promote and convert the volatile and non-volatile metabolites present in the tea leaves to produce the unique flavor quality. To date, significant efforts had been made to explore the changes in the conventional quality components during green tea processing [19]. However, previous studies were mainly focused on detecting and analyzing the total amounts of these substances, which was not sufficiently comprehensive since different types of amino acids have different tastes [20], and different groups of flavonoid glycosides and flavonoid aglycones, which differed in their impact on the color and taste of green tea [21]. However, the evolution of the various components of Xihu Longjing tea and the conversion among non-volatile metabolites in ways of different machine processing and manual processing remained largely unexplored. The hypothesis of this research was that non-volatile components variations are present in ways of different machine processing and manual processing of Xihu Longjing.
In recent years, metabolomic methods had been widely used in the field of tea research to comprehensively analyze the non-volatile components present in tea. Examples include metabolomics combined with proteomics to analyze the influence of withering on the formation of metabolites related to the taste of white tea [22], and the effect of shading on the main quality components of green tea [23]. However, the majority of these methods were based on targeted metabolite detection, wherein the coverage of detection substances was limited. Alternatively, they were based on non-targeted metabolite detection, which had a low sensitivity and a poor qualitative and quantitative accuracy, thereby resulting in falsepositive signals. In contrast, widely targeted metabolomics integrates the advantages of the nontarget and targeted metabolite detection technologies, achieved a highthroughput, and exhibited a high sensitivity and wide coverage [21]. Therefore, we considered that this new method could be applied to the comprehensive detection and analysis of the non volatile metabolites present in Xihu Longjing tea based on different processing methods.
To clarity the quality difference mechanism of Xihu Longjing tea based on different machine processing and manual processing methods, we herein employed the combination of manual and mechanical processing method, which was previously found to produce high-quality green tea. Ultraperformance liquid chromatography–tandem mass spectrometry (UPLC-MS/MS) combined with a widely targeted metabolomic method was expected to allow the extensive detection of non-volatile metabolites in the different processing method of Xihu Longjing green tea. In addition, multiple statistical analysis methods, including Principal Component Analysis(PCA), orthogonal partial least squares discrimination analysis (OPLS-DA), and heat map were used to determine the law of the dynamic evolution of non-volatile metabolites in each category, which were used to clarify the effect of different machine processing and manual processing methods on these metabolites. This study was expected to provide a theoretical reference and objective basis for the formation mechanism of high-quality Xihu Longjing green tea.
2. Materials and Methods
2.1. Materials
The raw materials of fresh tea leaves were collected from Longjing tea plantation in Xihu district, Hangzhou City, Zhejiang province.
Liquid-chromatography-grade solvents, including methanol (MeOH), acetonitrile (ACN), and ethanol were purchased from Thermo (American), and all standard samples, were purchased from Sigma-Aldrich (St. Louis, MO,). Anhydrous ethanol was purchased from Dingguo Co., Ltd (China). L-2-chlorophenylalanine was obtained from Shanghai Hengchong Biotechnology Co. , Ltd. Deionized water (DW) was purified by the Mili-Q system (Millipore, Molsheim, France).
2.2. Xihu Longjing Tea Processing Method
(1) The method 1 was that the Xihu Longjing tea fixing both by machine at first and second step(A1)
Fresh tea leaves → spreading out (leaf thickness 2 cm for 4 h at 18-23 ℃ with a relative air humidity of 58%) → first fixing by machine (210 ℃ for 4 min, 6CCB-100ZD fixing machine, Zhejiang Hongwuhuan Tea Equipment Co. , Ltd. ) →spreading cool (30 min) → second fixing by machine (170 ℃ for 4 min, 6CCB-100ZD fixing machine, Zhejiang Hongwuhuan Tea Equipment Co. , Ltd. )→ spreading cool (30 min) → dry (90 ℃ for 60 min, 6CLH-60 drying machine, Zhejiang Shangyang Machinery Co., Ltd., Shaoxing, China) → dried tea (A1).
The method 2 was that the Xihu Longjing tea fixing first step by machine and second step by hand(A2)
Fresh tea leaves → spreading out (leaf thickness 2 cm for 4 h at 18-23 ℃ with a relative air humidity of 58%) → first fixing by machine (210 ℃ for 4 min, 6CCB-100ZD fixing machine, Zhejiang Hongwuhuan Tea Equipment Co. , Ltd. ) →spreading cool (30 min) → second fixing by hand (190 ℃ for 10 min)→ spreading cool (30 min) → dry (90 ℃ for 60 min, 6CLH-60 drying machine, Zhejiang Shangyang Machinery Co., Ltd., Shaoxing, China) → dried tea (A2).
The method 3 was that the Xihu Longjing tea fixing first step by hand and second step by machine(A3)
fresh tea leaves → spreading out (leaf thickness 2 cm for 4 h at 18-23 ℃ with a relative air humidity of 58%) → first fixing by hand (200 ℃ for 10 min) →spreading cool (30 min) →second fixing by machine (170 ℃ for 4 min, 6CCB-100ZD fixing machine, Zhejiang Hongwuhuan Tea Equipment Co. , Ltd. )→ spreading cool (30 min) → dry (90 ℃ for 60 min, 6CLH-60 drying machine, Zhejiang Shangyang Machinery Co., Ltd., Shaoxing, China) → dried tea (A3).
The method 4 was that the Xihu Longjing tea fixing both by hand at first and second step (A4)
Fresh tea leaves → spreading out (leaf thickness 2 cm for 4 h at 18-23 ℃ with a relative air humidity of 58%) → first fixing by hand (200 ℃ for 10 min) →spreading cool (30 min) →second fixing by hand (190 ℃ for 10 min)→ spreading cool (30 min) → dry (90 ℃ for 60 min, 6CLH-60 drying machine, Zhejiang Shangyang Machinery Co., Ltd., Shaoxing, China) → dried tea (A4).
Each processing method of Xihu Longjing tea was repeated 3 times.
2.2. Sample Preparation and Extraction
80 mg accurately weighed sample was transferred to a 1.5 mL Eppendorf tube. Two small steel balls were added to the tube. 20 μL of L-2-chlorophenylalanine (0.3 mg/mL) dissolved in methanol as internal standard and 1 mL mixture of methanol and water (7/3, vol/vol) were added to each sample, samples were placed at -20 ℃ for 2 min. Then grinded at 60 HZ for 2 min, and the whole samples were extracted by ultrasonic for 30 min in ice-water bath, then placed at -20 ℃ for 20 min. Samples were centrifuged at 4 ℃ (13000 rpm) for 10 min prior to decanting of 150 μL supernatants from each tube were collected using crystal syringes, filtered through 0.22 μm microfilters and transferred to LC vials. The vials were stored at - 80 ℃ until LC -MS analysis.
QC were prepared by mixing aliquot of the all samples to be a pooled sample.
2.4. Waters Q-EXACTIVE Plus/Dionex U3000 UHPLC
ACQUITY UPLC I-Class system (Waters Corporation, Milford, USA) coupled with Q-EXACTIVE Mass spectrometer (Waters Corporation,Milford, USA) was used to analyze the metabolic profiling in both ESI positive and ESI negative ion modes. An ACQUITY UPLC HSS T3 column (1.8 μm, 2.1 × 100 mm) were employed in both positive and negative modes. Water and Acetonitrile 2/3(v/v), both containing 0.1% formic acid were used as mobile phases A and B, respectively. Linear gradient: 0 min, 5% B; 2 min, 5% B; 4 min, 30% B; 8 min, 50% B; 10 min, 80% B; 14 min, 100% B; 15 min, 100% B; 15.1 min, 100% B and 16 min, 100% B. The flow rate was 0.35 mL/min and column temperature was 45 ℃. All the samples were kept at 4℃ during the analysis. The injection volume was 2 μL.
The mass range was from m/z 100 to 1200. The resolution was set at 70,000 for the full MS scans and 17500 for HCD MS/MS scans. The Collision energy was set at 10, 20 and 40 eV. The mass spectrometer operated as follows: spray voltage, 3,800 V (+) and 3,000 V (−); sheath gas flow rate, 35 arbitrary units; auxiliary gas flow rate, 8 arbitrary units; capillary temperature, 320 °C; Aux gas heater temperature, 350 °C; S-lens RF level, 50.
The QCs were injected at regular intervals (every three samples) throughout the analytical run to provide a set of data from which repeatability can be assessed.
2.5. Data Preprocessing and Statistical Analysis
The original LC-MS data were processed by software Progenesis QI V2.3 (Nonlinear, Dynamics, Newcastle, UK) for baseline filtering, peak identification, integral, retention time correction, peak alignment, and normalization. Main parameters of 5 ppm precursor tolerance, 10 ppm product tolerance, and 5% product ion threshold were applied. Compound identification were based on precise mass-to-charge ratio (M/z), secondary fragments, and isotopic distribution using The Human Metabolome Database (HMDB), Lipidmaps (V2.3), Metlin, EMDB, PMDB, and self-built databases to do qualitative analysis.
The extracted data were then further processed by removing any peaks with a missing value (ion intensity = 0) in more than 50% in groups, by replacing zero value by half of the minimum value, and by screening according to the qualitative results of the compound. Compounds with resulting scores below 36 (out of 60) points were also deemed to be inaccurate and removed. A data matrix was combined from the positive and negative ion data.
The matrix was imported in R to carry out Principle Component Analysis (PCA) to observe the overall distribution among the samples and the stability of the whole analysis process. Orthogonal Partial Least-Squares-Discriminant Analysis (OPLS-DA) and Partial Least-Squares-Discriminant Analysis (PLS-DA) were utilized to distinguish the metabolites that differ between groups. To prevent overfitting, 7-fold cross-validation and 200 Response Permutation Testing (RPT) were used to evaluate the quality of the model.
Variable Importance of Projection (VIP) values obtained from the OPLS-DA model were used to rank the overall contribution of each variable to group discrimination. A two-tailed Student’s T-test was further used to verify whether the metabolites of difference between groups were significant. Differential metabolites were selected with VIP values greater than 1.0 and p-values less than 0.05.
3. Results and Discussion
3.1. Metabolite Profifiling Analysis
Compounds in the four Xihu Longjing samples were evaluated by LC-MS in MRM mode. To confirm differences in total compound contents and composition, a new LC-MS-based method widely used for metabolomics was used herein [21]. A total of 490 metabolites (3 alkaloids, 3 anthracenes, 15 benzene and substituted derivatives, 2 benzopyrans, 13 coumarins and derivatives, 128 flavonoids, 4 furanoid lignans, 16 glycosides and derivatives, 5 indoles and derivatives, 18 isocoumarins and derivatives, 4 chalcones and dihydrochalcones, 4 naphthopyrans, 3 nucleosides, 78 organic acids and derivatives, 55 organooxygen compounds, 5 phenols, 109 prenol lipids, 3 saccharolipids, 3 steroids and steroid derivatives, 17 tannins) were identified (Figure 1A). In order to view the specific differential metabolite quantity of each comparison group, the differential metabolite quantity of each comparison group was counted. The number of different metabolites was 45,104,115,69,66,90 in the A1 and A2 comparison group, A1 and A3 comparison group, A1 and A4 comparison group, A2 and A3 comparison group, A2 and A4 comparison group, and A3 and A4 comparison group, respectively (Figure 1B).
The relative content of some metabolites above A1 was higher than that of A2 in Figure 1C. such as 7-methy-1,4,5-naphthalenetriod-4-[xylosyl-(1-6-glucoside), tragopogonsaponin D, hesperidin, hovenoside D, araloside, tuberoside C, (-)-epigallocatechin 3,3’-di-gallate, theaflavate A, asperagenin, uroporphyrin Ⅲ, neoxanthin, olitorin, camellioside C, azll, achimilic acid, neomacrostemonoside D, sennoside B, agavasaponin D, araliasasponin, araliasaponin Ⅱ, camelliasaponin A1, daddzen 4’-glucuronide, 16,17-dihydro-16a, 17-dihydroxygibberellin A7 17-glucoside. However, the relative content of some metabolites below A1 was lower than that of A2, such as L-cystine, L-pipecolic acid, D-glyceraldehyde 3-phosphate, d-ipiperamide D, 5-ethyl-2-methypyridine, 2-ethyl-5-methypyridine, N-trifluoroacetyladriamycinol, liensinine, O-acetylserine, goyaglycoside h, niazimin A, N-acetylornithine, 2-hydroxycinnamic acid, parcathamin, hebevinoside vill, 3’,4,4’-trihydroxypulvione, nebignoside, camellenodiol, L-coprine, adenine, cernuine.
The relative content of some metabolites above A1 was higher than that of A2 In Figure 1D, such as rhoifolin, hovenoside D, hesperidin, ceposide D, kaempferol 3-arabinofuranoside 7-rhamnofuranoside, dibuthy phthalate, (-)-epigallocatechin 3,3’-di-gallate, 6’’-4-hydroxycinnamoyl)astragalin 4’-glucoside, quercetin 3-(2G-rhamnosygentiobioside), kamempferol 3-[2’’-(p-coumaroyglucosyl)rhamnoside], kaempferide 5-glucoside-7-glucuronide, biorobin, agvasaponin D, Congmuyenoside B. However, the relative content of some metabolites below below A1 was lower than that of A3. The relative content of some metabolites above A1 was higher than that of A4 in Figure 1E, such as kaempferol 3-[2’’-(p-coumaroylglucosyl)rhamnoside], hovenoside D, ceposide D, theaflavate A, oolongtheanin, (-)-epigallocatechin-3,3’−di−gallate, orientaloside. However, the relative content of some metabolites below below A1 was lower than that of A4.
The relative content of some metabolites above A2 was higher than that of A3 in Figure 1F, such as dipiperamide D, kaempferol 3-(2’’’-feruloylsophoroside) 7-cellobioside, N−Trifluoroacetyladriamycinol, lyciumoside IX, 3-O-p-Coumaroylquinic acid. However, the relative content of some metabolites below below A2 was lower than that of A3. The relative content of some metabolites above A2 was higher than that of A4 in Figure 1G, such as luteolin 7−[E−feruloyl−(−>2)−glucuronyl−(1−>2)−glucuronide] 4’−glucuronide, phenethyl 6−galloylglucoside, dipiperamide D, castamollissin, d−Vacciniin. However, the relative content of some metabolites below below A2 was lower than that of A4.
The relative content of some metabolites above A3 was higher than that of A4 in Figure 1H, such as anhydrocinnzeylanine, epigallocatechin−(4beta−>8)−epicatechin 3-O-gallate, 3,3’−Digalloylprocyanidin B2, (-)-epiafzelechin 3-gallate, (+)−gallocatechin, oolongtheanin, (-)-trans-carveol, uridine diphosphate glucose, oridine 5’−monophosphate, orientaloside, dehydrophytosphingosine, pSF−A, delphinidin 3−sambubioside, glutathione, ellagic acid, schizotenuin F, isomelitric acid A, cyanidin 3-sambubioside, 5’-Methylthioadenosine, isovitexin 7-(6’’’-sinapoylglucoside) 4’-glucoside. However, the relative content of some metabolites below below A3 was lower than that of A4.
According to the results of the comparison of total metabolites and two metabolites, there were differences in the types and contents of metabolites, especially flavonoids, furanoid lignans, glycosides and derivatives, organic acids and derivatives and organooxygen compounds.
3.2. Differential Metabolite Analysis Based on PCA
PCA is an unsupervised mode of data statistics, can restore the sample of the real state of metabolism. If there is an obvious trend of separation in the PCA score graph, it indicates that there is a significant difference in the composition of metabolites among the samples [24]. In the PCA plot of four tea process method samples and QC sample (Figure 2A), PC1 and PC2 were 22.3% and 14.7%, respectively. In the PCA plot of comparing two tea processing techniques sample (Figure 2B–G), PC1 of A1 and A2, A1 and A3, A1 and A4, A2 and A3, A2 and A4, A3 and A4 were 32.2%, 30.8%, 35.3%, 32.8%, 35.6% and 32.7%, respectively, and PC2 of A1 and A2, A1 and A3, A1 and A4, A2 and A3, A2 and A4, A3 and A4 were 25%, 26.9%, 26.6%, 23.4%, 23.1% and 23.6%, respectively,.
Overall, the PCA plot containing the samples from the four different tea process method treatments indicates that there were significant difference in the metabolites in each sample. Sample QC could be distinguished from the A1, A2, A3 and A4 samples. The A1 sample overlapped with the A2 sample, A2 sample overlapped with the A4 sample, A3 sample overlapped with the A4 sample, suggesting that metabolites in the A1 and A2 samples, A2 and A4 samples, A3 and A4 samples were similar.
3.3. Differential Metabolite Analysis via OPLS-DA
OPLS-DA analysis was a multivariate statistical analysis method with supervised pattern recognition, which can effectively eliminate irrelevant effects and screen for differential metabolites [25]. The OPLS-DA was a good method to identify potential markers of the different tea processing method. Good predictability (Q2) and strong goodness of fit (R2) of the OPLS-DA models was observed for comparisons between A1 and A2 (Q2 = 0.462, R2 = 0.991, Figure 4A), as well as between A1 and A3 (Q2 = 0.253, R2 = 0.989, Figure 4B), A1 and A4 (Q2 = 0.212, R2= 0.996, Figure 4C), A2 and A3 (Q2 = 0.392, R2 = 0.997, Figure 4D), A2 and A4 (Q2 = 0.412, R2 = 0.993, Figure 4E), A3 and A4 (Q2 = 0.536, R2 = 0.995, Figure 4F). In the OPLS-DA models, A1 and A2 samples, A2 and A4 samples, A3 and A4 samples were clearly separated (Figure 3).
Figure 3.
OPLS-DA of the relative differences metabolites in the four Xihu Longjing tea processing samples.
Figure 3.
OPLS-DA of the relative differences metabolites in the four Xihu Longjing tea processing samples.
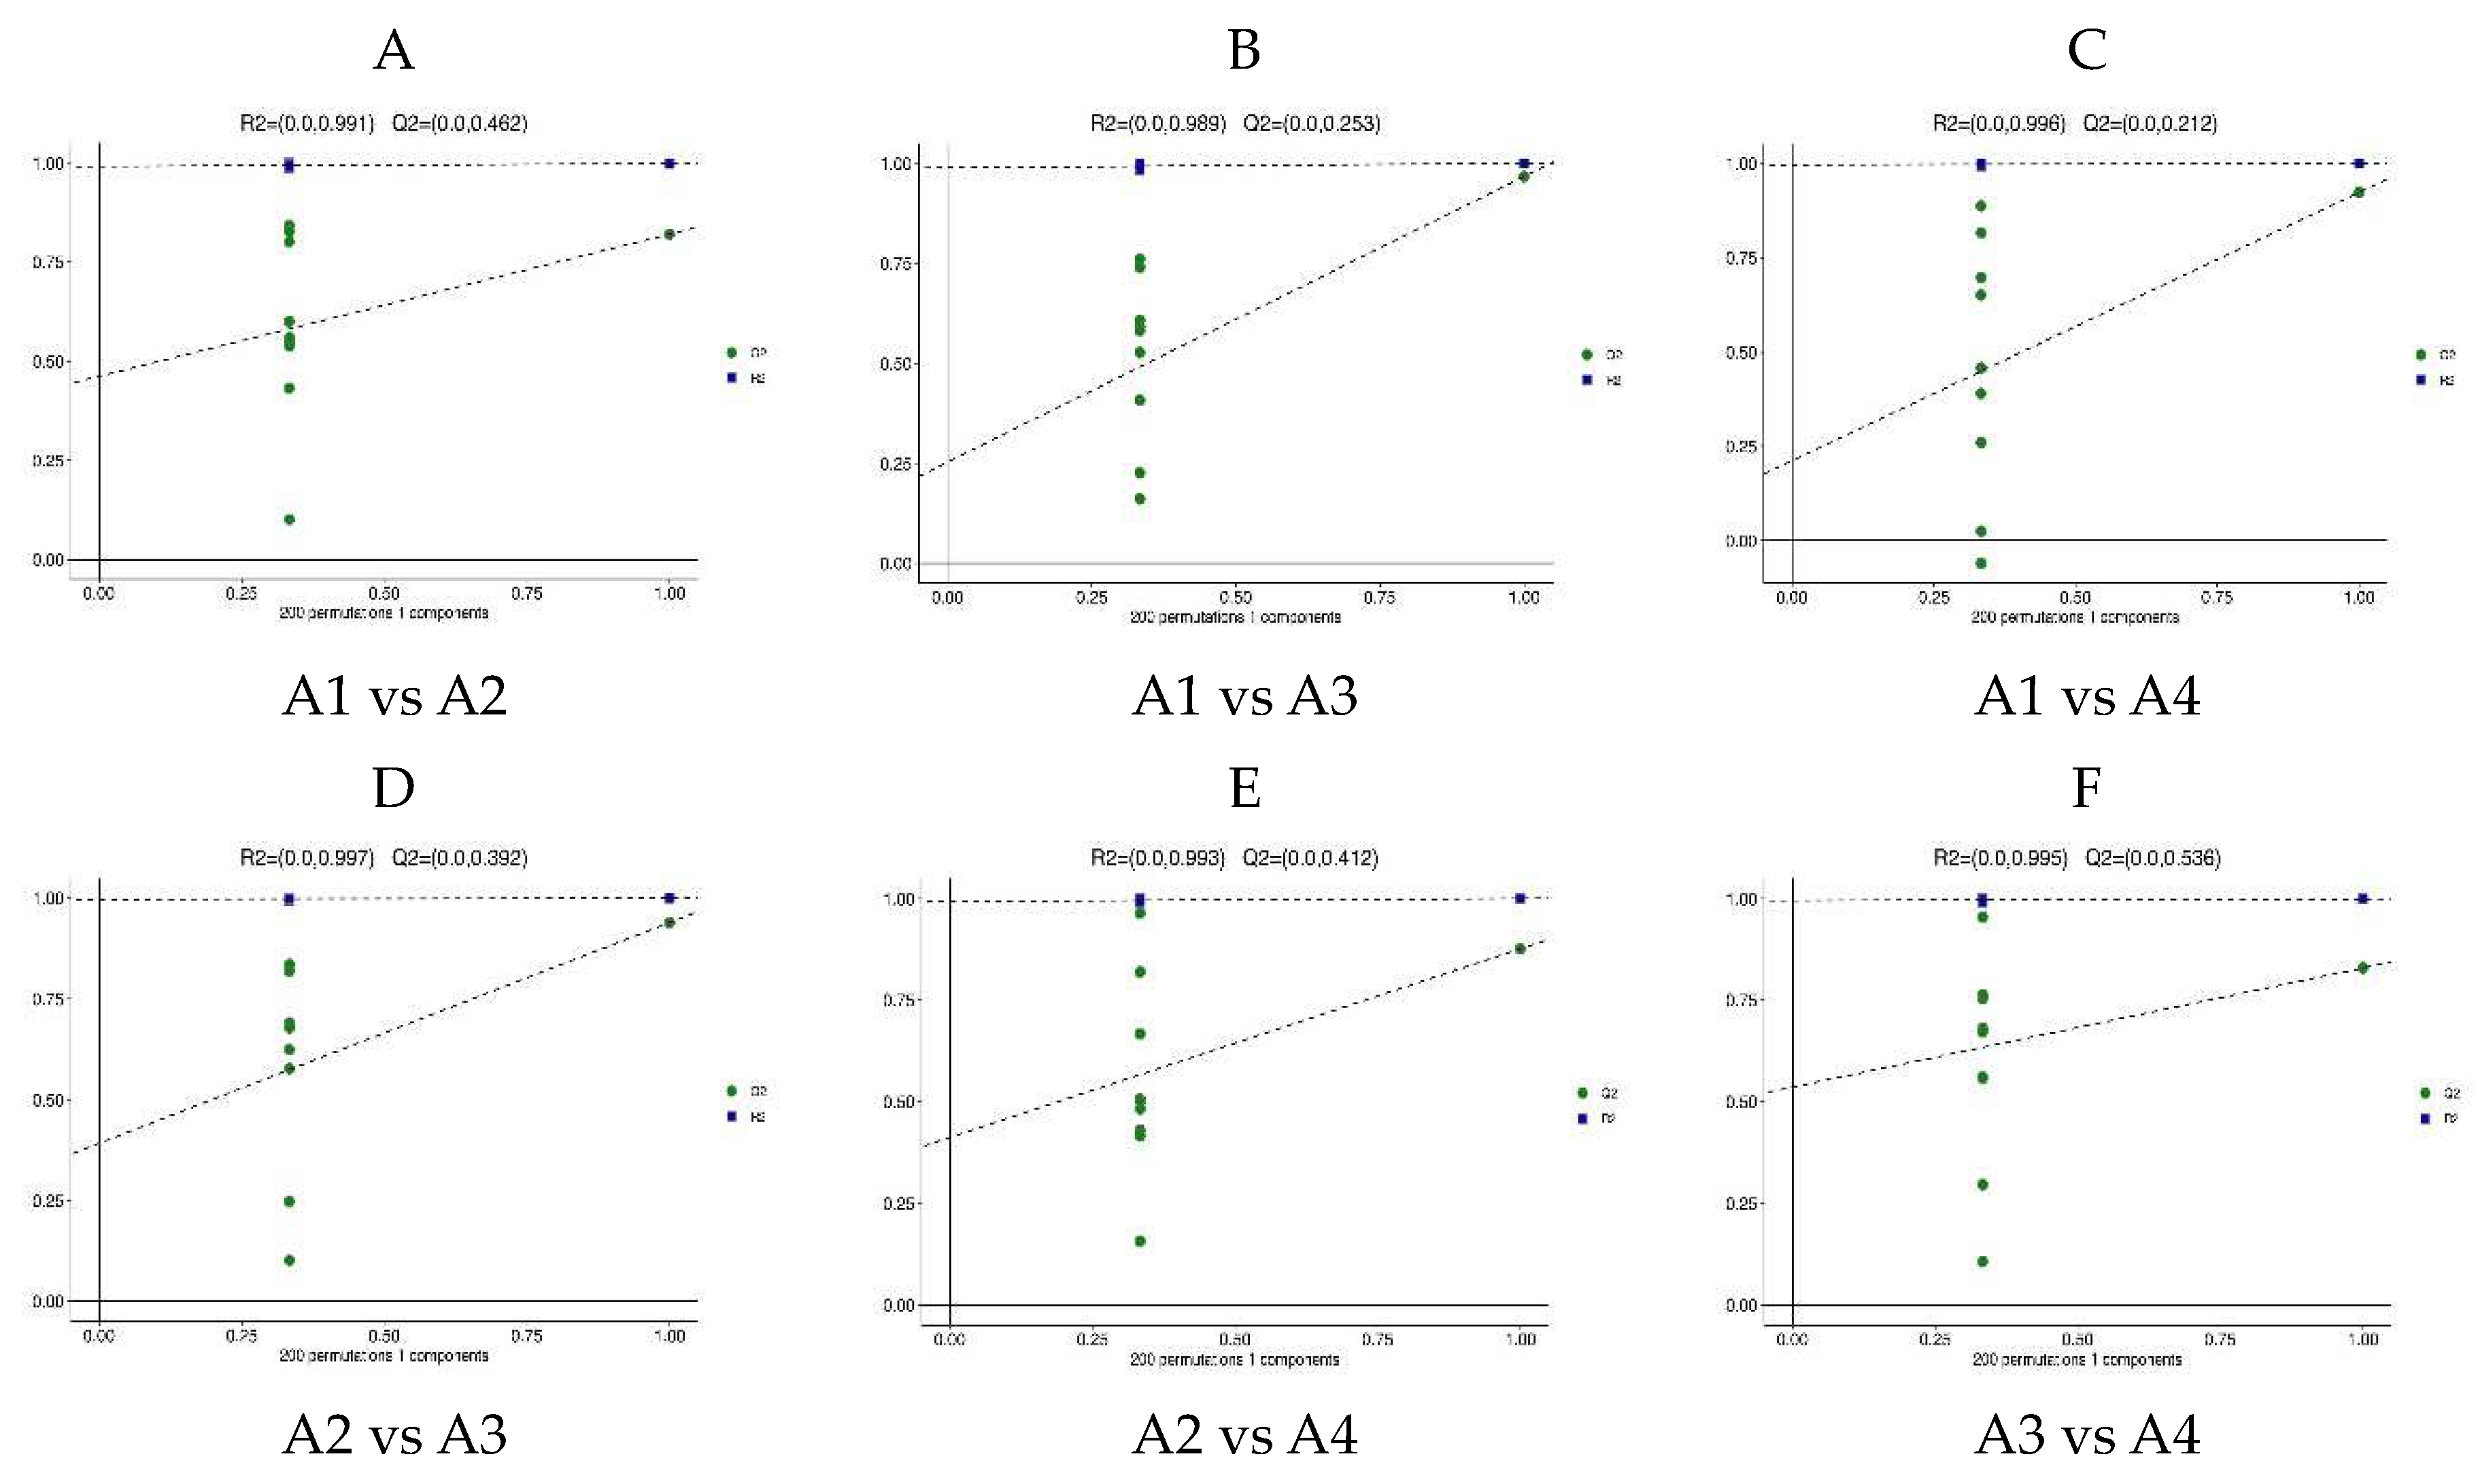
Figure 4.
Volcano plots of the relative differences of the four Xihu Longjing tea processing samples.
Figure 4.
Volcano plots of the relative differences of the four Xihu Longjing tea processing samples.
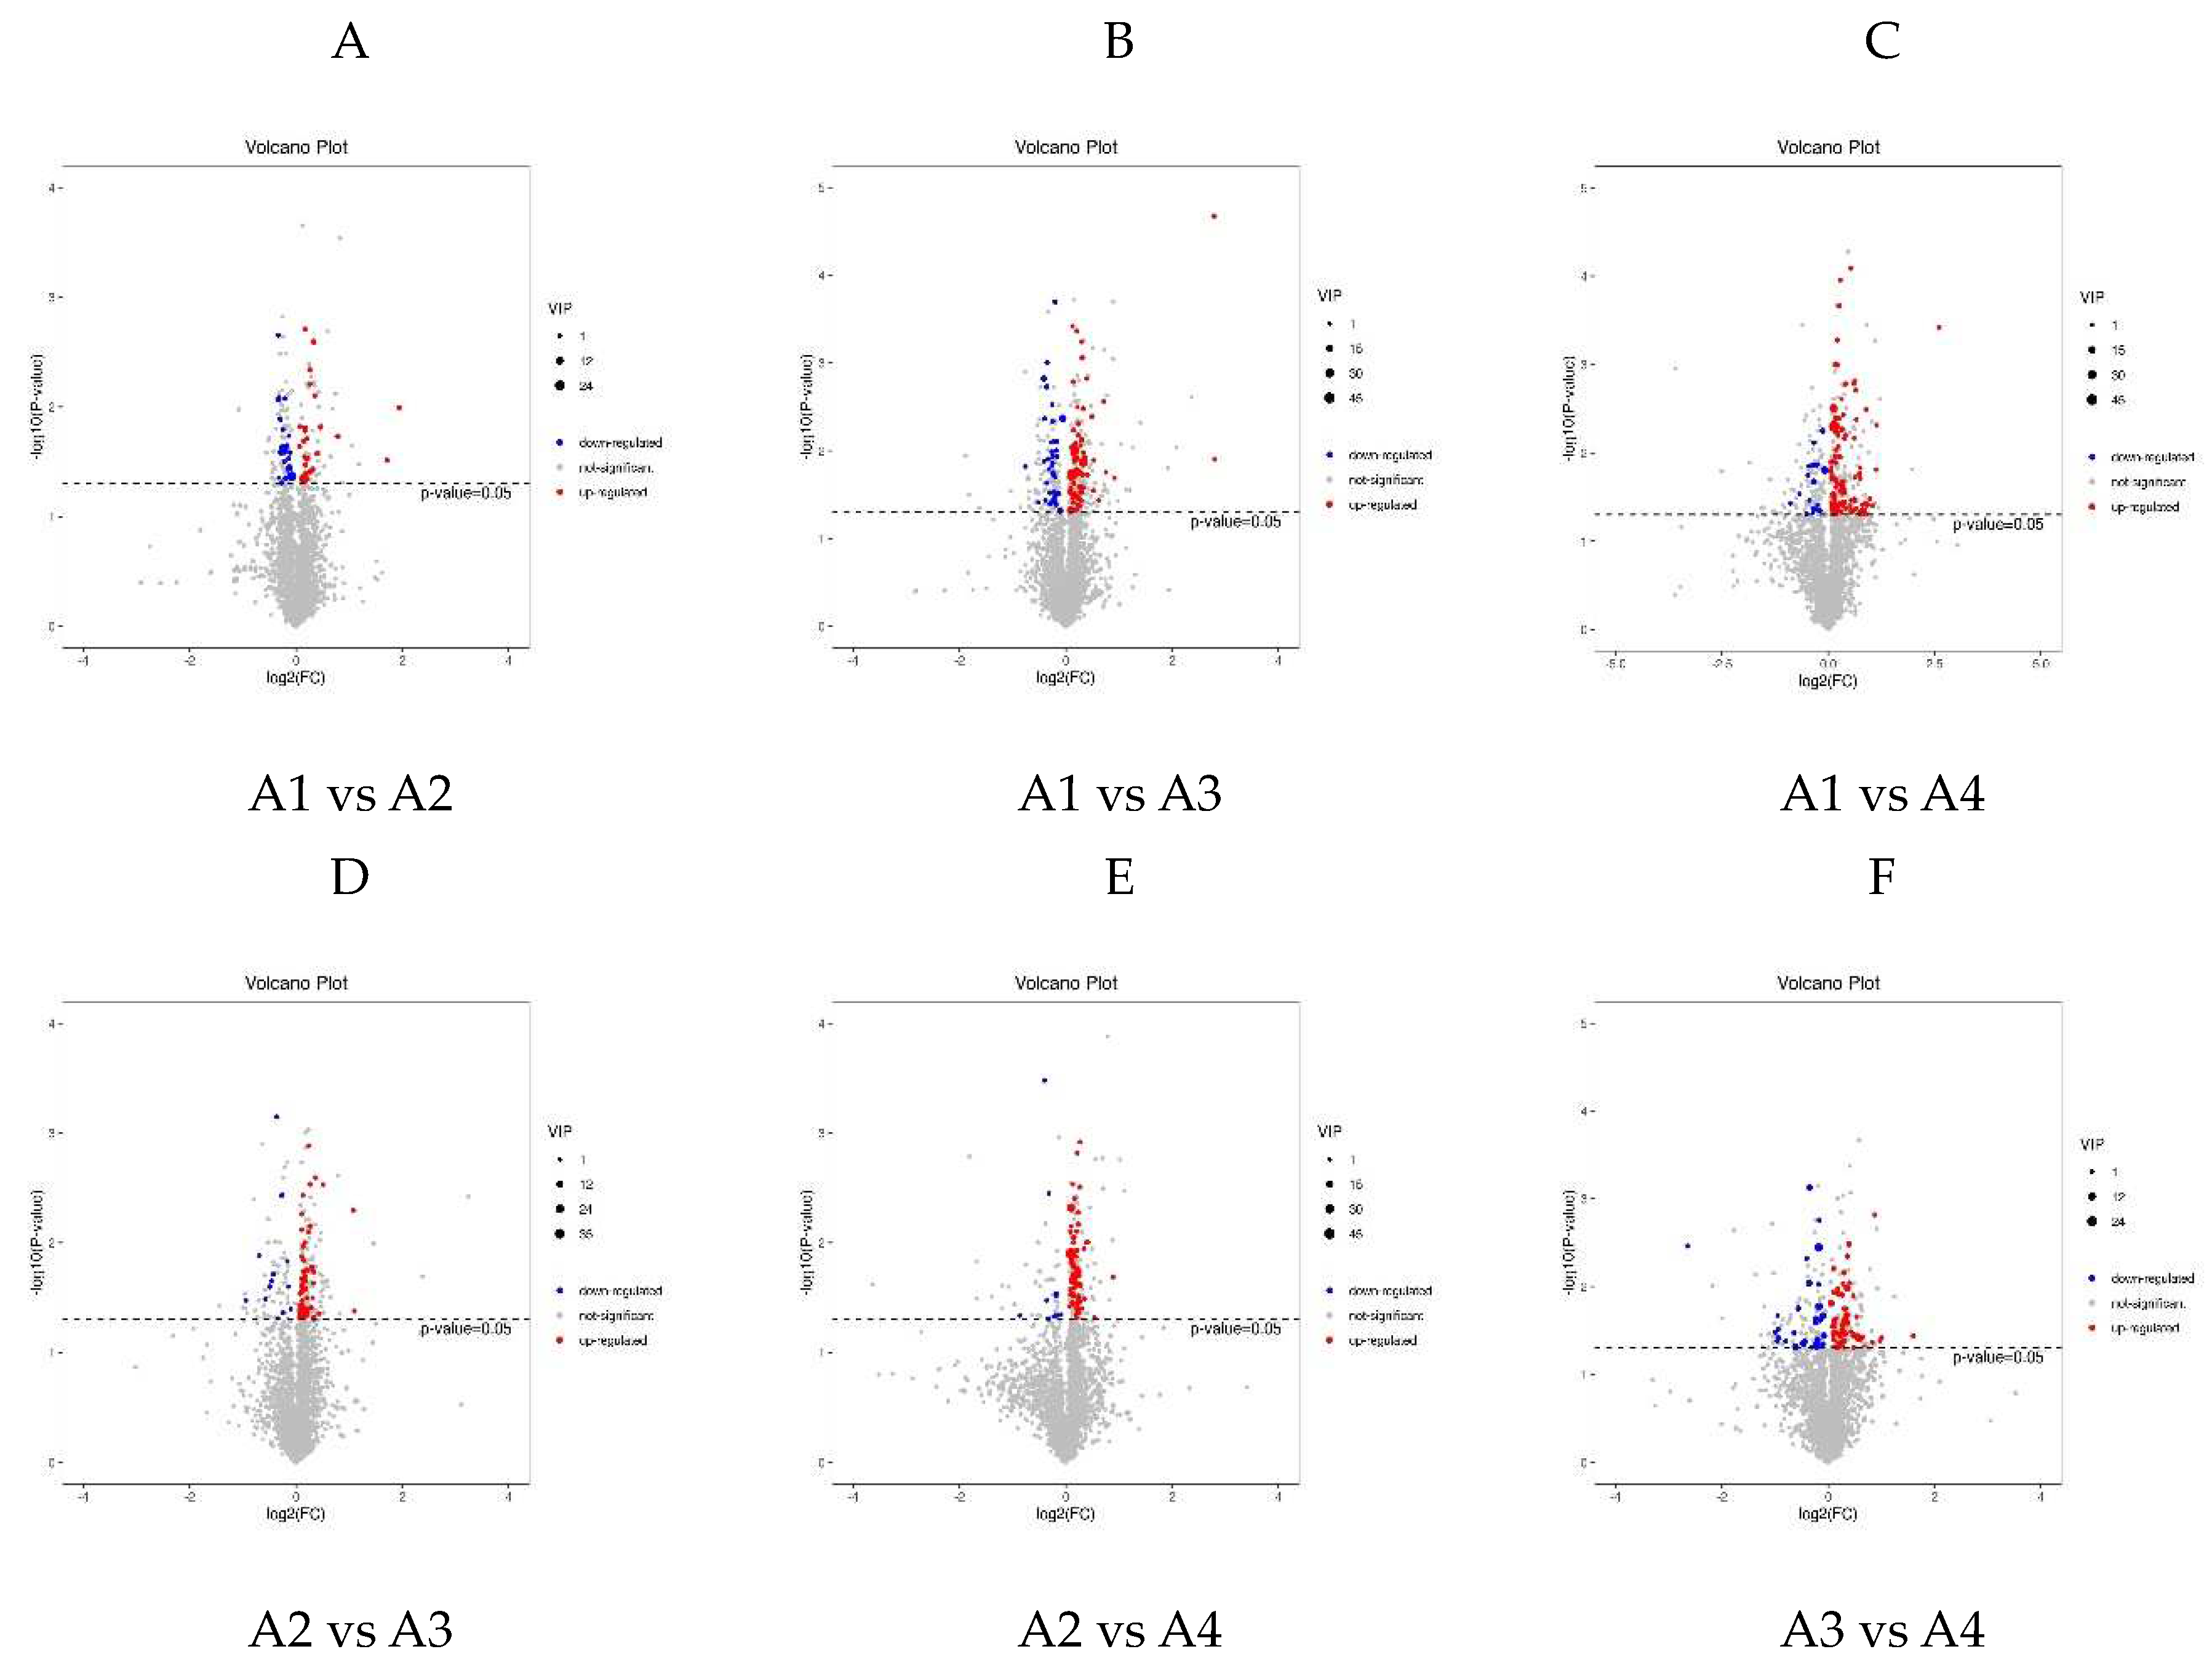
To gain an in-depth understanding of the metabolite differences between A1 and A2, A1 and A3, A1 and A4, A2 and A3, A3 and A4, differential metabolite screening was performed with all 492 metabolites identified in accordance with the fold change and the variable importance in projection (VIP) scores. The criteria for significant differences included P value > 0.5 and a VIP score of ≥ 1. The results are illustrated using volcano plots (Figure 4A–H). There were 401 differential metabolites (172 up-regulated and 229 down-regulated) between the A1 and A2 (Figure 4A); 340 (up-regulated 204 and 136 down-regulated) between the A1 and A3 (Figure 5B); 261 (163 up-regulated and 98 down-regulated) between the A1 and A4 (Figure 4C). Similarly, 319 (219 up-regulated and 100 down-regulated) between the A2 and A3 (Figure 4D); 332 differential metabolites (237 up-regulated and 95 down-regulated) between the A2 and A4 (Figure 4E), 357 (204 upregulated and 153 downregulated) between the A3 and A4 (Figure 4F).
3.4. Differential Metabolite Association HEATMAP
The aim of differential metabolite association analysis was to look at the concordance of metabolites with the trend of metabolite change, and to analyze the correlation between individual metabolites by calculating the Plzeň correlation coefficient between all metabolites [26]. Metabolite correlations often reveal a synergy of changes between metabolites, such as a positive correlation for the same trend of change of a certain metabolite and a negative correlation for the opposite trend of change of a certain metabolite. The difference in red and blue color distribution in Figure 5 shows the synergy of changes between metabolites in each comparison group. There was a positive correlation between flavonoid metabolism and amino acid metabolism. However, there was a negative correlation between flavonoid metabolism and amino acid metabolism (Figure 5). And, There was a positive correlation between prenol lipids metabolism and tannin metabolism. However, there was a negative correlation between prenol lipids metabolism and tannin metabolism (Figure 5). Similarly, There was a positive correlation between prenol lipids metabolism and flavonoid metabolism. However, there was a negative correlation between prenol lipids metabolism and flavonoid metabolism (Figure 5).
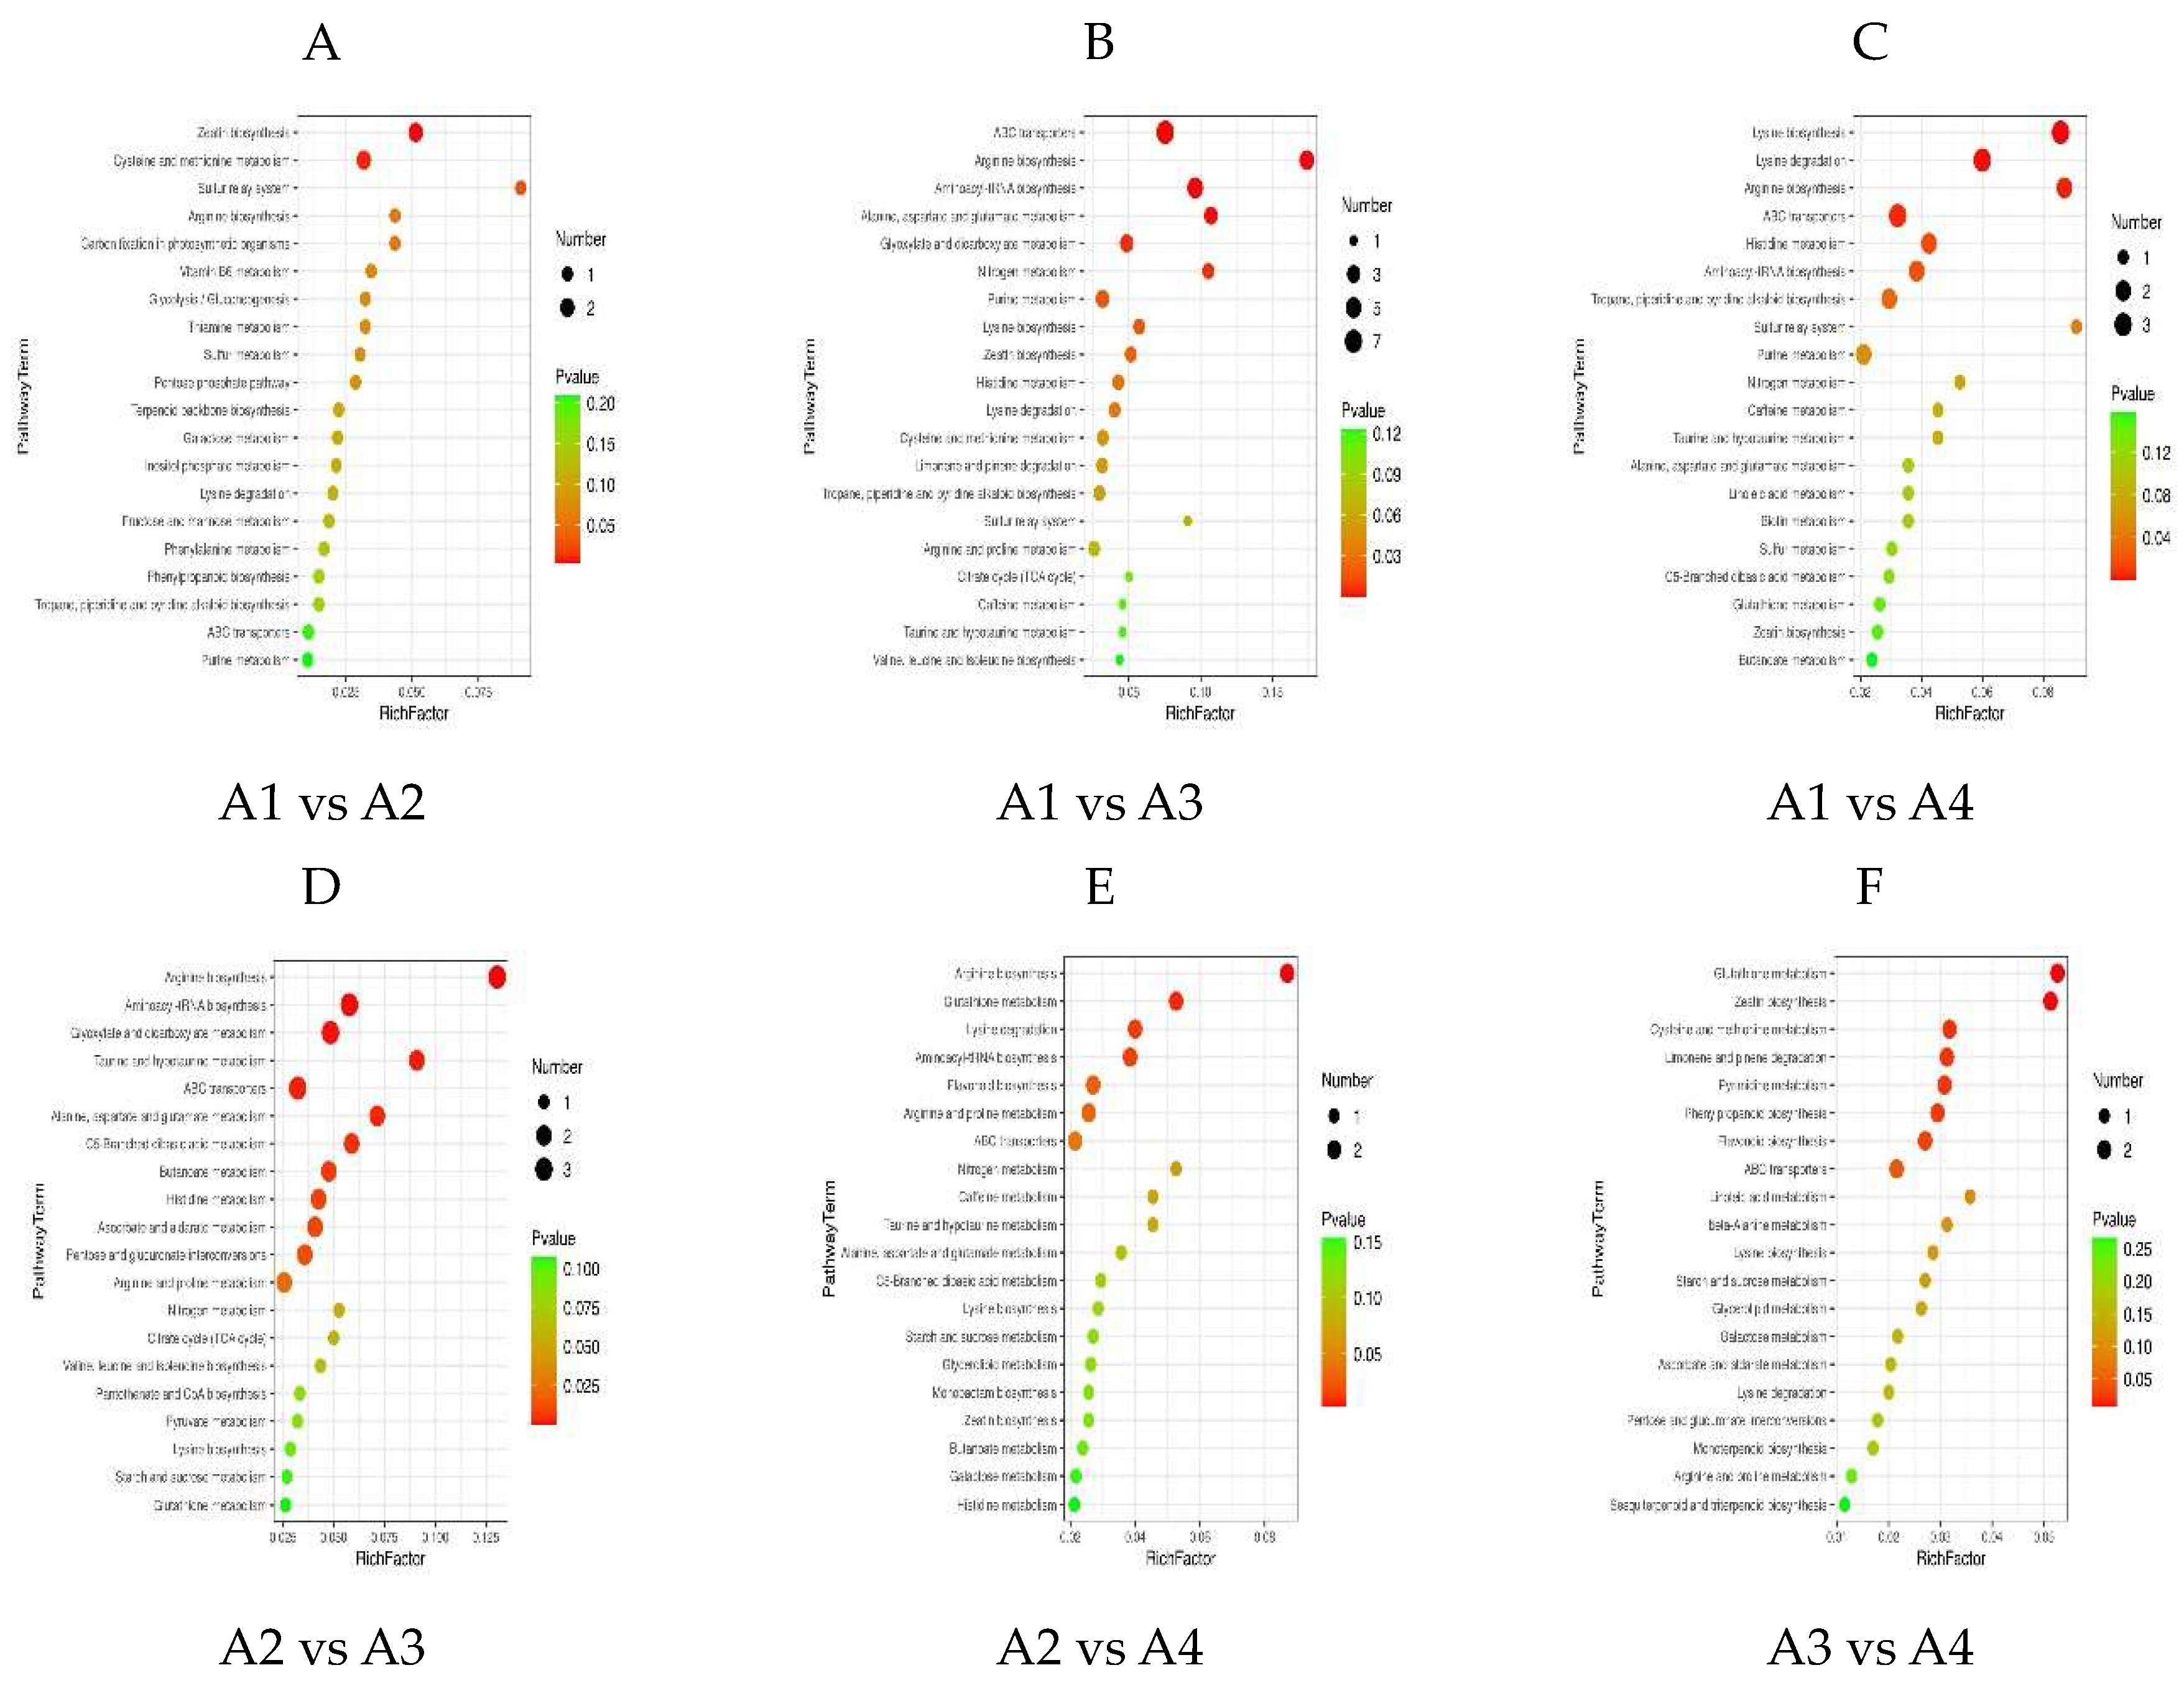
3.5. Differential Metabolic Pathways among the Xihu Longjing Tea Processing Samples
KEGG (Kyoto Encyclopedia of Genes and Genomes) is a database for the systematic analysis of gene function and genome information, which contains a lot of useful information [28]. The different metabolites of the four tea processing methods samples were mapped to the Kyoto Encyclopedia of Genes and Genomes (KEGG) database (http://www.genome.jp/kegg/) to obtain detailed pathway information. The KEGG classification results indicated that the differential metabolites from the comparison groups A1 and A2 being compared were associated with zeatin biosynthesis, cysteine and methionine metabolism, sulfur relay system (Figure 6A). The KEGG classification results indicated that the differential metabolites from the comparison groups A1 and A3 being compared were associated with ABC transporters, arginine biosynthesis, aminoacyl-tRNA biosynthesis, alanine, aspartate and glutamate metabolism, nitrogen metabolism, purine metabolism(Figure 6B). The KEGG classification results indicated that the differential metabolites from the comparison groups A1 and A4 being compared were asso”Iate’ with lysine biosynthesis, lysine degradation, arginine biosynthesis, ABC transporters, histidine metabolism, aminoacyl-tRNA biosynthesis, tropane, piperidine and pyridine alkaloid biosynthesis(Figure 6C). The most frequently represented outcomes were “metabolic pathways” : 13/46, 28.26%, A1 vs A2; 31/105, 29.52%, A1 vs A3; 24/116, 20.69%, A1 vs A4; 17/70, 24.29%, A2 vs A3; 20/67, 29.85%, A2 vs A4; 22/91, 24.18%, A3 vs A4.
The KEGG classification results indicated that the differential metabolites from the comparison groups A2 and A3 being compared were associated with arginine biosynthesis, aminoacyl-tRNA biosynthesis, glyoxylate and dicarboxylate metabolism, taurine and hypotaurine metabolism, ABC transporters, alanine, aspartate and glutamate metabolism, C5-Branched dibasic acid metabolism, butanoate metabolism, histidine metabolism, ascorbate and aldarate metabolism, pentose and glucuronate interconversions (Figure 6D). The KEGG classification results indicated that the differential metabolites from the comparison groups A2 and A3 being compared were associated with arginine biosynthesis, aminoacyl-tRNA biosynthesis, glyoxylate and dicarboxylate metabolism, taurine and hypotaurine metabolism, ABC transporters, alanine, aspartate and glutamate metabolism, C5-Branched dibasic acid metabolism, butanoate metabolism, histidine metabolism, ascorbate and aldarate metabolism, pentose and glucuronate interconversions (Figure 6E).The KEGG classification results indicated that the differential metabolites from the comparison groups A3 and A4 being compared were associated with arginine biosynthesis, glutathione metabolism, lysine degradation, aminoacyl-tRNA biosynthesis, flavonoid biosynthesis, arginine and proline metabolism and ABC transporters (Figure 6F).
4. Conclusion
In this study, In order to clarify the effects of different stages of machine processing and manual processing on the flavor chemical components of Xihu Longjing tea, metabolomics was used to analyze metabolites in samples of Xihu Longjing tea processing with four different methods. A total of 490 metabolites (3 alkaloids, 3 anthracenes, 15 benzene and substituted derivatives, 2 benzopyrans, 13 coumarins and derivatives, 128 flavonoids, 4 furanoid lignans, 16 glycosides and derivatives, 5 indoles and derivatives, 18 isocoumarins and derivatives, 4 chalcones and dihydrochalcones, 4 naphthopyrans, 3 nucleosides, 78 organic acids and derivatives, 55 organooxygen compounds, 5 phenols, 109 prenol lipids, 3 saccharolipids, 3 steroids and steroid derivatives, 17 tannins) were detected and identified in Xihu Longjing tea processing.
Xihu Longjing green tea is a well-known green tea in China and even in the world. China Xihu Longjing tea has high aroma, fresh and mellow taste and good flavor quality [29]. It is very popular with consumers all over the world. In addition, it is a health food because of its metabolites, particularly anti-oxidation, anti-cancer, anti-inflammation, anti-aging, reducing blood lipids and controlling blood sugar compounds, such as flavonoids, tannin and other substances [30,31,32,33,34,35]. The quality of Xihu Longjing tea produced by different processing method was quite different, especially by machine or by hand. The traditional Xihu Longjing was processed by hand, but at present, there were two ways to process Xihu Longjing, such as machine tea and hand tea. However, there were few reports on metabolite characterization and metabolic pathway in machine and manual processing of Xihu Longjing tea, which limited the precision of quality control of Xihu Longjing. Our study used the PCA and OPLS-DA to distinguish the different metabolism profiles of four different Xihu Longjing tea processing methods. There was a significant difference in the composition of metabolites among the four Xihu Longjing tea processing methods samples. The PC1 and PC2 of four tea process method samples and QC sample were 22.3% and 14.7%, respectively. There were differences in the types and contents of metabolites, especially flavonoids, furanoid lignans, glycosides and derivatives, organic acids and derivatives and organooxygen compounds. There was a positive correlation between flavonoid metabolism and amino acid metabolism. However, there was a negative correlation between flavonoid metabolism and amino acid metabolism, which had the same trend as prenol lipids metabolism, tannin. This study has improved understanding of metabolite differences in relation to flavor quality and drinking value affecting by Xihu Longjing green tea processing.
Author Contributions
Hongchun Cui: Investigation, Writing - original draft, Formal analysis, Visualization. Yuxiao Mao: Investigation, Formal analysis, Data curation. Zhao Yun: Investigation, Data curation. Haitao Huang: Data curation, Methodology. Junfeng Yin: Revise, Project administration. Jizhong Yu: Review, Project administration, Funding acquisition. Jianyong Zhang: Conceptualization, Investigation, Writing - original draft, Review, Project administration, Supervision.
Acknowledgment
The work is supported by the China Hangzhou Agricultural and Social Development Scientific Research Key Project (202203A06), Hangzhou Science and Technology Commissioner Project (20231127), the China national key research and development program (2021YFD1601105), the China Agriculture Research System of MOF and MARA (CARS-19), the Innovation Project for Chinese Academy of Agricultural Sciences(2021-2025).
Conflicts of Interest
The authors declare that they have no known competing financial interests or personal relationships that could have appeared to influence the work reported in this paper.
References
- Sun, J. Y., Feng, X. N., Lyu, C., Zhou, S., Liu, Z. X. Effects of different processing methods on the lipid composition of hazelnut oil: a lipidomics analysis. Food Sci. Hum. Wellness 2022, 11: 427-435. [CrossRef]
- Guo, Y. Q., Yang, X. T., Wang, H. L., Yang. X. F., Su, X. Q., Kong, J. H., Cheng, Y. L., Yao, W. R., Qian, H. Study on the establishment of quality discrimination model of Longjing 43 green tea (Camellia sinensis(L.) Kuntze). J APPL RES MED AROMA 2022, 31: 100389-100396. [CrossRef]
- Gong, S. Y., Mao, Z. F., Lu, D. B., Zhang, Y. B., Qian, X. D., et al. Effect of processing technology on quality of spring (high-grade) longjing tea. China Tea 2011, 12: 8-11.
- Shen, H. Effects of different processing methods on the quality of high-grade WestLake Longjing tea-comparison from sensory evaluation results. Tea Proc. in China 2010, 3:33-35.
- Wang, H., Gong, S. Y, Wei, M. X., et al. Effects of tea varieties and processing technology on the quality of changxing bamboo shoot tea. Chinese Tea 2014, 3:18-21.
- Zhang, C, Claire, L., Chao, Y., et al. Antioxidant capacity and major polyphenol composition of teas as affected by geographical location, plantation elevation and leaf grade.Food Chem. 2018, 244:109-119.
- Wang, L. Y., Wei, K., Cheng, H., et al.Geographical tracing of Xihu Longjing tea using high performance liquid chromatography. Food Chem. 2014, 146:98-103. [CrossRef]
- Jin, J., Shao, Z. Q., Chang, L. M. Discussion on the processing technology of Longjing tea automatic continuous production line with different defoliation methods . Tea, 2017, 43(3) :157-160.
- Xia, J. R., Xu, L. Y., Yang, Q., et al. Analysis of Longjing tea mechanism technology. Tea Proc. in China, 2016, 1: 20-23.
- Jiang, B. F. Research and application of new semi-continuous processing technology of Longjing tea. Agri. Sci. and Tech. in Shanghai 2016, 2:21-22.
- Shi, D. L, Lu, D. B., Jin, J. Small-scale processing mode and technology integration of Longjing tea. Chinese Tea 2015, 5: 21-22.
- Chen, F, Zou, X. W. A brief analysis of the reasons for the formation of the quality of West Lake Longjing tea. Tea Proc. in China 2011, 3: 22,27-30.
- Wang, D. B. Xu, J., Ru, L. J., et al. Reasons for quality defects of longjing tea and improvement methods. Chinese Tea 2019, 3:46-48.
- Shi, D. L, Yu, J. Z., Liu, X, H., et al. Study on the effect of different technology and different pot method on the quality of longjing tea. J. Southwest Normal University (natural science edition) 2010, 35(5):173-177.
- Kang, M. L., Xue, X. C., Ling, J. G. Optimization of processing parameters of longjing tea with summer and autumn tea. Sci. and tech. in the Food Industry 2007, 28(12):145-147.
- Ge, Y. T., Sheng, L. F., Gao, L. H., et al. Identification of key control points in Longjing tea mechanism process based on leaf temperature monitoring. Zhejiang Agri. Sci. 2019, 60(3): 425-426, 436.
- Han, Y. C., Chen, H. J., Gao, H. Y., et al. Effect of soaking conditions on antioxidant properties of West Lake Longjing and correlation analysis. Chinese Journal of Food 2018,18(10):128-136.
- Yin. J. F., Xu, Y. Q., Chen, G. S., et al. Effects of different types of drinking water on flavor and main quality components of WestLake Longjing tea. Chinese Tea 2018, 5:21-26.
- Chen, Q., Zhao, J., Guo, Z., et al. Determination of caffeine content and main catechins contents in green tea (Camellia sinensis L.) using taste sensor tech nique and multivariate calibration. J FOOD COMPOS ANAL 2010, 23(4): 353-358. [CrossRef]
- Chen, Q. , Zhao, J., & Vittayapadung, S. Identification of the green tea grade level using electronic tongue and pattern recognition. FOOD RES INT 2008, 41(5): 500-504. [CrossRef]
- Wang, Y. J.,Kan, Z. P., Henry, J. T., Ling, T. J., Ho, C. T., Li, D. Y., Wan, X. C. Impact of Six Typical Processing Methods on the Chemical Composition of Tea Leaves Using a Single Camellia sinensis Cultivar, Longjing 43. J. Agric. Food Chem. 2019, 67, 5423−5436. [CrossRef]
- Li, P.; Dai, W.; Lu, M.; Xie, D.; Tan, J.; Yang, C.; Zhu, Y.; Lv, H.; Peng, Q.; Zhang, Y.; Guo, L.; Ni, D.; Lin, Z. Metabolomic analysis reveals the composition differences in 13 Chinese tea cultivars of different manufacturing suitabilities. J. Sci. Food Agric. 2018, 98, 1153− 1161. [CrossRef]
- Dai, W.; Xie, D.; Lu, M.; Li, P.; Lv, H.; Yang, C.; Peng, Q.; Zhu, Y.; Guo, L.; Zhang, Y.; Tan, J.; Lin, Z. Characterization of white tea metabolome: Comparison against green and black tea by a nontargeted metabolomics approach. Food Res. Int. 2017, 96, 40−45. [CrossRef]
- Davosir, D., Sola, I. Membrane permeabilizers enhance biofortification of Brassica microgreens by interspecific transfer of metabolites from tea (Camellia sinensis). Food Chem. 2023, 420: 1-11. [CrossRef]
- Qi, B. R., Zhang, Y. Y., Ren, D. Y. Fu Brick Tea Alleviates Constipation via Regulating the Aquaporins-Mediated Water Transport System in Association with Gut Microbiota. J. Agric. Food Chem. 2023, 71(8): 3862-3865. [CrossRef]
- Wang, J., & Wei, Z. The classification and prediction of green teas by elector chemical response data extraction and fusion approaches based on the combination of e-nose and e-tongue. RSC ADV 2015, 5(129): 106959–106970.
- Xu, L., Yan, X., et al. Combining Electronic tongue array and chemometrics for discriminating the specific geographical origins of green tea. J ANAL METHODS CHEM 2013, 3: 1-5.
- Yu, P., Yeo, A. S. L., Low, M. Y., et al. Identifying key non-volatile com pounds in ready-to-drink green tea and their impact on taste profile. Food Chem. 2014, 155: 9-16.
- Ma, G., Zhang, Y., Zhang, J., et al. Determining the geographical origin of Chinese green tea by linear discriminant analysis of trace metals and rare earth elements: taking Dongting Biluochun as an example. Food Control 2016, 59: 714-720. [CrossRef]
- Chen, B. H., Hsieh, C. H., Tsai, S. Y., Wang, C. Y., & Wang, C. C. Anticancer effects of epigallocatechin-3-gallate nanoemulsion on lung cancer cells through the activation of AMP-activated protein kinase signaling pathway. SCI REP-UK 2020,10, 5163-5173. [CrossRef]
- Chen, Z. G., Duan, J. W., Diao, Y. P., Chen, Y. Liang, X. Y., Li, H. Y., et al. ROS-responsive capsules engineered from EGCG-Zinc networks improve therapeutic angiogenesis in mouse limb ischemia. BIOACT MATER 2021,6:1-11. [CrossRef]
- Dai, W. Z., Ruan, C. C., Zhang, Y. M., Wang, J. J., Shao, Z. H., ……, Liang, J. Bioavailability enhancement of EGCG by structural modification and nano delivery: A review.J FUNCT FOODS 2020, 65: 103732-103740.
- Dong, X. W., Tang, Y. M., Zhan, C. D., Wei, G. H. Green tea extract EGCG plays a dual role in Aβ42 protofibril disruption and membrane protection: A molecular dynamic study. CHEM PHYS LIPIDS 2021, 234:105024-105034. [CrossRef]
- Nikoo, M., Regenstein, J. M., Gavlighi, H. A. Antioxidant and antimicrobial activities of (-)-epigallocatechin-3-gallate (EGCG) and its potential to preserve the quality and safety of foods. COMPR REV FOOD SCI F 2018,17, 732-753. [CrossRef]
- Sun, X. B., Wu, X. J., Chen, X.Y., Guo, R., Kou, Y. X., Li, X. J., …, Wu, Y. Casein-maltodextrin maillard conjugates encapsulation enhances the antioxidative potential of proanthocyanidins: An in vitro and in vivo evaluation. Food Chem. 2021, 346, 128952-128959.
- Wang, Q., Cao, J., Yu, H., Zhang, J. H., Yuan, Y. Q., Shen, X. R., Li, C.The effects of EGCG on the mechanical, bioactivities, cross-linking and release properties of gelatin film. Food Chem. 2019, 271, 204-210.
Figure 1.
Heat map visualization and color of the four Xihu Longjing tea processing samples.
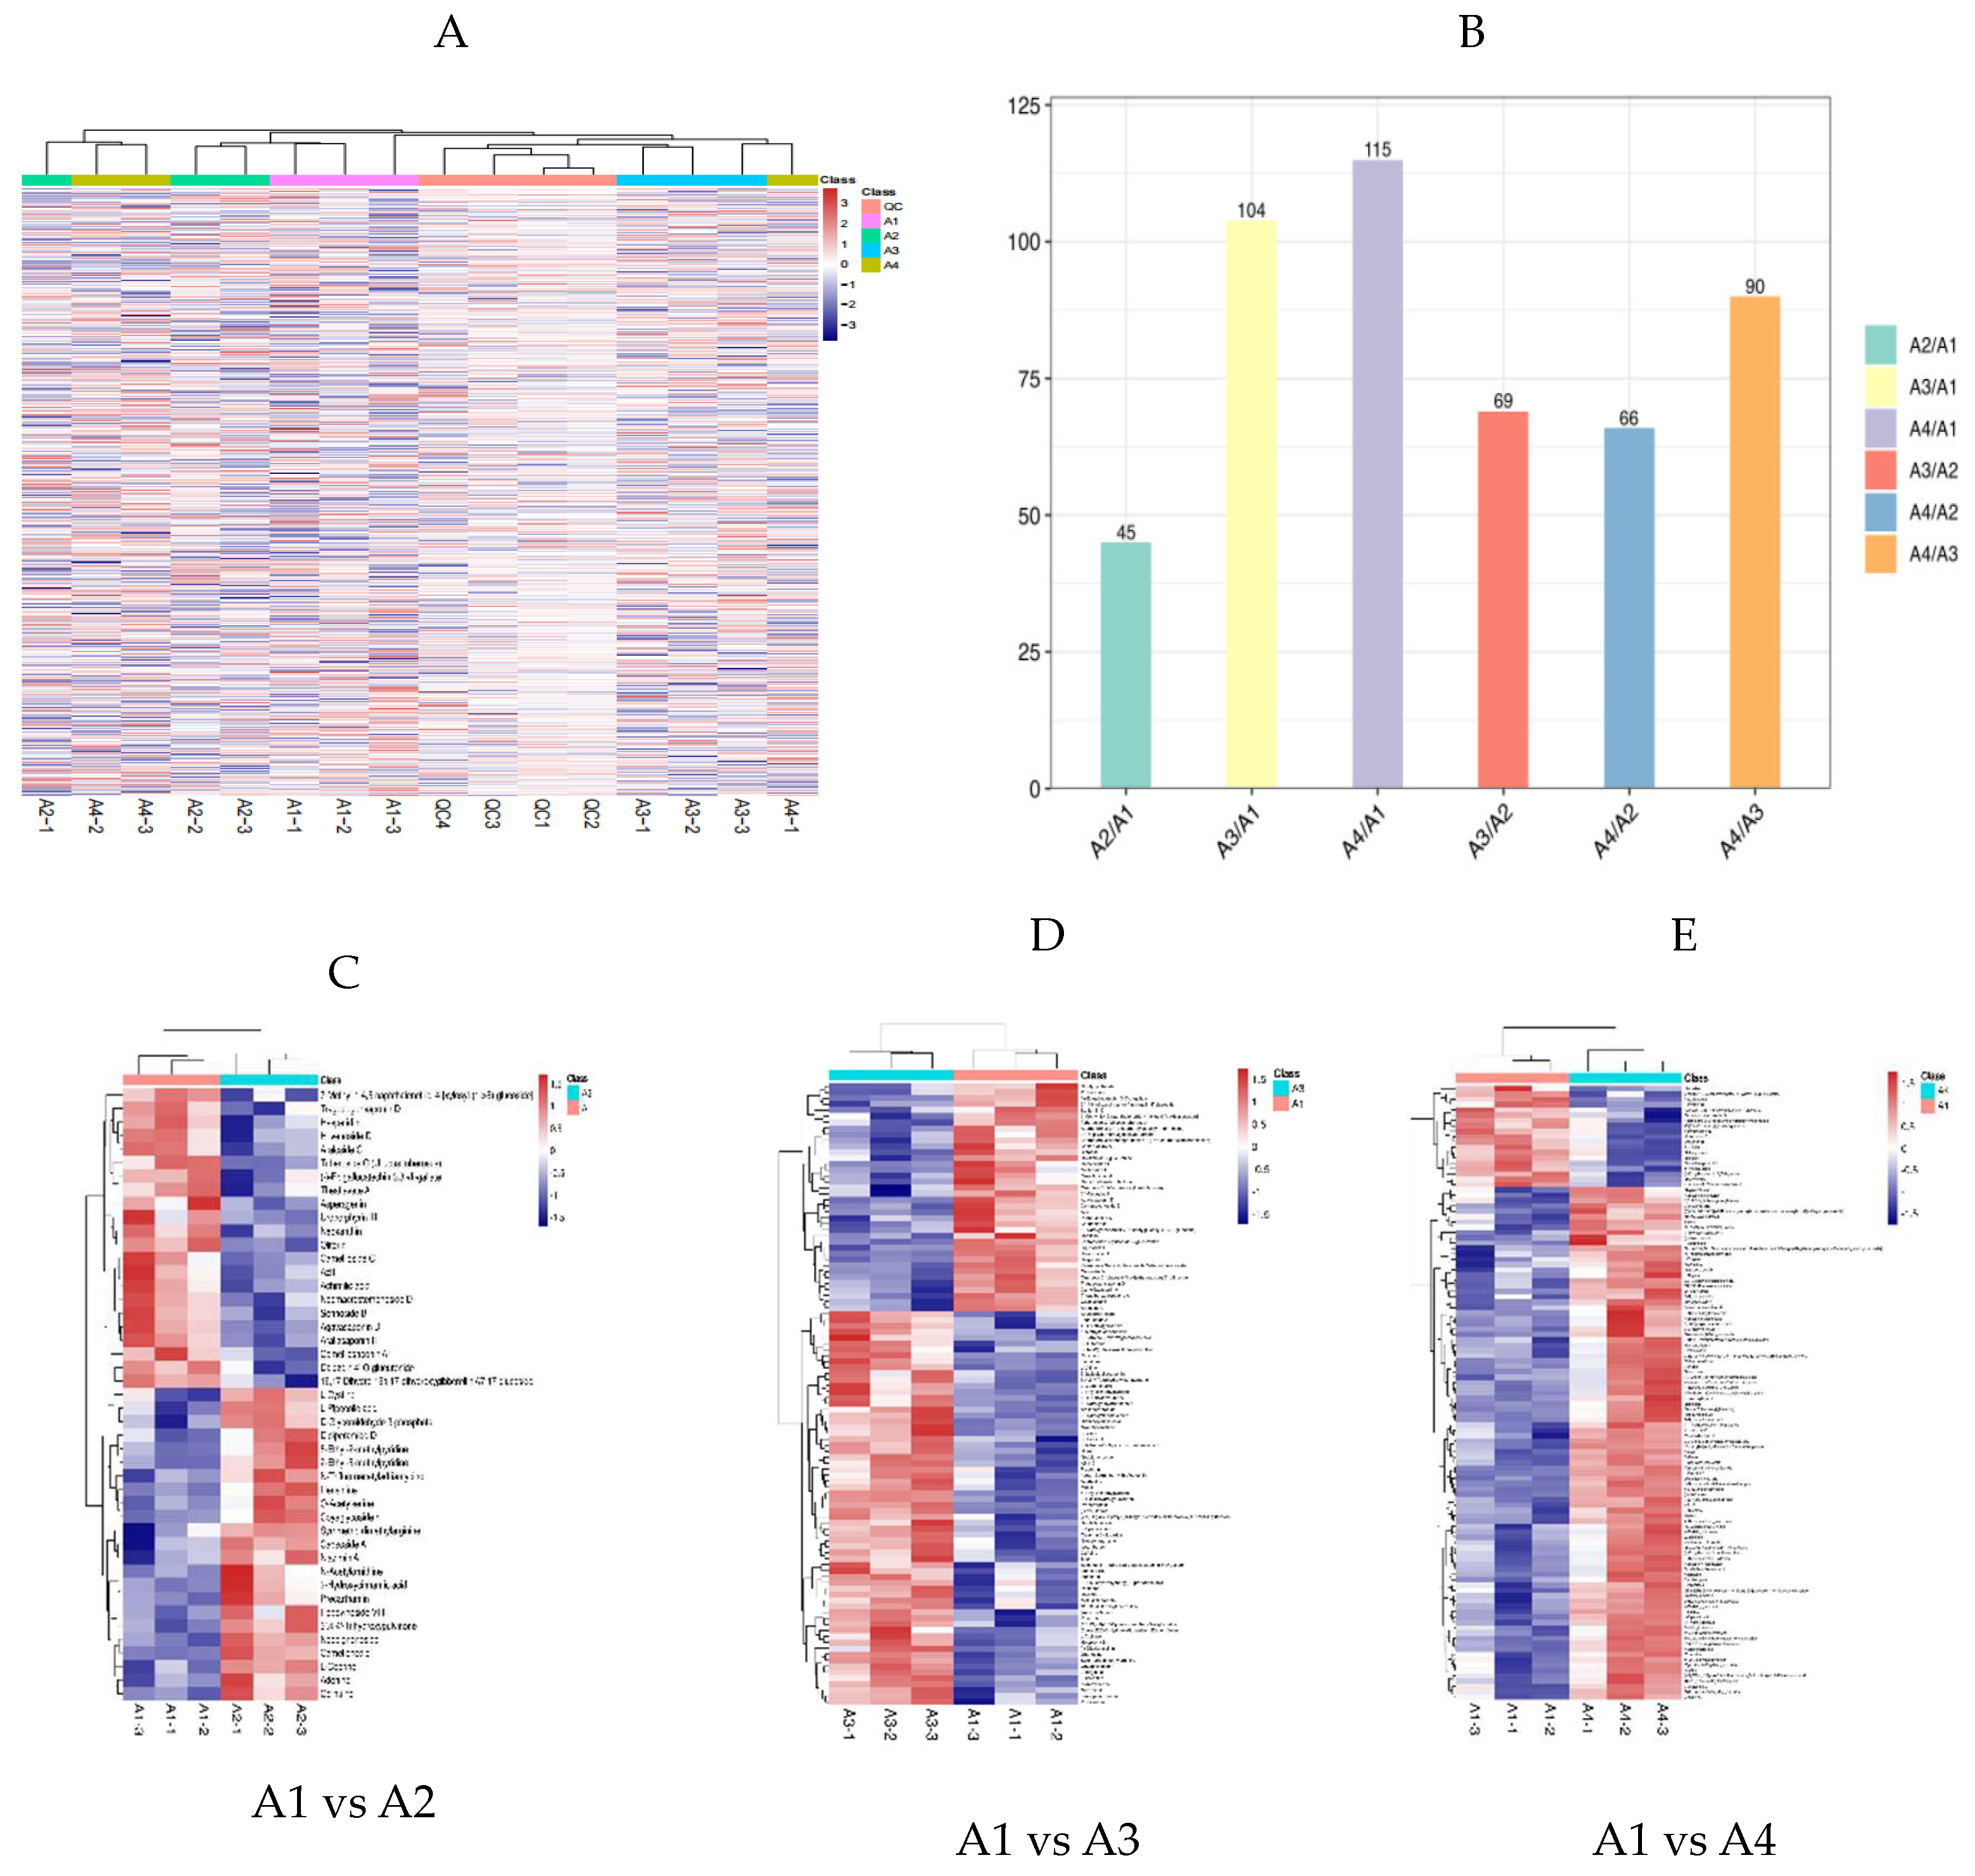
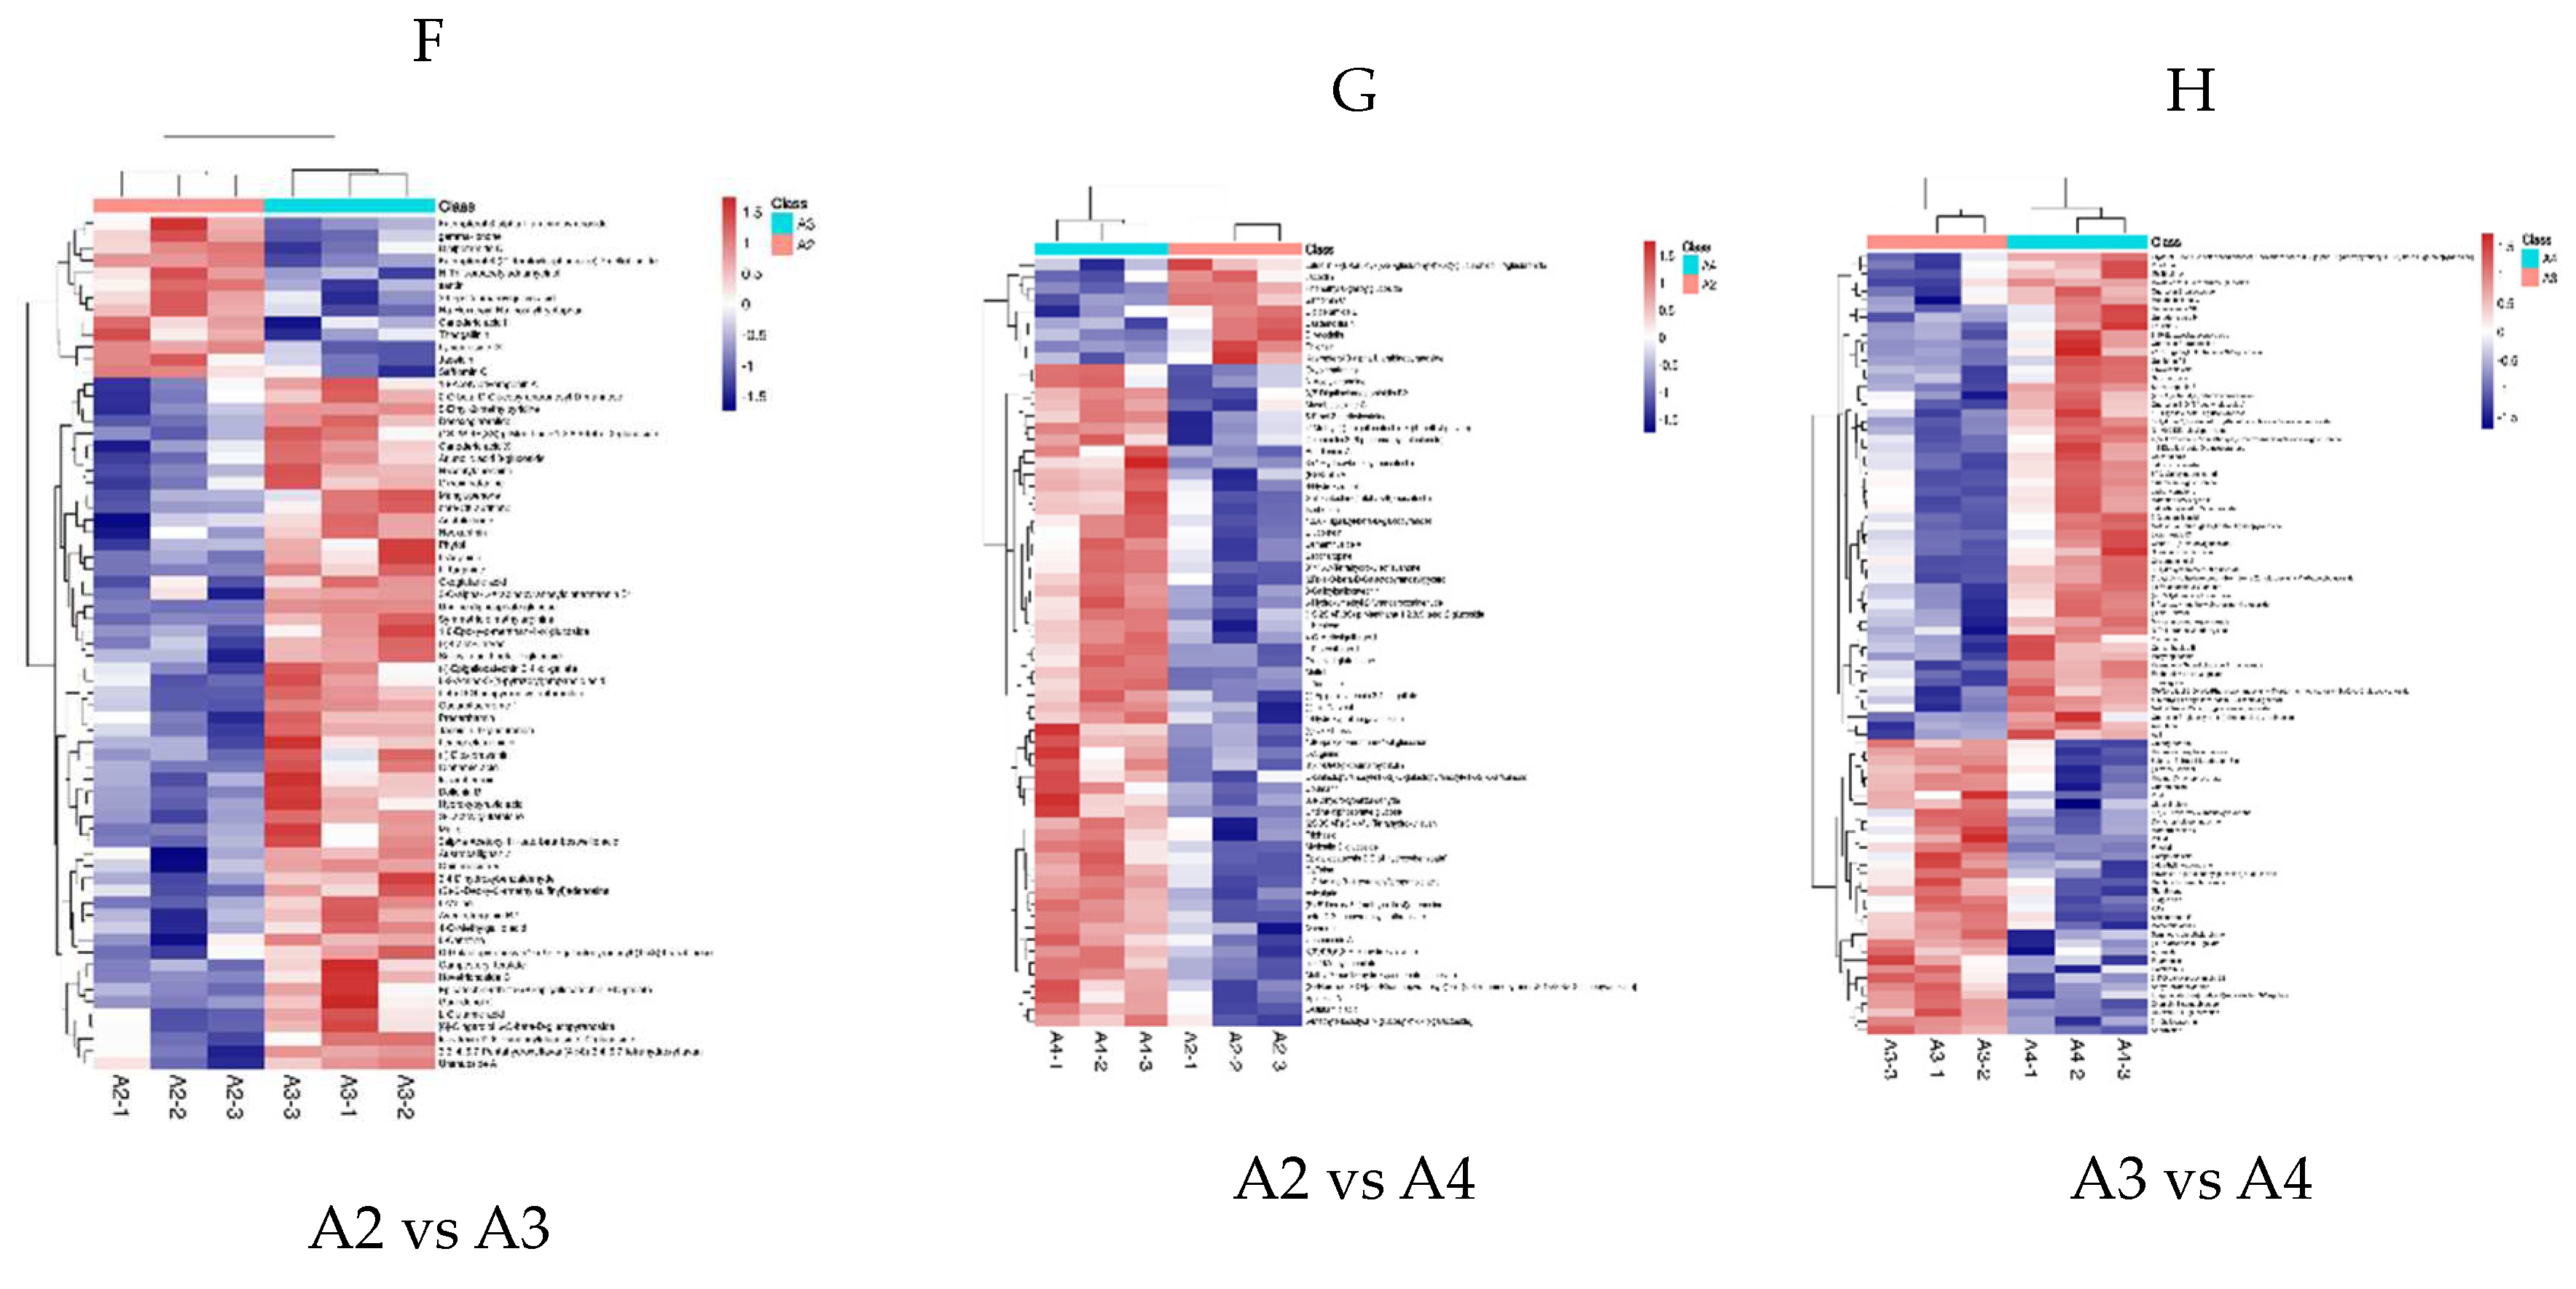
Figure 2.
PCA of the relative differences metabolites in the four Xihu Longjing tea processing samples.
Figure 2.
PCA of the relative differences metabolites in the four Xihu Longjing tea processing samples.
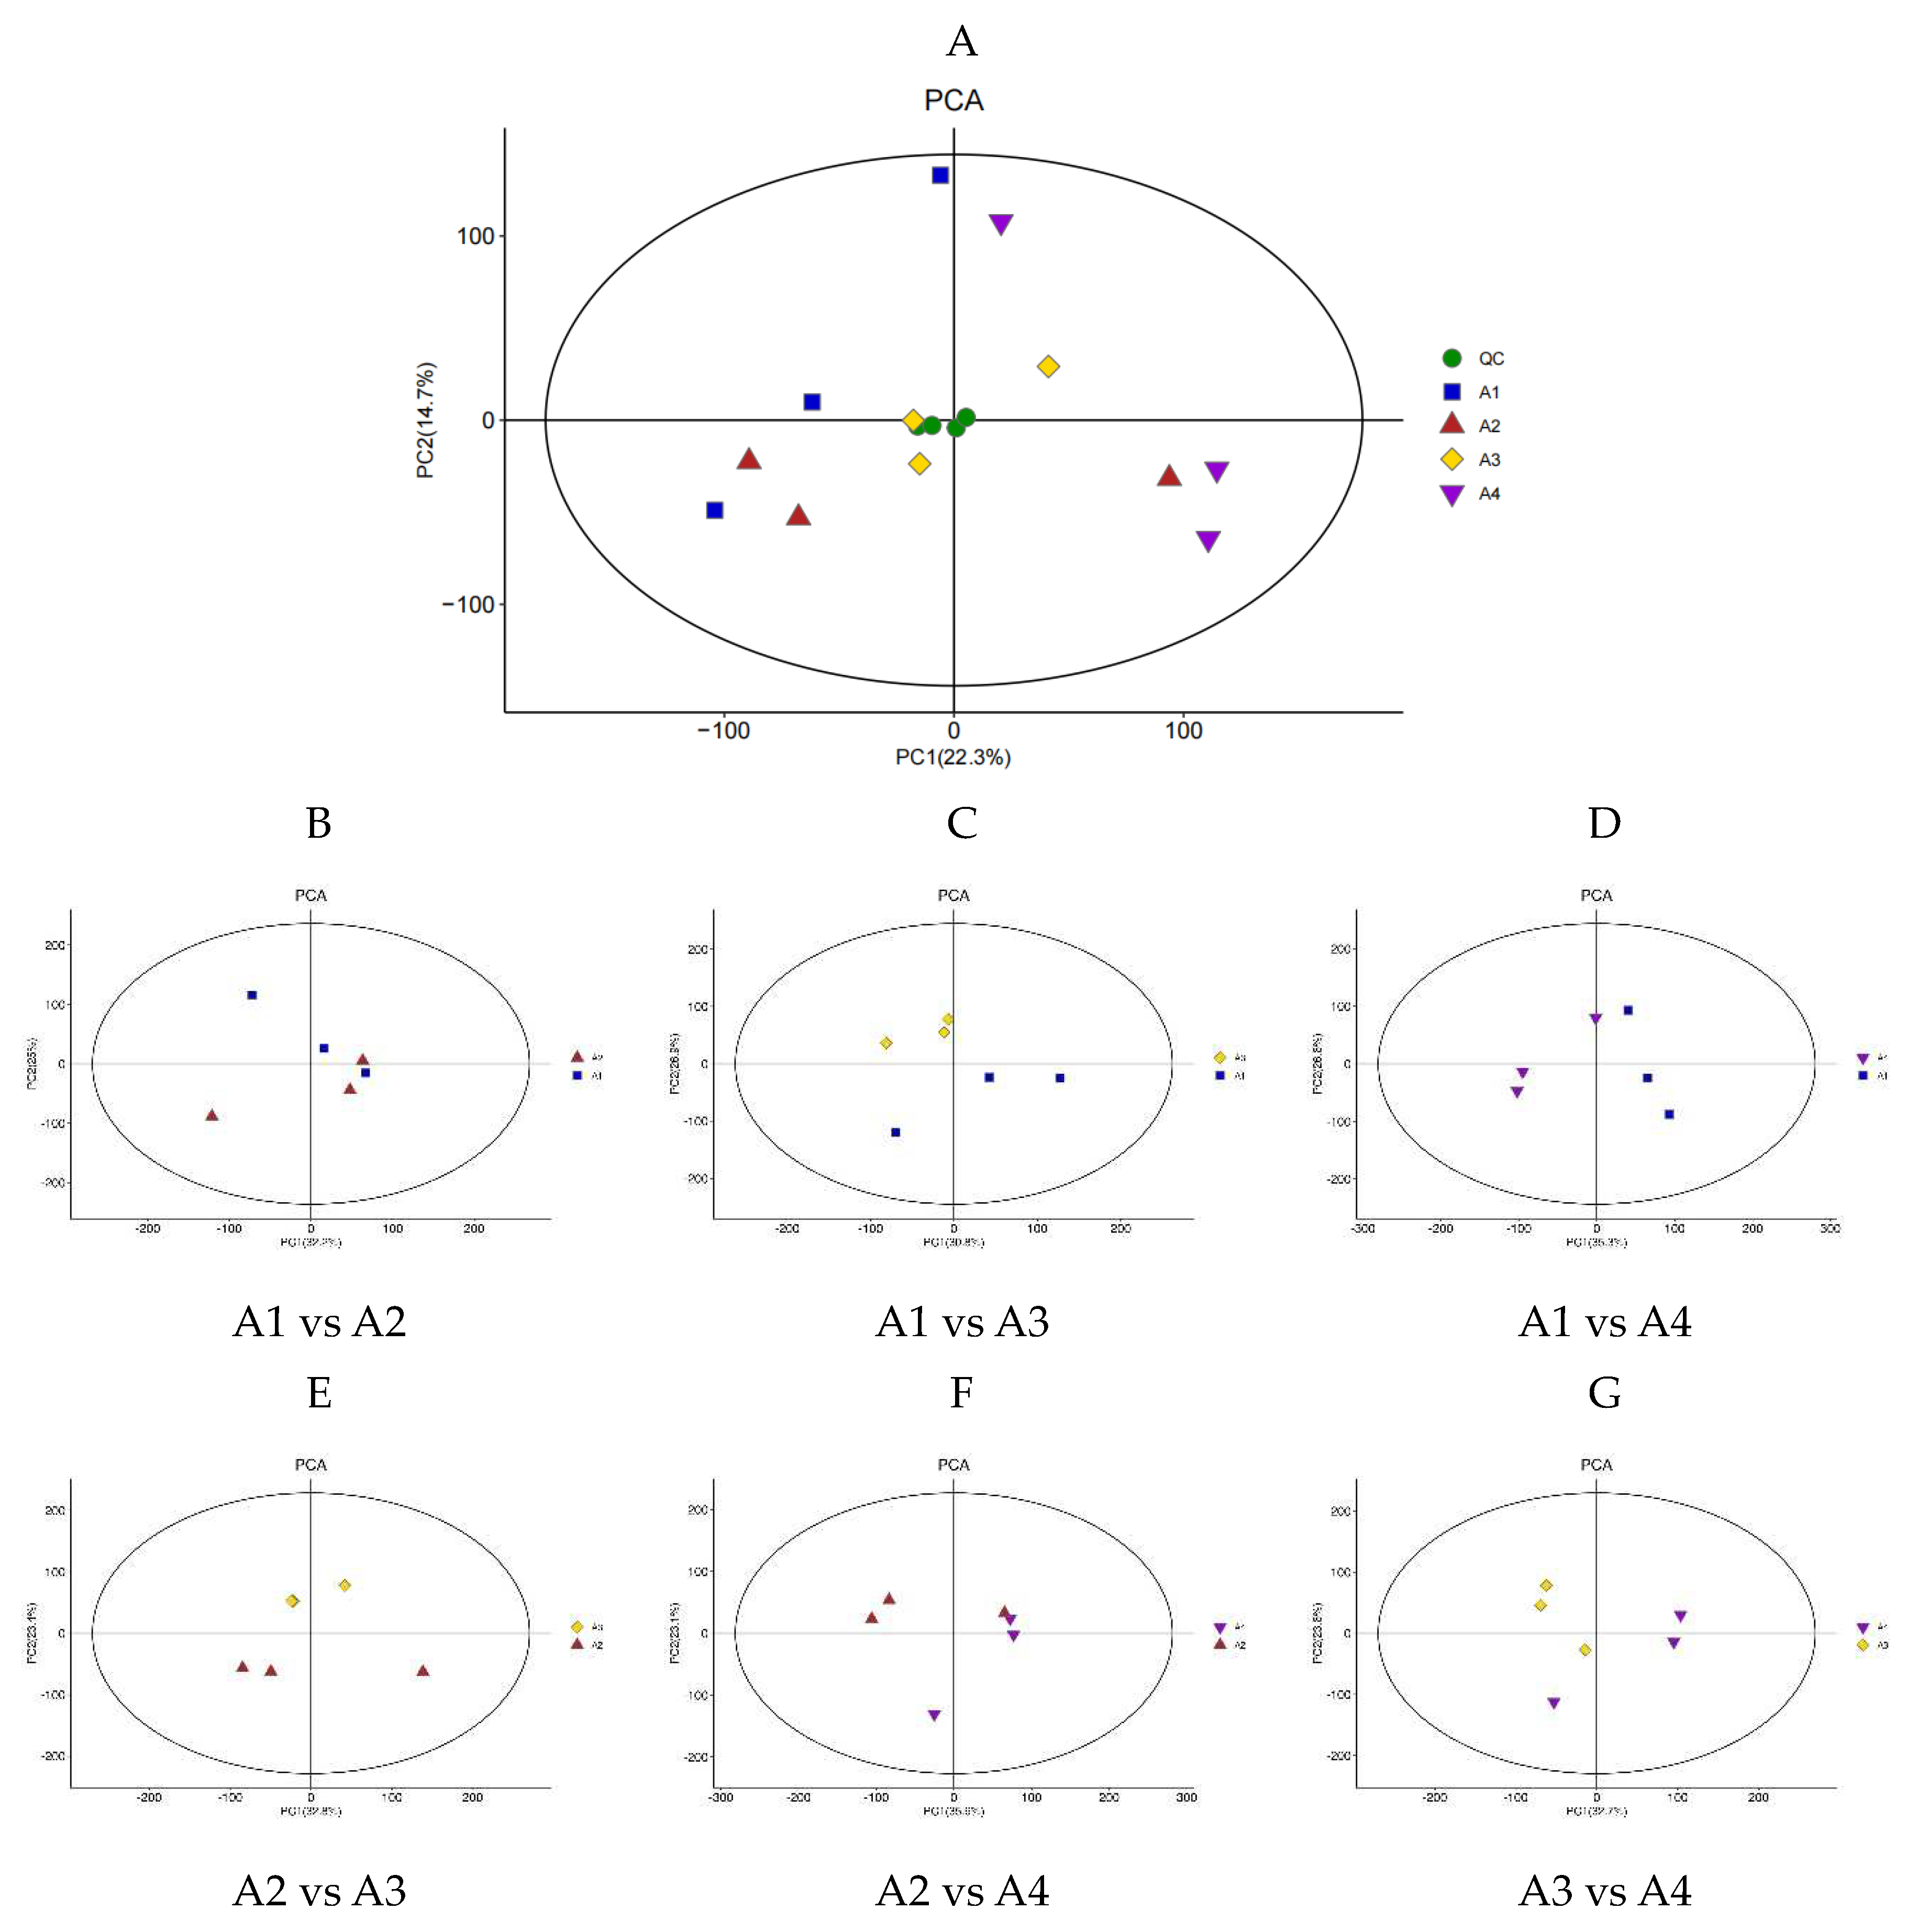
Figure 5.
Differential metabolite association HEATMAP of the four Xihu Longjing tea processing samples.
Figure 5.
Differential metabolite association HEATMAP of the four Xihu Longjing tea processing samples.
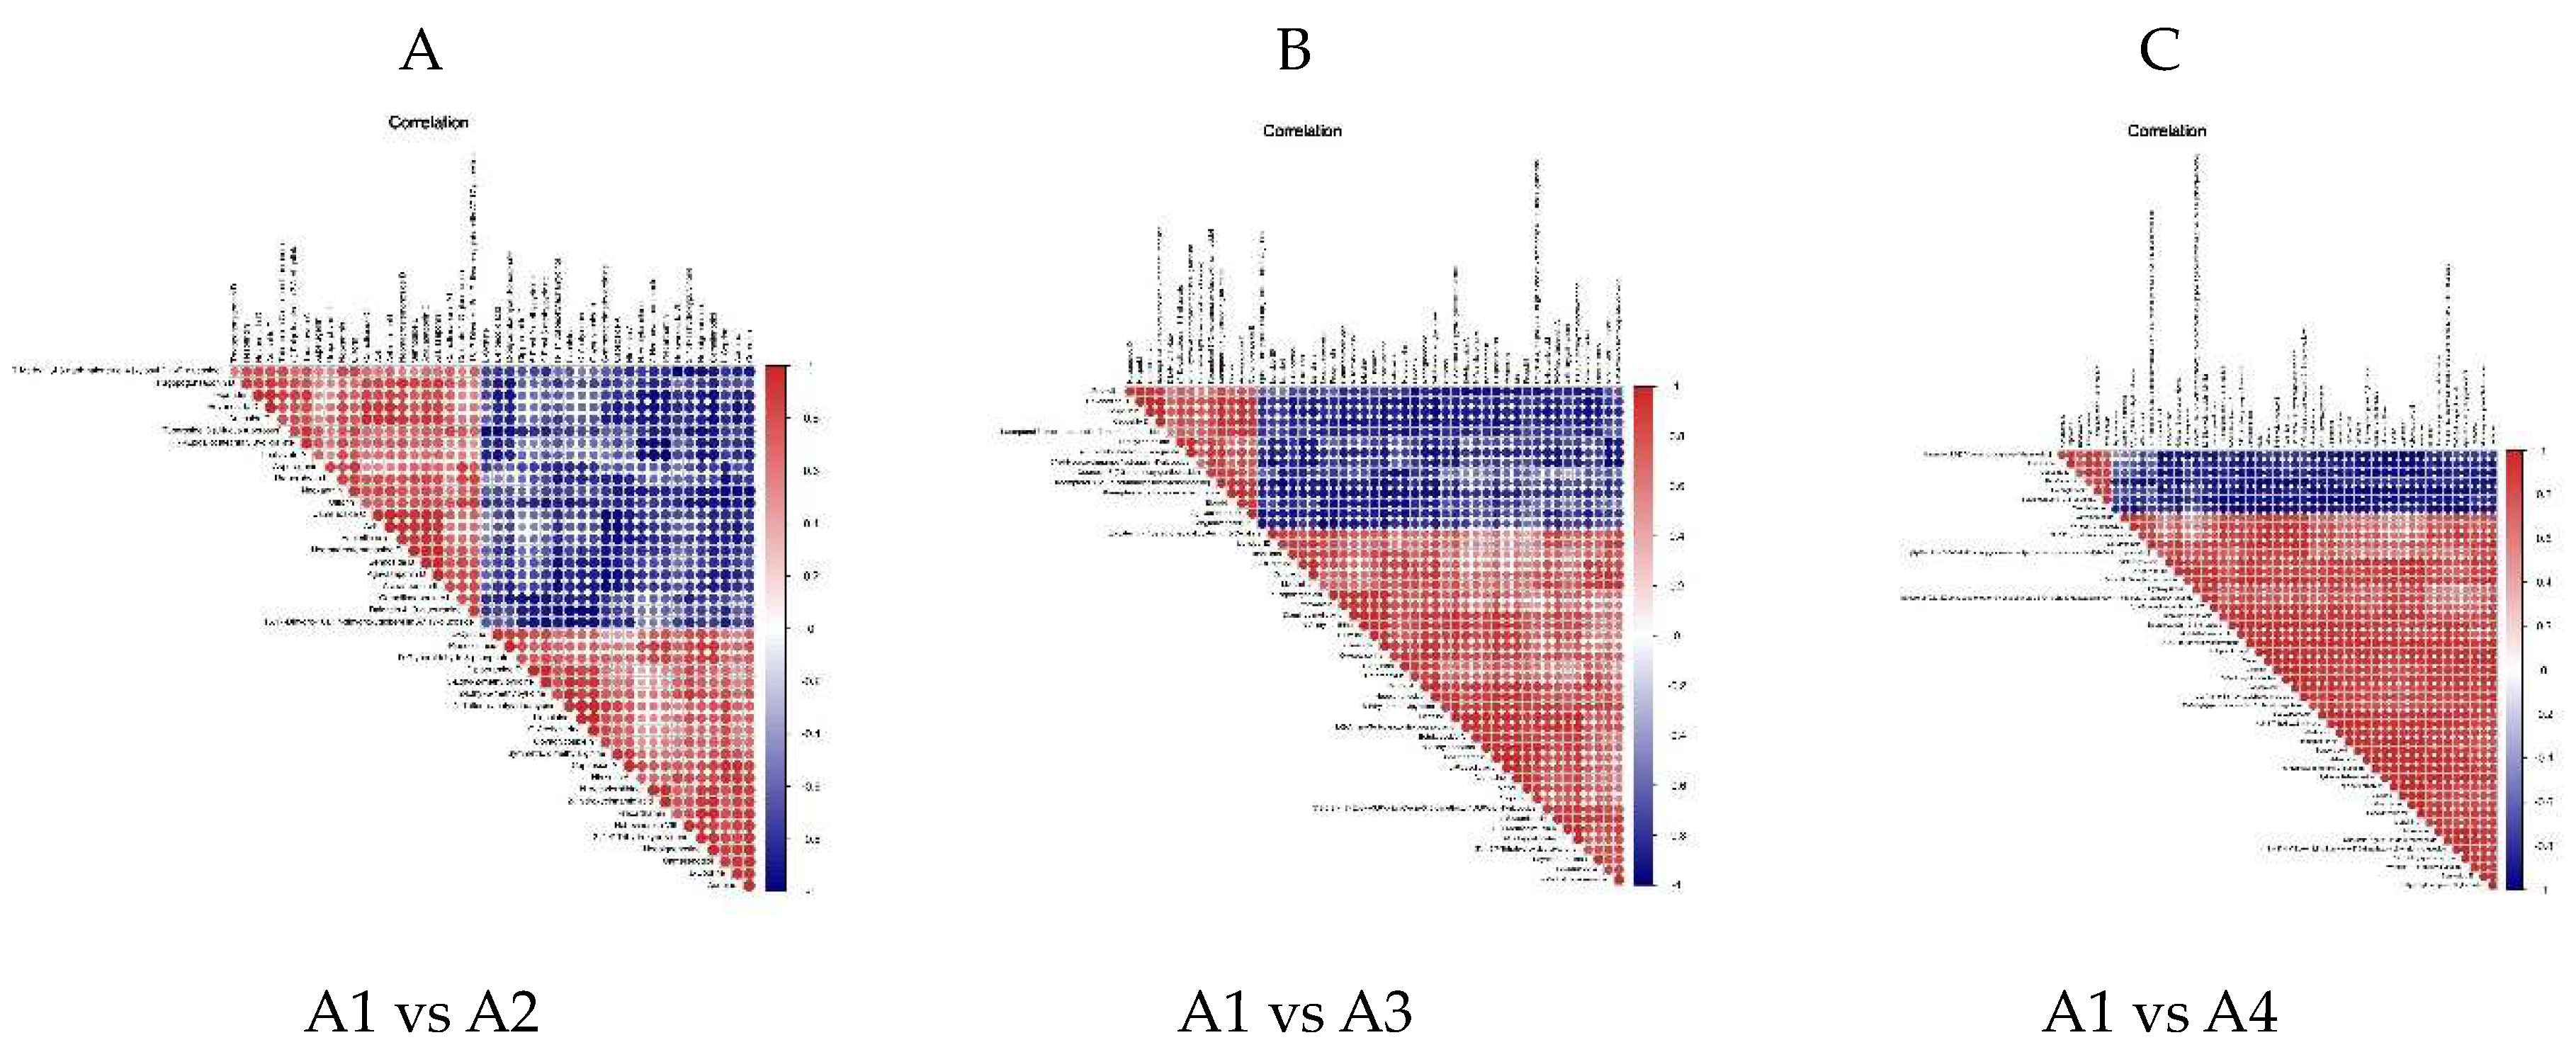
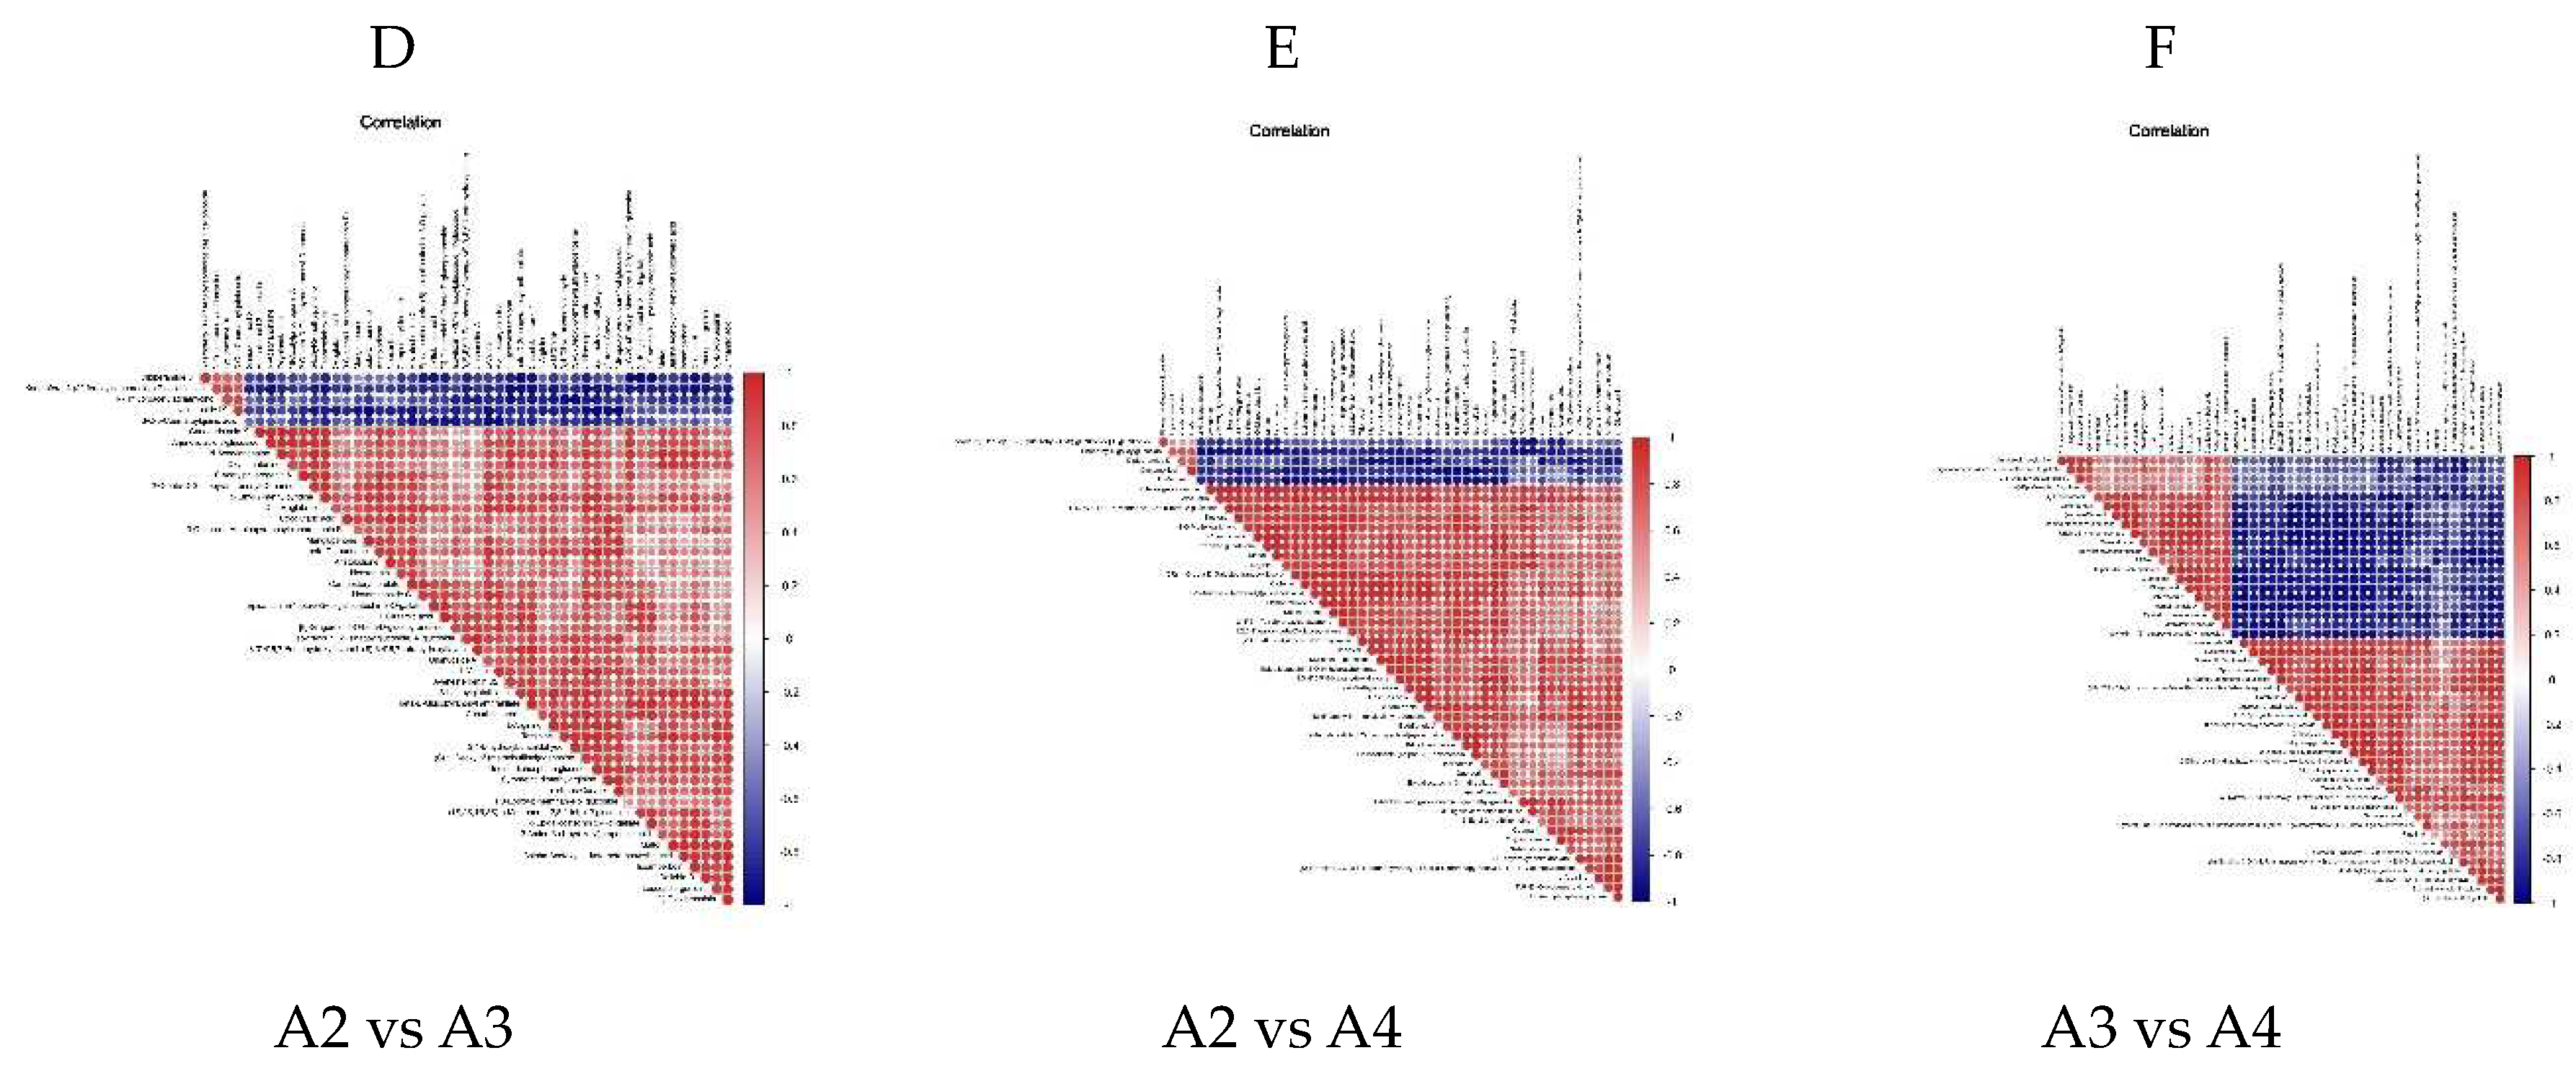
Figure 6.
KEEG of the four Xihu Longjing tea processing samples.
Disclaimer/Publisher’s Note: The statements, opinions and data contained in all publications are solely those of the individual author(s) and contributor(s) and not of MDPI and/or the editor(s). MDPI and/or the editor(s) disclaim responsibility for any injury to people or property resulting from any ideas, methods, instructions or products referred to in the content. |
© 2023 by the authors. Licensee MDPI, Basel, Switzerland. This article is an open access article distributed under the terms and conditions of the Creative Commons Attribution (CC BY) license (http://creativecommons.org/licenses/by/4.0/).
Copyright: This open access article is published under a Creative Commons CC BY 4.0 license, which permit the free download, distribution, and reuse, provided that the author and preprint are cited in any reuse.


