
Submitted:
15 November 2023
Posted:
15 November 2023
You are already at the latest version
Abstract
Nowadays, when milling complex parts or curved surfaces, we encounter several problems that must be taken into account in the production process. There are various factors that affect the quality and accuracy of production. The main objective of this paper was to analyze the size of the effective tool diameter when machining a shaped surface with respect to the selected position, namely at the perpendicular position of the tool. At the same time, the distribution of the engagement area on the tool surface was evaluated by extracting the area content and volume data at the point of contact. The experiment was also intended to highlight the importance of the choice of finishing strategy in a CAM system. The results showed that the tool engagement size corresponded to the extracted data describing the area and volume size for each tool position with respect to the curvature of the surface. The negative deviations obtained by the scanning method were due to machining close to the tool centre, which was affected by the changing effective tool diameter.
Keywords:
effective tool diameter
; milling strategies
; tool engagement
1. Introduction
The manufacturing process of machining is a specific process that is mainly found in the industry for the production of automotive and aircraft parts, but they are also represented in the industry for the processing of plastics in the area of the production of shaped cavities. Input factors entering the machining process affect the resulting quality of the machined surface, as well as shape and dimensional accuracy. These are factors such as cutting conditions, type of choice of machine tool, type of fixture, size of the machined sample, type of tool, selected milling strategy, clamping of the part, unloading of the tool, cooling medium and, last but not least, the post-processor and the control system of the machine [1].
In the production of shaped parts, a larger part of the process is focused on optimizing production from the point of view of productivity with regard to the quality and accuracy of production. Optimization of production can be solved by a correctly chosen milling strategy, machine selection, etc. However, due to the production of these shaped surfaces, it is necessary to have knowledge about the behavior of the tool in the cutting process. It is necessary to consider that the milling of shaped surfaces is characterized by non-planar interactions between the tool and the workpiece [2,3]. In the case of machining free form surfaces, these are complex surfaces, therefore it is important to choose a suitable milling strategy in order to achieve not only efficient production in terms of time, but also surface quality in the form of dimensional and shape accuracy. Therefore, great importance is placed on appropriate finishing strategies, as well as the importance of their use [4]. Machining shaped surfaces is very time-consuming. In the industrial sector, these shapes are still machined on 3-axis machines. Unfortunately, this process leads to some inaccuracies. This requires special positioning and repositioning of the workpiece for machined surfaces. We can state that machining is only possible with a certain degree of accuracy on these machines. For general machining of surfaces, only one tool is often used, when it is necessary to take into account higher machining time and possible errors. Undesirable effects arising in the cutting process can be eliminated by using a tool with a suitable diameter. In 3-axis milling, the tool is controlled in three directions—the position of the tool relative to the general position of the surface is determined by three coordinates. In conventional milling, the diameter of the ball mill is limited by the curvature of the convex shapes. Exceeding the used diameter of the tool is most often manifested by undercutting the machined surface. Therefore, it is necessary to ensure the correct ratio between the radius of the used tool and the radius of curvature of the machined surface [5].
CAx systems are widely used in the field of simulation of various production processes such as machining, forming, joining, welding and other production methods [6]. The selection of suitable strategies was implemented in the SolidCAM CAM system. With the appropriate selection of milling strategies, we can machine different types of surfaces, which is greatly helped by the simulation modes in the CAM system. The CAM system thus plays an important role in the field of machining parts with complex shapes, where it is not possible to use classic workshop programming containing only certain cycles intended for 2.5D milling.
It is important to define the tool used to machine a complex shape (general surface), taking into account the maximum possible usable diameter. Taking it into account is important in order to prevent local undercutting of the workpiece. Therefore, it is necessary to know whether the shape of the general area is concave and saddle-like and what degree of curvature. This control is usually performed in CAM systems, where it is possible to practically control undercutting, or the collision of the tool with the workpiece [7]. The use of copying tools in the field of finishing operations has its advantages due to adaptability to changes in surface curvature. When using the finishing strategies applied to the 3-axis machining process, the cutting tool must always be tangent to the machined surface. In the case of using a copying cutter, it is a position that is given by the contact point of the cutter, the center of the tool, the position of the cutter, the radius of the tool and the vector of the tool orientation [8]. When machining shaped parts, the area of engagement of the cutter when the tool is in contact with the machined surface is also important, which changes from the point of view of the curvature of the surface during the cutting process. The cutting edge of the cutter also finds its meaning in the cutting process. It is difficult to predict and analyze the area of capture in a specific position of the tool to the machined surface. The use of copying tools in the field of finishing operations has its advantages due to adaptability to changes in surface curvature. Nevertheless, the tool grip changes during the manufacturing process, resulting in process instability [9,10].
Many studies have been devoted to the importance of applying multi-axis machining in the production of shaped surfaces due to less tool wear due to its tilting, as well as to avoid the negative effect known as material ploughing. Appears when the tool is in a perpendicular position relative to the machined surface. An accompanying phenomenon of material ploughing is the action of the vertical position of the tool, while there is no shearing mechanism, as the action of the center of the tool does not create enough chips for removal, and thus there is a zero cutting speed at the cutting point [11]. In his research, Varga [12] dealt with the effect of the vertical position of the tool on the quality and topography of the machined flat surface, where he evaluated not only the geometric characteristics of the surface, but also compared four strategies. He also evaluated the roughness of the surface, where it was shown that the best results were obtained with the circular pocket and Constant step pocket auto boundary strategies. He expanded his research with knowledge regarding the influence of finishing milling strategies on the production quality of the shaped surface applied in 3-axis milling of aluminum samples, while it was a combination of convex and concave curves. As part of this experiment, he also assessed roughness and the choice of a milling strategy, where the Constant Z strategy achieved the best results in terms of roughness [13]. Varga also proposed a method of comprehensive assessment of the quality of the machined surfaces (surface topography, surface roughness, shape deviation, etc.), useful in deciding on the production method and the use of appropriate strategies in 3-axis milling. For the experiment, he chose an aluminum alloy that had a parabolic shape. He also evaluated the elements of the surfaces with respect to the chosen height of the sample using a digital microscope, where the regular arrangement of the tool paths along the contour lines was achieved only with the Constant Z strategy [14]. In their works, Kaymakci [15] and Diciuc [16] evaluated the methods dealing with the interaction between the tool and the machined surface. Since CAM systems are important in the production of shaped surfaces, Bagci [17] dealt with their influence and importance, who analyzed the accuracy of their use due to the difference in the generation of tool paths compared to real production. The difference in the results was up to 30%.
Wojciechowski [18] dealt with vibrations during the production of shaped surfaces and their estimation, who in his conclusions emphasized the influence of tool overhang. In his results, Tuysuz [19] reported effective cutting speeds in areas where the interaction of the tool with respect to the machined surface reached a tangential level. From the point of view of dimensional and shape accuracy assessment, various surface assessment methods are used in practice, resulting in various analyses, reports providing information on production accuracy, shape deviations, etc. [20]. One of the authors who dealt with the design of an algorithm designed to predict the quality of the machined surface was Mizugaki et al. [21], where he used a copy cutter for the finishing process. Capla [22] investigated the contact point in the interaction of the cutting tool and the machined surface in multi-axis machining, where he changed the angle of inclination of the tool in the cutting process.
In addition to virtual modeling, a reverse engineering method is also used to obtain a 3D model from a physical (real) part. One of the possible methods is digitization of the physical part using a non-contact optical scanner. The output format is the so-called cloud of points. Currently, various aspects focused on the milling of shaped surfaces and their evaluation are being investigated. In their research, some authors dealt with the choice of a suitable copying tool based on a cloud of points, while not taking into account the specific shape of the machined surface [23,24,25].
An important output of the evaluation is data that can contribute to the optimization of the machining process. Data evaluation using the scanning method allows to verify the correctness of the selection of the milling strategy as well as the influence of the effective diameter of the tool on the quality or accuracy of the machined surface [26]. When milling free-form surfaces, it is possible to use 3-axis and 5-axis machining, although the choice of machine is conditioned by the shape of the future part and the required accuracy. In his research, Sadílek [27] compared 3-axis and 5-axis machining in the production of shaped surfaces, where he achieved the highest accuracy precisely by using 5-axis machining. He also dealt with the comparison of shape deviations between these two methods of machining, where better surface quality and smaller deviations were again demonstrated in 5-axis machining. The deviation of the produced shape was evaluated, as well as the effect of the effective diameter with respect to the contact point of the tool and the workpiece in the cutting process. Grešová [28] evaluated the shape deviations of a free-form surface using a 3D laser scanner. Better results in terms of the quality of the machined surface in 5-axis machining were achieved by using a linear and spiral strategy and in 3-axis machining by using an offset strategy. The author Tran [29] focused on the evaluation of the machined surface based on the cloud of points obtained by different scanning devices, where the evaluation parameters were the roughness and shape deviation of the samples. The results pointed to the importance of the data obtained from the point cloud. Masood et al. [30] and also Bey [8] dealt with the design of a mathematical model, the goal of which was to generate tool paths for the production of a shape sample intended for 3-axis machining and then to evaluate the individual roughness parameters from the obtained point cloud data using scanning.
In their work, Li and Gu [31] compared machined surfaces using the scanning method, where they used a formula based on an extended Gaussian curve and normal orientation as an evaluation module. Another author, Deng [32], focused on the selection of characteristic points that allowed defining the limitation zone for the assessment of surface quality, where, thanks to this factor, he defined the minimum zone for evaluating the machined surface. Yuwen [33] evaluated the quality of shaped surfaces obtained by milling using the SQP (sequential quadratic programming) method, which he applied for process optimization. The purpose of using this method was to evaluate the quality of the surface at a large set of sampling points. The 5-axis surface inspection technology known as sweep scan was applied in his research by Zhang [34], who works with the idea of distributing the free form of the machined surface into parts of elementary shapes, and based on this, the necessary algorithms are designed that find the optimal scanning path. As a result, the control of the machined surface is improved. In his work, Chen [35] pointed to the analysis of the cutting effect, where he compared different positions of the tool, while applying the method of geometric modeling and numerical simulation.
When milling shaped surfaces, the area of engagement of the tool with the machined surface changes along the path of the cutter. It is therefore difficult to analyze its distribution in terms of size, area, or volume. The tool feed when milling shaped surfaces can be determined based on the start and exit angles as a function of the axial height along the tool axis. In the case of a possible evaluation, we may encounter several evaluation procedures. One of them is Boolean operations, then spatial operations, and last but not least is the use of discrete vectors. Applying the subtraction method between the model of the tool and the machined surface enabled through Boolean operations is considered the most accurate [36,37]. The application of scanning methods was also dealt with by Kender [38], who analyzed several reverse engineering techniques used for mechanical systems. He also described the benefit of their use for various components in the field of automotive design [39].
The paper focuses on the selection of the finishing strategy and the consideration of its selection through the display of the residual material in the CAM system. Since in the machining process the position and orientation of the tool is just as important, the mentioned article proposes a methodology for evaluating the effective diameter of the tool when using a copying cutter in the production of a shaped surface. An analysis of the changing contact zone in the tool-workpiece relationship was carried out, as changing the position of the cutter during milling of shaped surfaces changes the distribution of the area of engagement on the surface of the tool. Among other things, this analysis brings additional information in the form of data extraction from the section area in the form of area content and volume at the point of the contact surface. He also described the benefit of their use for various components in the field of automotive design. At the moment, there is little information dealing with this transformation, information that would bring us closer to the changing area of the tool grip when milling shaped surfaces. Likewise, based on a broader review of the literature in this area, there has not yet been proven research that would deal with the analysis of the size of the effective diameter of the tool when machining the shaped surface in the point of contact of the perpendicular position of tool—workpiece. Understanding the contact zone in the tool-workpiece relationship when milling shaped surfaces can contribute to a better analysis of the cutting forces in the machining process, which have a significant impact on the machining accuracy, as well as the chip thickness that corresponds to the cutting edge of the tool used.
2. Materials and Methods
In order to adequately illustrate the possibility of producing complex and free-form surfaces, the profile of a human face (Figure 1) created in the Rhinoceros 2020 graphics program was selected as a CAD model. The model was extracted from the Rhino environment into STL format and then saved in STEP format using the STL2STEP converter. This format is supported by the CAD system SolidWorks 2020, which forms the basis for the chosen CAM system SolidCAM 2022, which allowed us to define the necessary milling strategies for machining the desired shape and dimensions.
An aluminum alloy was chosen as a semi-finished product AlCu4Mg (Slovalco, a. s., Žiar nad Hronom, Slovakia), tensile strength = 420 MPa; yield strength = 240 MPa; hardness = 120 HB. A 3-axis milling machine was used to produce a test sample with dimensions of 100 x 80 x 40 mm EMCO Mill 155 ((EMCO MAIER Ges.m.b.H., Hallein, Austria) with a control system Heidenhain TNC 426. The maximum speed of the machine spindle is 5,000 rpm. Production took place in six operations, where three types of tools were used as shown in Table 1. All tools were from the Korloy company, while the cutting conditions corresponded to the manufacturer’s recommendations.
The choice of finishing strategies was conditioned by the knowledge gained from various overview studies, as well as their most frequent use in the production of the mentioned shapes. The milling strategies linear, constant step and constant Z in the simulation mode that SolidCAM 2023 includes were selected as finishing operations and compared with each other. This is the SolidVerify mode, in which, based on the consideration of the residual material after machining with the chosen strategy, the most suitable one for production was selected.
The implementation of the experiment included the following sequence:
- Roughing—face cylindrical cutter D18 mm, axial depth of cut ap = 1 mm, radial depth of cut ae = 0.6 mm, tool path tolerance T = 0.1 mm, surface allowance P = 0.5 mm
- Pre-finishing—copy cutter D6 mm, cutting material HSS Co8, machining strategy—linear, axial depth of cut ap = 0.5 mm, radial depth of cut ae = 0.5 mm, surface allowance P = 0.2 mm
- Finishing—copy cutter D4 mm, cutting material HSS Co8, machining strategy—constant Z, radial depth of cut ae = 0.2 mm, tool path tolerance T = 0.01 mm
The following sequences were chosen to evaluate the results of the experiment:
- Comparison of machined surfaces between CAM system and real production
- Evaluation of the effective diameter of the tool Deff with respect to the contact of the tool and the workpiece
- Evaluation of tool surface area distribution using areal content and volume data extraction at the contact patch location
- Assessment of surface deviations by the 3D scanning method—scanner FARO Laser ScanArm V3 (FARO Technologies Italy S.r.l)
2.1. Methodology for evaluating the effective diameter of the tool with regard to the contact between the tool and the workpiece
The evaluation of the effective diameter of the Deff cutter was carried out directly in the CAD system, where it was possible to perform a measurement based on the contact surface of the tool with respect to the workpiece in a specific position. The selection of individual positions on the shape surface is shown in Figure 2a and an example of displaying the contact of the tool with the workpiece for position no. 8 shows Figure 2b.
2.2. Methodology for assessing the distribution of the engagement area on the tool surface
Using the functions that are part of the Solidworks 2022 CAD system (Boolean operations), it was possible to analyze the contact surface forming a tangent in the tool-workpiece relationship. By obtaining a CL point for each tool position, it was possible to extract the contact area between the tool and the workpiece using the Body Boolean function, which gave the resulting 3D contact area [36]. This contact surface was subsequently projected onto a plane perpendicular to the tool axis. Through the application of Boolean functions, the boundaries and curves of the contact area were obtained. By creating perpendicular cuts to the axis of the tool, individual cuts in the form of disks, circles were projected onto a plane perpendicular to the cutter axis, as shown in Figure 3.
To compare the amount of tool engagement in the cutting process, which is affected by the contact area of the tool with respect to the machined surface, the positions were chosen as shown in Figure 2.
2.3. Methodology for evaluating surface deviations using the scanning method
The choice of this method was based on its effective scanning of the surface and obtaining results that would not be possible to achieve with the touch method. The results of the scan were analyzed in the Polyworks program included in this system. Digitization of the shape surface was carried out in several steps. It was necessary to set the model on the work table so that it would not move during the scanning. The digitization itself took place with the support of the Polyworks program in its work module IM Align project. The facial profile was scanned by a laser scanning head, where the resulting 3D scan contained a total of 130,844 points as shown in Figure 4.
This was followed by a comparison of the 3D scan of the face profile with its original 3D model. After importing the point cloud of the face scan and defining the X,Y,Z coordinate system (Figure 5a), the 3D model of your face was also imported (Figure 5b).
In the next procedure, the 3D model was overlaid with a scan (Figure 6), where it was necessary to identify all dimensional deviations of the manufactured component compared to the original 3D model, from which the CNC program was initially prepared and generated. Such a comparison of dimensions revealed in the results the final accuracy of machining and thus helped to identify possible shortcomings or deviations from the designed dimensions.
3. Results
3.1. Comparison of machined surfaces between CAM system and real production
A visual comparison of the machined surface in the Solid Verify simulation mode and the real state after the roughing operation (Figure 7) and the pre-finishing operation is shown in Figure 8, where individual tool paths, the simulation mode, and the real state of production are plotted.
The comparison shows that the obtained shape of the machined surface in the simulation corresponds with the obtained shape on the CNC milling machine. After roughing, it was possible to visually see an irregular surface, for the removal of which a pre-finishing operation was used.
The final state after the pre-finishing operation was the machined surface that corresponded to the simulation mode, while an allowance of 0.2 mm was left for the last production operation, the so-called finishing. The choice of the final strategy corresponded to three strategies: linear, constant step over and constant Z, which were compared with each other. The most suitable one was chosen for the production process and that was the constant Z strategy. A comparison of the display of the tool paths in the simulation mode and the residual material in the CAM system during the finishing operation for the linear strategy (Figure 9), the constant step over strategy (Figure 10) and the Constant Z strategy shows Figure 11.
From the given display of residual machining after choosing one of the finishing strategies, the Constant Z strategy proved to be effective, leaving a small amount of material for finishing. Subsequently, it was used for the production process, where the resulting part after milling is shown in Figure 11.
3.2. Evaluation of the effective diameter of the tool Deff with respect to the contact of the tool and the workpiece
Figure 12 shows the resulting interactions between the tool and the machined surface for specific positions.
In order to obtain the necessary data taking into account the changing effective diameter of the tool with respect to the machined surface and its curvature, every single interaction in the tool-workpiece relationship according to Figure 12 was gradually analyzed. At the beginning of the analysis, visual maps were made showing the border distances within this interaction, the contact area as shown in Table 2 in a specific plane.
Obtained maximum and minimum values of the effective diameter of the tool at the point of contact with the workpiece relative to the position of the tool are shown in Table 3.
A graphic representation of the maximum and minimum values of the Deff parameter with respect to the position of the tool and the machined surface is shown in Figure 13.
From the graphic comparison of the Deff parameter depending on the position of the tool and the contact machined surface, it follows that a decreasing tendency was demonstrated in all positions of the tool. The most significant difference with respect to Deff max and Deff min for a specific position of the instrument was manifested in the position of instrument No. 8. Within this interaction of the tool with the workpiece, the Deff min parameter was almost 6 times smaller compared to the Deff max value. The smallest difference ratio was recorded in the position of tool No. 2.
3.3. Evaluating tool surface area distribution using data extraction
The tool engagement when milling shaped surfaces can be determined based on the start and exit angles as a function of the axial height along the tool axis. Since the capture area is formed by a combination of start and exit angles at the point of contact with the machined surface, the next procedure was to assign these angles to each projected circle in a plane perpendicular to the tool axis. The extracted values of surface content and volume of the cutting part of the tool at the point of contact with the machined surface are described in Table 4. A graphical comparison of these data depending on the position of the tool and the contact machined surface is described in Figure 14.
The graphic comparison of surface content and volume depending on the position of the tool and the contact machined surface shows that in both cases a decreasing tendency of these parameters was achieved. It is possible to state that the highest value of surface content was achieved at the position of tool no. 1 and the smallest position of the tool with respect to the machined surface was at position no. 9. The same was the case with the volume comparison. Figure 15 shows the overall comparison of all extracted data (Deff max, Deff min, area content and volume) at the point of contact of the tool with respect to the curvature of the surface.
When milling shaped surfaces, not only the value of the effective diameter of the tool changes due to the curvature of the shaped surface, but also the start and exit angle changes in the area of the cutting part of the tool. Individual angles are described in more detail in Table 5.
Figure 16 shows the individual positions for which the start and exit angles were analyzed at the point of tool engagement with respect to the curvature of the surface. Their closer evaluation and comparison in the form of a graph, when the tool and workpiece are in contact with respect to a specific position of the tool, can be seen in Figure 17.
The size, as well as the shape of the tool engagement in the cutting process, has an effect on the length and time of the engagement in relation to the cutting edge of the tool during one revolution of the tool. As shown in Figure 17, the start and exit angles defining the tool engagement determine which part of the cutting tool actually participates in the cutting process. The smallest engagement of the tool due to the curvature of the shaped surface corresponded to position no. 9 and the largest to position no. 1.
The obtained image sizes also corresponded to the extracted data describing the size of the surface and volume for individual positions of the tool with respect to the curvature of the surface (Figure 18). For position no. 9, an area with a value of 0.921 mm2 was measured, which represented the smallest value among all positions, and for position No. 1, an area with a value of 8.467 mm2 was measured in comparison with the other positions. As for the volume, for position no. 9, a capture volume of 0.009 mm3 was achieved, which represented the smallest value among all positions. For position No. 1, compared to the other positions, the obtained volume was 0.806 mm3. The obtained information about the start angle at the location of the tool engagement defines its input position.
3.4. Evaluation of surface deviations by the 3D scanning method
In the process of evaluating surface deviations, a positive and negative deviation of the manufactured dimension from the original 3D model was set, where the reference surface was on the 3D model. A deviation of ± 0.5 mm was used. The range was quite large, but it was suitable for a high-quality display, as shown in Figure 19. The position of the scanned points corresponded to the applied deviation range.
Nine points of contact between the tool and the machined surface were identified and selected, where the 3D dimensional deviations of the selected 3D scan points were plotted in the X, Y, Z coordinate system. These control points are shown in Figure 20. Based on the set deviation and the colour coding of the measured points, it was possible to identify the points that characterize the uncut or undercut points to the final dimension. The measured surface deviations by the scanning method are shown in Table 6.
These were predominantly undercut-defining locations in the machining process, characterized by negative deviations compared to the baseline 3D model. The maximum negative deviation was obtained at position 2 (value -0.146 mm) and the smallest negative deviation at position 3 (value -0.002 mm). The highest positive deviation was measured at position 5 ( value 0.114 mm) and the smallest positive deviation was measured at position 6 (value 0.028 mm). A graphical comparison between the obtained surface deviations given in Table 6 and the values of the effective diameter parameter Deff max and Deff min (Table 3), for specific positions of the tool with respect to the curvature of the surface is shown in Figure 21.
It can be concluded that the negative deviations obtained by the scanning method were due to machining near the tool center, which was affected by the changing effective tool diameter for that position with respect to the curvature of the surface. As a result, an adverse effect on production accuracy was demonstrated. The highest negative deviations for position 4 (-0.139 mm), position 8 (-0.102 mm), and position 9 (-0.127 mm) corresponded to the maximum and minimum values of the Deff parameter compared to the positive deviations for tool position 5 (0.114 mm) and for position 6 (0.028 mm).
4. Discussion
Currently, there are several methods for evaluating the milled surface, which make it possible to identify surface defects, evaluate shape and dimensional accuracy, or even surface topography, etc. The primary factor that can influence the above characteristics is the choice of milling strategies found in CAM systems when producing shaped surfaces. Choosing an appropriate strategy allows for more efficient machining of the part and increased production productivity due to fewer finishing operations.
However, the application of CAM systems in the production of shaped surfaces is not the only criterion of quality or dimensional accuracy of production. If a 3-axis milling machine is to be used for the production of a shaped surface, it is important to have knowledge of the tool behaviour in the cutting process as well as the non-planar interactions occurring between the tool and the workpiece. This is due to the changing effective diameter of the tool with respect to the curvature of the surface. The cutting mechanism based on the change in the cutter contact points and the subsequent instantaneous contact area causes the change in cutting forces and determines the overall quality of the part.
The specimen used for the experiment represented a shape complex surface precisely because of showing the non-planar interaction between the tool and the machined surface. The results of the experiment were intended to show the possibilities of evaluating this interaction, as well as the possibilities of outputs that can be obtained by extracting different data from the point of contact between the tool and the machined surface. This was an assessment of the effective tool diameter, area and volume parameter at the cutter engagement point.
Individual results proved the following statements:
- The most significant difference with respect to Deff max and Deff min for a specific position of the instrument was manifested in the position of instrument No. 8. Within this interaction of the tool with the workpiece, the Deff min parameter was almost 6 times smaller compared to the Deff max value. The smallest difference ratio was recorded in the position of tool No. 2.
- The start and exit angle defining the tool engagement determines which part of the cutting tool actually participates in the cutting process. With respect to the curvature of the shaped surface, the smallest engagement of the tool corresponded to the position of tool no. 9 and the largest to the position of tool no. 1.
- The obtained engagement sizes also corresponded to the extracted data describing the size of the surface and volume for individual positions of the tool with respect to the curvature of the surface. For tool position no. 9, an area with a value of 0.921 mm2 was measured, which represented the smallest value among all positions, and for position No. 1, an area with a value of 8.467 mm2 was measured in comparison with the other positions. As for the volume, for position no. 9, a capture volume of 0.009 mm3 was achieved, which represented the smallest value among all positions, and for tool position No. 1, a volume of 0.806 mm3 was obtained in comparison with the other positions.
- In the process of analysing the deviations of the surface, the results showed that it was mainly the places defining the undercut in the machining process, which are characterized by negative deviations compared to the initial 3D model. The maximum negative deviation was reached at position no. 2 (value -0.146 mm) and the smallest negative at position No. 3 (value -0.002 mm). The highest positive deviation was measured at position no. 5 (value 0.114 mm) and the smallest positive at position no. 6. (value 0.028 mm). The negative deviations obtained by the scanning method were achieved due to machining near the center of the tool, which was affected by the changing effective diameter of the tool for a given position due to the curvature of the surface. As a result, this has been shown to adversely affect production accuracy. The highest negative deviations for: position no. 4 (-0.139 mm), position no. 8 (-0.102 mm), position no. 9 (-0.127 mm) corresponded to the maximum and minimum values of the Deff parameter compared to positive deviations for tool position No. 5 (0.114 mm) and for position No. 6 (0.028 mm).
5. Conclusions
The aim of this paper was to analyze the choice of finishing strategy in machining a shape complex surface and to evaluate the size and effect of effective tool diameter on the accuracy of the shape complex surface. For the purpose of the experiment, aluminium alloy was chosen and the machining process was carried out on a 3-axis milling machine. For the analysis of the evaluation of the effective tool diameter, 9 positions at different heights of the machined surface were selected. The individual analyses were extended to evaluate the cutter engagement at the tool contact point with respect to the curvature of the machined surface. Boolen operations were used for this analysis.
The cutter engagement at the point of contact was analyzed in more detail in terms of the start and exit angles and other extracted data obtained from the cut area, namely in the form of areal content and volume at the point of contact. The research highlights the method of analysis and methodology for evaluating the changing effective tool diameter when using a copy milling cutter in the production of a shaped surface with respect to the changing tool position. It also evaluates the effect of tool engagement on surface variations when milling a shape complex surface using the 3D scanning method.
From the point of view of future research, further experiments could deal again with the influence of the contact zone between the tool and the workpiece with regard to the effective diameter of the tool when milling shaped surfaces, but supplemented with the knowledge of monitoring cutting forces and deflection of the tool during contact with the workpiece. Among the other information that could help to create a kind of integrated complex of information would be the change of material, the size of the tool’s extension, which affects the stiffness in the machining process, the evaluation of tool wear, the examination of the surface topography, and last but not least, to compare the results achieved by us with the process where 5-axis machining was applied, thanks to which it is possible to eliminate machining through the center of the tool.
Author Contributions
Conceptualization, J.V.; methodology, J.V. and Š.K.; validation, J.V.; formal analysis, J.V. and L.K.; investigation, J.V.; resources, J.V. and V.R.; writing—original draft preparation, J.V.; writing—review and editing, J.V.; V.R. and L.K.; visualization, J.V. and Š.K; supervision, L.K.; project administration, L.K. and E.S.; funding acquisition, E.S. All authors have read and agreed to the published version of the manuscript.
Funding
This research was funded by The Ministry of Education, Science, Research and Sport of the Slovak Republic, grant number VEGA 1/0384/20, KEGA 036TUKE-4/2021.
Conflicts of Interest
The authors declare no conflicts of interest. The funders had no role in the design of the study; in the collection, analyses, or interpretation of data; in the writing of the manuscript, or in the decision to publish the results.
Nomenclature
| CNC | computer numerical control |
| NC | numerical control |
| CAM | computer-aided manufacturing |
| CL | cutter location |
| CAD | computer-aided design |
| HB | hardness Brinell |
| D | diameter of milling tool |
| RPM | revolutions per minute |
| ae | radial depth of cut |
| ap | depths of cut for given strategies |
| fz | feed per tooth |
| Deff max | maximum effective radius |
| Deff min | minimum effective radius |
| F | feed |
| T | tolerance |
| P | surface allowance |
| ISO | International Organization for Standardization |
| S10z | Ten-point height of surface |
| Sa | Arithmetical mean height |
| Ssk | Skewness |
| Lc | cutoff |
| vc | cutting speed |
References
- Jiang, X.J.; Scott, P.J. Fundaments for free-form surfaces. Advanced metrology. 2020, 11–34. [Google Scholar] [CrossRef]
- Scandiffio, I.; Diniz, A.E.; Souza, A.F. Evaluating surface roughness, tool life, and machining force when milling free-form shapes on hardened AISI D6 steel. International Journal of Advanced Manufacturing Technology. 2015, 82, 2075–2086. [Google Scholar] [CrossRef]
- Ma, J.; Hu, G.; Jia, Z.; Zhang, N.; Wang, F. Effect of geometric feature and cutting direction on variation of force and vibration in high-speed milling of TC4 curved surface. International Journal of Advanced Manufacturing Technology. 2018, 95, 2207–2218. [Google Scholar] [CrossRef]
- Chen, Z.C.; Vickers, G.W.; Dong, Z. A New Principle of CNC Tool Path Planning for Three-Axis Sculptured Part Machining—A Steepest-Ascending Tool Path. Journal of Manufacturing Science and Engineering. 2004, 126, 515–523. [Google Scholar] [CrossRef]
- KURT, M.; BAGCI, E. Feedrate optimisation/scheduling on sculptured surface machining: a comprehensive review, applications and future direction. The International Journal of Advanced Manufacturing Technology. 2011, 55, 1037–1067. [Google Scholar] [CrossRef]
- Kurylo, P.; Frankovský, P.; Malinowski, M.; Maciejewski, T.; Varga, J.; Kostka, J.; Adrian, L.; Szufa, S.; Rusnáková, S. Data Exchange with Support for the Neutral Processing of Formats in Computer-Aided Design/Computer-Aided Manufacturing Systems. Applied Sciences. 2023, 13, 1–20. [Google Scholar] [CrossRef]
- Yan, X.; Ballu, A. Review and comparison of form error simulation methods for computer-aided tolerancing. J. Comput. Inf. Sci. Eng. 2019, 19, 1–16. [Google Scholar] [CrossRef]
- BEY, M.; CHERFI, A. Finishing of freeform surfaces with an optimized Z-Constant machining strategy. 8th CIRP Conference on High Performance Cutting (HPC 2018). Procedia CIRP 77. 2018, 12, 271–274. [Google Scholar] [CrossRef]
- GENG, L.; LIU, P.L.; LIU, K. Optimization of cutter posture based on cutting force prediction for five-axis machining with ball-end cutters. Int J Adv Manuf Technol. 2015, 78, 1289–1303. [Google Scholar] [CrossRef]
- SOUZA, A.F.; BERKENBROCK, E.; DINIZ, A.E.; RODRIGUES, A.R. Influences of the tool path strategy on the machining force when milling free form geometries with a ball-end cutting tool. J Braz. Soc. Mech. Sci. Eng. 2015, 37, 675–687. [Google Scholar] [CrossRef]
- SOUZA, A.F.; DINIZ, A.E.; RODRIGUES, A.R.; COELHO, R.T. Investigating the cutting phenomena in freeform milling using a ball-end cutting tool for die and mold manufacturing. International Journal Advanced Manufacturing Technologies. 2014, 71, 1565–1577. [Google Scholar] [CrossRef]
- VARGA, J.; TÓTH, T.; KAŠČÁK, Ľ.; SPIŠÁK, E. The effect of the machining strategy on the surface accuracy when milling with a ball end cutting tool of the aluminum alloy AlCu4Mg. Applied Sciences 2022, 12, 1–16. [Google Scholar] [CrossRef]
- VARGA, J.; SPIŠÁK, E.; GAJDOŠ, I.; MULIDRÁN, P. Comparison of milling strategies in the production of shaped surfaces. Advances in Science and Technology Research Journal 2022, 16, 267–274. [Google Scholar] [CrossRef]
- VARGA, J.; IŽOL, P.; VRABEĽ, M.; KAŠČÁK, Ľ.; DRBÚL, M.; BRINDZA, J. Surface Quality Evaluation in the Milling Process Using a Ball Nose End Mill. Applied Sciences. 2023, 13, 1–27. [Google Scholar] [CrossRef]
- KAYMAKCI, M.; LAZOGLU, I. Tool path selection strategies for complex sculptured surface machining. Machining Science and Technology. 2008, 12 (), 119–132. [Google Scholar] [CrossRef]
- DICIUC, V.; LOBONTIU, M.; NASUI, V. The modeling of the ball nose end milling process by using cad methods. Academic Journal of Manufacturing Engineering. 2011, (4), 42–47. [Google Scholar]
- BAGCI, E.; YÜNCÜOĞLU, E.U. The Effects of Milling Strategies on Forces, Material Removal Rate, Tool Deflection, and Surface Errors for the Rough Machining of Complex Surfaces. Journal of Mechanical Engineering. 2017, 63, 643–656. [Google Scholar] [CrossRef]
- WOJCIECHOWSKI, S.; WIACKIEWICZ, G.M.; KROLCZYK, G.M. Study on metrological relations between instant tool displacements and surface roughness during precise ball end milling. Measurement 2018, 129, 694. [Google Scholar] [CrossRef]
- TUYSUZ, O.; ALTINTAS, Y.; FENG, H.Y. Prediction of cutting forces in three and five-axis ball-end milling with tool indentation effect. International Journal of Machine Tools & Manufacture. 2013, 66, 66–81. [Google Scholar] [CrossRef]
- BAS, G.; DEMIRCIOGLU, P.; DURAKBASA, N.; OSANNA, P.H. A nanometrological management approach to assess the profile and the surface characteristics of the end milling tools by multi-measurement analysis. Proceedings of the XX IMEKO World Congress. Metrology for Green Growth, Busan, Korea. 2012, p. 1−5.
- MIZUGAKI, Y.; HAO, M.; KIKKAWA, K. Geometric Generating Mechanism of Machined Surface by Ball-nosed End Milling. In: CIRP Annals–Manufacturing Technology. Vol. 50, (2001), p. 69-72.
- CAPLA, R.; SOUZA, A.F.; BRANDÃO, L.C.; COELHO, R.T. Some effects of stock variations due to the use of 2 axes strategy on roughing. In: Proceedings of the 18th International Congress of Mechanical Engineering, Ouro Preto, Brazil, 2005.
- OUYANG, D.; VAN NEST, B. A.; FENG, H. Y. Automatic Ball-End Milling Tool Selection from 3D Point Cloud Data. Flexible Automation and Intelligent Manufacturing, FAIM2004, 2004, pp. 253–260, Toronto, Canada.
- CHOI, B.K.; JUN, C.S. Ball-end cutter interference avoidance in NC machining of sculptured surfaces. Computer Aided Design 1989, 21, 371–378. [Google Scholar] [CrossRef]
- PARK, S.C. Tool path generation for Z-constant contour machining. Computer-Aided Design. 2003, 35, 27–36. [Google Scholar] [CrossRef]
- LACALLE, L.N.L.; LAMIKIZ, A.; POLVOROSA, R.; VALDIVIELSO, A.F.; CALLEJA, A.; GONZALES, H.; ARTEXTE, E. Optimised methodology for aircraft engine IBRs five-axis machining process. International Journal of Mechatronics and Manufacturing Systems. 2016, 9, 385. [Google Scholar] [CrossRef]
- SADÍLEK, M.; PORUBA, Z.; ČEPOVÁ, L.; ŠAJGALÍK, M. Increasing the Accuracy of Free-Form Surface Multiaxis Milling. Materials. 2021, 14, 1–15. [Google Scholar] [CrossRef] [PubMed]
- GREŠOVÁ, Z.; IŽOL, P.; VRABEĽ, M.; KAŠČÁK, Ľ.; BRINDZA, J.; DEMKO, M. Influence of Ball-End Milling Strategy on the Accuracy and Roughness of Free Form Surfaces. Applied Sciences. 2022, 12, 4421. [Google Scholar] [CrossRef]
- TRAN, V.H.; Truong, T.T.; BUI, K.K.; Le, H.K. Quality Assessment of Freeform Surface Manufactured by CNC Milling Using Point Cloud Data Obtained from Different Scanning Devices. Proceedings of the International Conference on Advanced Mechanical Engineering, Automation, and Sustainable Development 2021. 2022, 39–45. [Google Scholar] [CrossRef] [PubMed]
- MASOOD, A.; SIDDIQUI, R.; PINTO, M.; REHMAN, H.; KHAN, M.A. Tool path generation, for complex surface machining, using point cloud data. Procedia CIRP. 2015, 26, 397–402. [Google Scholar] [CrossRef]
- LI, YADONG.; GU, PEIHUA, G. Inspection of free-form shaped parts. Robotics and Computer-Integrated Manufacturing. 2005, 21, 421–430. [CrossRef]
- DENG, G.; WANG. G.; DUAN, J. A new algorithm for evaluating form error: the valid characteristic point method with the rapidly contracted constraint zone. Journal of Materials Processing Technology. 2003, 139, 247–252. [CrossRef]
- YUWEN, S.; XIAOMING, W.; DONGMING, G.; JIAN, L. Machining localization and quality evaluation of parts with sculptured surfaces using SQP method. Int J Adv Manuf Technol. 2009, 42, 1131–1139. [Google Scholar] [CrossRef]
- ZHANG, Y.; ZHOU, Z.; TANG, K. Sweep scan path planning for five-axis inspection of free-form surfaces. Robotics and Computer-Integrated Manufacturing. 2018, 49, 335–348. [Google Scholar] [CrossRef]
- CHEN, X.X.; ZHAO, J.; ZHANG, W.W. Optimization analysis considering the cutting effects for high-speed five-axis down milling process by employing ball end mill. Int. J. Adv. Manuf. Technol. 2019, 105, 4989–5008. [Google Scholar] [CrossRef]
- BOZ, Y.; KHAVIDAKI, S.E.L.; ERDIM, H.; LAZOGLU, I. High Performance 5-Axis Milling of Complex Sculptured Surfaces. Machining of Complex Sculptured Surfaces. 2012, 67–125. [Google Scholar]
- SZPUNAR, M.; OSTROWSKI, R.; TRZEPIECINSKI, T.; KAŠČÁK, Ľ. Central Composite Design Optimisation in Single Point Incremental Forming of Truncated Cones from Commercially Pure Titanium Grade 2 Sheet Metals. Materials. 2021, 14, 1–20. [Google Scholar] [CrossRef] [PubMed]
- DÚRAVČIK, M.; KENDER, Š. Application of reverse engineering techniques in mechanics system services. Procedia Engineering. 2012, 48, 96–104. [Google Scholar] [CrossRef]
- KENDER, Š.; BREZINOVÁ, J. Reverse engineering in automotive design component. International Scientific Journal. 2022, 7, 62–65. [Google Scholar]
Figure 1.
CAD model of human face
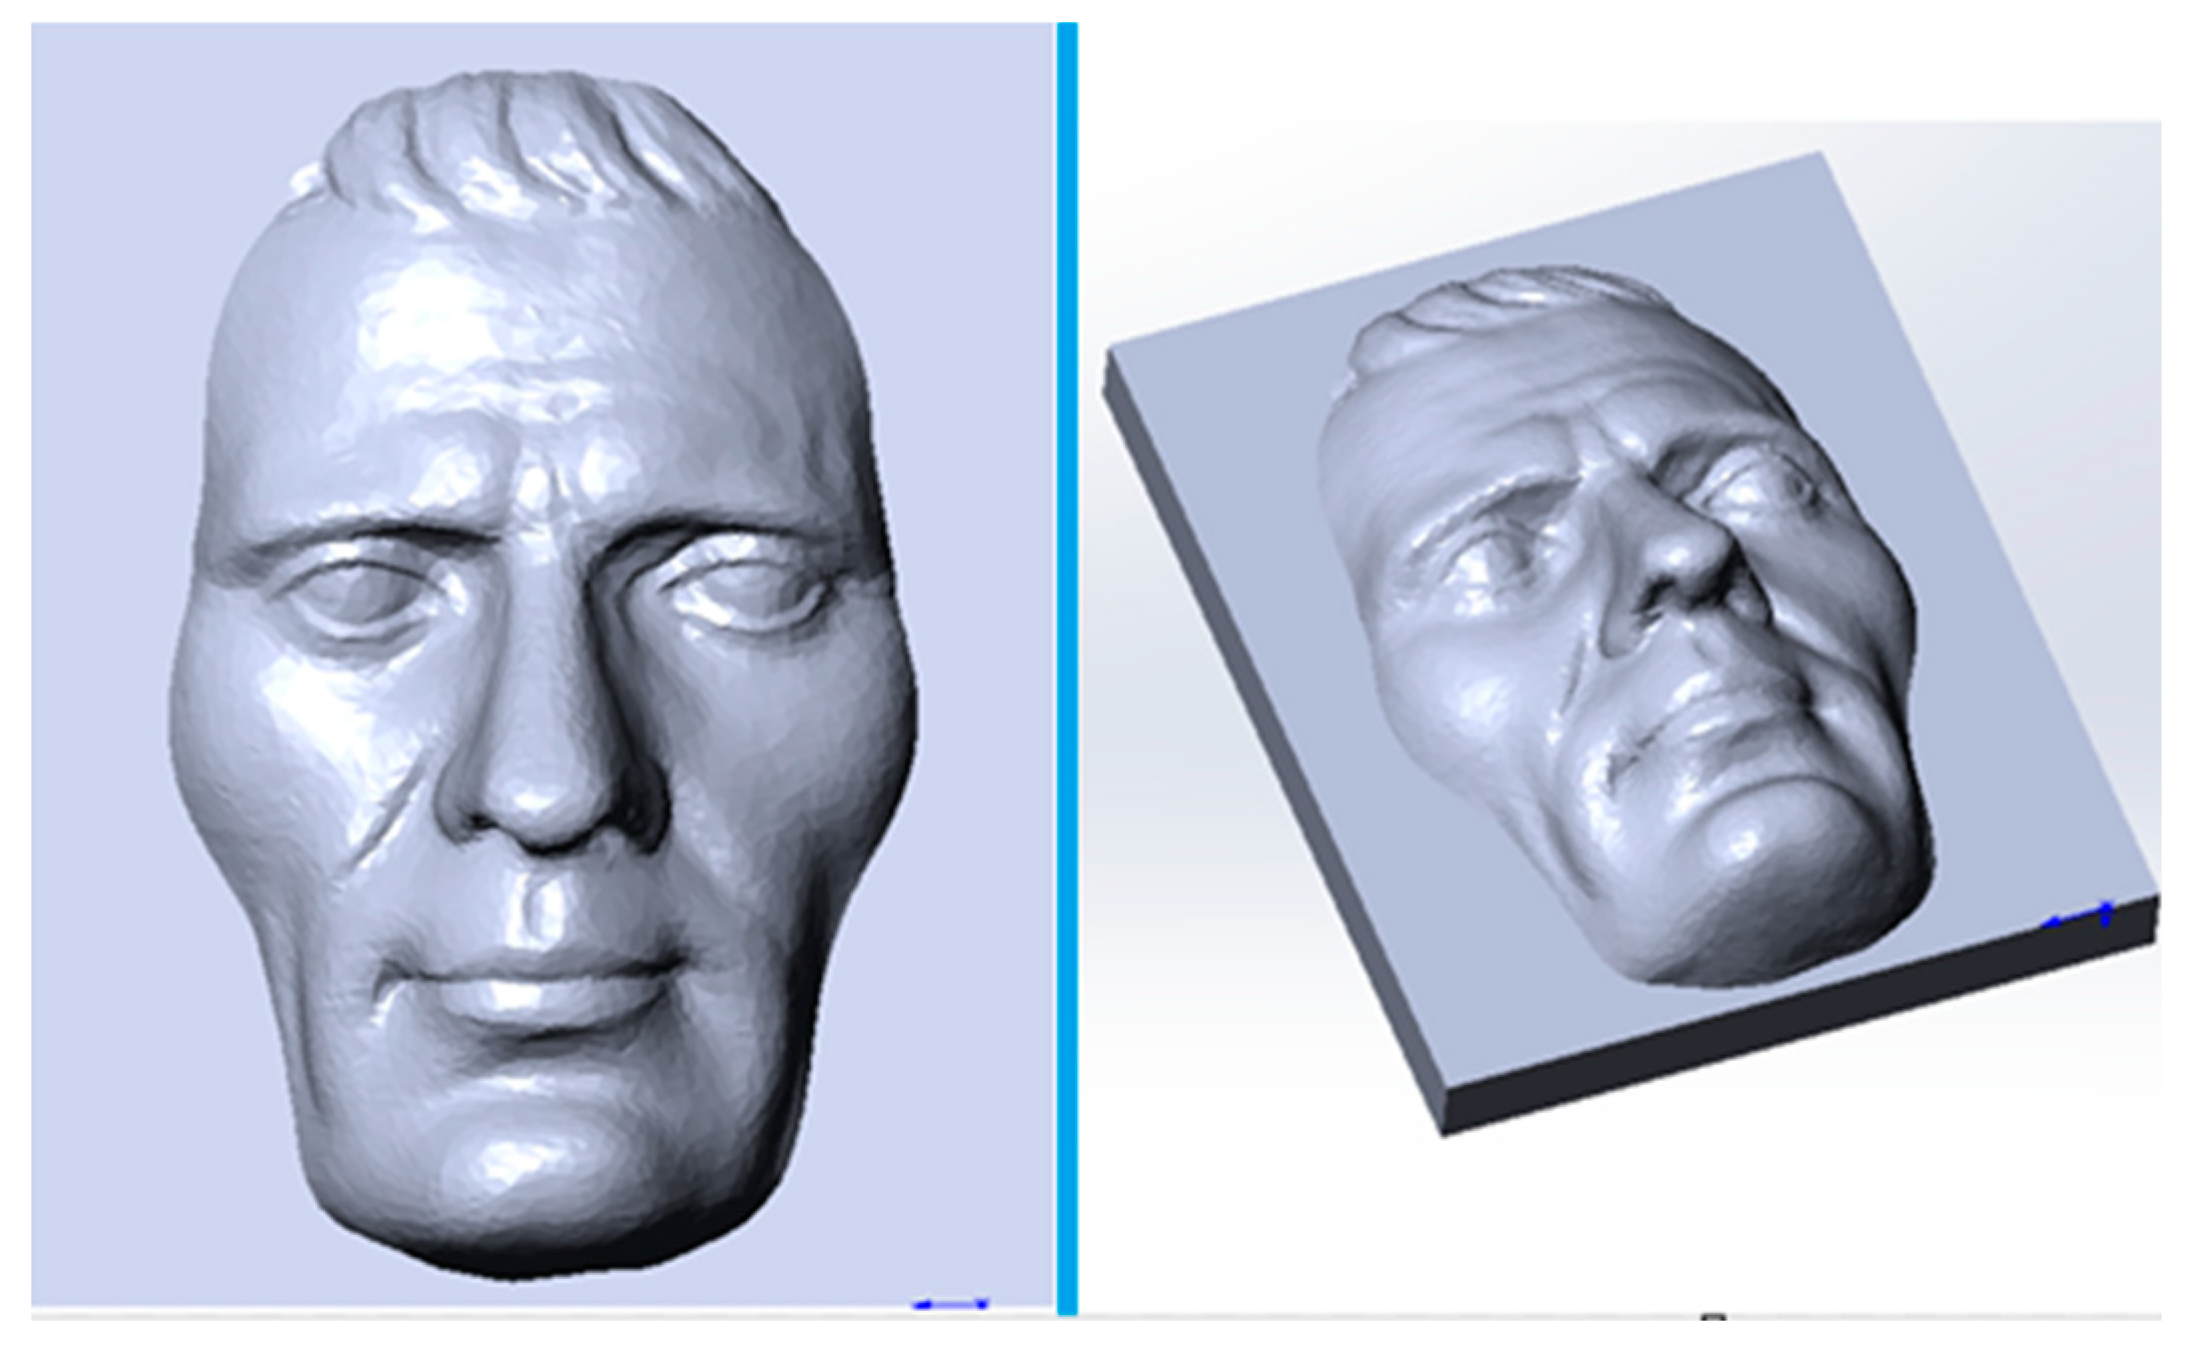
Figure 2.
Individual positions intended for Deff evaluation
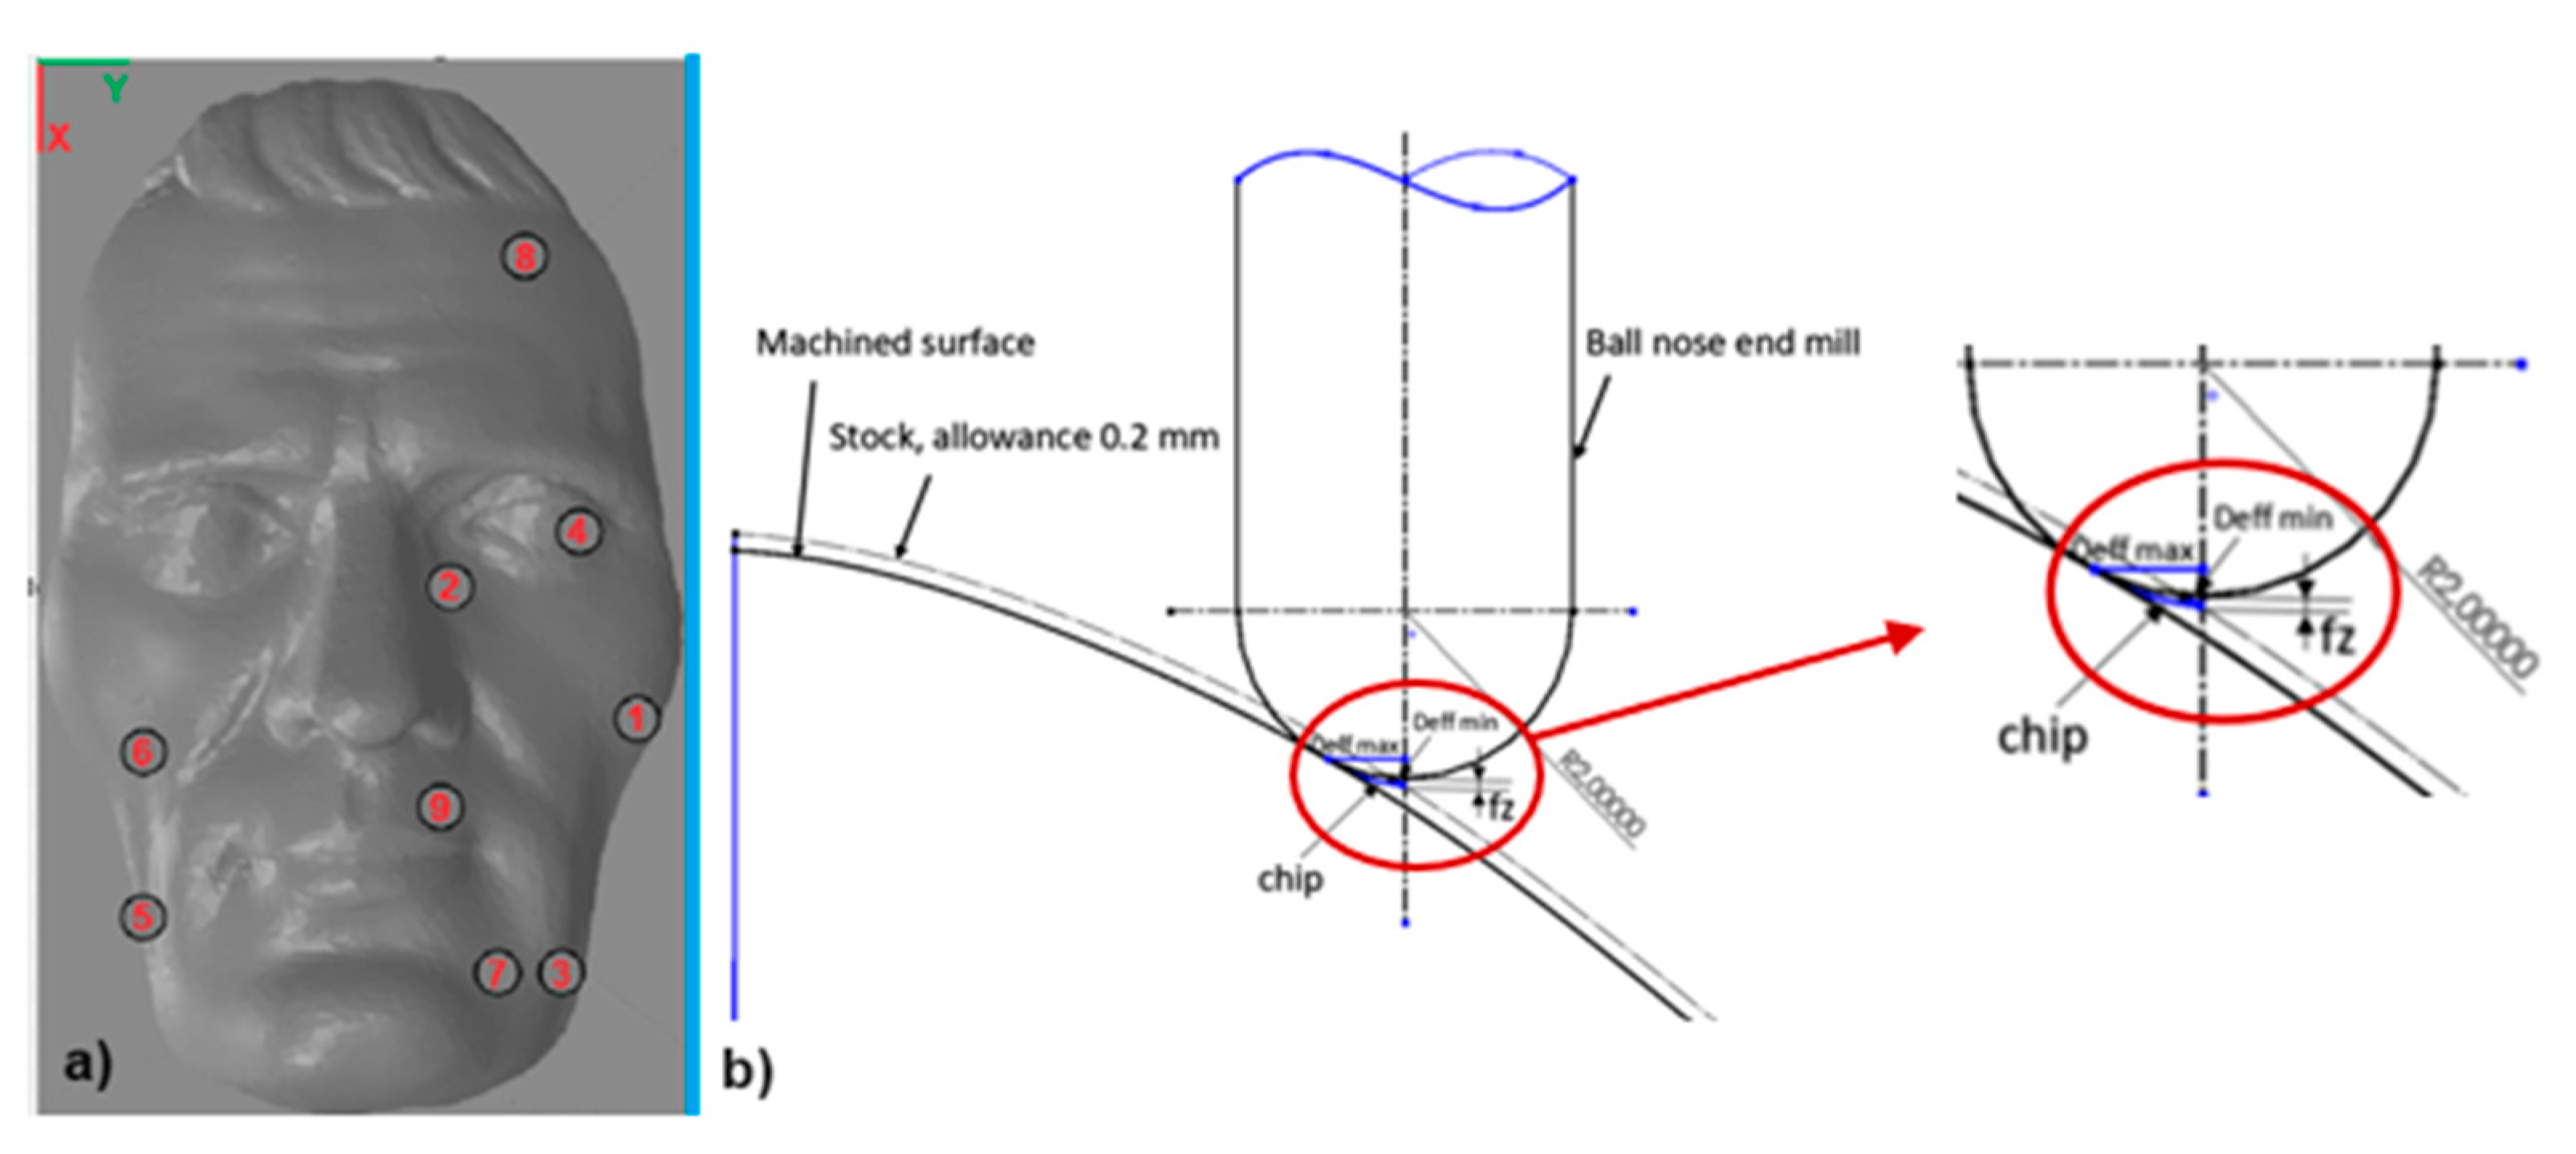
Figure 3.
View of the extraction of the image of the copying tool to the machined surface
Figure 4.
3D scan view
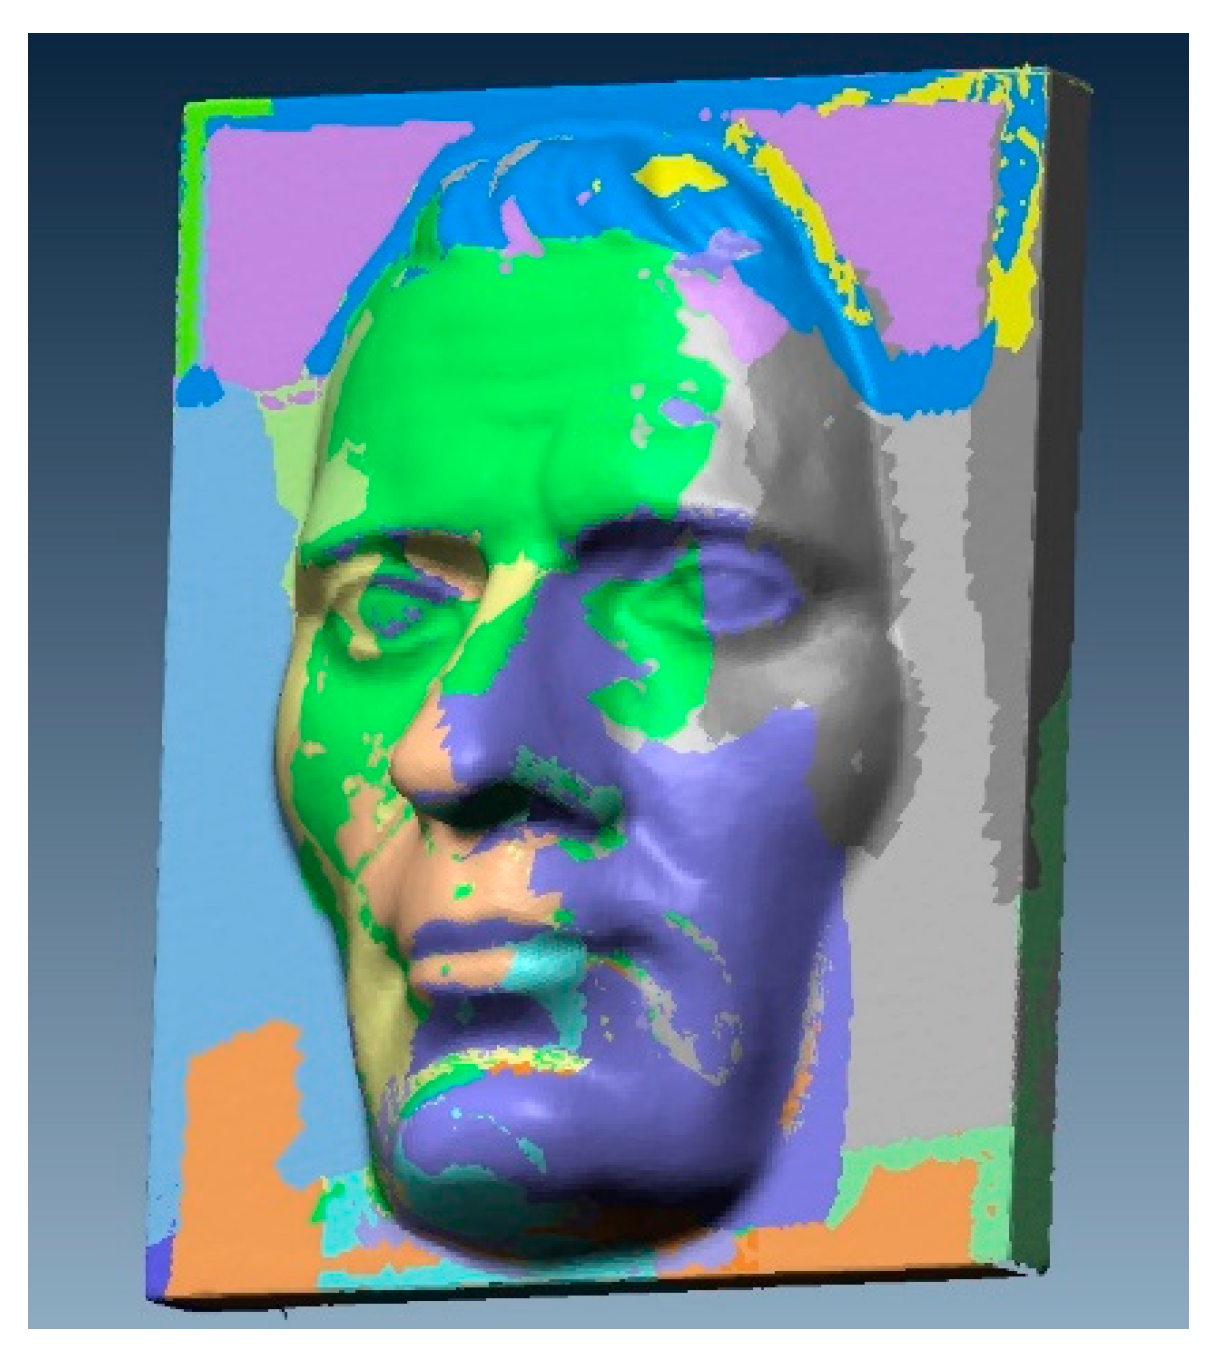
Figure 5.
Comparison of 3D scan and 3D model a) imported point cloud b) imported model
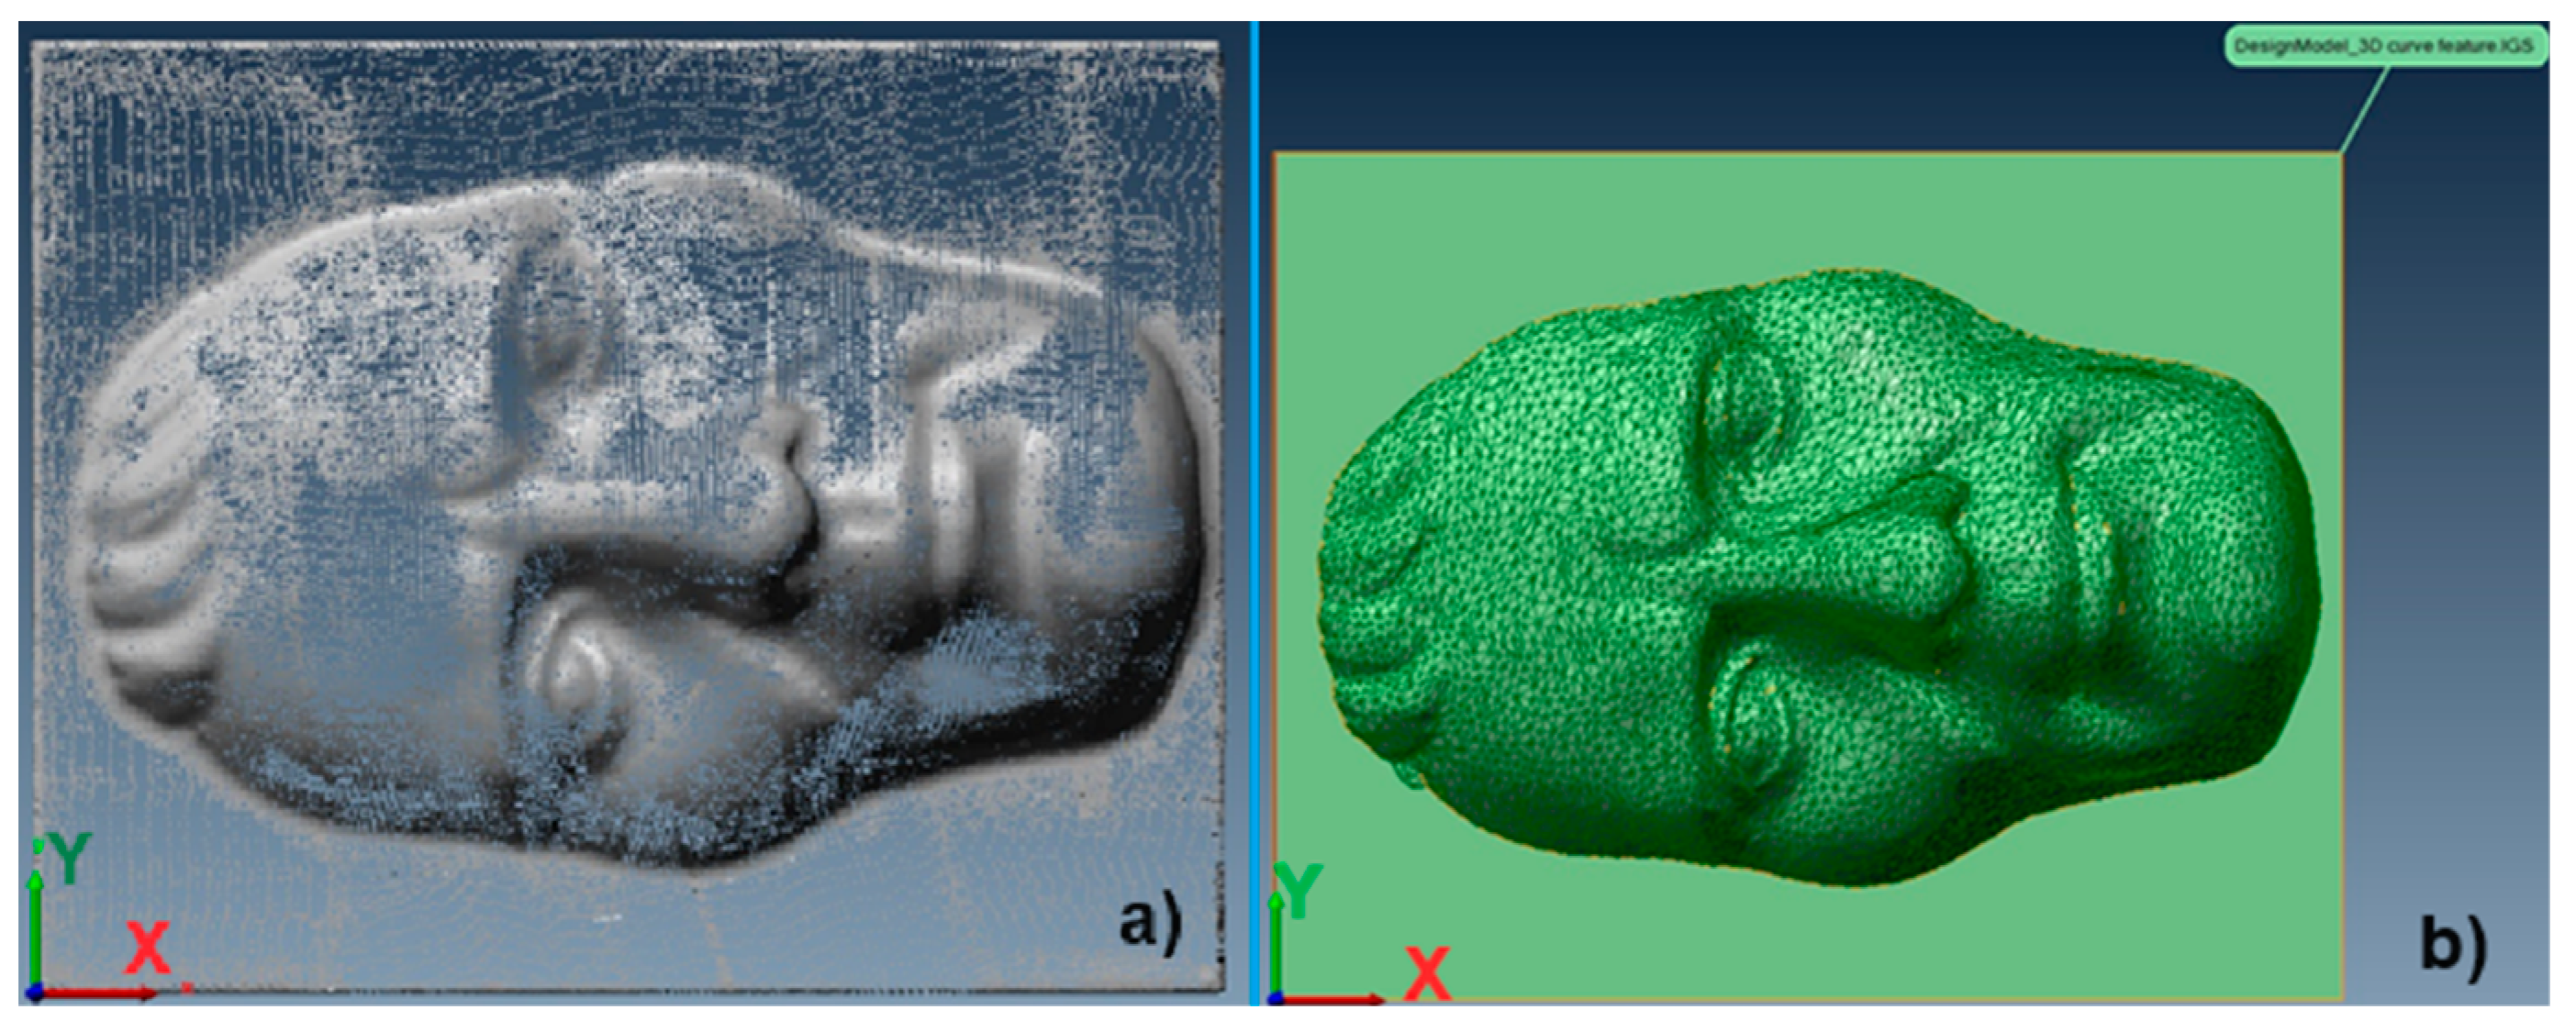
Figure 6.
Overlaying the 3D scan with a 3D face model
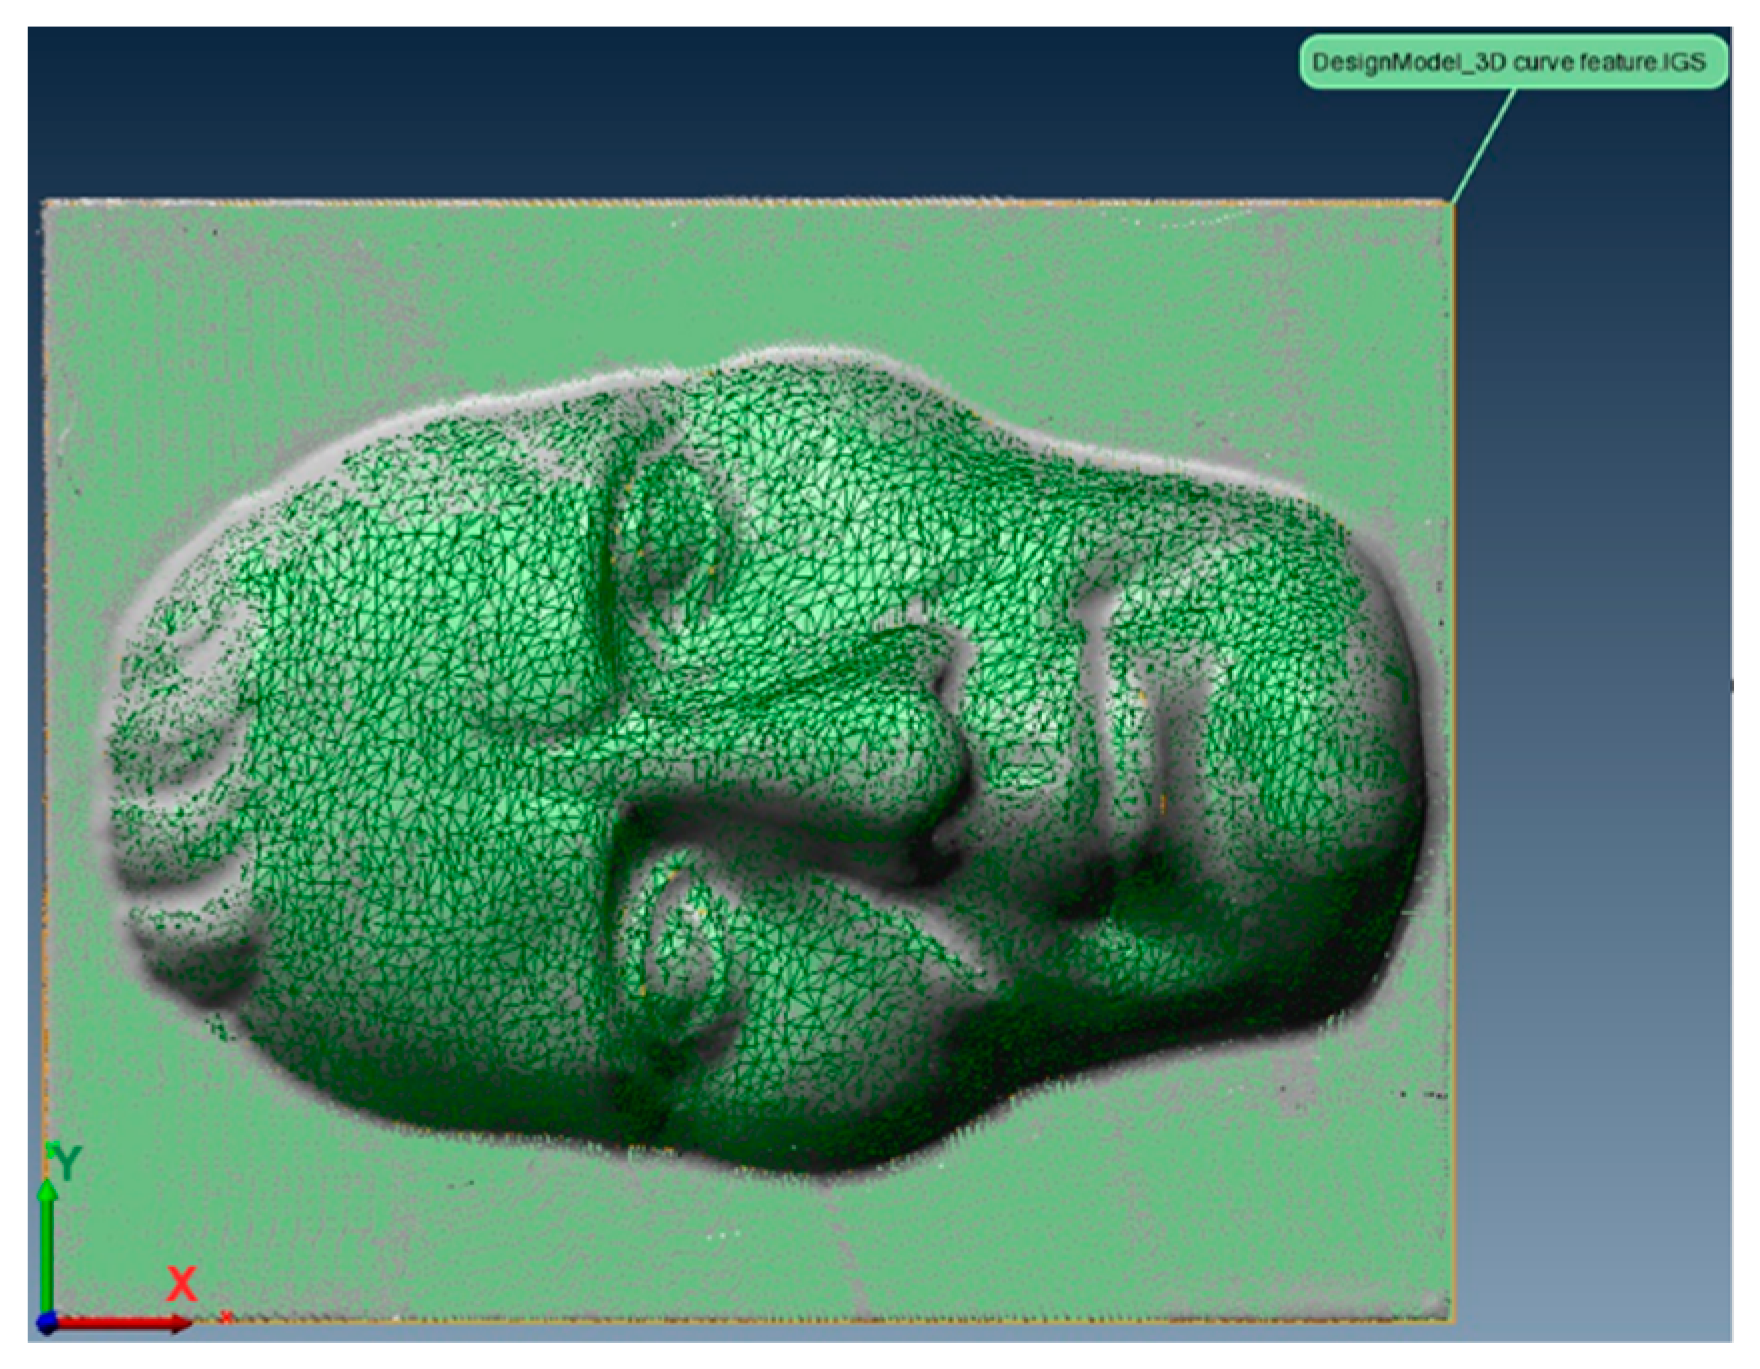
Figure 7.
Visual comparison of roughing operation a) tool path b) simulation mode c) real production
Figure 7.
Visual comparison of roughing operation a) tool path b) simulation mode c) real production
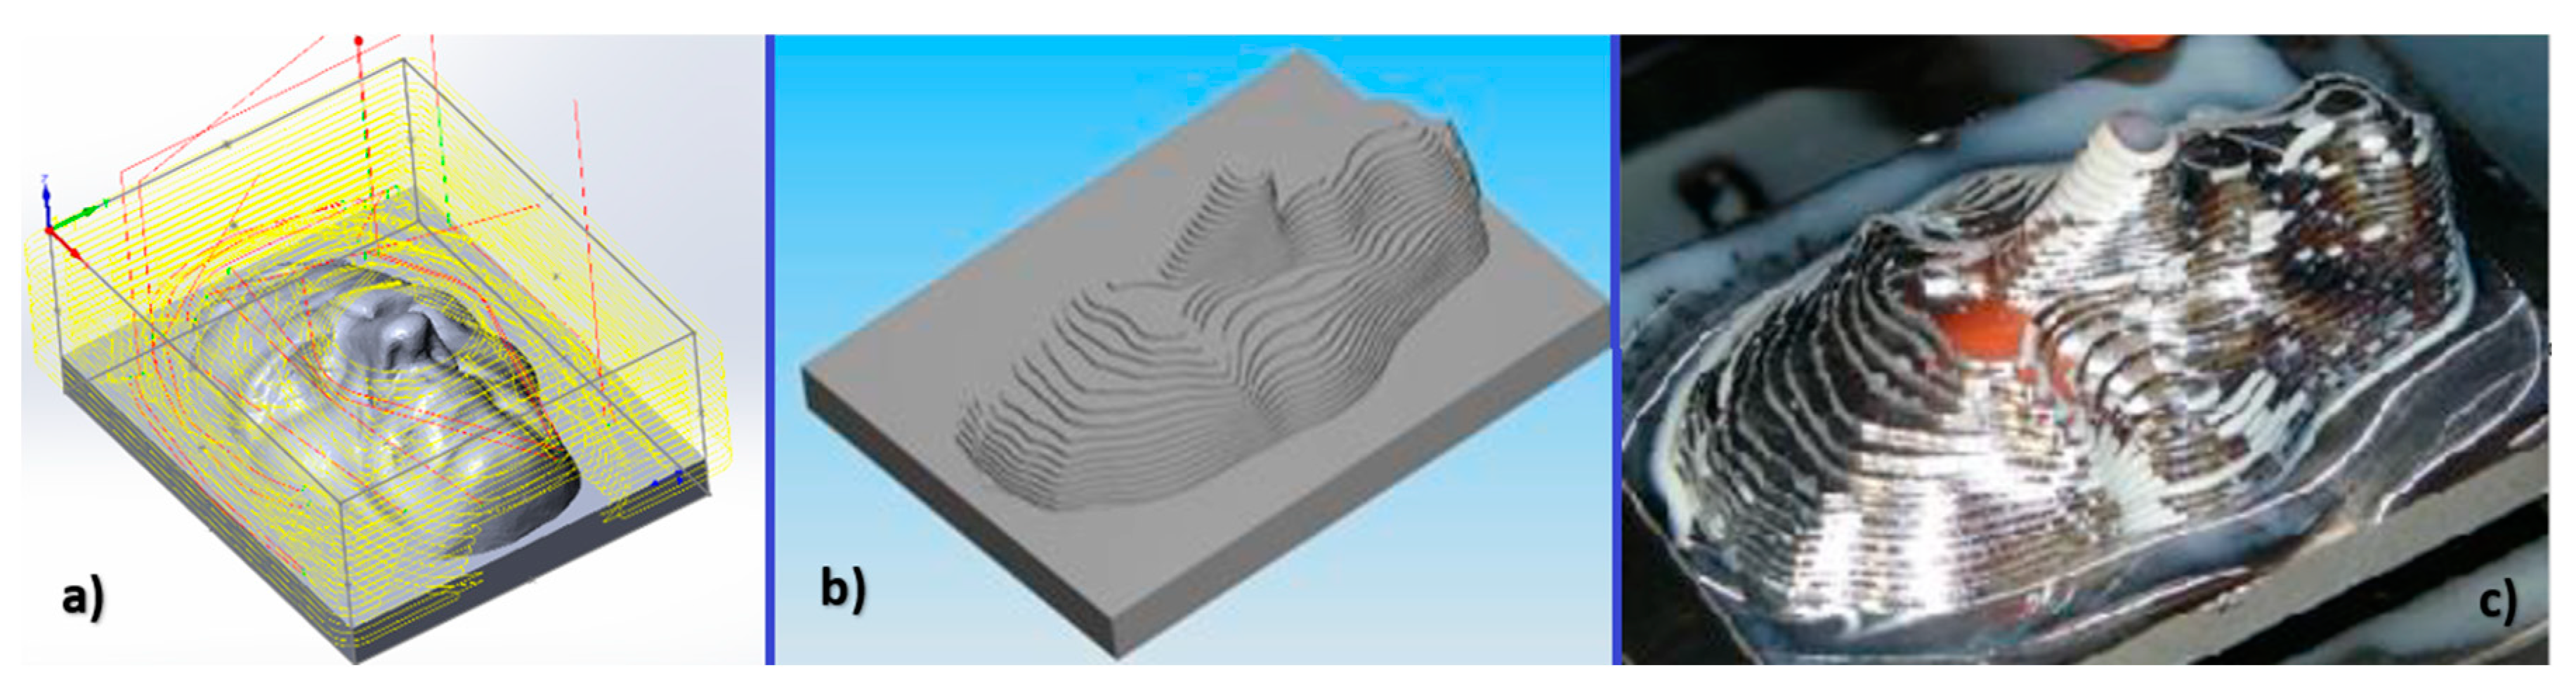
Figure 8.
Visual comparison of pre-finishing operation a) tool path b) simulation mode c) production
Figure 8.
Visual comparison of pre-finishing operation a) tool path b) simulation mode c) production
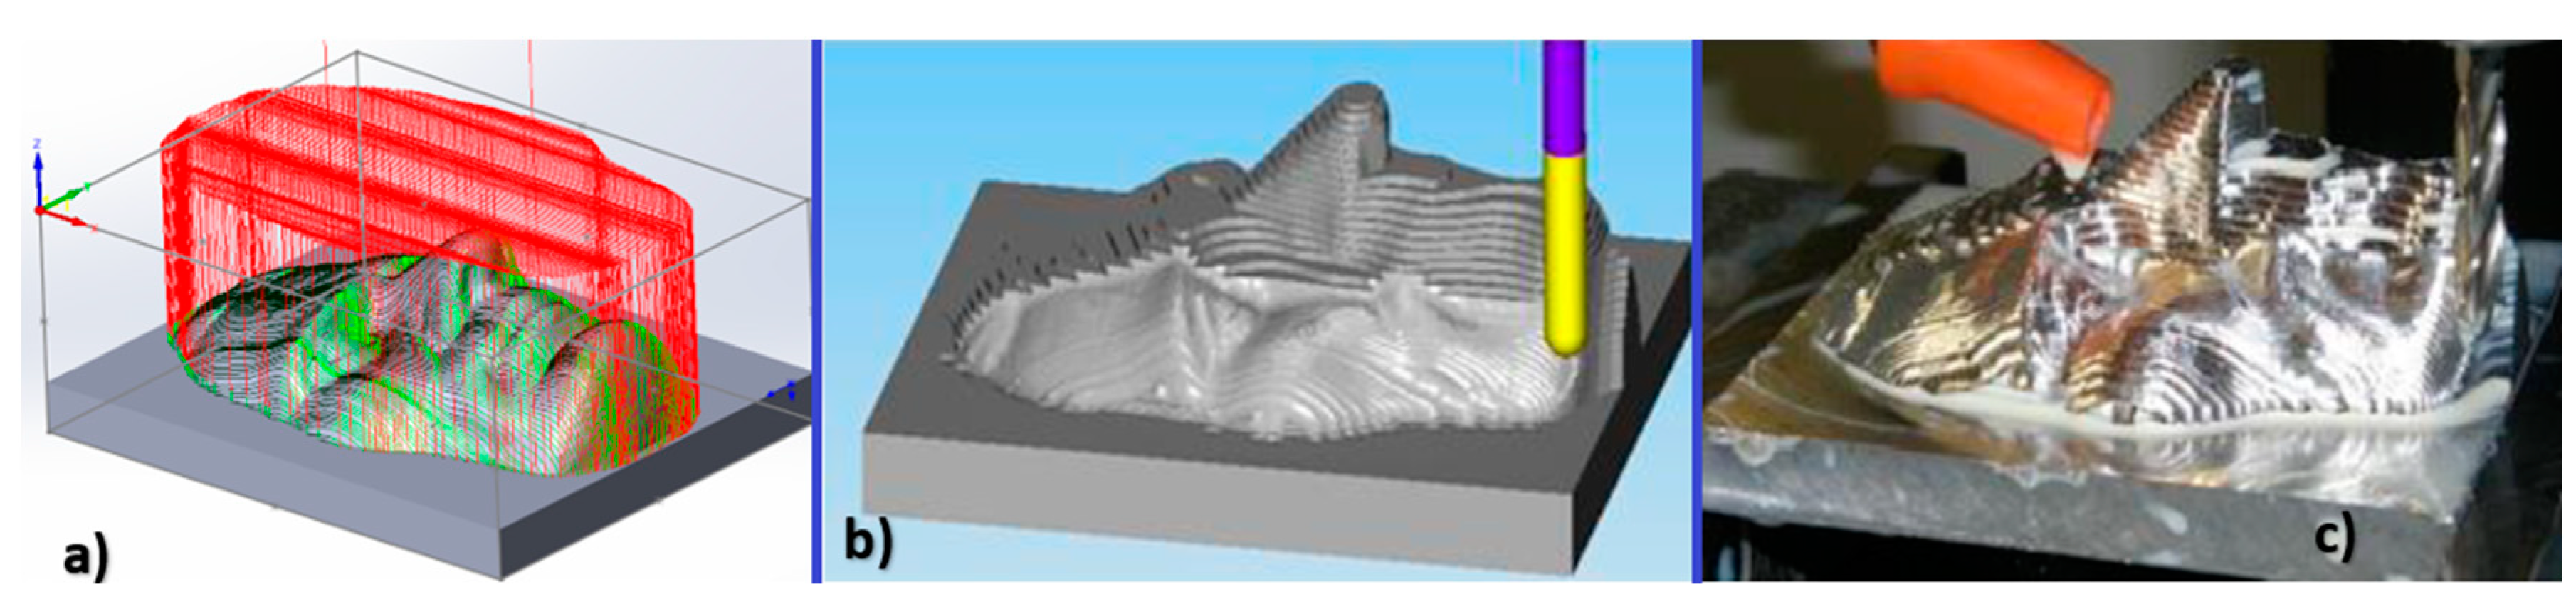
Figure 9.
Figure 9. Display of tool paths for linear strategy a) CAM system b) residual material
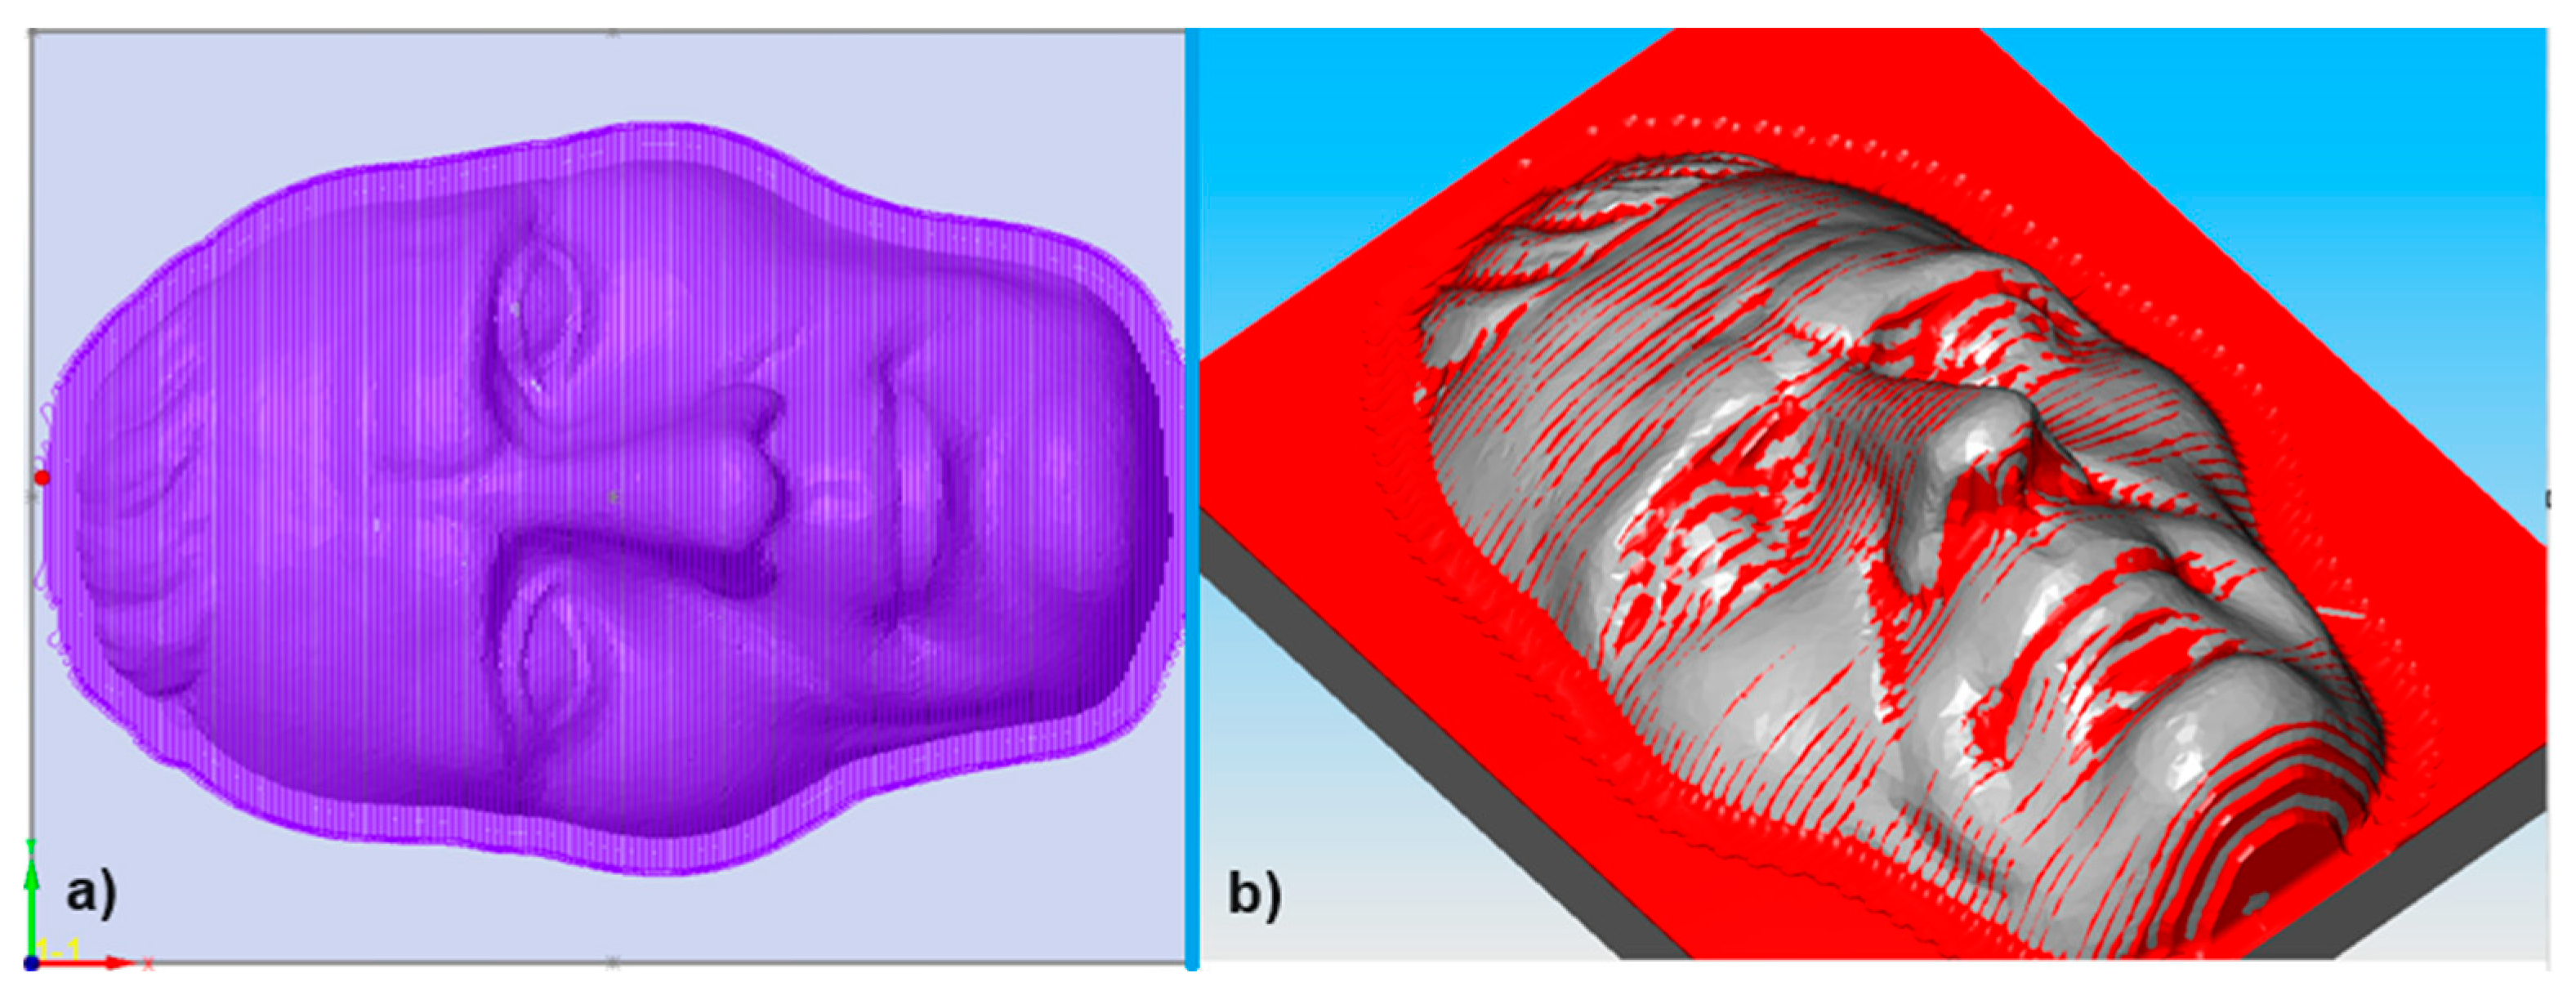
Figure 10.
Figure 10. Display of tool paths for constant step over strategy a) CAM system b) residual material
Figure 10.
Figure 10. Display of tool paths for constant step over strategy a) CAM system b) residual material
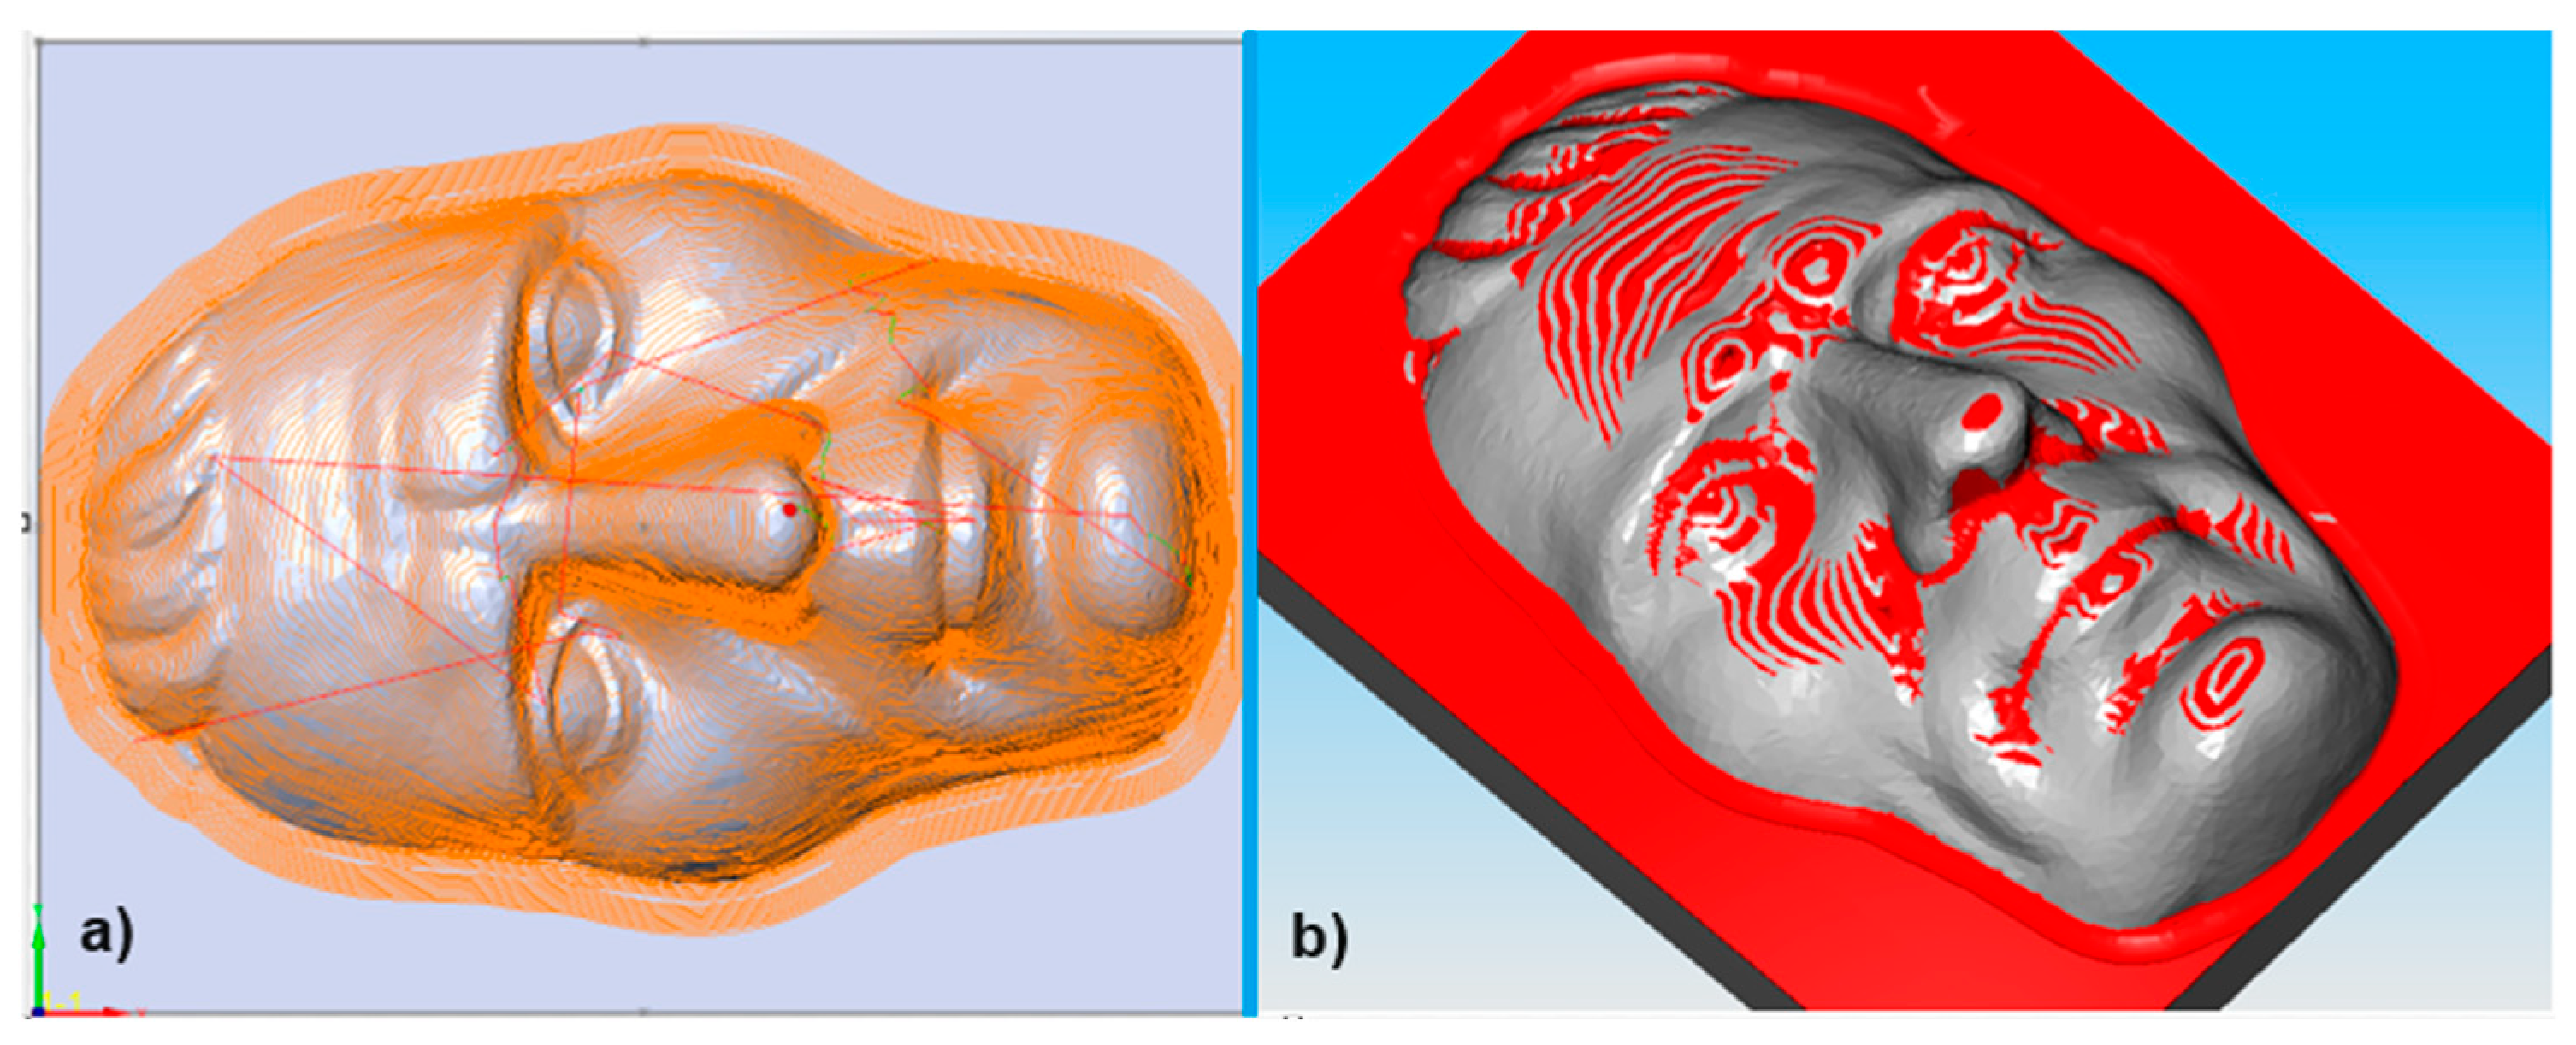
Figure 11.
Figure 11. Display of toolpaths for constant Z strategy a) CAM system b) residual material
Figure 11.
Figure 11. Display of toolpaths for constant Z strategy a) CAM system b) residual material
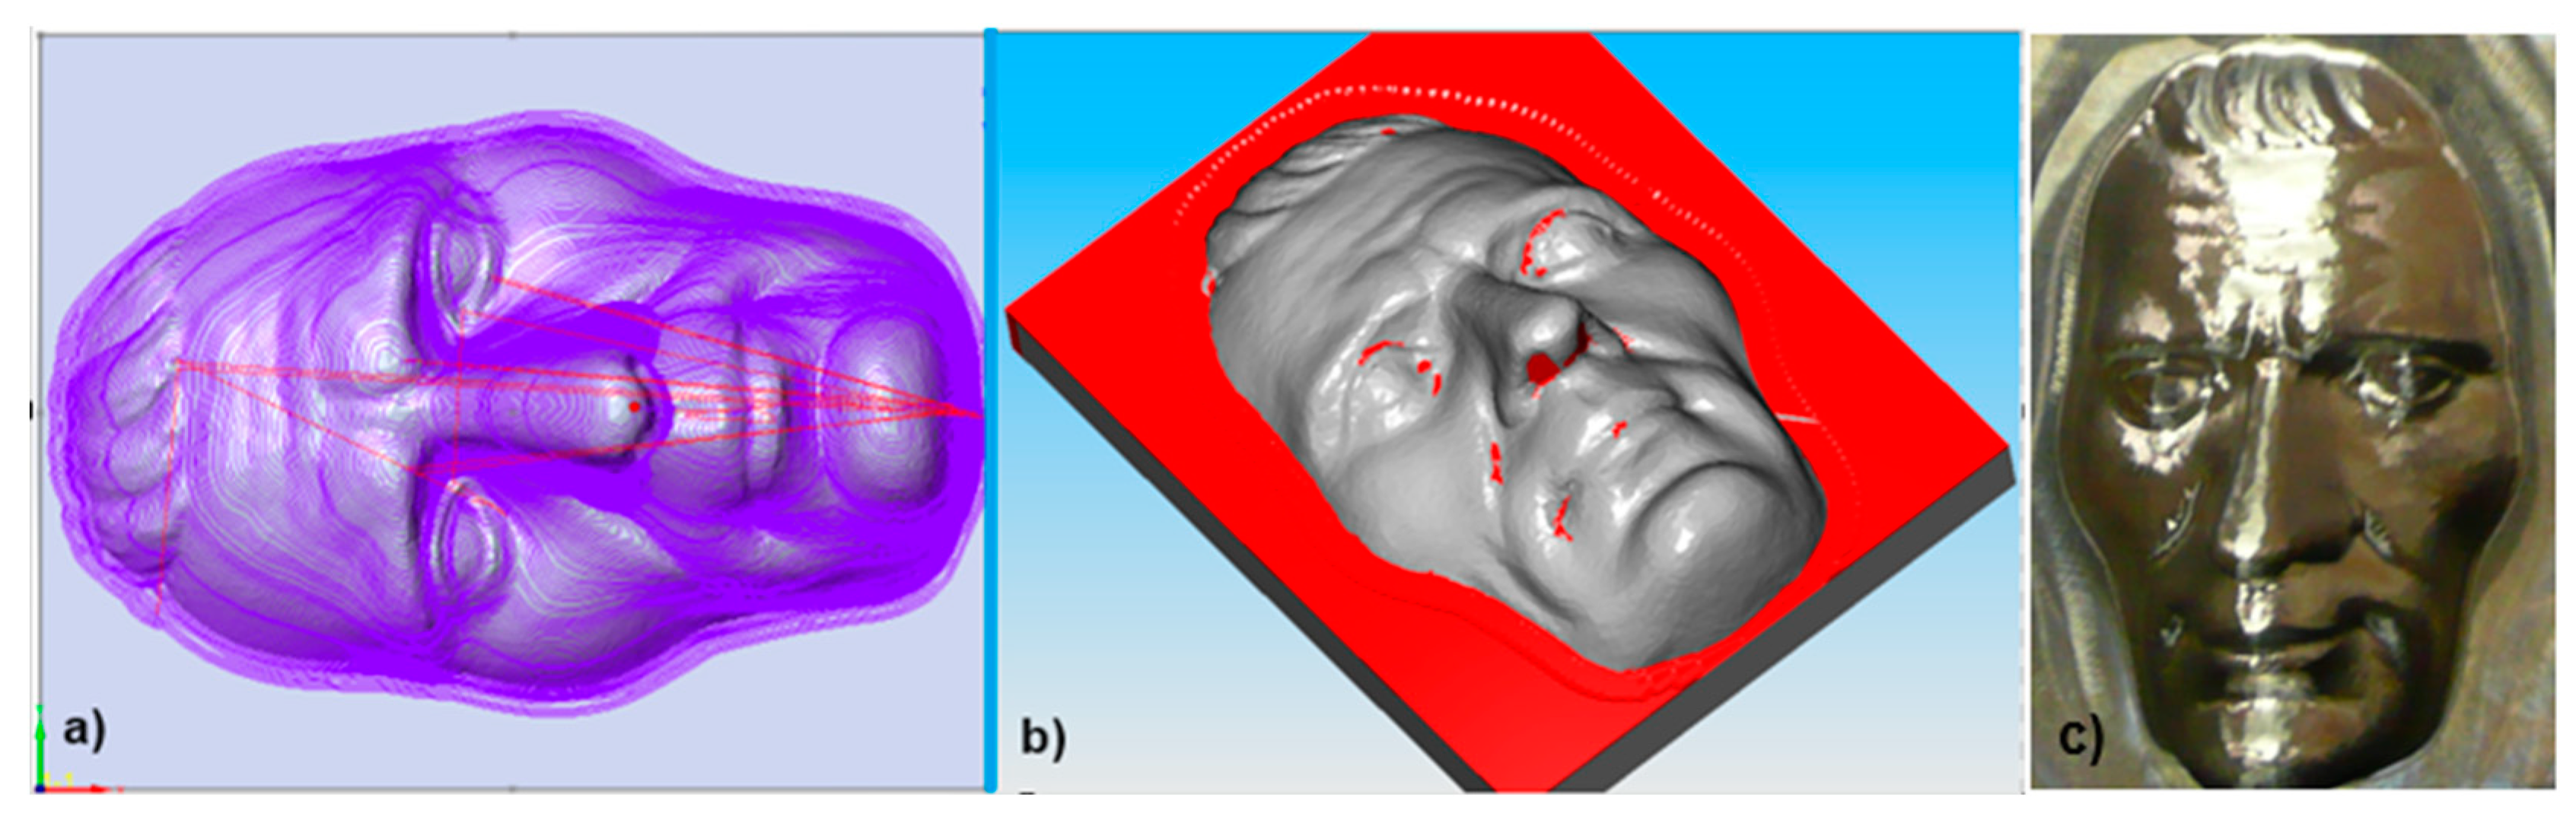
Figure 12.
Display of individual interactions between the tool and the machined surface
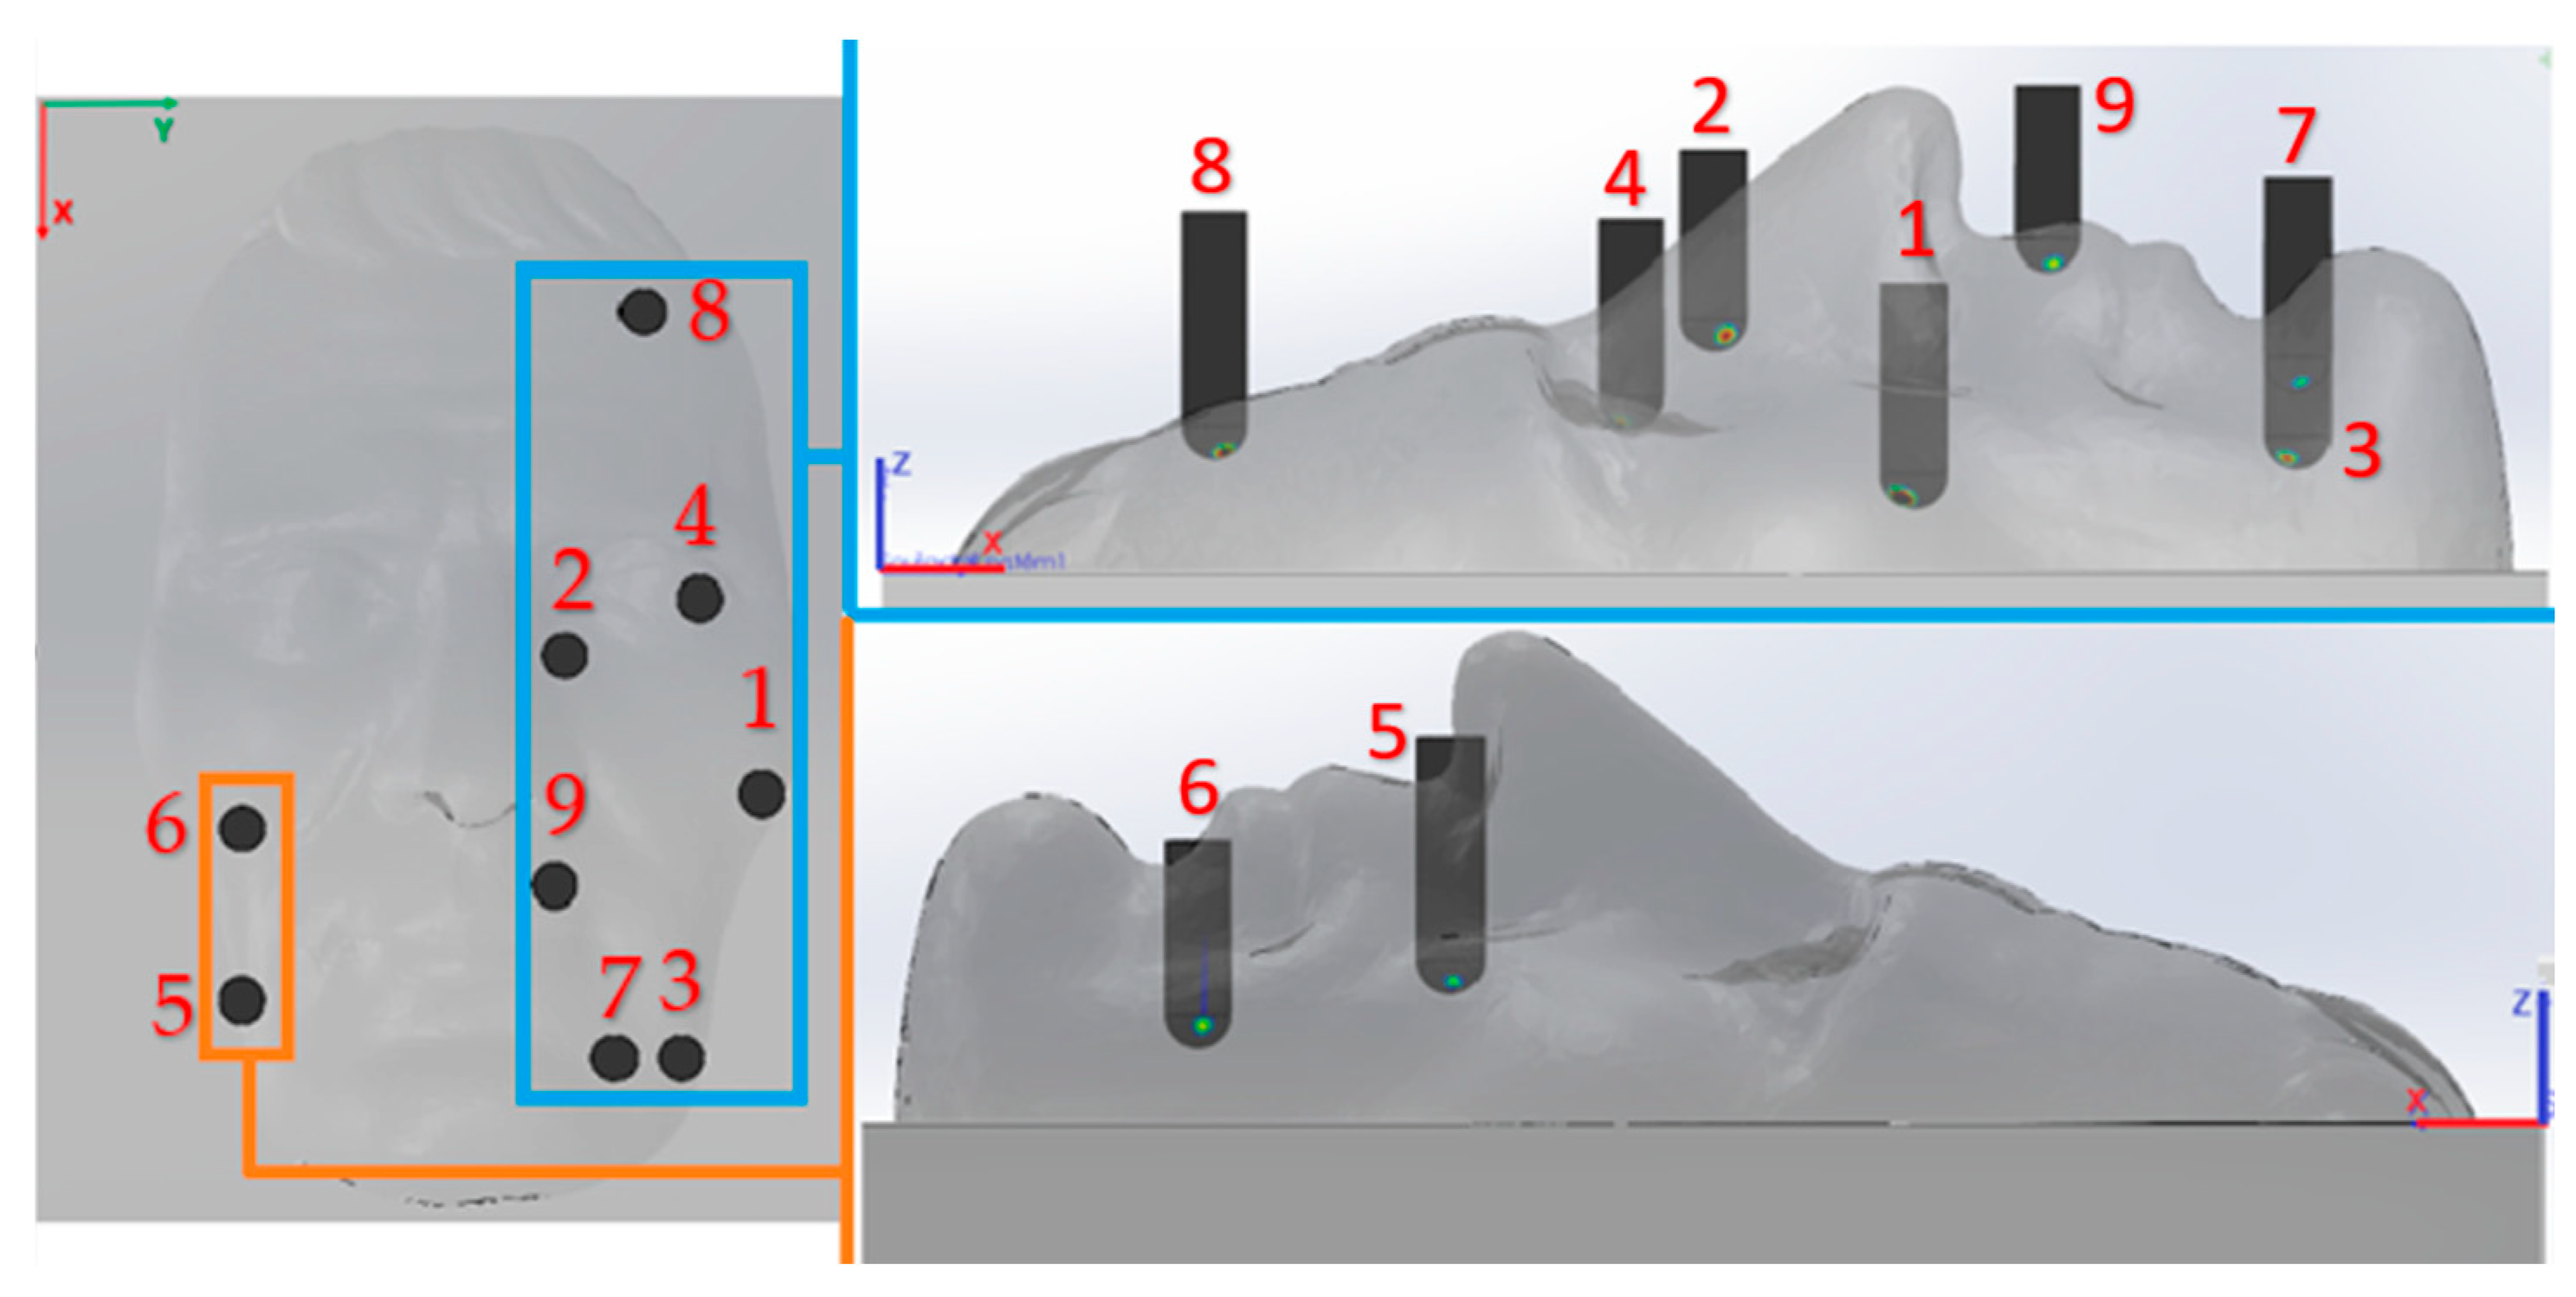
Figure 13.
Comparison of Deff max and Deff min values with respect to the tool-workpiece position
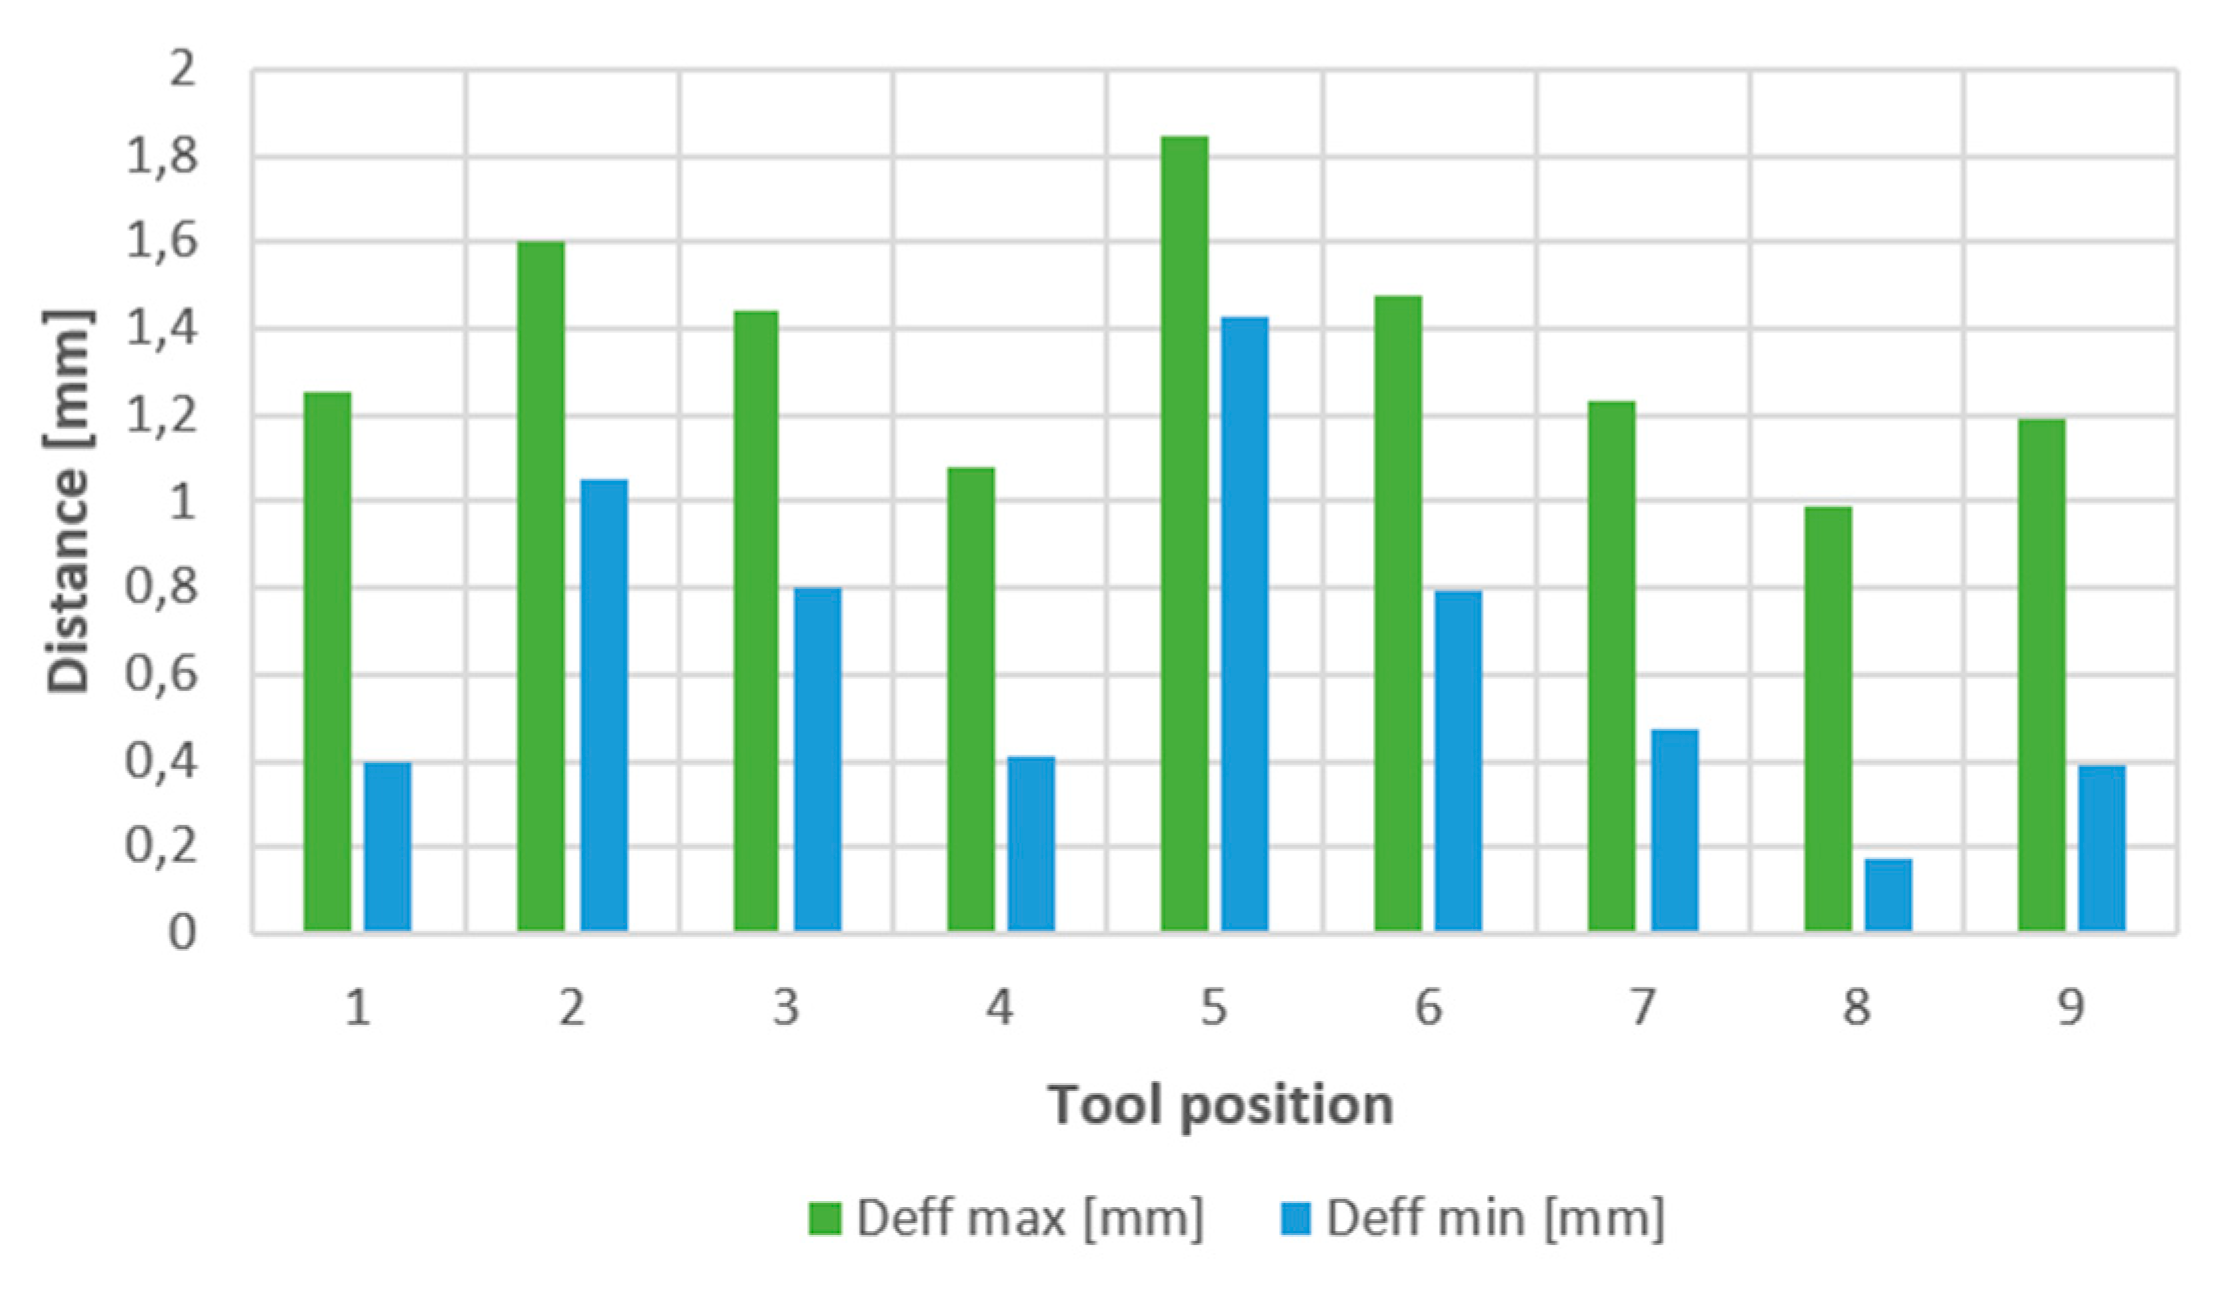
Figure 14.
Comparison of area content and volume with respect to the position of the tool—workpiece
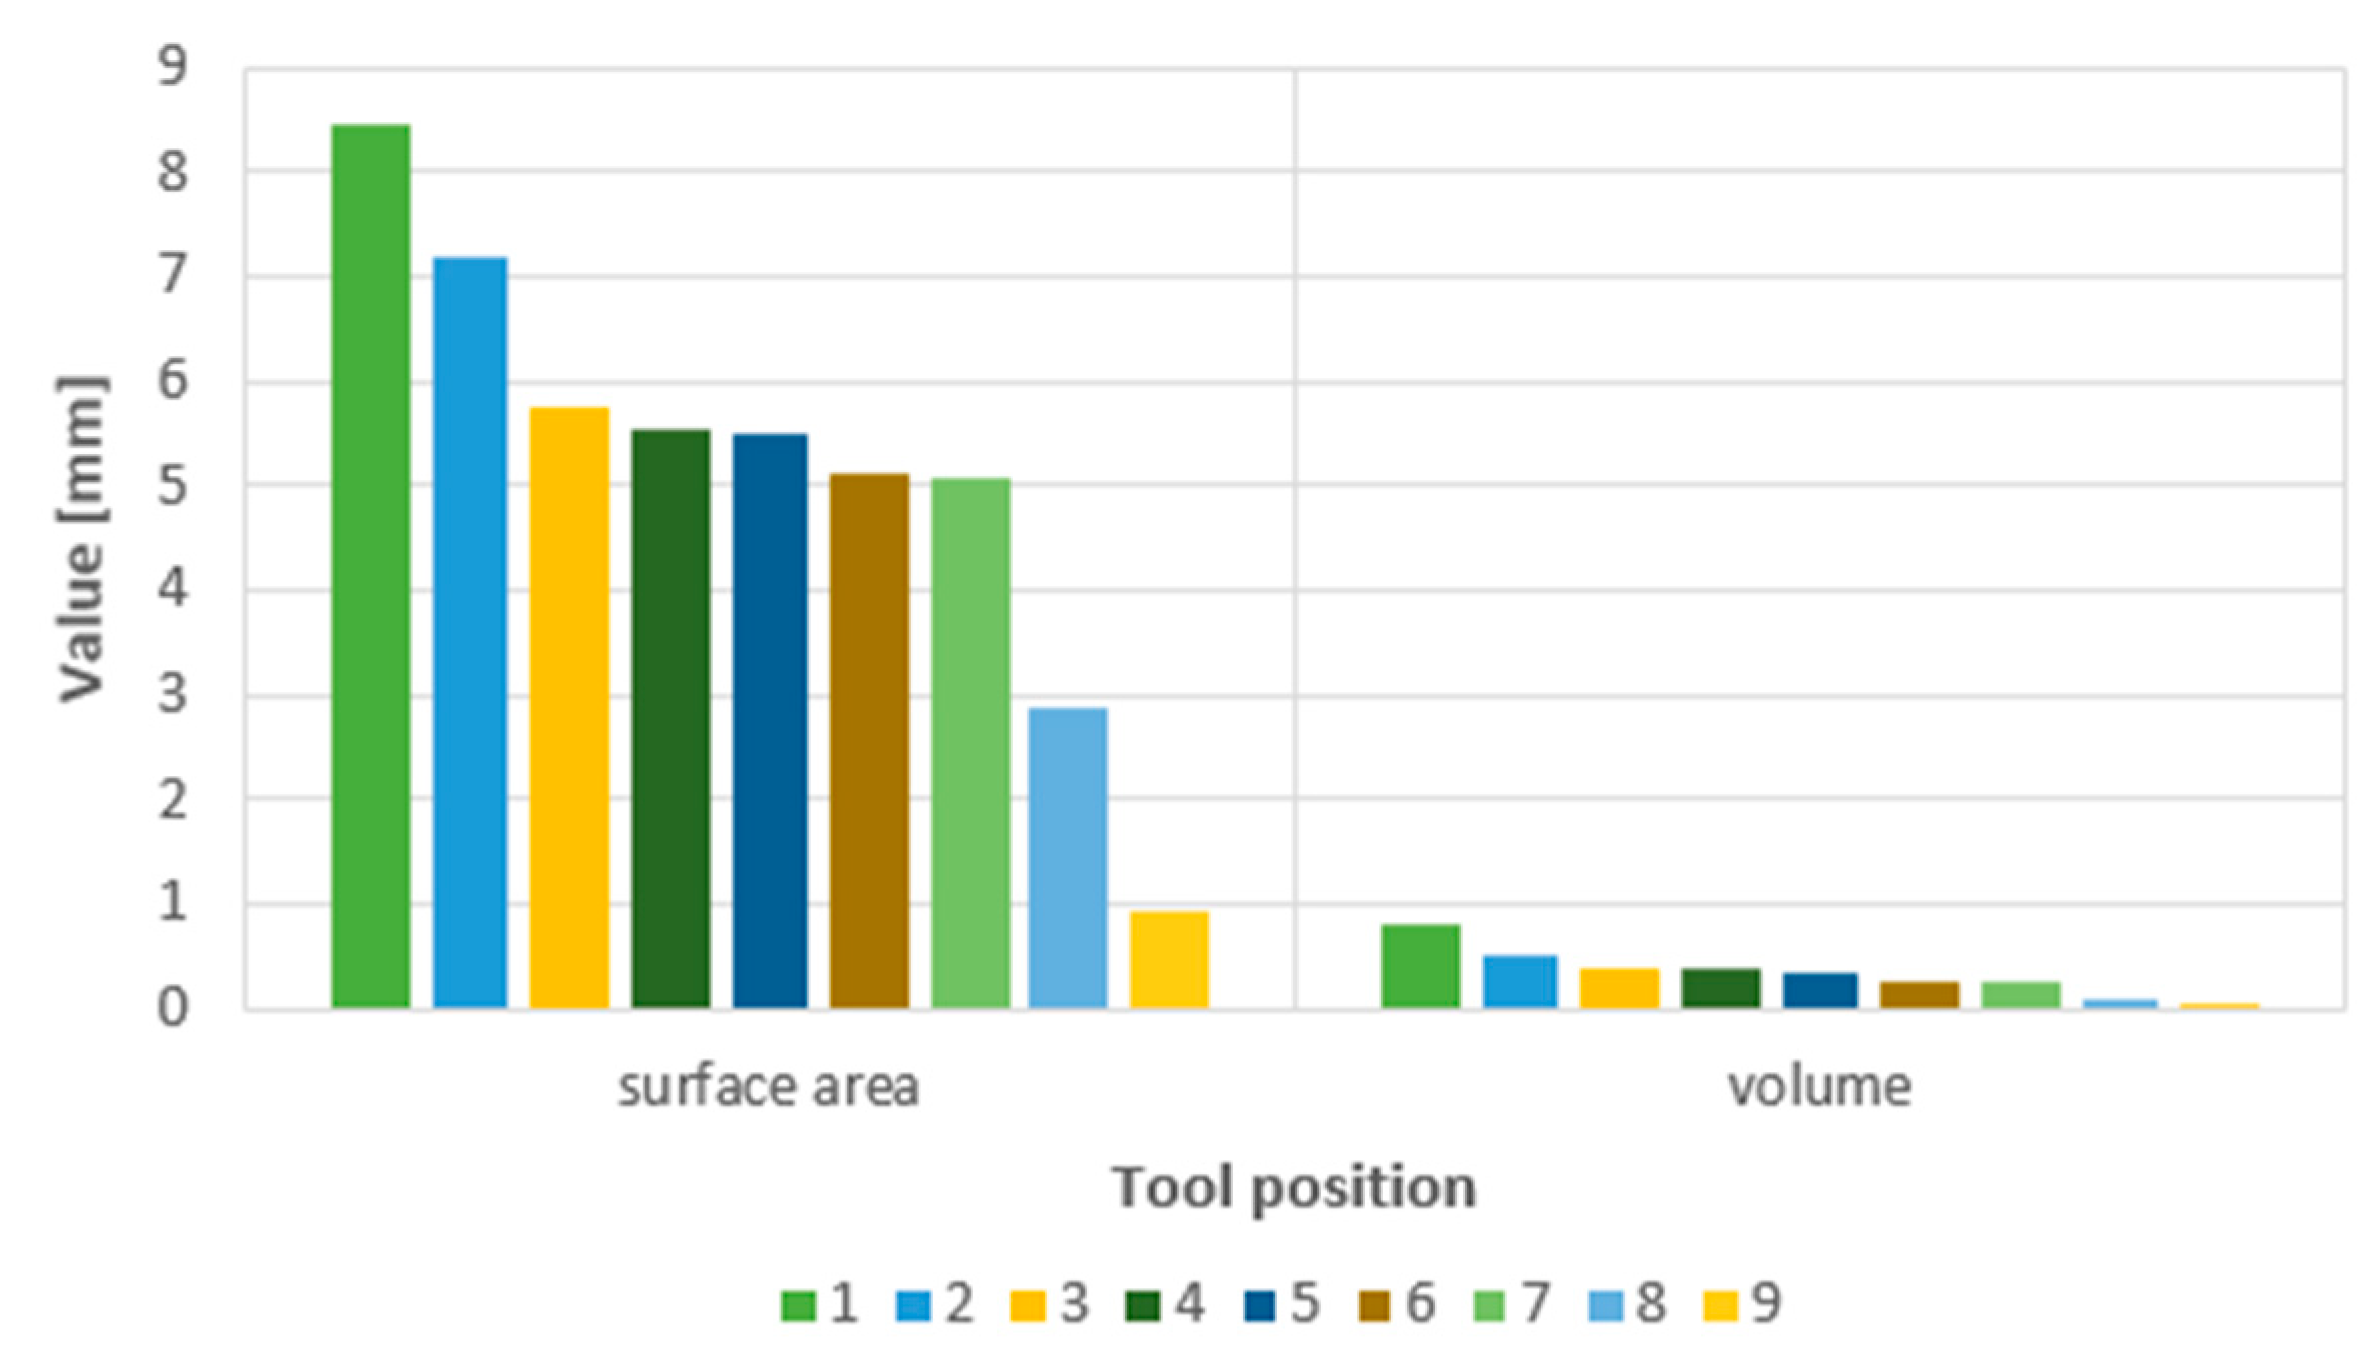
Figure 15.
Overall comparison of area content, volume and parameter Deff max, Deff min
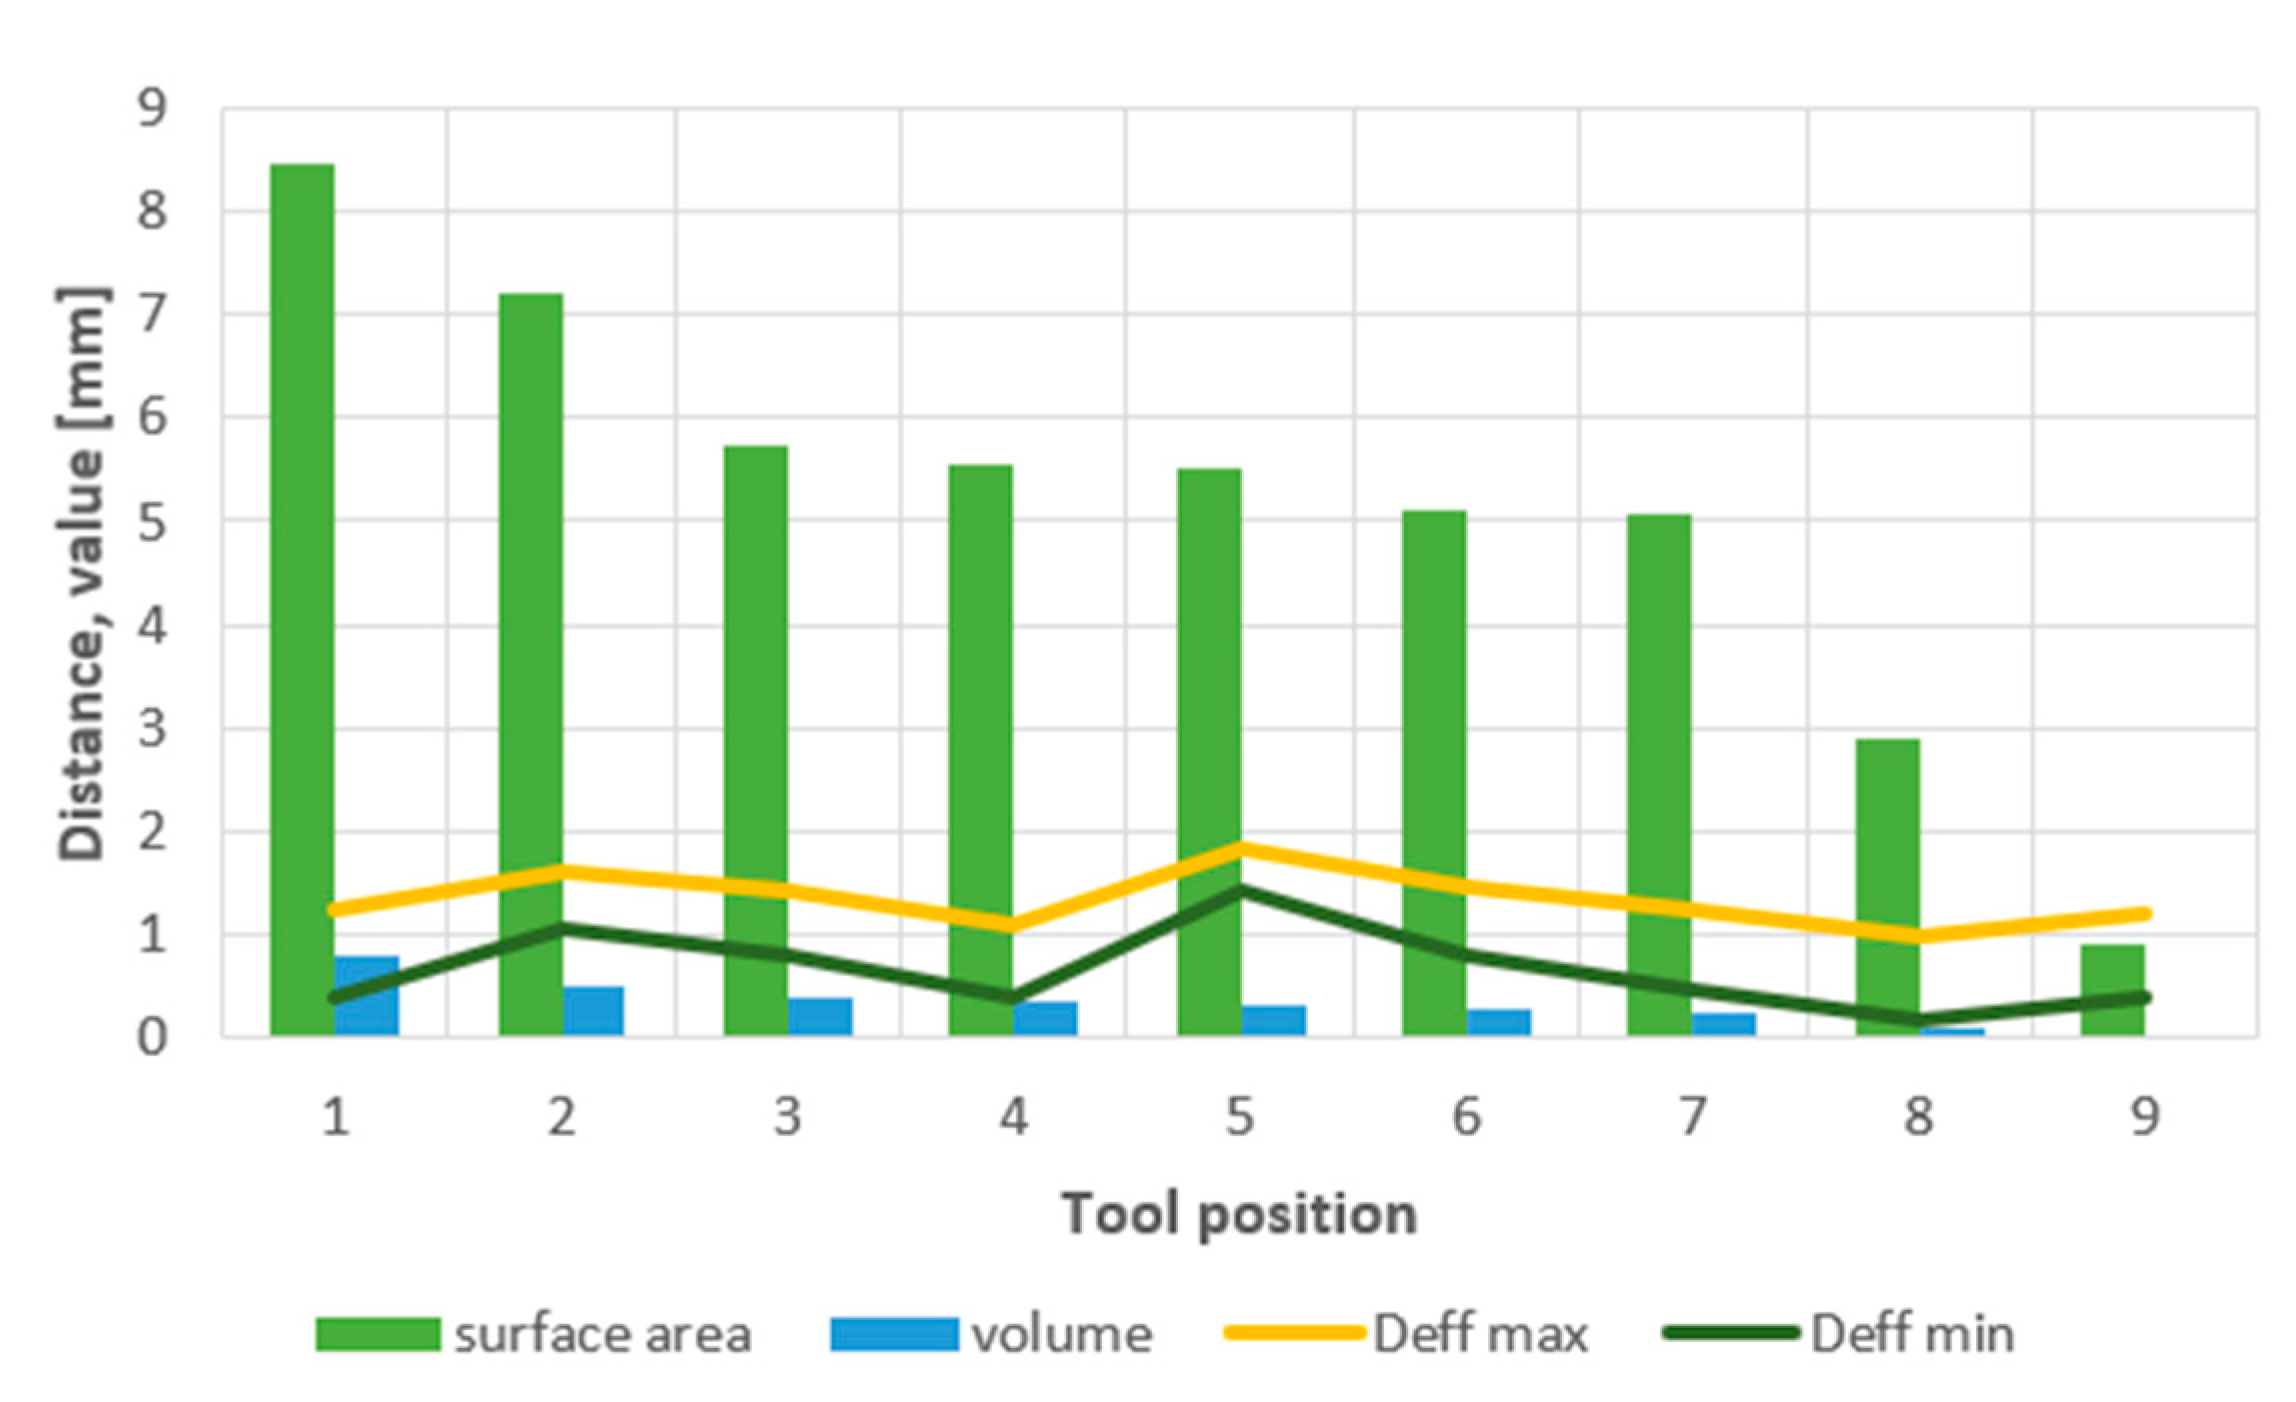
Figure 16.
Display of positions for analysis of start and exit angles during tool engagement
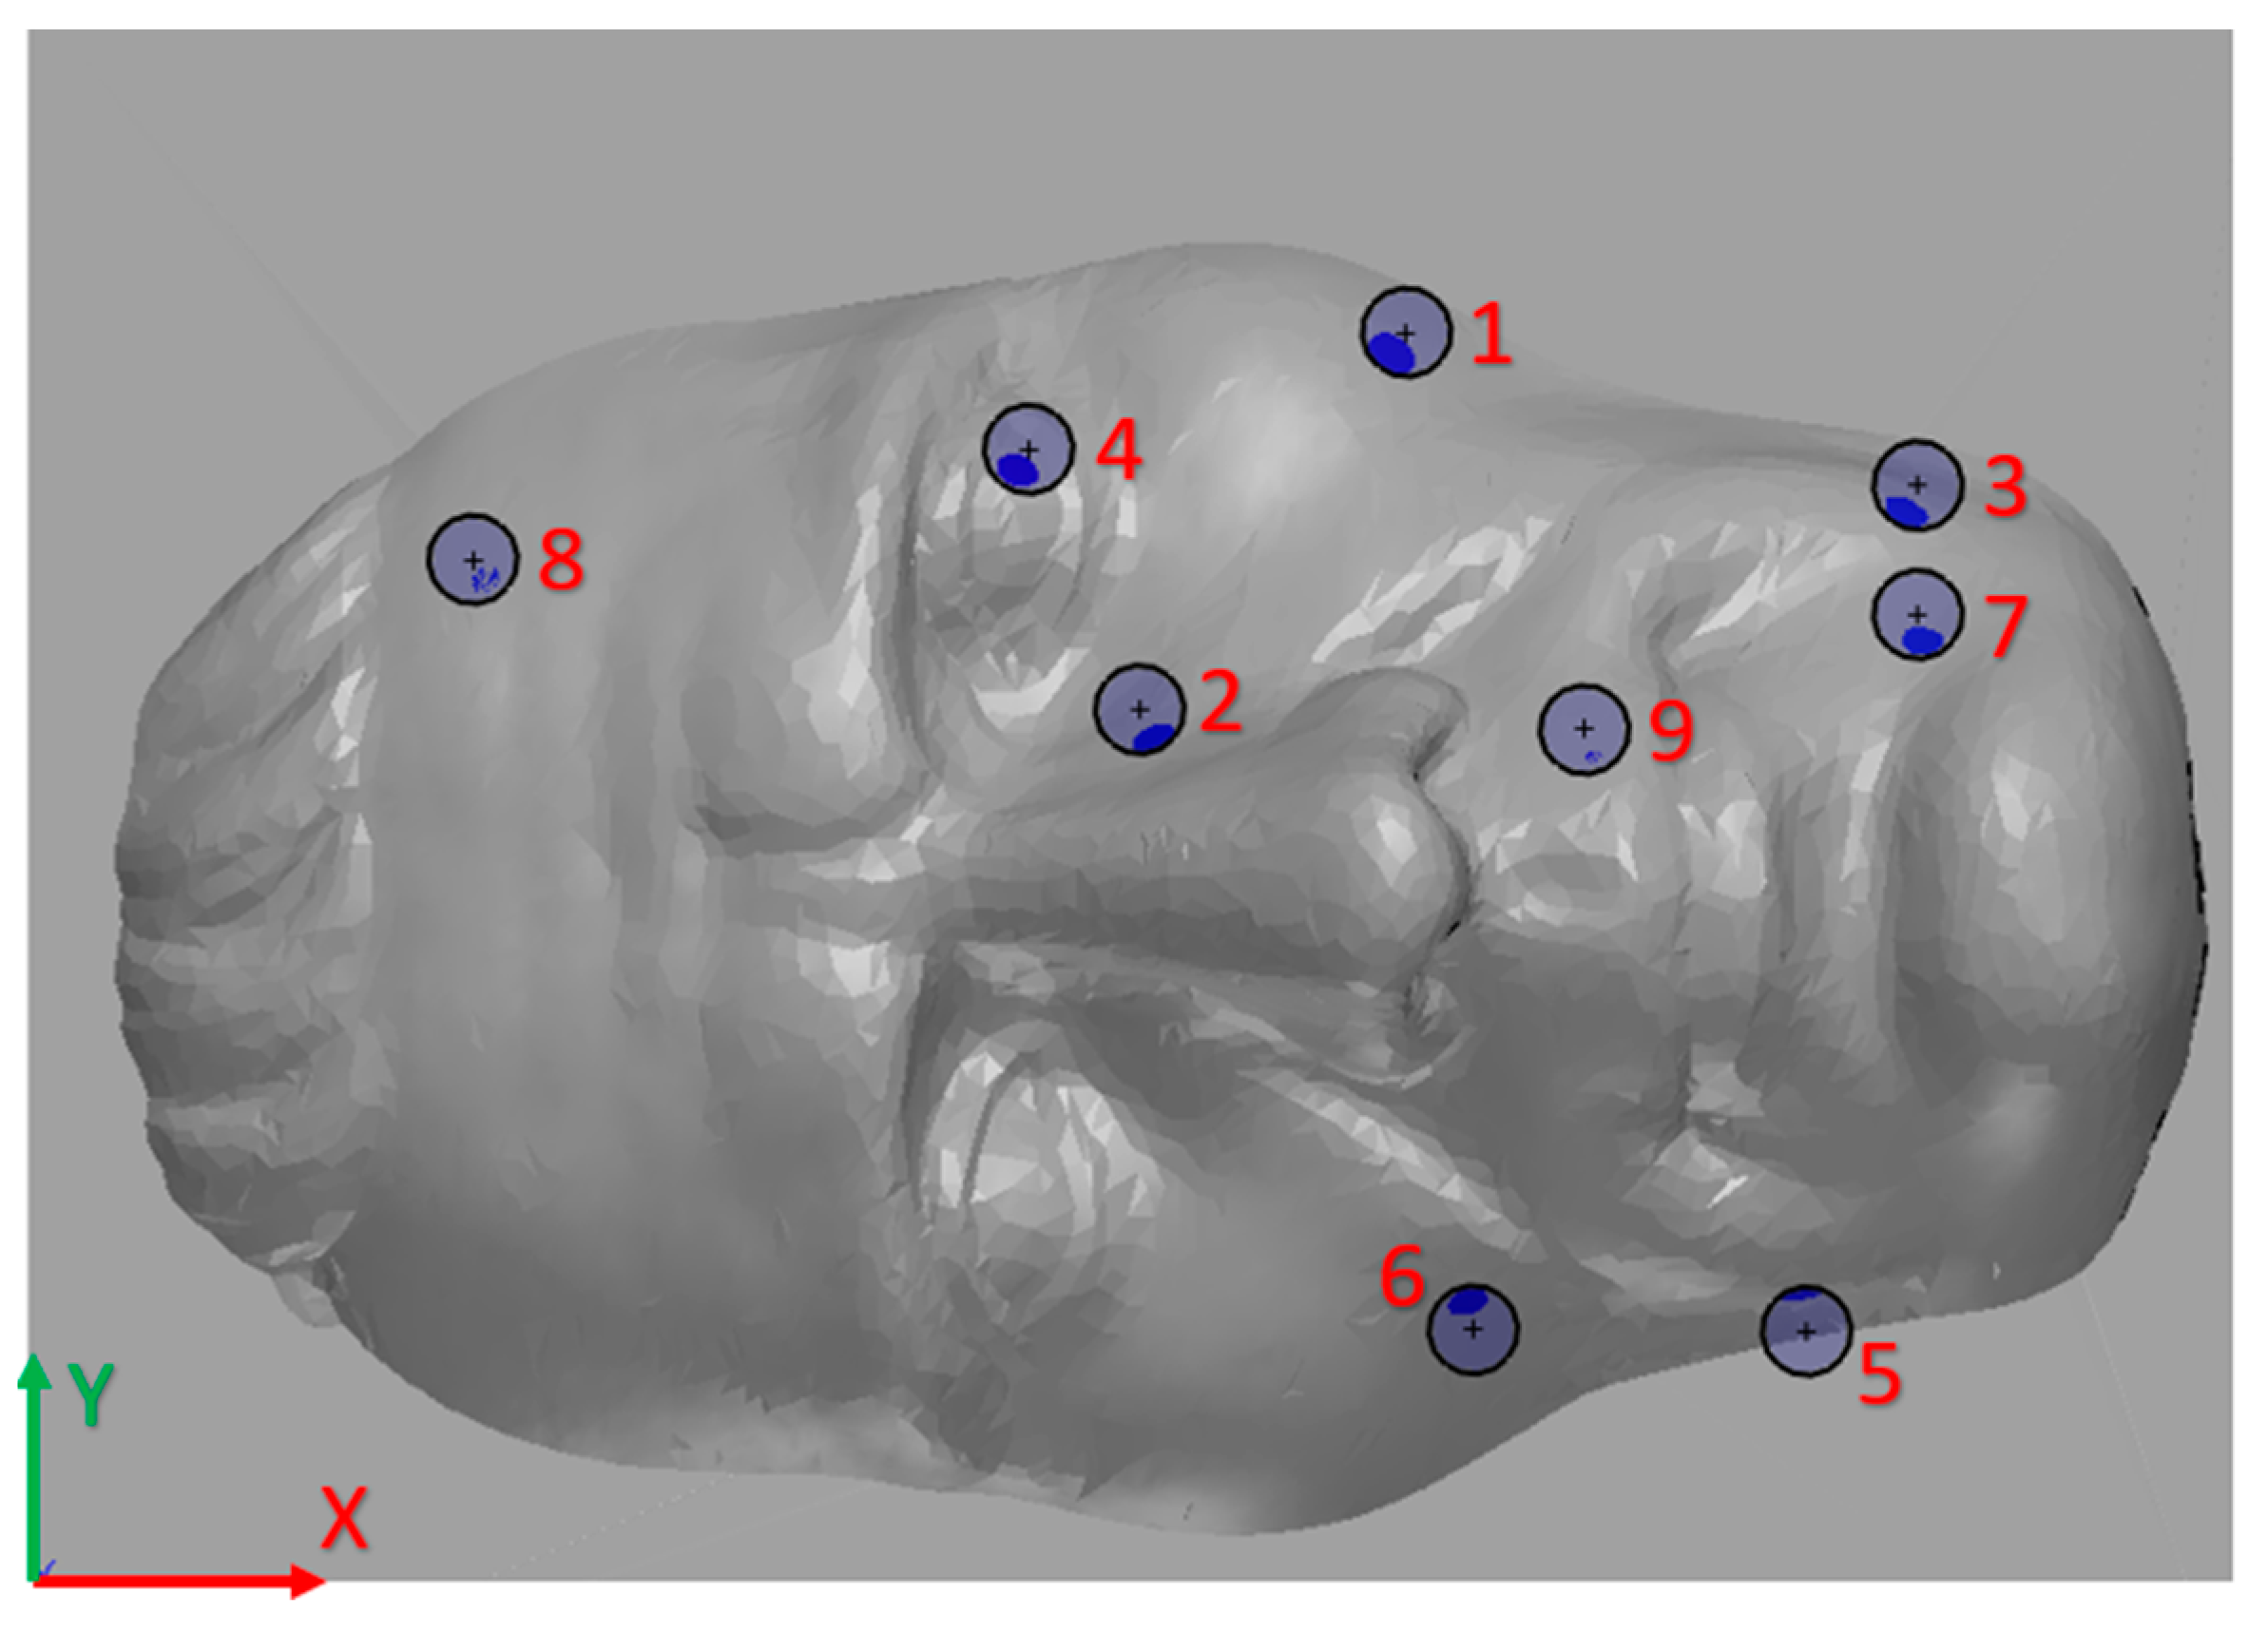
Figure 17.
Comparison of individual angles in the shot when the tool and workpiece are in contact with respect to the specific position of the tool
Figure 17.
Comparison of individual angles in the shot when the tool and workpiece are in contact with respect to the specific position of the tool
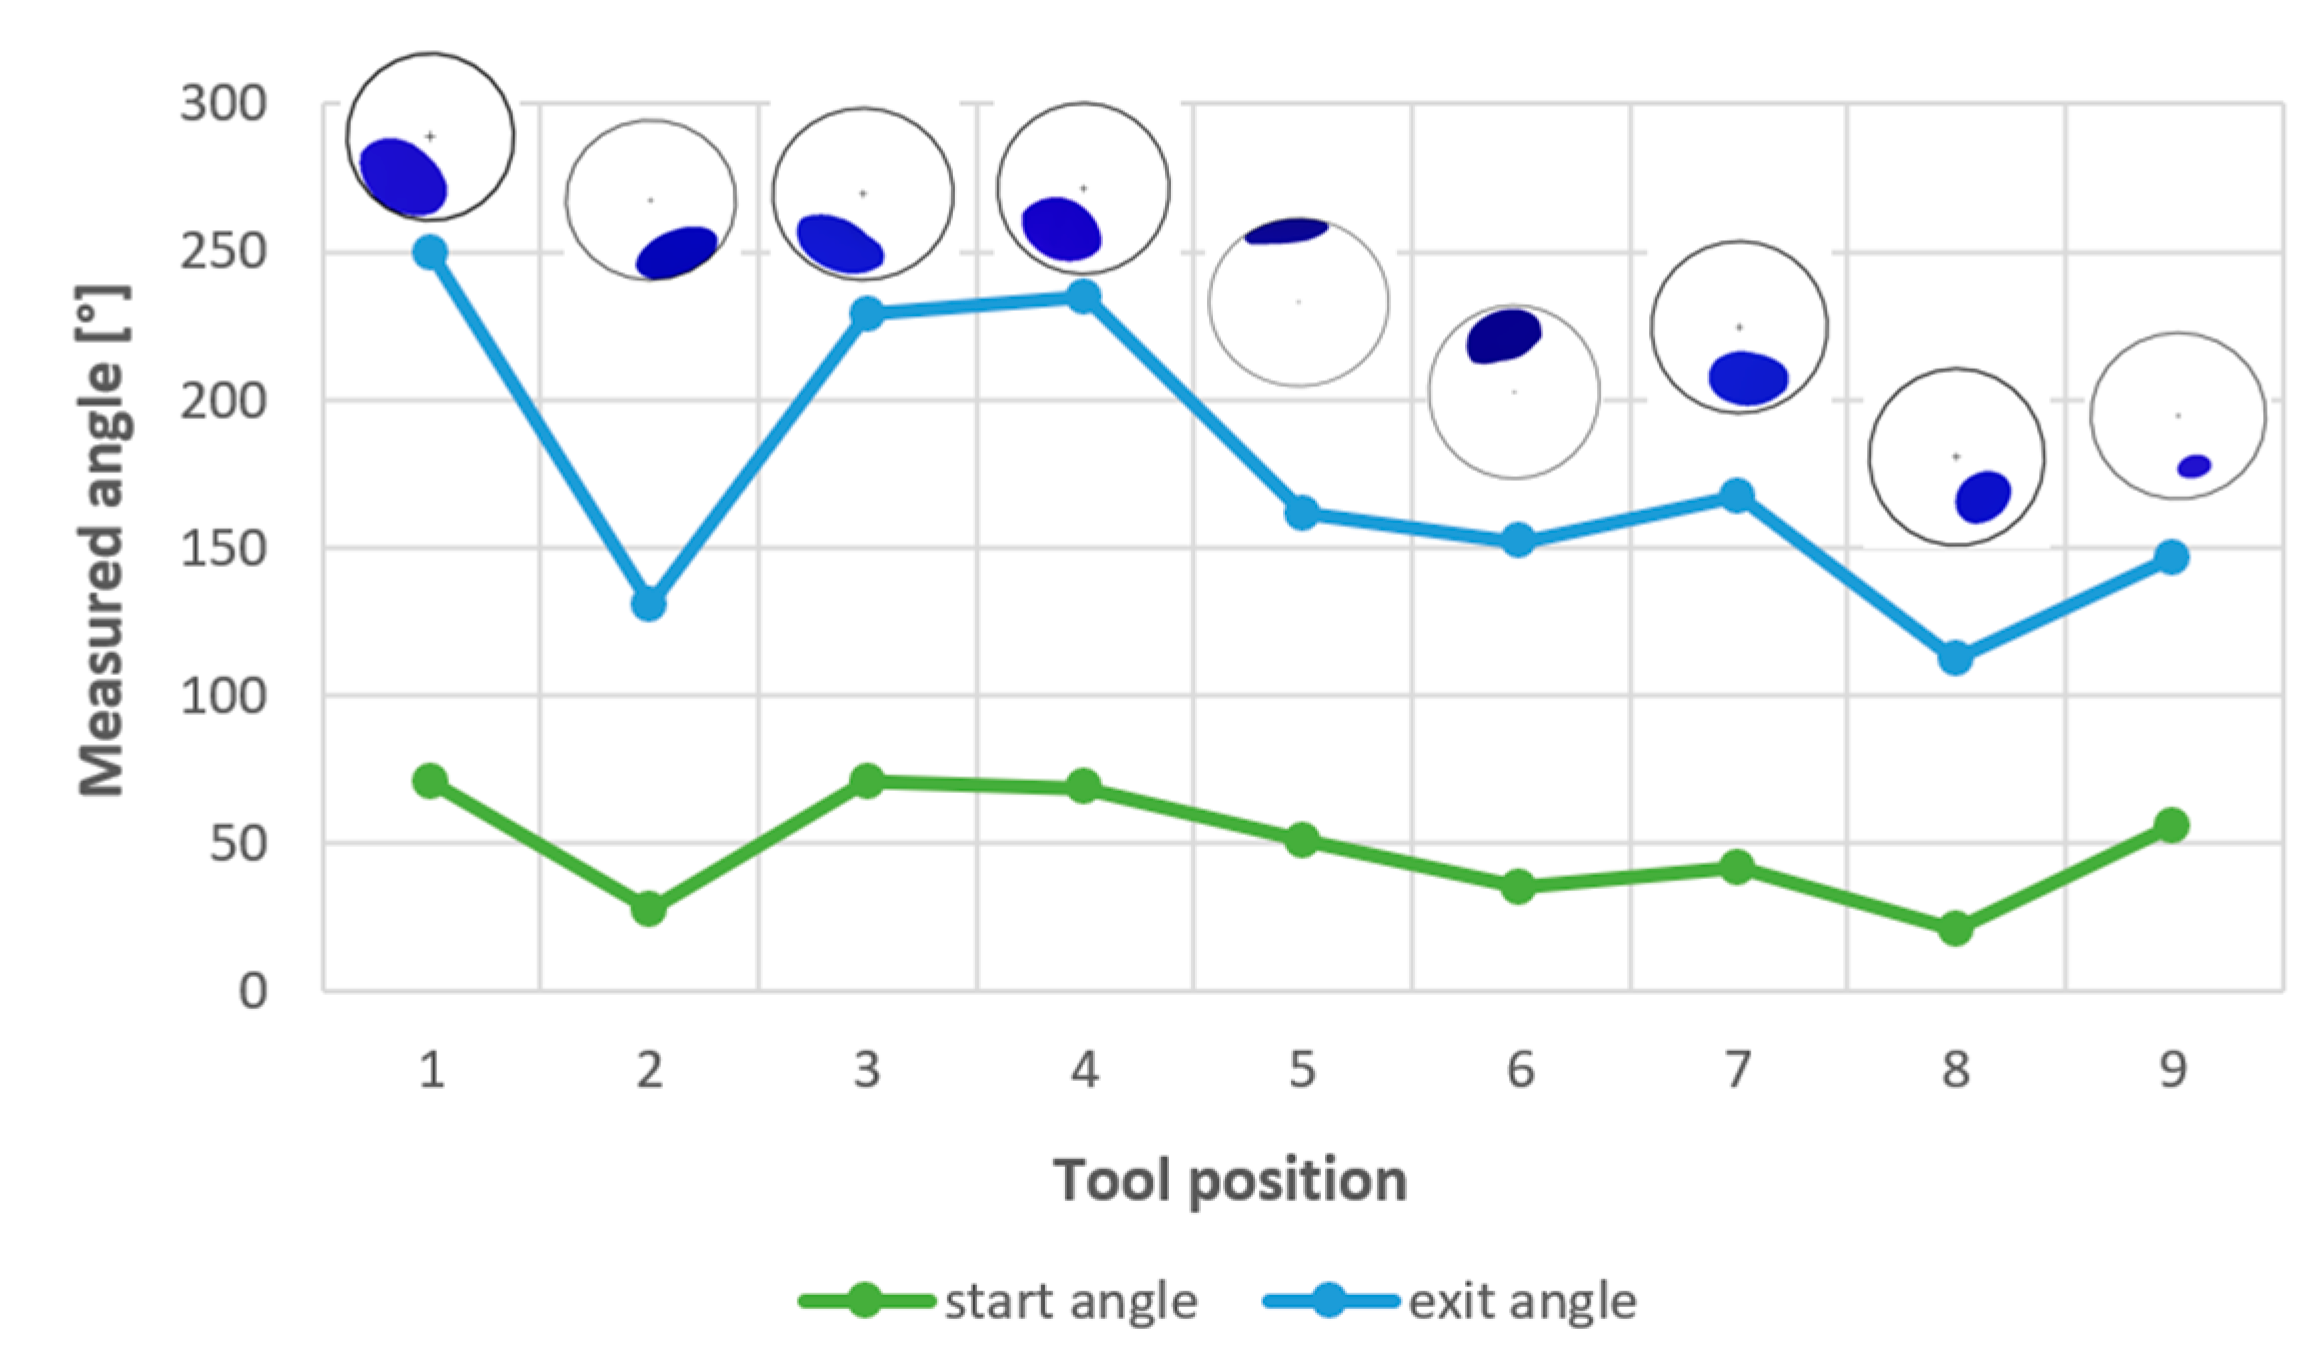
Figure 18.
Comparison of the angle engagement size with the extracted area and volume data
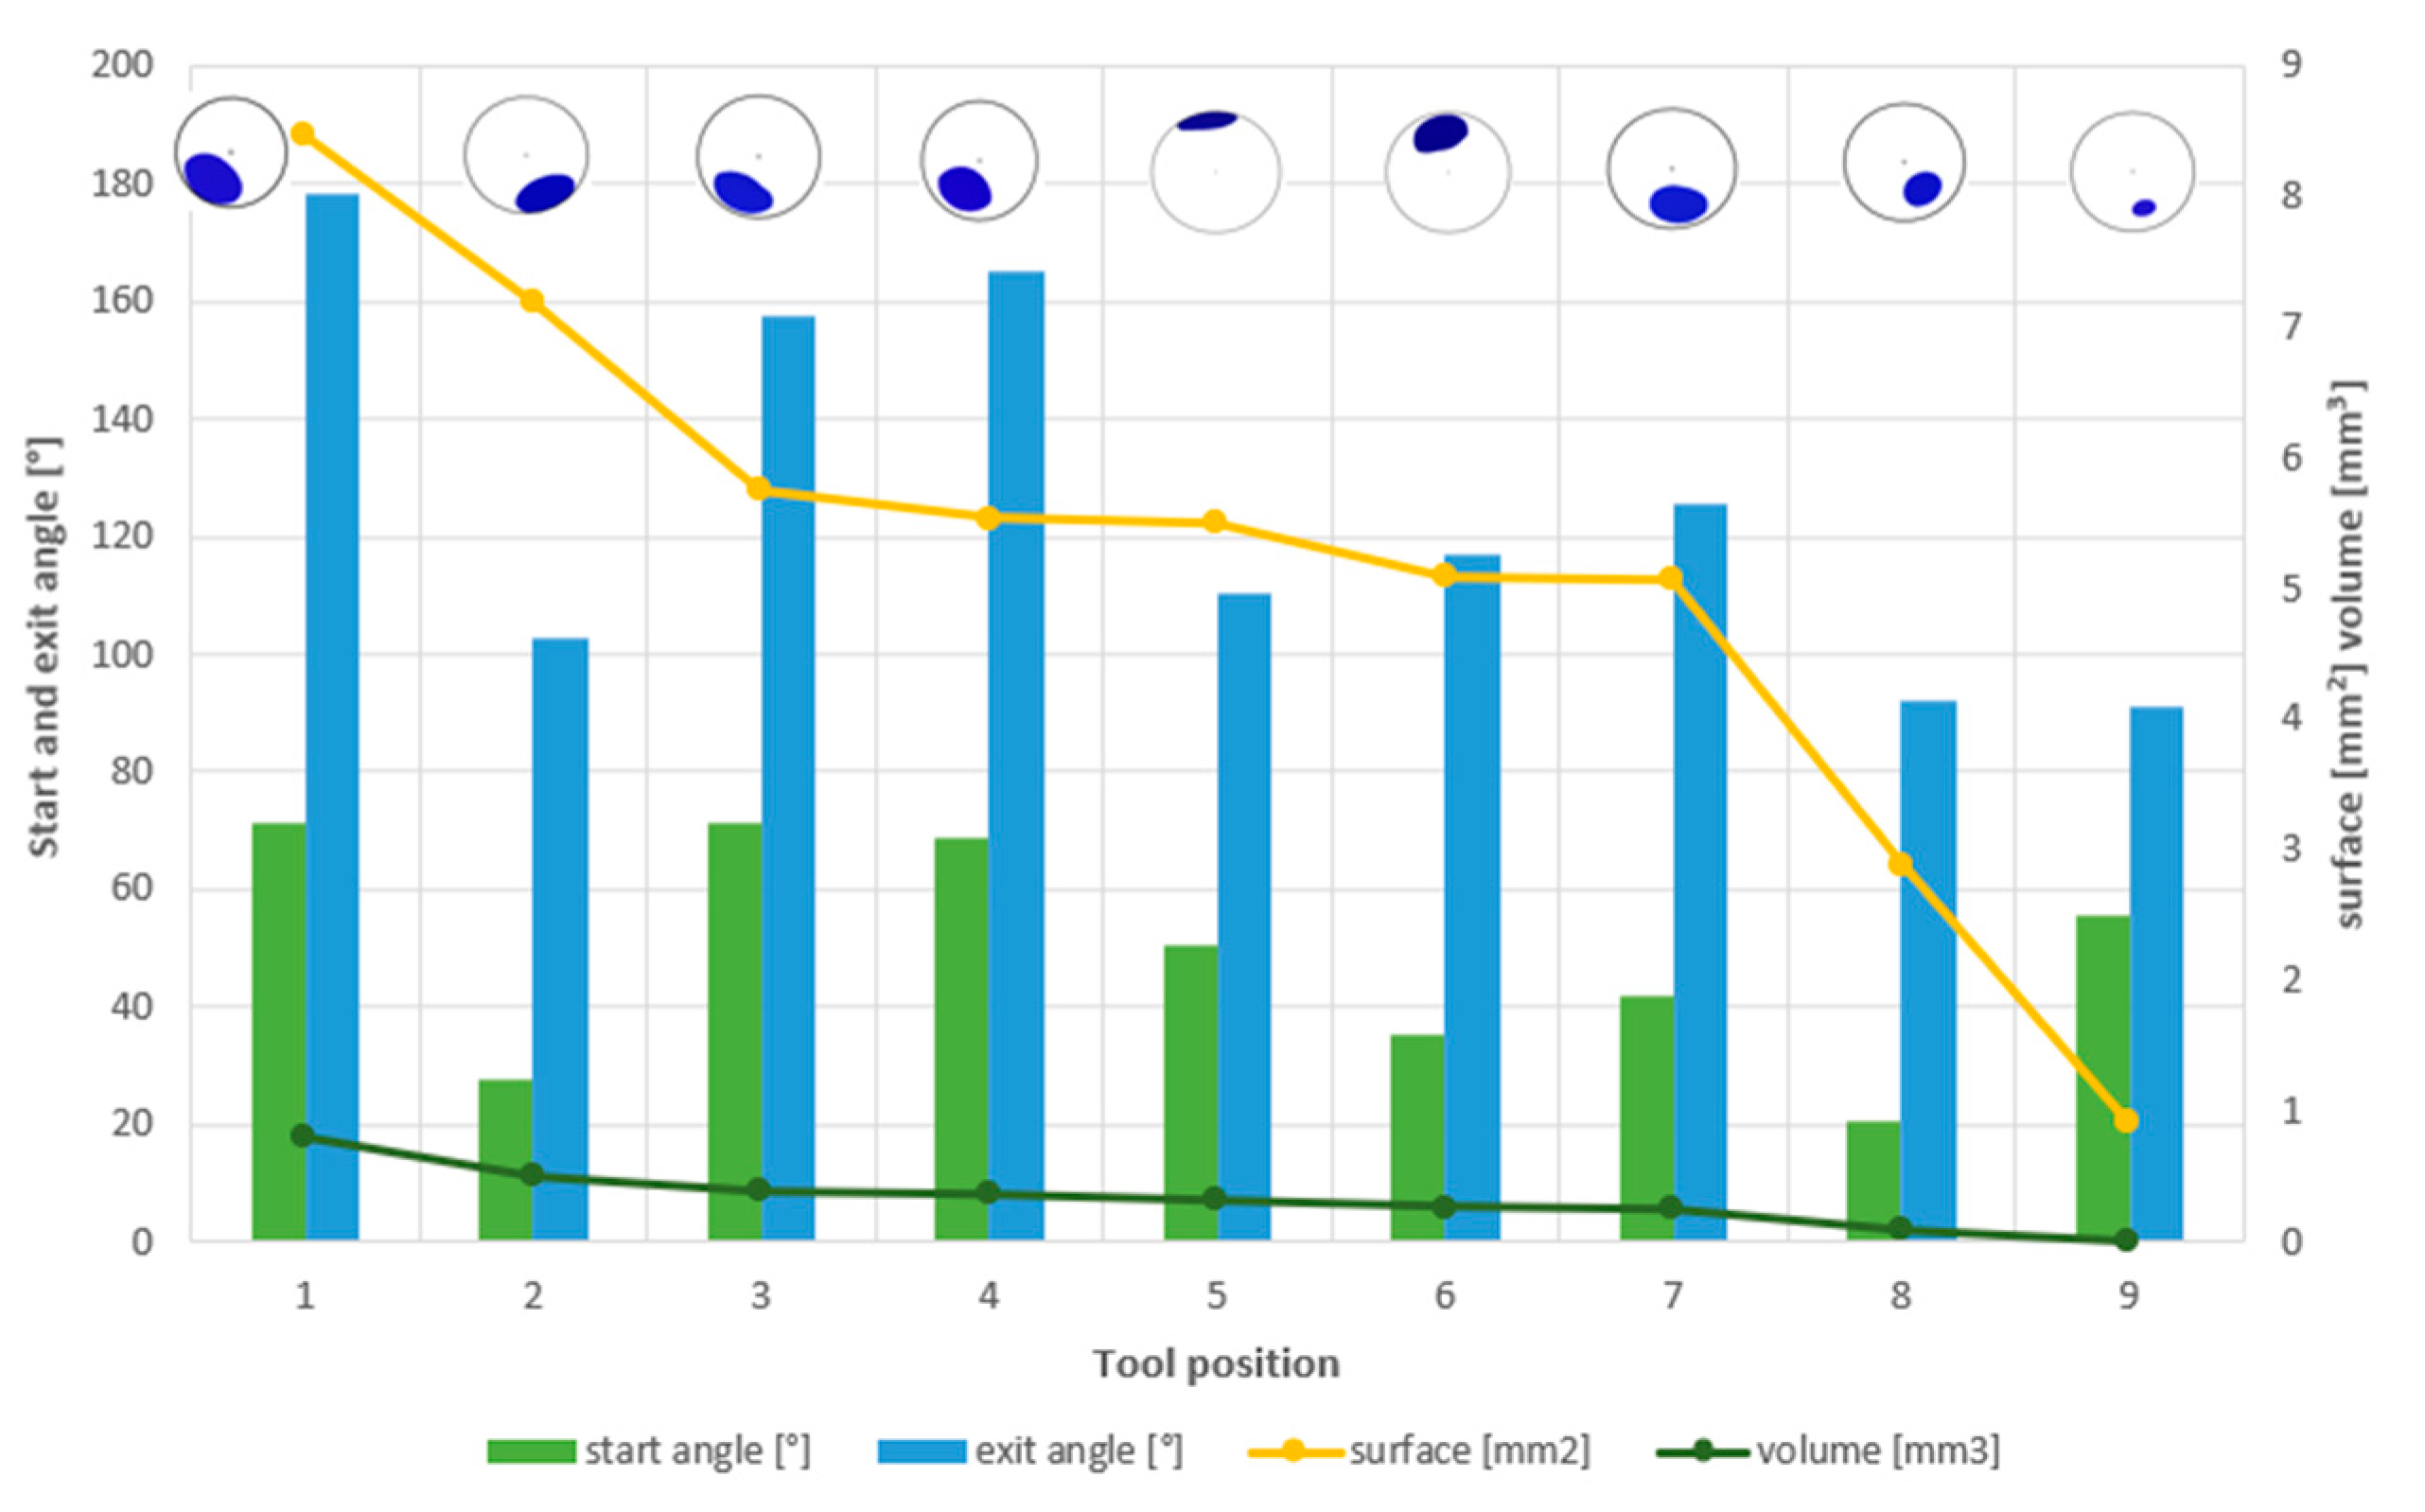
Figure 19.
Comparison of the face scan with the original 3D model
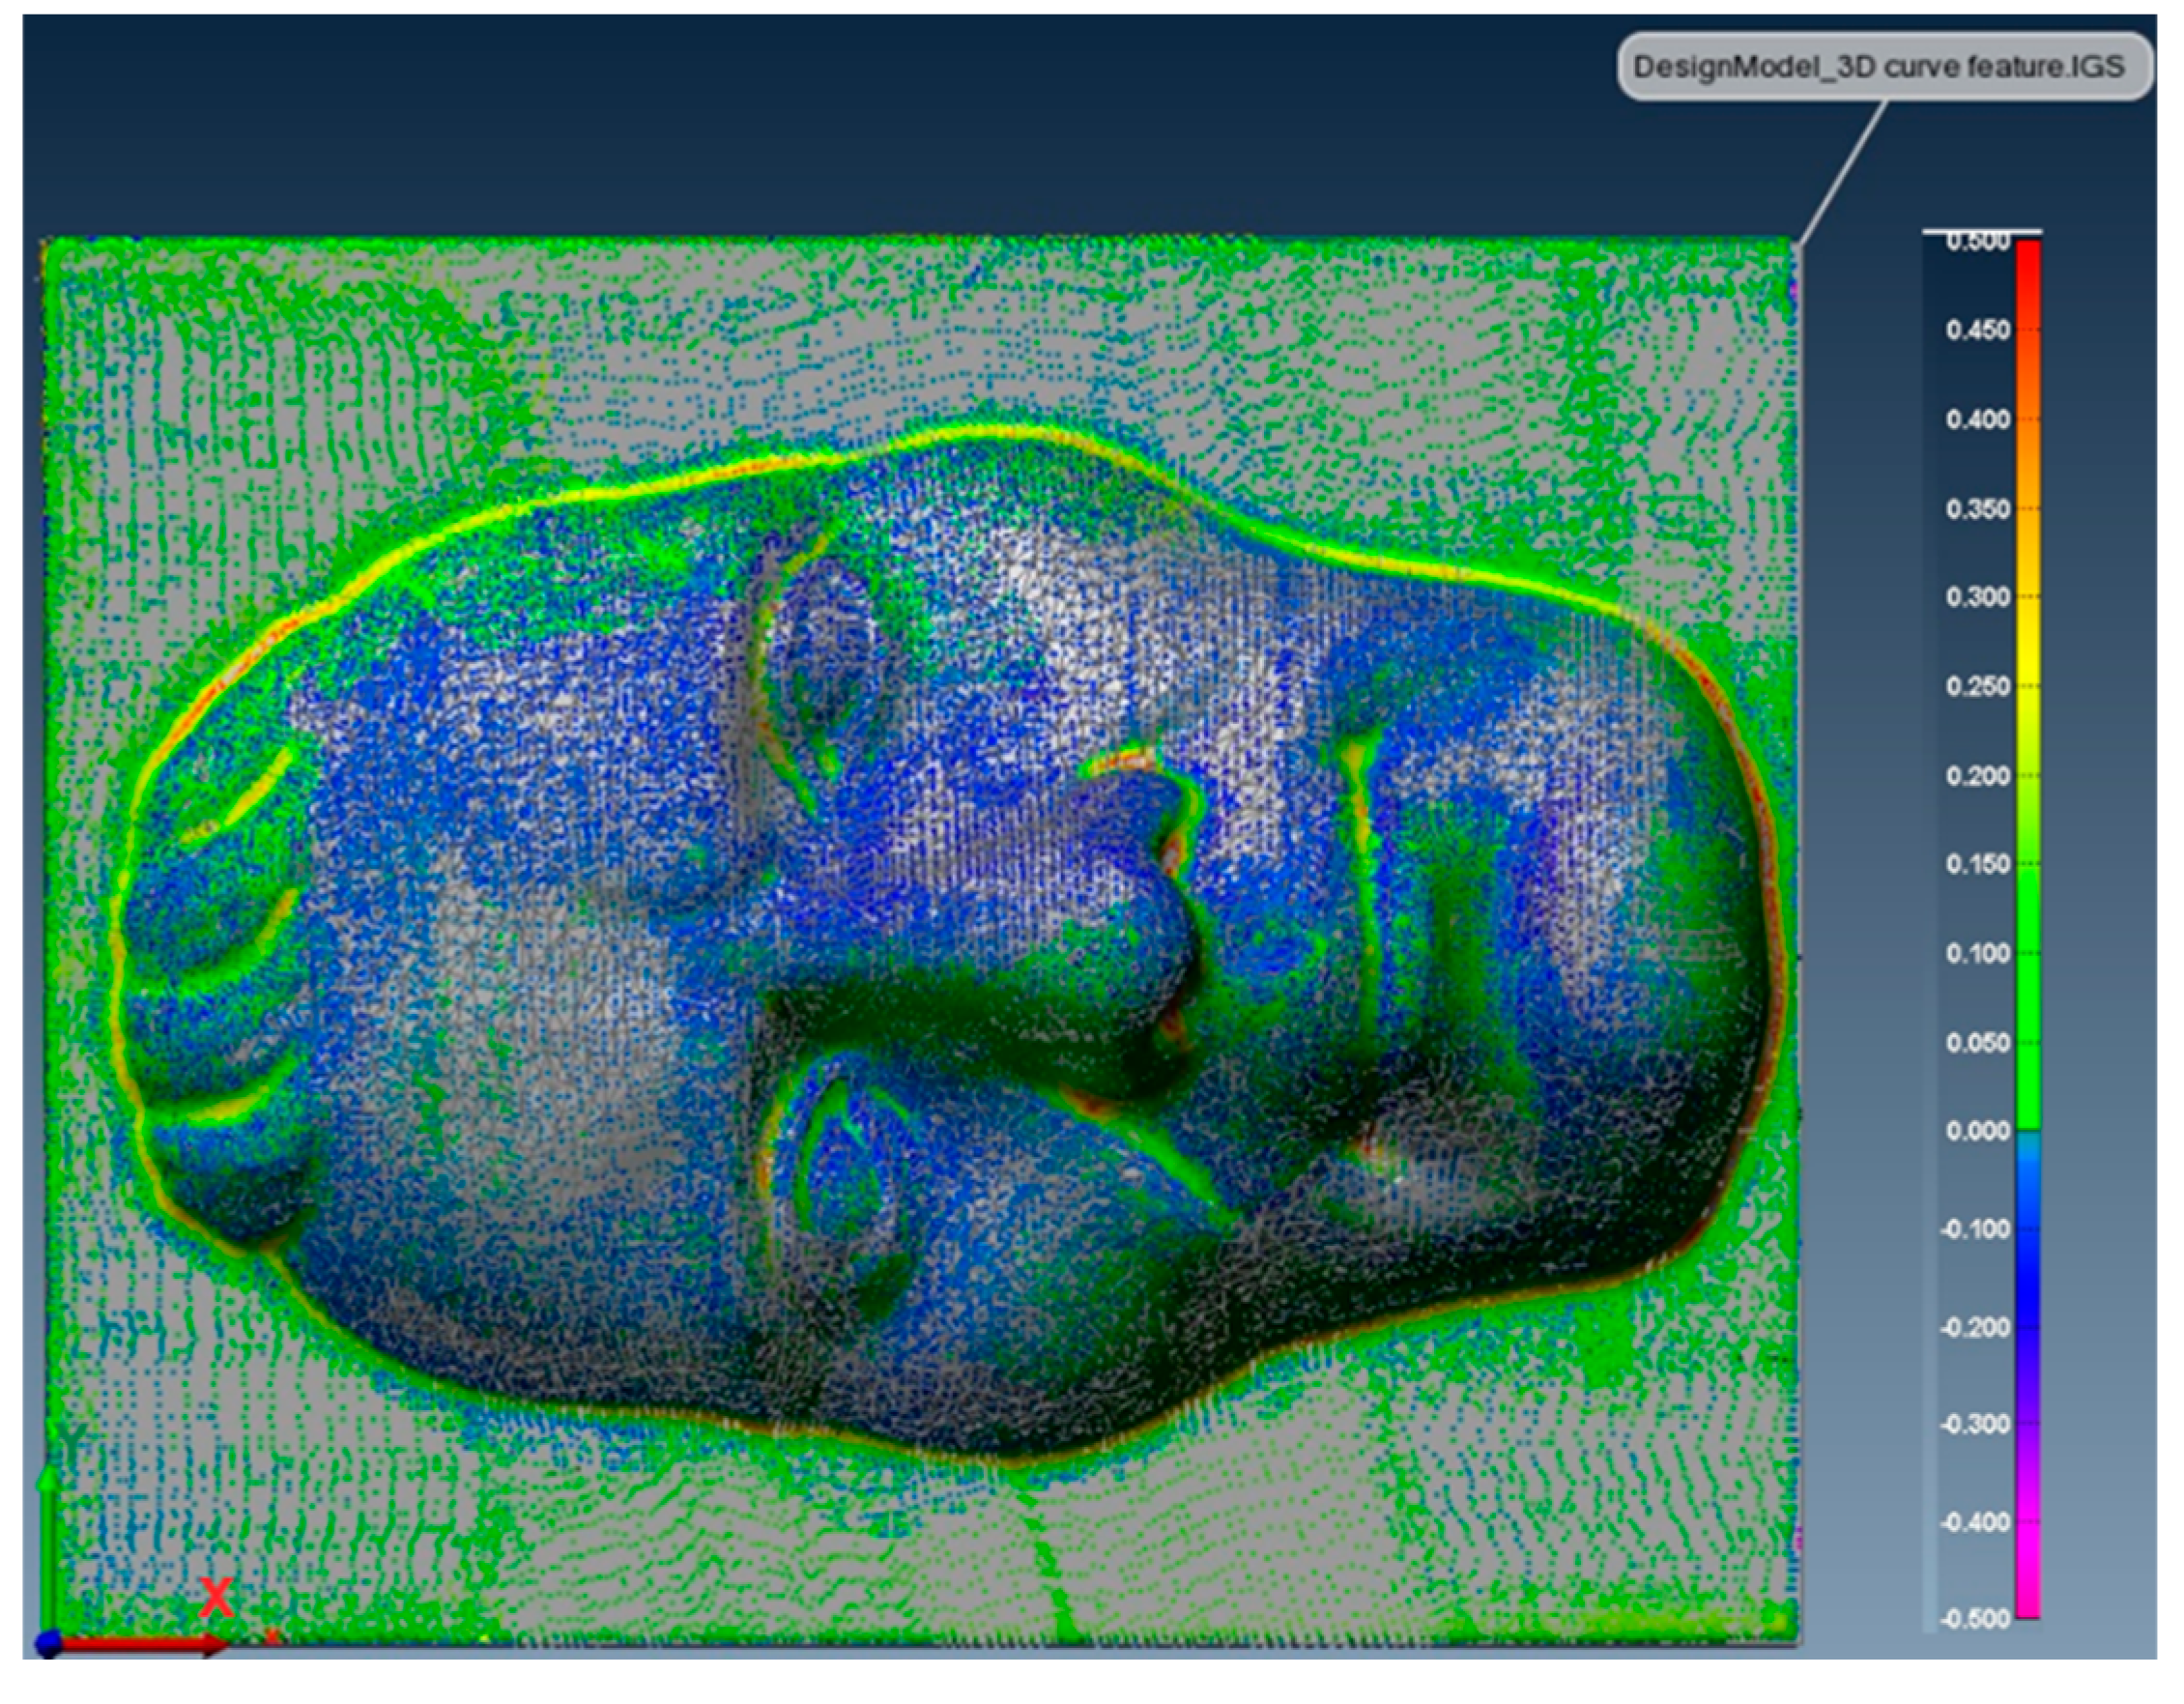
Figure 20.
The focus of the facial scan control points relative to the original 3D model
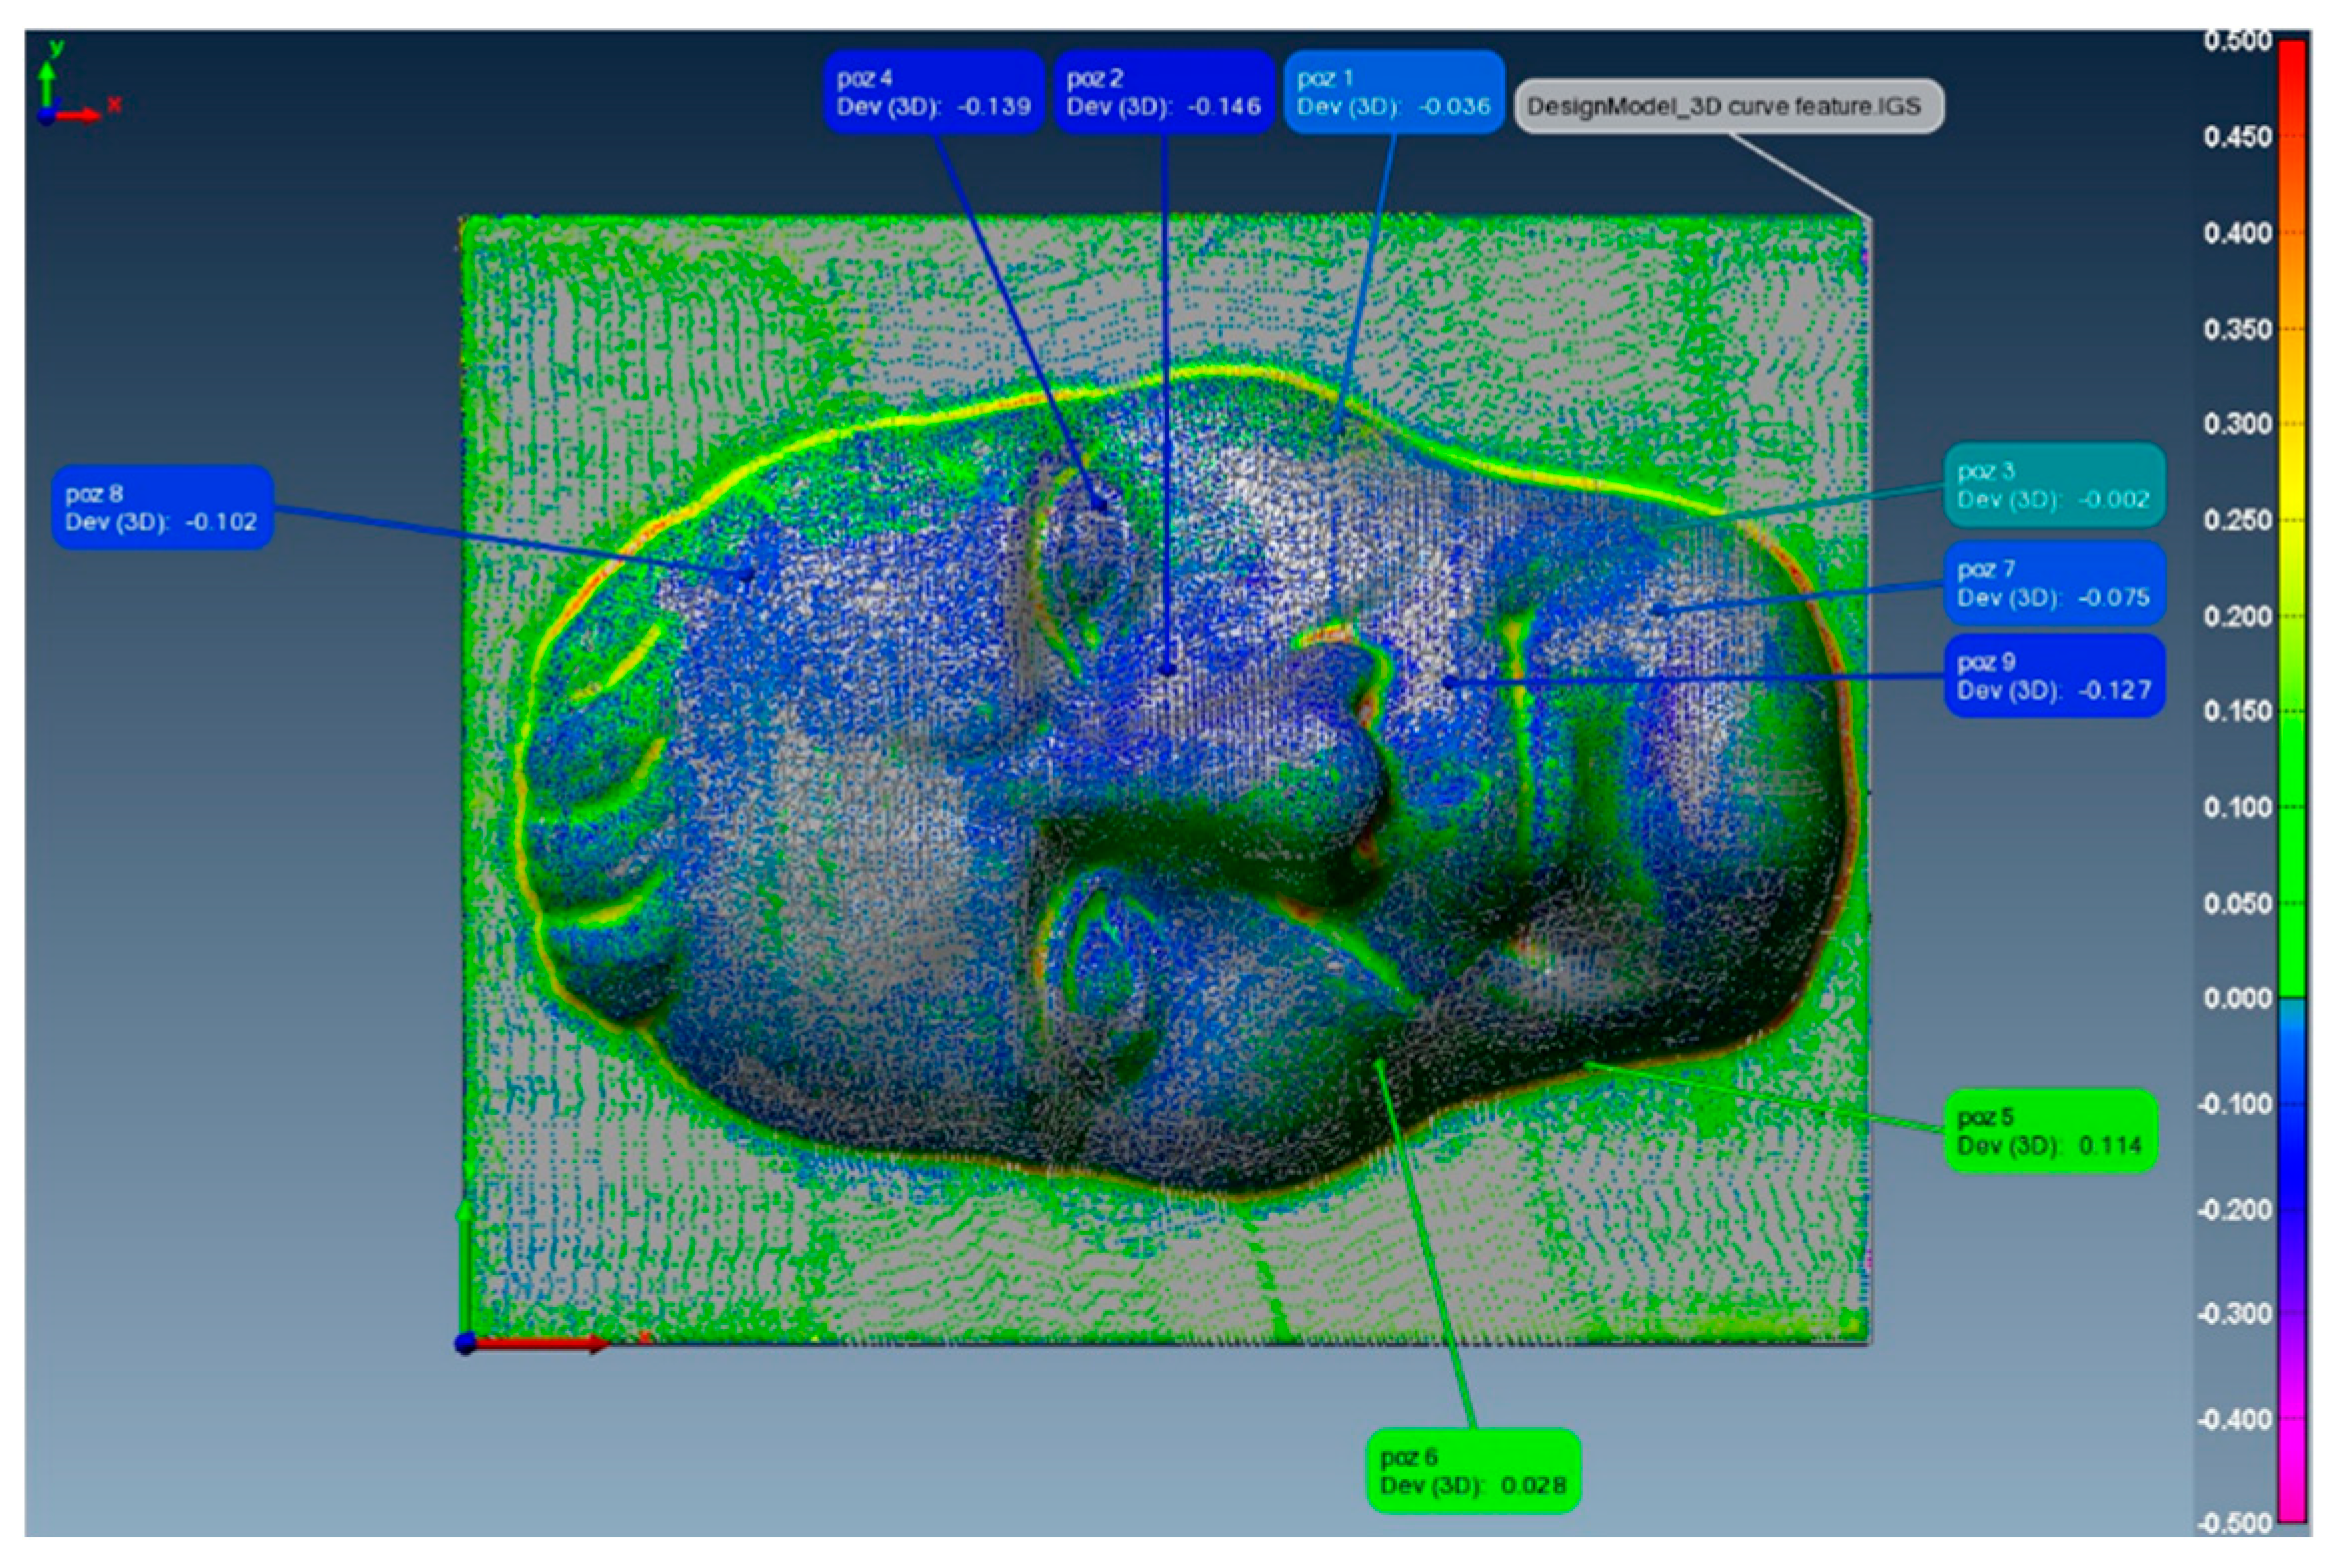
Figure 21.
Comparison of surface deviations with Deff max and Deff min values
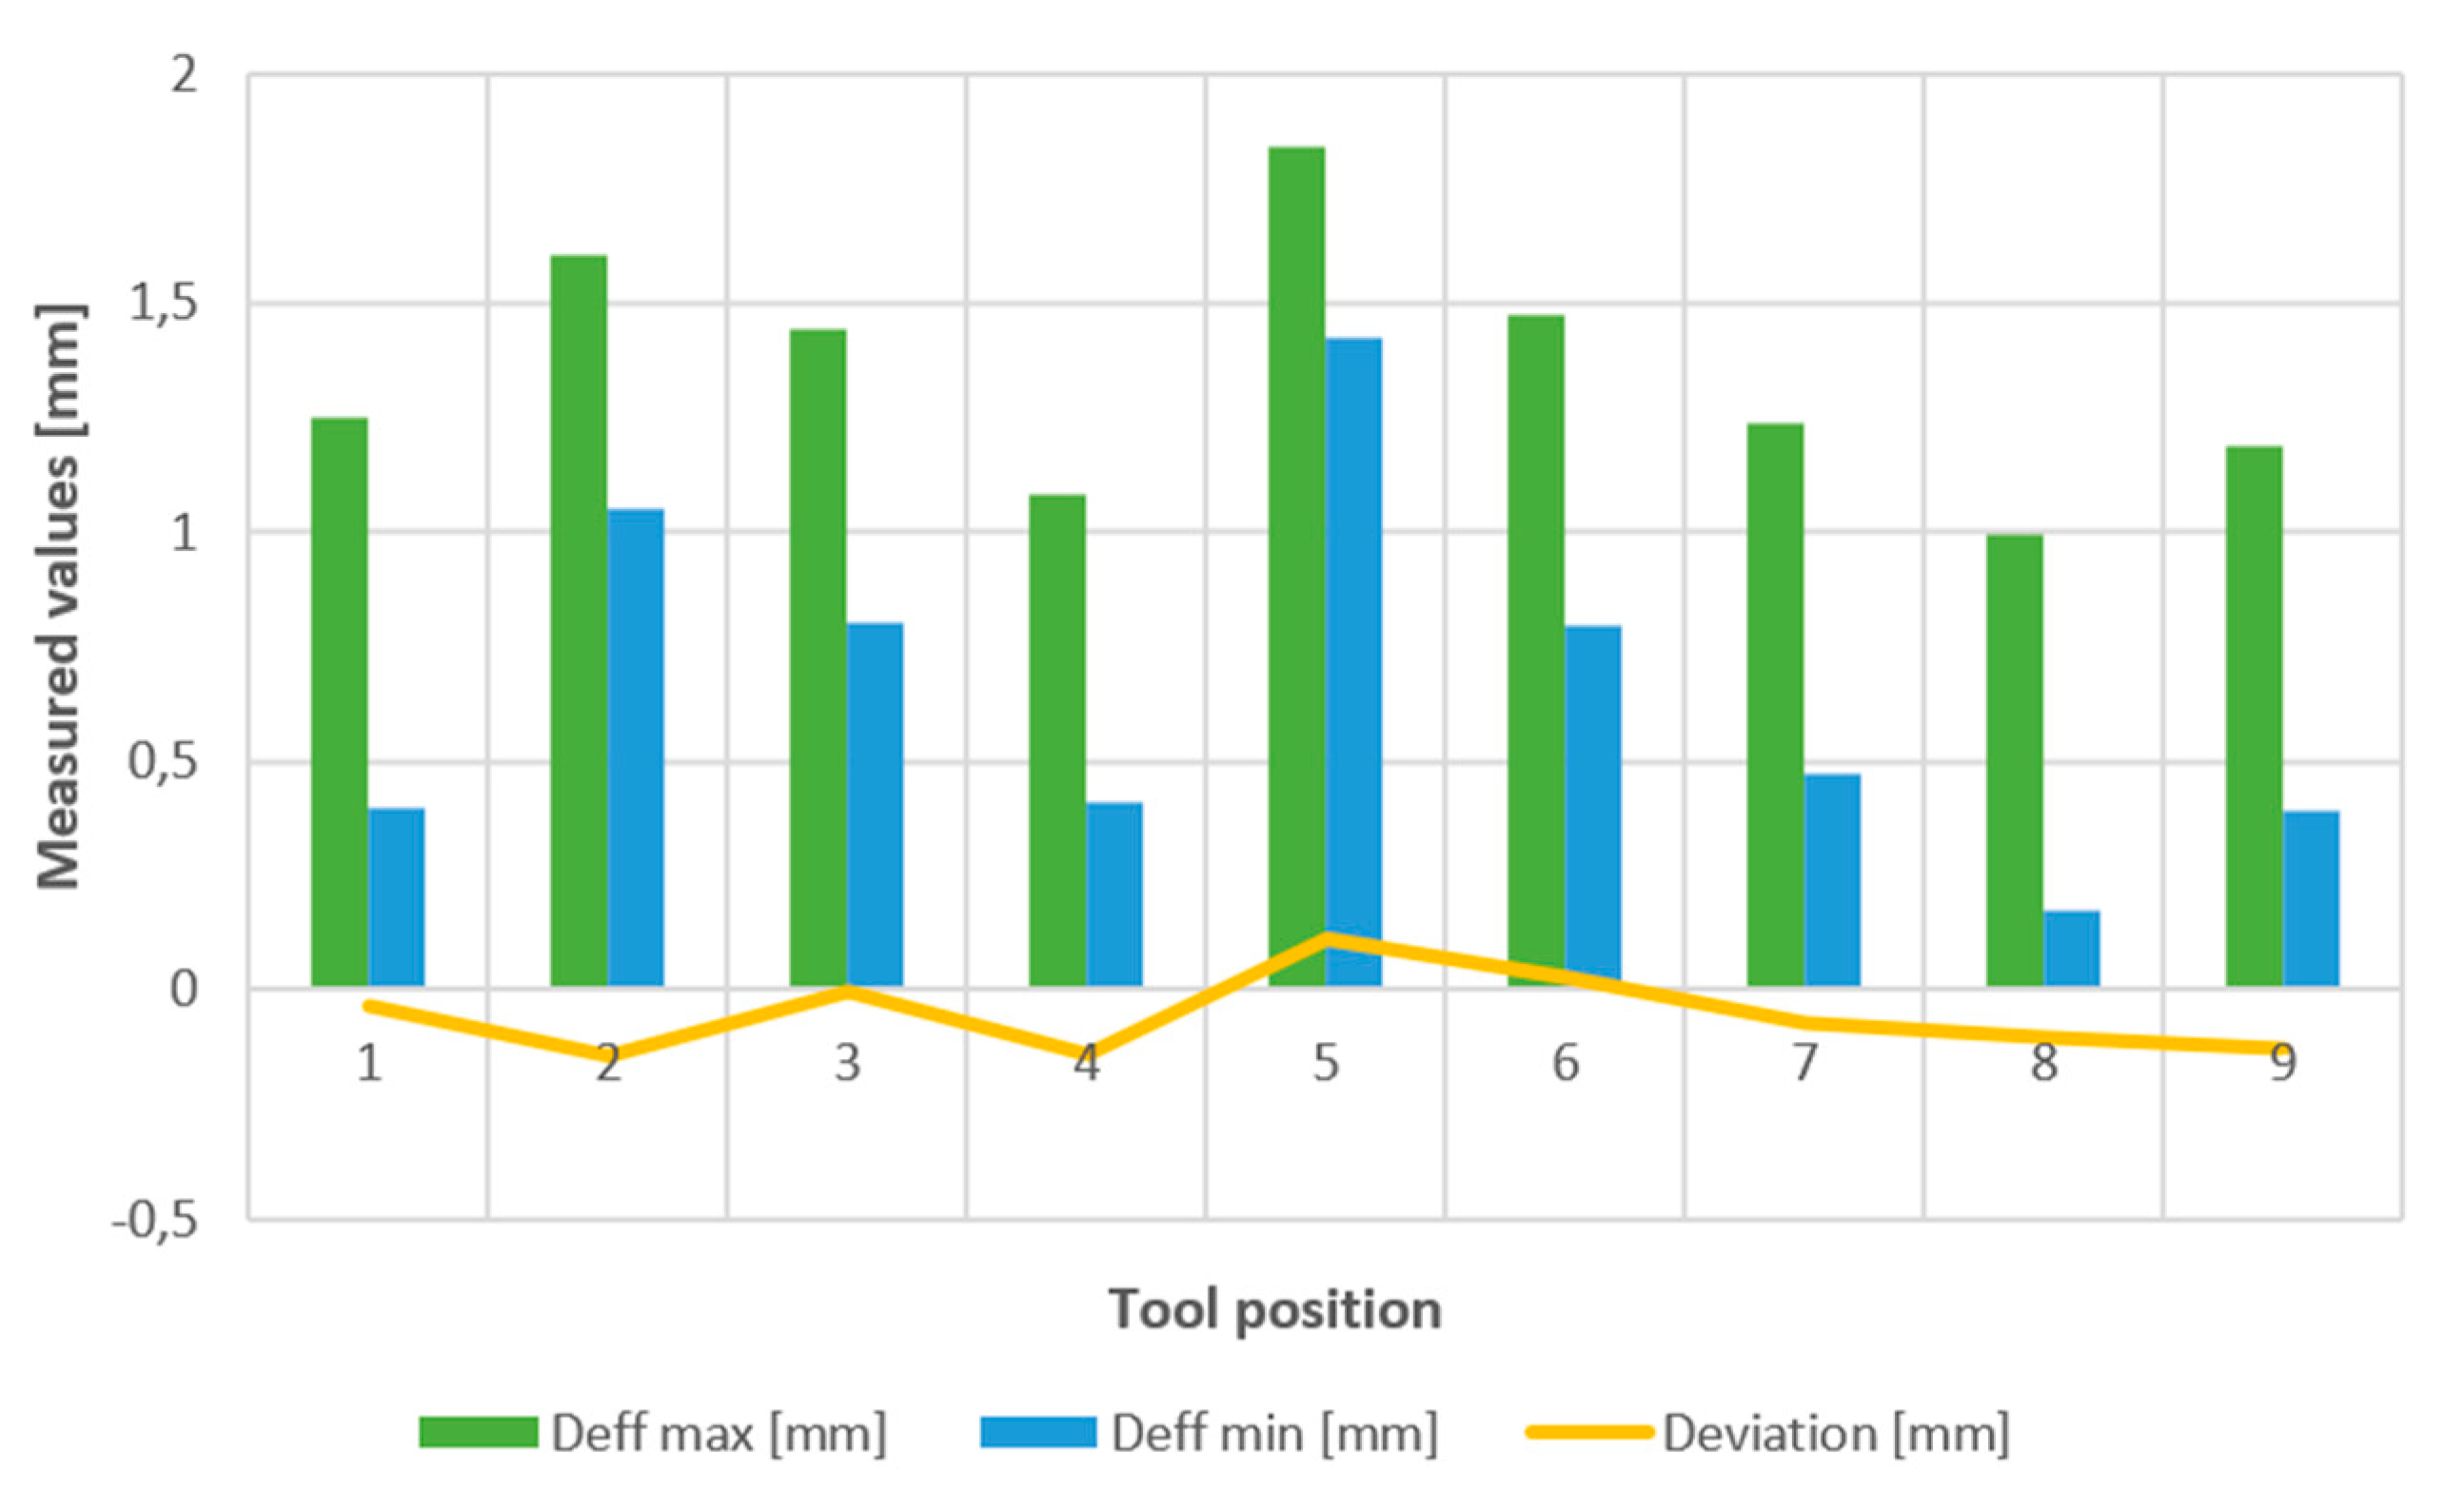

Table 1.
Cutting parameters used in the experiment.
| Tool Diameter [mm] | Cutting speed [m.min- 1] | Feed per tooth [mm] | Tooth number |
Tool code |
| End Mill D 18 | 237 | 0.25 | 4200 | AMS2018S |
| Ball End Mill D6 | 94 | 0.015 | 4900 | 273618.060 |
| Ball End Mill D4 | 63 | 0.008 | 4900 | 510418.120 |
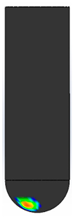
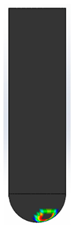
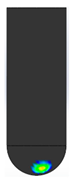
Table 2.
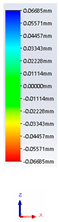
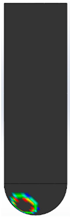
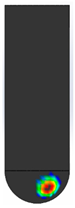
Visual maps showing tool-workpiece interaction boundary/contact area distances
| Position | 1 | 2 | 3 | 4 | 5 | 6 | 7 | 8 | 9 |
|---|---|---|---|---|---|---|---|---|---|
 |
 |
 |
 |
 |
 |
 |
 |
 |
 |
 |
 |
 |
 |
 |
 |
 |
 |
 |
 |
 |
 |
 |
 |
 |
 |
 |
 |
 |
 |
Table 3.
Measured maximum and minimum values for the parameter Deff
| Position 1 |
Position 2 |
Position 3 |
Position 4 |
Position 5 |
Position 6 |
Position 7 |
Position 8 |
Position 9 |
|
| Deff max [mm] | 1.252 | 1.605 | 1.442 | 1.081 | 1.843 | 1.474 | 1.235 | 0.992 | 1.189 |
| Deff min [mm] | 0.398 | 1.049 | 0.802 | 0.410 | 1.425 | 0.796 | 0.471 | 0.174 | 0.393 |
Table 4.
Extracted values of surface content and volume of the cutting part of the tool at the point of contact with the machined surface
Table 4.
Extracted values of surface content and volume of the cutting part of the tool at the point of contact with the machined surface
| Position 1 |
Position 2 |
Position 3 |
Position 4 |
Position 5 |
Position 6 |
Position 7 |
Position 8 |
Position 9 |
|
| Surface [mm2] | 8.467 | 7.197 | 5.751 | 5.541 | 5.513 | 5.096 | 5.080 | 2.894 | 0.921 |
| Volume [mm3] | 0.806 | 0.513 | 0.397 | 0.373 | 0.329 | 0.269 | 0.256 | 0.092 | 0.009 |
Table 5.
Values of the start and exit angle defining the grip of the tool at the point of contact with the machined surface
Table 5.
Values of the start and exit angle defining the grip of the tool at the point of contact with the machined surface
| Position 1 |
Position 2 |
Position 3 |
Position 4 |
Position 5 |
Position 6 |
Position 7 |
Position 8 |
Position 9 |
|
| Start angle | 71.29 | 27.95 | 71.25 | 69.05 | 50.81 | 35.12 | 41.74 | 20.77 | 55.81 |
| Exit angle | 178.26 | 102.69 | 157.58 | 165.44 | 110.66 | 116.94 | 125.54 | 91.95 | 90.99 |
Table 6.
Measured surface deviations for specific tool positions with respect to surface curvature
| Position 1 | Position 2 | Position 3 | Position 4 | Position 5 | Position 6 | Position 7 | Position 8 | Position 9 |
| -0.036 | -0.146 | -0.002 | -0.139 | 0.114 | 0.028 | -0.075 | -0.102 | -0.127 |
Disclaimer/Publisher’s Note: The statements, opinions and data contained in all publications are solely those of the individual author(s) and contributor(s) and not of MDPI and/or the editor(s). MDPI and/or the editor(s) disclaim responsibility for any injury to people or property resulting from any ideas, methods, instructions or products referred to in the content. |
© 2023 by the authors. Licensee MDPI, Basel, Switzerland. This article is an open access article distributed under the terms and conditions of the Creative Commons Attribution (CC BY) license (http://creativecommons.org/licenses/by/4.0/).
Copyright: This open access article is published under a Creative Commons CC BY 4.0 license, which permit the free download, distribution, and reuse, provided that the author and preprint are cited in any reuse.


