
Submitted:
13 November 2023
Posted:
14 November 2023
You are already at the latest version
Abstract
Leak of carbon dioxide (CO2) from conventional underground carbon storage reservoirs is an increasing concern. It is highly desirable to inject CO2 into low-temperature reservoirs so that CO2 can be locked inside the reservoir in solid state as CO2-hydrates. Marine gas hydrate reservoirs and surrounding water aquifers are attractive candidates for this purpose. However, the nature of low-permeability of these marine sediments hinders injection of CO2 in commercial scale due to the low-injectivity of wells with conventional completions. This study investigates injection of CO2 into the low-permeability marine reservoirs using a new type of well namely radial-lateral wells (RLW). An analytical model was developed for predicting CO2 injectivity of the RLW to assess well injectivity improvement. A case study and sensitivity analysis were performed with field data from the South China Sea. Result of analysis reveals that the injectivity of the RLW is nearly proportional to reservoir permeability, lateral wellbore length, and number of laterals. CO2 injection rate is predicted to be 19 tons/day to 250 tons/day, which is 3 to 15 times higher than the injectivity of frac-packed wells. It is feasible to inject CO2 into the low-permeability-low-temperature marine reservoirs at commercial flow rates. This work provides an analytical tool to predict CO2-injectivity of RLW in low-temperature marine reservoirs for leak-free CO2 storage.
Keywords:
CO2 storage
; radial-lateral well
; well injectivity
; permissible pressure
; analytical model.
1. Introduction
Global climate change is partially attributed to the increasing level of CO2 emission into the atmosphere (Frölicher et al., 2014). Several mitigation strategies have been proposed for carbon reduction (Soeder, 2021). Injecting CO2 into underground structures, such as oil reservoirs, is now more than just for improving oil recovery but for sealing CO2 inside the reservoirs (Gaurina-Međimurec and Mavar, 2019). Previous studies revealed high risks of CO2 leak from reservoirs through old wells where cracks were found in well cement sheath (Duguid et al., 2017). These cracks are very likely the channels responsible for CO2 leak. The work of computer simulation done by Zhang et al. (2021) shows that it may take just a few months for CO2 to fully penetrate wellbore cement through cement cracks to reach well casing where sealing property is lost. Because the deterioration of wellbore cement sheath that induces cracks is unavoidable, the only option to prevent CO2 leak is to make CO2 immobile inside the storage reservoirs. This can be achieved by injecting CO2 into low temperature reservoirs such as gas hydrate reservoirs and/or nearby water zones where CO2 will turn into its hydrates (solid-state).
Figure 1 shows conditions for forming CO2 hydrates and methane hydrates. Because the pressures required for forming CO2-hydrates are lower than that required for forming methane-hydrates, natural gas (mainly methane) hydrate reservoirs are always good candidates for storing CO2 in form of CO2-hydrates. The water zones near the gas-hydrate zones are also good candidates for storing CO2 in the form of CO2-hydrates if the in-situ pressures are higher than the forming pressure of CO2-hydrates. In fact, these water zones are better candidates than the gas-hydrate reservoirs due to their higher injectivities.
Moridis et al. (2008) characterized gas hydrate reservoirs in three types namely Class 1, 2 and 3. Class 1 type gas hydrate reservoirs have three coexisting phases (gas, water, and hydrate). Class 2 type hydrate reservoirs have hydrate-bearing layers with underlying free water layers or overlaying free gas layers. The Class 3 type ga hydrate reservoirs consist of hydrate-bearing layers existing as standalones confined by under burden and overburden layers (Moridis et al. (2007). To the best of our knowledge, the Class 1 types of gas hydrate reservoirs are not in thermodynamic equilibrium condition which results in only one excessive phase in nature, either free gas or free water but not both. This is why Moridis et al. (2008) further divided the Class 1 type gas hydrate reservoirs into two categories as Class 1W for the hydrate-bearing layers with free water and Class 1G for the hydrate bearing layers with free water.
Because of the existence of either free water or free gas in gas hydrate reservoirs, non-zero injectivity of CO2 into gas hydrate reservoirs is possible before dissociation of gas hydrates. The CO2 injectivity should increase as the gas hydrates decompose. However, CO2 injectivity may drop during CH4-CO2 swapping. But the efficiency of CH4-CO2 swapping is low due to mass transfer barriers caused by the CO2-hydrate formation (Davies et al., 2010). Nevertheless, the low-injectivity of CO2 into marine gas hydrate reservoirs is a big concern due to the low-permeability nature of the storage reservoirs.
Guo and Zhang (2023) proposed to inject CO2 into low-temperature water zones for non-leaking storage in hydrate form. Assuming pre-injection of heating of CO2 should prevent CO2-hydrate formation during injection, they developed an analytical model to predict CO2 injectivity into frac-packed reservoirs. A case study with the model shows achievable commercial injection rates of 6-17 tons/day depending on fracture conductivity. Because this range of CO2-injectivity is still commercially marginal, we investigated using Radial-Lateral Wells (RLW) shown in Figure 2 for increasing CO2-injectivity into gas-hydrate reservoirs or low-temperature aquifers in this study.
The first versions of RLW are short-radius open-hole multi-lateral wells drilled for improving well productivity (Marbun et al., 2011). Abdel-Ghany (2011) reported application of the technology in offshore field development. Modern RLW are created by radial jet-drilling (RJD) starting from cased hole (Wang et al., 2016; Kamel 2017; Qin et al., 2020). Productivity of RLW has been studied by many investigators including Liu et al. (2012), Lu et al. (2014), Jain et al. (2017), and Maut et al. (2017). Based on Furui et al.’s (2003) model for horizontal wells, Guo et al. (2020) developed a mathematical model for predicting productivity of RLW considering the interactions between radial laterals. No literature reports any mathematical model for injectivity of RLW. Such a model is highly desired and developed for predicting CO2-injectivity into marine hydrate reservoirs and low-temperature aquifers for project feasibility analysis.
Mathematical Model
A mathematical model for predicting injectivity of RLW was derived in this study using the following assumptions:
- 1)
- Reservoir rock is homogeneous and isotropic in horizontal extension;
- 2)
- The injected fluid is incompressible;
- 3)
- Pseudo-steady state flow condition prevails in the reservoir; and
- 4)
- Radial laterals are identical in geometry and evenly placed in the reservoir.
The first assumption, homogeneous and isotropic properties in horizontal extension, is valid for most clayey deposits formed in marine environments where gas hydrates are found. The second assumption, incompressible fluid, is valid for water and CO2 in supercritical conditions that exist in CO2 injection wells. The third assumption, pseudo-steady state flow, becomes realistic after a short transient flow period. The fourth assumption, identical and evenly distributed RLW, is realistic with the modern RJD technology.
Development of the well injectivity model is given in Appendix A for reference. The resultant model is briefly presented as follows.
where
- QLmax = the maximum permissible fluid injection rate in bbl/day,
- n = number of radial laterals,
- kH = formation horizontal permeability in md,
- h = thickness of reservoir in ft,
- smin = the minimum formation in-situ stress in psi,
- = reservoir pressure in psi,
- μL = liquid viscosity in cp,
- rw = lateral wellbore radius in ft,
- s = skin factor of wellbore,
- L = length of lateral in ft,
- Rw = radius of the main wellbore in ft,
and
where kV is vertical formation permeability in md.
The maximum permissible fluid injection rate corresponds to the maximum permissible bottom fluid injection pressure being equal to the minimum formation in-situ pressure. Because the minimum in-situ stress is normally the vertical stress in shallow marine deposits, using any fluid injection rate that is higher than this maximum fluid injection rate is expected to cause formation breakdown/fracturing and lifting the overburden of the reservoir, which can be disastrous for offshore operations involving gas hydrates.
The developed well injectivity model has not been validated due to lack of field data. However, the model for oil production wells has been validated by Guo et al. (2020) using data from 3 RLW. They found that the productivity model overestimated production rates for the 3 wells by 7.7%, 3.25%, and 8.8%, respectively. The error was attributed to lack of data for well skin factor, uncertainty of horizontal permeability, uncertainty of permeability anisotropy (Iani), and uncertainty in bottom hole pressure. COMSOL Multiphysics simulation was also used to validate the model. The values of the Mean Absolute Percentage Error (MAPE) were found 2.98% and 5.92% for two analyzed cases. It is understood that, when the well injectivity model is applied to CO2-injection into gas hydrate reservoirs, less accuracy is expected due to the uncertainties in determination of free gas/water saturation, relative permeability, and the effect of CH4-CO2 swapping.
Comparison of Well Types
It is worthy to investigate the improvement of RLW over other types of wells in fluid injectivity. This section provides a comparison of well injectivity using the term Fold of Increase (FoI). The FoI of RLW over vertical well is defined by
and the FoI of RLW over frac-packed well is defined by
The injectivity of vertical well is expresses as (Guo et al., 2017):
The injectivity of frac-packed well is written as (Guo and Zhang, 2023):
where w is fracture width in inch and is fracture permeability in md.
Substitution of Equations (1) and (5) into Equation (3) yields:
Substituting Equations (1) and (6) into Equation (4) gives:
Due to the complex forms of Equations (7) and (8), it is not clear what trends the FoIRoV and FoIRoF take. A numerical analysis was further carried out using the data in Table 1. Figure 3 shows the effects of number of laterals and lateral length on FoIRoV. It indicates that the FoIRoV is nearly proportional to the number of laterals and lateral length. Using RLW to replace vertical wells can improve fluid injectivity by over 30 times. Figure 4 illustrates the effects of number of laterals and lateral length on FoIRoF. It shows that the FoIRoF is also nearly proportional to the number of laterals and lateral length. Using RLW to replace frac-packed wells can increase fluid injectivity by over 10 times.
Field Case Study
A case study was performed using data from the gas hydrate reservoir in the Shenhu area, Northern South China Sea. The water depth is about 1,180 m in the area. The gas hydrate reservoir is between 155 m and 177 m below the mudline (Wang et al. (2014). The average reservoir pressure and temperature are approximately 14 MPa and 6 oC, respectively (Li, et al., 2018). The major component of the natural gas in the Shenhu area is methane. The dissociation temperature of the gas hydrate at 14 MPa is about 15 oC (Chen et al., 2018). The reservoir is composed of clayey silt in three intervals namely “a”, “b”, and “c”. Interval “a” has an effective about 0.35, hydrate saturation about 34%, and permeability about 2.9 md. Interval “b” has an effective porosity about 0.33, hydrate saturation about 31%, and permeability about 1.5 md. Interval “c” has an effective porosity about 0.32, gashydrate saturation about 7.8%, and permeability about 7.4 md (Chen et al., 2018). Recently Lu et al. (2023) presents a review of research progress and scientific challenges in the depressurization exploitation mechanism of clayey-silt natural gas hydrates in the area. They reported that 85% of the produced natural gas is from dissociation of gas hydrates. This means that 15% of the produced natural gas is from the free gas in the reservoir, indicating that the reservoir is a Class 1G type gas hydrate reservoir. They also reported that the maximum gas relative permeability is 0.1.
Table 2 presents a summary of estimated reservoir properties and wellbore geometry of RLW for CO2 injection. A conservative value of the effective horizontal permeability to CO2 was estimated to be about 1 md, considering free-gas saturation and relative permeability to the CO2 phase. Equation (1) indicates that the injectivity of the RLW depends on several factors including the controllable parameters (lateral length, lateral radius, and the number of laterals) and parameters (reservoir permeability and permeability anisotropy). A sensitivity analysis was performed using the data set in Table 1 by varying one parameter at a time.
Figure 5 shows model-calculated effects of number of laterals on well injectivity for 9 lateral lengths. It indicates that CO2-injectivity increases with the number of laterals and lateral length. This is because these parameters control the flow cross-section area at the sand face. The injectivity is proportional to the number of laterals when the laterals are short, but the linearity drops for long laterals. In the practical ranges of the number of lateral and lateral length between 100 ft and 500 ft, CO2-injectivity of the RLW can be 19 tons/day to 250 tons/day.
Figure 6 presents model-calculated effect of lateral radius on well injectivity for 4 values lateral radii. It shows that well injectivity increases non-linearly with lateral length. This is because wellbore radius affects the flow cross-section area at the sand face. The narrow band covered by the 4 curves implies that the injectivity is not sensitive to lateral radius in the range investigated.
Equation (1) shows explicitly that well injectivity is directly proportional to the reservoir horizontal permeability. However, the effect of reservoir permeability anisotropy is not obvious. Figure 7 illustrates model-calculated effect of reservoir permeability anisotropy on well injectivity. It shows that well injectivity decreases non-linearly with reservoir permeability anisotropy. This is because reservoir permeability reduces fluid seepage flow in the vertical direction.
Discussion
Effect of Reservoir Type. The result of case analysis presented in the above section was obtained based on the assumption of CO2 flows in the gas hydrate reservoir prior to decomposition of natural gas hydrates. This can happen only in Class 1 type gas hydrate reservoirs where at least one free phase exists, such as gas hydrates and free gas (1G type) or gas hydrates and free water (1W). If the free-phase does not exist in the gas hydrate reservoir, relying on CH4-CO2 swapping due to molecular diffusion would make it very difficult to inject CO2 at commercial rate. It is also understood that Equation (1) is expected to be more conservative in 1G than in 1W gas hydrate reservoirs because the gas in front of CO2 has higher mobility than water.
Effect of Hydrate Formation. Equation (1) was derived based on the assumption of no formation of CO2 hydrates during CO2 injection. This assumption may be valid in the near wellbore region where the high velocity of CO2 flow should not give sufficient retention time for forming CO2 hydrates. This condition may not exist in the region away from the wellbore where the CO2 velocity can drop to below a critical value that will cause CO2-hydrate to form, reducing injectivity. Future studies should investigate the determination of the critical velocity through lab-testing and/or computer simulation with compositional multi-phase flow models.
Conclusions
It is desirable to inject CO2 into marine gas hydrate reservoirs for non-leak storage. Low-injectivity of conventional wells is a major concern in the process. Radial lateral wells (RLW) are proposed to improve well injectivity. A mathematical model was derived in this work to predict injectivity of RLW for CO2 injection. The following conclusions are drawn based on case studies and sensitivity analysis.
- The FoIRoV is nearly proportional to the number of laterals and lateral length. Using RLW to replace vertical wells can improve CO2 injectivity by over 30 times.
- The FoIRoF is also nearly proportional to the number of laterals and lateral length. Using RLW to replace frac-packed wells can increase CO2 injectivity by over 10 times.
- CO2 can be injected into marine gas hydrate reservoirs through an RLW at a rate of 19 tons/day to 250 tons/day, which theoretically proves the feasibility of the RLW technology.
- RLW injectivity increases with lateral length, lateral radius, and the number of laterals. It is nearly proportional to the lateral length and the number of laterals but not sensitive to lateral radius.
- RLW injectivity is directly proportional to reservoir permeability and inversely proportional to reservoir permeability anisotropy.
The mathematical model has some limitations in real applications. It may be applicable to Class 1 type gas hydrate reservoirs with free gas (1G type) or free water (1W). The model may be valid in the near wellbore region where the high velocity of CO2 flow should not give sufficient retention time for forming CO2 hydrates. This condition may not exist in the region away from the wellbore where the CO2 velocity can drop to below a critical value that will cause CO2-hydrate to form. Future studies should investigate the determination of the critical velocity through lab-testing and/or computer simulation with compositional multi-phase flow models.
Appendix A. Derivation of Analytical Model for Injectivity of Radial-Lateral Wells
The following assumptions are made in deriving an injectivity model of radial-lateral wells: 1) reservoir rock is homogeneous and isotropic in horizontal extension, 2) reservoir fluids and injected fluids are incompressible liquids; 3) psudo-steady state flow condition prevails, and 4) radial laterals are identical in geometry and evenly placed in the reservoir.
The plan view of a radial-lateral well model is sketched in Figure A1. For an infinitesimal segment of a lateral dx at distance x from the center of the main wellbore, the following relation is considered (Furui’s, 2003):
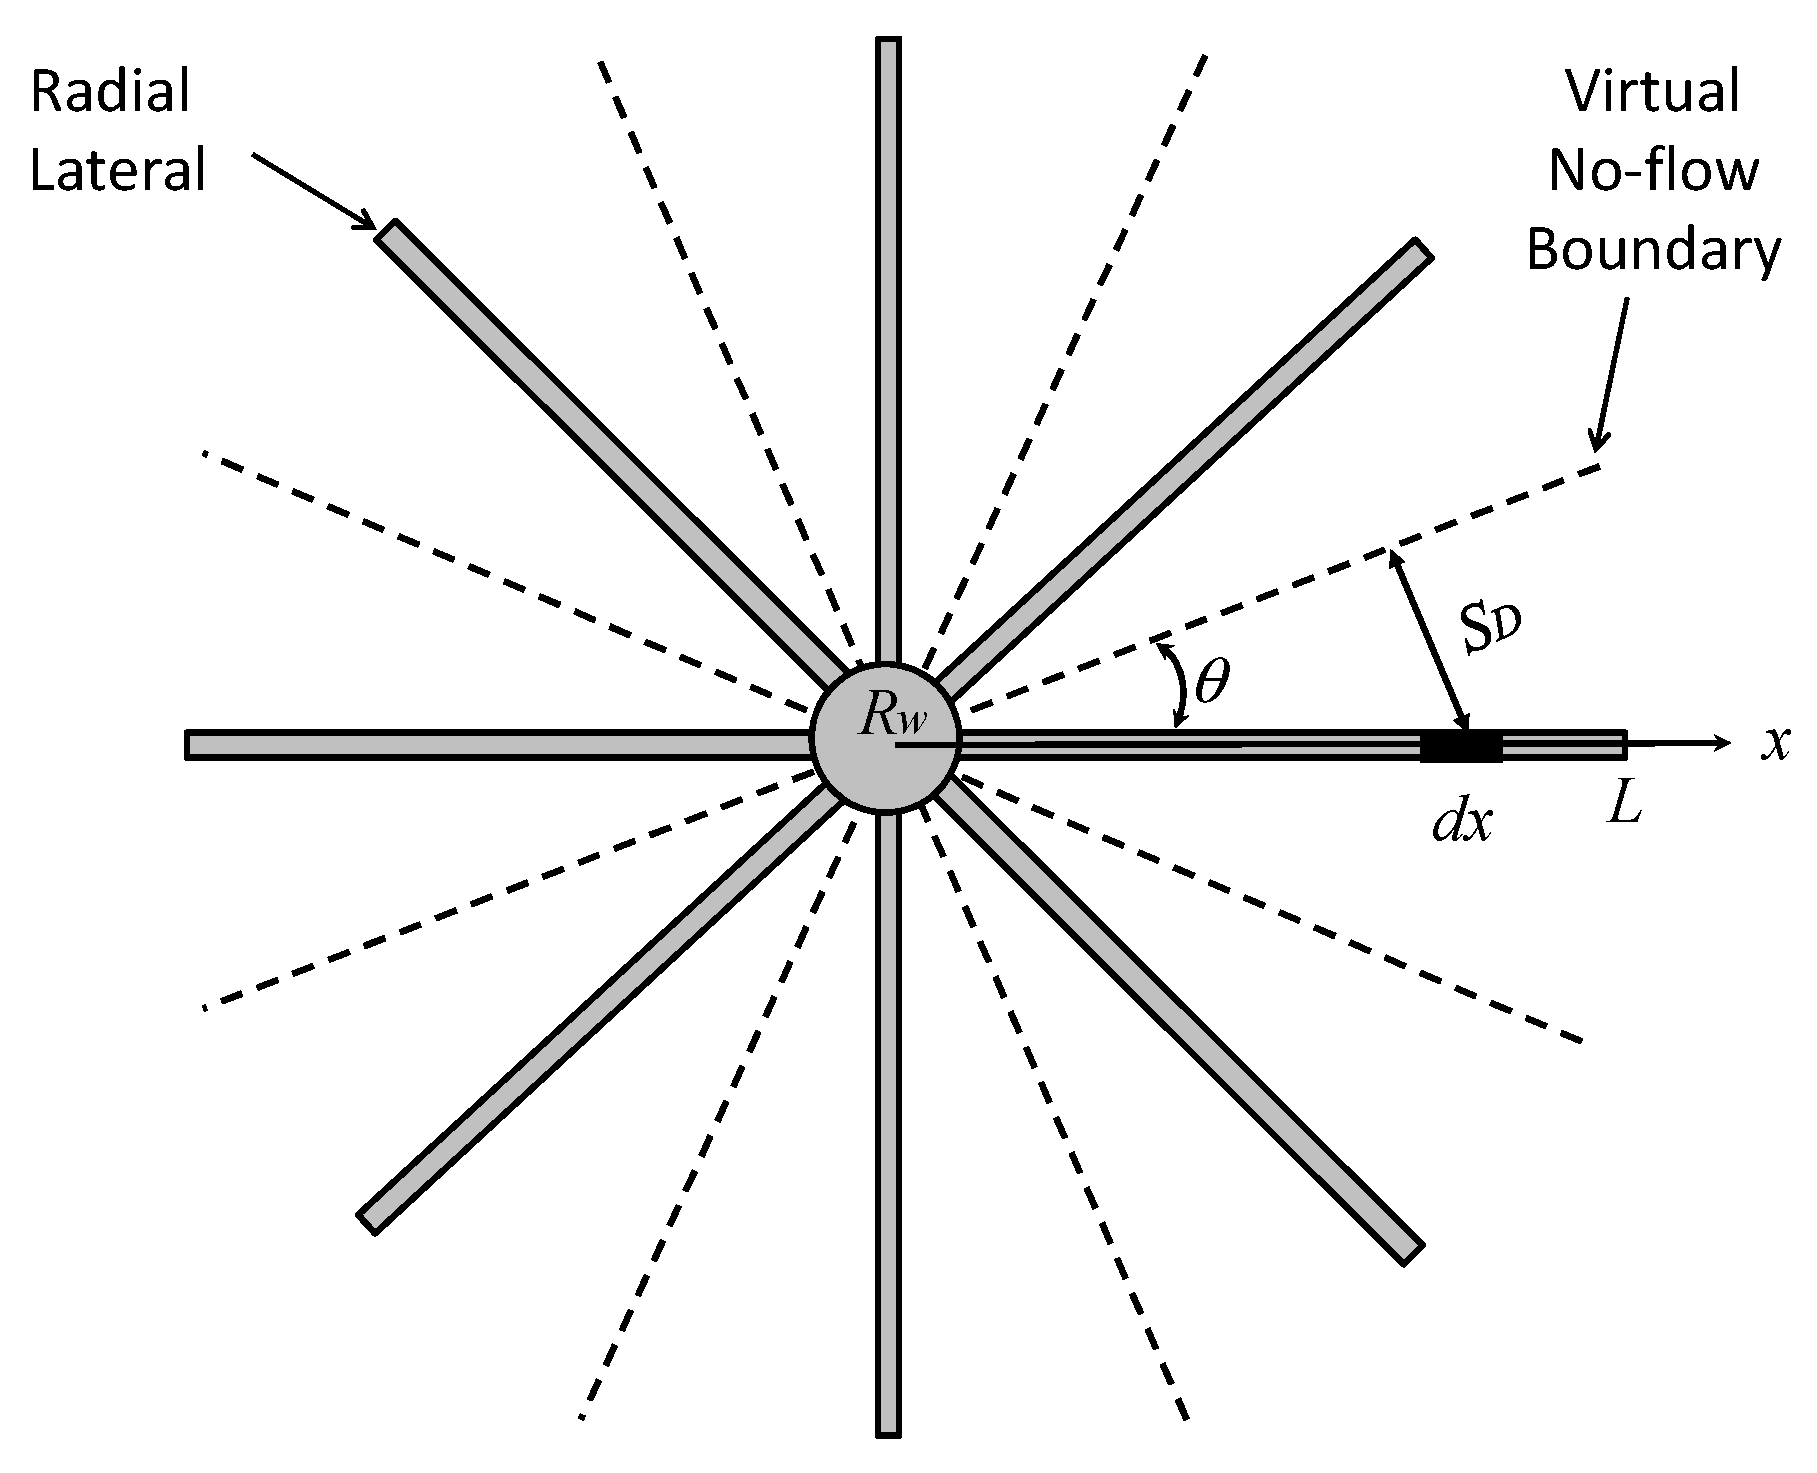 where qL is liquid flow rate in bbl/day, kH is horizontal permeability in md, pw is lateral wellbore pressure in psi, is the average reservoir pressure in psi, μL is liquid viscosity in cp, h is thickness of reservoir in ft, rw is lateral wellbore radius in ft, s is lateral wellbore skin factor, SD is the drainage distance of the wellbore segment dx in ft. The reservoir anisotropy factor is defined as:
where kV is the vertical permeability of formation rock in md. The drainage distance of wellbore segment relates to its location x and the angle θ between laterals:
where n is the number of laterals. Substituting this relation into Equation (A.1) gives:
which can be integrated as
where Rw is the radius of the main wellbore. This equation is integrated to give the following.
where qL is liquid flow rate in bbl/day, kH is horizontal permeability in md, pw is lateral wellbore pressure in psi, is the average reservoir pressure in psi, μL is liquid viscosity in cp, h is thickness of reservoir in ft, rw is lateral wellbore radius in ft, s is lateral wellbore skin factor, SD is the drainage distance of the wellbore segment dx in ft. The reservoir anisotropy factor is defined as:
where kV is the vertical permeability of formation rock in md. The drainage distance of wellbore segment relates to its location x and the angle θ between laterals:
where n is the number of laterals. Substituting this relation into Equation (A.1) gives:
which can be integrated as
where Rw is the radius of the main wellbore. This equation is integrated to give the following.
Figure A1.
Planar configuration of a radial-lateral well.
If a well has n evenly placed radial laterals, the fluid injection rate of the well can be expressed as:
where QL is well liquid injection rate in bbl/day.
The maximum permissible fluid injection rate is defined as the flow rate at which the formation is broken down (fractured) by the injection pressure near the wellbore, i.e., pw= pf, where pf is formation fracturing pressure. For highly permeable formations, such as gas hydrate reservoirs with free gas or free water, the formation fracturing pressure is approximately equal to the minimum formation stress. Therefore, the maximum permissible fluid injection rate is expressed as
where smin is the minimum formation stress which is normally the vertical in-situ stress in subsea sediments.
References
- Abdel-Ghany, M. A., Siso, S., Hassan, A. M., Pierpaolo, P., & Roberto, C. (2011, January 1). New Technology Application, Radial Drilling Petrobel, First Well In Egypt. Offshore Mediterranean Conference.
- Bhawangirkar, D.R., Nair, V.C., and Sangwai, J. 2019. Phase Equilibria and Kinetics of Methane Hydrate Formation and Dissociation in Krishna–Godavari Basin Marine Sediments. Proceedings of the Fifth International Conference in Ocean Engineering (ICOE2019), January 2021. pp.405-411. [CrossRef]
- Chen, L., Feng, Y., Okajima, J., Komiya, A., and Maruyama, S. 2018. Production behavior and numerical analysis for 2017 methane hydrate extraction test of Shenhu, South China Sea, J. Nat. Gas Sci. Eng. 53 (2018) 55e66. [CrossRef]
- Davies, S. R., Sloan, E. D., Sum, A. K., et al. In situ studies of the mass transfer mechanism across a methane hydrate film using high-resolution confocal Raman spectroscopy. The Journal of Physical Chemistry C, 2010, 114(2): 1173-1180.
- Duguid, A., Guo, B., Nygaard, R. Well integrity assessment of monitoring wells at an active CO2-EOR flood. Energy Procedia, 2017, 114: 5118-5138.
- Furui, K., Zhu, D., and Hill, A.D.: “A Rigorous Formation Damage Skin Factor and Reservoir Inflow Model for a Horizontal Well,” SPERE (August 2003): 151.
- Frölicher, T. L., Winton, M,, Sarmiento, J. L. Continued global warming after CO2 emissions stoppage. Nature Climate Change, 2014, 4(1): 40-44.
- Gaurina-Međimurec, N., Mavar, K. N. Carbon capture and storage (CCS): geological sequestration of CO2. CO2 Sequestration, 2019: 1-21.
- Guo, B.; Ghalambor, A. Natural Gas Engineering Handbook, 2nd ed.; Gulf Publishing Company: Houston, TX, USA, 2012; pp. 277–279.
- Guo, B., Liu, X., and Tan, X. 2017. Petroleum Production Engineering, Gulf Professional Publishing, Cambridge (2017). pp. 39–40.
- Guo, B. and Zhang, P. 2023. Theoretical assessment of CO2 injection into low-temperature water zones for non-leaking storage in hydrate form. Advances in Geo-Energy Research. 2023, 10(1). 1-6.
- Guo, B., Shaibu, R., and Yang, X. 2020. Analytical Model for Predicting Productivity of Radial-Lateral Wells. Energies 2020. 13(23), 6386. [CrossRef]
- Jain, D., Maut, P. P., Saharia, P., Dutta, R., Yomdo, S., Hatchell, I., & Mukherjee, A. (2017, April 4). Radial Jet Drilling in Mature Fields of Oil India Limited- An Experimental Approach. Society of Petroleum Engineers. [CrossRef]
- Kamel, A. H. (2017, March 6). Radial Jet Drilling: A Technical Review. Society of Petroleum Engineers. doi:10.2118/183740-MS. [CrossRef]
- Li, J.F., Ye, J.L. Qin, X.W., Qiu, H.J., N.Y. Wu, Lu, H.L., and Xie, W.W. 2018. The first offshorenatural gas hydrate production test in South China Sea, China Geol 1 (2018)5e16.
- Liu, C., Ye, Y., Meng, Q., et al. The characteristics of gas hydrates recovered from Shenhu Area in the South China Sea. Marine Geology, 2012, 307: 22-27.
- Lu, C., Qin, X., Sun, J., Wang, R., Cai, J. and Yu, H. 2023. Research progress and scientific challenges in the depressurization exploitation mechanism of clayey-silt natural gas hydrates in the northern South China Sea. Advances in Geo-energy Research, 2023 10(1): 14-20. [CrossRef]
- Lu, Y., Li, N., Zhou, X., Wang, X., Zhang, F., Yang, P., Teng, X. (2014, March 25). Radial Drilling Revitalizes Aging Field in Tarim: A Case Study. Society of Petroleum Engineers. [CrossRef]
- Marbun, B. T. H., Zulkhifly, S., Arliyando, L., & Putra, S. K. (2011, January 1). Review of Ultrashort-Radius Radial System (URRS). International Petroleum Technology Conference. [CrossRef]
- Maut, P. P., Jain, D., Mohan, R., Talukdar, D., Baruah, T., Sharma, P., & Verma, S. (2017, November 7). Production Enhancement in Mature Fields of Assam Arakan Basin by Radial Jet Drilling- A Case Study. Society of Petroleum Engineers. [CrossRef]
- Moridis, G.J., Collett, T.S., Boswell, R., Kurihara, M., and Reagan, M.T. 2008. Toward Production from Gas Hydrates: Assessment of Resources, Technology and Potential, 2008.
- Moridis, G.J., Kowalsky, M.B, and Pruess, K. 2027. Depressurization-induced gas production from class-1 hydrate deposits, SPE Reservoir Eval. Eng. 10 (2007) 458e481. [CrossRef]
- Qin, X., Mao, J., Liu, J., Zhao, Y., & Long, W. (2020, March 16). Extended Reach Analysis of Coiled Tubing Assisted Radial Jet Drilling. Society of Petroleum Engineers. [CrossRef]
- Soeder, D. J. Greenhouse gas sources and mitigation strategies from a geosciences perspective. Advances in Geo-Energy Research, 2021, 5(3): 274-285.
- Su, M.; Yang, R.; Wu, N.Y. Structural characteristics in the Shenhu Area, northern continental slope of South China Sea and their influence on gas hydrate. Acta Geol. Sin. 2014, 88, 318–326.
- Wang, Y., Li, J., Sen, X., Li, G., Huang, N.S., and Feng, J.C. 2014. Experimental study on the hydrate dissociation in porous media by five-spot thermal huff and puff method, Fuel 117 (2014) 688e696. [CrossRef]
- Wang, B., Li, G., Huang, Z., Li, J., Zheng, D., & Li, H. (2016, March 1). Hydraulics Calculations and Field Application of Radial Jet Drilling. Society of Petroleum Engineers. [CrossRef]
- Zhang, P., Guo, B., Liu, N. Numerical simulation of CO2 migration into cement sheath of oil/gas wells. Journal of Natural Gas Science and Engineering, 2021, 94: 104085.
Figure 1.
Phase equilibrium curves for CO2 and CH4 (Bhawangirkar et al., 2019).
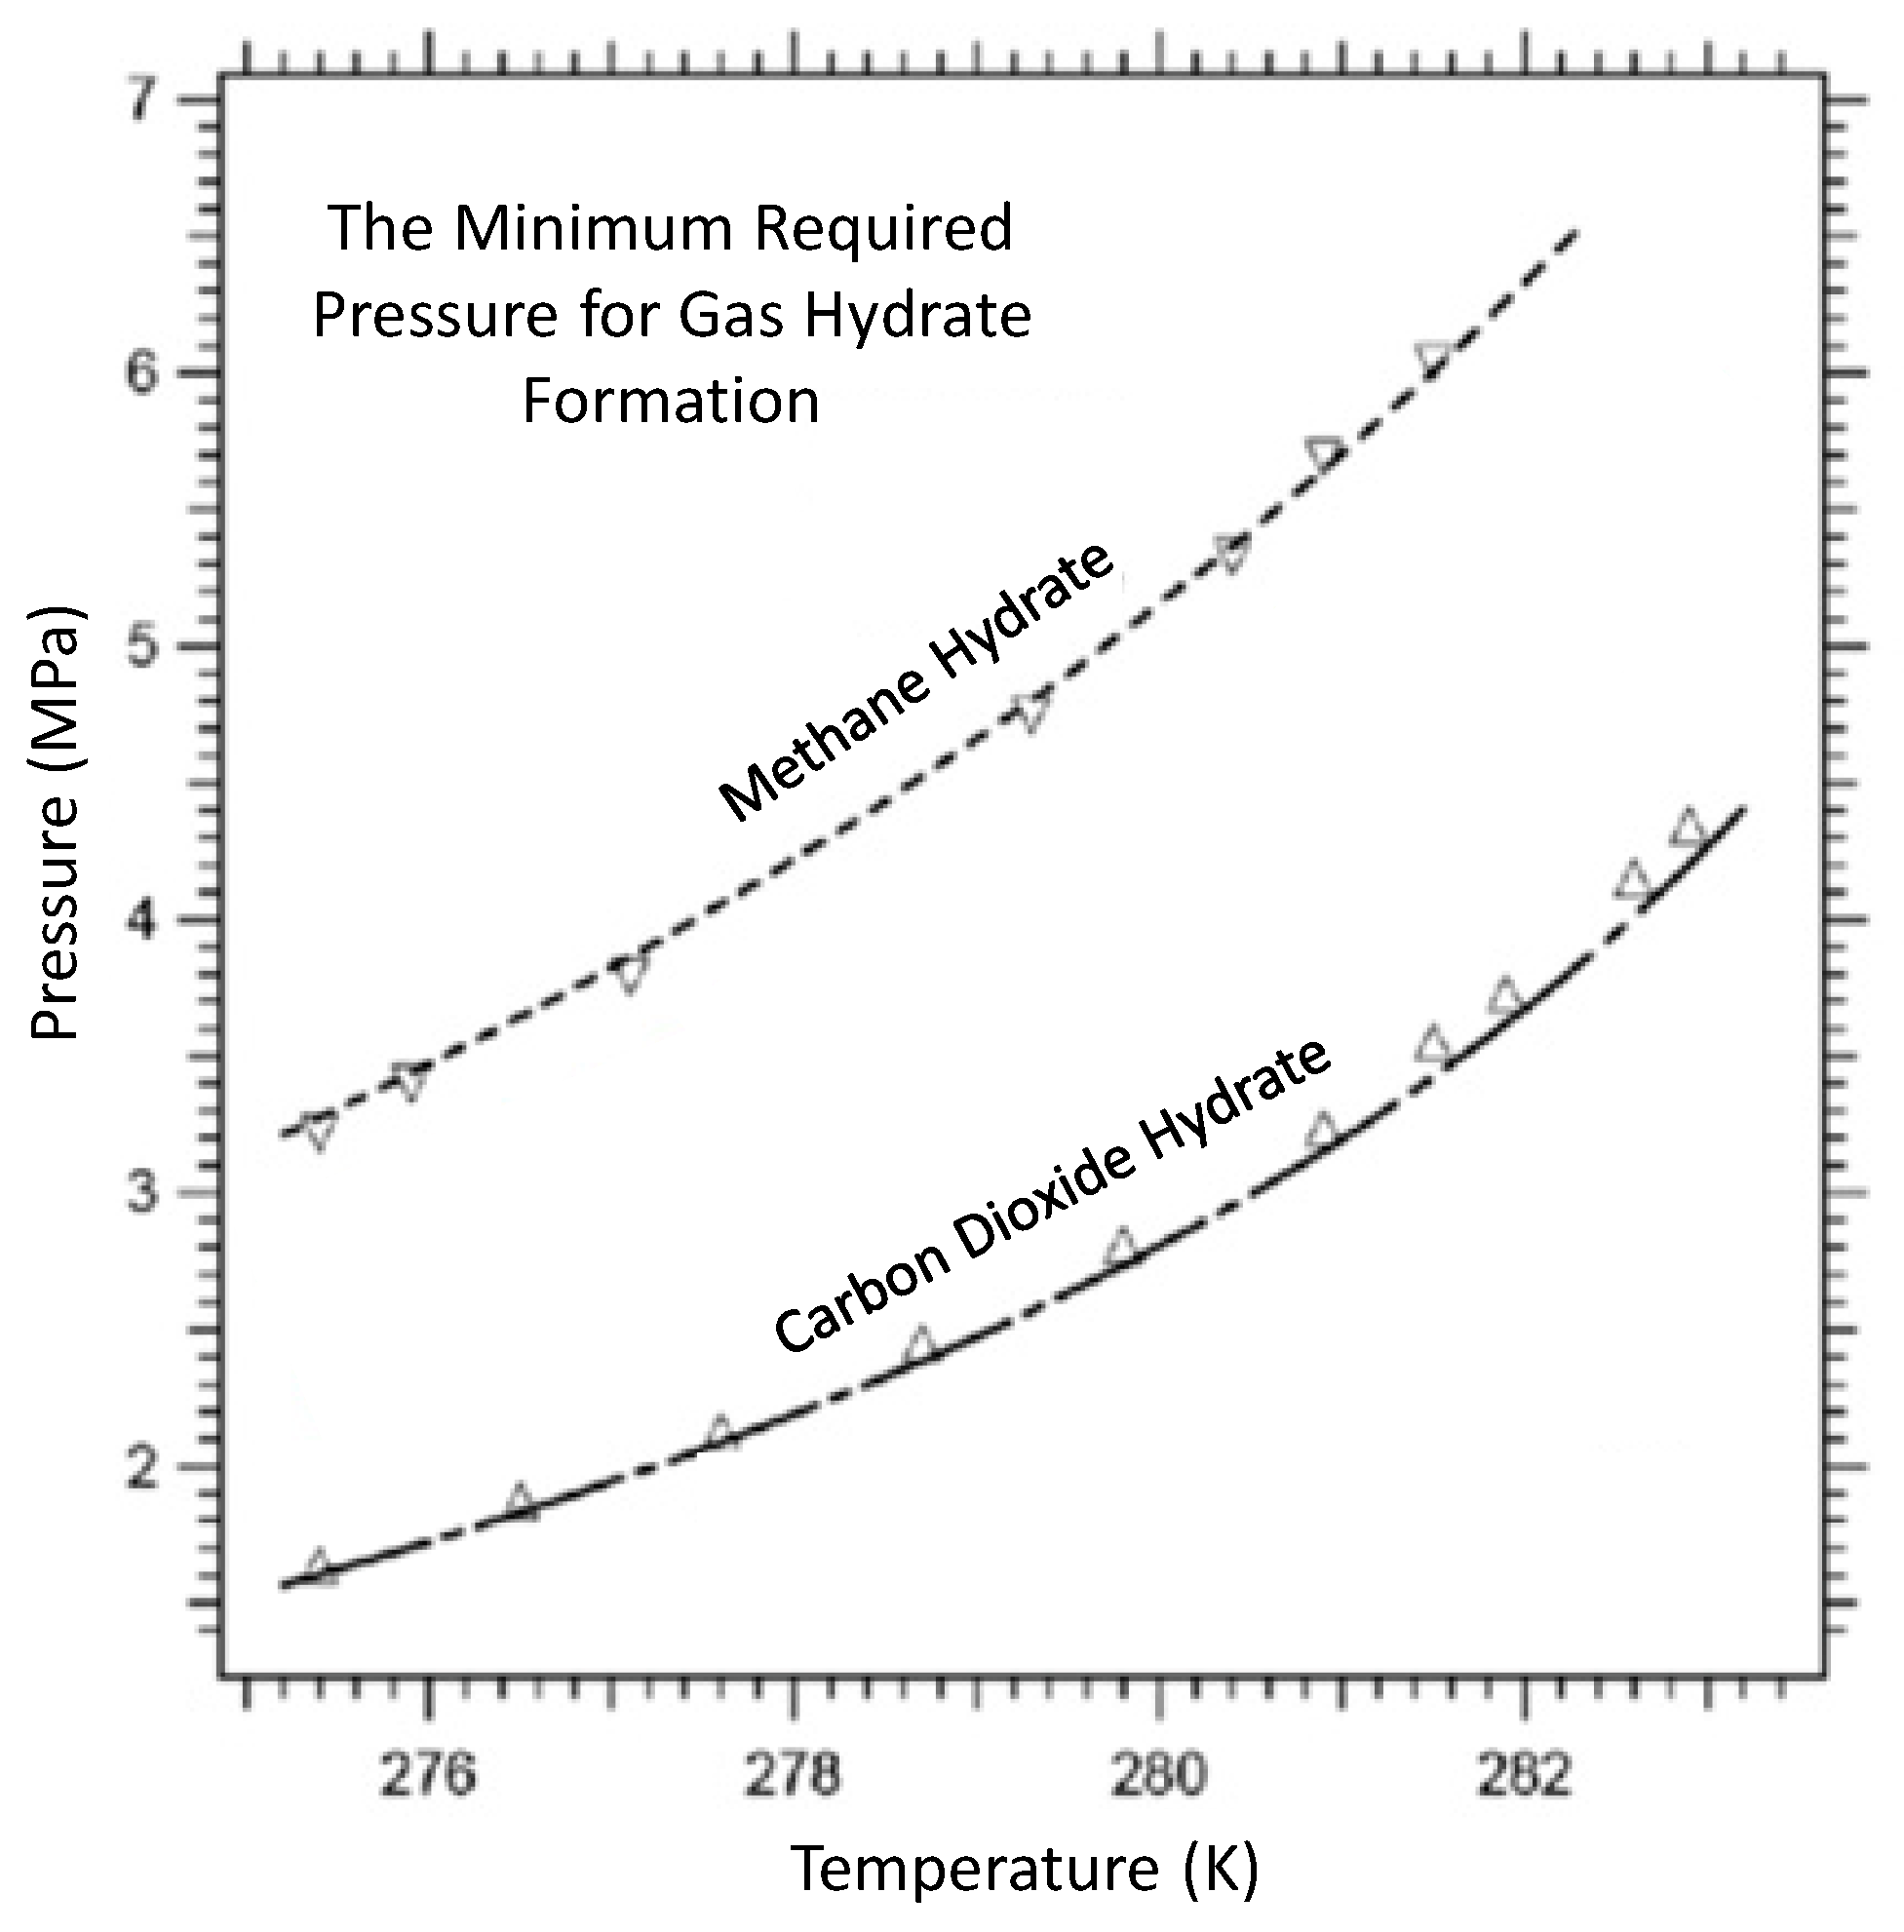
Figure 2.
Sketch of a radial lateral well with four identical laterals.
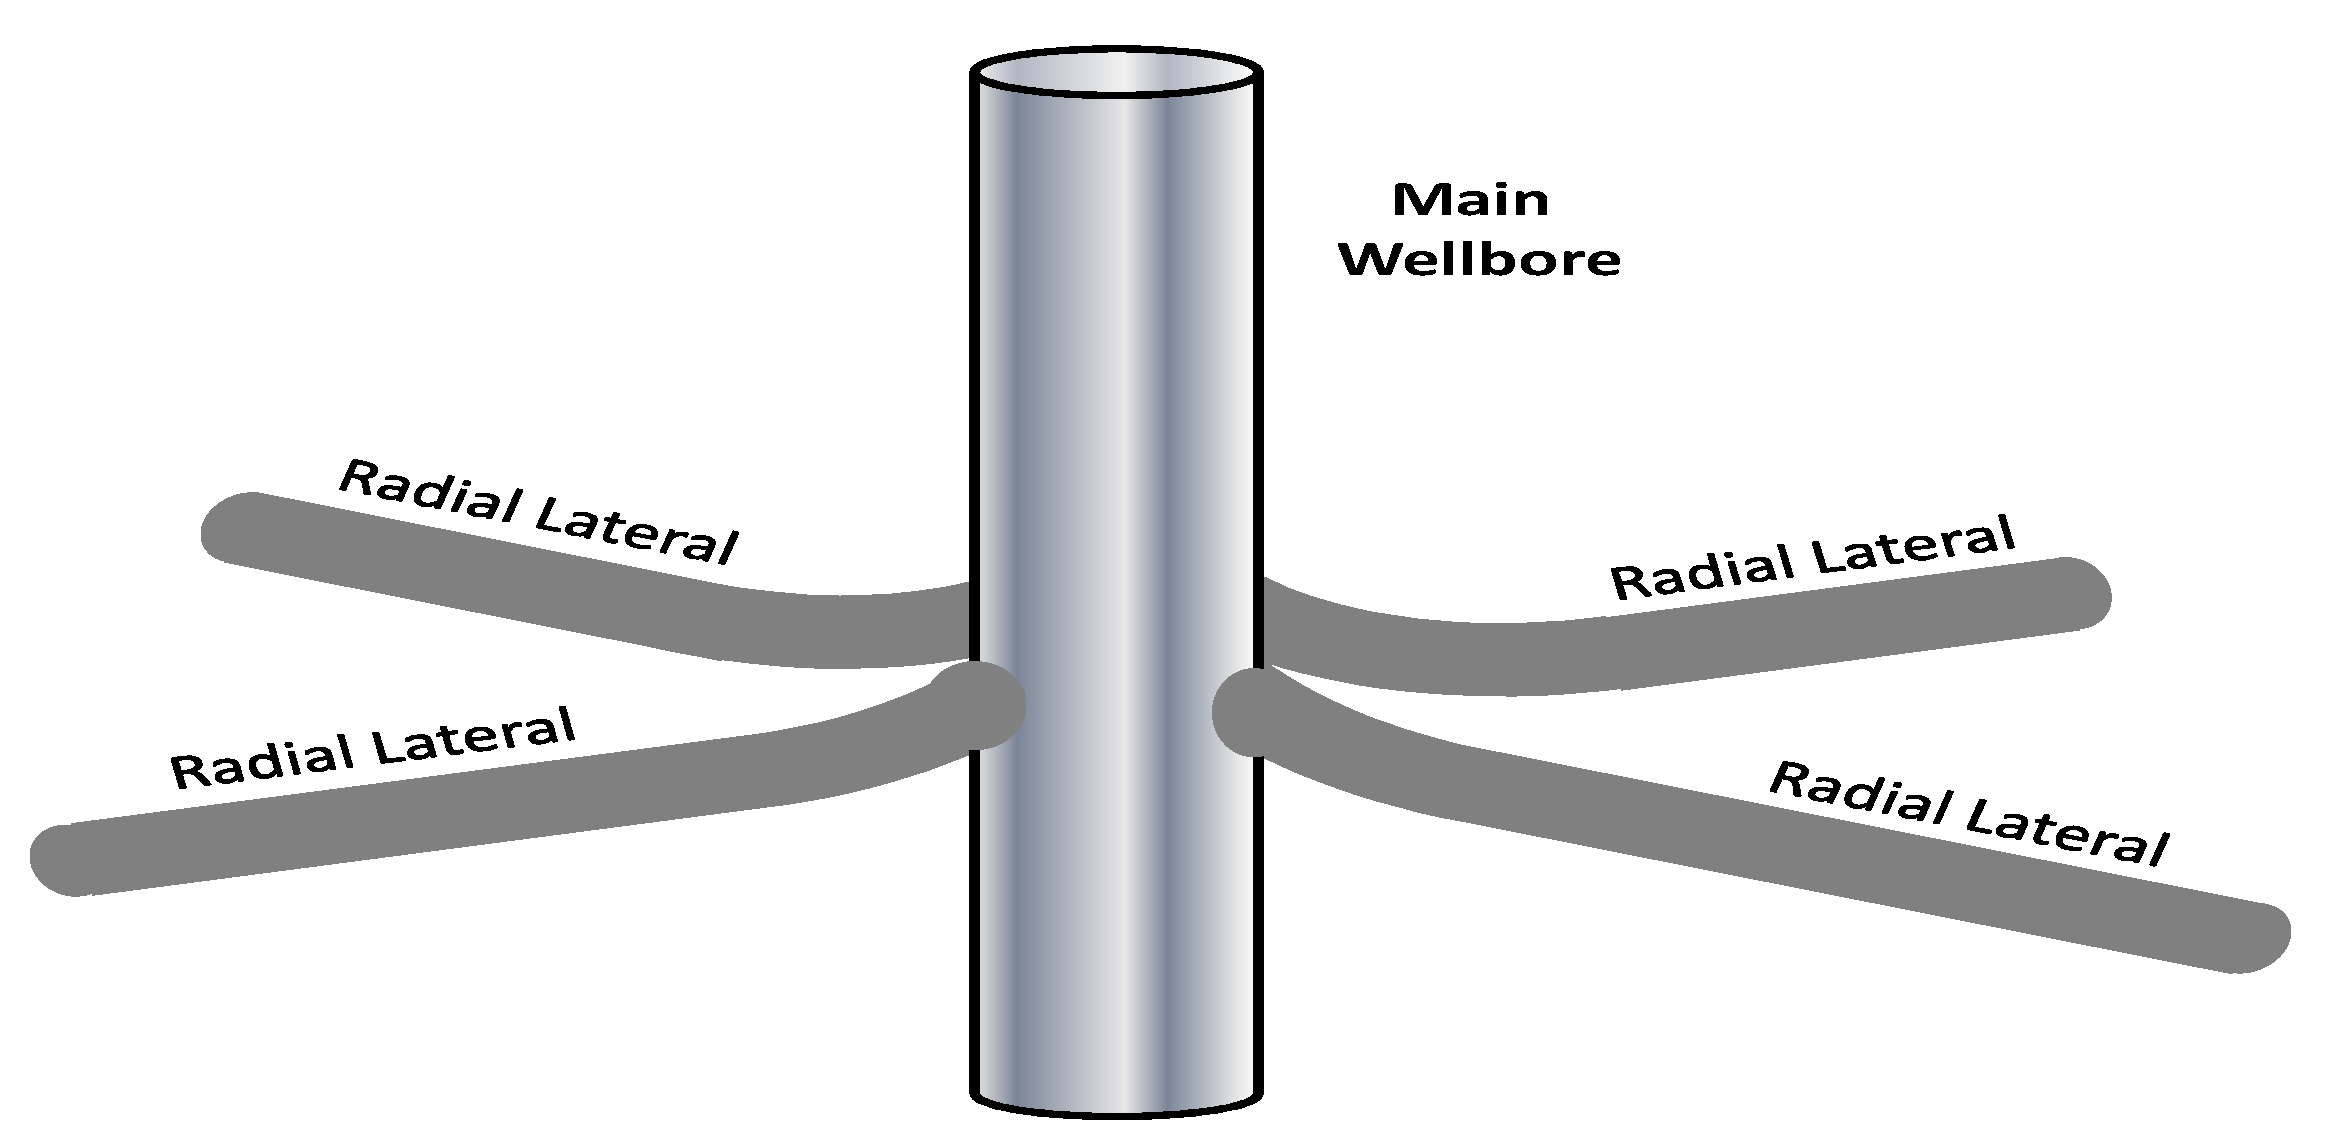
Figure 3.
Effects of number of laterals and lateral length on FoIRoV.
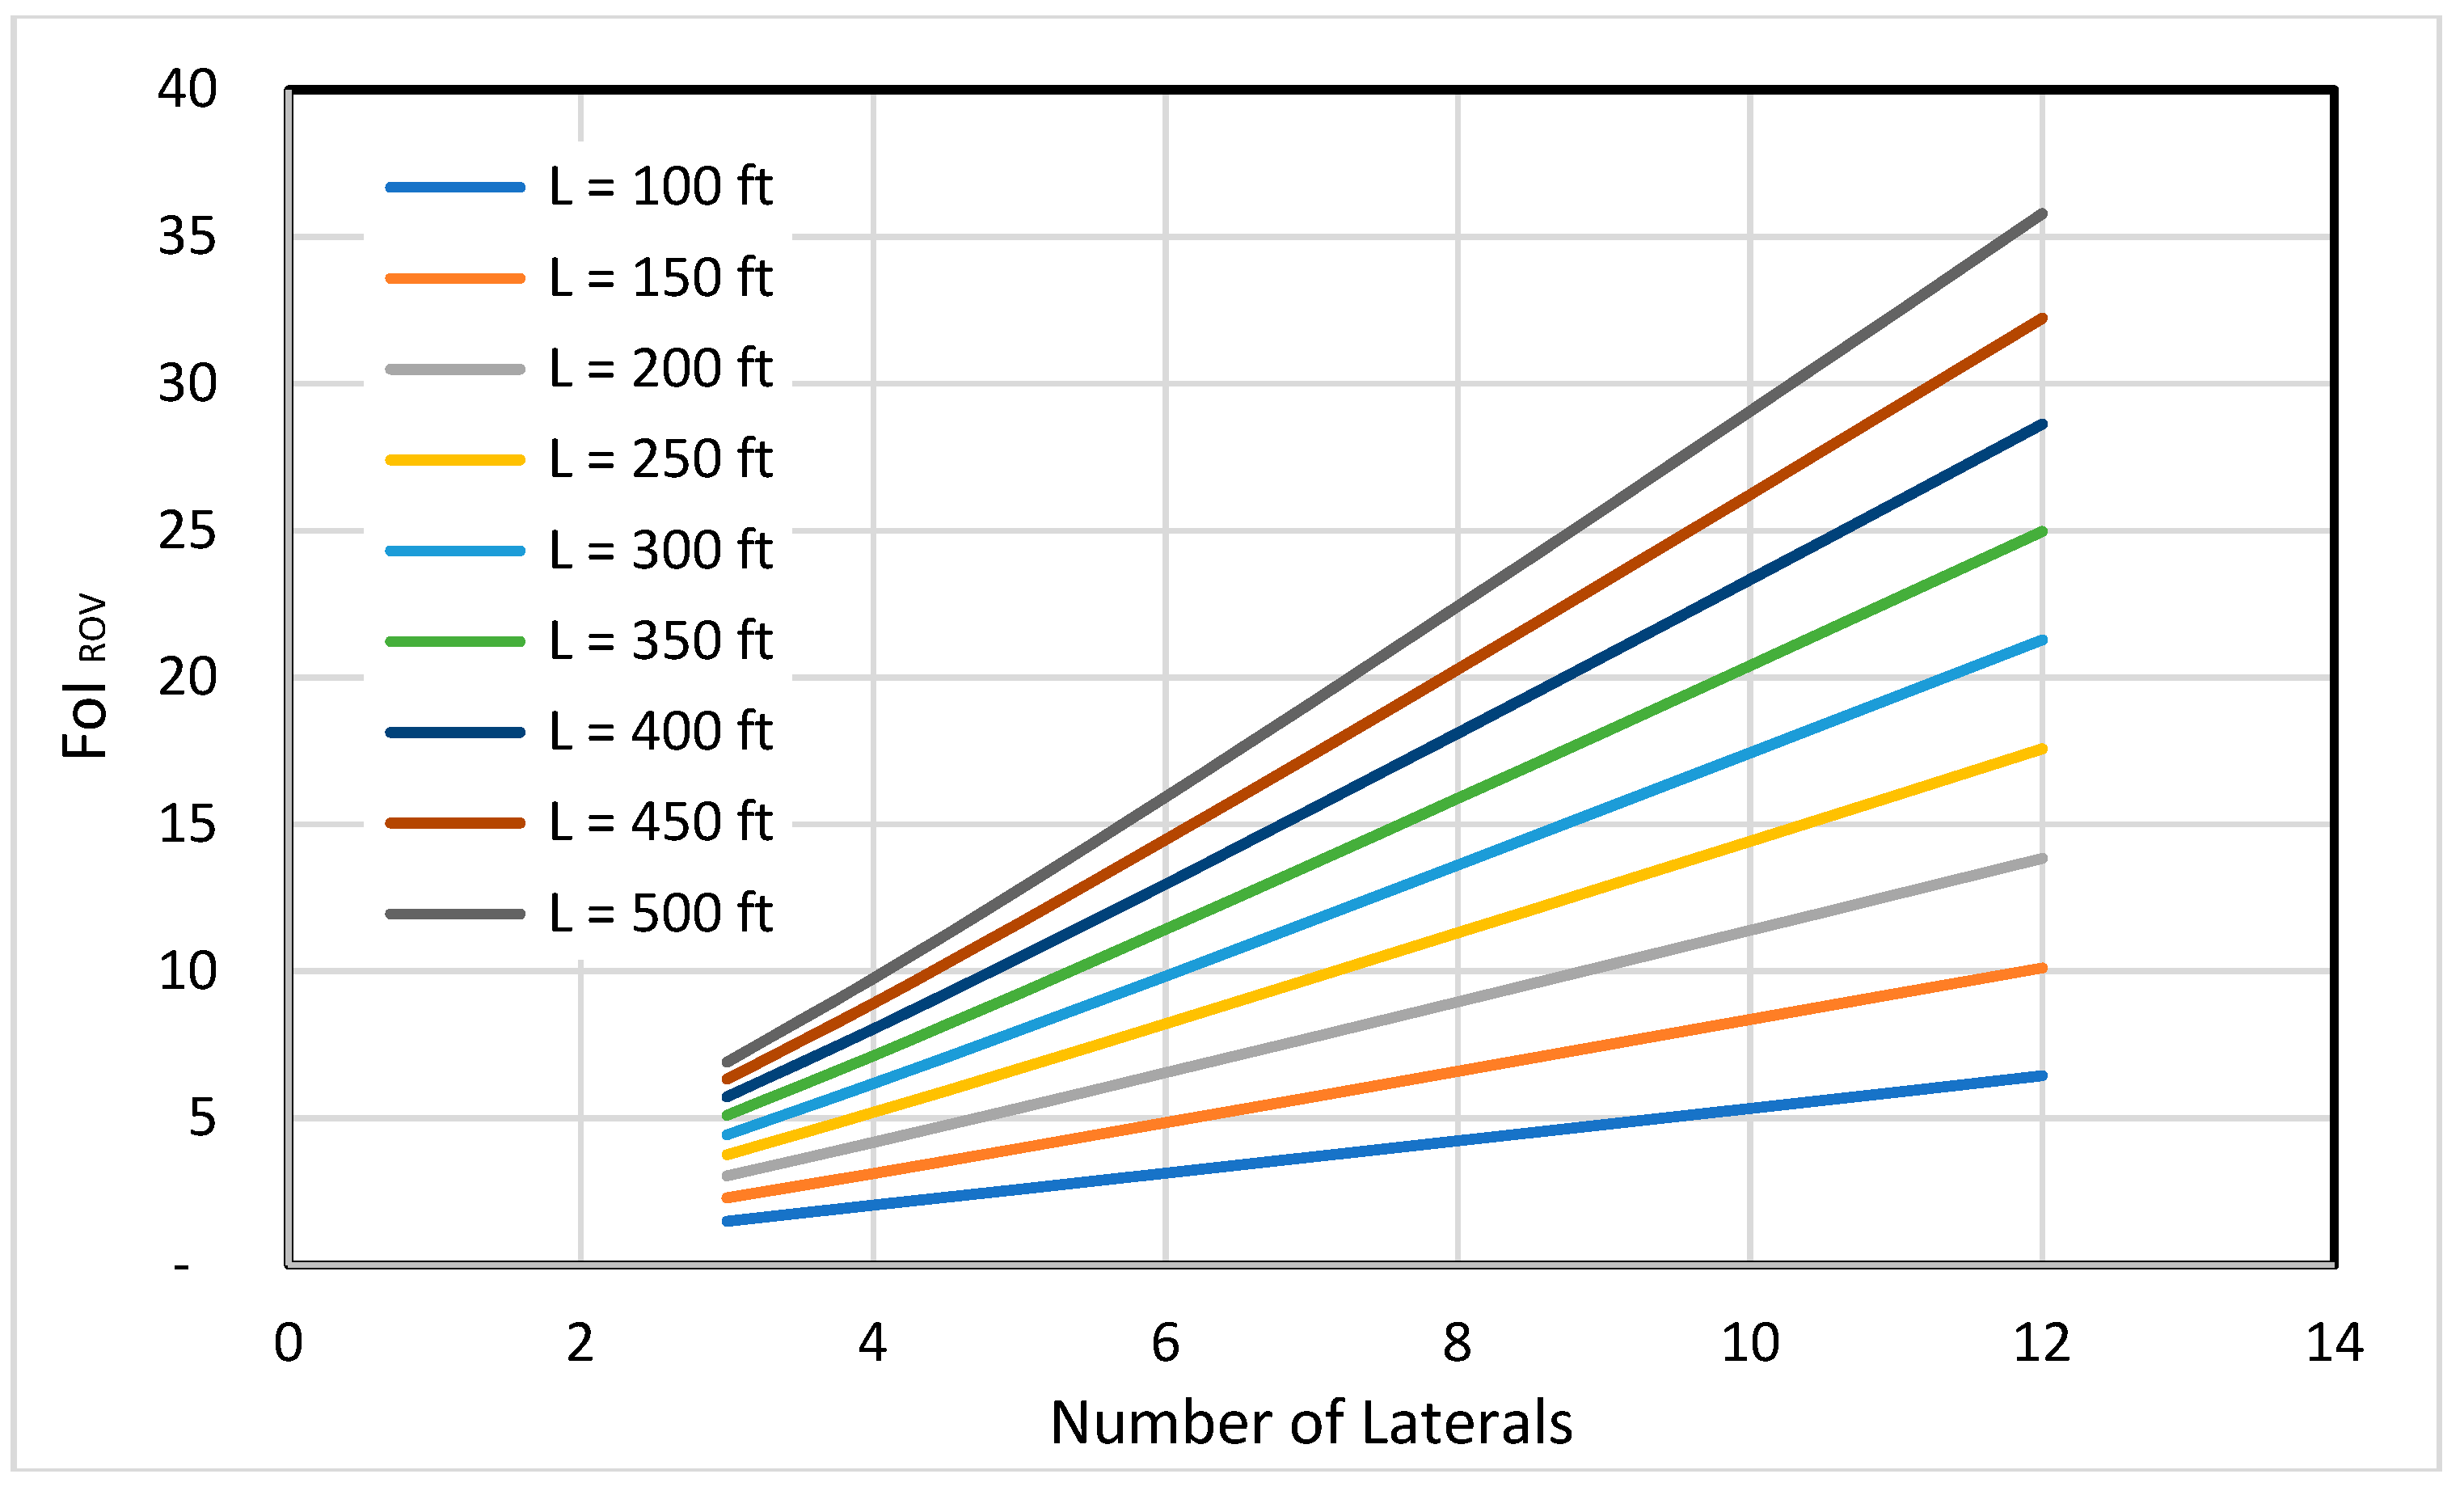
Figure 4.
Effects of number of laterals and lateral length on FoIRoF.
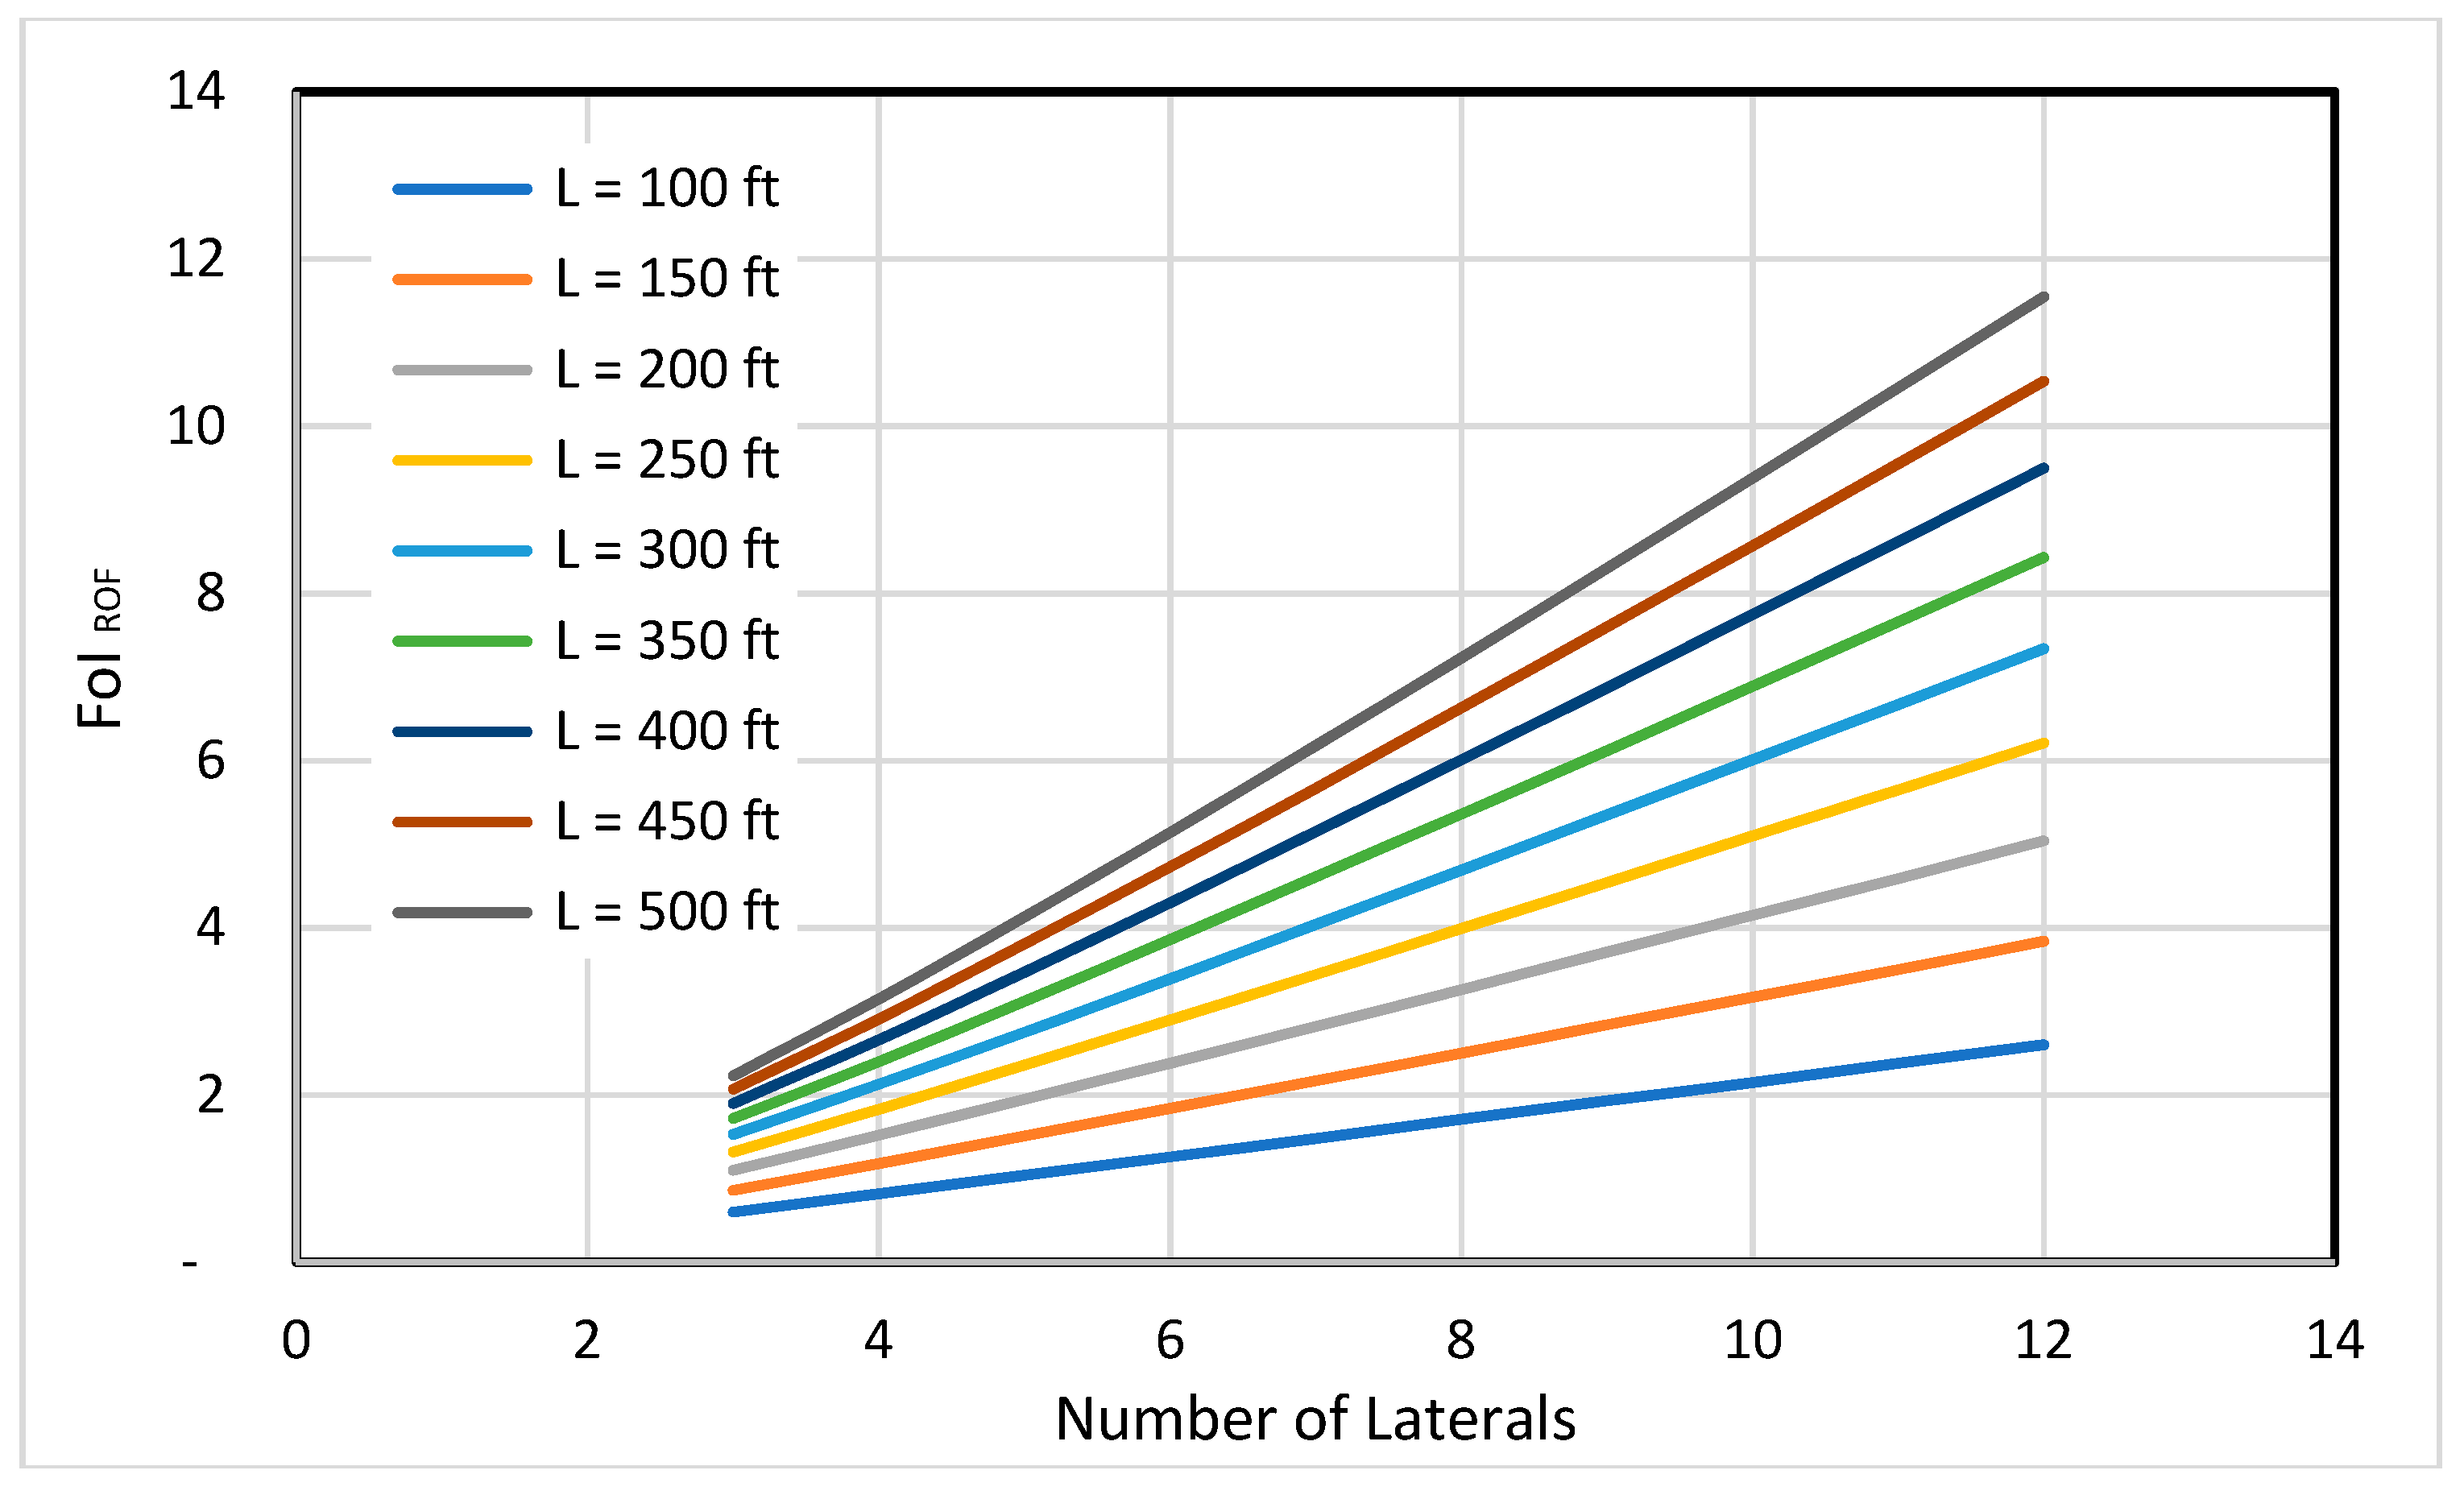
Figure 5.
Effects of number of laterals and lateral length on well injectivity.
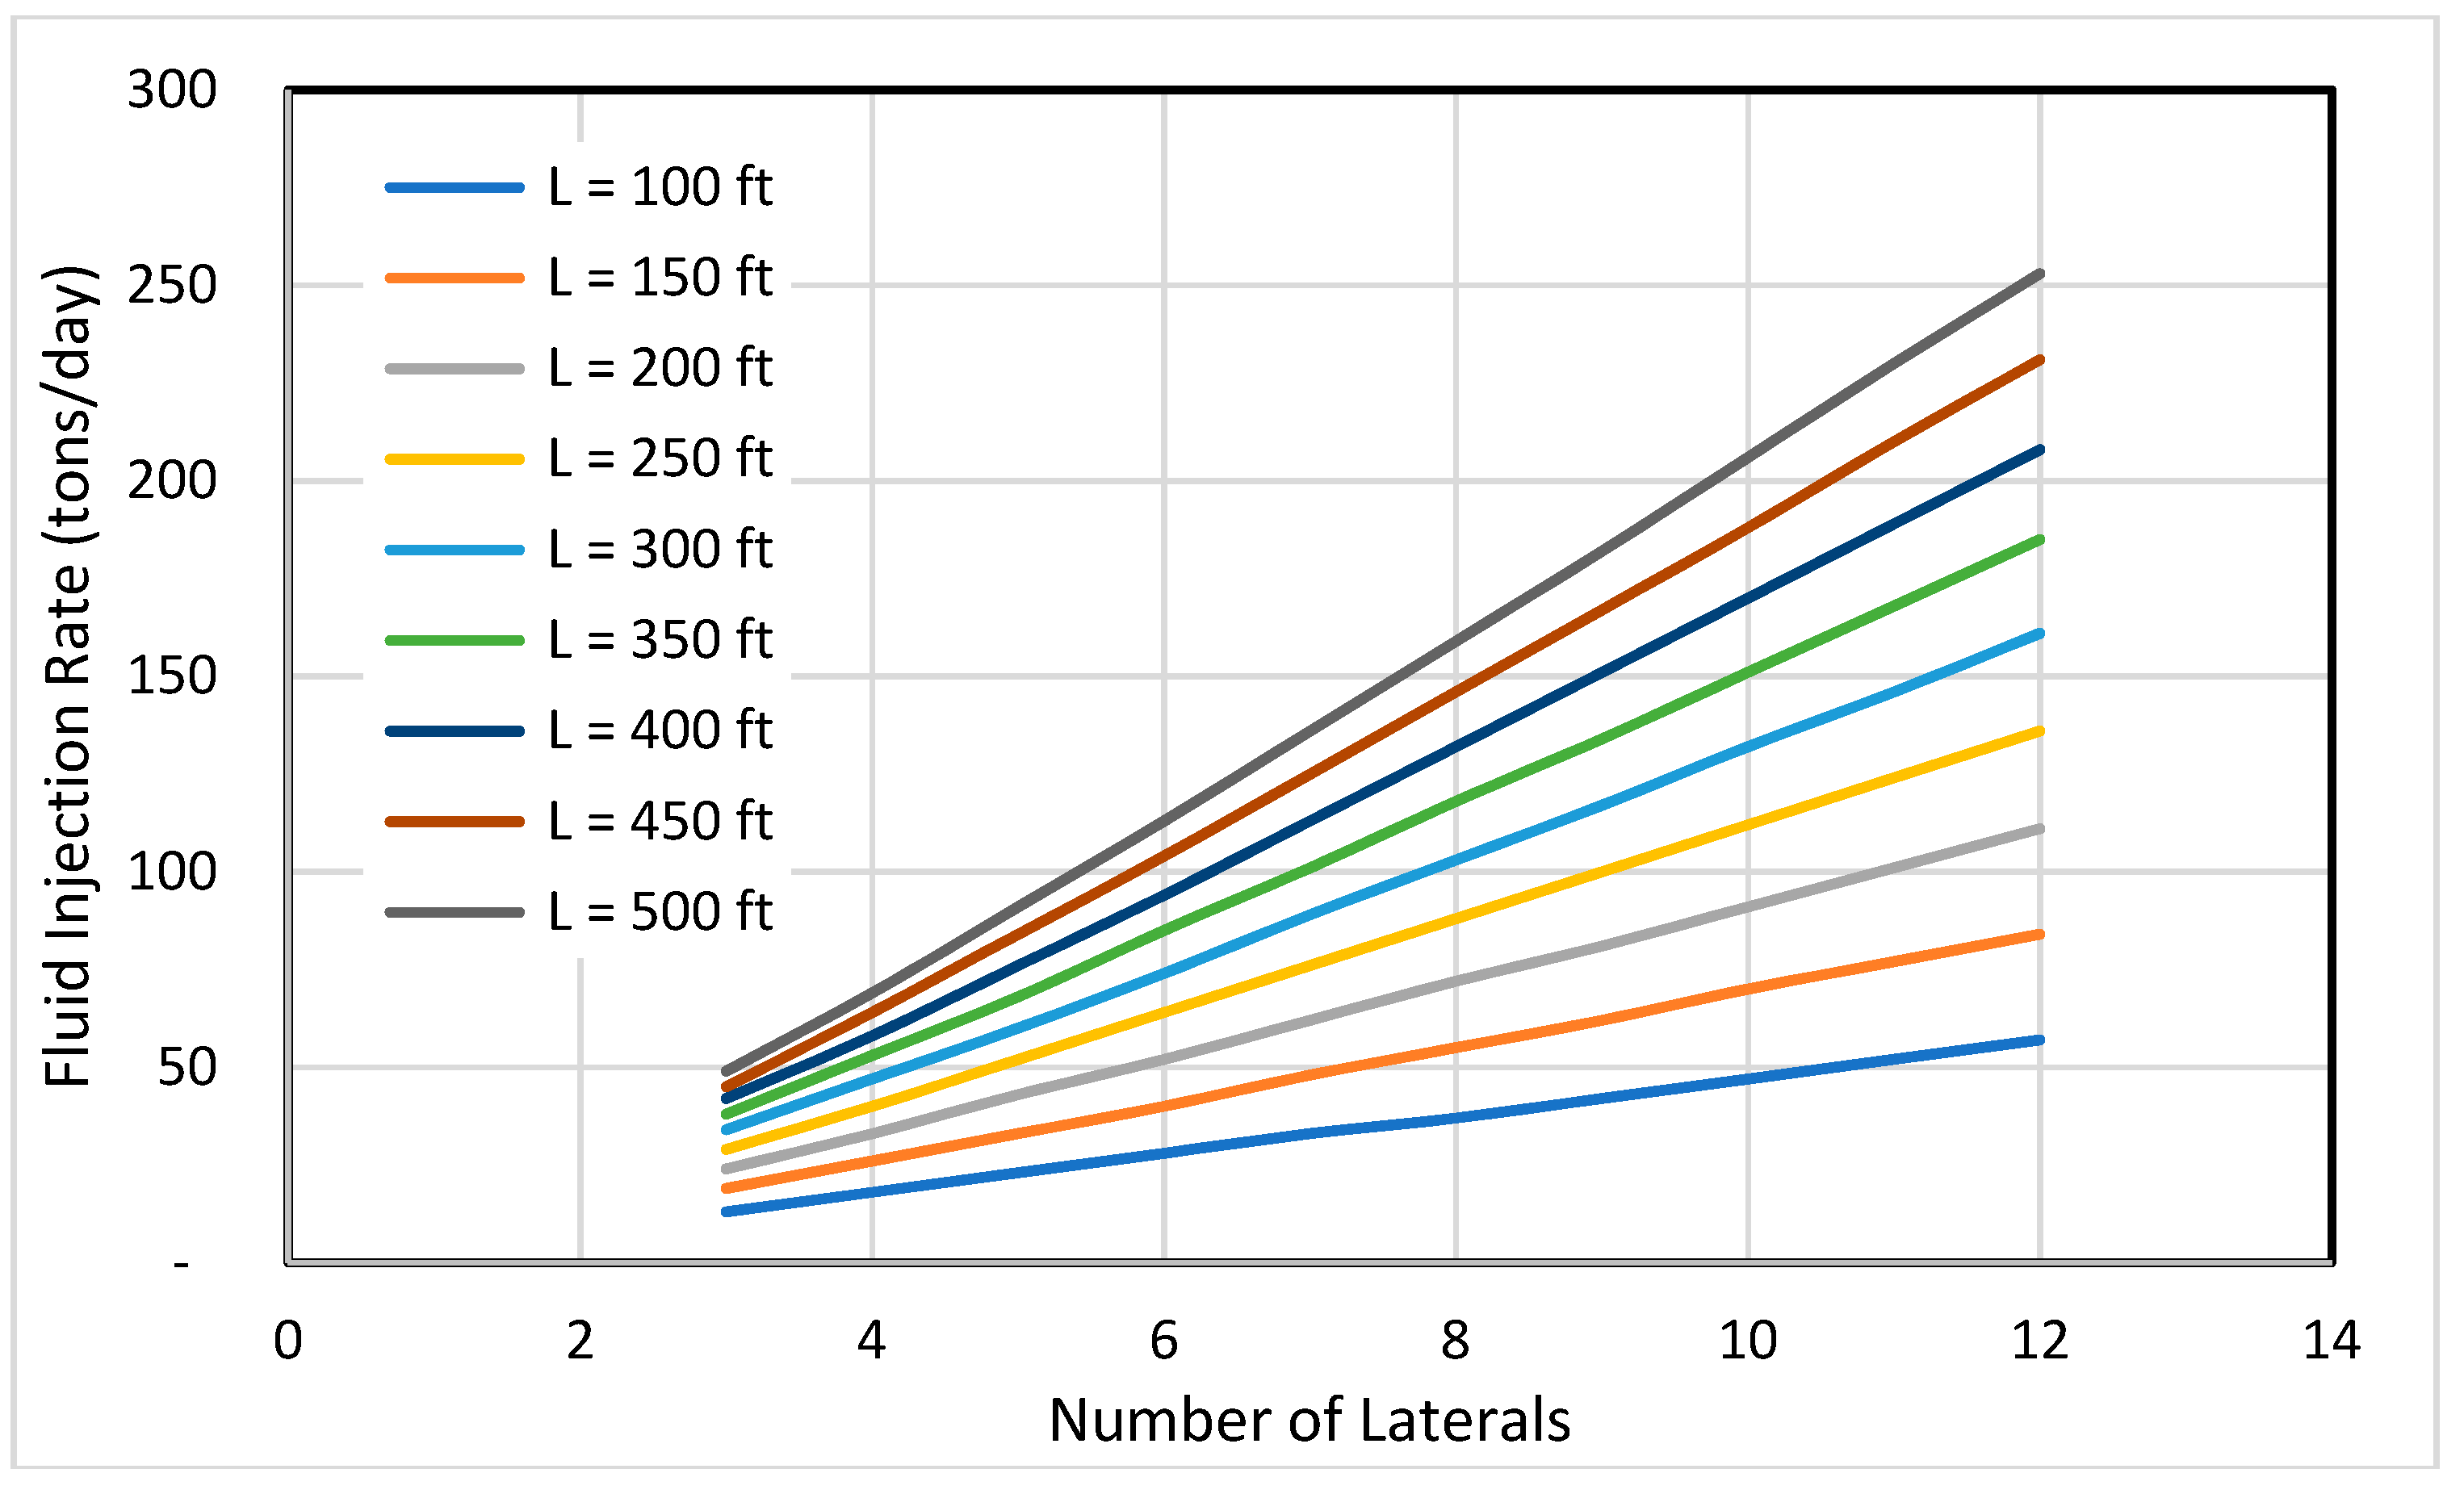
Figure 6.
Effect of lateral length on well injectivity for 4 lateral radii.
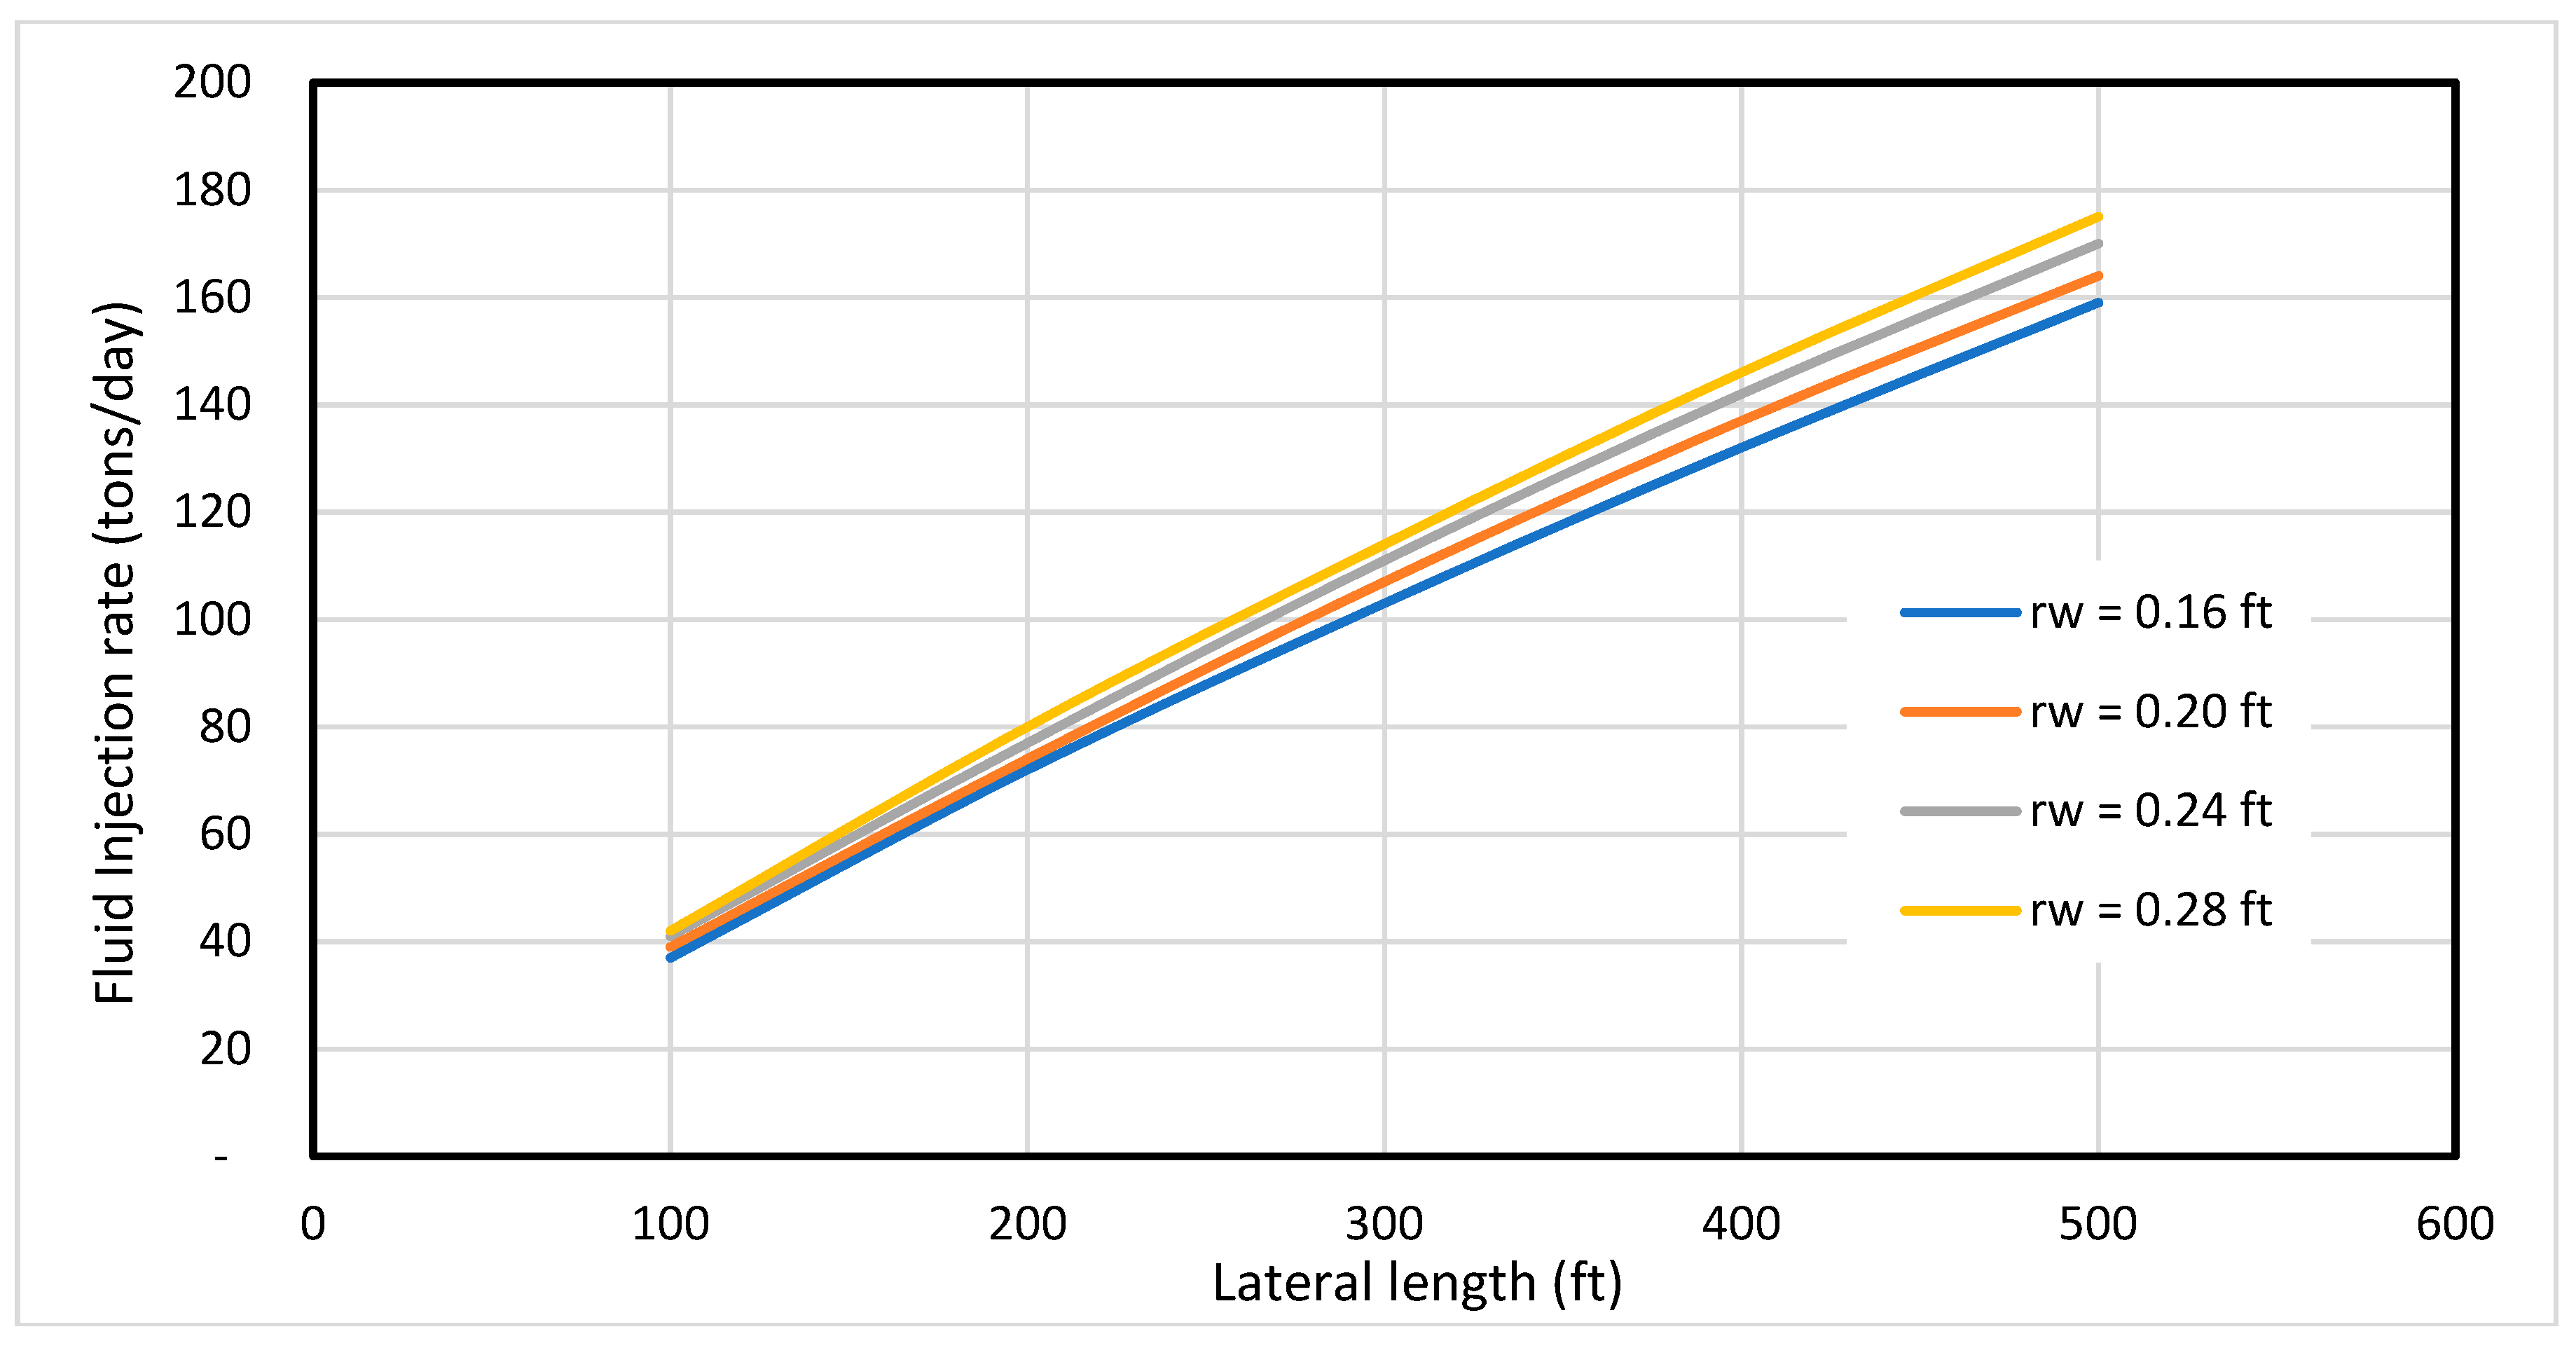
Figure 7.
Effect of reservoir permeability anisotropy on well injectivity.
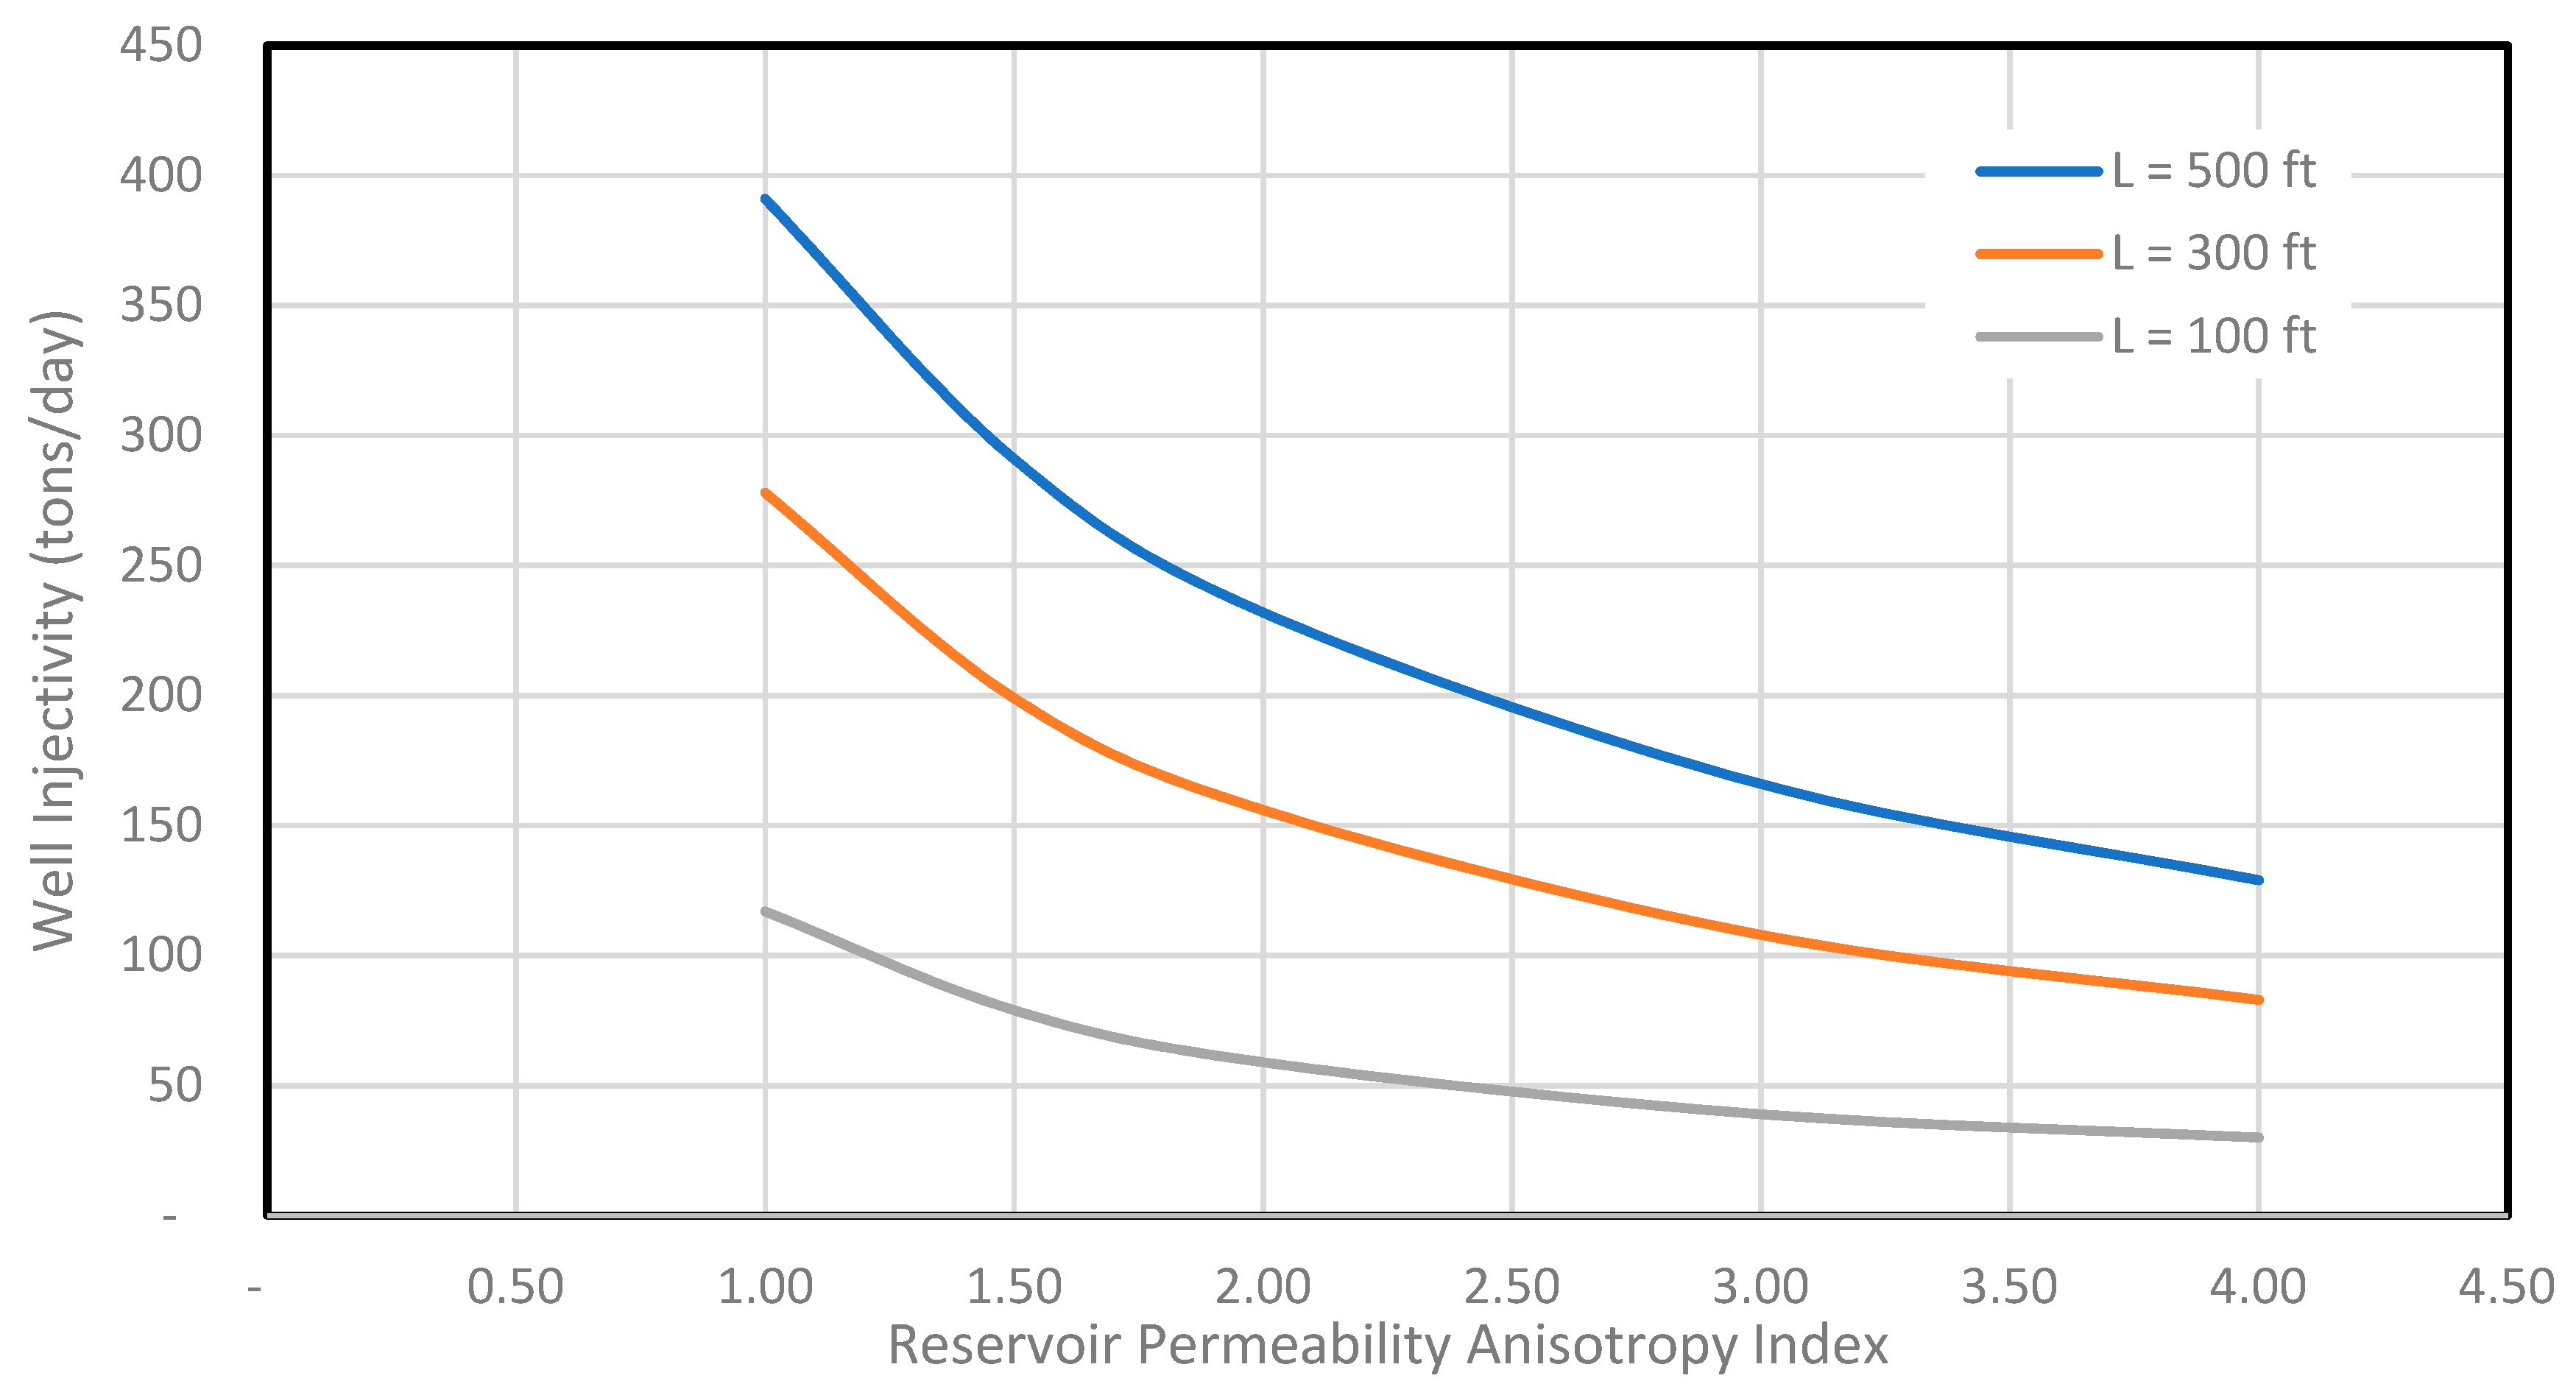

Table 1.
Reservoir Properties and Wellbore Geometry for Well Type Comparison.
| Parameter | Value | Unit | Value | Unit |
|---|---|---|---|---|
| Reservoir thickness | 24 | m | 78 | ft |
| Reservoir horizontal permeability | 1 | md | 1 | md |
| Reservoir vertical permeability | 0.1 | md | 0.1 | md |
| Radial wellbore radius | 0.05 | m | 0.16 | ft |
| Main wellbore radius | 0.10 | m | 0.33 | ft |
| Wellbore skin factor | 0 | 0 | ||
| Fracture width | 0.0127 | m | 0.5 | in |
| Fracture permeability | 5,000 | md | 5,000 | md |
Table 2.
Reservoir Properties and Wellbore Geometry for Case Study.
| Parameter | Value | Unit | Value | Unit |
|---|---|---|---|---|
| Water depth | 1,180 | m | 3,870 | ft |
| Reservoir mid-depth | 1,346 | m | 4,415 | ft |
| Reservoir pressure | 14 | MPa | 2,058 | psi |
| Reservoir temperature | 6 | ℃ | 43 | F |
| The minimum formation stress | 18 | MPa | 2,646 | psi |
| Reservoir thickness | 22 | m | 78 | ft |
| Reservoir horizontal permeability | 1 | md | 1 | md |
| Reservoir vertical permeability | 0.1 | md | 0.1 | md |
| Fluid density | 1100 | kg/m^3 | 386 | lb/bbl |
| Fluid viscosity | 1 | cp | 1 | cp |
| Radial wellbore radius | 0.05 | m | 0.16 | ft |
| Main wellbore radius | 0.10 | m | 0.33 | ft |
| Wellbore skin factor | 0 |
Disclaimer/Publisher’s Note: The statements, opinions and data contained in all publications are solely those of the individual author(s) and contributor(s) and not of MDPI and/or the editor(s). MDPI and/or the editor(s) disclaim responsibility for any injury to people or property resulting from any ideas, methods, instructions or products referred to in the content. |
© 2023 by the authors. Licensee MDPI, Basel, Switzerland. This article is an open access article distributed under the terms and conditions of the Creative Commons Attribution (CC BY) license (http://creativecommons.org/licenses/by/4.0/).
Copyright: This open access article is published under a Creative Commons CC BY 4.0 license, which permit the free download, distribution, and reuse, provided that the author and preprint are cited in any reuse.


