
Submitted:
13 November 2023
Posted:
14 November 2023
Read the latest preprint version here
Abstract
Background: The growth of arthroplasty procedures requires innovative strategies to reduce inpatients Length of Stay (LOS). This study aims to develop a machine learning prediction model that may aid to predict LOS after hip or knee arthroplasties. Methods: A collection of all the clinical notes of patients undergoing elective primary or revision arthroplasty from 1 January 2019 to 31 December 2019 was performed. The hospitalization has been classified as “Short LOS” if it was less than or equal to 6 days and “Long LOS” if it was greater than 7 days. Clinical data coming from pre-operative laboratory analysis, vital parameters, demographic characteristics of patients were screened. Final data have been used to train a Logistic Regression model with the aim of predicting short or long LOS. Results: Final dataset was composed of 1517 patients (795 “LONG”, 722 “SHORT”, p = 0.3196) with a total of 1541 admissions (729 “LONG”, 812 “SHORT”, p < 0.000). Complete model had a prediction efficacy of 78,99% (AUC 0.7899). Conclusions: Machine learning may facilitate day-by-day clinical practice predicting which patients are suitable for a shorter LOS, from those with a longer LOS in which a cautious approach could be recommended.
Keywords:
Artificial intelligence
; Machine learning
; Arthroplasty
; Hip
; Knee
; Length of stay.
1. Introduction
Total hip and knee arthroplasty (THA and TKA) procedures are growing in numbers worldwide each year with proven improvements in patients’ quality of life [1]. In the USA, as the population progressively ages, the demand for these procedures is expected to grow by 174% for primary THAs and 673% for primary TKAs by 2030. The Italian Arthroplasty Register reported 29,681 THA procedures (94.7% were primary THA and 84,6% were elective procedures) and 19,402 TKA procedures (94.6 % were primary TKA) during 2020 [2]. The number of THA and TKA procedures has increased on average by 4.2% each year since 2001 [3]. The rising number of hip and knee arthroplasties has allowed the development of advanced and less invasive surgical techniques, the improvement of perioperative course in order to achieve the shortest average length of stay (LOS) for hospitalization and a quicker resumption of daily activities, maintaining a low number of complications. Thus, an emerging interest in “fast-track” postoperative protocols erupted over the last years [4,5]. Frassanito et al highlighted the impact of the implementation of the enhanced recovery after surgery (ERAS) program for hip and knee replacement surgeries, which allows early ‘patients discharge and quick return to independence in the daily activities [6]. Despite the enormous increase of the procedures performed, reimbursement for THA and TKA has been dropping throughout last years, considering that they are not following the trend of the inflation worldwide [7]. The reduction of the reimbursement is in part justifiable by the relatively lower complexity of the patient undergoing this procedure, which are younger and younger. On the other hand, whilst the number of patients is increasing, a parallel increase of the complications related to this procedure could not be accepted. Thus, a public health strategy aimed to reduce costs of this procedure, both in economic, social, and healthy terms is mandatory. Machine learning has become increasingly applied to medicine and to orthopaedic field, it represents a natural extension of traditional statistical approaches [8]. Clinical decision support tools that use machine learning algorithms such as random forests, artificial neural networks, or support vector machines have been proved useful in medical research [9,10]. They have the potential to forecast the episode of care by predicting payment or LOS for any given patient after THA and TKA prior to the initiation of the elective procedures [11]. Navarro et al showed that a machine learning model using the New York State administrative database could predict LOS and cost before TKA [12]. Random forest (RF), an intricate tree-based machine learning algorithm, was used to predict LOS after shoulder arthroplasty. [13]. Bayesian algorithms that use conditional probabilities have been used to predict LOS and patients costs after TKA. Etzel et al used six different machine learning classification algorithms to predict long LOS of anterior and posterior lumbar fusion patients relevant to spine surgery [14]. In recent years, only few projects investigated how to facilitate ERAS protocols in the orthopaedic field [13,15], however machine learning algorithms could be regularly used in clinical practice, employing their potential utility to integrate computerized models into electronic health record systems, where they can be used as point-of-care surgeon’s decision support tools. Although a few studies have already investigated the application of machine learning algorithms predicting LOS in patients that received THA and TKA they were national studies and have all used large administrative datasets. To the best of our knowledge all these studies investigate patients underwent only primary THA and TKA [12,16,17,18,19]. Previous studies show that a small amount of recent and accurate data is more effective than using larger amounts of older data [19]. Therefore further independent single center cohort studies are required to confirm these finding. The purpose of this study was to develop and validate a machine learning algorithm based prediction tool of preoperative patient-specific objective criteria, and perform multivariable analysis to predict LOS after primary and revision THA or TKA, and elucidates factors correlated with an extended LOS in a high volume single center. Our hypothesis was that the presented tool can firmly distinguish patients with a predicted ”short LOS” if they had LOS less than or equal to 6 (5th postoperative day) and “long LOS” if they had LOS greater than 7 (6th postoperative day), thus giving an advantage in the health management strategies of patients undergoing arthroplasty.
2. Materials and Methods
The study was conducted in accordance with the Declaration of Helsinki and good clinical practice guidelines. The study protocol for the development of this registry was approved by Ethics Committee protocol code 83/23 of Humanitas Research Hospital IRCCS on July 2023. All patients provided signed informed consent.
2.1. Dataset
The used dataset included patient-specific data written in the Humanitas Research Hospital’s medical records from 2015 to 2019. Textual data from 1 January 2015 to 31 December 2018 were gathered from the collection of all the clinical notes regarding medical history, comorbidities, inabilities, reason for admission and lower limbs physical examinations. These training set data were used to develop and train an embedding model. Secondly, clinical and textual data from 1 January 2019 to 31 December 2019 coming from pre-operative laboratory analysis, vital parameters, demographics and morphological characteristics of the selected cohort of patients were screened and used to develop and train a logistic regression machine learning model predicting LOS (Figure 1). Thus, the two sources of data have been meshed to create a unique dataset.
2.2. Data extraction
The first data extraction step consisted in querying the data from Data Warehouse (DWH). Oracle SQLTM has been used to gather the interested data of patients admitted at the Orthopaedics Department. Consequently, a pre-process pipeline has been implemented to clean the text data from unwanted or unnecessary characters, returning a cleaned corpus ready to be processed. The pre-processing phase aimed to normalize the character to ASCII format, and remove all the present HTML special characters.
2.3. Data Selection & Inclusion Criteria
The study included patients undergoing elective primary and revision THA or TKA by senior surgeons experienced in joint replacement surgery, from 1 January 2019 to 31 December 2019, at Humanitas Research Hospital, Italy. Patients were identified from hospital clinical records using International Classification of Diseases, Ninth Revision, Clinical Modification (ICD9-CM) procedure codes (81.51 for THA; 00.70, 00.71,00.72, 00.73, 00.74, 00.75, 00.76, 00.77 for revision THA; 81.54 for TKA; 80.06, 81.55, 00.80, 00.81, 00.82, 00.83, 00.84 for revision TKA). Eligibility criteria included all patients aged above 18 years old undergoing elective primary or revision THA or TKA in our Orthopaedic Department. Malunion or nonunion sequelae, traumatology surgeries, malignancy, patients who did not underwent elective procedures, patients who did not have at least 70% of the required predictive features recorded were the participants exclusion criteria. Since the management of the post-operative hospitalization and admissions to Rehabilitation Unit varied significantly from 2015 to 2019, and since these variations were exogenous, all patients admitted before 2019 in Orthopaedic Department who performed primary and revision THA and TKA were further excluded. LOS corresponded to the number of inpatient days during admission: it included the day of patient’s admission which always corresponds to the day before surgery, the day of surgery and the related postoperative days. Total LOS associated with each patient has been transformed to a categorical feature according to the following decision rule: LOS 0 corresponded to the day of hospital admission, LOS 1 corresponded to the day of surgery, LOS 2 corresponded to the 1st postoperative day, LOS 3 corresponded to the 2th postoperative day, LOS 4 corresponded to the 3th postoperative day, LOS 5 corresponded to the 4th postoperative day, LOS 6 corresponded to the 5th postoperative day, LOS 7 corresponded to the 6th postoperative day and so on. Patients were labelled as ”short LOS” if they had LOS less than or equal to 6 (5th postoperative day), patients were labelled as “long LOS” if they had LOS greater than 7 (6th postoperative day). Patients were excluded if they had LOS equal to 7 (6th postoperative day). Finally, a brief part of predictive features selection was required. The first step was to eliminate all variables with a quote of missing values above or equal 25%. The second step consisted in selecting the relevant clinical features (labs and vital parameters). Then a Mann-Whitney U Test was used to look for significant differences in predictive features distributions between long LOS and short LOS classes and thus selecting the ones with a p-value lower than 0.05.
2.4. Methods
A total of 24 independent variables were collected for each patient and were used for modeling analysis in this study. The patient-related characteristic included age, gender, BMI, marital status (whether the patient was living alone or with family), height, weight, absolute eosinophils count, alanine aminotransferase, anisocytosis index, aspartate aminotransferase, creatinin, erythrocytes, ferritin, hematocrit, hemoglobin, INR, iron, RBC hemoglobin concentration, bilirubin, joint, discharge disposition and need of revision. Since the outcome of the study was binary, the problem could be treated as a standard binary classification and be solved using standard supervised learning techniques. In this case, data came from mixed sources, and a certain level of feature engineering was required. In particular, textual data needed to be transformed to numerical vectors to be used in machine learning models (embedding). For this reason, a custom Neural Network architecture was built. This architecture was able to transform text data while maintaining their local and global structure. This step allowed us to bring data to a common structure and join all different sources of data into one unique dataset. After the embedding procedure, the final data have been used to train a Logistic Regression model to predict whether a patient where was more likely to have long LOS following primary or revision THA and TKA. All procedures described above have been performed using Python 3.9. In particular, the following libraries have been used:
- Pandas 1.0.1 [20]: importing and managing data.
- Numpy 1.18.1 [21]: array manipulation and scientific computation.
- Scikit-learn 1.0.0 [22]: definition, training and validation of machine learning and statistical models.
- Tensorflow 2.0.0 [23]: definition, training and validation of transformer autoencoder.
- Matplotlib 3.1.3 [24]: plotting models performances.
2.5. Text preprocessing
A pre-trained deep learning architecture able to extract relevant information from clinical texts was not available. The majority of pre-trained language models based on deep learning algorithms were trained on generic corpuses [27] and couldn’t be used on specific texts like the ones here considered, because this will likely result in poor latent representation. Therefore, a custom neural network architecture to encode data coming from anamnesis, previous surgeries and reason for admission into 300-dimensional numerical vectors was developed. From an architectural point of view, the network has been designed as a transformer autoencoder, with both encoder and decoder composed of 3 three-headed attention layers (Figure 2) [28].
The model has finally been trained by Adaptive Moment Estimation (ADAM) [29] algorithm using all the clinical notes regarding anamnesis, comorbidities, inabilities, reasons for admission and lower limbs clinical examinations, written from 2015 to 2018, with a train and validation set consisting of, respectively, 36489 and 9153 clinical sentences, with the aim of minimizing a loss of function based on Binary Cross-Entropy. At the end of the process, the encoded texts have been reduced, using principal component analysis, to a dimensionality able to explain 90% of the variance, resulting in 48-dimensional vectors for anamnesis, 58-dimensional for previous surgeries and 16-dimensional for reason for admission.
2.6. Classification
The sources of data for the analysis were different: 79.2% of features came from textual data, while 20.8% came from labs, morphological and demographic features. The study was structured in order to understand the impact of all the different sources, defining a baseline and complete model with all the selected features, and two subset-models used as controls, one including only textual data and one including only labs and demos. Subsequently, models performances were compared using standard classification scores and AUC. From an architectural point of view, all models have been structured as three-layered pipelines with a z-score based standardizer as first layer, an iterative imputer based on chained equations [30] to impute missing values as second layer and a Logistic Regression Classifier as last layer. Hyperparameters for all models were chosen using a randomized search algorithm and the training and testing procedure were performed using hold out strategy, in which data were randomly splitted according to the following decision rule: 70% for the training phase and 30% for the testing one.
2.7. Statistical Analysis
The statistical analysis part was mainly focused on understanding the impact of the selected covariates on the outcome distribution. Since text-embedding vectors were built using deep learning, all the interpretability is lost in the process, and the inference part can only be done on laboratory exams, demographic data and morphological features. With respect to univariate analysis, the distribution was divided according to LOS, as mentioned before, and a Mann-Whitney U test for continuous variables and Proportion Z test (or two classes Chi Squared) for categorical ones were used, with the aim of assessing significant differences in the features distribution. On the other hand, multivariate analysis were performed using Logistic Regression, which was used to compute risk factors (odds ratios) and their relative confidence intervals. To assess the significance of the odds ratio, t-test and p-values of the Wald statistics were performed. Finally, all p-values below 0.05 were considered as statistically significant.
3. Results
3.1. Dataset and Univariate Analysis
Final dataset was composed of 1517 patients extracted and identified of which 795 belonging to class “long LOS” and 722 to class “short LOS” (p = 0.3196), with a total of 1541 admissions, 729 (47.3%) belonging to Group 1 “short LOS” and 812 (52.7%) belonging to Group 2 “long LOS”, p < 0.000). Average LOS was 11.7 and 5.7 for “long LOS” and “short LOS”, respectively. Group 1 included 729 patients with a mean age of 63.8 (20 – 90; σ 12.1) years old: there were 364 (49.9%) female patients and 365 (50.1%) male patients. 36 (4.9 %) patients underwent bilateral arthroplasty, 722 (99.0%) underwent primary arthroplasty and 7 (1.0%) underwent revision arthroplasty. Group 2 included 812 patients with a mean age of 70.0 (14 – 90; σ 12.1) years old: there were 503 (61.9%) female patients p < 0.000 and 309 (38.1%) male patients p 0.0023; 641 (78.9%) underwent primary arthroplasty and 171 (21.1%) underwent revision arthroplasty. 174 (21.4 %) patients underwent bilateral arthroplasty, 530 (72.7%) patients underwent hip arthroplasty and 199 (27.3%) patients underwent knee arthroplasty in the Group 1. 639 (78.7%) patients underwent hip arthroplasty p < 0.0000 and 173 (21.3%) patients underwent knee arthroplasty p 0.0566 in the Group 2. Among 178 revisions arthroplasty 7 (3.9%) were performed in Group 1 and 171 (96.1%) were performed in Group 2, p < 0.000. Among 1363 primary arthroplasty 722 (53.0 %) were performed in Group 1 and 641(47.0%) were performed in Group 2, p = 0.0019. Finally, 565 admissions needed to be moved to rehabilitation unit 1 (0.2%) in Group 1 and 564 (98.8%) in Group 2 p < 0.000; and 976 patients did not 728 (74.6%) in Group 1 and 248 (25.4%) in Group 2, p < 0.000. Demographic, clinical and morphological features are reported in Table 1.
3.2. Classification
All the features used in the model were information available at pre-admission level. This includes gender, age, BMI, height, weight, body part, marital status, and revision flag (a flag indicating if a surgery is a revision or a primary arthroplasty). In addition to this, all laboratory analysis described in Table 1 were included. Complete model including all sources of features was the best performing one, with an Area Under the Curve (AUC: 0.7899), followed by texts model (AUC: 0.7228) and labs and demos model (AUC: 0.7198). Apart from AUC, the dominance of the complete model was confirmed by all the selected classification scores (Table 2 and Table 3) as well as the AUC order.
3.3. Multivariate Analysis
4. Discussion
The main finding of our study was the capability of machine learning algorithm in predicting LOS in patients undergoing elective primary or revision THA or TKA. The here presented tool can forecast patients who are candidates as ”short LOS” if they had LOS less than or equal to 6 days and “long LOS” if they had LOS greater than 7 days with great accuracy, taking into consideration data extracted from pre-admission routine. Thus, patients suitable for ERAS protocols could be identified at pre-admission. From a methodological point of view, the most interesting result of the study was the comparison between different sources of data. As a matter of fact, it was possible to understand the information added by each subset of considered features and by their combination (Table 2 and Table 3). As previously stated, it is straightforward to see the dominance of the complete model, which relies on information provided by clinical texts, labs, demographics and morphological features. Secondly, it is also interesting to focus on the performances of the two control models: Table 2 and Table 3, and Figure 3 show similar results, especially for the AUC. Moreover, ROC curves intersect at about 0.8, 0.42, making these more difficult to interpret. Overall, the here reported results showed that a lot of clinical information could be extracted from texts; and this relates to physicians' experience and physical examination. On the other hand, the significant boost in all classification performances given by adding labs, demographic and morphological features to the model indicates that documents written by clinicians were not able to capture all the information needed to perform a correct classification. Taking into account the clinical relevance of the present study, the evaluation of comorbidities was very important given the type of patients undergoing arthroplasty, especially if an ERAS protocol is advocated. Previous studies used machine learning to predict LOS after TKA, THA and TSA with c-statistics of 0.78, 0.87 and 0.77 respectively. The present model had the potential to be integrated into electronic medical record to provide a personalized assessment for a patient’s potential need for a longher or shorter LOS in the hospital after underwent total joint arthroplasty, hospital readmission or needing another operation [12,13,17]. Podmore et al [32] in 2021 included 640,832 patients who had a primary hip or knee arthroplasty between April 2009 and March 2016, the study evaluated the impact of 11 comorbidities on the safety risks (including LOS and 30-day readmission rate) of hip and knee arthroplasty surgery. The present model included all the comorbidities. Their study highlighted the impact of the examinated comorbidities on clinical and socioeconomical fields. Alternatively, they concluded that the increased risk is small compared with the large improvements in functional outcomes, even in patients with multiple comorbidities. Thus, a prediction based on pre-admission evaluation of comorbidities and labs could help to individualize the path of the patients from admission to complete recovery. Zhu et al in 2017 [6] performed a large meta-analysis of RCTs and CCTs available on literature about ERAS protocols in arthroplasty surgery. They conclude that ERAS significantly reduces LOS and incidence of complications in patients who underwent THA or TKA. One of the most interesting aspects that emerged throughout their study was the need of improvement for perioperative management of the patient over the surgical technique. In this scenario, the correct selection of patients eligible for ERAS protocol was the crucial aspects to enhance clinical outcomes. Furthermore, ERAS protocols have of their milestone in early rehabilitation: Masaracchio et al (2017) [33] summarized the benefic effects of an early administration of rehab protocols. Early rehabilitation reduced LOS and socioeconomical cost of the procedure. Although these beneficial effects, early mobilization could lead to complications like falls if addressed to patients with a certain risk profile (i.e. cardiovascular or neurological disease). To avoid such complications, a quantitative, individualized risk assessment through artificial intelligence could be beneficial. Focusing on the economical aspect, reimbursement for THA and TKA dramatically dropped throughout last 20 years, especially if considering inflations [7]. The amount of reimbursement is strictly linked with patient volume, patient satisfaction, a healthier patient population, and government ownership of a hospital as stated by Padegimas et al in 2016 [34]. A predictive tool for the enhancement of selection of patients eligible for ERAS protocol could help in the path towards a more sustainable arthroplasty surgery in a context of limited resources. Similar machine learning approach was evaluated by Anis et al (2020) [9]. Their study was focused on predicting LOS using a Poisson regression model. Some similarities with our approach were the feature selection process; in fact, they chose to focus on laboratory analysis as well as patients’ anamnestic details. On the other hand, their study was prospective, and features were specifically selected for the task. Such features were demographics and specific clinical scores coming from previous examinations. On the other hand, our study was retrospective, and the main feature selection process was more general and focused on features routinely collected during daily examination activities. Considering that we did not have direct access to all the specific clinical information, we used the transformer architecture to automatically extract proxies of this information from the selected texts. A rigorous comparison of the two studies cannot be assessed since they are based on different modeling strategy. However, our approach may have a significant boost in simplicity in data collection, and thus can be more easily implemented as a routine clinical service since, as previously stated, our features can be easily retrieved from the hospital daily practice. This study had several potential limitations. First relied on textual data, information coming from clinical records needed to be heavily preprocessed to be used by language models, resulting in a more difficult prediction process. Second, some interpretability was lost in the embedding process: the vectorization of the documents made difficult to assess a sort of causality between the presence of a token (a word or a sentence) and the selected outcomes, making data more suitable for prediction tasks. Third, our language model was trained and validated only on internal data and an external validation was required as a benchmark. Fourth, all the clinical texts were written in italian, so the model is well-suited only for one language.
5. Conclusions
This study demonstrated the reliability of an artificial intelligence model to distinguish fit patients suitable for a shorter LOS, thus eligible for ERAS protocols, and patients with an expected longer LOS. The promising results suggest that there is the potential utility to integrate computerized algorithms in electronic health record systems, where they can be used as point of care decision support tool to assist the surgeons in patient selection. As these decision support tools become part of regular practice, however, they should not replace the clinical judgment of the surgeon, but rather supplement the informed consent process and contribute to shared decision making. Further, prospective, studies are needed to validate our finding and the feasibility of this technology to clinical practice.
Author Contributions
Conceptualization, M.L. and G.G.; methodology, M.L.; software, P.M.; validation, M.L., T.T. and V.D.M; formal analysis, P.M.; investigation, T.T.; resources, G.G.; data curation, P.M.; writing—original draft preparation, V.D.M.; writing—review and editing, M.L. and V.D.M.; visualization, P.M.; supervision, M.L.; project administration, T.T.; funding acquisition, V.S. All authors have read and agreed to the published version of the manuscript.
Funding
This research received funding from IRCCS Humanitas Research Hospital (5x1000 funding).
Institutional Review Board Statement
The study was conducted in accordance with the Declaration of Helsinki and good clinical practice guidelines. The study protocol for the development of this registry was approved by Ethics Committee of Humanitas Research Hospital (protocol code 83/23) on July 2023.
Informed Consent Statement
Informed consent was obtained from all subjects involved in the study: all individual participants signed a written informed consent before the surgical procedure and a written informed consent to be included in the study.
Data Availability Statement
The data supporting reported results can be found in a repository (Zenodo).
Acknowledgments
All the patients who participated in the studyare gratefully acknowledged.
Conflicts of Interest
G.G. declares royalties and licenses from Zimmer Biomet, Innomed, and Adler Ortho; Financial support for attending symposia and educational programs from Zimmer Biomet. M.L. declares Research grant as principal investigator (2022YME9N3) from the Italian Ministry of University and Research; Research grant as co-principal investigator (GR-2019-12371158) from the Italian Ministry of Health; Research grant as principal investigator (GR-2018-12367275) from the Italian Ministry of Health; Research grants as principal investigator for postmarket study for medical devices from Zimmer Biomet; Financial support for attending symposia and educational programs from Zimmer Biomet; Scientific Director of Fondazione Livio-Sciutto. V.D.M and P.M and T.T and V.S. declare no conflict of interest.
References
- Konopka, J.F.; Lee, Y.-Y.; Su, E.P.; McLawhorn, A.S. Quality-Adjusted Life Years After Hip and Knee Arthroplasty: Health-Related Quality of Life After 12,782 Joint Replacements. JB JS Open Access 2018, 3, e0007. [Google Scholar] [CrossRef] [PubMed]
- Benedetta Report Annuale RIAP 2021 e Compendio Available online:. Available online: https://riap.iss.it/riap/it/attivita/report/2022/10/27/report-annuale-riap-2021/ (accessed on 11 June 2023).
- Torre, M.; Romanini, E.; Zanoli, G.; Carrani, E.; Luzi, I.; Leone, L.; Bellino, S. Monitoring Outcome of Joint Arthroplasty in Italy: Implementation of the National Registry. Joints 2017, 5, 70–78. [Google Scholar] [CrossRef] [PubMed]
- Husted, H.; Solgaard, S.; Hansen, T.B.; Søballe, K.; Kehlet, H. Care Principles at Four Fast-Track Arthroplasty Departments in Denmark.
- Kehlet, H. Fast-Track Hip and Knee Arthroplasty. Lancet 2013, 381, 1600–1602. [Google Scholar] [CrossRef] [PubMed]
- Frassanito, L.; Vergari, A.; Nestorini, R.; Cerulli, G.; Placella, G.; Pace, V.; Rossi, M. Enhanced Recovery after Surgery (ERAS) in Hip and Knee Replacement Surgery: Description of a Multidisciplinary Program to Improve Management of the Patients Undergoing Major Orthopedic Surgery. Musculoskelet Surg 2020, 104, 87–92. [Google Scholar] [CrossRef] [PubMed]
- Mayfield, C.K.; Haglin, J.M.; Levine, B.; Valle, C.D.; Lieberman, J.R.; Heckmann, N. Medicare Reimbursement for Hip and Knee Arthroplasty From 2000 to 2019: An Unsustainable Trend. The Journal of Arthroplasty 2020, 35, 1174–1178. [Google Scholar] [CrossRef] [PubMed]
- Gulshan, V.; Peng, L.; Coram, M.; Stumpe, M.C.; Wu, D.; Narayanaswamy, A.; Venugopalan, S.; Widner, K.; Madams, T.; Cuadros, J.; et al. Development and Validation of a Deep Learning Algorithm for Detection of Diabetic Retinopathy in Retinal Fundus Photographs. JAMA 2016, 316, 2402. [Google Scholar] [CrossRef]
- Embi, P.J.; Kaufman, S.E.; Payne, P.R.O. Biomedical Informatics and Outcomes Research: Enabling Knowledge-Driven Health Care. Circulation 2009, 120, 2393–2399. [Google Scholar] [CrossRef]
- Cafri, G.; Li, L.; Paxton, E.W.; Fan, J. Predicting Risk for Adverse Health Events Using Random Forest. Journal of Applied Statistics 2018, 45, 2279–2294. [Google Scholar] [CrossRef]
- Ravi, D.; Wong, C.; Deligianni, F.; Berthelot, M.; Andreu-Perez, J.; Lo, B.; Yang, G.-Z. Deep Learning for Health Informatics. IEEE J. Biomed. Health Inform. 2017, 21, 4–21. [Google Scholar] [CrossRef]
- Navarro, S.M.; Wang, E.Y.; Haeberle, H.S.; Mont, M.A.; Krebs, V.E.; Patterson, B.M.; Ramkumar, P.N. Machine Learning and Primary Total Knee Arthroplasty: Patient Forecasting for a Patient-Specific Payment Model. The Journal of Arthroplasty 2018, 33, 3617–3623. [Google Scholar] [CrossRef]
- Biron, D.R.; Sinha, I.; Kleiner, J.E.; Aluthge, D.P.; Goodman, A.D.; Sarkar, I.N.; Cohen, E.; Daniels, A.H. A Novel Machine Learning Model Developed to Assist in Patient Selection for Outpatient Total Shoulder Arthroplasty. J Am Acad Orthop Surg 2020, 28, e580–e585. [Google Scholar] [CrossRef] [PubMed]
- Etzel, C.M.; Veeramani, A.; Zhang, A.S.; McDonald, C.L.; DiSilvestro, K.J.; Cohen, E.M.; Daniels, A.H. Supervised Machine Learning for Predicting Length of Stay After Lumbar Arthrodesis: A Comprehensive Artificial Intelligence Approach. J Am Acad Orthop Surg 2022, 30, 125–132. [Google Scholar] [CrossRef]
- Anis, H.K.; Strnad, G.J.; Klika, A.K.; Zajichek, A.; Spindler, K.P.; Barsoum, W.K.; Higuera, C.A.; Piuzzi, N.S.; Group, C.C.O.A. Developing a Personalized Outcome Prediction Tool for Knee Arthroplasty. The Bone & Joint Journal 2020, 102-B, 1183–1193. [Google Scholar] [CrossRef]
- Ramkumar, P.N.; Karnuta, J.M.; Navarro, S.M.; Haeberle, H.S.; Scuderi, G.R.; Mont, M.A.; Krebs, V.E.; Patterson, B.M. Deep Learning Preoperatively Predicts Value Metrics for Primary Total Knee Arthroplasty: Development and Validation of an Artificial Neural Network Model. The Journal of Arthroplasty 2019, 34, 2220–2227. [Google Scholar] [CrossRef] [PubMed]
- Ramkumar, P.N. Development and Validation of a Machine Learning Algorithm After Primary Total Hip Arthroplasty: Applications to Length of Stay and Payment Models. The Journal of Arthroplasty 2019. [Google Scholar] [CrossRef] [PubMed]
- Gabriel, R.A.; Sharma, B.S.; Doan, C.N.; Jiang, X.; Schmidt, U.H.; Vaida, F. A Predictive Model for Determining Patients Not Requiring Prolonged Hospital Length of Stay After Elective Primary Total Hip Arthroplasty. Anesthesia & Analgesia 2019, 129, 43–50. [Google Scholar] [CrossRef]
- Greenstein, A.S.; Teitel, J.; Mitten, D.J.; Ricciardi, B.F.; Myers, T.G. An Electronic Medical Record–Based Discharge Disposition Tool Gets Bundle Busted: Decaying Relevance of Clinical Data Accuracy in Machine Learning. Arthroplasty Today 2020, 6, 850–855. [Google Scholar] [CrossRef] [PubMed]
- McKinney, W. Pandas: A Foundational Python Library for Data Analysis and Statistics.
- Harris, C.R.; Millman, K.J.; van der Walt, S.J.; Gommers, R.; Virtanen, P.; Cournapeau, D.; Wieser, E.; Taylor, J.; Berg, S.; Smith, N.J.; et al. Array Programming with NumPy. Nature 2020, 585, 357–362. [Google Scholar] [CrossRef]
- Pedregosa, F.; Varoquaux, G.; Gramfort, A.; Michel, V.; Thirion, B.; Grisel, O.; Blondel, M.; Prettenhofer, P.; Weiss, R.; Dubourg, V.; et al. Scikit-Learn: Machine Learning in Python. MACHINE LEARNING IN PYTHON.
- Abadi, M.; Barham, P.; Chen, J.; Chen, Z.; Davis, A.; Dean, J.; Devin, M.; Ghemawat, S.; Irving, G.; Isard, M.; et al. TensorFlow: A System for Large-Scale Machine Learning.
- Hunter, J.D. Matplotlib: A 2D Graphics Environment. Computing in Science and Engineering 2007, 9, 90–95. [Google Scholar] [CrossRef]
- Virtanen, P.; Gommers, R.; Oliphant, T.E.; Haberland, M.; Reddy, T.; Cournapeau, D.; Burovski, E.; Peterson, P.; Weckesser, W.; Bright, J.; et al. SciPy 1.0: Fundamental Algorithms for Scientific Computing in Python. Nat Methods 2020, 17, 261–272. [Google Scholar] [CrossRef]
- Seabold, S.; Perktold, J. Statsmodels: Econometric and Statistical Modeling with Python.; Austin, Texas, 2010; pp. 92–96.
- Devlin, J.; Chang, M.-W.; Lee, K.; Toutanova, K. BERT: Pre-Training of Deep Bidirectional Transformers for Language Understanding.
- Vaswani, A.; Shazeer, N.; Parmar, N.; Uszkoreit, J.; Jones, L.; Gomez, A.N.; Kaiser, Ł.; Polosukhin, I. Attention Is All You Need.
- Kingma, D.P.; Ba, J. Adam: A Method for Stochastic Optimization 2017.
- Buuren, S. van; Groothuis-Oudshoorn, K. Mice: Multivariate Imputation by Chained Equations in R. Journal of Statistical Software 2011, 45, 1–67. [Google Scholar] [CrossRef]
- Fletcher, Roger. Practical Methods of Optimization. John Wiley & Sons, 2013.
- Podmore, B.; Hutchings, A.; Skinner, J.A.; MacGregor, A.J.; van der Meulen, J. Impact of Comorbidities on the Safety and Effectiveness of Hip and Knee Arthroplasty Surgery. Bone Joint J. [CrossRef]
- Masaracchio, M.; Hanney, W.J.; Liu, X.; Kolber, M.; Kirker, K. Timing of Rehabilitation on Length of Stay and Cost in Patients with Hip or Knee Joint Arthroplasty: A Systematic Review with Meta-Analysis. PLoS One 2017, 12, e0178295. [Google Scholar] [CrossRef]
- Padegimas, E.M.; Verma, K.; Zmistowski, B.; Rothman, R.H.; Purtill, J.J.; Howley, M. Medicare Reimbursement for Total Joint Arthroplasty: The Driving Forces. The Journal of Bone and Joint Surgery 2016, 98, 1007–1013. [Google Scholar] [CrossRef] [PubMed]
Figure 1.
Project setup, how data were used to create the Language Model and to feed the final Classification Model.
Figure 1.
Project setup, how data were used to create the Language Model and to feed the final Classification Model.
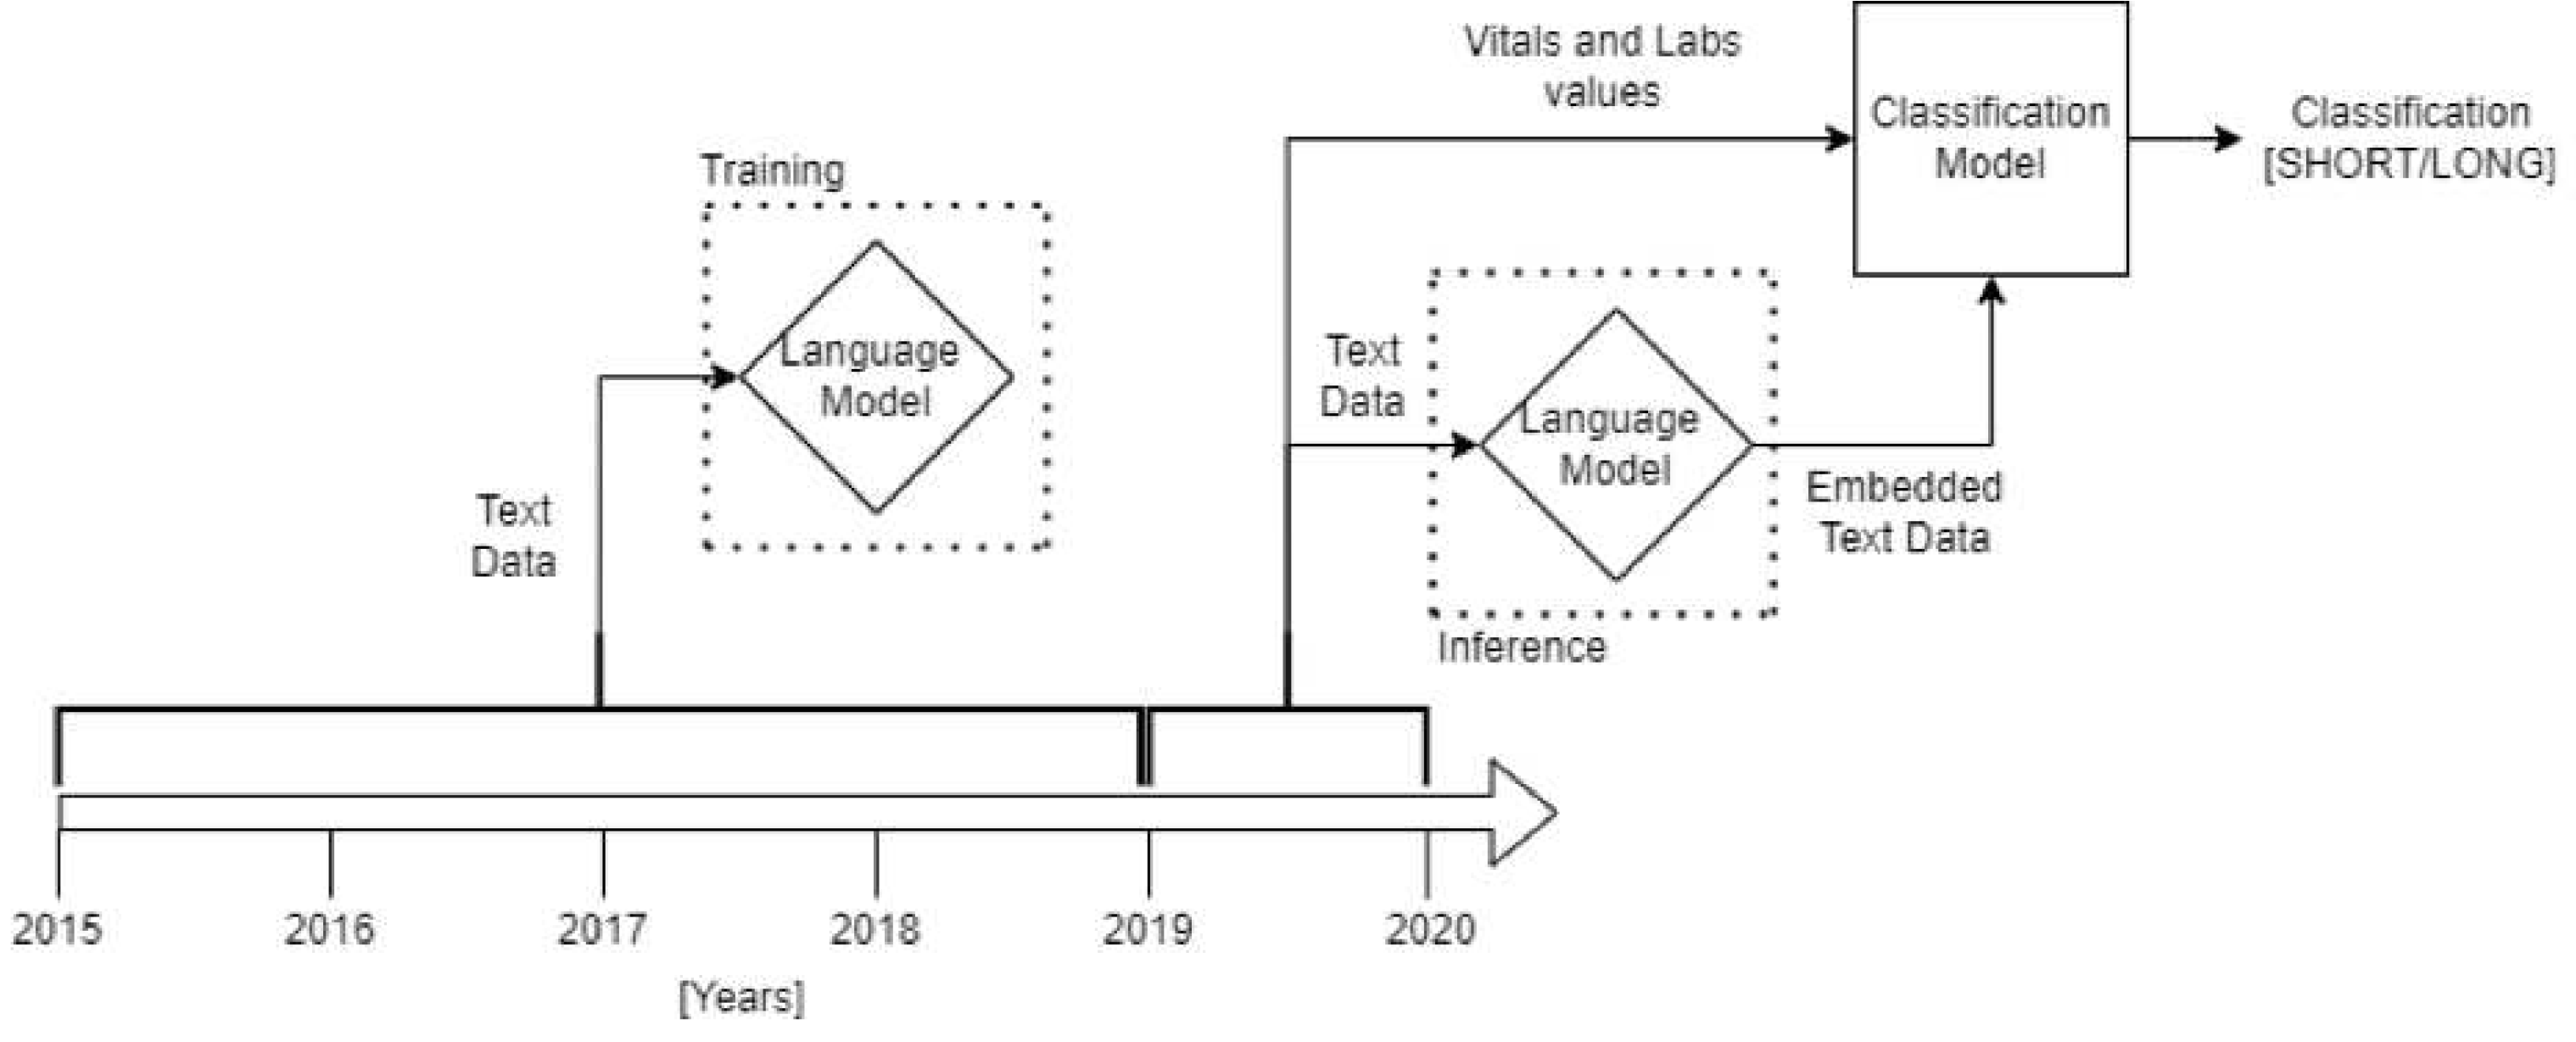
Figure 2.
Autoencoder structure is composed by an encoder and a decoder. The encoder compresses the input information, usually as unstructured information like images or texts, in a numeric format producing the embedding. The decoder takes as input the embedded data and tries to reconstruct the data in its original format. During the training process, the two parts cooperate to compress and reconstruct the input data as much accurately as possible. In this project, after the training, only the encoder has been used during the final classification to encode the data in numeric format to feed the Logistic Regression performing the classification.
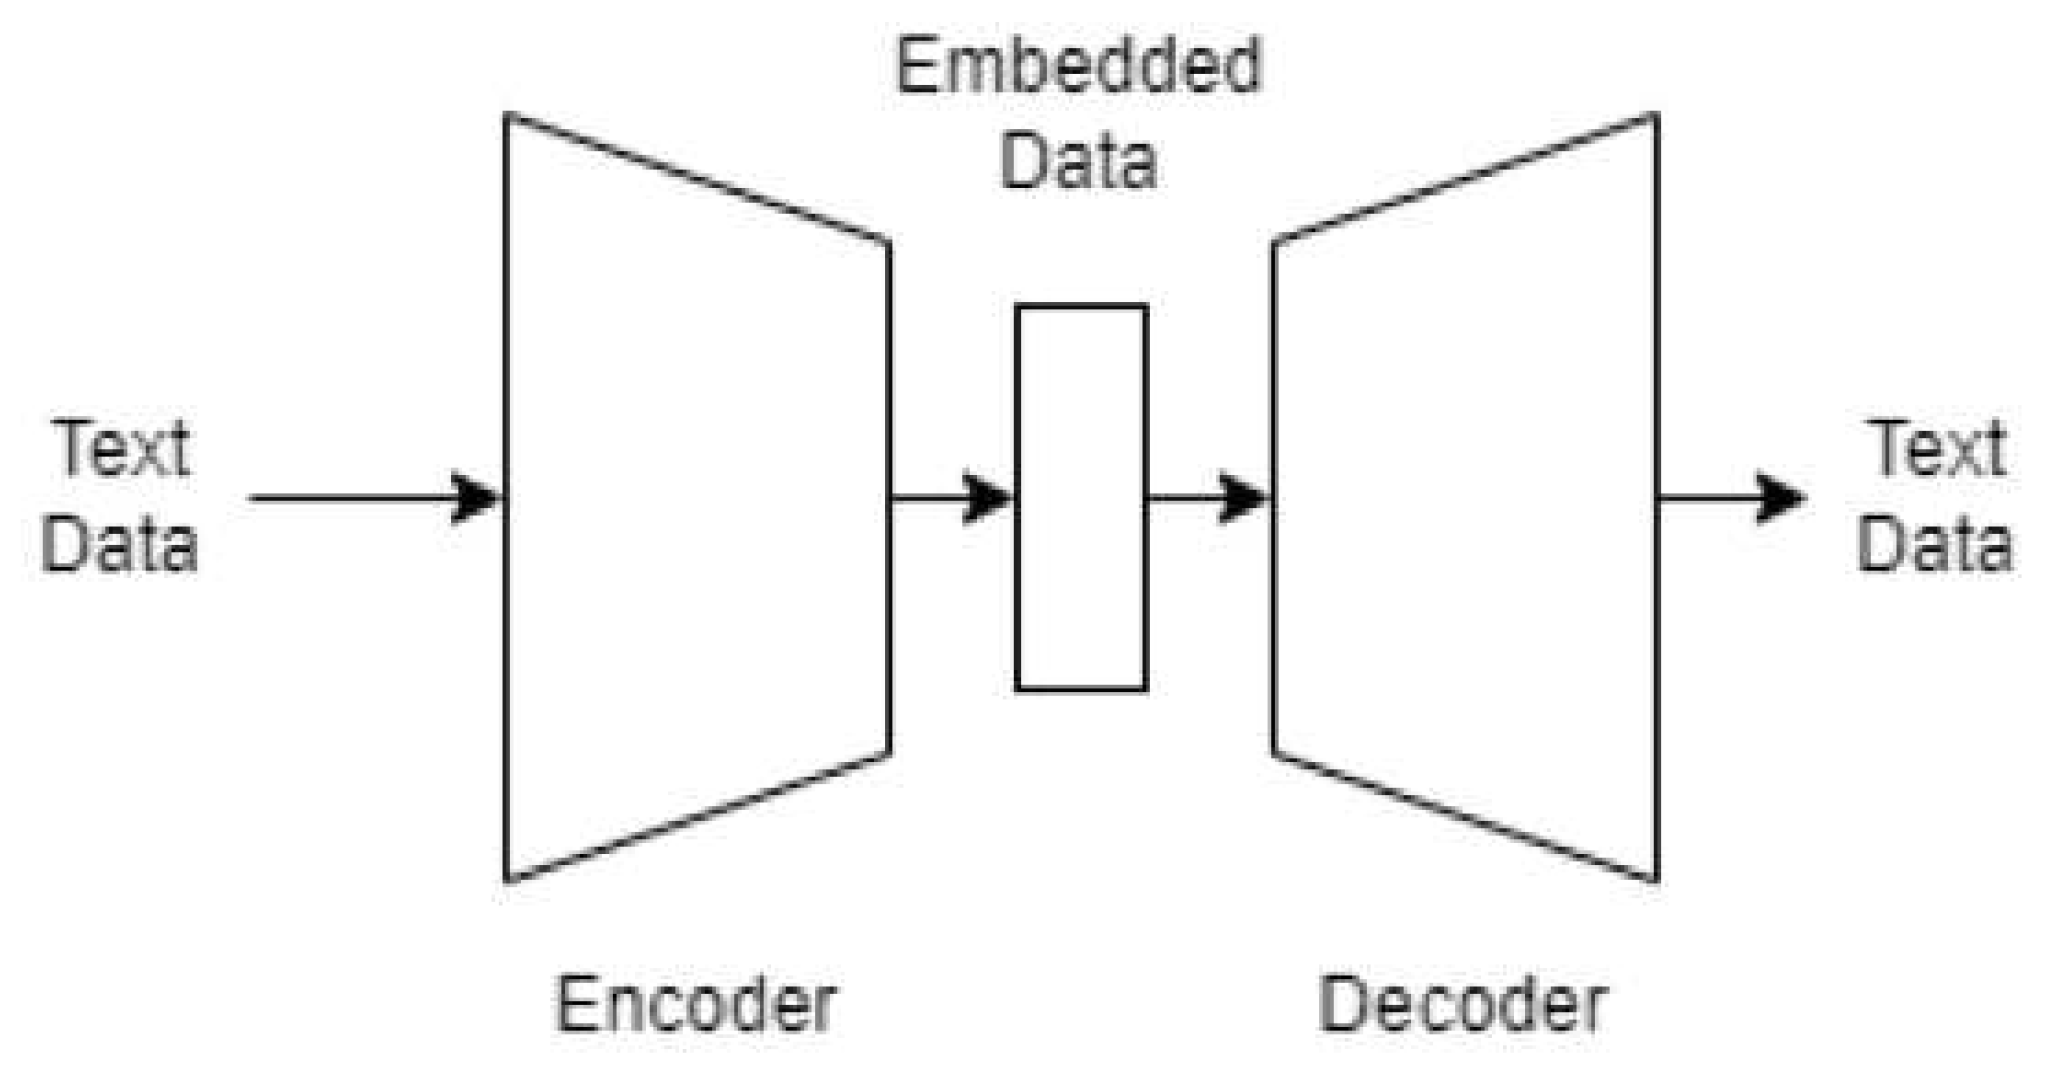
Figure 3.
It confirms the results shown in Table 2 and Table 3: ROC Curve for the complete model dominates the others.
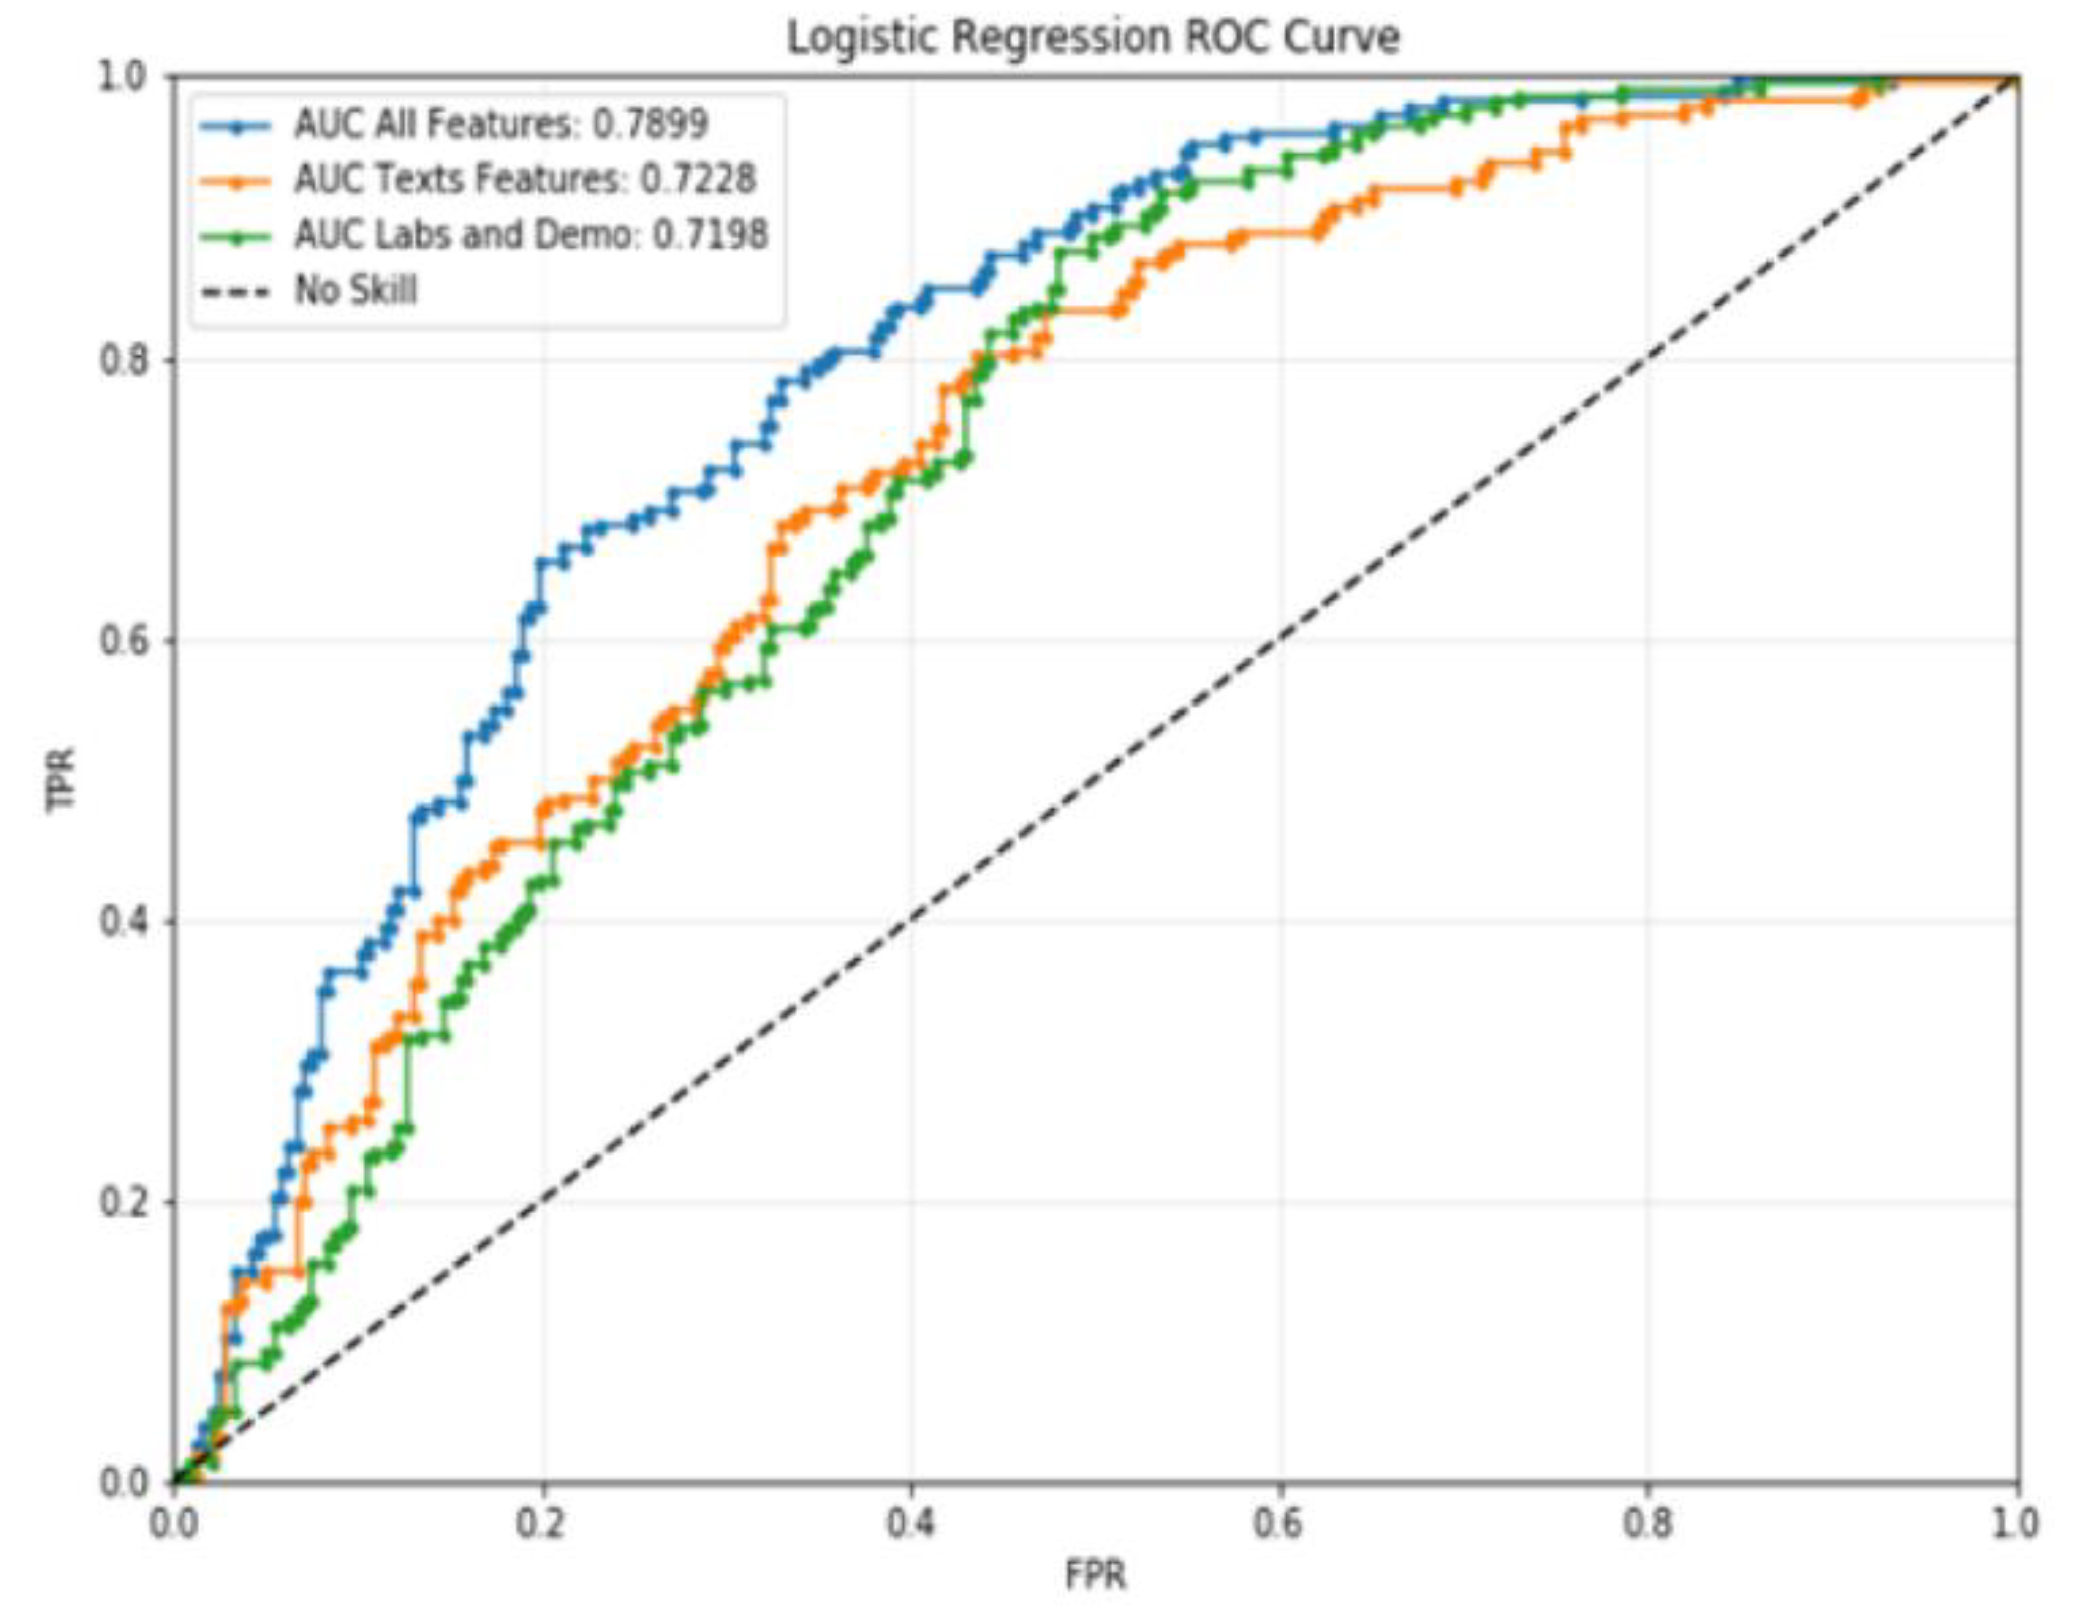
Figure 4.
Multivariate Logistic Regression Odds Ratios and CIs. (Note: INR has been removed from the plot due to a scale problem).
Figure 4.
Multivariate Logistic Regression Odds Ratios and CIs. (Note: INR has been removed from the plot due to a scale problem).
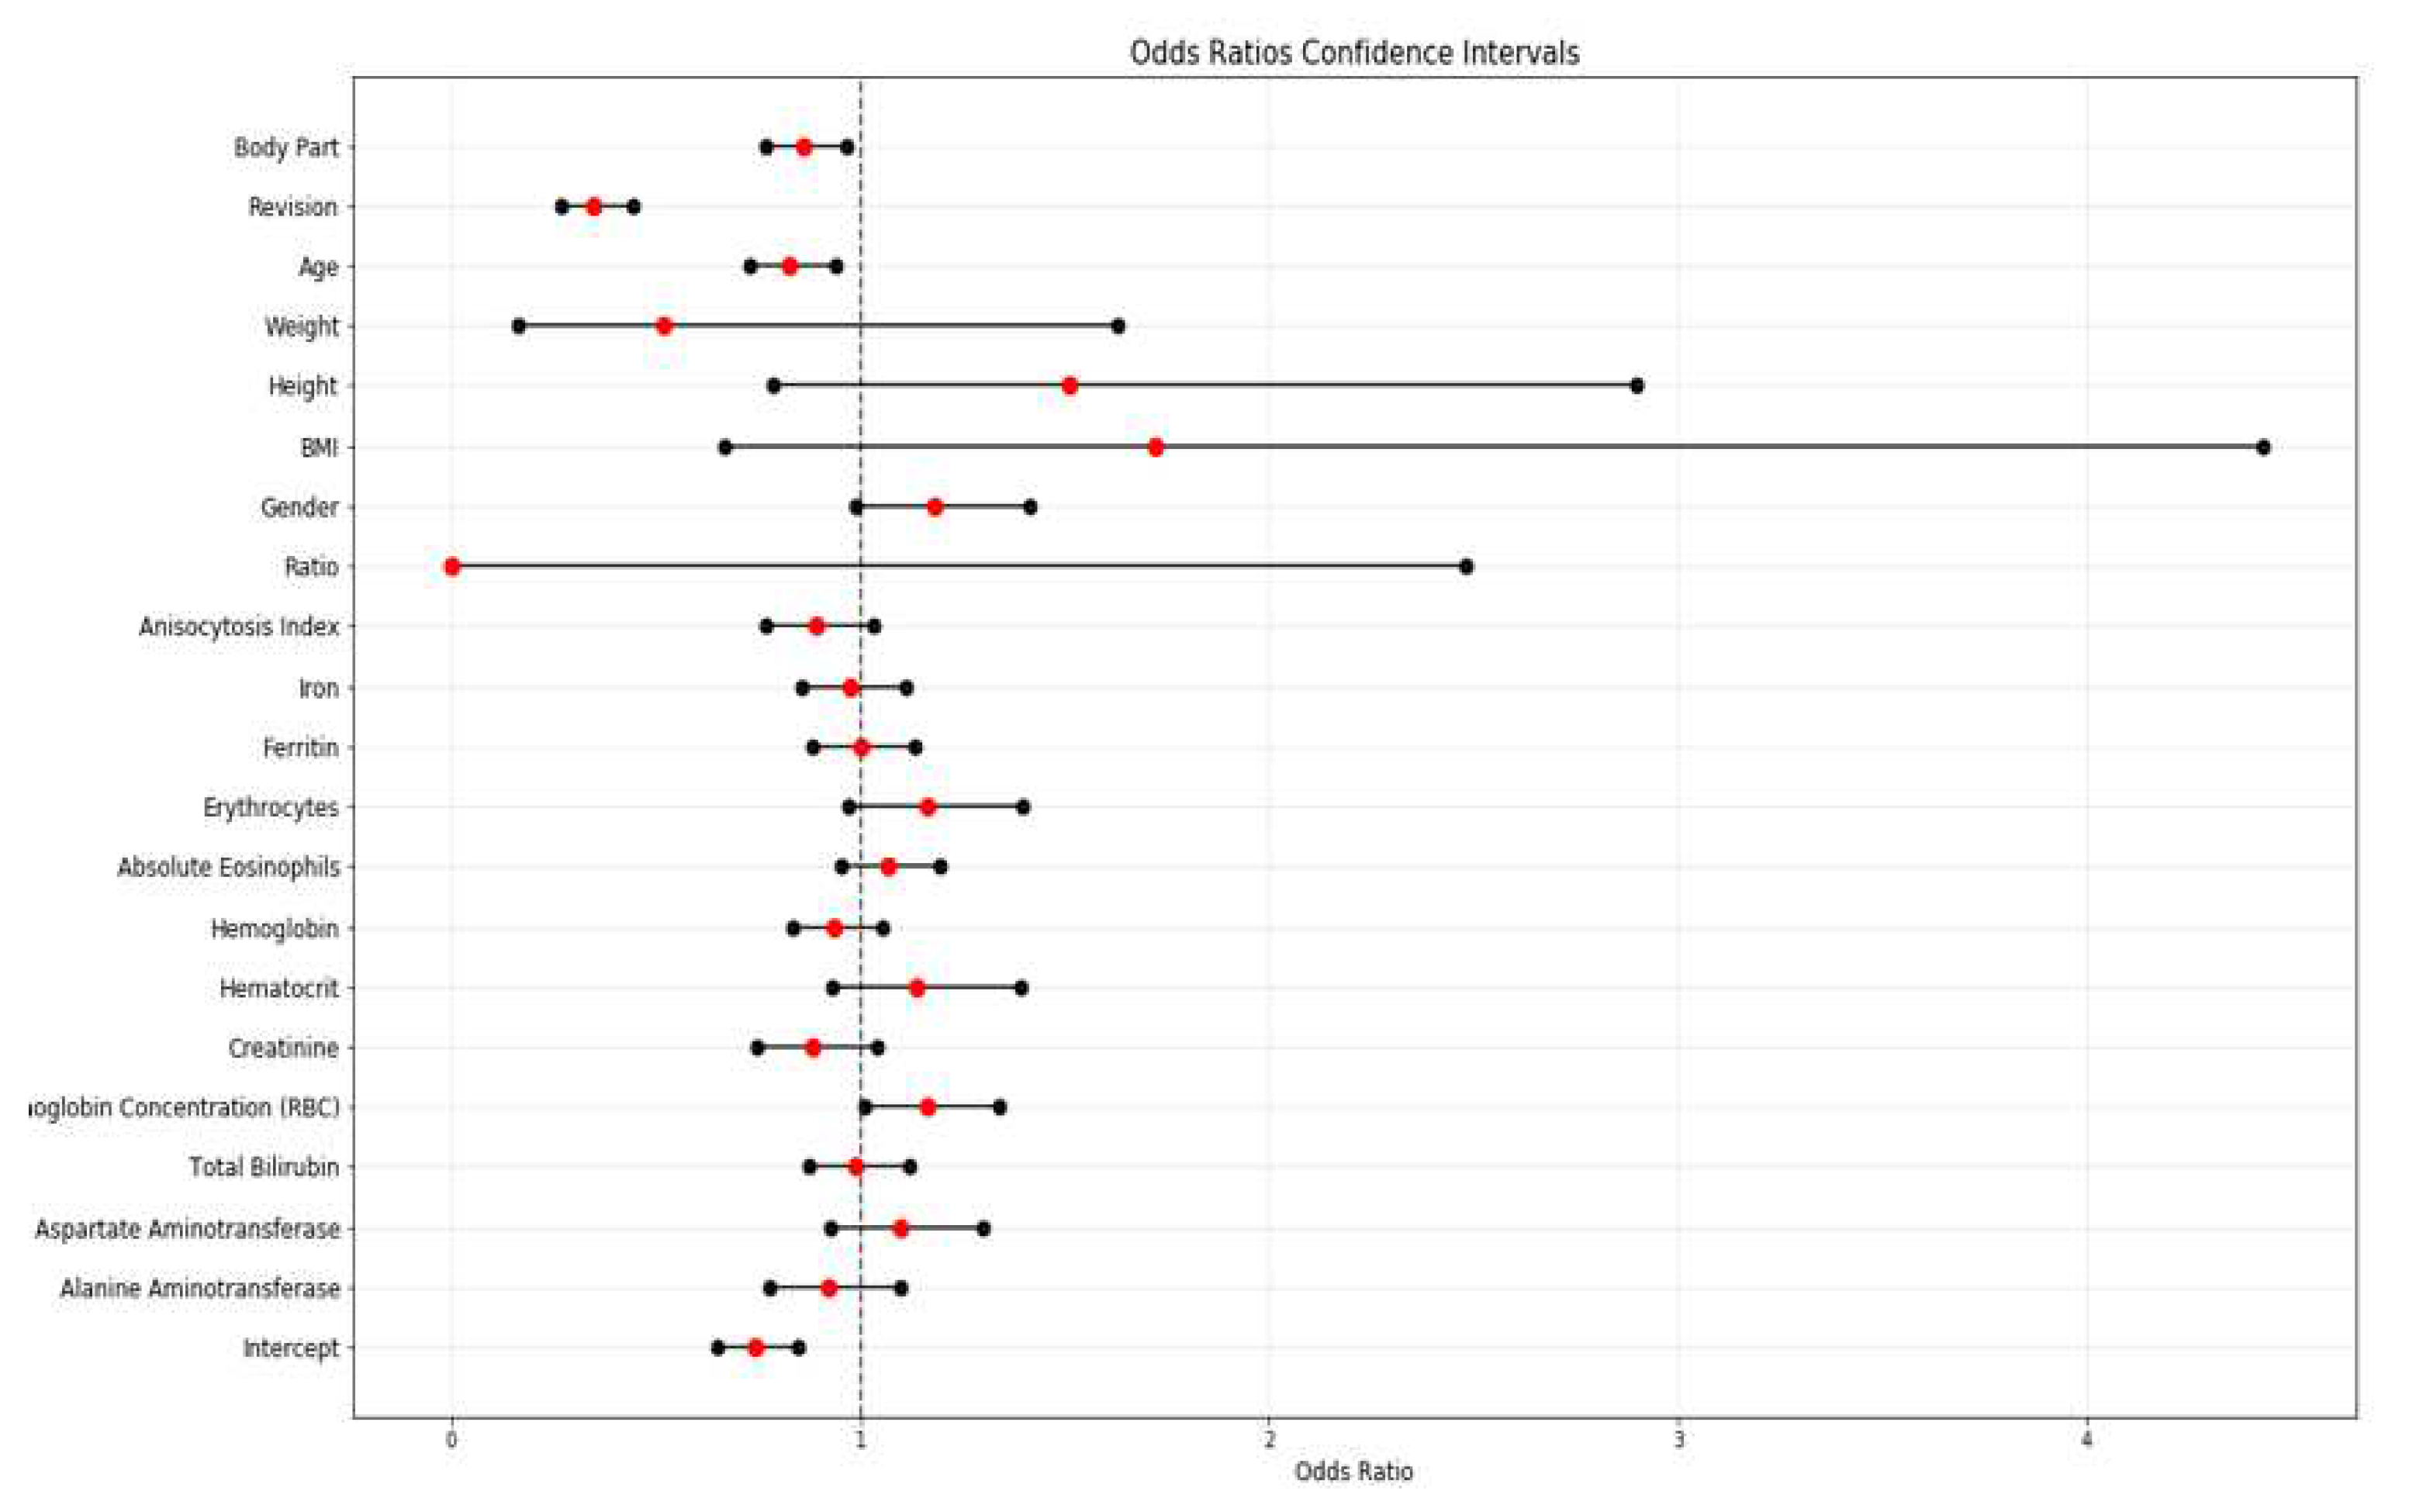

Table 1.
Demographic, Clinical and Morphological Characteristics of the Cohort.
| Long (Group 2) | Short (Group 1) | Measure | P-Value | ||||
| Patients | 795 | 722 | # | 0.3196 | |||
| Admissions | 812 (52.7%) | 729 (47.3%) | # | 0.0000 | |||
| Mean Age | 67.0 | 63.8 | Years | 0.0000 | |||
| Mean BMI | 27.439 | 27.709 | % | 0.2497 | |||
| Mean Height | 165.688 | 167.716 | cm | 0.0001 | |||
| Mean Weight | 75.605 | 78.181 | Kg | 0.0030 | |||
| Mean LOS | 11.7 | 5.7 | Days | 0.0000 | |||
| Mean Absolute eosinophils | 0.169 | 0.182 | mg/dL | 0.0449 | |||
| Mean Alanine aminotransferase | 19.232 | 21.213 | mg/dL | 0.0000 | |||
| Mean Anisocytosis Index | 14.292 | 13.960 | mg/dL | 0.0000 | |||
| Mean Aspartate aminotransferase | 21.380 | 22.344 | mg/dL | 0.0130 | |||
| Mean Creatinine | 0.818 | 0.804 | mg/dL | 0.0003 | |||
| Mean Erythrocytes | 4.639 | 4.762 | mg/dL | 0.0000 | |||
| Mean Ferritin | 96.240 | 108.057 | mg/dL | 0.0002 | |||
| Mean Hematocrit | 41.807 | 43.171 | mg/dL | 0.0000 | |||
| Mean Hemoglobin | 7.519 | 7.719 | mg/dL | 0.0000 | |||
| Mean INR | 1.066 | 1.023 | mg/dL | 0.0000 | |||
| Mean Iron | 80.938 | 86.495 | mg/dL | 0.0001 | |||
| Mean RBC hemoglobin concentration | 33.108 | 33.320 | mg/dL | 0.0000 | |||
| Mean Ratio | 1.067 | 1.023 | mg/dL | 0.0000 | |||
| Mean Total Bilirubin | 0.709 | 0,747 | mg/dL | 0.0057 | |||
| Hip | 639 (78.7%) | 530 (72,7%) | # | 0.0000 | |||
| Knee | 173 (21.3%) | 199 (27,3%) | # | 0.0566 | |||
| Female | 503 (61.9%) | 364 (49,9%) | # | 0.0000 | |||
| Male | 309 (38.1%) | 365 (50,1%) | # | 0.0023 | |||
| One | 6 | 4 | # | 0.3711 | |||
| Two | 60 | 59 | # | 0.8969 | |||
| Three | 2 | 1 | # | 0.4142 | |||
| Four | 2 | 1 | # | 0.4142 | |||
| Five | 11 | 3 | # | 0.0025 | |||
| Six | 560 | 481 | # | 0.0005 | |||
| Unknown | 171 | 180 | # | 0.4969 | |||
| No | 248 (25.4%) | 728 (74,6%) | # | 0.0000 | |||
| Yes | 564 (99.8%) | 1 (0,2%) | # | 0.0000 | |||
| No | 641 (47.0%) | 722 (53,0%) | # | 0.0019 | |||
| Yes | 171 (96.1%) | 7 (3,9%) | # | 0.0000 | |||
BMI, Body mass index; LOS, Length of Stay; INR, international normalized ratio; RBC, red blood cell.
Table 2.
Models Classification Scores for the Two Classes.
| LONG | SHORT | |||||||
| F1 Score | Precision | Recall | Support | F1 Score | Precision | Recall | Support | |
| Complete | 0.709251 | 0.741935 | 0.679325 | 237.0 | 0.720339 | 0.691057 | 0.752212 | 226.0 |
| Texts | 0.656319 | 0.691589 | 0.624473 | 237.0 | 0.673684 | 0.642570 | 0.707965 | 226.0 |
| Others | 0.642082 | 0.660714 | 0.624473 | 237.0 | 0.645161 | 0.627615 | 0.663717 | 226.0 |
Table 3.
Models Classification Scores (Averages).
| MACRO AVG | WEIGHTED AVG | |||||||
| F1 Score | Precision | Recall | Support | F1 Score | Precision | Recall | Support | |
| Complete | 0.714795 | 0.716496 | 0.715769 | 463.0 | 0.714663 | 0.717101 | 0.714903 | 463.0 |
| Texts | 0.665002 | 0.66708 | 0.666219 | 463.0 | 0.664795 | 0.667662 | 0.665227 | 463.0 |
| Others | 0.643622 | 0.644165 | 0.644095 | 463.0 | 0.643585 | 0.644558 | 0.643629 | 463.0 |
Table 4.
Multivariate Logistic Regression Results. (Note: Missing Values correspond to negative variance estimation).
Table 4.
Multivariate Logistic Regression Results. (Note: Missing Values correspond to negative variance estimation).
| Feature | Coefficients | Standard Errors | W values | P > |z| | Odds Ratio | [0.025 | 0.975] | ||
| 0 | Intercept | -0.2990 | 0.0680 | -4.3950 | 0.0000 | 0.7416 | 0.6490 | 0.8473 | |
| 1 | Alanine aminotransferase | -0.0785 | 0.0870 | -0.9060 | 0.3650 | 0.9245 | 0.7796 | 1.0964 | |
| 2 | Aspartate aminotransferase | 0.0931 | 0.0860 | 1.0860 | 0.2780 | 1.0976 | 0.9273 | 1.2991 | |
| 3 | Total Bilirubin | -0.0111 | 0.0630 | -0.1760 | 0.8600 | 0.9890 | 0.8741 | 1.1189 | |
| 4 | Mean corpuscular hemoglobin concentration (MCHC) | 0.1503 | 0.0720 | 2.0910 | 0.0370 | 1.1622 | 1.0092 | 1.3383 | |
| 5 | RBC hemoglobin concentration | -0.1261 | 0.0850 | -1.4880 | 0.1370 | 0.8815 | 0.7462 | 1.0413 | |
| 6 | Hematocrit | 0.1303 | 0.1020 | 1.2820 | 0.2000 | 1.1392 | 0.9327 | 1.3913 | |
| 7 | Hemoglobin | -0.0647 | 0.0600 | -1.0800 | 0.2800 | 0.9373 | 0.8334 | 1.0543 | |
| 8 | Absolute eosinophils | 0.0658 | 0.0570 | 1.1600 | 0.2460 | 1.0680 | 0.9551 | 1.1943 | |
| 9 | Erythrocytes | 0.1528 | 0.0930 | 1.6510 | 0.0990 | 1.1651 | 0.9710 | 1,3981 | |
| 10 | Ferritin | 0.0012 | 0.0630 | 0.0190 | 0.9850 | 1.0012 | 0.8849 | 1.1328 | |
| 11 | Iron | -0.0239 | 0.0670 | -0.3560 | 0.7220 | 0.9764 | 0.8562 | 1.1134 | |
| 12 | INR | 8.4158 | 4.9490 | 1.7000 | 0.0890 | 4517.8884 | 0.2769 | 73724077.5095 | |
| 13 | Anisocytosis Index | -0.1163 | 0.0760 | -1.5400 | 0.1240 | 0.8902 | 0.7670 | 1.0332 | |
| 14 | Ratio | -8.8155 | 4.9610 | -1.7770 | 0.0760 | 0.0001 | 0.0000 | 2.4795 | |
| 15 | Gender | 0.1667 | 0.0910 | 1.8380 | 0.0660 | 1.1814 | 0.9884 | 1.4121 | |
| 16 | One | -0.0423 | / | 0.0000 | 1.0000 | 0.9586 | 0 | / | |
| 17 | Two | 0.0191 | / | 0.0000 | 1.0000 | 1.0193 | 0 | / | |
| 18 | Three | -0.0360 | / | 0.0000 | 1.0000 | 0.9646 | 0 | / | |
| 19 | Four | -0.0491 | / | 0.0000 | 1.0000 | 0.9521 | 0 | / | |
| 20 | Five | -0.0973 | / | 0.0000 | 1.0000 | 0.9073 | 0 | / | |
| 21 | Six | 0.0011 | / | 0.0000 | 1.0000 | 1.0011 | 0 | / | |
| 22 | Unknown | 0.0257 | / | 0.0000 | 1.0000 | 1.0260 | 0 | / | |
| 23 | BMI | 0.5422 | 0.4830 | 1.1220 | 0.2620 | 1.7198 | 0.6673 | 4.4321 | |
| 24 | Height | 0.4118 | 0.3330 | 1.2380 | 0.2160 | 1.5095 | 0.7859 | 2.8993 | |
| 25 | Weight | -0.6558 | 0.5840 | -1.1220 | 0.2620 | 0.5190 | 0.1652 | 1.6304 | |
| 26 | Age | -0.1895 | 0.0640 | -2.9460 | 0.0030 | 0.8274 | 0.7298 | 0.9379 | |
| 27 | Revision | -1.0611 | 0.1260 | -8.4100 | 0.0000 | 0.3461 | 0.2703 | 0.4430 | |
| 28 | Body Part | -0.1499 | 0.0590 | -2.5560 | 0.0110 | 0.8608 | 0.7668 | 0.9663 | |
Disclaimer/Publisher’s Note: The statements, opinions and data contained in all publications are solely those of the individual author(s) and contributor(s) and not of MDPI and/or the editor(s). MDPI and/or the editor(s) disclaim responsibility for any injury to people or property resulting from any ideas, methods, instructions or products referred to in the content. |
© 2023 by the authors. Licensee MDPI, Basel, Switzerland. This article is an open access article distributed under the terms and conditions of the Creative Commons Attribution (CC BY) license (http://creativecommons.org/licenses/by/4.0/).
Copyright: This open access article is published under a Creative Commons CC BY 4.0 license, which permit the free download, distribution, and reuse, provided that the author and preprint are cited in any reuse.


