
Submitted:
13 November 2023
Posted:
14 November 2023
You are already at the latest version
Abstract
Two-phase olive pomace is a byproduct of the olive-oil extraction process that is sometimes processed further to recover more oil. During pomace oil production, especially in the early stages of olive processing, odours can be produced. These odours are a serious nuisance especially in and around the processing facilities, as well as for nearby communities. These odours can be strong and unpleasant, and they may result in various issues, including environmental concerns. Thus, in this paper, the effect of storage and drying on the composition of two-phase olive pomace was investigated. Several physicochemical and instrumental analyses were performed and it was concluded that the structural elements of pomace are not the ones who are affected during storage and drying. Storage and drying mainly impact the oil content of pomace, leading to an acidity increase and to the production of odorous oxidation compounds. Volatile acids, methyl and ethyl esters are released into the atmosphere causing serious environmental nuisance.
Keywords:
acidity
; crystallinity
; FTIR
; odour nuisance
; volatile organic compounds
1. Introduction
Olive oil is not only a source of income for Mediterranean countries, but also a cultural value centuries-old that is connected to history, culture, the environment and the local economy. The global production of olive oil in 2021-2022 reached 3.27 million tons, but production is expected to decrease in 2022-2023 to 2.82 million tons [1]. The European Union is responsible for 70% of the global production in 2021-2022 corresponding to 2.27 million tons, while it is expected to fall down to 1.39 million tons in 2022-2023 [2]. This production is mainly concentrated in Spain (58.4%), Italy (19.0%) and Greece (14.3%). Based on data from the International Olive Council (IOC) for years 2010-2020, Greece produces on average 270,000 tons per year, Italy 350,000 tons and Spain 1,300,000 tons.
In Spain intensive crops dominate, with over 200 trees per hectare whereas in Greece it is estimated that 70-80% of the crops are of low density with less than 200 trees per hectare. Additionally, in Greece, most olive mills are small businesses and their average production is low, about 150 tons per year while in Spain the average production is about 700 tons per year. In Italy the fragmentation of olive mills is greater than in Greece and more olive mills operate, with an average production of about 100-150 tons. However, Italy follows a different model compared to Greece and Spain, where it is common growers to have small olive oil production and standardization units.
The main production processes are three-phase and two-phase olive mills. The latter are gaining ground due to the recent legislation. Two-phase olive mills have as their product olive oil and as by-products the two-phase pomace as well as a small amount of wastewater which derives from the water used in the last stage of the clarification process [3]. The two-phase pomace is a semi-solid waste that consists of large amounts of moisture (50-75%), olive kernel, pieces of olive peel and pulp as well as residues from leaves and pruning [4]. The waste of the two-phase pomace represents more than 80% of the raw material processed. Strong phytotoxic effects result from uncontrolled waste discharge into the soil. This waste also makes the soil more hydrophobic, decreases water retention and filtration rate, and alters microbial activity, leaching, lipid concentration, salinity, acidity, nitrogen uptake, and the synthesis of organic acids and phenols. Uncontrolled discharge of waste into the soil increases hydrophobicity, causes phytotoxic effects, decreases water filtration and retention rates, affects salinity, acidity, microbial activity, nitrogen uptake, leaching lipid concentration, and production of phenols and organic acids [5].
A common valorisation pathway of the two-phase pomace is the extraction of pomace oil in pomace oil plants. A typical plant includes a drying step in a rotary drum dryer in order to reduce the moisture of pomace to 8% as well as an oil extraction step with hexane. More specifically, the production process of pomace oil is illustrated in Figure 1, including the following stages: reception and storage, drying, oil extraction, recovery of solvent, degassing and management of the final products (pomace oil and olive stone wooden residue). The main environmental issue that these plants face is the emissions to the atmosphere that become a serious nuisance to the local communities. These gaseous emissions are mainly suspended particulate matter (PM), volatile organic compounds (VOCs), and flue gases that are dependent on the fuel type and quality as well as on the combustion equipment. It has been estimated that the produced gaseous emissions from pomace oil plants are 1.4-2.45 kg VOC/tn pomace and 1.2 kg PM/tn pomace.
More specifically, odorous volatile compounds are released during the drying of the fresh olive pomace. These compounds are produced either during the process of drying, or have been produced earlier (during storage) and are released during drying. The production of odours during drying can be due to the thermal decomposition of fatty components contained in the pomace oil if the drying temperature exceeds some limits. Odorous volatile compounds are also released from the flue gases from the combustion furnace of the dryer and the steam generation section. From the combustion of olive stone wooden residues, mainly exhaust gases are produced. The CO content depends mainly on the combustion conditions rather than the fuel composition while the SO2 content depends on the sulfur content of the fuel. The remaining compounds released constitute the conventional combustion products of any fuel.
Particulates from the dryer and steam generation furnaces are also produced. The particulate emissions are due to unburned particles of olive stone wooden residues (mainly in the exhaust gases of dryers) or in ash particles (mainly in the exhaust gases of steam boilers). The particle size composition of the emitted particles from dryers varies mainly between 100-500 µm, which classifies them as coarse particles, while the particles from the steam boiler are characterized by a granulometric composition 0-100 µm, so they are classified as fine particles.
Additionally, water vapors are produced from the drying stage of the fresh olive pomace and from the steam generation section. They are due to the induced moisture of the pomace and the moisture content of the olive stone wooden residues. Water vapor is a harmless emission but causes optical nuisance. For this reason, it is not necessary to apply any special measure in order to deal with it.
In this context, the current paper focuses on the effect of storage and drying of two-phase pomace on its physicochemical characteristics in view of mitigating environmental nuisance.
2. Materials and Methods - Methodological approach
Initially, samples of olive pomace were collected from various olive mills in Greece at different times of the oil production period (typically form late October to early February) and were subjected to analytical physicochemical characterization so as to study the impact of the origin of the sample on the two-phase olive pomace composition.
Specifically, analyzes were performed according to standard methods for the characterization of the two-phase olive pomace: pH, conductivity, moisture, total, volatile and water-soluble solids, total nitrogen, acid-insoluble residue, soluble lignin, cellulose, hemicellulose and oil. Moisture, ash, acid-soluble and insoluble lignin, cellulose and hemicellulose were estimated by the NREL Laboratory Analytical Protocols [6,7,8,9,10]. The Soxhlet standard method (5520E) was utilized for the quantification of fats and lipids [11,12].
Subsequently, to study the effect of storage and drying on the composition of two-phase olive pomace under field conditions, various samples were collected from a two-phase olive mill and a pomace oil plant in Messinia, Greece, and delivered to the Unit of Environmental Science and Technology (UEST), School of Chemical Engineering, National Technical University of Athens. Figure 2 illustrates the sampling points in the value chain of pomace oil, from the production of pomace in the olive mill until the production of dried pomace.
In addition to determining the physicochemical characteristics of these samples, particle size analysis was performed by a sieve shaker analysis (Retsch Vibratory Sieve Shaker AS200 Basic). Furthermore, X -ray diffraction (XRD) analysis was performed by a Bruker D8 Advance X -ray instrument. The instrument was operated in step scan mode in steps of 0.02˚ 2θ over the range 10˚ - 50˚. A thermogravimetric analysis of the dried samples in a nitrogen environment was also carried out by a Mettler Toledo TGA/DSC HT1 instrument, with the aim of exploring the effect of thermal degradation on the components of the olive pomace. A thermogravimetric analysis of fresh samples in an air environment was also performed by the same instrument, with the aim of simulating the process of drying - moisture removal. Samples were heated from 30 to 600°C at a rate of 10°C min−1, while the simultaneous flow of oxygen or nitrogen was regulated at 10 mL min−1. The weight of each sample's final residue at 600°C was measured.
Additionally, Fourier transform infrared spectroscopy (FTIR) was used as described by Moreno et al. [13] to quantify the aldehydes and ketones in the samples as well as in the oil content. An FTIR spectrometer with a TGS detector (FTIR 4200 Jasco, Tokyo, Japan) was used for the pomace pomace. The scanning was performed from 4000 to 700 cm−1 by applying a resolution of 4 cm−1. The Jasco Spectra Manager (version 2.0) software was used to evaluate the acquired infrared spectra. Utilizing an air background adjustment, spectra were obtained.
Pomace oil was also investigated for some qualitative characteristics (free acidity, specific extinction K232 and K270 values), with the aim of identifying changes in the organoleptic characteristics of the oil content due to storage and fermentation progress. Free acidity (FA) and specific extinction coefficients at 232 and 270 nm (K232, K270) were estimated based on EU standards [14].
Finally, the VOC analysis was performed using a thermal desorption (Markes International Ltd., UK) gas chromatography (GC-7890B, Agilent, USA) mass spectrometer (5977B MSD, Agilent Technologies, USA) system (TD-GC-MS). Chlorobenzene-d5 (Supelco, concentration of 200 ppb) was previously spiked to each sample to serve as an internal standard (I.S.), as well as for the semi-quantitative approach. The PDMS HiSorb probe (Markes International Ltd., UK) was used for the headspace extraction of VOCs. Then, it was inserted into an empty tube and desorbed on the TD-GC-MS system. The details of the TD-GC-MS analysis are presented in detail in Fella et al. [15].
3. Results
3.1. Two-phase olive pomace composition
The results of the analysis of the different samples of two-phase olive pomace are presented in Table 1. In addition, in this Table, the mean values of the measurements of the above parameters of all samples are presented along with the corresponding literature values.
From this Table (Table 1), it is concluded that the average value of pH is consistent with the values reported in the literature. The same applies for the average values of conductivity and total solids content. A relatively greater discrepancy is observed in the value of volatile solids (99.00 ± 0.07% vs. 83.25 ± 4.15%). In addition, the mean value for hemicellulose, acid insoluble residue, total nitrogen and oil range within the respective literature values. However, it is worth noting that the cellulose content of the samples of this study is much lower.
3.2. Effect of storage and drying on two-phase olive pomace composition under field conditions
The sample taken from point 1 is considered a "fresh" sample in contrast to the sample taken from point 2 which has undergone a long-term storage. The sample taken from point 3 results from the mixing of fresh stored olive pomace with dried olive pomace, aiming to achieve a final moisture content of 50%. The sample taken from point 4 is the final dry pomace.
Evolution of physicochemical characteristics
The following Table (Table 2) presents the evolution of the composition of the sample entering the olive pomace plant until its exit from the rotary drum dryer.
A significant decrease in conductivity was observed during the storage of the fresh olive pomace. As for changes in moisture and total solids, these are to be expected given the processes taking place. Regarding the structural elements of the solid phase, it was observed that no significant changes occurred, which is in agreement with preliminary laboratory scale experiments. However, it is worth emphasizing that there is a decrease in cellulose and hemicellulose content which can be attributed to thermal degradation that takes place during the heat treatment of the olive pomace.
Particle size distribution
Particle size distribution analysis is used to measure the size of the particles present in a sample according to their characteristics such as their weight or their shape, for a better understanding of their nature. Figure 3 illustrates the results from the particle size distribution analysis for the following samples:
- Olive pomace before drying (Point 3)
- Olive pomace after drying (Point 4)
- Solid sample from the cyclones
- Olive stone wooden residue.
From this figure (Figure 3), it is observed that 90% of the granules of olive pomace before drying have a diameter of less than 3.5 mm, while the corresponding percentage for the olive pomace after drying has a diameter of 3.25 mm. This reduction is probably due to the removal of moisture. Furthermore, it is evident that small diameter particles escape and are subsequently collected in the cyclones. From the particle size distribution analysis of the olive stone wooden residue and olive pomace samples after drying, it appears that the removal of the pomace oil leads to a decrease in the diameter of the particles, as expected.
X-ray diffraction analysis
A non-destructive method for obtaining precise data about a sample's crystallographic structure, chemical makeup, and physical characteristics is X-ray diffraction (XRD). From the results of Figure 4, the heat treatment in the dryer leads to the change in the crystallinity of the cellulose as well as to the removal/degradation of characteristic triglycerides of the olive oil.
Thermogravimetric analysis
Thermogravimetric analysis (TGA) relies on monitoring the change in mass of a substance as a function of temperature change. More specifically, it is a dynamic combination of gravimetric analysis with oven drying. This analysis technique is applied to the analysis of solid samples, which during heating show changes in weight, due to physical or chemical phenomena. Therefore, a thermogravimetric analysis of the dry samples was carried out in a nitrogen environment (Figure 5), with the aim of studying the effect of thermal degradation on the components of the olive pomace.
Likewise, the specific technique was also applied to fresh-‘as received’ samples in an air environment (Figure 6), with the aim of simulating the process of drying - moisture removal.
The results from the thermogravimetric analysis tests are summarized in the following Table (Table 3).
From all the above, it may be concluded that:
- The thermal degradation in the operating temperature range of the dryer is very low (0.86-2.67%).
- The weight loss of fresh - ‘as received’ samples under air flow is proportional to the moisture content.
Therefore, the nuisance (odour) of the exhaust gases of the drying process is probably due to organic compounds removed in very low concentrations (which cannot be illustrated in the particle size distribution analysis) and present a low odour threshold, which was investigated next.
Analysis of fresh-‘as received’ olive pomace samples by Fourier Transform Infrared Spectroscopy
Fourier Transform Infrared Spectroscopy (FTIR) analysis was also carried out on the olive pomace samples (Figure 7). FTIR is a method for obtaining solid, liquid, and gaseous materials' infrared absorption, emission, and photoconductivity spectra.
From the results of this analysis and according to Figure 7, it was observed that the greatest difference between the samples is found in the peak between the wavenumbers 1633-1648 cm-1 . The 1664cm-1 peak is due to the cis C=C bond. Additionally, the sample in which the particular peak does not appear is the sample after the drying process. It can thus be concluded that the oil content was auto-oxidized since oleic acid which has a cis double bond is the main component in olive oil.
Subsequently, the recovered oils from these samples were also subjected to FTIR analysis (Figure 8).
In the spectra shown in Figure 8Figure 82, the characteristic absorption peaks can be observed:
- at 1365.35 cm-1 corresponding to the CH2 -CH2 groups and
- at 1174.44 cm-1 corresponding to the C-O bond of the ester groups,
- as well as at 1459.85 cm- 1 corresponding to the group CH2 -CH3.
At first sight, it seems that all samples present similar peaks. However, qualitatively, the 1465cm-1 and 1163cm-1 peaks appear to decrease in the oil extracted from the dried sample. Furthermore, in addition to fatty acids, it appears that triglycerides are also oxidized, as a decrease in transmittance at 1163cm-1 is observed. The decrease in the transmittance ratio of the wavenumbers 1163 and 1377 cm-1 also indicates a change in the chemical composition of the oil.
As seen in Figure 9, the triglyceride esters exhibit a prominent absorption band at 1743 cm-1 in the infrared spectrum because of the carbonyl group's vibration. Additionally, between 1700 and 1726 cm-1, ketones and aldehydes exhibit distinctive absorption. On the other hand, the average value of aldehydes is approximately 1725 cm-1, and that of ketones is approximately 1715 cm-1. Consequently, the broadening (area) of the region between 1700-1726 cm-1 (A1) in relation to the area between 1840-1743 cm-1 (A1/2), which is proportionate only to esters, can be used to quantify the total aldehydes and ketones generated.
The ratio A1/(A1/2) according to Moreno (1999) can lead to a quantitative analysis of the aldehydes and ketones in the sample (Table 4).
All the samples in the pomace oil plant showed a higher ratio than the sample entering the plant coming from the olive mill. This indicates a possible indication of production of aldehydes and ketones as oxidation products.
Pomace oil acidity
Therefore, from all the above, it emerged that storage causes changes mainly in the oil content of the olive pomace, and the research was directed in this direction. One of the factors that contribute to the rapid deterioration of the olive pomace is moisture, which favors the hydrolysis of triglycerides.
In addition, the acidity of pomace oil can increase from 5 to 60% in a short period of time. This is due to the action of lipase, an enzyme which is present in the olive pomace (it comes from the olive fruit), but also, which is released by the microorganisms Gliomastrix Chartarum, Aspergillus niger, Cephalosporum Sp., Aspergillus glaucus etc. These microorganisms grow on the substrate of the olive pomace and are favored by the humidity and temperature of the olive pomace and the storage time. In addition to the acidity during the storage of the olive pomace, oxidation products (aldehydes, ketones) are also produced, which degrade the quality of the oil, as observed in the previous section.
The percentage of oleic acid in the oil indicates its acidity. Extra virgin olive oil equates to an acidity of less than 1%. In general, an olive oil's quality deterioration and amount of free fatty acids increase with its acidity value. Acidity increase is correlated with rancidity and oxidation, since this is related to problems faced by the olive fruit (olive fly, frozen, rotten, beaten olives, etc.), by the method of collection and storage, the olive mill facilities, the possibility of mixing with previously harvested olive oil, or with poor quality oils (pomace oil, etc.).
The K232 indicator which corresponds to the radiation measured at a wavelength of 232 nm, is the known indicator of the initial stages of K232 oxidation, due to compounds (hydroperoxides) produced in a primary oxidation step but also to compounds (conjugated dienes), produced in an intermediate oxidation step. The absorption coefficient of the same radiation at a wavelength of 270 nm was also calculated (Table 5), which is the indicator of an advanced stage of oxidation, known as K270. This is probably caused by secondary oxidation products that have carbonyl groups, such as aldehydes and ketones.
Taking into account the results of the table above (Table 5), it is observed that the oil sample from the olive mill has the lowest acidity compared to the rest of the samples. Between the samples from the storage tank and the sample before drying no great variation is shown, however after drying a higher acidity value is observed. The increased acidity values are due to the higher content of the olive oil in free acids, a fact that can be largely attributed to the fact that the olive fruit has been stored for a prolonged period of time. In such an occasion, the growth of a microorganisms is promoted, resulting in an increased glycerides hydrolysis and ultimately in the free fatty acids production. In addition, the triglycerides hydrolysis can be influenced by several factors such as the degree of ripening, moisture, temperature, enzymes and microorganisms. Hydrolysis is the result of contact of triglycerides with water. Hence, high humidity has the dual impact of directly accelerating the hydrolysis process and indirectly facilitating the activity of lipolytic enzymes and microbes.
Similarly, the absorption coefficients at 232 and 270 nm show a deviation with respect to the values of virgin and extra virgin olive oil. In general, when olive fruit is kept in storage for several days before being pressed and when olive oil is kept in improper circumstances, the value of the absorption coefficient K232 rises. The freshness of the olive oil affects the K270 absorption coefficient's value. K270 levels are higher in ancient olive oils or combinations including old olive oils. Furthermore, K270's value decreases dramatically right after bottling and rises with the age of the olive oil. Olive oil ages more quickly when exposed to sunshine or high temperatures.
Analysis by TD-GC-MS
In order to identify and quantify the numerous odorous emissions (VOCs) present in the collected samples (and potentially escaping or having escaped during storage or drying), headspace HiSorb TD-GC-MS analysis was performed. The total ion chromatograms obtained are shown in Figure 10. The presented results are consistent with the previous research. Hernández et al. conducted a six-month study using sorbent tubes and TD-GC-MS to monitor the process in open reservoirs, observing an increase in aldehyde, ketone, and carboxylic acid emissions over time, as well as a decrease in fatty acid methyl esters and alkenes [26]. Another study by Hernández et al. used absorbent tubes to measure odorant components in a pilot-scale rotary dryer, identifying several frequent VOCs such as aldehydes (nonanal, furfural and benzaldehyde), alcohols (2-furan methanol, phenol), carboxylic acids (acetic acid), and hydrocarbons (hexane, toluene, nonane and octane) [28]. Finally, Cecchi et al. utilized headspace solid phase microextraction-GC-MS (SPME-GC-MS) to detect specific gaseous VOCs linked to off-flavors, including 2-ethyl butanoate, p-cresol, 4-ethyl phenol, acetic acid, ethanol, and ethyl acetate [17]. The growth of bacteria that produce lactic acid, especially Lactobacillus pentosus, is related to the abundance presence of 4-ethyl phenol [29].
Table 6 below presents the major VOCs identified and semi-quantified using headspace HiSorb TD-GC-MS analysis based on the respective I.S. Although various oxygenated compounds were identified (e.g., alcohols, ketones, esters, and acids), only the most abundant VOCs are included in Table 6.
From this Table, the variations in the concentrations of VOCs during storage and drying of the two-phase olive pomace are evident. Thus, these compounds, although emitted in low concentrations (ppt to ppb by volume), escape in the atmosphere during drying, causing unpleasant consequences for the area since their odour threshold is very low.
4. Conclusions
Conclusively, from this study it was made clear that the structural elements of two-phase olive pomace such as total and volatile solids, cellulose, hemicellulose and acid-insoluble residue do not change significantly during storage. In addition, the high concentration of phenolic compounds may constitute an inhibiting factor for the development of biodegradation reactions of these components. From all the instrumental analyses during the study of the effect of storage on field samples, it was evident that during drying alterations in the crystalline structure of the cellulose are observed as well as removal/degradation of the triglycerides of the oil. The main alterations of the two-phase olive pomace are observed in its oil content, leading to an increase in its acidity and to the production of oxidation products (aldehydes, ketones). Finally, the storage of the olive pomace results in the progress of reactions and the production of a large number of volatile compounds, such as volatile acids, methyl esters and ethyl esters, which escape into the atmosphere during the drying process. As a final conclusion, it becomes clear that the appropriate parameters for monitoring the fermentation process during the storage of the two-phase olive pomace are directly related to the physicochemical characteristics of the oil content of the two-phase olive pomace.
Author Contributions
Conceptualization, Mai S. and Barampouti E.M.; methodology, Mai S. and Barampouti E.M..; formal analysis, Agapios A., Mai S. and Barampouti E.M.; investigation, Christofi A. and Fella P.; resources, Moustakas K. and Loizidou M.; writing—original draft preparation, Mai S. and Barampouti E.M.; data curation , Agapios A., Christofi A., Mai S. and Barampouti E.M.; writing—review and editing, Agapios A., Mai S. and Barampouti E.M.; visualization, Mai S. and Barampouti E.M.; supervision, Mai S. and Barampouti E.M.; project administration, Loizidou M. All authors have read and agreed to the published version of the manuscript.
Funding
This research was funded by the Regional Development Fund of the Region of Peloponnese.
Informed Consent Statement
Not applicable.
Data Availability Statement
Not applicable
Conflicts of Interest
The authors declare no conflict of interest.
References
- Statista, “Production volume of olive oil worldwide from 2012/13 to 2022/23,” https://www.statista.com/statistics/613466/olive-oil-production-volume-worldwide/.
- Olive oil times, “Europe Confirms Steep Decline in Olive Oil Production.”.
- J. A. Alburquerque, J. Gonzalvez, D. Garcia, and J. Cegarra, “Agrochemical characterisation of alperujo, a solid by-product of the two-phase centrifugation method for olive oil extraction,” Bioresour Technol, vol. 91, pp. 195–200, 2004. [CrossRef]
- E. Christoforou and P. Fokaides, “A review of olive mill solid wastes to energy utilization techniques,” Waste Management, vol. 49, pp. 346–363, 2016. [CrossRef]
- J. Sierra, E. Martí, M. A. Garau, and R. Cruañas, “Effects of the agronomic use of olive oil mill wastewater: Field experiment,” Science of the Total Environment, vol. 378, pp. 90–94, 2007. [CrossRef]
- A. Sluiter, B. Hames, R. Ruiz, C. Scarlata, J. Sluiter, and D. Templeton, “Determination of Ash in Biomass,” National Renewable Energy Laboratory (NREL), p. 8, 2005.
- A. Sluiter et al., “Determination of structural carbohydrates and lignin in biomass: Laboratory Analytical Procedure (LAP) (NREL/TP-510-42618),” National Renewable Energy Laboratory (NREL), no. April 2008, p. 17, 2012, doi: NREL/TP-510-42618.
- A. Sluiter, R. Ruiz, C. Scarlata, J. Sluiter, and D. Templeton, “Determination of Extractives in Biomass,” National Renewable Energy Laboratory (NREL), p. 12, 2005. [CrossRef]
- A. Sluiter et al., “Determination of total solids in biomass and total dissolved solids in liquid process samples,” National Renewable Energy Laboratory (NREL), no. March. pp. 3–5, 2008.
- J. Sluiter and A. Sluiter, “Summative Mass Closure: Laboratory Analytical Procedure (LAP) Review and Integration: Feedstocks; Issue Date: April 2010; Revision Date: July 2011 (Version 07-08-2011).” 2010.
- S. S. Nielsen, Food Analysis Laboratory Manual. West Lafayette, IN, USA: Springer, 2017. [CrossRef]
- G. G. Hewavitharana, D. N. Perera, S. B. Navaratne, and I. Wickramasinghe, “Extraction methods of fat from food samples and preparation of fatty acid methyl esters for gas chromatography: A review,” Arabian Journal of Chemistry, vol. 13, pp. 6865–6875, 2020. [CrossRef]
- M. C. M. M. Moreno, D. M. Olivares, F. J. A. Lopez, V. P. Martinez, and F. B. Reig, “Study of the formation of carbonyl compounds in edible oils and fats by 1H- NMR and FTIR,” J Mol Struct, vol. 482–483, pp. 557–561, 1999.
- M. T. Frangipane, L. Costantini, N. Merendino, and R. Massantini, “Antioxidant Profile and Sensory Analysis in Olive Oils of Different Quality Grades,” Agriculture, vol. 13, pp. 993–1006, 2023. [CrossRef]
- P. Fella, M. Stylianou, and A. Agapiou, “A green sorptive extraction method (HiSorb-TD-GC-MS) for determining the extra virgin olive oil (EVOO) aroma profile,” in Pure and Applied Chemistry, De Gruyter Open Ltd, May 2023, pp. 595–610. [CrossRef]
- A. Clemente, R. Sánchez-Vioque, J. Vioque, J. Bautista, and F. Millán, “Chemical composition of extracted dried olive pomaces containing two and three phases,” Food Biotechnol, vol. 11, no. 3, pp. 273–291, 1997. [CrossRef]
- L. Cecchi, M. Migliorini, E. Giambanelli, A. Cane, N. Mulinacci, and B. Zanoni, “Volatile Profile of Two-Phase Olive Pomace (Alperujo) by HS-SPME-GC-MS as a Key to Defining Volatile Markers of Sensory Defects Caused by Biological Phenomena in Virgin Olive Oil,” J Agric Food Chem, vol. 69, no. 17, pp. 5155–5166, May 2021. [CrossRef]
- J. A. Morillo, B. Antizar-Ladislao, M. Monteoliva-Sánchez, A. Ramos-Cormenzana, and N. J. Russell, “Bioremediation and biovalorisation of olive-mill wastes,” Applied Microbiology and Biotechnology, vol. 82, no. 1. pp. 25–39, Feb. 2009. [CrossRef]
- M. K. Doula, J. L. Moreno-Ortego, F. Tinivella, V. J. Inglezakis, A. Sarris, and K. Komnitsas, “Olive mill waste: Recent advances for the sustainable development of olive oil industry,” in Olive Mill Waste: Recent Advances for Sustainable Management, Elsevier Inc., 2017, pp. 29–56. [CrossRef]
- A. Roig, M. L. Cayuela, and M. A. Sánchez-Monedero, “An overview on olive mill wastes and their valorisation methods,” Waste Management, vol. 26, no. 9, pp. 960–969, 2006. [CrossRef]
- L. González-Martínez, D. Hernández, C. A. Astudillo, F. Silva A, and D. Gabriel, “Data extracted from olive oil mill waste exposed to ambient conditions,” Data Brief, vol. 26, Oct. 2019. [CrossRef]
- M. P. Maniscalco, M. Volpe, R. Volpe, and A. Messineo, “Promoting energy recovery from recalcitrant agro-industrial wastes through anaerobic digestion: A review on olive mill residues,” in AIP Conference Proceedings, American Institute of Physics Inc., Nov. 2018. [CrossRef]
- A. Serrano, F. G. Fermoso, G. Rodríguez-Gutierrez, J. Fernandez-Bolaños, and R. Borja, “Biomethanization of olive mill solid waste after phenols recovery through low-temperature thermal pre-treatment,” Waste Management, vol. 61, pp. 229–235, Mar. 2017. [CrossRef]
- R. Borja, B. Rincón, F. Raposo, J. Alba, and A. Martín, “A study of anaerobic digestibility of two-phases olive mill solid waste (OMSW) at mesophilic temperature,” Process Biochemistry, vol. 38, pp. 733–742, 2002, [Online]. Available: www.elsevier.com/locate/procbio.
- Rincón, F. Raposo, R. Borja, J. M. Gonzalez, M. C. Portillo, and C. Saiz-Jimenez, “Performance and microbial communities of a continuous stirred tank anaerobic reactor treating two-phases olive mill solid wastes at low organic loading rates,” J Biotechnol, vol. 121, no. 4, pp. 534–543, Feb. 2006. [CrossRef]
- Hernández, C. A. Astudillo, E. Fernández-Palacios, F. Cataldo, C. Tenreiro, and D. Gabriel, “Evolution of physical-chemical parameters, microbial diversity and VOC emissions of olive oil mill waste exposed to ambient conditions in open reservoirs,” Waste Management, vol. 79, pp. 501–509, Sep. 2018. [CrossRef]
- M. J. Fernández-Rodríguez, D. de la Lama-Calvente, A. Jiménez-Rodríguez, R. Borja, and B. Rincón, “Evolution of control parameters in biochemical methane potential tests of olive mill solid waste (OMSW), thermal pre-treated OMSW, and its co-digestion with Dunaliella salina,” J Appl Phycol, vol. 33, no. 1, pp. 419–429, Feb. 2021. [CrossRef]
- Hernández, H. Quinteros-Lama, C. Tenreiro, and D. Gabriel, “Assessing concentration changes of odorant compounds in the thermal-mechanical drying phase of sediment-likewastes from olive oil extraction,” Applied Sciences (Switzerland), vol. 9, no. 3, Feb. 2019. [CrossRef]
- A. De Castro, E. Asencio, V. Ruiz-Méndez, C. Romero, and M. Brenes, “Production of 4-ethylphenol in alperujo by Lactobacillus pentosus,” J Sci Food Agric, vol. 95, no. 11, pp. 2222–2227, 2014. [CrossRef]
- Y. Nagata, “Measurement of Odor Threshold by Triangle Odor Bag Method,” Environmental Science, pp. 118–127, 2003.
Figure 1.
Pomace oil production process.
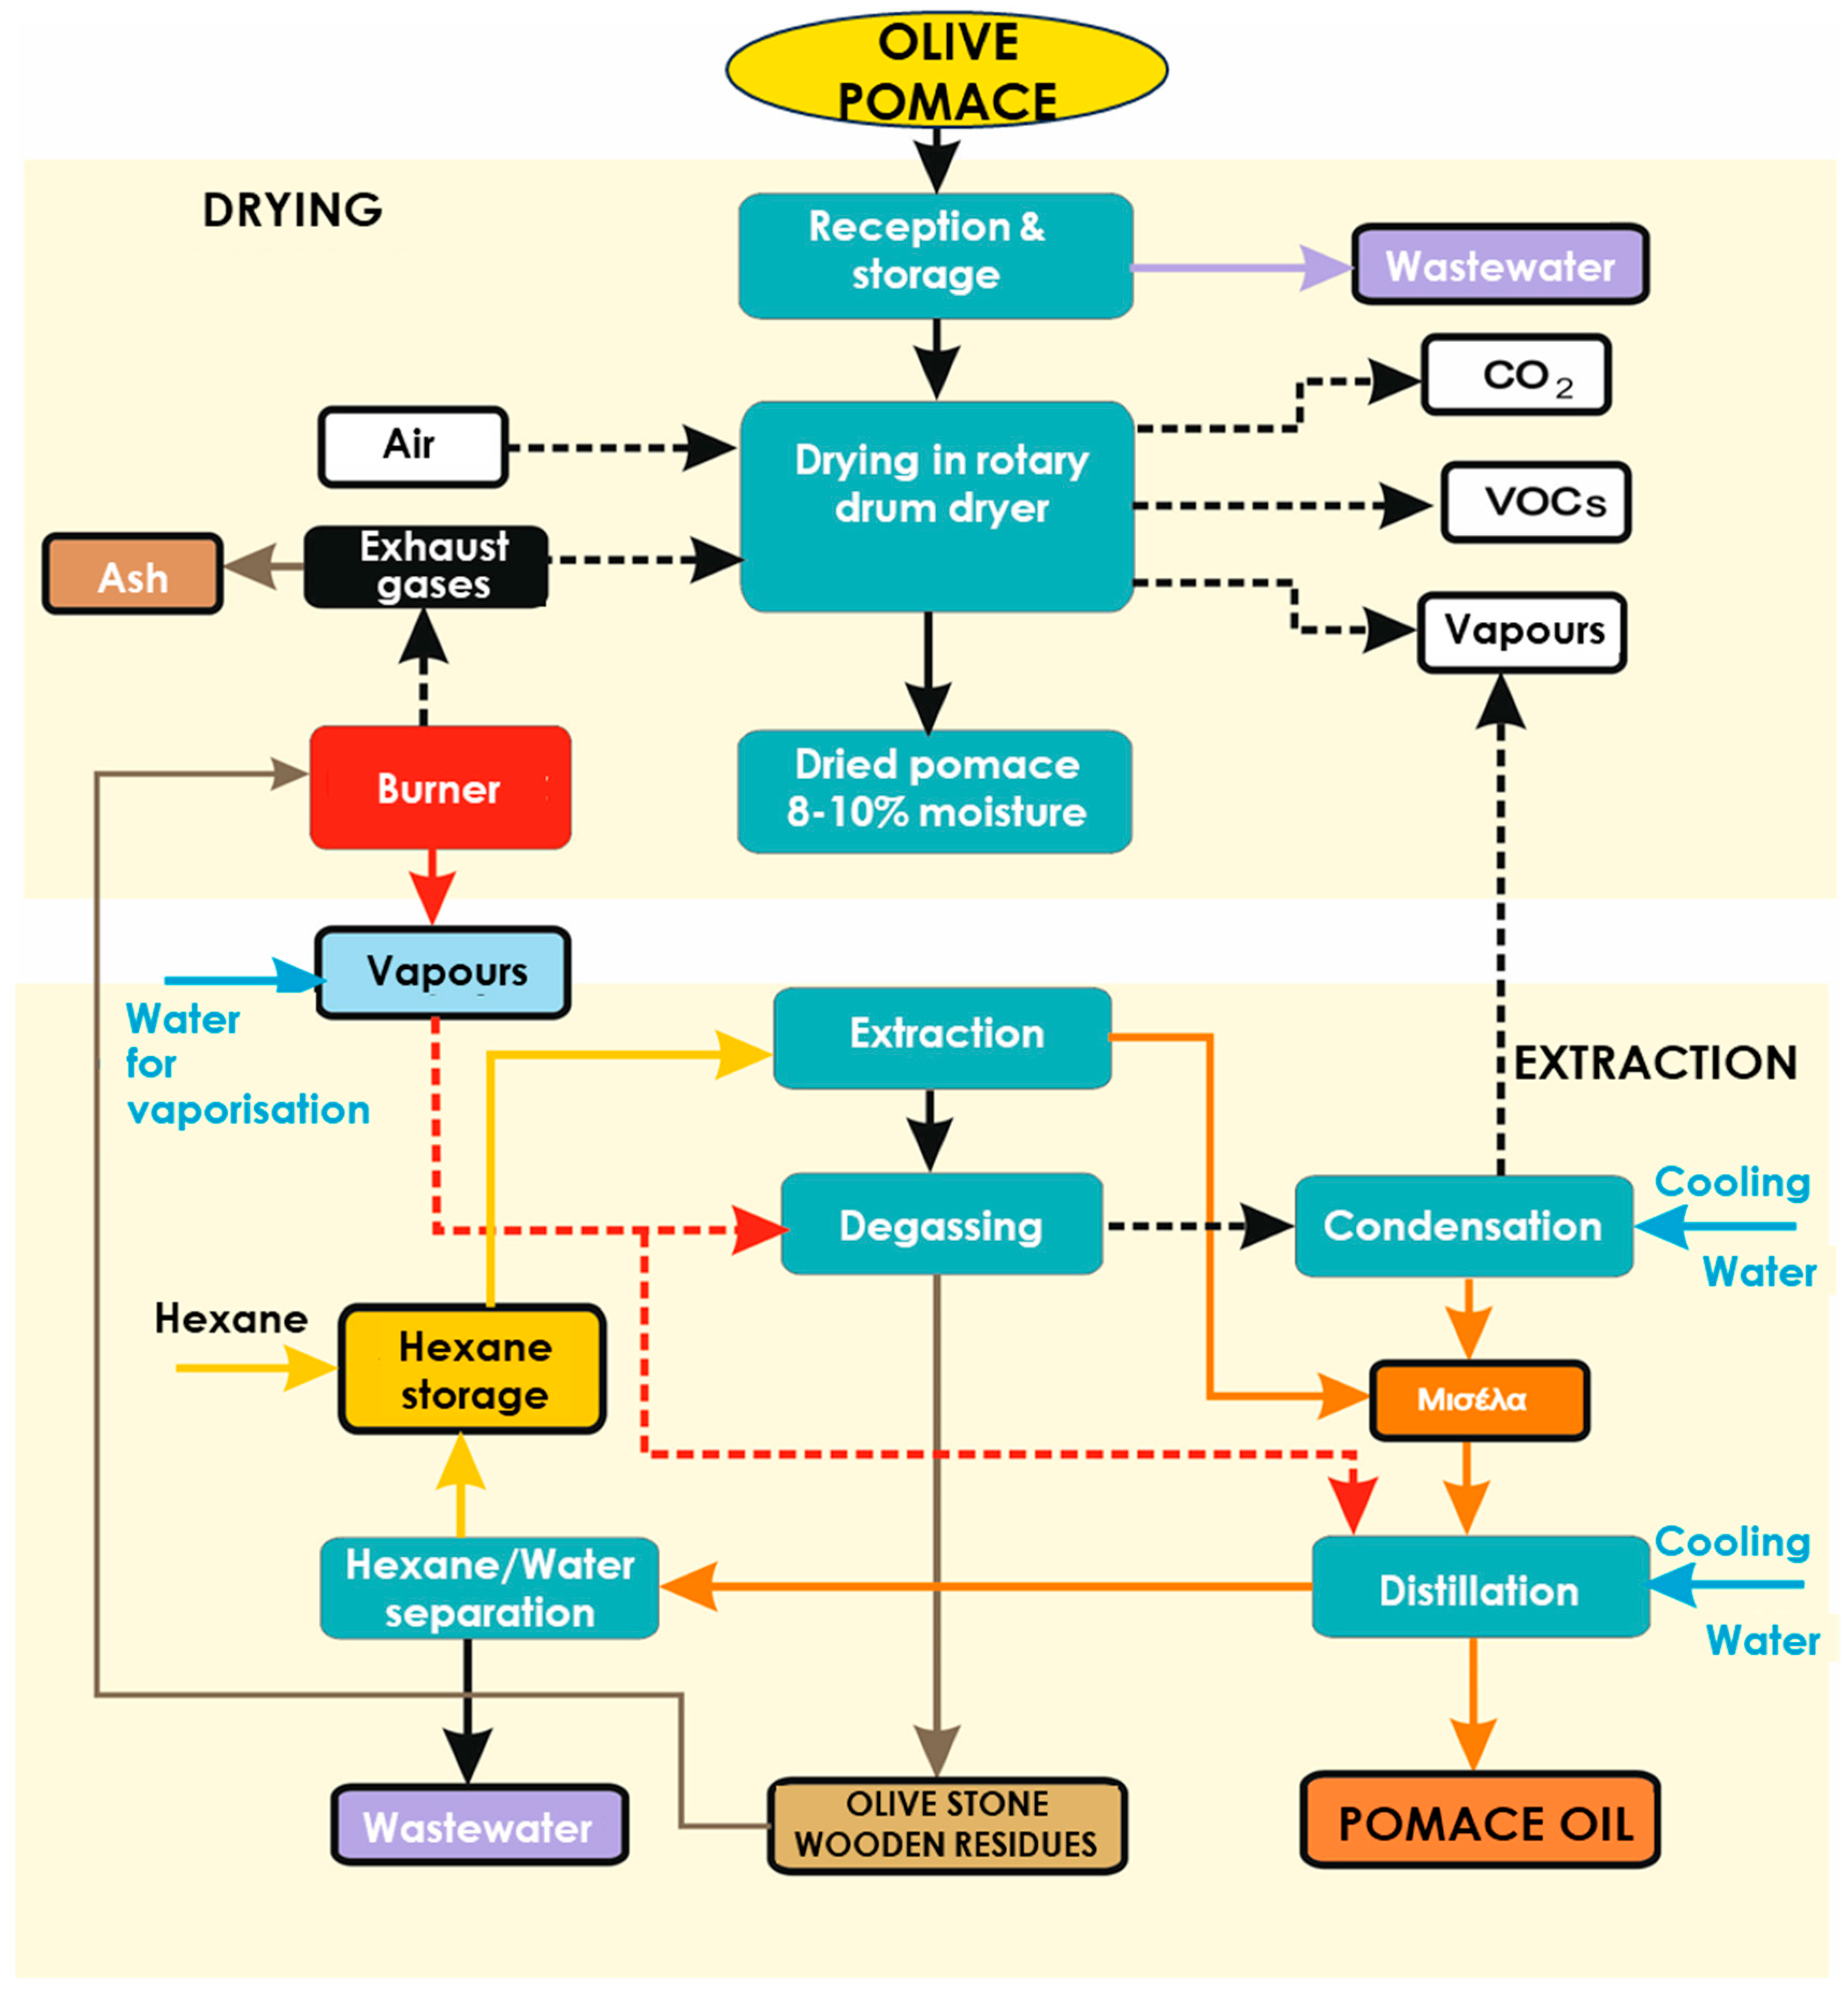
Figure 2.
Simplified flow diagram of the sampling points in the value chain of pomace oil

Figure 3.
Particle size distribution of different olive pomace samples.
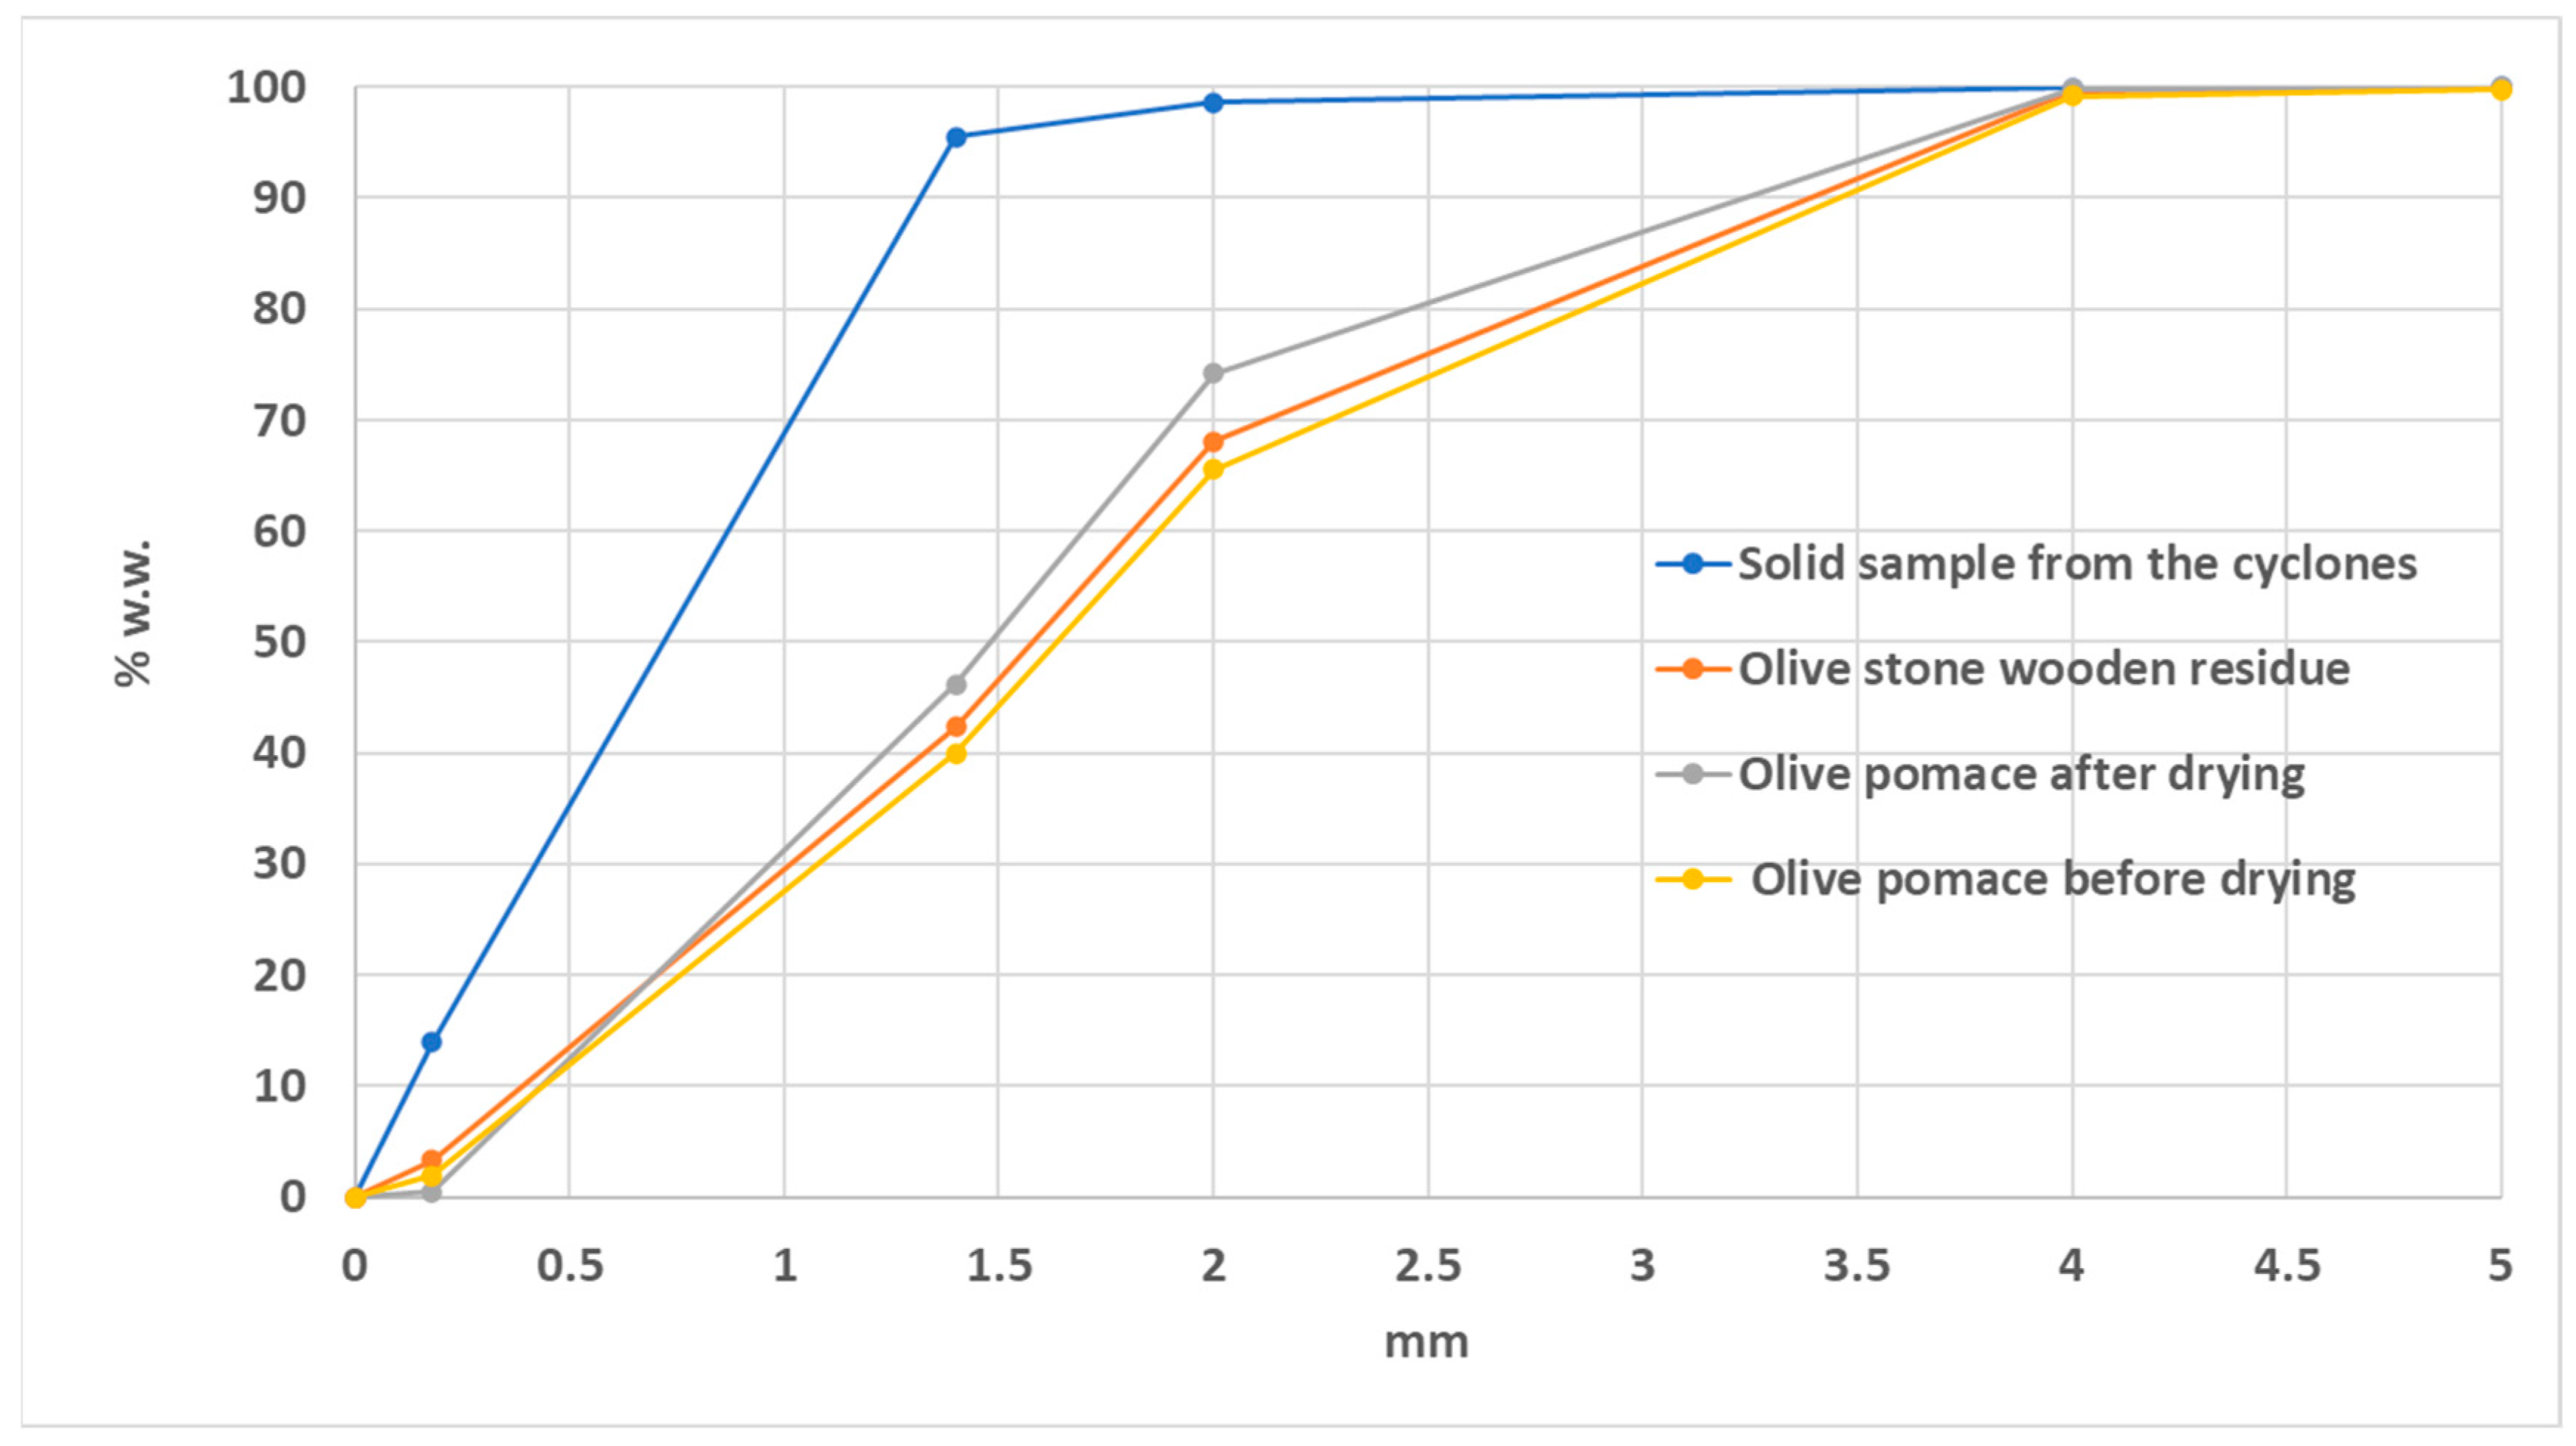
Figure 4.
Schematic illustration of the results of X-ray diffraction of the samples.
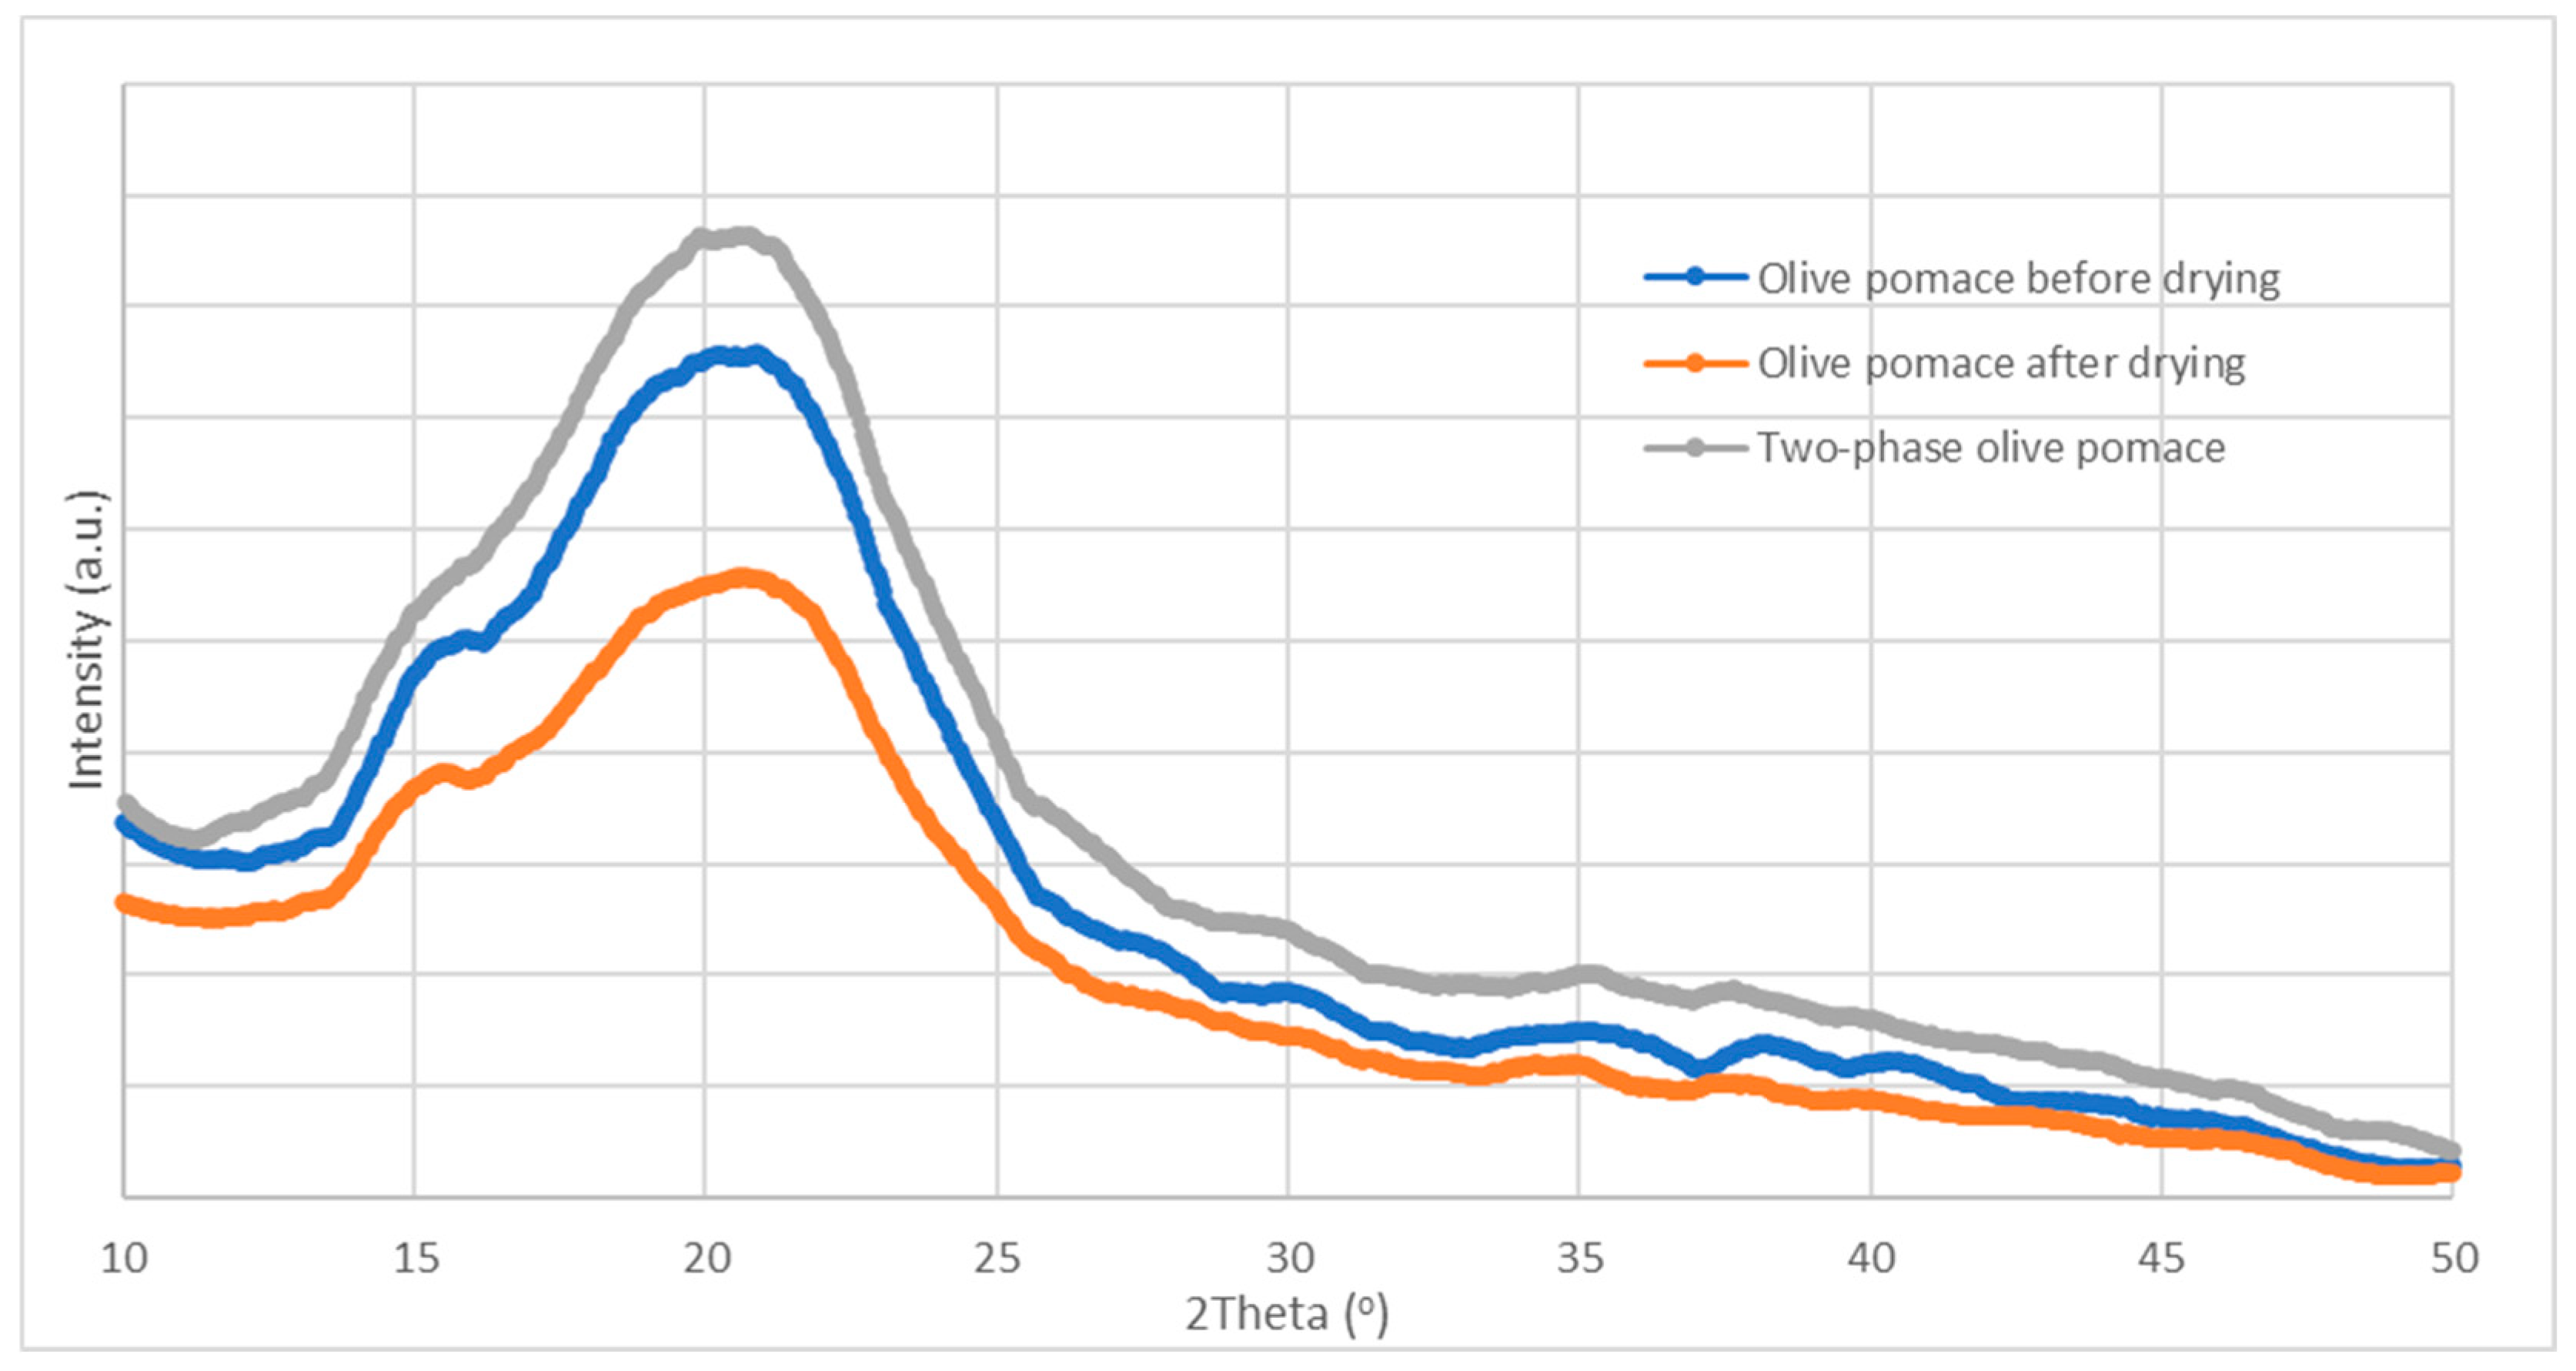
Figure 51.
Thermogravimetric analysis of the dry olive pomace samples in a nitrogen environment.
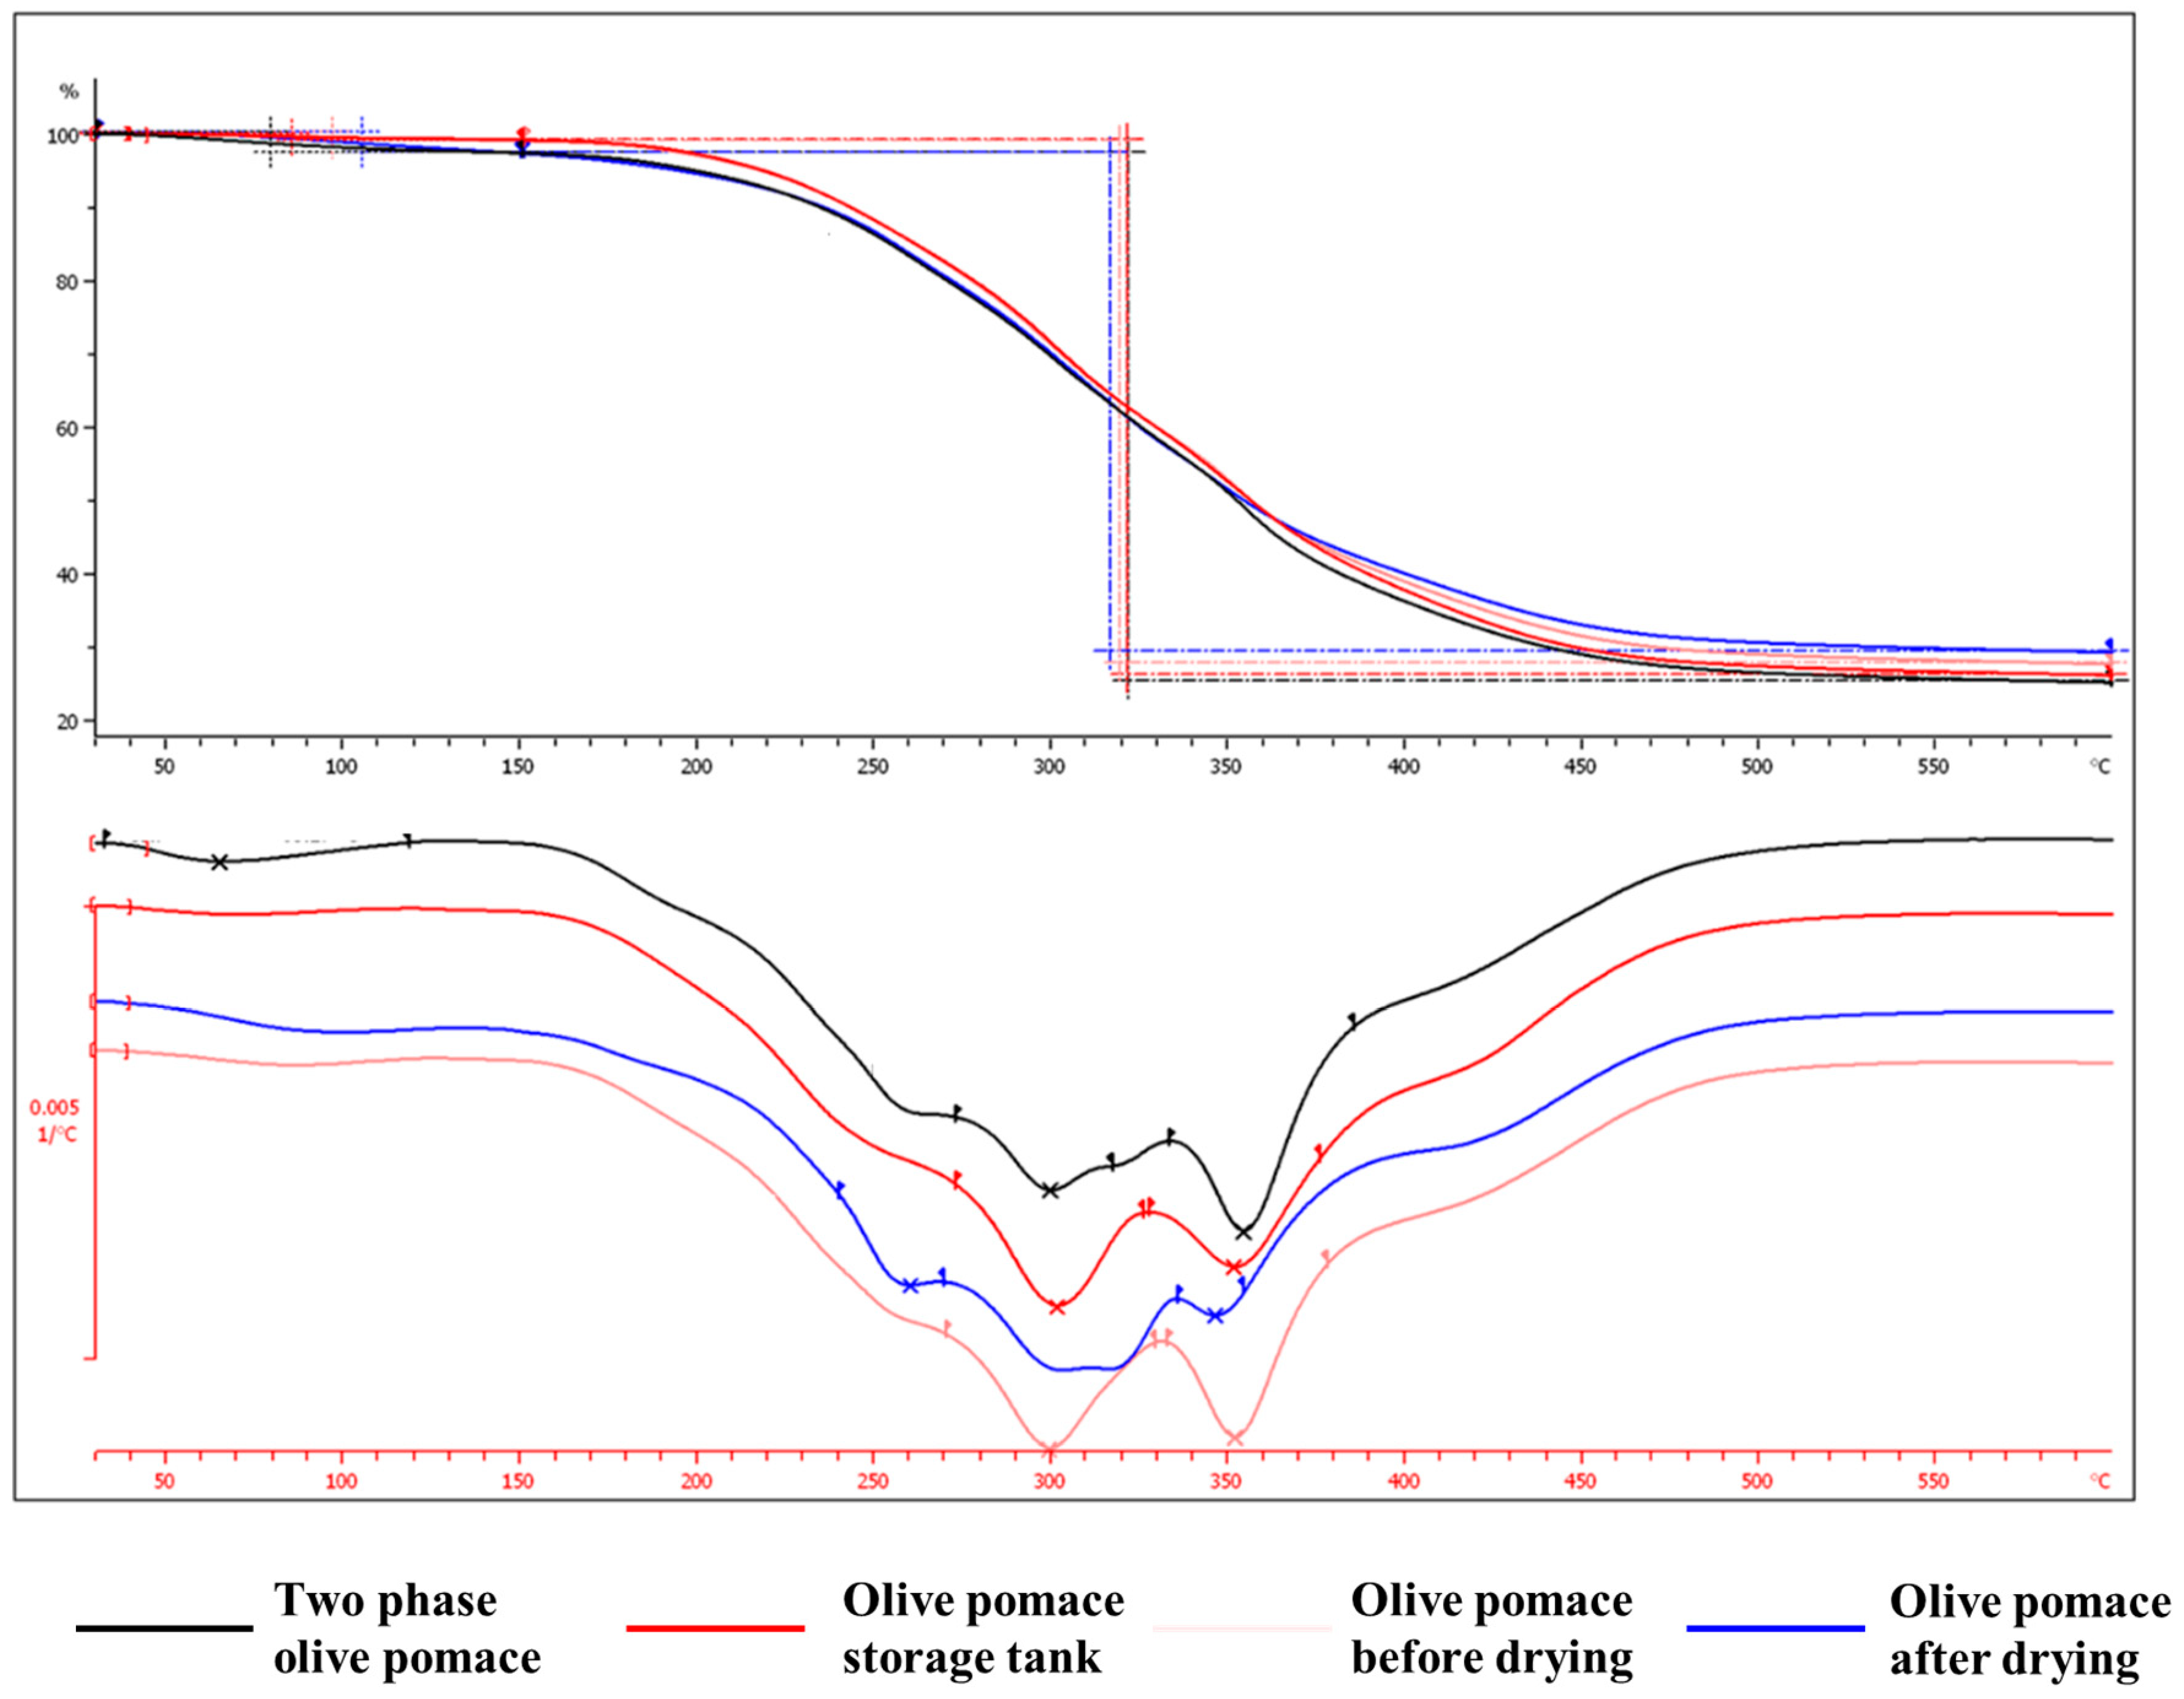
Figure 6.
Thermogravimetric analysis of the fresh olive pomace samples in an air environment.
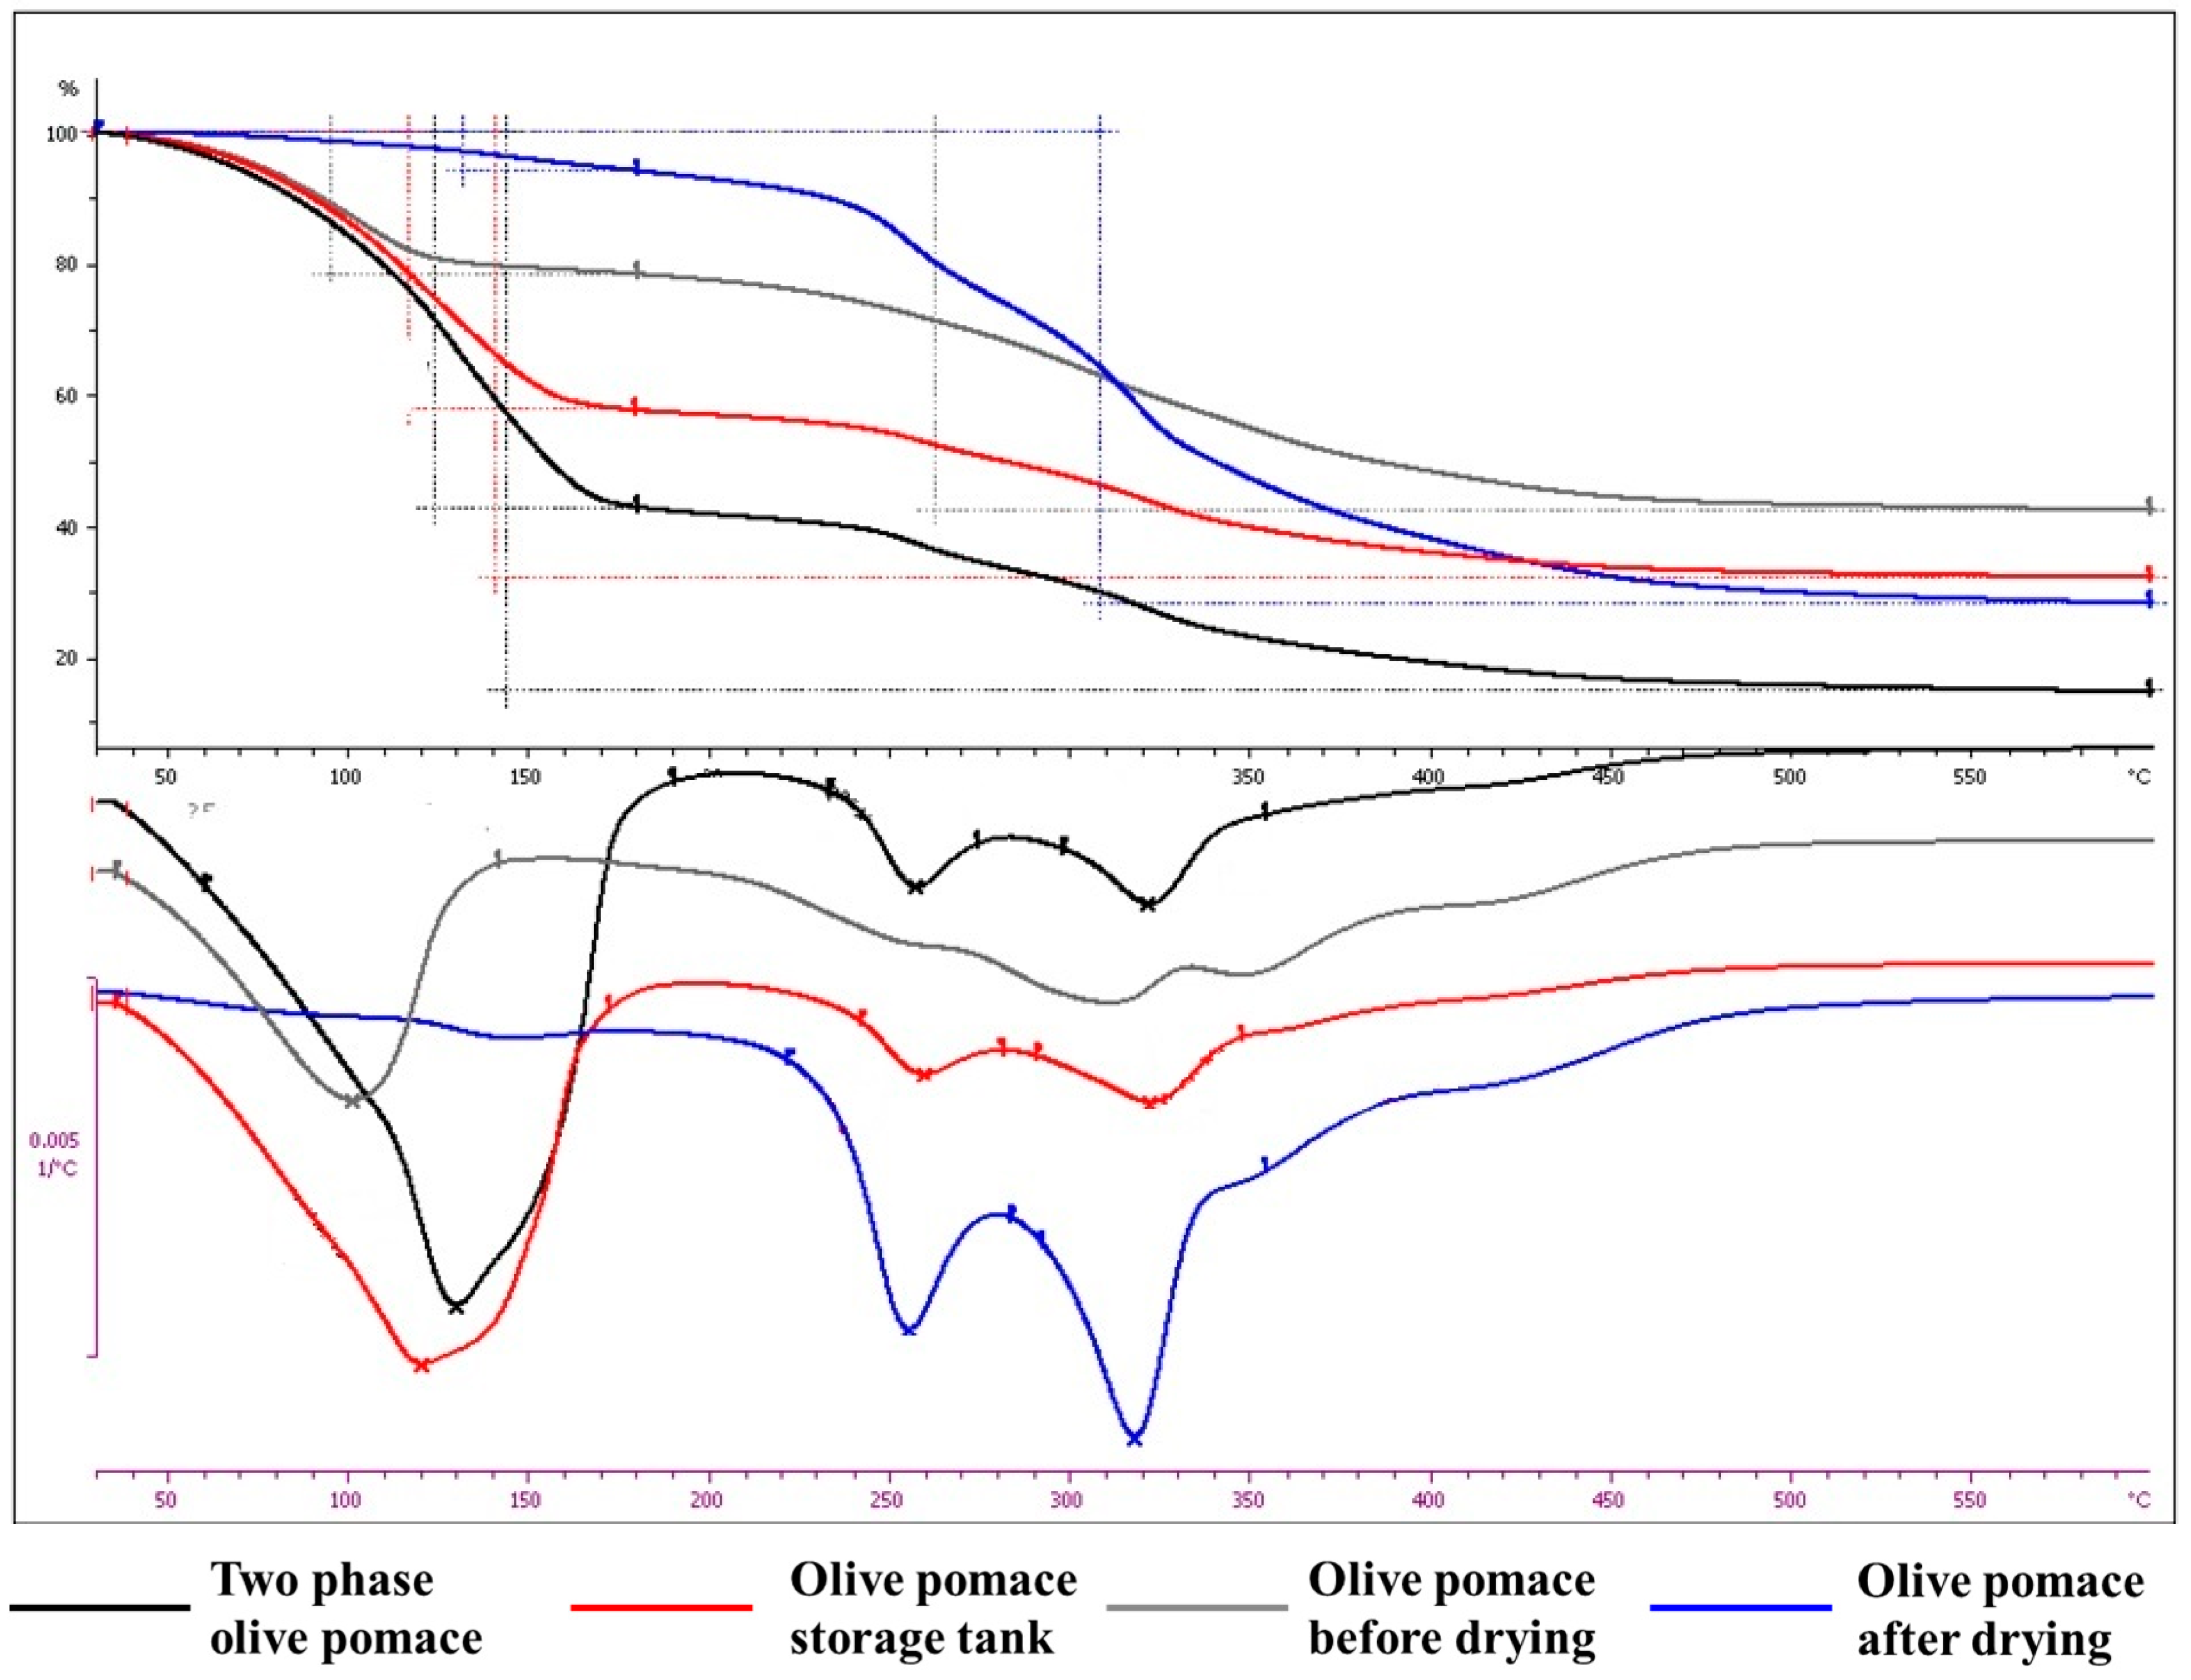
Figure 7.
Absorption spectra of the olive pomace samples.
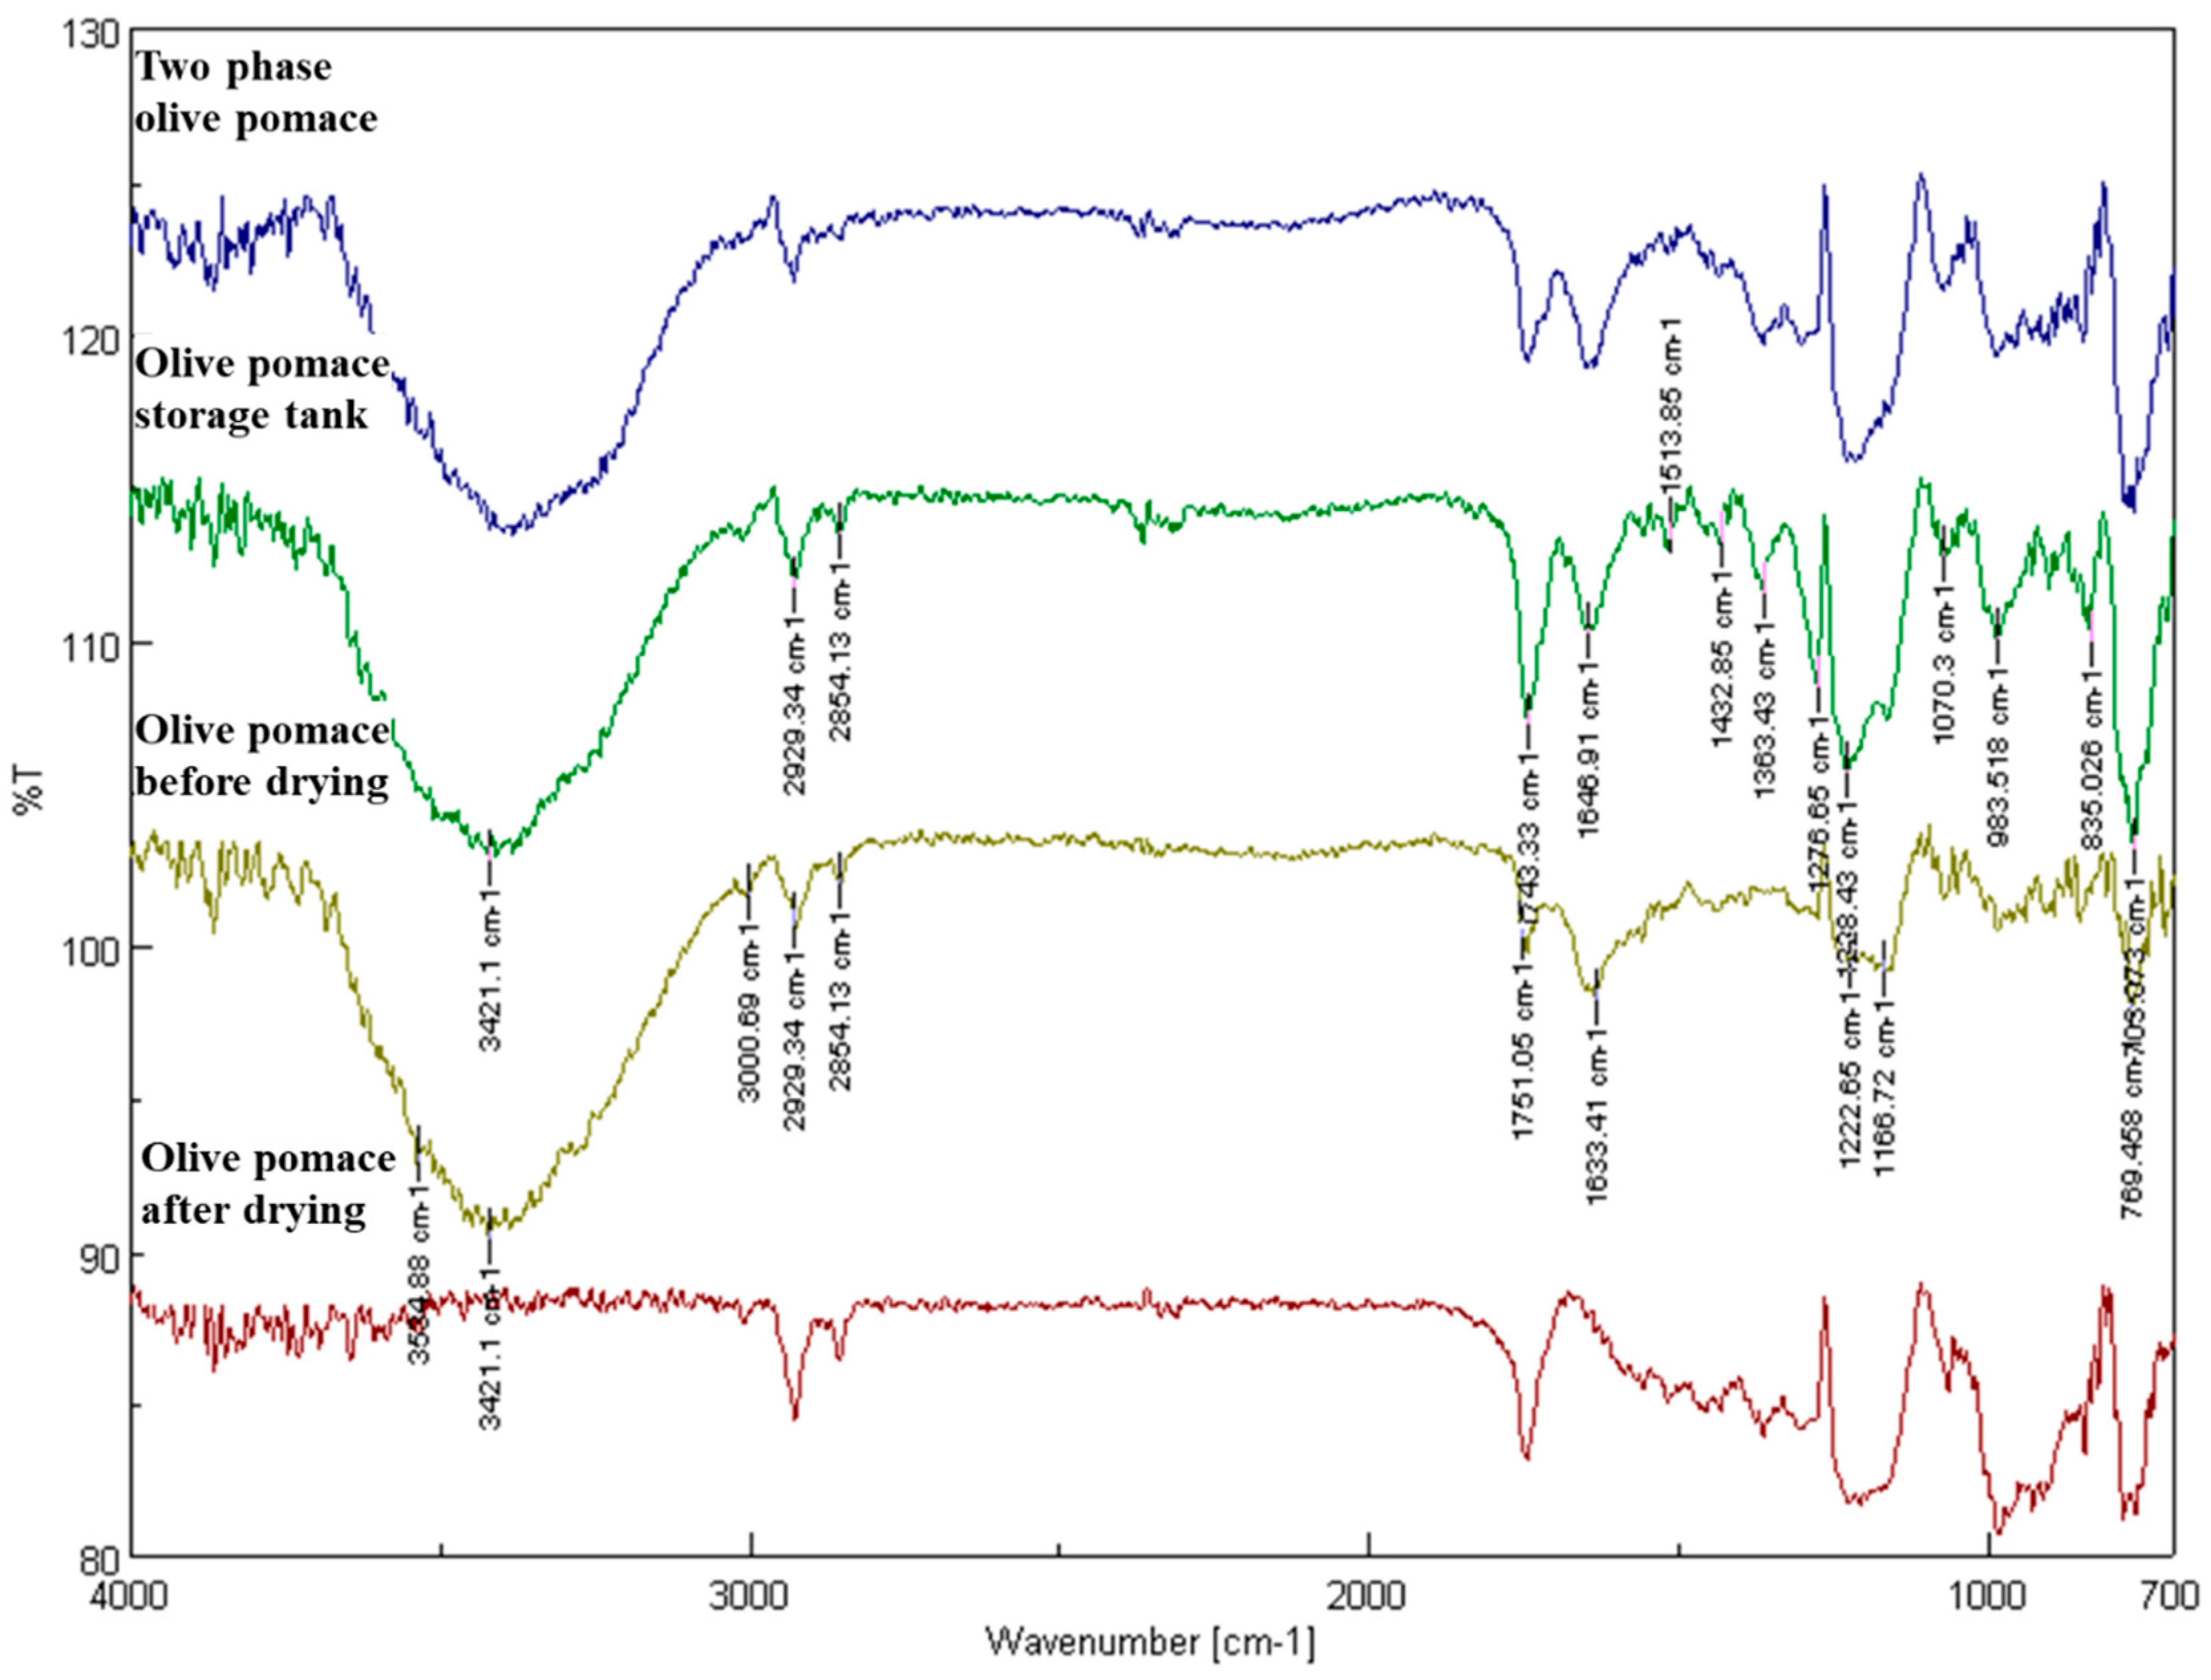
Figure 82.
Absorption spectra of the oil content of the olive pomace samples.
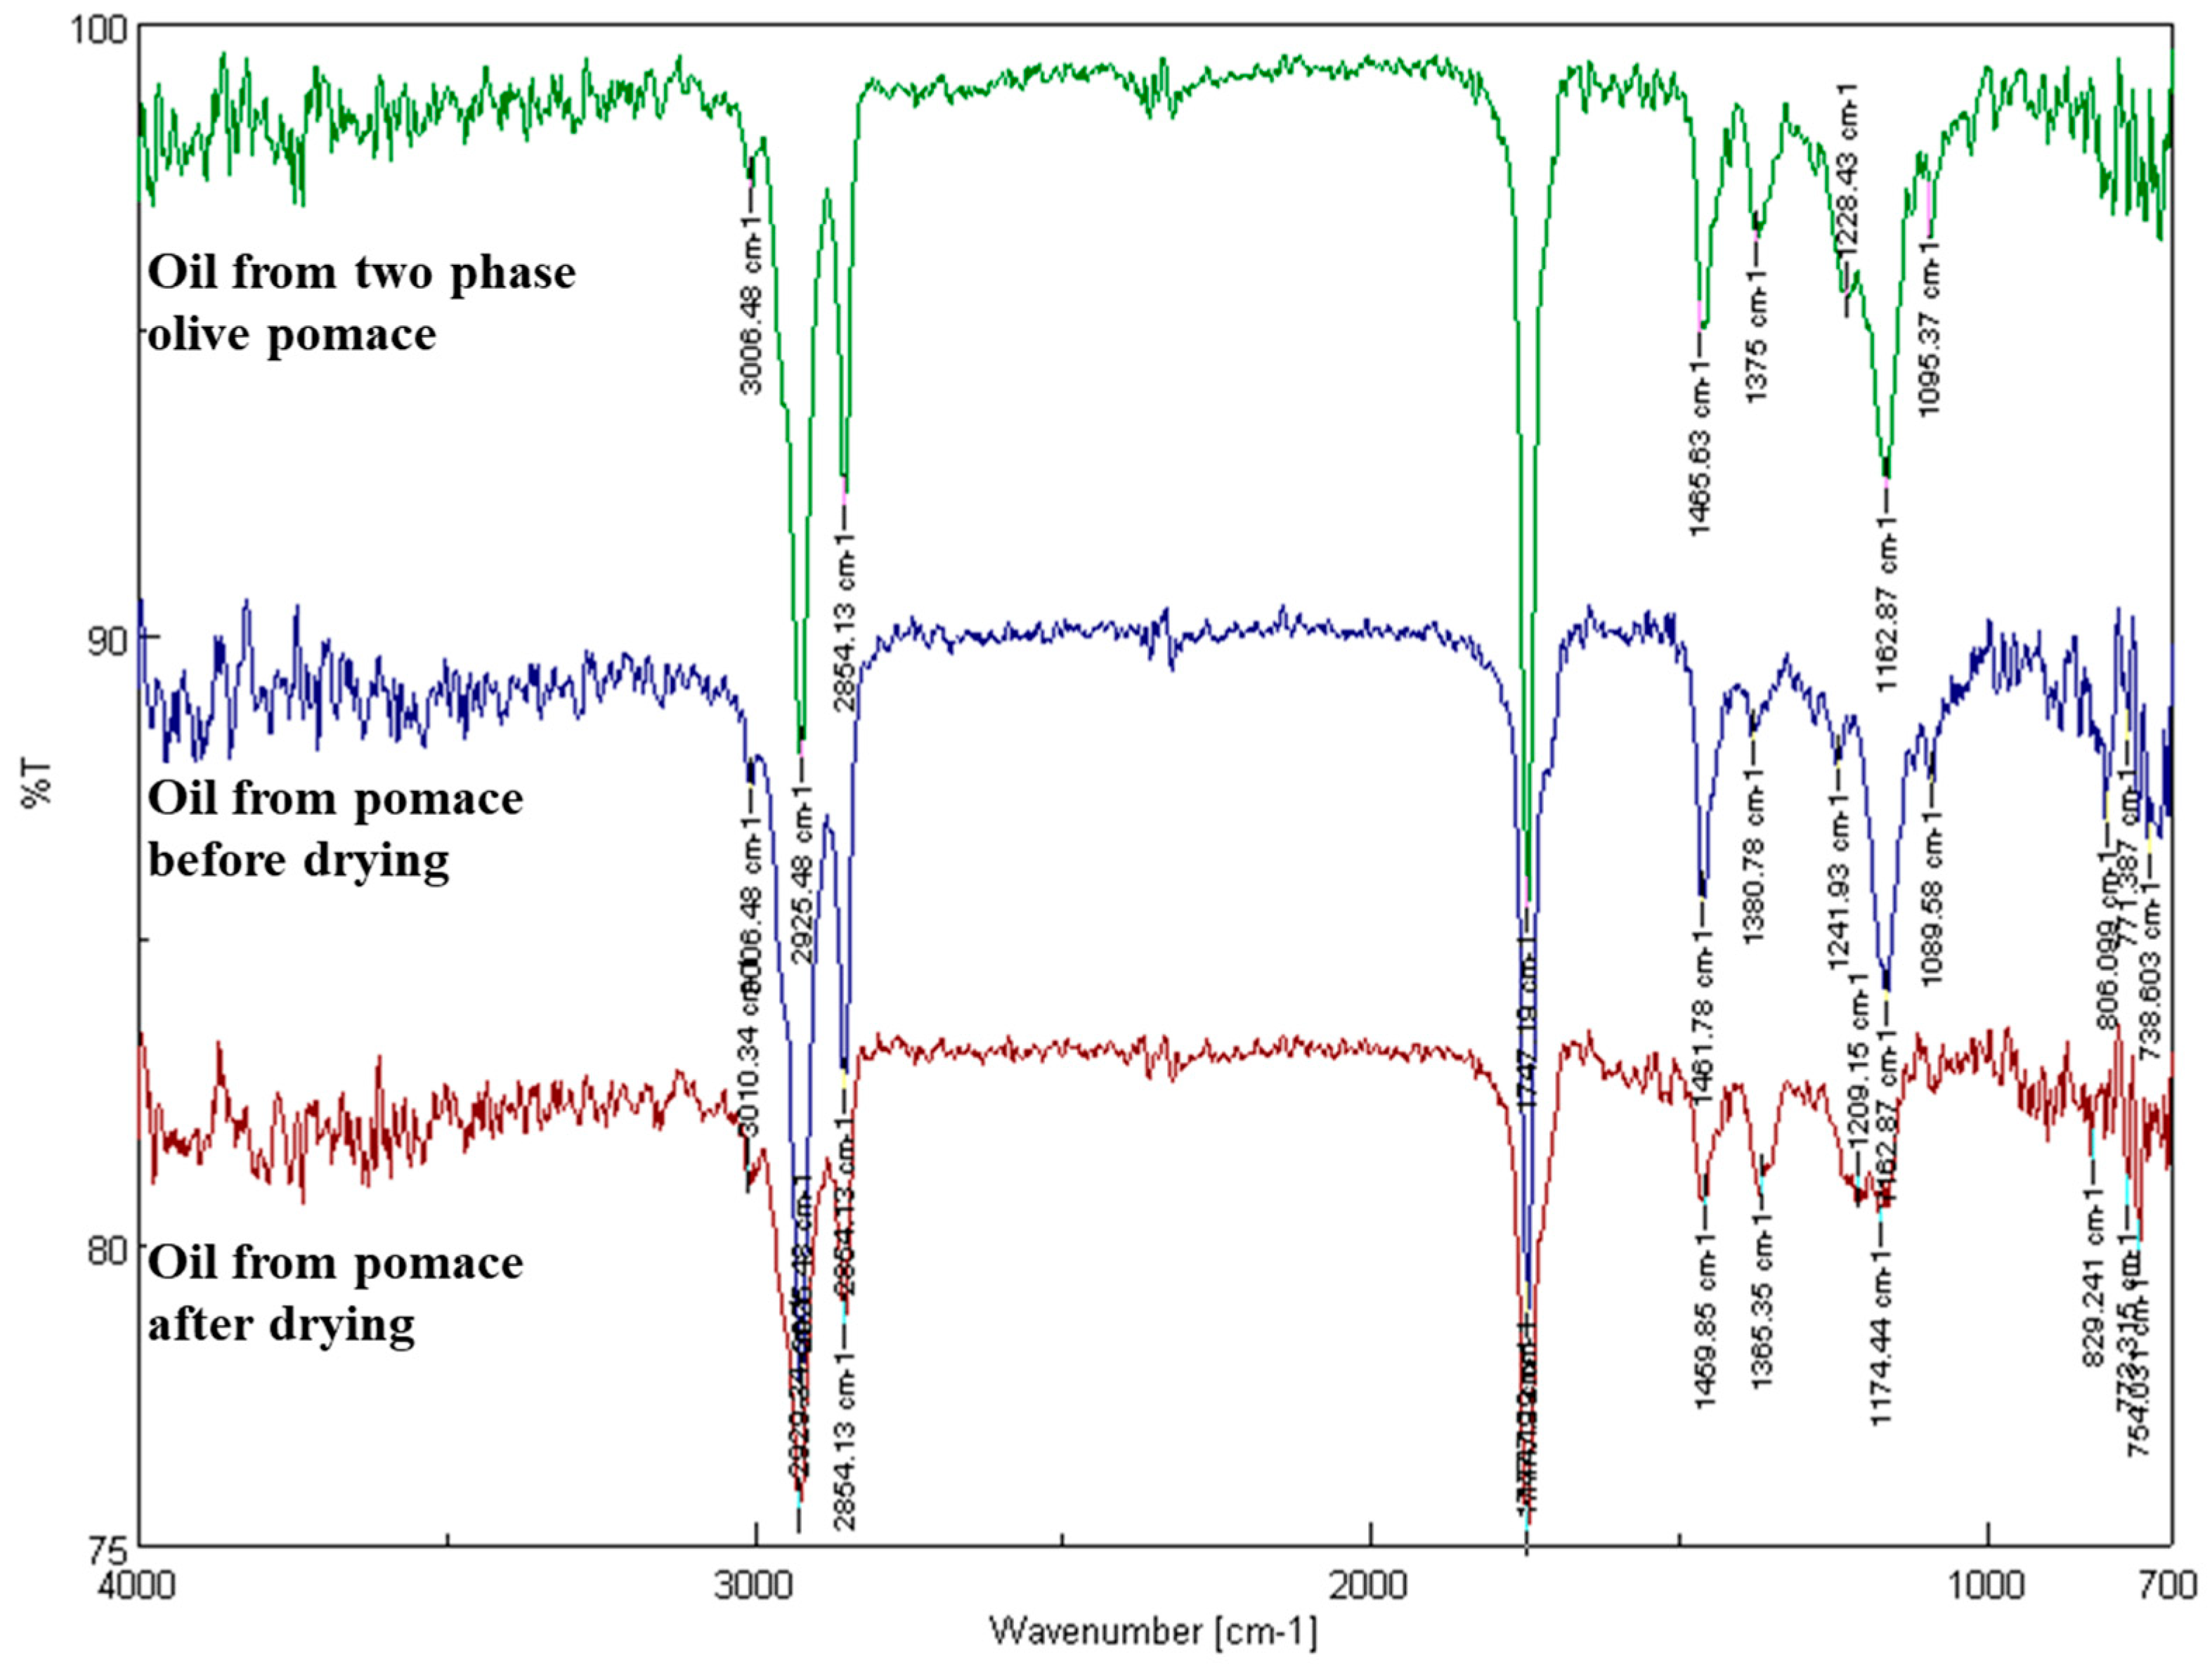
Figure 9.
Spectrum of the oil samples in FTIR.
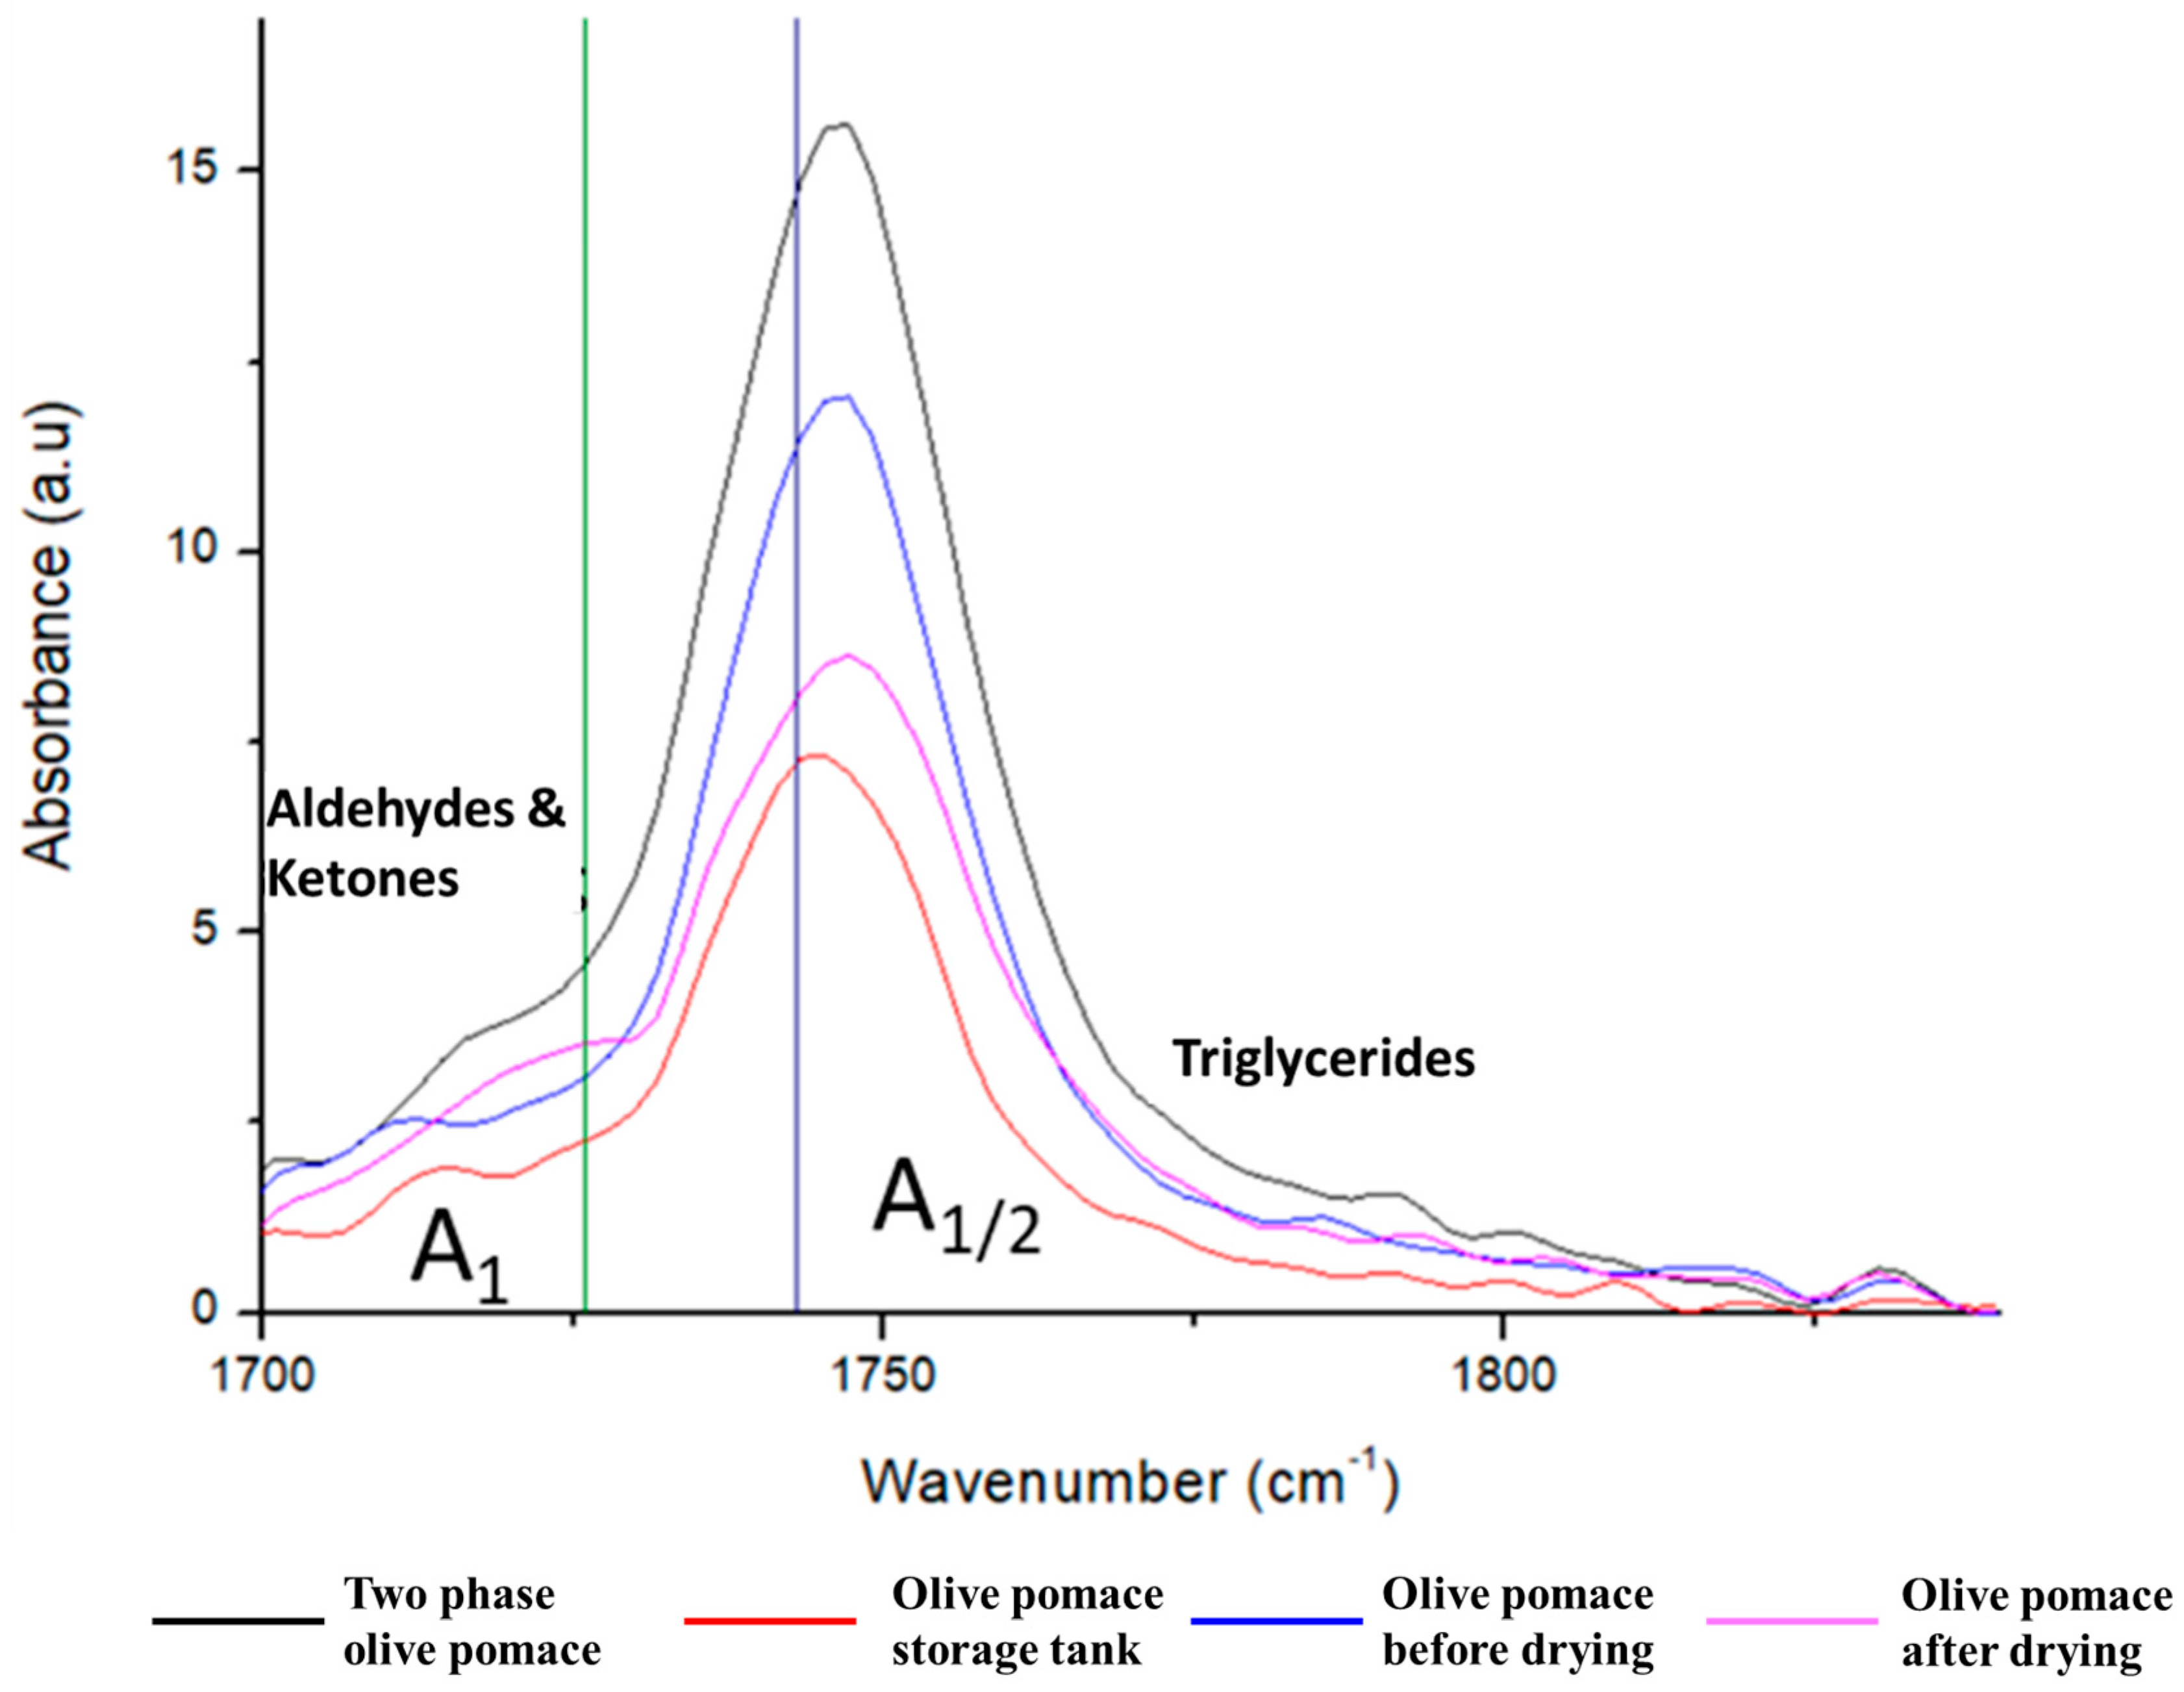
Figure 10.
Chromatograms of oil samples from fresh two-phase olive pomace, olive pomace from the storage tank, olive pomace before and after drying.
Figure 10.
Chromatograms of oil samples from fresh two-phase olive pomace, olive pomace from the storage tank, olive pomace before and after drying.
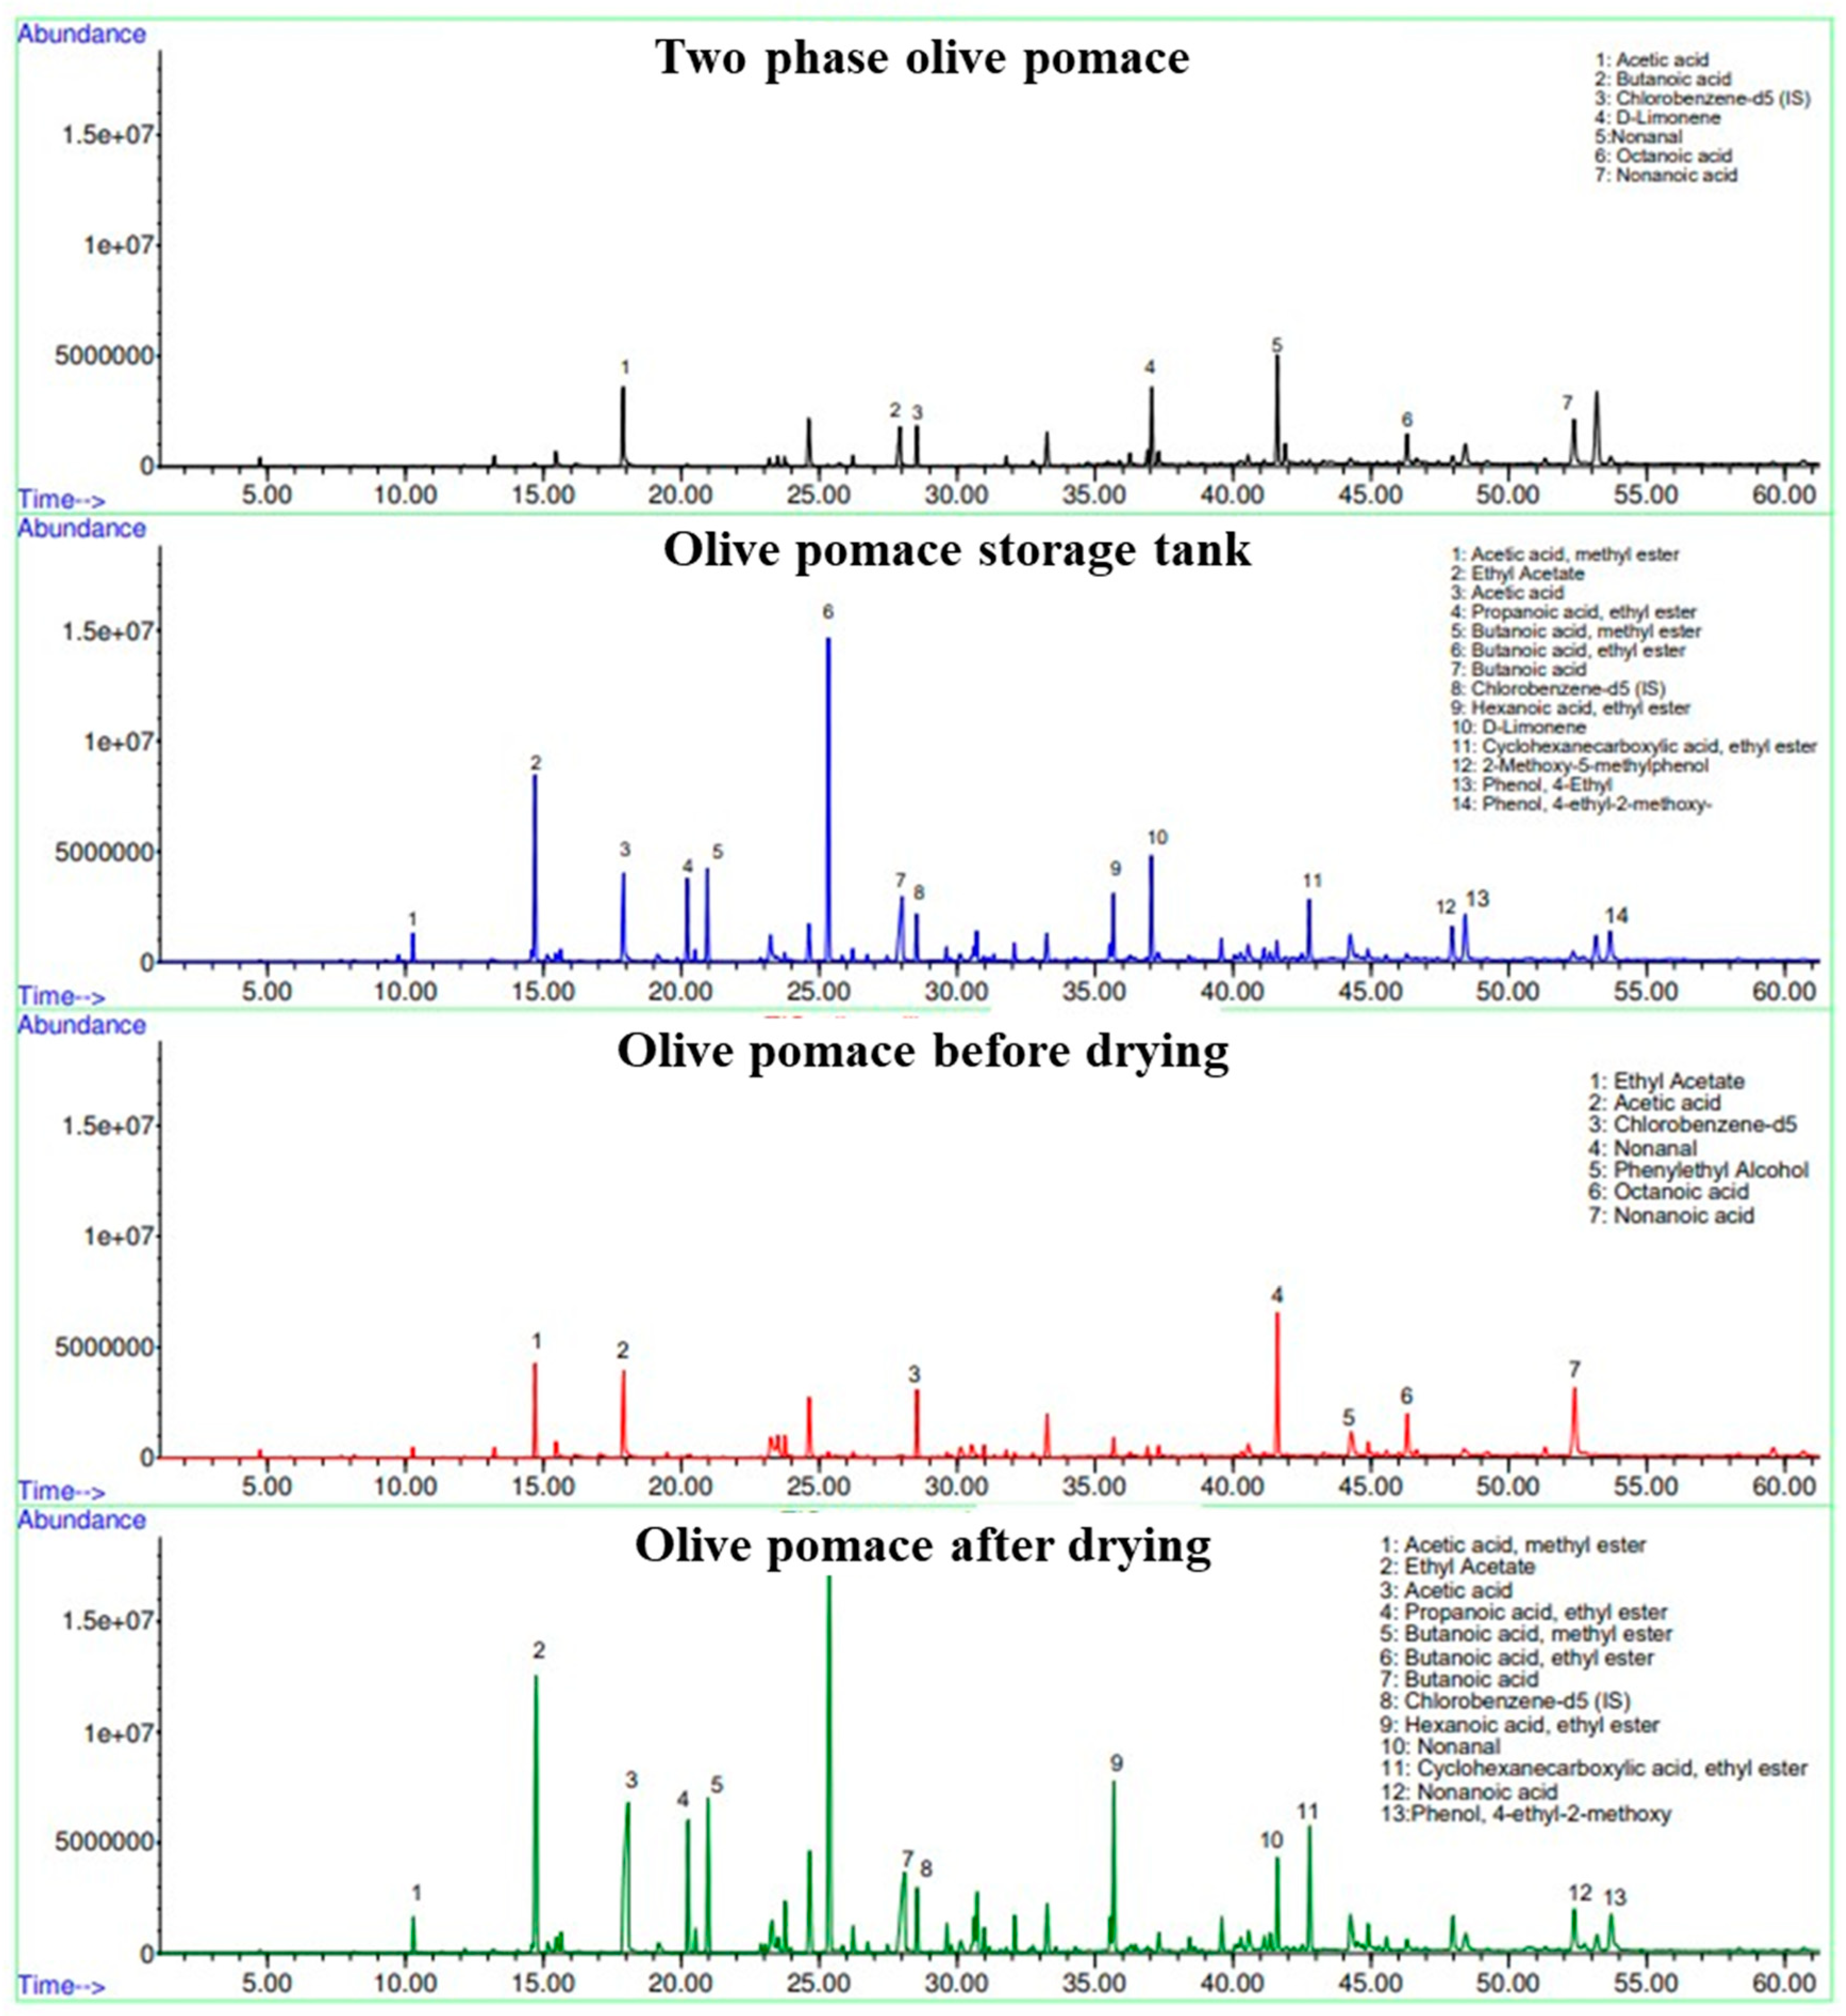

Table 1.
Two-phase olive pomace characterization
| Parameter | Sample 1 | Sample 2 | Sample 3 | Sample 4 | Sample 5 | Mean values | Literature [16,17,18,19,20,21,22,23,24,25,26,27] |
|---|---|---|---|---|---|---|---|
| pH | 4.71±0.02 | 4.77±0.06 | 4.55±0.05 | 4.67±0.05 | 4.81±0.06 | 4.70±0.05 | 5.78±1.05 |
| Conductivity (μS /cm) |
1425±5 | 2417±9 | 3251±75 | 1368 0±2020 | 2686±101 | 4692±441 | 3220±2020 |
| Moisture (% w.b.) |
63.68±1.52 | 62.36±2.32 | 71.92±0.59 | 60.36±0.10 | 68.34±0.11 | 65.33±0.93 | na* |
| Total solids, TS (% w.b.) | 36.33±1.52 | 37.64±2.32 | 28.08±0.59 | 39.64±0.10 | 31.66±0.11 | 34.67±0.93 | 36.75±13.65 |
| Volatile solids, VS (% TS) | 99.02±1.26 | 99.32±0.13 | 98.66±0.01 | 97 .25±1 .15 | 99 .25±1.01 | 99.00±0.07 | 83.25±4.15 |
| Composition of the solid phase (% d.b.) | |||||||
| Water soluble solids | 20.69±0.16 | 24.18±1.58 | 20.47±3.28 | 15.89±1.18 | 14.66±1.79 | 19.18±1.6 | na* |
| Cellulose | 5.46±1.18 | 6.01±0.83 | 14.06±0.68 | 8.93±0.58 | 8.96±0.23 | 8.68±0.7 | 24.65±12.55 |
| Hemicellulose | 27.33±0.29 | 26.96±0.29 | 17.96±0.29 | 27.50±2.13 | 29.75±1.13 | 26.43±0.96 | 27.40±15.20 |
| Acid insoluble residue | 43.07±2.92 | 44.6±1.15 | 38.88±1.74 | 42.42±2.19 | 47.64±1.6 | 43.32±2.11 | 36.10 ±16.30 |
| Soluble lignin | 1.33±0.17 | 0.94±0.06 | 1.63±0.12 | 0.94±0.08 | 0.9±0.05 | 1.15±0.11 | na* |
| Total Nitrogen | 0.94±0.07 | 0.84±0.16 | 1.1±0.21 | 0.89±0. 06 | 0.89±0.34 | 0.96±0.15 | 1.56±0.49 |
| Oil | 9.77±0.54 | 15.05±0.62 | 15.6±0.75 | 1 3.71±0.45 | 14.49±0.61 | 13.72±0.64 | 11.95±7.85 |
* na: not available
Table 2.
Composition of samples at different points in the production line of pomace oil.
| Parameter | Two phase olive pomace (Point 1) |
Olive pomace storage tank (Point 2) |
Olive pomace before drying (Point 3) | Olive pomace after drying (Point 4) |
|---|---|---|---|---|
| pH | 4.67±0.05 | 4.81±0.06 | 4.71±0.03 | 4.87 ± 0.06 |
| Conductivity (μS /cm) |
13680±2020 | 2686±101 | 2425±51 | 2477 ± 91 |
| Moisture (% w.b.) |
60.36±0.10 | 68.34±0.11 | 45.07±0.37 | 5.24 ± 0.12 |
| Total solids, TS (% w.b.) | 39.64±0.10 | 31.66±0.11 | 54.93±0.37 | 94.76 ± 0.12 |
| Volatile solids, VS (% TS) |
97.25±1.15 | 99.25±1.01 | 99.43±0.17 | 99.47 ± 0.02 |
| Composition of the solid phase (% d.b.) | ||||
| Water soluble solids | 15.89±1.18 | 14.66±1.79 | 12.61±1.47 | 20.23 ± 0.20 |
| Cellulose | 8.93±0.58 | 8.96±0.23 | 9.14±0.23 | 6.67 ± 0.02 |
| Hemicellulose | 27.50±2.13 | 29.75±1.13 | 27.09±3.63 | 20.78 ± 1.03 |
| Acid insoluble residue | 42.42±2.19 | 47.64±1.6 | 47.15±1.56 | 46.73 ± 5.95 |
| Soluble lignin | 0.94±0.08 | 0.9±0.05 | 0.99±0.18 | 1.56 ± 0.09 |
| Total Nitrogen | 0.89±0.06 | 0.89±0.34 | 0.91±0.14 | 1.05 ± 0.16 |
| Oil | 13.71±0.45 | 14.49±0.61 | 12.17±0.65 | 14.00 ± 0.52 |
Table 3.
Thermogravimetric analysis results of olive pomace samples.
| Weight loss (%) | |||||||
|---|---|---|---|---|---|---|---|
| Dried under nitrogen flow | ‘As received’ under air flow | ||||||
| Moisture (%) |
30 – 150 oC |
150 - 600 oC | 30-600 oC | 30-180 oC | 180-600 oC | 30-600 oC |
|
| Two phase olive pomace | 59.38 | 2.67 | 72.24 | 74.91 | 57.33 | 28.14 | 85.47 |
| Olive pomace storage tank | 65.05 | 0.86 | 73.07 | 73.93 | 42.51 | 24.47 | 67.98 |
| Olive pomace before drying | 39.97 | 0.98 | 71.43 | 72.41 | 21.72 | 36.01 | 57.73 |
| Olive pomace after drying | 6.36 | 2.72 | 68.06 | 70.78 | 5.99 | 66 | 71.99 |
Table 4.
The ratio A1/(A1/2) corresponding to the aldehydes and ketones contents of the olive pomace samples.
Table 4.
The ratio A1/(A1/2) corresponding to the aldehydes and ketones contents of the olive pomace samples.
| Two phase olive pomace | Olive pomace storage tank | Olive pomace before drying | Olive pomace after drying | |
|---|---|---|---|---|
| A1 /A1/2 | 0.12 | 0.16 | 0.13 | 0.23 |
Table 5.
Free acidity, coefficients K232 and K270 of oil samples from fresh two-phase olive pomace, olive pomace from the storage tank, olive pomace before and after drying and from virgin and extra virgin olive oil.
Table 5.
Free acidity, coefficients K232 and K270 of oil samples from fresh two-phase olive pomace, olive pomace from the storage tank, olive pomace before and after drying and from virgin and extra virgin olive oil.
| Free acidity | K232 | K270 | ||||
|---|---|---|---|---|---|---|
| % | a.u. | a.u. | ||||
| Two-phase olive pomace | 3.69 ± 0.21 | 0.835 | 1.275 | |||
| Olive pomace storage tank | 7.60 ± 0.10 | 1,126 | 1.591 | |||
| Olive pomace before drying | 7.96 ± 0.14 | 1,093 | 1.644 | |||
| Olive pomace after drying | 8.88 ± 0.12 | 1.103 | 1.538 | |||
| % | Limit | a.u. | Limit | a.u. | Limit | |
| Virgin | 1.41 | <2 | 0.343 | <2.5 | 0.510 | <0.25 |
| ExtraVirgin | 0.42 | <0.8 | 0.352 | <2.6 | 0.447 | <0.22 |
Table 6.
Headspace HiSorb TD-GC-MS analysis results of volatile substances of oil samples from fresh two-phase olive pomace, olive pomace from the storage tank, olive pomace before and after drying and odour thresholds [28,30].
| Ret. time (min) | Ingredient | Odor Threshold (ppb) | Two-phase olive pomace (ppb) |
Olive pomace storage tank (ppb) | Olive pomace before drying (ppb) | Olive pomace after drying (ppb) | |
|---|---|---|---|---|---|---|---|
| 14,69 | Ethyl Acetate | 870 | 261 | 1084 | 811 | 12 | |
| 17,892 | Acetic acid | 60 | 330 | 1173 | 492 | 478 | |
| 20,22 | Propanoic acid, ethyl ester | Fruity | 7 | 4 | 399 | 334 | 9 |
| 20,943 | Butanoic acid, methyl ester | 2 | 461 | 377 | 3 | ||
| 25,32 | Butanoic acid, ethyl ester | fruity | 0.04 | 14 | 1759 | 1558 | 7 |
| 27,898 | Butanoic acid | 0.19 | 4 | 633 | 558 | 265 | |
| 35,663 | Hexanoic acid, ethyl ester | Apple, fruity, sweetish, aniseed | 57 | 485 | 253 | 0 | |
| 37,053 | D-Limonene | 38 | 0 | 0 | 464 | 386 | |
| 48,428 | Phenol, 2-ethyl | 0 | 103 | 319 | 187 | ||
| 42,79 | Cyclohexanecarboxylic acid, ethyl ester | 0 | 430 | 286 | 20 | ||
| 53,707 | Phenol, 4-ethyl-2-methoxy | Smoky, gammon-like | 0 | 181 | 208 | 60 | |
| 47,969 | 2-Methoxy-5-methylphenol | 0 | 150 | 206 | 57 |
Disclaimer/Publisher’s Note: The statements, opinions and data contained in all publications are solely those of the individual author(s) and contributor(s) and not of MDPI and/or the editor(s). MDPI and/or the editor(s) disclaim responsibility for any injury to people or property resulting from any ideas, methods, instructions or products referred to in the content. |
© 2023 by the authors. Licensee MDPI, Basel, Switzerland. This article is an open access article distributed under the terms and conditions of the Creative Commons Attribution (CC BY) license (http://creativecommons.org/licenses/by/4.0/).
Copyright: This open access article is published under a Creative Commons CC BY 4.0 license, which permit the free download, distribution, and reuse, provided that the author and preprint are cited in any reuse.


