

Submitted:
10 November 2023
Posted:
13 November 2023
You are already at the latest version
Abstract
(1) The main purpose of this article is to analyse the relationship between risk factors and the benefits of Information Technology Outsourcing (ITO). For this purpose, a structural model was created to determine the dependency of the benefits on the importance of the risk factors associated with this service. (2) The research methodology included: a literature review, descriptive analysis, and empirical and formal methods. A survey questionnaire was used to collect data, and structural equation methodology was used to build and verify hypotheses. The structural model was tested on data from business practice - 200 large organizations, mostly enterprises, operating in Poland and using IT outsourcing. (3) The purpose was accomplished by determining the relationship between the IT outsourcing benefits and the risk factors' importance. The strongest relationship exists between supplier-related risk factors and technological benefits, while a slightly weaker relationship exists between economic risk and economic benefits and customer-related risk and organizational benefits. The weakest relationship exists between security risks and strategic benefits. (4) The article’s originality and value consist in establishing the existence of a relationship between risk factors and the benefits of IT outsourcing, and in identifying which groups of risks have the strongest impact on the benefits of ITO, which can be exploited by the service suppliers.
Keywords:
benefit
; risk
; IT outsourcing
; SEM
; big Polish organizations
1. Introduction
The essence of outsourcing is the acquisition of specialised services from external suppliers [1]. Its application influences the optimisation of processes in organisations and especially in companies, contributing to the sustainable use of resources.
IT outsourcing began to grow rapidly in the 1980s and is now a developed global market. Many companies, regardless of their business model, decide to outsource one or more services related to IT functions [2] (p. 6).
Since the beginning of outsourcing, the primary motivation for outsourcing activities has been cost reduction. However, there are other factors of great importance:
- Speed of development: after a start-up or spin-off, a new business entity can benefit from outsourcing to implement key functions much faster and cheaper than building its own capabilities from scratch;
- Flexibility: outsourcing can provide the flexible capacity that a rapidly growing business might need to keep up with changing demand;
- Specialised skills: in specialised areas such as IT, attracting, developing and retaining skilled staff can be a real challenge: external service suppliers often offer access to these rare skills;
- Political factors: offshoring can be a sensitive topic - outsourcing to a supplier who can then use its own near-shore and off-shore capabilities may be a politically acceptable way to achieve the same goal.
Sustainable policies and well-chosen strategies for gaining competitive advantage play a key role in management. Outsourcing is an important strategy related to building mutually beneficial, sustainable relationships with stakeholders. It is also a strategy that requires the integration of different, sometimes contradictory concepts. The literature indicates that IT outsourcing is used to simultaneously reduce costs [3], increase productivity [4], and focus on core competencies [5],[6].
IT outsourcing is the research subject due to the wide range of issues. Cross-sectional studies [7,8,910,11] identified a number of empirical areas and outlined issues that require further research.
The IT industry is developing dynamically in Poland. The annual growth rate of companies in the IT/ICT industry is 10% and the value of IT/ICT services exports is 5,6 billion euros [12]. The IT outsourcing market is also developing rapidly, with new IT outsourcing companies emerging and existing ones expanding their offerings. Among the most important reasons for choosing an ITO supplier from Poland are: highly qualified programmers (3rd place in the world), insignificant cultural gap and good knowledge of English, small time difference (short waiting time), high security standards and relatively low price of services [13].
Given the rate of IT outsourcing development (use of cloud technologies, rapid development of internet technologies, hardware and software) and the intensification of its use in businesses and organisations (the COVID-19 pandemic was a significant stimulus), it is necessary to examine the evolution of this phenomenon and the impact of factors stimulating and inhibiting its development and use. Therefore, the impact of selected risk-related factors of this service on its benefits has been investigated.
Structural modelling was used to investigate the relationship between ITO risk and benefits of this service. Structural modelling is a statistical method used to study and evaluate causally related phenomena. It is also used to model IT outsourcing. The structural model developed by Vivek [14] presents the impact of three factors: transaction characteristics, key activities and relationships on offshoring investments. The model developed by Ali and Green [15] examines the impact of IT intensity and IT governance effectiveness on IT outsourcing decisions. Bahl and Wali’s [16] model assumes that the quality of the security service affects the performance of the organisation, which is measured by both tangible and non-tangible assets. In a hierarchical three-level model of overall satisfaction with outsourcing, Kim [17] highlighted that the effectiveness of management is influenced by the parameters of the contract and the closeness of the relationship between supplier and customer. Research conducted by Yu [18] concludes that long-term outsourcing cooperation is influenced by equipment/investment factors and information sharing. These factors depend on the trust and interdependence between the parties involved. Gorla and Somers [19] constructed a model investigating outsourcing user satisfaction. According to their research, it depends on the quality of service, perceived usefulness and the extent of outsourcing. Adams’ [20] model examined the impact of strategic supplier, purchasing development and purchasing complexity on relative behaviour. A three-level model of satisfaction with ITO was presented in the work of Gonzalez [21]. It considered the impact of technological, strategic and economic benefits on IT outsourcing satisfaction.
2. Materials and Methods
The research presented here has analysed IT outsourcing from a cross-sectional perspective in order to determine the extent of the phenomenon, its characteristics and the relationship between the studied quantities. The original data used to verify the hypotheses were obtained by means of a diagnostic survey, in which the research tool was a survey questionnaire The research was quantitative and was conducted in 2021. The questionnaire contained substantive semi-open questions and a metric. The survey involved 200 large organisations, mostly companies that use IT outsourcing in their operations. The selection of the research sample was therefore intentional and randomised. The research sample represented 19.4% of the population of large companies using ITO. The research was conducted using the (Computer Added Telephone Interview) method. Choosing large organisations as the object of IT outsourcing research was guided by the following considerations:
- These organisations outsource IT activities most frequently and to the greatest extent [22];
- They are relatively stable entities and do not undergo transformations as frequently as smaller organisations;
- They use ITO earlier than other organisations, if only for economic reasons;
- They use different types and forms of outsourcing.
Table 1 presents the structure of branch organisations participating in the research.
From a methodological perspective, the following methods were used to prepare and conduct the research and its analysis: critical literature review, empirical and formal methods. Data analysis was conducted using statistical techniques. The structural equation modelling method, which belongs to multivariate analysis, was used to create the research model and verify the hypotheses.
The licensed software MS Excel version 16.73 was used to compile, analyse and graphically present the findings. The open-source application Jamovi 2.3.28.0 was used to construct and test the structural model.
The constructed model of the relationship between the benefits of IT outsourcing and the risk validity of this service included eight latent variables, including four endogenous and four exogenous variables. The survey questionnaire included thirteen types of benefits and seventeen risk factors, of which nine types of benefits and fourteen risk factors were used in the model construction for methodological reasons. The construction of the measurement tool was performed as follows: a literature review was conducted to identify existing tools (structural models, risk factors, benefits), a preliminary version of the survey questionnaire was created and tested on a group of part-time master's students of management studies at the Lublin University of Technology (all students were employed by companies and organisations), an in-depth interview was conducted with IT staff employed in outsourcing to correct the research tool in order to finally complete the questionnaire survey.
2.1. Description of the problem
Published studies of IT outsourcing using structural modelling have not found a study of the relationship between the benefits of using this service and its risks. Undoubtedly, such a relationship exists, and it was therefore decided, on the basis of the previous survey, to investigate such a relationship.
There are a number of factors that influence the achievement of benefits or outcomes from the use of IT outsourcing. Numerous studies have confirmed the various benefits of this service. Han [23] lists customer-supplier relationship factors such as communication, customer-supplier collaboration, Koh [24] adds knowledge transfer between supplier and customer to this list. Lacity [8] distinguishes the following groups of factors: relationship characteristics, customer company capabilities, customer company characteristics, contract management, supplier company capabilities, transaction attributes, decision characteristics. Attention is also drawn to the benefits associated with the use of new technologies in outsourcing, for example: cloud computing is associated with cost savings, flexibility and agility [25], automation results in the lowest ITO service costs and time savings [26], robotisation results in the optimisation of internal business operations and the rational use of limited knowledge [26].
Focusing on the benefits of outsourcing, this research looked at the benefits in a multifaceted way, considering a wide range of aspects. Therefore, in classifying the benefits of IT outsourcing, the division of this service's benefits proposed by Grover [27], was used, according to which three groups of benefits are distinguished: economic, technological and strategic. However, this classification has been extended to include another group of benefits - organisational. The economic benefits relate directly to cost savings, the technological benefits relate to technology-related issues, the strategic benefits relate to strategy-related areas and the organisational benefits relate to the organisation of the business.
Despite the undoubted benefits of outsourcing, it also involves risks. Grover [27] lists the disadvantages of outsourcing that can be considered as risk factors. These include management factors such as loss of flexibility or risks from a long-term perspective, cost factors: increased costs of coordination, hidden costs, conflict of interest: the service supplier's focus on profit alone, and trust in systems and data. In subsequent years, many authors have studied other risk factors. A detailed review of the risk factors examined can be found in Gonzalez's publication [21].
Aron [28] distinguishes four categories of outsourcing risk: strategic risk, operational risk, internal risk - which can be called client-related risk, and location-related risk.
For the purpose of this research, risk factors were classified into four groups: economic risk, service supplier risk, customer risk and security risk.
Finally, four groups of outsourcing benefits and four types of risk factors were used for the model.
2.2. Hypotheses
When constructing the model, the dependency between each group of benefits and each group of risks of using IT outsourcing was tested - a total of 12 dependencies. Although not all correlations proved to be statistically significant, four research hypotheses were finally formulated. The model includes eight latent variables, four endogenous and four exogenous. Each endogenous variable consists of 2 to 3 explicit variables and each exogenous variable consists of 4 to 5 explicit variables. Table 2 contains the latent variables studied and the observable variables that comprise them.
H1: The achievement of strategic benefits from ITO use is positively influenced by the importance of ITO security risks.
H2: The achievement of organisational benefits from ITO use is positively influenced by the importance of the risks associated with the ITO client.
H3: The achievement of technological benefits from ITO use is positively influenced by the importance of ITO supplier risk.
H4: The achievement of economic benefits from ITO is positively influenced by the importance of economic risk.
Figure 1 presents a conceptual model of the relationships presented in the hypotheses.
The construct consists of an internal model that shows the links between latent and observable variables (grouped risk factors with their constituent individual risks and classified ITO benefits with their constituent individual benefits). The external model presents the links between endogenous and exogenous latent variables (grouped risk factors and classified ITO benefits). An external model is a tool for examining the factors influencing a latent variable, allowing us to determine how each factor contributes to shaping that variable. The internal model, however, is used to analyse the causal relationships between the variables, showing what the links are between the latent variables [29].
3. Results
The model used 200 observations (large organisations using ITO), 23 observable variables, 8 latent variables, and was estimated in 108 iterations. The figure shows a structural model of the dependence between the benefits of outsourcing and the importance of the service's risk factors, as estimated in the Jamovi application SEMLj module.
First, a correlation analysis was performed to determine Pearson correlation coefficients for the observable variables in the benefit and risk factor group. Figure 2 shows a heat map for the correlation between the variables, including latent, endogenous and exogenous variables (see Table 2 for variable explanations).
The variables are correlated with each other. The Pearson correlation coefficient is positive for all variables, indicating a positive correlation between the variables. The figure reveals that the endogenous and exogenous variables are correlated from weak to very strong (0.1- 0.78 and 0.1- 0.73).
At the beginning of the analysis, we proceeded to assess the representation quality of the individual primary variables in the latent variables by determining Cronbach's alpha coefficient (Table 3). Cronbach's alpha values for the proposed latent variables are above 0.7, indicating that the variables are consistent at an acceptable level.
The Generalized Least Squares (GLS) method, which estimates the parameters of an assumed probability distribution from observable data, was used to estimate the model. The method maximises the plausibility function to make the observed data as probable as possible given the assumed model. The GLS method is the dominant method of statistical inference.
Convergent validity is assessed by analysing the magnitude and statistical significance of factor loadings. The factor loading values should exceed 0.5 or better 0.7, which is largely achieved in the presented model. The convergence assessment is also shown by the AVE (average variance extracted) indicator, whose value equal to or greater than 0.5 indicates adequate convergence. The AVE values for the estimated variables are shown in Table 4. The AVE value for the vast majority of variables is greater than 0.5, indicating convergence of the model.
Figure 3 presents a model of the relationship between the benefits of IT outsourcing and the importance of the risk from this service estimated using the SEMLj module of the Jamovi application.
The chi-square statistic for this model reached 457, with 283 degrees of freedom and a significance level below 0.001.
All four assumed paths in the model were proved to be statistically significant.
The model fit measures are presented in Table 5. The fit model measures indicate that the model is fit at a medium level.
Measures of model fit indicate that the model is fitted at a medium level. However, it should be noted that all identified relationships are statistically significant.
4. Discussion
Table 6 was created to address the hypotheses. The test result was determined based on the structural model presented in Figure 3.
The strategic benefits of IT outsourcing are a focus on strategic issues and access to new international markets. Achieving these benefits is statistically significantly positively influenced by the importance of security risks. Security risk factors include external attacks, data corruption/loss, security issues, exposure to the use of sensitive and confidential data. The importance of these factors has little positive impact on the achievement of strategic benefits.
The organisational benefits of IT outsourcing consist of an improvement in the quality of the services offered, technological considerations, facilitating access to new technologies and reducing the risk of technological obsolescence. The achievement of organisational benefits is statistically significantly positively influenced by the importance of ITO customer risk. Risk factors associated with the ITO client include loss of knowledge and core skills, possible employee resistance as well as loss/dilution of competencies. The importance of these factors has a positive impact on achieving organisational benefits.
The technological benefits of IT outsourcing consist of increasing the flexibility of the IT department, technological considerations and facilitating access to new technologies. The achievement of these benefits is statistically significantly positively influenced by the importance of ITO supplier risk. Risk factors related to the ITO supplier are: the qualifications of the supplier's staff, over-dependence on the supplier, the supplier's failure to comply with the contract as well as the supplier's inability to adapt quickly to new technologies. The importance of ITO supplier factors has a significant positive impact on achieving technological benefits.
The economic benefits of IT outsourcing consist of savings in staff costs and savings in the cost of using technology. The importance of economic risk has a statistically significant positive impact on the achievement of economic benefits. Economic risk factors include: unclear cost-benefit relationships, lack of control over wage costs and hidden contract costs. The importance of economic factors has a positive impact on the achievement of economic benefits.
All the assumed hypotheses were confirmed, although not all to the same extent. The significance of the assumed risk factors has a positive impact on the achievement of the assumed benefits of IT outsourcing.
Implications from the research presented include two perspectives: theoretical (academic) and practical. From an academic perspective, it was found that the benefits of using IT outsourcing are influenced by the perception of risk associated with the service. There were four types of benefits and four risk groups. Although the impact of each risk group on the different types of benefits is not the same, all the relationships were confirmed. The greatest impact is supplier risk on technology benefits. The impact of economic risk on economic benefit and customer risk on organisational benefit is slightly lower. Security risks have the lowest impact on strategic benefits. From a theoretical perspective, the main advantage of the structural modelling method used was the ability to test the hypotheses assumed implying relationships between unobservable variables.
From a practical perspective, when relating the presented results to business practice, practitioners' attention should be drawn to the fact that the risk factors that most affect the benefits of ITO are those related to the service supplier, in particular: the qualification of the service supplier's staff, over-dependence on the supplier, the supplier's failure to comply with the contract as well as the supplier's inability to adapt quickly to new technologies. Particular focus should therefore be given to these in order to maximise the benefits of outsourcing.
The novelty of the article's findings resides in the identification of the relationship between the risks and benefits of IT outsourcing and the magnitude of this relationship. Similar findings have not been reported in the literature.
Relating the presented model to research in the literature, no similar structural model was found for the relationship between the benefits of outsourcing and the importance of the risks associated with this service. The scientists' published research addresses different issues. Accordingly, based on a survey of 398 large companies in Spain, Gonzalez [21] present a structural model of the dependence of ITO benefits (economic, technological, and strategic) on the level of relevant outsourcing, the role of top management and the relationship with the service supplier. Meanwhile, Wongsaroj [40] present the relationship between ITO level, defined as the percentage of IT activities and components selected for outsourcing, and ITO success, understood as the benefits obtained from outsourcing. The study was conducted among 428 IT employees in the Thai financial sector and the results were analysed using structural equation modelling. Wibisono [41] proposed a model to explain the relationship between the capabilities associated with IT outsourcing conducted abroad (interaction capability, management capability, distance management capability) and outsourcing success. The model was tested on a sample of 64 Indonesian IT suppliers with experience in running outsourcing projects.
Undoubtedly, the risks of outsourcing affect the benefits of this service, as confirmed by the research presented. The research concerned the period from the beginning of the COVID-19 pandemic (2021). The outsourcing determinants as a consequence of the pandemic have changed and, although the economy is now returning to normal, some changes have entered the economy permanently and have affected IT outsourcing, largely positively.
Future research directions could include:
- changes in the impact of risk on the benefits of outsourcing in the post-pandemic period;
- research on other economic entities (the study presented focused on large companies and organisations in Poland).
The research presented included the customer perspective, therefore the service supplier perspective could also be included in the research.
It should be emphasised that the progressive globalisation processes are significantly influencing the level and extent of the use of outsourcing. It is, therefore, necessary to follow the changes and successively repeat the scientific research in the area presented in order to observe the processes in progress, identify changes and also identify opportunities and threats to ITO. Dynamic changes in markets are forcing companies to implement the principles of sustainable development, related to building mutually beneficial and long-term relationships. This type of relationship includes outsourcing, which, when properly implemented in an organization, can influence the acquisition of competitive advantages.
Supplementary Materials
There are not any supplementary materials.
Author Contributions
Article has one author only J.S.
Institutional Review Board Statement
Study did not require ethical approval.
Informed Consent Statement
Not applicable.
Data Availability Statement
Data is unavailable due to privacy or ethical restrictions.
Conflicts of Interest
The authors declare no conflict of interest.
References
- Alaghehband, F.K.; Rivard, S.; Wub, S.; Goyette, S. An assessment of the use of Transaction Cost Theory in information technology outsourcing. Journal of Strategic Information Systems 2011, 20, 125–138.
- The Outsourcing Handbook. A guide to outsourcing, Publisher: Deloitte MCS Limited, 2013, 6-7. https://www.deloitte.co.uk/makeconnections/assets/pdf/the-outsourcing-handbook-a-guide-to-outsourcing.pdf.
- Han, K.; Mithas, S. Information technology outsourcing and non-IT operating costs: an empirical investigation. MIS Quarterly 2013, 37(1), 315-331. [CrossRef]
- Salimath, M.S.; Cullen, J.B.; Umesh, U.N. Outsourcing and performance in entrepreneurial forms: contingent relationships with entrepreneurial configurations. Decision Sciences 2008, 39(3), 359-381. [CrossRef]
- Premus, R.; Sanders, N.R. Outsourcing of Core and Non-Core Competencies in U.S. Corporations. Supply Chain Forum 2002, 3(2), 12-20. [CrossRef]
- Thouin M.F.; Hoffman, J.J.; Ford, E.W. IT outsourcing and firm-level performance: a transaction cost perspective. Information & Management 2009, 46(8), 463-469. [CrossRef]
- Lacity, M.C.; Khan, S.A.; Willcocks, L.P. A review of the IT outsourcing literature: Insights for practice. Journal of Strategic Information Systems 2009, 130–146.
- Lacity, M.C.; Khan, S.A.; Yan, A.; Willcocks, L.P. A review of the IT outsourcing empirical literature and future research direction. Journal of Information Technology 2010, 25, 395–433.
- Lacity, M.; Khan, S.; Yan, A. Review of the Empirical Business Services Sourcing Literature: An Update and Future Directions, Journal of Information Technology 2016, 31(3), 269-328.
- Lacity, M.; Khan, S.; Yan, A. Review of the Empirical Business Services Sourcing Literature: An Update and Future Directions. Journal of Information Technology 2017, 31(3), 269-328. [CrossRef]
- Sloniec, J. Outsourcing w dużych organizacjach w Polsce Modelowanie z wykorzystaniem równań strukturalnych. 1st ed.; Publisher: Dom Organizatora, Toruń, Poland, 2018, 163-215.
- Rutkowski, E. IT/ICT sector in Poland. Polish Agency for Enterprise Development, Warsaw, Poland, 2019.
- Małysiak, J. 2018. Top 5 reasons for outsourcing in Poland. https://itsg-global.com/top-5-reasons-outsourcing-to-poland/, (accessed on 15 May 2022).
- Vivek, S.D.; Banwet, D.K.; Shankar, R. Analysis of interactions among core, transaction and relationship-specific investments: The case of offshoring. Journal of Operations management 2008, 26, 180-197. [CrossRef]
- Ali S.; Green, P. Effective information technology (IT) governance mechanisms: An IT outsourcing perspective. Information Systems Frontiers 2012, 14(2), 179–193.
- Bahl, S.; Wali, O.P. An empirical analysis of perceived significance of information security service quality to predict the organizational performance in software industry. CSI Transactions on ICT 2013, 1 (30), 221-230.
- Kim, Y.J.; Lee, J.M.; Koo, Ch.; Nam, K. The role of governance effectiveness in explaining IT outsourcing performance. International Journal of Information Management 2013, 33, 5, 850-860.
- Yu, T.Y. An empirical study of collaborative partnering among enterprises and government organizations for information system outsourcing. Applied Economics 2014, 46, 312-322. [CrossRef]
- Gorla, N.; Somers, T.M. The impact of IT outsourcing on information system success. Information & Management 2014, 51, 320-355. [CrossRef]
- Adams, J.; Davis, J.; Standing, G.; Kauffmann, R.G. Achieving strategic supplier leverage for small enterprises by using purchasing development and complexity. International Journal of Business, Marketing, and Decision Sciences 2013, 6, 1, 72-88.
- Gonzalez M.R.; Gasco, J.L.; Llopis, J. Information Systems Outsourcing Satisfaction: Some Exploratory Factors. Industrial Management & Data Systems 2015, 115, 6, 1067-1085.
- Lee J.-N.; Miranda, S.M.; Kim, Y.-M. IT outsourcing strategies: Universalistic, contingency, and configurational explanations of success. Information Systems Research 2004, 15(2), 110–131.
- Han, H.-S.; Lee, J.-N. and Seo, Y.-W. Analyzing the impact of a firm’s capability on outsourcing success; a process perspective. Information & Management 2008, 45, 1, 31-42.
- Koh, C.; Ang, S. and Straub, D.W. IT outsourcing success: a psychological contract perspective. Information Systems Research 2004, 15, 4, 356-373.
- Alali F.A.; Yeh C.-L. Cloud computing: overview and risk analysis. Journal of Information Systems 2012, 26(2), 13-33.
- Davenport T.H.; Ronanki R. Artificial Intelligence for the Real World. Harvard Business Review 2018, 96(1), 108-116.
- Grover, V.; Cheon, M.J.; Teng, T.C. A Descriptive Study on the Outsourcing of Information Systems Functions. Information & Management 1996, 27, 1, 33-44.
- Aron R., Clemons E.K., Reddi S. Just right outsourcing: understanding and managing risk. Journal of Management Information Systems 2005, 22(2), 37-55.
- Bollen, K.A. A New Incremental Fit Index for General Structural Equation Models. Sociological Methods & Research 1989, 17(3), 303–316. [CrossRef]
- Pavlov, G.; Maydeu-Olivares, A.; Shi, D. Using the Standardized Root Mean Squared Residual (SRMR) to Assess Exact Fit in Structural Equation Models. Educational and Psychological Measurement 2021, 81(1), 110–130. [CrossRef]
- Steiger, J.H. Poinr Etsimation, Hypothesis and Interval Estimation Using the RMSEA: Some Comments and a Reply to Hayduk and Glaser. Structural equation modelling 2000, 77(2), 149-162. http://statpower.net/Steiger%20Biblio/Steiger2000%20--%20Final.pdf.
- Bentler P.M. Comparative fit indexes in structural models. Psychological Bulletin 1990, 107(2), 238–246. [CrossRef]
- Tucker, L.R.; Lewis, C. A reliability coefficient for maximum likelihood factor analysis. Psychometrika 1973, 38, 1–10. [CrossRef]
- Bentler, P.M.; Bonett, D.G. Significance tests and goodness of fit in the analysis of covariance structures. Psychological Bulletin 1980, 88(3), 588–606. [CrossRef]
- Li-tze, H.; Bentler, P.M. Cutoff criteria for fit indexes in covariance structure analysis: Conventional criteria versus new alternatives. Structural Equation Modeling: A Multidisciplinary Journal 1999, 6:1, 1-55.
- Ullman, J.B. Structural Equation Modeling. In Using Multivariate Statistics, (3rd ed.), Tabachnick, B.G.; Fidell, L.S. (Eds.), NY: Harper Collins College Publishers, USA, 1996, pp. 709-819.
- Bollen, K.A. Structural equations with latent variables, NY: Wiley, USA, 1989.
- Bollen, K.A. Sample size and Bentler and Bonett's nonnormed fit index. Psychometrika 1986, 51, 375–377.
- Mulaik, S.A.; James, L.R.; Van Alstine, J.; Bennett, N.; Lind, S.; Stilwell, C.D. Evaluation of goodness-of-fit indices for structural equation models. Psychological Bulletin 1989, 105, 430-455.
- Wongsaroj, R.; Krairit, D.; Khang, D.B. IT outsourcing and impacts in Thailand's financial institutions. Information Development 2014, 30 (3), 256-275. [CrossRef]
- Wibisono, Y.Y.; Govindaraju, R.; Irianto, D.; Sudirman, I., Capabilities in Managing Offshore IT Outsourcing Challenges and the Influence on Outsourcing Success from the IT Vendor Perspective. International Journal of Technology 2018, 10(4), 841-853.
Figure 1.
Conceptual model of the relationship between ITO benefits and ITO risks. Source: own elaboration. Explanations of the observable and latent variables are provided in Table 2.
Figure 1.
Conceptual model of the relationship between ITO benefits and ITO risks. Source: own elaboration. Explanations of the observable and latent variables are provided in Table 2.
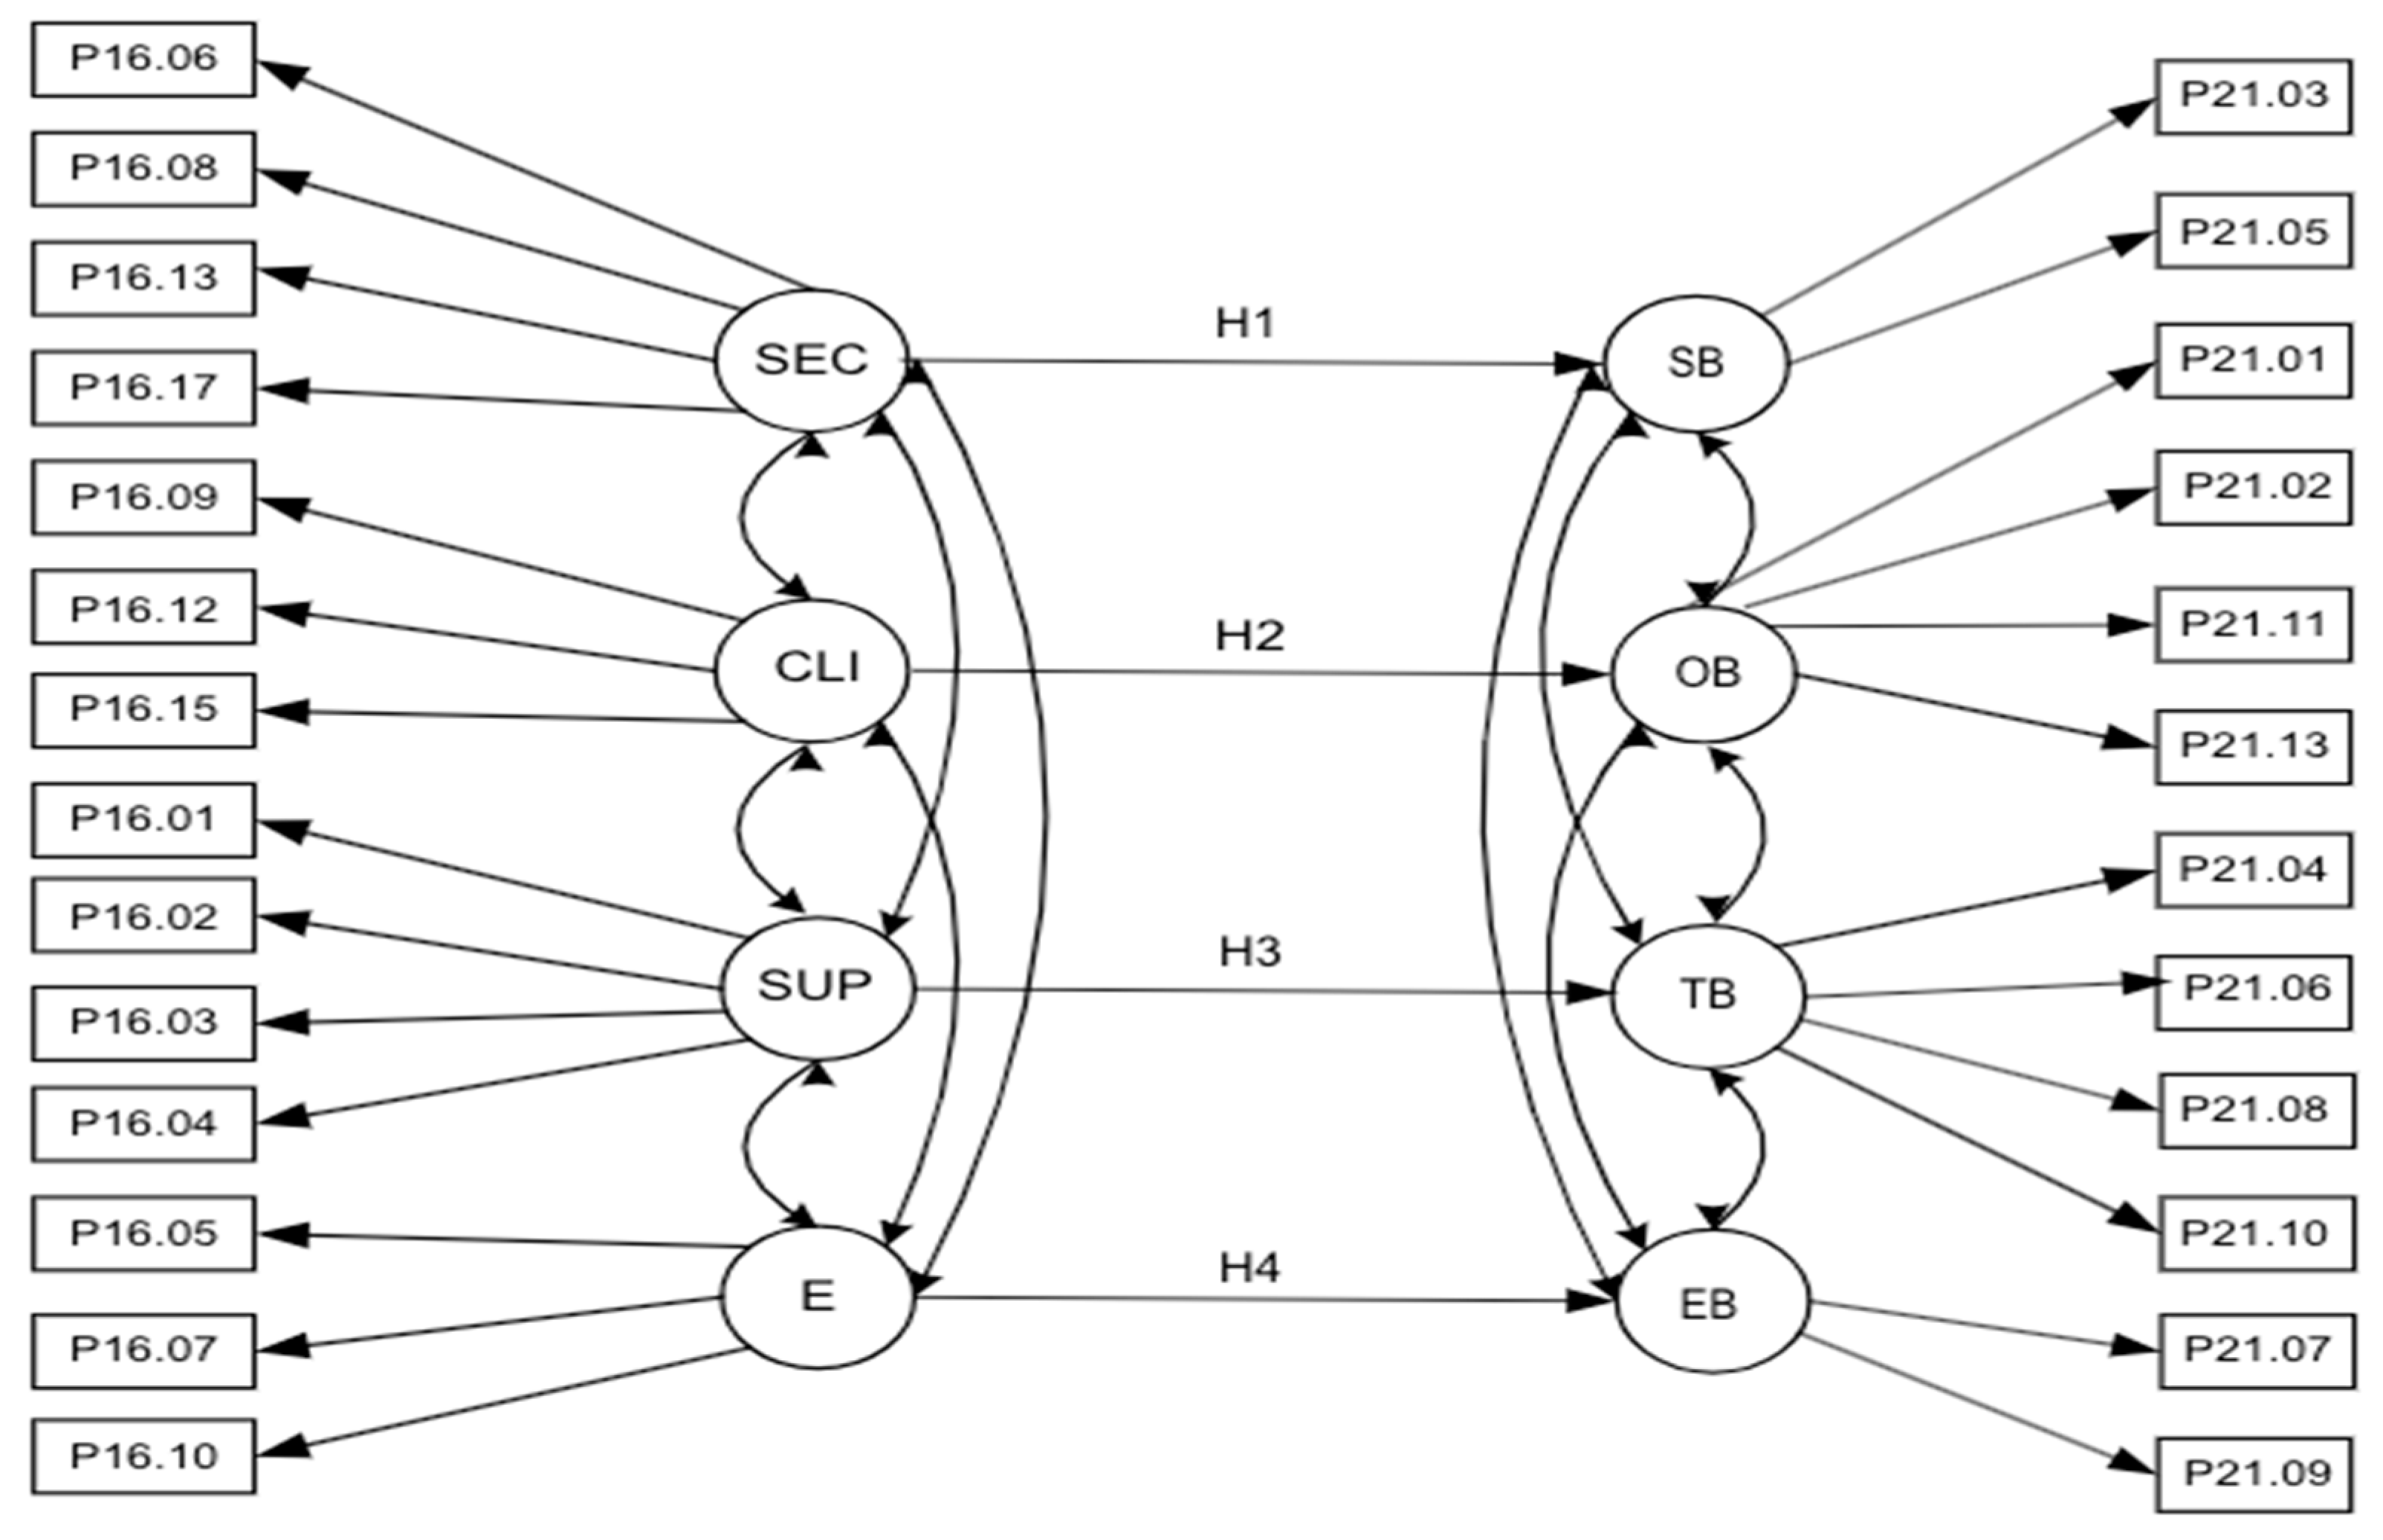
Figure 2.
Heat map for correlation between variables including rising; (a) endogenous latent variables; (b) exogenous latent variables (Jamovi). Source: own elaboration. Explanations of the observable variables are provided in Table 2.
Figure 2.
Heat map for correlation between variables including rising; (a) endogenous latent variables; (b) exogenous latent variables (Jamovi). Source: own elaboration. Explanations of the observable variables are provided in Table 2.
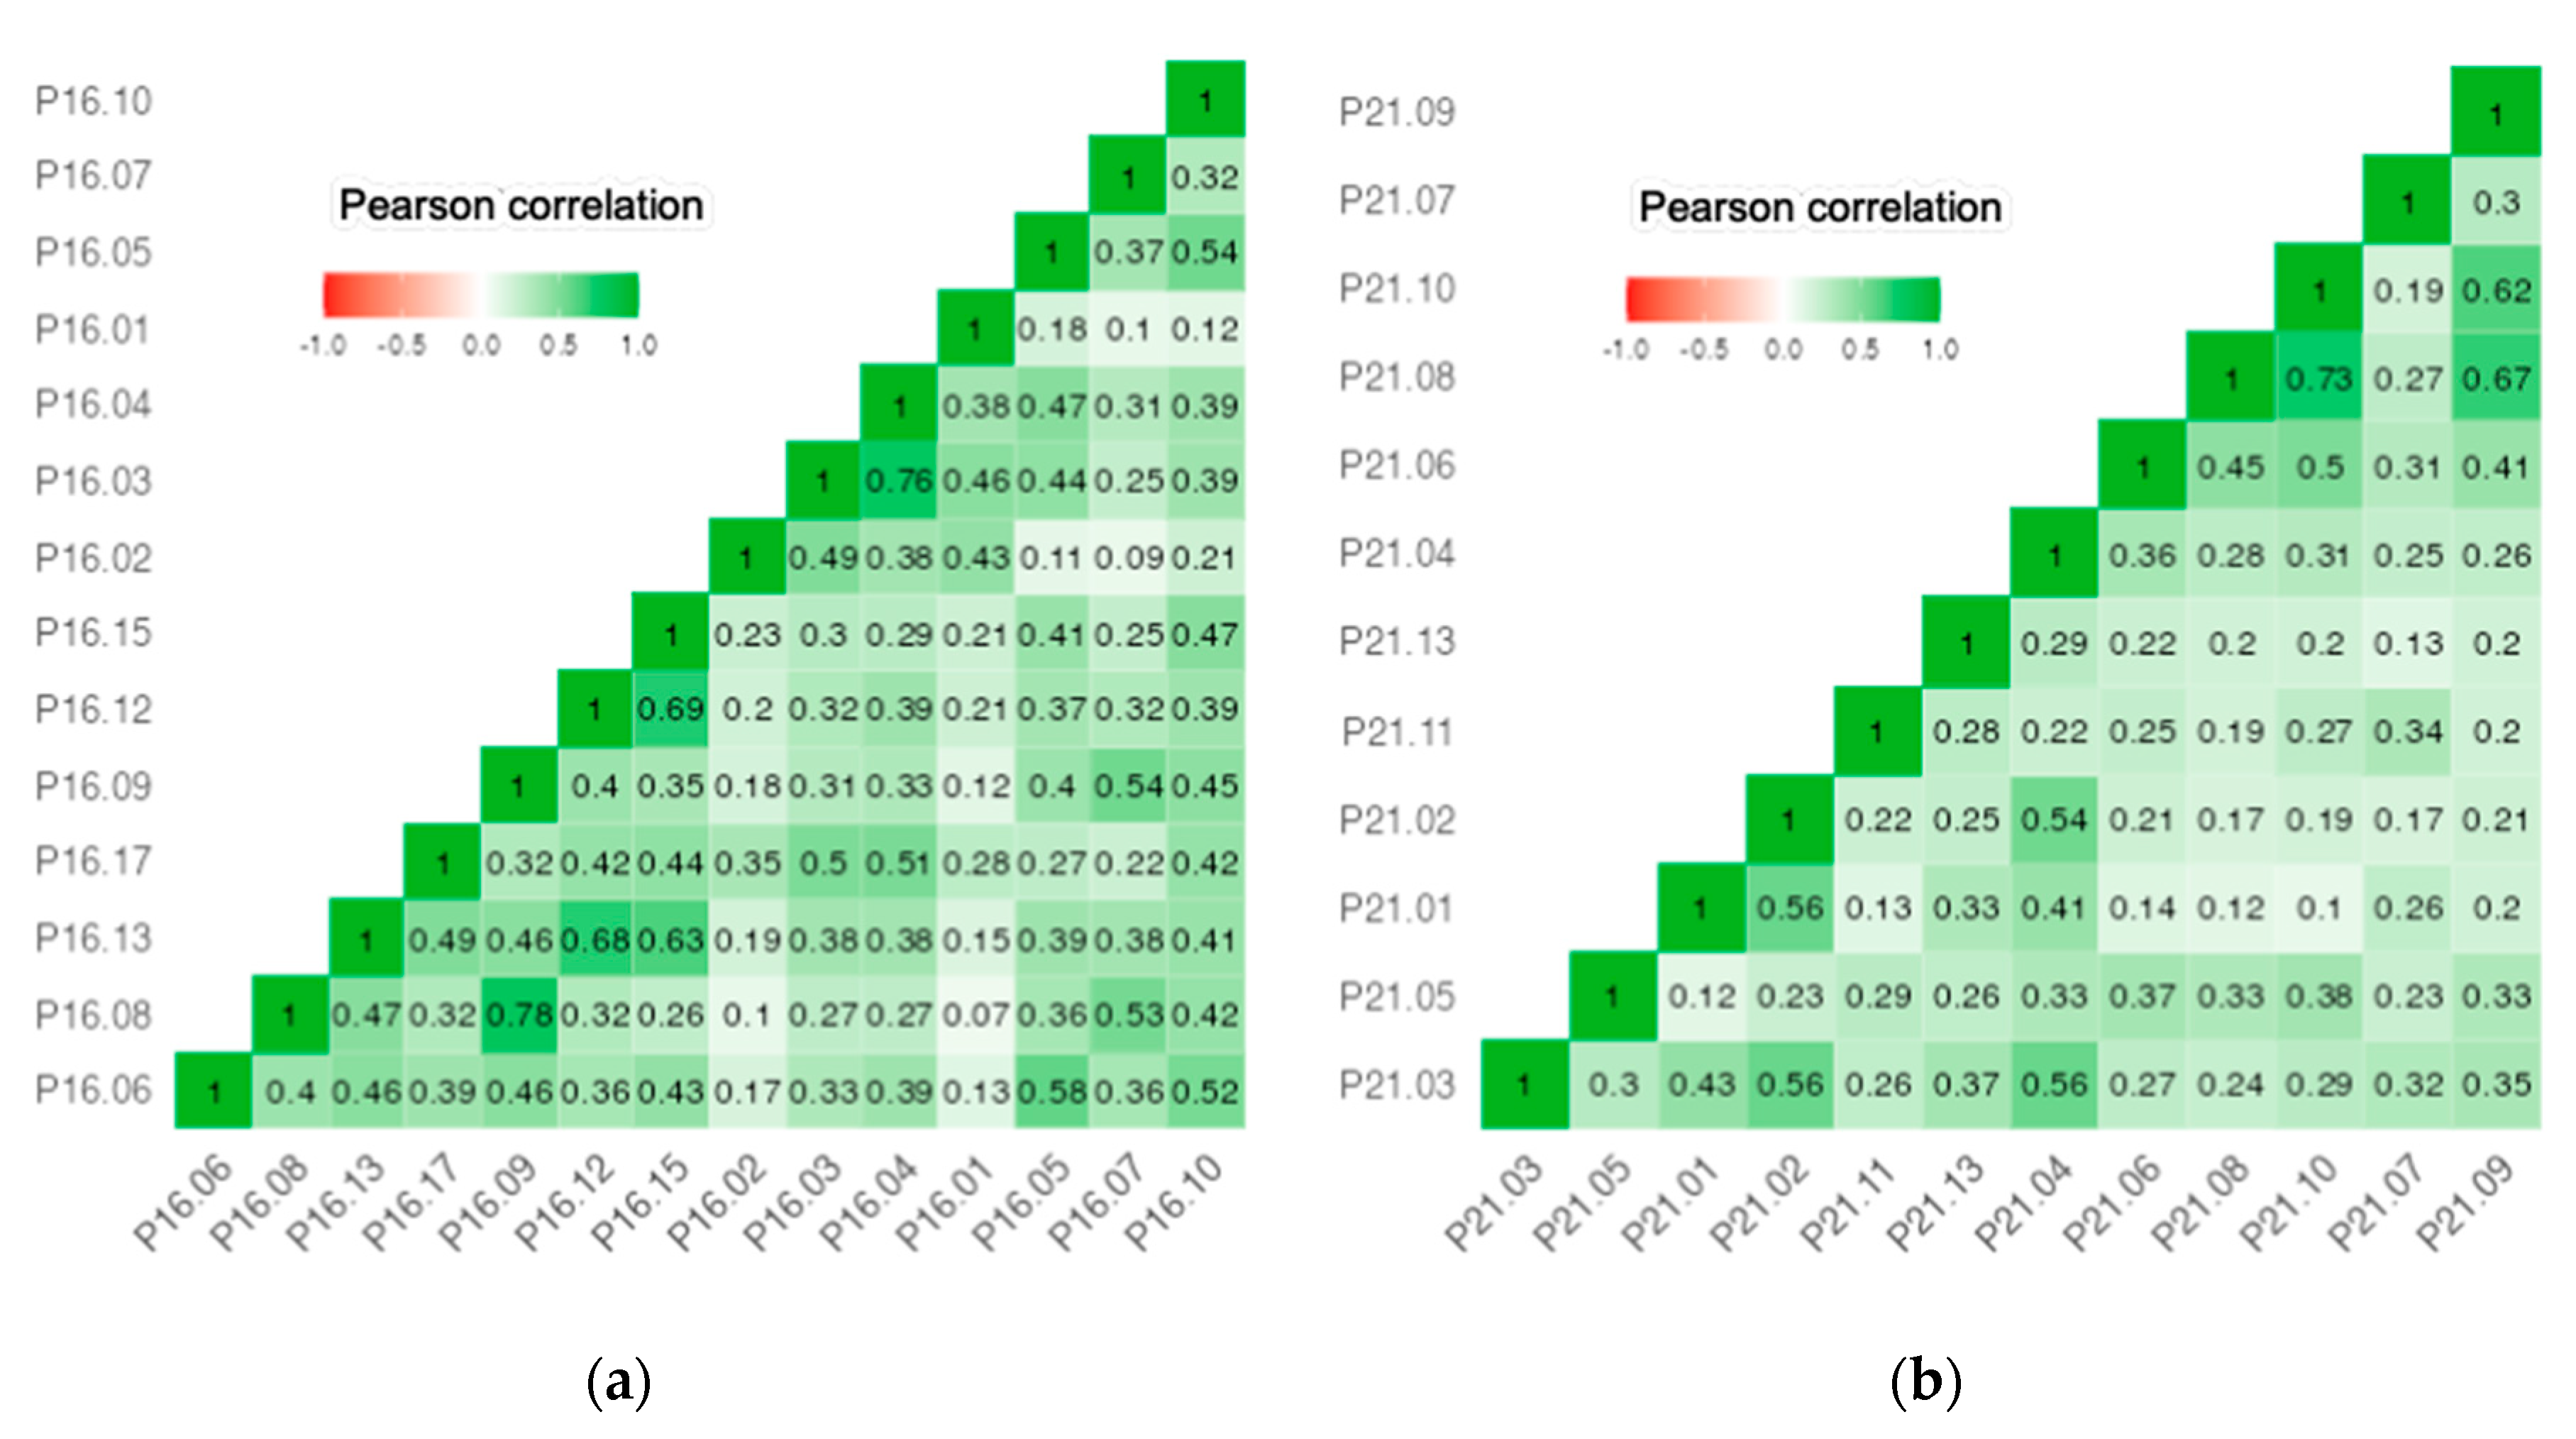
Figure 3.
Structural model of the relationship between ITO benefits and ITO risk validity, estimation in application in Jamovi, SEMLj module. Source: own elaboration. Explanations of the observable and latent variables are provided in Table 2.
Figure 3.
Structural model of the relationship between ITO benefits and ITO risk validity, estimation in application in Jamovi, SEMLj module. Source: own elaboration. Explanations of the observable and latent variables are provided in Table 2.
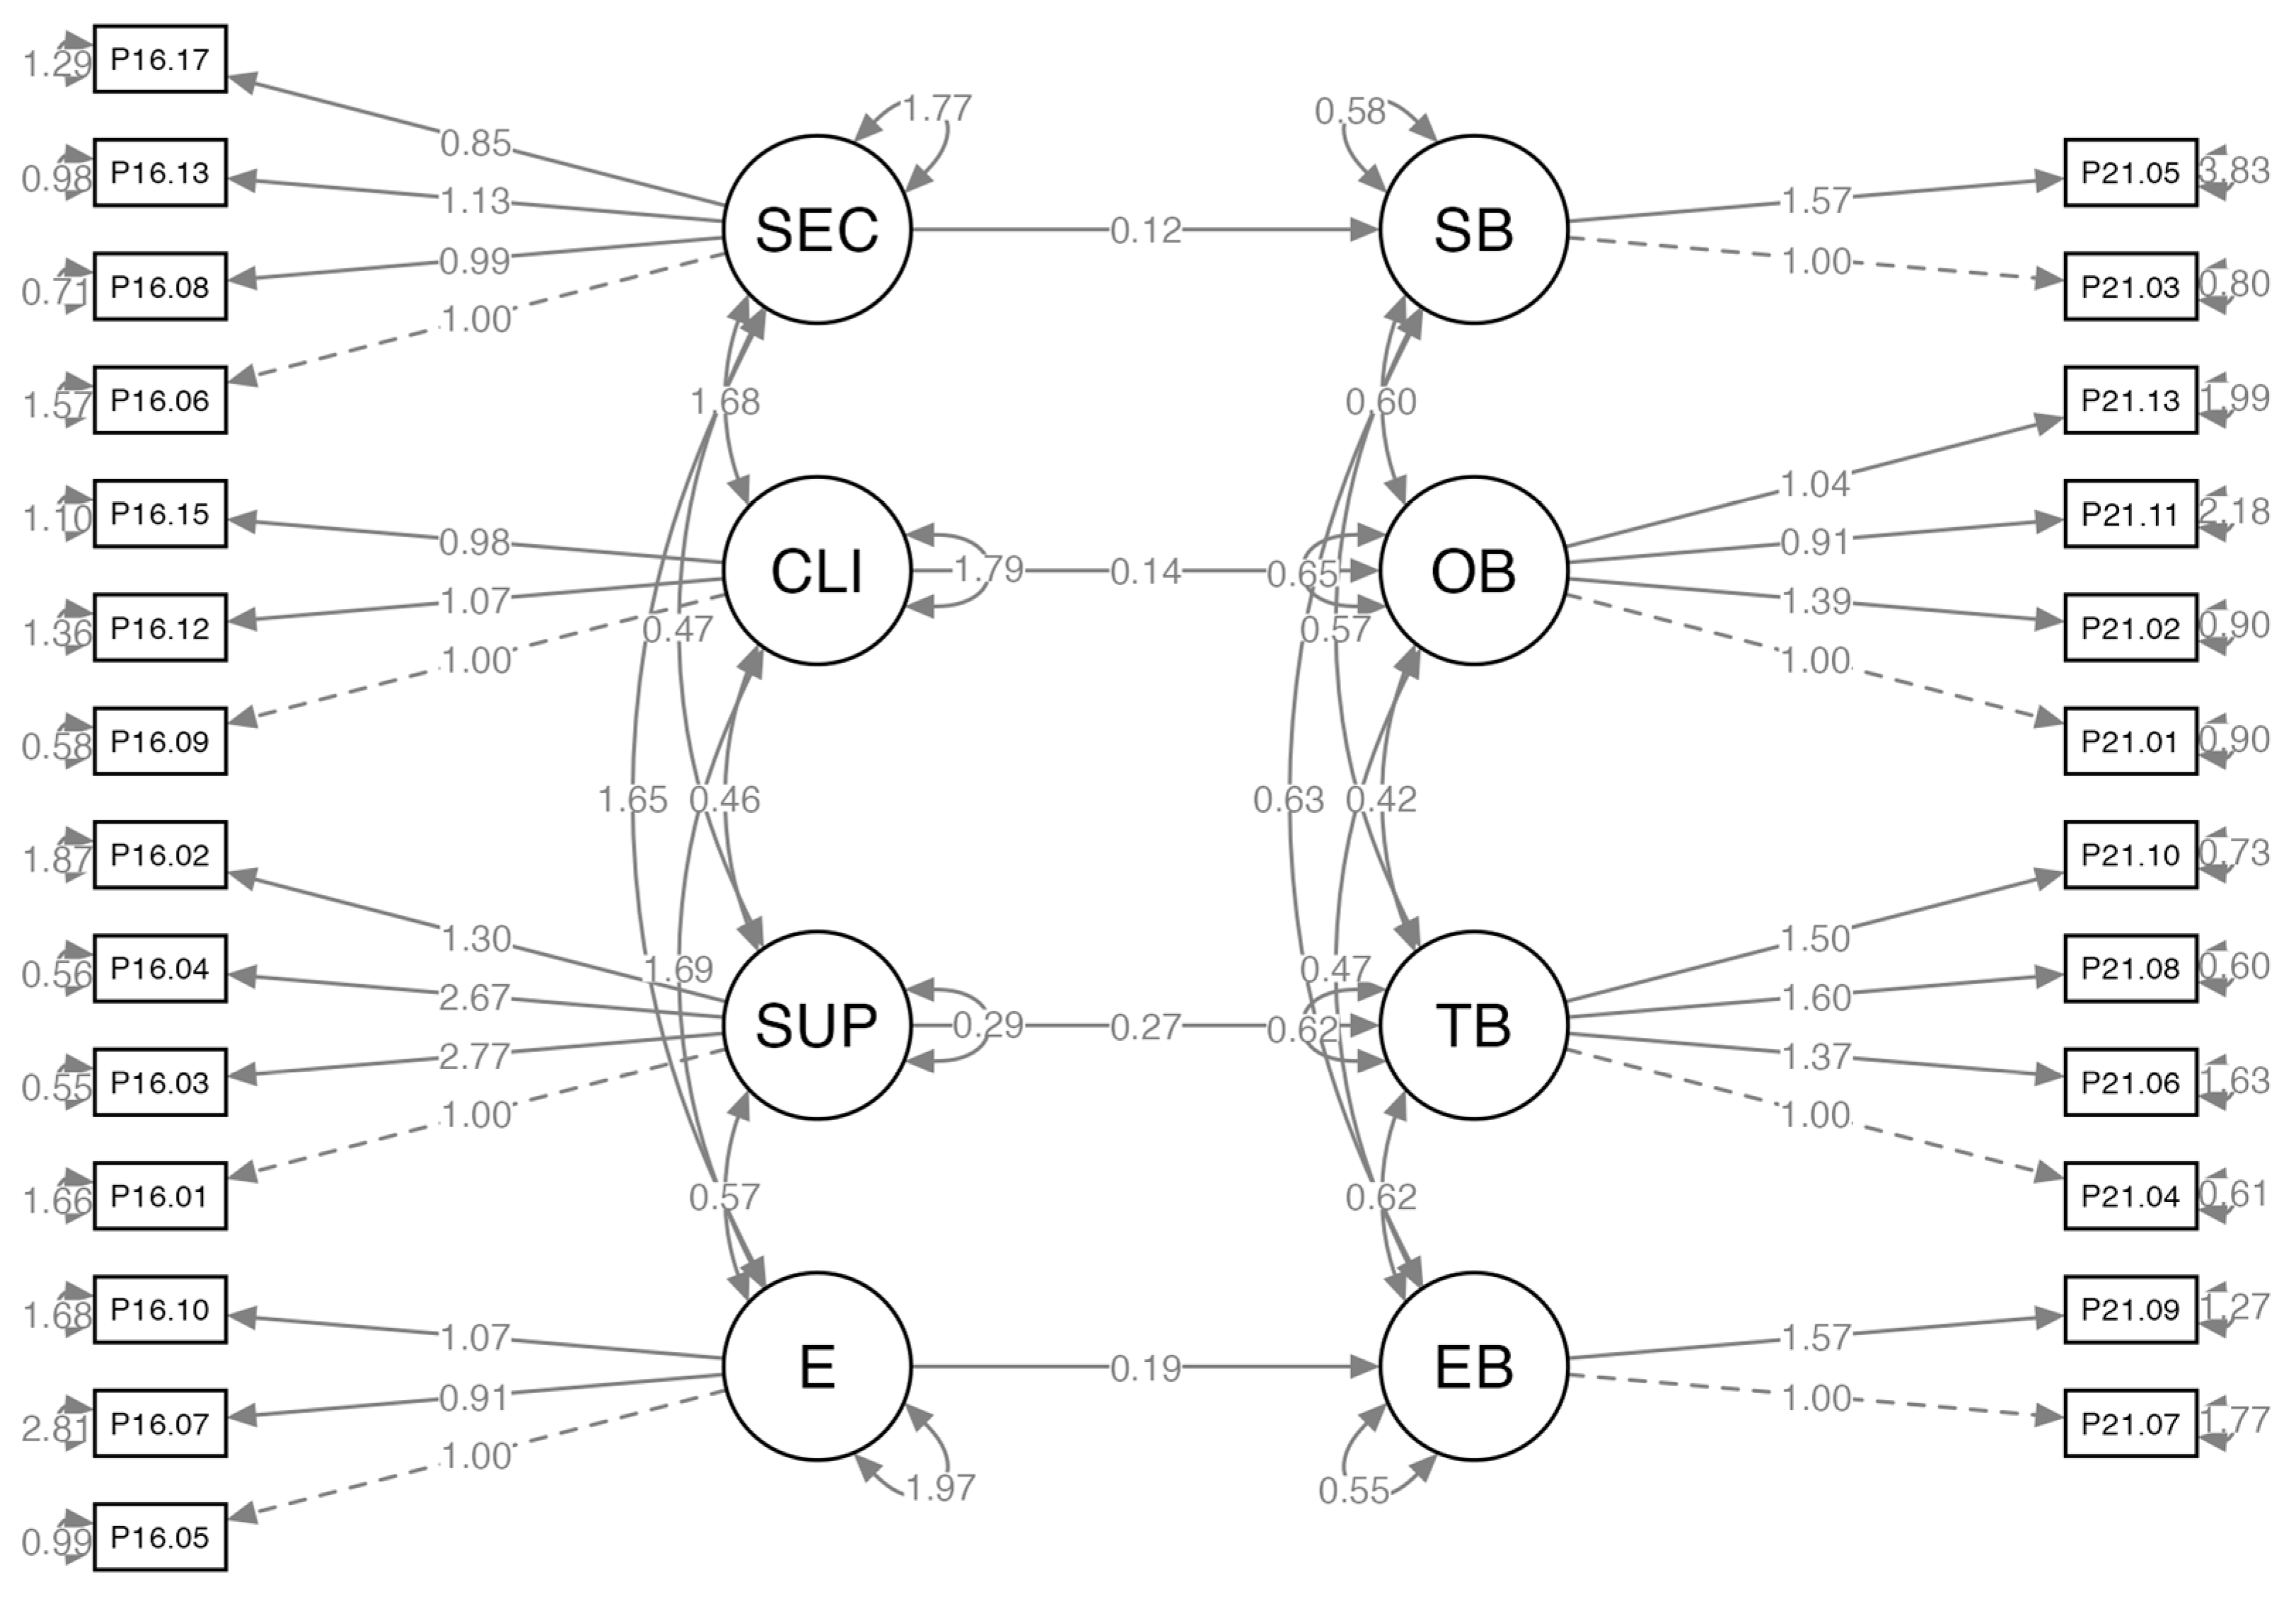

Table 1.
Structure of branches organizations participating in the research.
| No | Branches | % |
|---|---|---|
| 1 | Industry | 45.0 |
| 2 | Trade | 14.4 |
| 3 | Services | 12.4 |
| 4 | Logistics / transport | 4.3 |
| 5 | Science / research / education | 11.0 |
| 6 | Administration / organizations / agencies | 12.9 |
Sourse: own elaboration.
Table 2.
Latent variables with their constituent observable variables.
| No | Latent variable | Identification | Explanation | Identification | Observable variable |
|---|---|---|---|---|---|
| 1 | endogenic | E | importance of economic risk | P16.05 | unclear relationships between costs and benefits |
| P16.07 | lack of control over salary costs | ||||
| P16.10 | hidden contract costs | ||||
| 2 | SUP | importance of supplier risk | P16.01 | qualifications of the service supplier's staff | |
| P16.02 | overdependence on supplier | ||||
| P16.03 | supplier's failure to comply with a contract | ||||
| P16.04 | supplier's inability to adapt quickly to new technologies | ||||
| 3 | CLI | importance of customer risk | P16.09 | loss of knowledge and basic skills | |
| P16.12 | possible employee resistance | ||||
| P16.15 | loss/dilution of competences | ||||
| 4 | SEC | importance of security risk | P16.06 | attacks from outside | |
| P16.08 | data corruption/loss | ||||
| P16.13 | security problems | ||||
| P16.17 | exposure to the use of sensitive and confidential data | ||||
| 5 | exogenic | EB | economic benefits | P21.07 | personnel cost savings |
| P21.09 | cost savings of using technology | ||||
| 6 | TB | technological benefits | P21.01 | increasing flexibility of the IT department | |
| P21.06 | technological conditions | ||||
| P21.08 | facilitating access to new technologies | ||||
| 7 | OB | organisational benefits | P21.04 | improving the quality of services offered | |
| P21.06 | technological conditions | ||||
| P21.08 | facilitating access to new technologies | ||||
| P21.10 | reducing the risk of technological obsolescence | ||||
| 8 | SB | strategic benefits | P21.03 | possibility to focus on strategic issues | |
| P21.05 | access to new international markets |
Source: own elaboration.
Table 3.
Consistency of variables
| Variable | Latent variable | Number of original variables composing the latent variable | Cronbach's alpha |
|---|---|---|---|
| Validity of the risk of ITO use | E (economic) | 3 | 0.887 |
| SUP (supplier related) | 4 | ||
| CLI (customer related) | 3 | ||
| SEC (security related) | 4 | ||
| Benefits of ITO | EB (economic) | 2 | 0.830 |
| TB (technological) | 4 | ||
| OB (organisational) | 4 | ||
| SB (strategic) | 2 |
Source: own elaboration.
Table 4.
AVE (average variance extracted) values for latent variables
| No | Latent variable | Identification | AVE |
|---|---|---|---|
| 1 | importance of economic risk | E | 0.516 |
| 2 | importance of supplier-related risk | SUP | 0.522 |
| 3 | importance of customer-related risk | CLI | 0.646 |
| 4 | importance of security risk | SEC | 0.607 |
| 5 | economic benefits | EB | 0.314 |
| 6 | technological benefits | TB | 0.360 |
| 7 | organisational benefits | OB | 0.579 |
| 8 | strategic benefits | SB | 0.417 |
Source: own elaboration.
Table 5.
Measures of model fitting
| No | Measure | Value | Explanation | Result |
|---|---|---|---|---|
| 1 | Standardized Root Mean Squared Residual (SRMR) | 0.118 | A coefficient indicating the degree of misfit. The model is fit to the data when the value of this indicator is less than 0.05 [30]. | Coefficient is quite low, it does not meet the assumed condition |
| 2 | Root Mean Square Error of Approximation (RMSEA) | 0.056 | Average approximation error of the sample to the ideal population. The model is fit to the data when the index value is less than 0.05 [31] | Coefficient slightly exceeds the assumed value |
| 3 | Comparative Fit Index (CFI) | 0.520 | The comparative fit index (CFI) analyzes the model fit by examining the discrepancy between the data and the hypothesized model, while adjusting for the issues of sample size inherent in the chi-squared test of model fit, and the normed fit index. CFI values range from 0 to 1, with larger values indicating better fit [32]. | Coefficient has an average value |
| 4 | Tucker-Lewis Index (TLI) | 0.449 | Also known as the non-normed fit index, is one of the numerous incremental fit indices widely used in linear mean and covariance structure modeling, particularly in exploratory factor analysis, tools popular in prevention research [33], [34] TLI values exceeding 0.95 indicate good model fit [35]. | Coefficient does not reach the expected value |
| 5 | Bentler-Bonett Normed Fit Index (NNFI) | |||
| 6 | Bentler-Bonett Normed Fit Index (NFI) | 0.336 | An incremental measure of goodness of fit for a statistical model, which is not affected by the number of parameters/variables in the model. Goodness of fit is measured through a comparison of the model of interest to a model of completely uncorrelated variables [36]. | Coefficient has an average value |
| 7 | Bollen’s Relative Fit Index (RFI) | 0.237 | The Relative Fit Index is not guaranteed to vary from 0 to 1. However, RFI close to 1 indicates a good fit. IFI: the Incremental Fit Index (IFI) adjusts the Normed Fit Index (NFI) for sample size and degrees of freedom [37]. Over 0,9 is a good fit, but the index can exceed 1 [38]. | Coefficient has a low value |
| 8 | Bollen’s Incremental Fit Index (IFI) | 0.570 | It adjusts the Normed Fit Index for sample size and degrees of freedom. Over 0,9 is a good fit, but the index can exceed 1 [37]. | Coefficient has an average value |
| 9 | Parsimony Normed Fit Index (PNFI) | 0.292 | Parsimony-corrected fit indices are relative fit indices that are adjustments to most of the fit indices mentioned above. The adjustments are to penalize models that are less parsimonious, so that simpler theoretical processes are favored over more complex ones. The more complex the model, the lower the fit index [39]. | Correct value |
Source: own elaboration based on given sources.
Table 6.
Research hypotheses evaluation.
| Hypothesis | Testing result | Evaluation | |
|---|---|---|---|
| 1 | The achievement of strategic benefits from ITO is positively influenced by the importance of ITO security risks. | Accepted | Statistically significant positive impact, small impact |
| 2 | The achievement of organisational benefits from ITO use is positively influenced by the importance of the risks associated with the ITO client. | Accepted | Statistically significant positive impact, slightly higher impact |
| 3 | The achievement of technological benefits from ITO use is positively influenced by the importance of ITO supplier risk. | Accepted | Statistically significant positive impact, medium level impact, highest of assumed |
| 4 | The achievement of economic benefits from ITO is positively influenced by the importance of economic risk. | Accepted | Statistically significant positive impact, medium level impact |
Source: own elaboration.
Disclaimer/Publisher’s Note: The statements, opinions and data contained in all publications are solely those of the individual author(s) and contributor(s) and not of MDPI and/or the editor(s). MDPI and/or the editor(s) disclaim responsibility for any injury to people or property resulting from any ideas, methods, instructions or products referred to in the content. |
© 2023 by the authors. Licensee MDPI, Basel, Switzerland. This article is an open access article distributed under the terms and conditions of the Creative Commons Attribution (CC BY) license (http://creativecommons.org/licenses/by/4.0/).
Copyright: This open access article is published under a Creative Commons CC BY 4.0 license, which permit the free download, distribution, and reuse, provided that the author and preprint are cited in any reuse.


