Submitted:
09 November 2023
Posted:
10 November 2023
You are already at the latest version
Abstract
Particle-mediated elasticity/viscoelasticity imaging has potential to expand the elasticity imaging field, as it can provide accurate and local tissue elastic properties as well as density, Poisson’s ratio, and viscosity. Here, we investigated elasticity imaging based on the use of small particles located within the tissue and at the tissue interface exposed to a static and dynamic external load. First, we discuss elasticity/viscoelasticity imaging methods based on the use of particles (bubbles and rigid spheres) located within the tissue. Elasticity/viscoelasticity imaging techniques based on the use of particles (bubbles, rigid and soft spheres) located at the tissue interface are then presented. Based on new advances, we updated some of the models for the responses of the particles located within the tissue and at the tissue interface available in the literature. Finally, we compared the mathematical models for the particles located within the tissue and at the tissue interface and evaluated the elasticity/viscoelasticity imaging methods based on the use of small particles. Therefore, instead of the use of the term elasticity imaging, we suggest the use of the term viscoelasticity imaging.
Keywords:
Elasticity imaging
; elastography
; bubble
; sphere
; interface
; mathematical modelling
; shear modulus
; ultrasound sensors
; viscosity
; viscoelasticity imaging
1. Introduction
There are various imaging methods such as X-ray imaging, computed tomography (CT), magnetic resonance imaging (MRI), ultrasound imaging, and optical imaging to detect abnormalities [1]. X-ray imaging can provide detection of lesions when they absorb X-ray radiation differently from normal tissue. MRI produces multiplanar imaging and clear soft tissue contrast by distinguishing structures based on their water content, etc. Sonography can be used to detect abnormalities due to their hypoechoic or hyperechoic appearance on the B-scan and/or the acoustic shadowing effect they cause. However, these medical imaging techniques display tissue properties that are generally not related to the distinct mechanical properties of tissue, such as shear modulus and viscosity. The diagnostic value of characterizing mechanical properties of tissues resulted in development of methods such as magnetic resonance elastography (MRE) and ultrasound elastography for imaging tissue mechanical properties [2]. In these methods, a static, quasi-static or dynamic force is applied to the tissue and the deformation due to the force is observed or measured using a conventional imaging technique, such as MRI and ultrasound imaging. Many attempts have been made to develop elasticity imaging methods with distinct capabilities, especially using ultrasound technology [3,4]. Some of these methods include vibro-acoustography [5], shear wave elasticity imaging (SWEI) [6], acoustic radiation force impulse imaging (ARFI) [7], harmonic motion imaging (HMI) [8], supersonic shear imaging (SSI) [9], and shear wave spectroscopy (SWS) [10]. Readers may refer to the review papers for further information about ultrasound-based elasticity imaging methods [11,12] and clinical use of ultrasound elastography [13,14,15,16,17].
In addition to the aforementioned methods, acoustic radiation force based elasticity methods that use gas bubbles or rigid spheres located within the tissue have been proposed to identify the mechanical properties of the surrounding medium [18,19,20,21,22]. However, these techniques use a high-powered laser to generate the bubble inside the medium which limits its application to shallow targets and requires local destruction of the material [20]. Additionally, there is a need to locate a bubble or rigid sphere within the tissue in a way which may not be permissible in human tissue. A more practical method based on the use of particles located at the tissue interface has recently been proposed for the identification of tissue viscoelastic properties [23,24]. It should be remembered that the acoustic radiation force-based elasticity imaging methods that remotely palpate the tissue produce a complicated displacement field [20]. The displacement field depends on the transducer focusing characteristics and target geometry. For these absorption-based techniques, the focal volume affects elasticity reconstruction. On the other hand, for elasticity imaging based on the use of small particles, particle displacement is independent of the focal zone of the transducer and is affected only by the viscoelastic properties of the local tissue. As the object in the elasticity imaging techniques based on the use of small particles can be considered as almost a discrete target, simple and accurate elasticity reconstruction can be performed. Thanks to the analytical models for the response of the small particles located within the medium or at the tissue interface, in addition to elastic properties of tissue, the density and viscosity of tissue can be identified. It should be noted that the paramaters such as viscosity can be used as additional biomarkers for the evaluation of tissues [25].
Elasticity imaging based on the absorption mechanism and the use of small particles is illustrated in Figure 1. Displacements change widely over the region exposed to the acoustic radiation force due to differences in the applied force over the same region for the elasticity imaging methods based on the absorption mechanism (Figure 1a). On the other hand, for the elasticity imaging techniques based on the use of small particles, only the particle displacement is measured, which can be achieved to align with the focus of the applied force (Figure 1b). Because the radiation force applied to the particle located within the tissue or at the tissue interface is generally much greater than that arising in purely absorbing media, lower acoustic power can be used in moderately attenuating media for the elasticity imaging techniques based on the use of small particles. Similar displacements can be achieved with far lower acoustic intensities in particle-based methods. The elasticity imaging methods based on the use of small particles located within the tissue and at the tissue interface have potential to determine local tissue properties with improved measurement resolution at variable depths.
Elasticity imaging based on the use of small particles is illustrated in Figure 2. As stated before, the particle can be located within the tissue or at the tissue interface for elasticity imaging based on the use of small particles. Although the particle is pushed mostly using ultrasound, the excitation force () can be applied using any other method such as magnetic or mechanical excitation. Monitoring the displacement of the particle () using ultrasound is practical, yet particle imaging can be performed using other methods, such as optical imaging or magnetic resonance imaging. Although there is a need to use a coupling material such as gel or water between the tissue and transducer for ultrasonic excitation, there is no need for a coupling medium (or only air is around the medium) for other excitation methods such as a magnetic force. As stated before, thanks to the analytical models for the small particles located within the tissue and at the tissue interface, in addition to elastic properties of tissue, the density, Poisson’s ratio and viscosity of tissue can be identified in the elasticity imaging based on the use of small particles. Therefore, instead of the use of the term elasticity imaging, we suggest the use of the term viscoelasticity imaging.
Although there have been a huge number of research studies (e.g., [26,27]) and there are some review papers (e.g., [11,12]) on the elasticity imaging methods based on the absorption mechanism, there have been a limited number of research studies on the elasticity imaging methods based on the use of small particles. To the best knowledge of authors, there is currently no review study focusing on the elasticity imaging techniques based on the use of small particles located within the tissue and at the tissue interface. We believe that elasticity imaging based on the use of small particles have potential to change the field, as they can provide the determination of accurate and local tissue elastic properties as well as density and viscosity. Here, we examined the mathematical models for small particles located within the tissue and at the tissue interface. In addition, we compared the mathematical models for small particles located within the tissue and at the tissue interface and provided elasticity/viscoelasticity imaging results based on these models and experiments. This paper is the first review study on the elasticity and viscoelasticity imaging based on the use of small (nanometer-, micrometer-, or millimeter-sized) particles (e.g., bubbles and rigid and soft spheres) located within the tissue and at the tissue interface exposed to static and dynamic external forces. Elasticity/viscoelasticity imaging methods based on the use of particles (bubbles and rigid spheres) located within the tissue are presented in Section 2. Elasticity/viscoelasticity imaging techniques based on the use of particles (bubbles, rigid and soft spheres) located at the tissue interface are covered in Section 3. It should be noted that, the viscoelastic medium was mostly modelled using the Kelvin-Voigt model in the models available in the literature. In this paper, we extended the responses of particles located within the tissue and at the tissue interface and generalized the relations so that, in addition to the Kelvin-Voigt model, any viscoelastic rheological model such as the Maxwell, generalized Maxwell, standard linear solid and Kelvin-Voigt fractional derivative models can be used to simulate the medium. Furthermore, based on the new advances, in this paper, we updated some of the models for the responses of the particles located within the tissue and at the tissue interface available in the literature. The mathematical models for the small particles located within the tissue and at the tissue interface are compared and the elasticity and viscoelasticity imaging methods based on the use of the particles are evaluated in Section 4. Some concluding remarks are given in Section 5.
2. Elasticity/Viscoelasticity Imaging Using Particles Located within Tissue
2.1. Bubble Located within Tissue
There many mathematical models for radial oscillations of a bubble inside the elastic and viscoelastic media exposed to sound (e.g., [28,29,30]). However, these models generally are the extensions of the well-known Rayleigh-Plesset equation (e.g., [31]) and were proposed for studying the dynamics of bubbles inside the tissue, rather than for using them for elasticity imaging. The first important study for the purpose of elasticity imaging using a bubble located within the medium was performed by Ilinskii et al. [19] in 2005. In this model, the radiation pressure on the target is estimated by integrating the acoustic field in the surrounding medium with respect to the target surface (i.e., a technique similar to the one applied to estimate Stockes’ drag of a solid sphere inside viscous incompressible liquid was used [32]). Hence, by assuming the elastic medium as isotropic, homogeneous, incompressible, and non-viscous, Ilinskii et al. [19] proposed models for the static and dynamic displacements of a bubble located within the soft medium in response to acoustic radiation force. The model for an external static force and elastic medium is given by [19]:
where is the shear modulus of the medium, and is the radius of the bubble. It should be noted that the Young’s modulus is related to the shear modulus by for homogeneous isotropic materials. Ilinskii et al. [19] obtained the following equation of motion for the dynamic displacement of a bubble located within the soft medium in response to acoustic radiation force:
where
Here, is the density of the medium, and shows the time. The solution of Eq. (2) provides the dynamic force-displacement relation for a bubble located within the soft elastic medium. The solution of Eq. (2) can be determined analytically (e.g., using the Laplace transformation) or numerically. Readers can refer to the reference [19] to see the details for the derivations of the models (i.e., Eqs. (1) and (2)). By assuming the medium as isotropic, homogeneous, and incompressible, a mathematical model for the dynamic response of a bubble located within the soft viscoelastic medium in response to acoustic radiation force was proposed. The frequency-domain equation that relates the displacement of the bubble located within the soft viscoelastic medium for a dynamic force is given by [19]:
where is the viscosity of the medium, is the complex wave number of the shear wave with frequency , , is the Fourier transform of the external force , and is a spectral component of the bubble displacement . Readers can refer to the reference [19] to see the details for the derivation of the model (i.e., Eq. (3)). The response to a rectangular pulse with an amplitude of and a duration of represents the impulse response for small values and the step response for large values with . Therefore, the external force is assumed as a rectangular pulse here. It is noted that the Fourier transform of the rectangular pulse is . In conclusion, the dynamic displacement of the bubble located within the soft viscoelastic medium can be calculated using the inverse Fourier transformation by [33]:
By dividing the time duration into N points (e.g., N = 1000), and the calculations can be repeated over the entire period of interest to find the dynamic response of the bubble located within the medium numerically using Eq. (4).
Exploiting the static model (i.e., Eq. (1)), Erpelding et al. [20] identified the Young’s moduli of gelatin phantoms. For this purpose, acoustic radiation force was applied to individual bubbles generated by laser-induced optical breakdown. A two-element confocal ultrasonic transducer generated acoustic radiation force on individual bubbles while monitoring their displacement within the medium. Tone burst pushes of varying duration were applied by the outer element at 1.5 MHz. The inner element received pulse-echo recordings at 7.44 MHz. Maximum bubble displacements were used to the determine the Young’s moduli for different gel phantoms; average Young’s moduli varied from 1.7 kPa to 4.8 kPa as the gel concentration was increased from 5 to 9%. Erpelding et al. [34] used the same technique to map age-related elasticity changes in porcine lenses. Hollman et al. [35] used the same technique to map elasticity in human lenses; for middle-age lenses, Young’s modulus ranged from 5.2 kPa in the center to 1.1 kPa on the periphery and for old-age lenses, Young’s modulus ranged from 10.6 kPa in the center to 1.4 kPa on the periphery. Similarly, Mikula et al. [36] exploited this simple model to determine corneal elasticity. For this purpose, a low-frequency, high-intensity acoustic force is used to displace a femtosecond laser-generated microbubble, while high-frequency, low-intensity ultrasound is used to monitor the position of the microbubble within the ex vivo human cornea. They determined the Young’s modulus of E = 1.39 ± 0.28 kPa for the central anterior cornea and E = 0.71 ± 0.21 kPa for the central posterior cornea. In another study, using the same technique, Mikula et al. [37] determined elasticity map across the ex vivo human cornea.
Using the dynamic model presented above, Yoon et al. [38] estimated the mechanical properties of gelatin phantoms using a laser-induced microbubble interrogated by the acoustic radiation force. For this purpose, A 3.5 MHz ultrasound transducer was used to generate acoustic radiation force to excite a laser-induced microbubble and the motion of the microbubble was tracked using a 25 MHz imaging transducer. By using both maximum displacements and the times of maximum displacement of bubbles, they determined the Young’s modulus of the 3% gelatin phantom as E = 4.37 ± 0.26 kPa. In another study, exploiting the same model, the Young’s moduli and viscosities of ex vivo bovine and porcine crystalline lenses were identified using the time characteristics of the microbubble dynamics [39].
In the model presented above (i.e., Eqs. (3) and (4)), the viscoelastic medium was modelled using the Kelvin-Voigt model. In this paper, we extended the response of a bubble located within the soft viscoelastic medium and generalized the relations so that, in addition to the Kelvin-Voigt model, any viscoelastic rheological model such as the Maxwell, generalized Maxwell, standard linear solid and Kelvin-Voigt fractional derivative models can be used to simulate the medium. In conclusion, the generalized model for the response of a bubble located within the soft viscoelastic medium can be represented as:
where is the complex modulus of the medium material; and representing the storage and loss moduli, respectively. Readers may refer to the reference [22] for the expressions of and for different rheological models.
2.2. Sphere Located within Tissue
The response of a sphere located within the medium has been studied for over the past 70 years. Oestreicher [40] obtained mechanical impedance of an oscillating sphere inside a viscoelastic medium in frequency domain by modelling the medium using the Kelvin-Voigt model. Chen et al. [18] used the measured response of a vibrating sphere inside gelatin phantom excited by modulated ultrasound and the model in the reference [40] for the determination of the material viscoelastic properties. However, the first important study for the purpose of elasticity imaging using a sphere located within the medium was performed by Ilinskii et al. [19] in 2005. By assuming the elastic medium as isotropic, homogeneous, incompressible, and non-viscous, Ilinskii et al. [19] proposed models for the static and dynamic displacements of a rigid sphere located within the medium in response to the acoustic radiation force. The model for a static force and elastic medium is given by [19]:
For a dynamic force and an elastic medium, they obtained the following equation of motion [19]:
where
here, is the density of the sphere. The solution of Eq. (7) provides the dynamic force-displacement relation for a sphere located within the elastic medium. The solution of Eq. (7) can be determined analytically (e.g., using the Laplace transformation) or numerically. Readers can refer to the reference [19] to see the details for the derivations of the models (i.e., Eqs. (6) and (7)). By assuming the medium as isotropic, homogeneous, and incompressible, Aglyamov et al. [21] developed a mathematical model for the dynamic response of a sphere located within the viscoelastic medium in response to acoustic radiation force in 2007. The frequency-domain equation that relates the displacement of the sphere located within the viscoelastic medium for a dynamic force is given by [21]:
where is the mass of the sphere. Readers can refer to the reference [21] to see the details for the derivation of the model (i.e., Eq. (8)). By performing some operations, the dynamic displacement of the sphere located within the viscoelastic medium can be found by [33]:
By dividing the time duration into N points (e.g., N = 1000), and the calculations can be repeated over the entire period of interest to find the dynamic response of the sphere located within the viscoelastic medium numerically using Eq. (9).
Chen et al. [18], by using the measured response of a vibrating sphere inside the gelatin phantom excited by modulated ultrasound and the expression for the mechanical impedance of a vibrating sphere inside the gelation phantom, determined the viscoelastic material properties of gelatin. Karpiouk et al. [41] used the dynamic model presented above for a sphere inside the tissue to determine the shear modulus of the gelatin phantom. For this purpose, a short pulse produced by a 1.5-MHz highly focused ultrasound transducer was used to initiate the motion of a rigid sphere inside the elastic medium and another 25 MHz focused ultrasound transducer operating in pulse-echo mode was used to track the displacement of the sphere. They determined the shear modulus of the gelatin phantom using maximum displacement of the sphere and the time required for the rigid sphere to reach the maximum displacement (no need for knowing the applied force). Using a similar test setup, Shih et al. [42] exploited the spatiotemporal behavior of the displacement of the sphere and determined the viscoelastic properties of porcine clot (with different hematocrits); the value of shear modulus of blood clot decreased from 585±127 Pa at plasma to 168±26 Pa at 40% hematocrit and the viscosity of blood clot increased from 0.125±0.025 Pa s at plasma to 0.28±0.12 Pa s at 40% hematocrit. Similarly, Huang et al. [43], by using the dynamic model, identified the shear modulus and viscosity of porcine blood clots based on the spatiotemporal behavior of the sphere displacement.
It should be noted that the medium was modelled using the Kelvin-Voigt model in the model presented above (i.e., Eqs. (8) and (9)). Urban et al. [22] extended the vibration response of a sphere located within the viscoelastic medium and generalized the relations so that, in addition to the Kelvin-Voigt model, any viscoelastic rheological model such as the Maxwell, generalized Maxwell, standard linear solid and Kelvin-Voigt fractional derivative models can be used to simulate the medium. In conclusion, the generalized model for the vibration response of a sphere located within the viscoelastic medium can be written as:
Readers may refer to the reference [22] for the expressions of for different rheological models. Urban et al. [22] determined the viscoelastic properties of gelatin and rubber phantoms by matching the measured and theoretically predicted responses of the spheres inside phantoms using different rheological models for the medium.
It should be noted that the particle located within the tissue has been mostly pushed using acoustic excitation (e.g., [22,41]). However, the particle can be pushed using any proper excitation method such as a magnetic force. Recently, Levy and Oldenburg [44] used magnetic force to excite a sphere inside the medium for the elasticity imaging purpose. They formulated the motion of a magnetic particle exposed to the special magnetomotive ultrasound driving force as in the frequency domain and then obtained an analytical expression by using the inverse Fourier transform as following:
where and are the amplitude and frequency of the driving force, respectively. Readers may refer to the reference [44] for the explanation and expressions of the parameters , , , , , , and . Cebrecos et al. [45] evaluated the complex shear modulus of gelatin based on the application of a magnetic force to a sphere inside the medium. As obtaining an ideal rectangular waveform for the current is not possible due to the inductance of the coil, they assume that the temporal evolution of the magnetic force is given by a trapezoidal pulse with a finite rise time . The Fourier transform of the trapezoidal pulsed force is . Hence, the displacement of the sphere located within the medium can be found using:
A phased-array system using 3 MHz ultrasound probe operating in pulse-echo mode was used to track the displacement of the sphere. Using the measured response and the theory (i.e., Eq. (12)), the shear moduli and viscosities of two different gelatin phantoms were determined as 1.86 ± 0.005 and 4.96 ± 0.025 kPa and 0.61 ± 0.01 and 1.05 ± 0.03 Pa s, respectively.
3. Elasticity/Viscoelasticity Imaging Using Particles Located at Tissue Interface
3.1. Bubble Located at Tissue Interface
Although there many mathematical models for the radial oscillations of a bubble inside the elastic and viscoelastic media exposed to sound (e.g., [28,29,30,31]) and some studies on the elasticity imaging based on the use of a bubble located within the elastic and viscoelastic media (e.g., [19,20,34,35]), there are a few studies on the responses of the bubbles located at the medium interfaces [24,46,47,48]. By assuming the elastic medium as isotropic, homogeneous, incompressible, and non-viscous, Koruk and Choi [46] proposed models for the static and dynamic displacements of a bubble located at the soft medium interface in response to an external force in 2018. The model for an external static force and a soft elastic medium is given by [46]:
For a dynamic force and a soft elastic medium, they obtained the following equation of motion [46]:
where
where is the angle corresponding to the displacement (see Figure 2b). The solution of Eq. (14) provides the dynamic force-displacement relation for a bubble located at the soft elastic medium interface. The solution of Eq. (14) can be determined numerically. Readers can refer to the reference [46] to see the details for the derivations of the models (i.e., Eqs. (13) and (14)). Later, Koruk and Choi [47], by assuming the medium as isotropic, homogeneous, and incompressible, proposed a mathematical model for the dynamic response of a bubble located at the soft viscoelastic medium interface in response to an external force in 2019. The frequency-domain equation that relates the displacement of the bubble located at the soft viscoelastic medium interface for a dynamic force can be expressed as:
In conclusion, the dynamic displacement of the bubble located at the soft viscoelastic medium interface in response to a rectangular pulse input can be calculated using the inverse Fourier transformation [47,49]:
Readers can refer to the references [46,47] to see the details for the derivation of the model (i.e., Eqs. (15) and (16)). By dividing the time duration into N points (e.g., N = 1000), and the calculations can be repeated over the entire period of interest to find the dynamic response of the bubble numerically using Eq. (16).
Koruk et al. [23] emitted ultrasound pulses across a tunnel of a gelatin material filled with a cloud of microbubbles. Ultrasound stimulated the microbubble cloud to move in the direction of wave propagation, press against the distal surface, and cause deformations. Shear waves propagated away from the palpation site with a velocity that was used to determine the Young's moduli of the gelatin phantoms ( where is the gel density). Hence, they determined E = 0.46 ± 0.06 kPa for a 2.5% gelatin phantom and E = 1.54 ± 0.32 kPa for a 5% gelation phantom. Bezer et al. [24] administered individual microbubbles into a wall-less hydrogel channel (diameter: 25–100 µm) and exposed to an acoustic pulse (centre frequency: 1 MHz, pulse length: 10 ms, peak-rarefactional pressures: 0.6–1.0 MPa). Using high-speed microscopy, each microbubble was tracked as it pushed against the hydrogel wall. Using the mathematical model explained above (i.e., Eq. 16) and the measured response of each microbubble located at the gel interface, they evaluated the Young’s moduli (2-8.7 kPa) and the viscosities (0.12-0.20 Pa s) of the hydrogels.
In the model presented above (i.e., Eqs. (15) and (16)), the soft viscoelastic medium was modelled using the Kelvin-Voigt model. In this paper, we extended the response of a bubble located at the soft viscoelastic medium interface and generalized the relations so that, in addition to the Kelvin-Voigt model, any viscoelastic rheological model such as the Maxwell, generalized Maxwell, standard linear solid and Kelvin-Voigt fractional derivative models can be used to simulate the medium. In conclusion, the generalized model for the response of a bubble located at the soft viscoelastic medium interface can be represented as:
Readers may refer to the reference [22] for the expressions of for different rheological models.
3.2. Sphere Located at Tissue Interface
The displacement of a rigid sphere located at the tissue interface exposed to a static force can be calculated using the well-known Hertz Model [49]. However, the Hertz model can produce accurate estimates when the ratio of the sphere displacement to the sphere radius is less than 0.1 [50]. Some modified Hertz models have been proposed for more accurate estimates for static loading (e.g., [51,52,53,54]). Koruk [55] proposed a Hertz model for small and large sphere displacements and a Poisson’s ratio of v = 0.45 given by:
Koruk [56] recently proposed an improved Hertz model based on the finite element analyses for small and large sphere displacements and different values of the Poisson’s ratio of the medium given below:
Among the many investigated models, this model was shown to be more accurate model to accurately estimate the sphere displacement for small and large sphere displacements (i.e., ) and practical values of the medium Poisson’s ratio (i.e., v = 0.30 – 0.49).
Using the force-displacement relation in Eq. (18) and considering the damping of the oscillations of the sphere due to the radiation of shear waves, Koruk [55] obtained an analytical model for the dynamic response of a rigid sphere located at the elastic medium interface. However, as stated before, the force-displacement relation in Eq. (19) was shown to produce more accurate estimates. Therefore, the analytical model for the dynamic response of a rigid sphere located at the elastic medium interface in response to a rectangular pulse input in the reference [55] was updated using the force-displacement relation in Eq. (19) and the solution is presented in this paper. Hence, the solution is obtained as:
where
here, is the reduced Young’s modulus for a system consisting of sphere located at a flat medium interface with a Young’s modulus and Poisson’s ratio . For a rigid sphere, the reduced Young’s modulus becomes . Koruk et al. [57,58] pushed a sphere located at the gelatin-phantom interface using a magnetic force. Using high-speed camera, the sphere was tracked as it pushed against the gelatin phantom. For example, using the mathematical model explained above (i.e., Eq. (20)) and the measured response of the sphere located at the gelatin-phantom interface, the shear moduli of some gelatin phantoms were determined to be 1.5-2.8 kPa [57]. In addition, by using an equivalent viscous damping ratio for the soft sample in the model (i.e., Eq. (20)), the equivalent viscous damping ratios of the gelatin phantoms were determined to be 0.12-0.38 [57].
Later, Koruk [56], by using the force-displacement relation in Eq. (19) and considering the medium viscosity via the Kelvin-Voigt model, updated the model for the dynamic response of a rigid sphere located at the medium interface in the reference [55]. Hence, the dynamic response of the sphere located at the viscoelastic medium interface in response to a rectangular pulse input in the frequency domain was obtained as:
where for a homogeneous isotropic material and a non-deformable sphere. The time-domain response of the sphere located at the viscoelastic interface was obtained using the inverse Fourier transform as following [56]:
In addition to the elastic properties of the medium and size of the sphere, this model includes the corrected models for the inertia force due to the medium involved in motion, the inertia force of the sphere, the damping due to the oscillations of the sphere due to the radiation of shear waves, and force-displacement relation that is valid for small and large sphere displacements and practical values of the medium Poisson’s ratio. Therefore, the model given above (i.e., Eqs. (21) and (22)) is considered as the most comprehensive mathematical model for the response of a sphere located at the medium interface in the literature. It should be noted that the model presented above (i.e., Eqs. (21) and (22)) can be extended for the response of a soft sphere located at the medium interface by using the reduced Young’s modulus where and and and show the Young’s moduli and Poisson’s ratios of the medium and deformable sphere, respectively. Furthermore, the model can be extended for a sphere located at a spherical interface by replacing with the relative radius where and show the radii of the spherical interface and sphere, respectively.
It should be noted that the particles such as nondeformable spherical objects are commonly used in conventional indentation tests [59,60] and AFM or atomic force microcopy [61] to identify the material properties. However, a sphere is attached to a rigid holder in conventional indentation tests and to a flexible beam in AFM. Usually, only the Young’s modulus of material can be determined via conventional indentation tests while an AFM system is quite complicated and expensive. Furthermore, these systems are used for material identification in laboratory and can not be used for in vivo elasticity imaging. For example, Huth et al. [62] determined the Young’s moduli of some hydrogels using AFM indentation tests and Hertz model. Orikasa et al. [63] developed an indentation-based testing platform for measuring ultra-soft materials’ stiffness at meso/macro-scales. However, the model proposed by Koruk [56] can be used to identify the shear or Young’s modulus and viscosity of the tissue. Even, this model can be used to evaluate the density and Poisson’s ratio of the tissue.
Koruk et al. [64] has recently been updated the mathematical model in [56] for a trapezoidal pulsed force. Furthermore, Koruk and Pouliopoulos [65] have recently extended the mathematical model for a spherical object located at elastic and viscoelastic medium interface in [55,56] for different practical loading cases. The mathematical models in [65] simulate the change in the frequency of oscillations of the spherical object located at medium interface with the applied load. It was shown that the frequencies of oscillations were different in the loading and unloading phases, and the frequency of oscillations decreased with decreasing external load [65]. In this study, the shear modulus and viscosity of a gelatin sample with a density of 1133 kg/m3 were determined to be 6800 Pa and 6.0 Pa⋅s, respectively [65].
4. Evaluation of Elasticity/Viscoelasticity Imaging Using Particles Located within Tissue and at Tissue Interface
4.1. Evaluation of Mathematical Models
Here, we compared the most updated mathematical models for small particles located within the tissue and at the tissue interface and evaluated the models. The radius of the bubbles used in practical ultrasound applications are a few micrometers (e.g., [48,66]). The radius of the bubbles and spheres used for material characterization in laboratory mostly range from tens of micrometers to a few millimeters (e.g., [21,38]). Therefore, here the results for spherical particles with radii of and 50 m were presented. The shear modulus of tissue mostly ranges from a few hundred Pascal to ten thousand of Pascal, while it is a few thousand Pascal for most tissues (e.g., [36,67]). For example, the shear modulus, density, and viscosity of the liver are around 2000 Pa [67], 1000 kg/m3 [68], and 0.5 Pas [69], respectively. Here, the analyses were performed for physiologically relevant materials (i.e., G = 2000–6000 Pa, ρ = 1000 kg/m3, and η= 0.01–1.6 Pas). It should be noted that, for all the models presented above, scripts were written using Matlab (MathWorks, Natick, MA, USA) to find the responses of the small particles located within the tissue and at the tissue interface.
The static force required for a specific normalized displacement (i.e., ) for a bubble inside the medium (Eq. (1)), a sphere inside the medium (Eq. (6)), a bubble located at the medium interface (Eq. (13)) and a sphere located at the medium interface (Eq. (19)) are presented in Figure 3a ( m) and 3c ( m). The stiffnesses for the four cases are plotted as a function of the normalized displacement in Figure 3b ( m) and 3d ( m). It is seen that the stiffness of the bubble and sphere inside the medium are constant, while the stiffness changes nonlinearly with the displacement for the particles located at the medium interface. This stiffness for a normalized displacement of is 0.05, 0.08, 0.19 and 0.28 N/m when m and 0.81, 1.37, 3.14 and 4.71 N/m when m for the sphere located at the medium interface, bubble located at the medium interface, bubble inside the medium and sphere inside the medium, respectively. As the stiffness of the system increases, the force required for a specific displacement increases. It is seen that the value of the force for a normalized displacement of is 0.07, 0.12, 0.28 and 0.42 N when m and 20.35, 34.36, 78.54 and 117.8 N when m for the sphere located at the medium interface, bubble located at the medium interface, bubble inside the medium and sphere inside the medium, respectively. This clearly shows the order of the external force needed to be applied for a specific particle displacement for different systems.
The dynamic responses for a bubble inside the medium (Eq. (4)), a sphere inside the medium (Eq. (9)), a bubble located at the medium interface (Eq. (16)) and a sphere located at the medium interface (Eq. (22)) for m (a and b) and m (c and d) and two different medium viscosities ( and 0.2 Pas) are presented in Figure 4. Among the four small particles with m, only the sphere located at the medium interface oscillates when Pas. However, this small sphere does not have any oscillations when the viscosity is increased to 0.2 Pas. On the other hand, when the particle size is increased (i.e., m), both the sphere inside the medium and the sphere located at the medium interface oscillate for the viscosity Pas. It is seen that this larger sphere located at the medium interface still oscillates for the viscosity Pas. As expected, the period of oscillations of the particle increases (or the frequency of oscillation decreases) as the size of the particle increases. For example, the frequencies of oscillations are 38168 and 2825 Hz for the and m spheres, respectively, when Pas. The viscosity has small effect on the frequency of oscillation. For example, the frequency of oscillations decreases from 2825 to 2674 Hz for the m sphere located at the medium interface when the medium viscosity increased from to 0.2 Pas. The time needed for the particle to reach the steady state increases as medium viscosity increases. However, the viscosity does not change the steady-state displacements of the particles.
The effects of medium shear modulus and viscosity on the dynamic responses of a bubble inside the medium (Eq. (4)), a sphere inside the medium (Eq. (9)), a bubble located at the medium interface (Eq. (16)) and a sphere located at the medium interface (Eq. (22)) for m are presented in Figure 5 and Figure 6, respectively. It is seen that the displacements of the particles decrease as the medium shear modulus increases. The particles react faster and the time to reach the steady-state decreases as the medium shear modulus increases and medium viscosity decreases. The period of oscillations decreases (or the frequency of oscillation increases) as the medium shear modulus increases. Although, the displacements of the particles at a specific time before steady-state decreases with increasing medium viscosity, the viscosity does not change the steady-state displacements of the particles. It is seen that the mathematical models for all the particles can properly simulate the effects of medium shear modulus and viscosity on the dynamic responses of the particles.
In addition to the time-domain data, the frequency-domain data (spectra) can be used to identify the tissue properties. The FFTs or Fast Fourier Transforms of the response of the sphere located at the medium interface for different medium shear moduli, densities and viscosities are presented in Figure 7. The spectra clearly show that the displacement of the particle decreases and its frequency of oscillations increases with increasing medium shear modulus. The displacement of the particle and its frequency of oscillations decrease with increasing medium density. The displacement of the particle considerably decreases, and its frequency of oscillations slightly decreases with increasing medium viscosity.
In addition to the part of the curve during loading, the part of the curve corresponding to unloading can be used to identify the tissue properties. The external force function and the dynamic responses for a bubble inside the medium (Eq. (4)), a sphere inside the medium (Eq. (9)), a bubble located at the medium interface (Eq. (16)) and a sphere located at the medium interface (Eq. (22)) for m (a and c) and m (b and d) and two different medium viscosities ( and 1.6 Pas) are presented in Figure 8. It is observed that as the viscosity of the medium increases, the response of the particle slows down during loading and unloading. The part of the curve corresponding to loading or unloading can be used to identify medium viscosity. The response rate is lowest for the bubble located at the medium interface and the response rate is quite high for the sphere located at the medium interface.
The displacement presented so far shows the displacement of the tip point (the tip contact point between the particle and medium). It should be noted the displacement is mostly used for elasticity and viscoelastic imaging purpose. However, if it is needed, the radial and polar displacement components and radial and polar stress components at every point in the medium can be determined (see Figure 2b). Readers may refer to the references [19,33] for the corresponding displacement and stress expressions for a bubble and sphere inside the medium. Readers may refer to the references [33,46] for a bubble located at the medium interface and to the reference [33] for the sphere located at the medium interface for the corresponding displacement and stress expressions.
4.2. Evaluation of Tissue Identification Systems
Some of the elasticity and viscoelasticity imaging studies based on measurements and the mathematical models presented above are summarized in Table 1. It is seen that ultrasonic excitation and monitoring is mostly used to identify material properties, though magnetic and mechanical excitation and optical and MRI imaging can be used for elasticity and viscoelastic imaging based on the use of small particles located within the tissue and at the tissue interface (see Figure 2a). It is seen that there are still no applications for identification of tissue properties based on the use of small particles located within the tissue and at the tissue interface for in vivo. One of the reasons for this is that, although the particles inside the tissue have been used for the last 70 years, this technique use a high-powered laser to create the bubble inside the medium which limits its application to shallow targets and requires local destruction of the material or it is needed to locate a bubble or rigid sphere inside the tissue in a way (e.g., [20,43]), which may not be permissible in human tissue. However, thanks to the mathematical models recently proposed for the particles located at the tissue interfaces [46,47,55,56,64,65], it is believed that tissue identification for in vivo can be possible in future. We believe that tissue identification based on the use of small particles located within the tissue and at the tissue interface have potential to change the field, as they can provide the determination of accurate and local tissue elastic properties as well as density, Poisson’s ratio and viscosity, thanks to the developed sophisticated mathematical models. As different from conventional elasticity imaging that map elastic properties of tissue, some other properties such as viscosity of the tissue can be identified, we suggest the use of the term viscoelasticity imaging.
As mentioned before, because there is a need to locate the particles inside the medium in a way for the use of mathematical models for the particles inside the medium, these models are even difficult to be used for the identification of tissue-mimicking materials or ex vivo in laboratory. However, as it is straightforward to locate a particle at the medium interface and this does not alternate material properties, the mathematical models for the particles located at the medium interface can be easily used for the identification of material properties of tissue-mimicking materials and ex vivo in laboratory. Because, in addition to the elastic properties of the medium and size of the sphere, the model for the sphere located at the medium interface includes the corrected models for the inertia force due to the medium involved in motion, the inertia force of the sphere, the damping due to the oscillations of the sphere due to the radiation of shear waves, and force-displacement relation that is valid for small and large sphere displacements and practical values of the medium Poisson’s ratio and its experimental setup is very straightforward, this system seems very promising for tissue identification purposes.
The mathematical models presented in this paper can be used to identify material properties in macroscopic or microscopic scales. If only the identification of the elasticity (or the Young’s modulus) or shear modulus of tissue is required (i.e., elasticity imaging), it is only needed to measure the displacement of the particle exposed to a static force or the steady-state displacement of the particle exposed to a dynamic force. Using the corresponding mathematical models for a static external force (i.e., Eqs. (1), (6), (13 or (19)), the elastic properties of the tissue can be identified. However, in addition to the elasticity or shear modulus, if the identification of the density and/or viscosity of tissue is required (i.e., viscoelasticity imaging), there is a need to measure the dynamic response of the particle and to use the corresponding mathematical models for dynamic loading (i.e., Eqs. (4), (9), (16) or (22)). By performing curve fitting using experimental data and the mathematical models, the elasticity modulus, density, and viscosity of tissue can be identified. Alternatively, the elastic properties can be determined from the steady-state displacement and the viscosity can be identified from the part of the measured curve corresponding to loading or unloading and the density of the tissue can be determined by matching the measured and theoretical oscillating frequency of the particle. Furthermore, as it may be difficult to know the magnitude of the applied force in practice, without needing the amplitude of the applied force, the elasticity or shear modulus and/or the density of tissue can be identified by matching the measured and theoretical oscillating frequency of the particle and the viscosity of tissue can be identified from the part of the measured curve corresponding to loading or unloading. In addition, the frequency of oscillation of the particle and damping of tissue can be determined using the spectrum of the time-domain data and the modal analysis methods such as half-power, circle-fit or line-fit (e.g., [70,71]).
5. Concluding Remarks
We investigated the elasticity/viscoelasticity imaging based on the use of small particles located within the tissue and at the tissue interface exposed to static and dynamic external loads in this paper. We compared the mathematical models for the small particles exposed to static and dynamic external loads and evaluated the elasticity and viscoelasticity imaging methods based on the use of small particles located within the tissue and at the tissue interface. Some concluding remarks are listed below.
- The acoustic radiation force-based elasticity imaging methods that remotely palpate tissue produce a complicated displacement field. The displacement field depends on the transducer focusing characteristics and target geometry. For these absorption-based techniques, the focal volume affects elasticity reconstruction. For elasticity imaging based on the use of small particles located within the tissue and at the tissue interface, particle displacement is independent of the focal zone of the transducer and is affected only by the viscoelastic properties of the local tissue and simple and accurate elasticity reconstruction can be performed. As sophisticated mathematical models for a particle located within the tissue and at the tissue interface can be developed, in addition to elastic properties, density and viscosity of tissue can be determined in the elasticity imaging based on the use of small particles.
- Because the radiation force applied to the particle located within the tissue and at the tissue interface is generally much greater than that arising in purely absorbing media, lower acoustic power can be used in moderately attenuating media for the elasticity imaging techniques based on the use of small particles.
- For the particles located inside the tissue, there is a need to use a high-powered laser to generate the bubble inside the medium which limits its application to shallow targets and requires local destruction of the material or it is needed to locate a bubble or rigid sphere inside the tissue in a way, which may not be permissible in human tissue. However, thanks to the models recently proposed for the particles located at the tissue interfaces, it is believed that tissue identification for in vivo can be possible in future. Furthermore, thanks to well-developed mathematical models and the ease of their use, the particles located at the medium interface can be conveniently used to identify tissue-mimicking materials and ex vivo in laboratory.
- The stiffness of the bubble and sphere inside the medium is constant, while the stiffness changes nonlinearly with the displacement for the particles located at the medium interfaces. The stiffness, hence, the force required for a specific displacement of the particle, increases from the sphere located at the medium interface to bubble located at the medium interface, bubble inside the medium and sphere inside the medium. The value of force needed for a ratio of 0.5 particle displacement to the radius of the special object and a medium with shear modulus of 5000 Pa is around 70-420 nano Newton and 20-120 micro-Newton for particles with radius of and m, respectively.
- The period of oscillations of the particle significantly increases (or the frequency of oscillation significantly decreases) as the size of the particle increases. However, even the sphere located at the medium interface does not have any oscillations if the particle size is small and the medium viscosity is considerably high.
- The displacements of the particles decrease as the medium shear modulus increases. The particles react faster and the time to reach to the steady-state decreases as the medium shear modulus increases. The period of oscillations decreases (or the frequency of oscillation increases) as the medium shear modulus increases.
- The displacements of the particles at a specific time before steady-state decreases with increasing medium viscosity. The particles react faster, and the time needed for the particle to reach the steady state decreases as medium viscosity decreases. The viscosity does not change the steady-state displacements of the particles. The frequency of oscillation of the particle interacting with tissue slightly decreases as medium viscosity increases.
- The frequency of oscillations of the particle interacting with tissue deceases with increasing medium density.
- If only the identification of the elasticity (or Young’s modulus) or shear modulus of tissue is required (i.e., elasticity imaging), it is only needed to measure the displacement of the particle exposed to a static force or the steady-state displacement of the particle exposed to a dynamic force. Using the corresponding mathematical models for a static external force, the elastic properties of the tissue can be identified. However, in addition to the elasticity or shear modulus, if the identification of the density and/or viscosity of tissue is required (i.e., viscoelasticity imaging), there is a need to measure the dynamic response of the particle and to use the corresponding mathematical models for dynamic loading. By performing curve fitting using experimental data and the mathematical models, the Young’s or shear modulus, density and viscosity of tissue can be identified.
- Alternatively, the elastic properties can be determined from the steady-state displacement and the viscosity can be identified from the part of the measured curve corresponding to loading or unloading and the density of the tissue can be determined by matching the measured and theoretical oscillating frequency of the particle. Furthermore, as it may be difficult to know the magnitude of the applied force in practice, without needing the amplitude of the applied force, the Young’s modulus or shear modulus and/or the density of tissue can be identified by matching the measured and theoretical oscillating frequency of the particle and the viscosity of tissue can be identified from the part of the measured curve corresponding to loading or unloading.
- Although ultrasonic excitation and monitoring is mostly used to identify material properties based on the use of small particles, magnetic and mechanical excitation and optical and MRI imaging can be used for elasticity and viscoelastic imaging based on the use of small particles.
We believe that tissue identification based on the use of small particles located within the tissue and at the tissue interface have potential to change the field, as they can provide the determination of accurate and local tissue elastic properties as well as density, Poisson’s ratio, and viscosity, thanks to the developed sophisticated mathematical models. As different from conventional elasticity imaging that map elastic properties of tissue, some other properties such as density, Poisson’s ratio and viscosity of tissue can be identified using small particles located within the tissue and at the tissue interface, we suggest the use of the term viscoelasticity imaging.
Funding
Hasan Koruk was supported by the Focused Ultrasound Foundation (grant number FUS1050R1) and the Little Princess Trust (grant number CCLGA 2022 25).
Data Availability Statement
The data that support the findings of this study are available from the corresponding author on reasonable request.
Conflicts of Interest
The authors declare no conflict of interest.
References
- Konofagou, E.E. Quo Vadis Elasticity Imaging? Ultrasonics 2004, 42, 331–336. [Google Scholar] [CrossRef] [PubMed]
- Manduca, A.; Oliphant, T.E.; Dresner, M.A.; Mahowald, J.L.; Kruse, S.A.; Amromin, E.; Felmlee, J.P.; Greenleaf, J.F.; Ehman, R.L. Magnetic Resonance Elastography: Non-Invasive Mapping of Tissue Elasticity. Med Image Anal 2001, 5, 237–254. [Google Scholar] [CrossRef]
- Lee, S.; Eun, L.Y.; Hwang, J.Y.; Eun, Y. Ex Vivo Evaluation of Mechanical Anisotropic Tissues with High-Frequency Ultrasound Shear Wave Elastography. Sensors 2022, 22. [Google Scholar] [CrossRef]
- Ličen, U.; Kozinc, Ž. Using Shear-Wave Elastography to Assess Exercise-Induced Muscle Damage: A Review. Sensors 2022, 22, 7574. [Google Scholar] [CrossRef] [PubMed]
- Mostafa, F.; F. , G.J. Ultrasound-Stimulated Vibro-Acoustic Spectrography. Science (1979) 1998, 280, 82–85. [Google Scholar] [CrossRef] [PubMed]
- Sarvazyan, A.P.; Rudenko, O. V; Swanson, S.D.; Fowlkes, J.B.; Emelianov, S.Y. Shear Wave Elasticity Imaging: A New Ultrasonic Technology of Medical Diagnostics. Ultrasound Med Biol 1998, 24, 1419–1435. [Google Scholar] [CrossRef]
- Nightingale, K.R.; Palmeri, M.L.; Nightingale, R.W.; Trahey, G.E. On the Feasibility of Remote Palpation Using Acoustic Radiation Force. J Acoust Soc Am 2001, 110, 625–634. [Google Scholar] [CrossRef]
- Konofagou, E.E.; Hynynen, K. Localized Harmonic Motion Imaging: Theory, Simulations and Experiments. Ultrasound Med Biol 2003, 29, 1405–1413. [Google Scholar] [CrossRef]
- Bercoff, J.; Tanter, M.; Fink, M. Supersonic Shear Imaging: A New Technique for Soft Tissue Elasticity Mapping. IEEE Trans Ultrason Ferroelectr Freq Control 2004, 51, 396–409. [Google Scholar] [CrossRef]
- Deffieux, T.; Montaldo, G.; Tanter, M.; Fink, M. Shear Wave Spectroscopy for in Vivo Quantification of Human Soft Tissues Visco-Elasticity. IEEE Trans Med Imaging 2009, 28, 313–322. [Google Scholar] [CrossRef]
- Palmeri, M.L.; Nightingale, K.R. Acoustic Radiation Force-Based Elasticity Imaging Methods. Interface Focus 2011, 1, 553–564. [Google Scholar] [CrossRef]
- Doherty, J.; Trahey, G.; Nightingale, K.; Palmeri, M. Acoustic Radiation Force Elasticity Imaging in Diagnostic Ultrasound. IEEE Trans Ultrason Ferroelectr Freq Control 2013, 60, 685–701. [Google Scholar] [CrossRef]
- Shiina, T.; Nightingale, K.R.; Palmeri, M.L.; Hall, T.J.; Bamber, J.C.; Barr, R.G.; Castera, L.; Choi, B.I.; Chou, Y.-H.; Cosgrove, D.; et al. WFUMB Guidelines and Recommendations for Clinical Use of Ultrasound Elastography: Part 1: Basic Principles and Terminology. Ultrasound Med Biol 2015, 41, 1126–1147. [Google Scholar] [CrossRef] [PubMed]
- Barr, R.G.; Nakashima, K.; Amy, D.; Cosgrove, D.; Farrokh, A.; Schafer, F.; Bamber, J.C.; Castera, L.; Choi, B.I.; Chou, Y.-H.; et al. WFUMB Guidelines and Recommendations for Clinical Use of Ultrasound Elastography: Part 2: Breast. Ultrasound Med Biol 2015, 41, 1148–1160. [Google Scholar] [CrossRef] [PubMed]
- Ferraioli, G.; Filice, C.; Castera, L.; Choi, B.I.; Sporea, I.; Wilson, S.R.; Cosgrove, D.; Dietrich, C.F.; Amy, D.; Bamber, J.C.; et al. WFUMB Guidelines and Recommendations for Clinical Use of Ultrasound Elastography: Part 3: Liver. Ultrasound Med Biol 2015, 41, 1161–1179. [Google Scholar] [CrossRef]
- Cosgrove, D.; Barr, R.; Bojunga, J.; Cantisani, V.; Chammas, M.C.; Dighe, M.; Vinayak, S.; Xu, J.-M.; Dietrich, C.F. WFUMB Guidelines and Recommendations on the Clinical Use of Ultrasound Elastography: Part 4. Thyroid. Ultrasound Med Biol 2017, 43, 4–26. [Google Scholar] [CrossRef] [PubMed]
- Barr, R.G.; Cosgrove, D.; Brock, M.; Cantisani, V.; Correas, J.M.; Postema, A.W.; Salomon, G.; Tsutsumi, M.; Xu, H.-X.; Dietrich, C.F. WFUMB Guidelines and Recommendations on the Clinical Use of Ultrasound Elastography: Part 5. Prostate. Ultrasound Med Biol 2017, 43, 27–48. [Google Scholar] [CrossRef] [PubMed]
- Chen, S.; Fatemi, M.; Greenleaf, J.F. Remote Measurement of Material Properties from Radiation Force Induced Vibration of an Embedded Sphere. J Acoust Soc Am 2002, 112, 884–889. [Google Scholar] [CrossRef] [PubMed]
- Ilinskii, Y.A.; Meegan, G.D.; Zabolotskaya, E.A.; Emelianov, S.Y. Gas Bubble and Solid Sphere Motion in Elastic Media in Response to Acoustic Radiation Force. J Acoust Soc Am 2005, 117, 2338–2346. [Google Scholar] [CrossRef]
- Erpelding, T.N.; Hollman, K.W.; O’Donnell, M. Bubble-Based Acoustic Radiation Force Elasticity Imaging. Ultrasonics, Ferroelectrics, and Frequency Control, IEEE Transactions on 2005, 52, 971–979. [Google Scholar] [CrossRef]
- Aglyamov, S.R.; Karpiouk, A.B.; Ilinskii, Y.A.; Zabolotskaya, E.A.; Emelianov, S.Y. Motion of a Solid Sphere in a Viscoelastic Medium in Response to Applied Acoustic Radiation Force: Theoretical Analysis and Experimental Verification. J Acoust Soc Am 2007, 122, 1927–1936. [Google Scholar] [CrossRef] [PubMed]
- Urban, M.W.; Nenadic, I.Z.; Mitchell, S.A.; Chen, S.; Greenleaf, J.F. Generalized Response of a Sphere Embedded in a Viscoelastic Medium Excited by an Ultrasonic Radiation Force. J Acoust Soc Am 2011, 130, 1133–1141. [Google Scholar] [CrossRef] [PubMed]
- Koruk, H.; El Ghamrawy, A.; Pouliopoulos, A.N.; Choi, J.J. Acoustic Particle Palpation for Measuring Tissue Elasticity. Appl Phys Lett 2015, 107. [Google Scholar] [CrossRef] [PubMed]
- Bezer, J.H.; Koruk, H.; Rowlands, C.J.; Choi, J.J. Elastic Deformation of Soft Tissue-Mimicking Materials Using a Single Microbubble and Acoustic Radiation Force. Ultrasound Med Biol 2020, 46, 3327–3338. [Google Scholar] [CrossRef] [PubMed]
- Rus, G.; Faris, I.H.; Torres, J.; Callejas, A.; Melchor, J. Why Are Viscosity and Nonlinearity Bound to Make an Impact in Clinical Elastographic Diagnosis? Sensors 2020, 20, 2379. [Google Scholar] [CrossRef] [PubMed]
- Nightingale, K.; Soo, M.S.; Nightingale, R.; Trahey, G. Acoustic Radiation Force Impulse Imaging: In Vivo Demonstration of Clinical Feasibility. Ultrasound Med Biol 2002, 28, 227–235. [Google Scholar] [CrossRef] [PubMed]
- Fatemi, M.; Greenleaf, J.F. Vibro-Acoustography: An Imaging Modality Based on Ultrasound-Stimulated Acoustic Emission. Proceedings of the National Academy of Sciences 1999, 96, 6603 LP – 6608. [Google Scholar] [CrossRef] [PubMed]
- Yang, X.; Church, C.C. A Model for the Dynamics of Gas Bubbles in Soft Tissue. J Acoust Soc Am 2005, 118, 3595–3606. [Google Scholar] [CrossRef]
- Zabolotskaya, E.A.; Ilinskii, Y.A.; Meegan, G.D.; Hamilton, M.F. Modifications of the Equation for Gas Bubble Dynamics in a Soft Elastic Medium. J Acoust Soc Am 2005, 118, 2173–2181. [Google Scholar] [CrossRef]
- Barajas, C.; Johnsen, E. The Effects of Heat and Mass Diffusion on Freely Oscillating Bubbles in a Viscoelastic, Tissue-like Medium. Journal of the Acoustical Society of America 2017, 141, 908–918. [Google Scholar] [CrossRef]
- Hamaguchi, F.; Ando, K. Linear Oscillation of Gas Bubbles in a Viscoelastic Material under Ultrasound Irradiation. Physics of Fluids 2015, 27, 113103. [Google Scholar] [CrossRef]
- Landau, L.D. ; E. M. Lifshitz Fluid Mechanics; 2nd ed.; Pergamon: New York, 1987. [Google Scholar]
- Koruk, H. Assessment of the Models for Predicting the Responses of Spherical Objects in Viscoelastic Mediums and at Viscoelastic Interfaces. IOP Conf Ser Mater Sci Eng 2021, 1150, 012016. [Google Scholar] [CrossRef]
- Erpelding, T.N.; Hollman, K.W.; O’Donnell, M. Mapping Age-Related Elasticity Changes in Porcine Lenses Using Bubble-Based Acoustic Radiation Force. Exp Eye Res 2007, 84, 332–341. [Google Scholar] [CrossRef] [PubMed]
- Hollman, K.W.; O’Donnell, M.; Erpelding, T.N. Mapping Elasticity in Human Lenses Using Bubble-Based Acoustic Radiation Force. Exp Eye Res 2007, 85, 890–893. [Google Scholar] [CrossRef]
- Mikula, E.; Hollman, K.; Chai, D.; Jester, J.V.; Juhasz, T. Measurement of Corneal Elasticity with an Acoustic Radiation Force Elasticity Microscope. Ultrasound Med Biol 2014, 40, 1671–1679. [Google Scholar] [CrossRef] [PubMed]
- Mikula, E.R.; Jester, J. V; Juhasz, T. Measurement of an Elasticity Map in the Human Cornea. Invest Ophthalmol Vis Sci 2016, 57, 3282–3286. [Google Scholar] [CrossRef]
- Yoon, S.; Aglyamov, S.R.; Karpiouk, A.B.; Kim, S.; Emelianov, S.Y. Estimation of Mechanical Properties of a Viscoelastic Medium Using a Laser-Induced Microbubble Interrogated by an Acoustic Radiation Force. J Acoust Soc Am 2011, 130, 2241–2248. [Google Scholar] [CrossRef]
- Yoon, S.; Aglyamov, S.; Karpiouk, A.; Emelianov, S. The Mechanical Properties of Ex Vivo Bovine and Porcine Crystalline Lenses: Age-Related Changes and Location-Dependent Variations. Ultrasound Med Biol 2013, 39, 1120–1127. [Google Scholar] [CrossRef] [PubMed]
- Oestreicher, H.L. Field and Impedance of an Oscillating Sphere in a Viscoelastic Medium with an Application to Biophysics. J Acoust Soc Am 1951, 23, 707–714. [Google Scholar] [CrossRef]
- Karpiouk, A.B.; Aglyamov, S.R.; Ilinskii, Y.A.; Zabolotskaya, E.A.; Emelianov, S.Y. Assessment of Shear Modulus of Tissue Using Ultrasound Radiation Force Acting on a Spherical Acoustic Inhomogeneity. IEEE Trans Ultrason Ferroelectr Freq Control 2009, 56, 2380–2387. [Google Scholar] [CrossRef]
- Shih, C.; Liu, T.; Huang, C. In Vitro Assessments of Viscoelastic Properties of Fibrin Clot by Using Acoustic Radiation Force on a Solid Sphere. In Proceedings of the 2010 IEEE International Ultrasonics Symposium; 2010; pp. 479–482. [Google Scholar]
- Huang, C.-C.; Shih, C.-C.; Liu, T.-Y.; Lee, P.-Y. Assessing the Viscoelastic Properties of Thrombus Using a Solid-Sphere-Based Instantaneous Force Approach. Ultrasound Med Biol 2011, 37, 1722–1733. [Google Scholar] [CrossRef] [PubMed]
- Levy, B.E.; Oldenburg, A.L. Single Magnetic Particle Motion in Magnetomotive Ultrasound: An Analytical Model and Experimental Validation. IEEE Trans Ultrason Ferroelectr Freq Control 2021, 68, 2635–2644. [Google Scholar] [CrossRef] [PubMed]
- Cebrecos, A.; Jiménez, N.; Tarazona, R.; Company, M.; Benlloch, J.M.; Camarena, F. Characterization of Viscoelastic Media Combining Ultrasound and Magnetic-Force Induced Vibrations on an Embedded Soft Magnetic Sphere. IEEE Trans Ultrason Ferroelectr Freq Control 2021, 68, 3540–3548. [Google Scholar] [CrossRef] [PubMed]
- Koruk, H.; Choi, J.J. Displacement of a Bubble by Acoustic Radiation Force into a Fluid–Tissue Interface. J Acoust Soc Am 2018, 143, 2535–2540. [Google Scholar] [CrossRef] [PubMed]
- Koruk, H.; Choi, J.J. Displacement of a Bubble Located at a Fluid-Viscoelastic Medium Interface. Journal of the Acoustical Society of America 2019, 145, EL410–EL416. [Google Scholar] [CrossRef] [PubMed]
- Saharkhiz, N.; Koruk, H.; Choi, J.J. The Effects of Ultrasound Parameters and Microbubble Concentration on Acoustic Particle Palpation. J Acoust Soc Am 2018, 144, 796–805. [Google Scholar] [CrossRef]
- Koruk, H. Development of a Model for Predicting Dynamic Response of a Sphere at Viscoelastic Interface: A Dynamic Hertz Model. IOP Conf Ser Mater Sci Eng 2021, 1150, 012015. [Google Scholar] [CrossRef]
- Wu, C.-E.; Lin, K.-H.; Juang, J.-Y. Hertzian Load–Displacement Relation Holds for Spherical Indentation on Soft Elastic Solids Undergoing Large Deformations. Tribol Int 2016, 97, 71–76. [Google Scholar] [CrossRef]
- Sneddon, I.N. The Relation between Load and Penetration in the Axisymmetric Boussinesq Problem for a Punch of Arbitrary Profile. Int J Eng Sci 1965, 3, 47–57. [Google Scholar] [CrossRef]
- Dimitriadis, E.K.; Horkay, F.; Maresca, J.; Kachar, B.; Chadwick, R.S. Determination of Elastic Moduli of Thin Layers of Soft Material Using the Atomic Force Microscope. Biophys J 2002, 82, 2798–2810. [Google Scholar] [CrossRef]
- Guo, Z.; Hao, M.; Jiang, L.; Li, D.; Chen, Y.; Dong, L. A Modified Hertz Model for Finite Spherical Indentation Inspired by Numerical Simulations. European Journal of Mechanics - A/Solids 2020, 83, 104042. [Google Scholar] [CrossRef]
- Kontomaris, S. V; Malamou, A. A Novel Approximate Method to Calculate the Force Applied on an Elastic Half Space by a Rigid Sphere. Eur J Phys 2021, 42, 25010. [Google Scholar] [CrossRef]
- Koruk, H. Modelling Small and Large Displacements of a Sphere on an Elastic Half-Space Exposed to a Dynamic Force. Eur J Phys 2021, 52, 055006. [Google Scholar] [CrossRef]
- Koruk, H. Development of an Improved Mathematical Model for the Dynamic Response of a Sphere Located at a Viscoelastic Medium Interface. Eur J Phys 2022, 43, 25002. [Google Scholar] [CrossRef]
- Koruk, H.; Yurdaer, S.B.; Koc, H.O.; Besli, A. Identification of the Viscoelastic Properties of Soft Materials Using a Convenient Dynamic Indentation System and Procedure. Mater Today Proc 2022, 57, 464–468. [Google Scholar] [CrossRef]
- Koruk, H.; Besli, A.; Koc, H.O.; Yurdaer, S.B. Identification of Material Viscoelastic Properties Using the Motion of a Rigid Sphere Located at Tissue-Mimicking Material Interface in Response to a Dynamic Force. Materials Science Forum 2022, 73–78. [Google Scholar] [CrossRef]
- Qiang, B.; Greenleaf, J.; Oyen, M.; Zhang, X. Estimating Material Elasticity by Spherical Indentation Load-Relaxation Tests on Viscoelastic Samples of Finite Thickness. IEEE Trans Ultrason Ferroelectr Freq Control 2011, 58, 1418–1429. [Google Scholar] [CrossRef] [PubMed]
- Boots, J.N.M.; Fokkink, R.; van der Gucht, J.; Kodger, T.E. Development of a Multi-Position Indentation Setup: Mapping Soft and Patternable Heterogeneously Crosslinked Polymer Networks. Review of Scientific Instruments 2019, 90, 15108. [Google Scholar] [CrossRef] [PubMed]
- Chim, Y.H.; Mason, L.M.; Rath, N.; Olson, M.F.; Tassieri, M.; Yin, H. A One-Step Procedure to Probe the Viscoelastic Properties of Cells by Atomic Force Microscopy. Sci Rep 2018, 8, 14462. [Google Scholar] [CrossRef]
- Huth, S.; Sindt, S.; Selhuber-Unkel, C. Automated Analysis of Soft Hydrogel Microindentation: Impact of Various Indentation Parameters on the Measurement of Young’s Modulus. PLoS One 2019, 14, e0220281. [Google Scholar]
- Orikasa, K.; Bacca, N.; Agarwal, A. Meso/Macro-Scale Ultra-Soft Materials’ Mechanical Property Evaluation Device and Testbed. Review of Scientific Instruments 2021, 92, 73904. [Google Scholar] [CrossRef]
- Koruk, H.; Koc, H.O.; Yurdaer, S.B.; Besli, A.; Pouliopoulos, A.N. A New Approach for Measuring Viscoelastic Properties of Soft Materials Using the Dynamic Response of a Spherical Object Placed at the Sample Interface. Exp Mech, 2023; under revision. [Google Scholar]
- Koruk, H.; Pouliopoulos, A.N. Investigation of the Motion of a Spherical Object Located at Soft Elastic and Viscoelastic Material Interface for Identification of Material Properties. Applied Science and Engineering Progress 2023. Accepted. [Google Scholar] [CrossRef]
- Karakatsani, M.E.; Pouliopoulos, A.N.; Liu, M.; Jambawalikar, S.R.; Konofagou, E.E. Contrast-Free Detection of Focused Ultrasound-Induced Blood-Brain Barrier Opening Using Diffusion Tensor Imaging. IEEE Trans Biomed Eng 2021, 68, 2499–2508. [Google Scholar] [CrossRef]
- Maccabi, A.; Shin, A.; Namiri, N.K.; Bajwa, N.; St. John, M.; Taylor, Z.D.; Grundfest, W.; Saddik, G.N. Quantitative Characterization of Viscoelastic Behavior in Tissue-Mimicking Phantoms and Ex Vivo Animal Tissues. PLoS One 2018, 13, e0191919. [Google Scholar] [CrossRef]
- Woodard, H.Q.; White, D.R. The Composition of Body Tissues. Br J Radiol 1986, 59, 1209–1218. [Google Scholar] [CrossRef] [PubMed]
- Chen, S.; Urban, M.W.; Pislaru, C.; Kinnick, R.; Zheng, Y.; Yao, A.; Greenleaf, J.F. Shearwave Dispersion Ultrasound Vibrometry (SDUV) for Measuring Tissue Elasticity and Viscosity. IEEE Trans Ultrason Ferroelectr Freq Control 2009, 56, 55–62. [Google Scholar] [CrossRef]
- Koruk, H.; Sanliturk, K.Y. Identification and Removal of Adverse Effects of Non-Contact Electromagnetic Excitation in Oberst Beam Test Method. Mech Syst Signal Process 2012, 30, 274–295. [Google Scholar] [CrossRef]
- Koruk, H.; Dreyer, J.T.; Singh, R. Modal Analysis of Thin Cylindrical Shells with Cardboard Liners and Estimation of Loss Factors. Mech Syst Signal Process 2014, 45, 346–359. [Google Scholar] [CrossRef]
Figure 1.
The elasticity imaging based on the absorption mechanism (a) and the use of small particles located within the tissue and at the tissue interface (b). The arrows show the displacement produced due to the acoustic radiation force. Displacements change widely over the region exposed to the acoustic radiation force due to differences in the applied force over the same region for the elasticity imaging based on the absorption mechanism. Only the particle displacement is measured, which can be achieved to align with the focus of the applied force for the elasticity imaging based on the use of small particles. As sophisticated mathematical models for the particles located within the tissue can be developed, in addition to elastic properties, density and viscosity of tissue can be determined in particle-based methods.
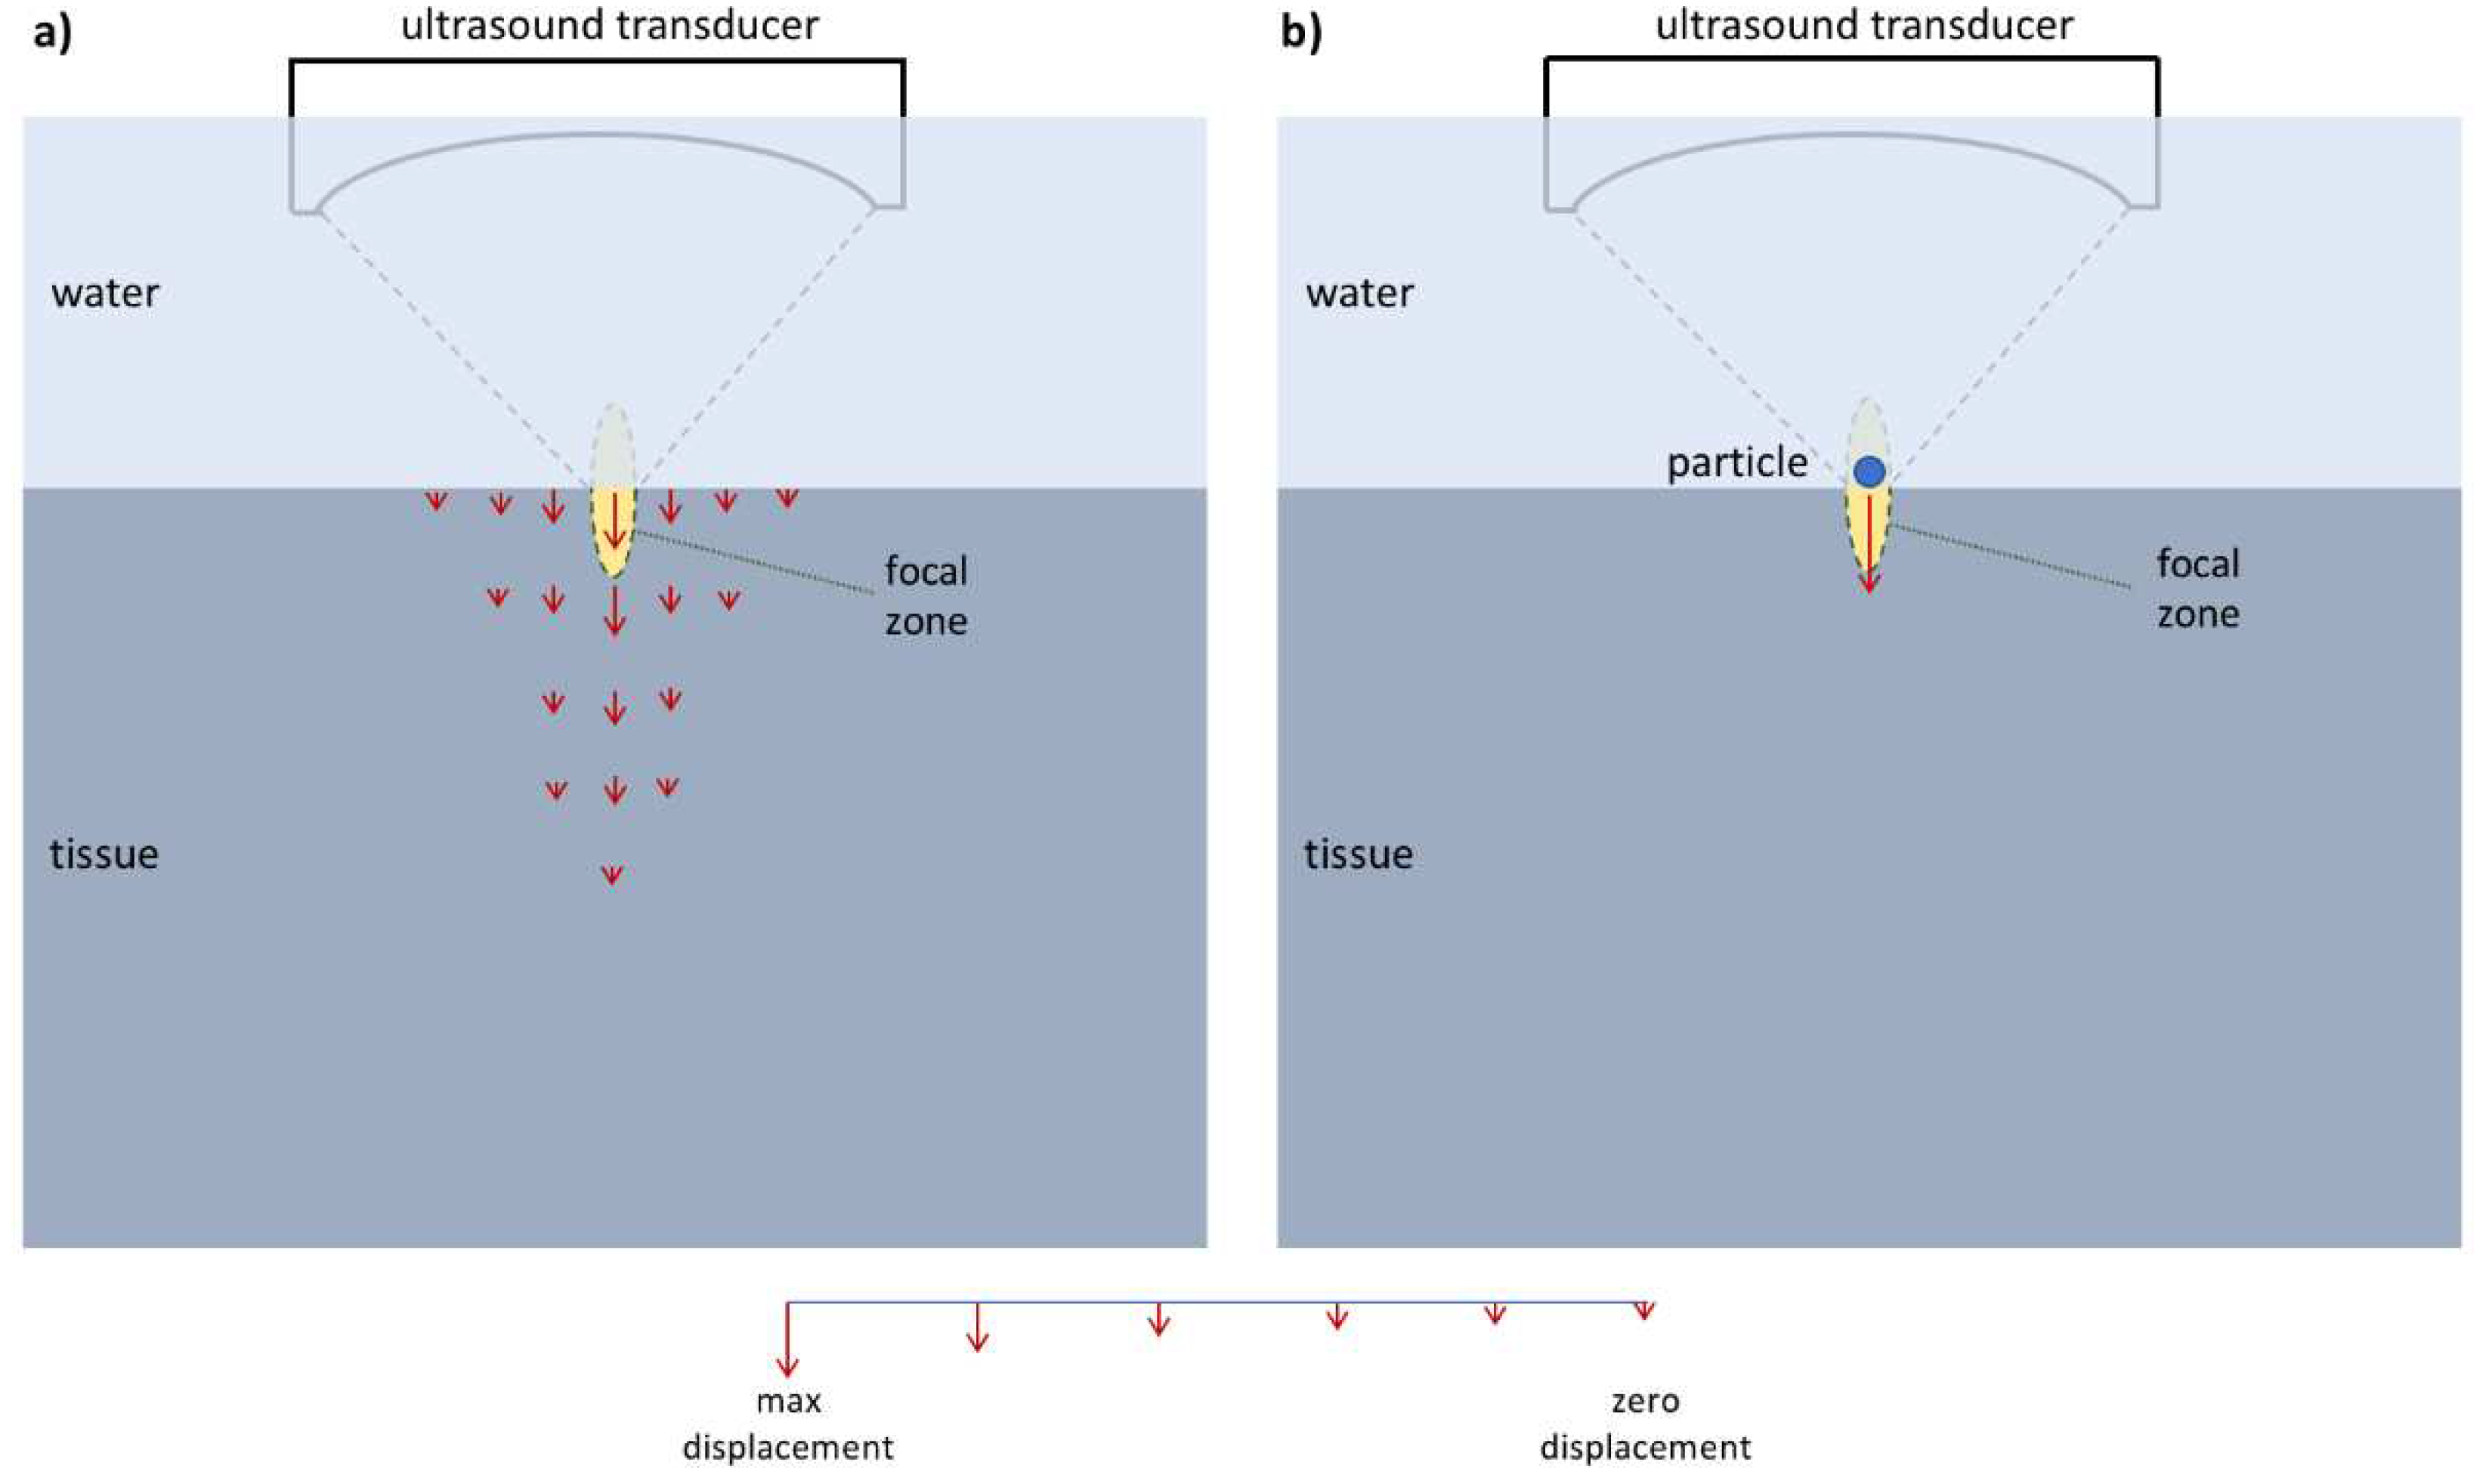
Figure 2.
(a) Elasticity imaging based on the use of small particles located within the tissue and at the tissue interface. Although the particle is pushed mostly using ultrasound, the excitation force () can be applied using any other method such as magnetic or mechanical excitation. Similarly, although monitoring the displacement of the particle () using ultrasound is quite practical, the imaging can be performed using other methods such as optical or magnetic resonance imaging. (b) The schematic for the particle located within the tissue and at the tissue interface. and show the medium shear modulus, density, viscosity, and Poisson’s ratio, respectively, and and
show the radial and polar coordinates, respectively.
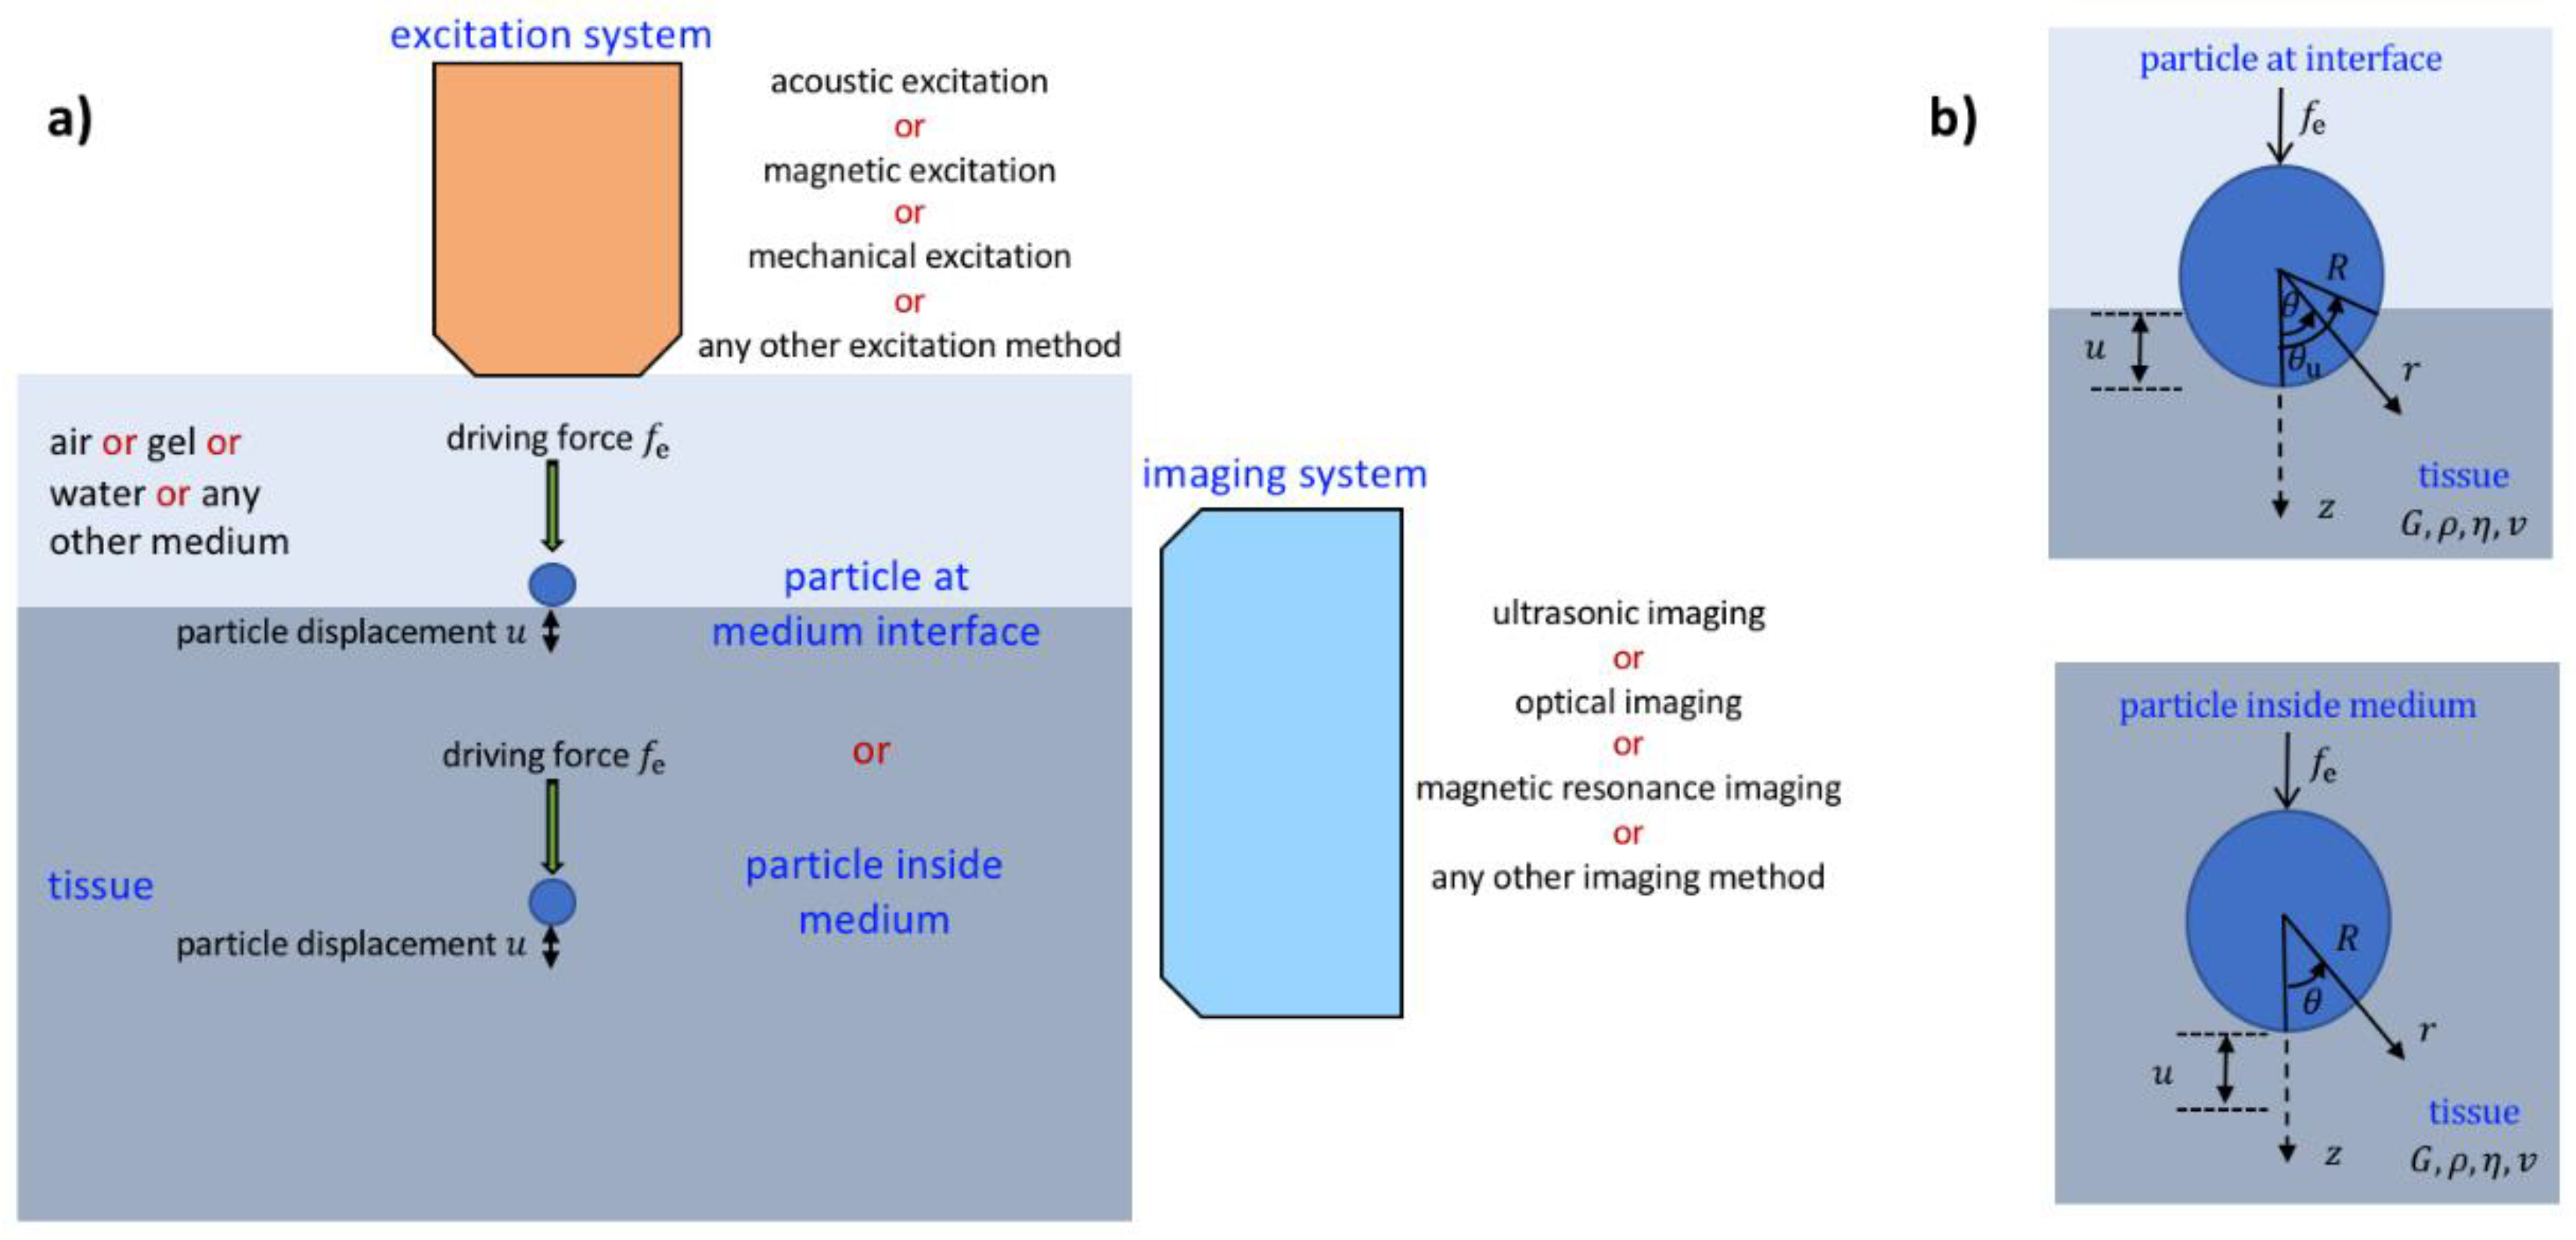
Figure 3.
The static force required for a specific normalized displacement (i.e., ) for a bubble inside the medium (Eq. (1)), a sphere inside the medium (Eq. (6)), a bubble located at the medium interface (Eq. (13)) and a sphere located at the medium interface (Eq. (19)) for m (a) and m (c). The stiffnesses for the four cases as a function of the normalized displacement for m (b) and m (d). The medium properties are Pa and . The plots clearly show the stiffnesses and the order of the external force needed to be applied for a specific particle displacement for different systems.
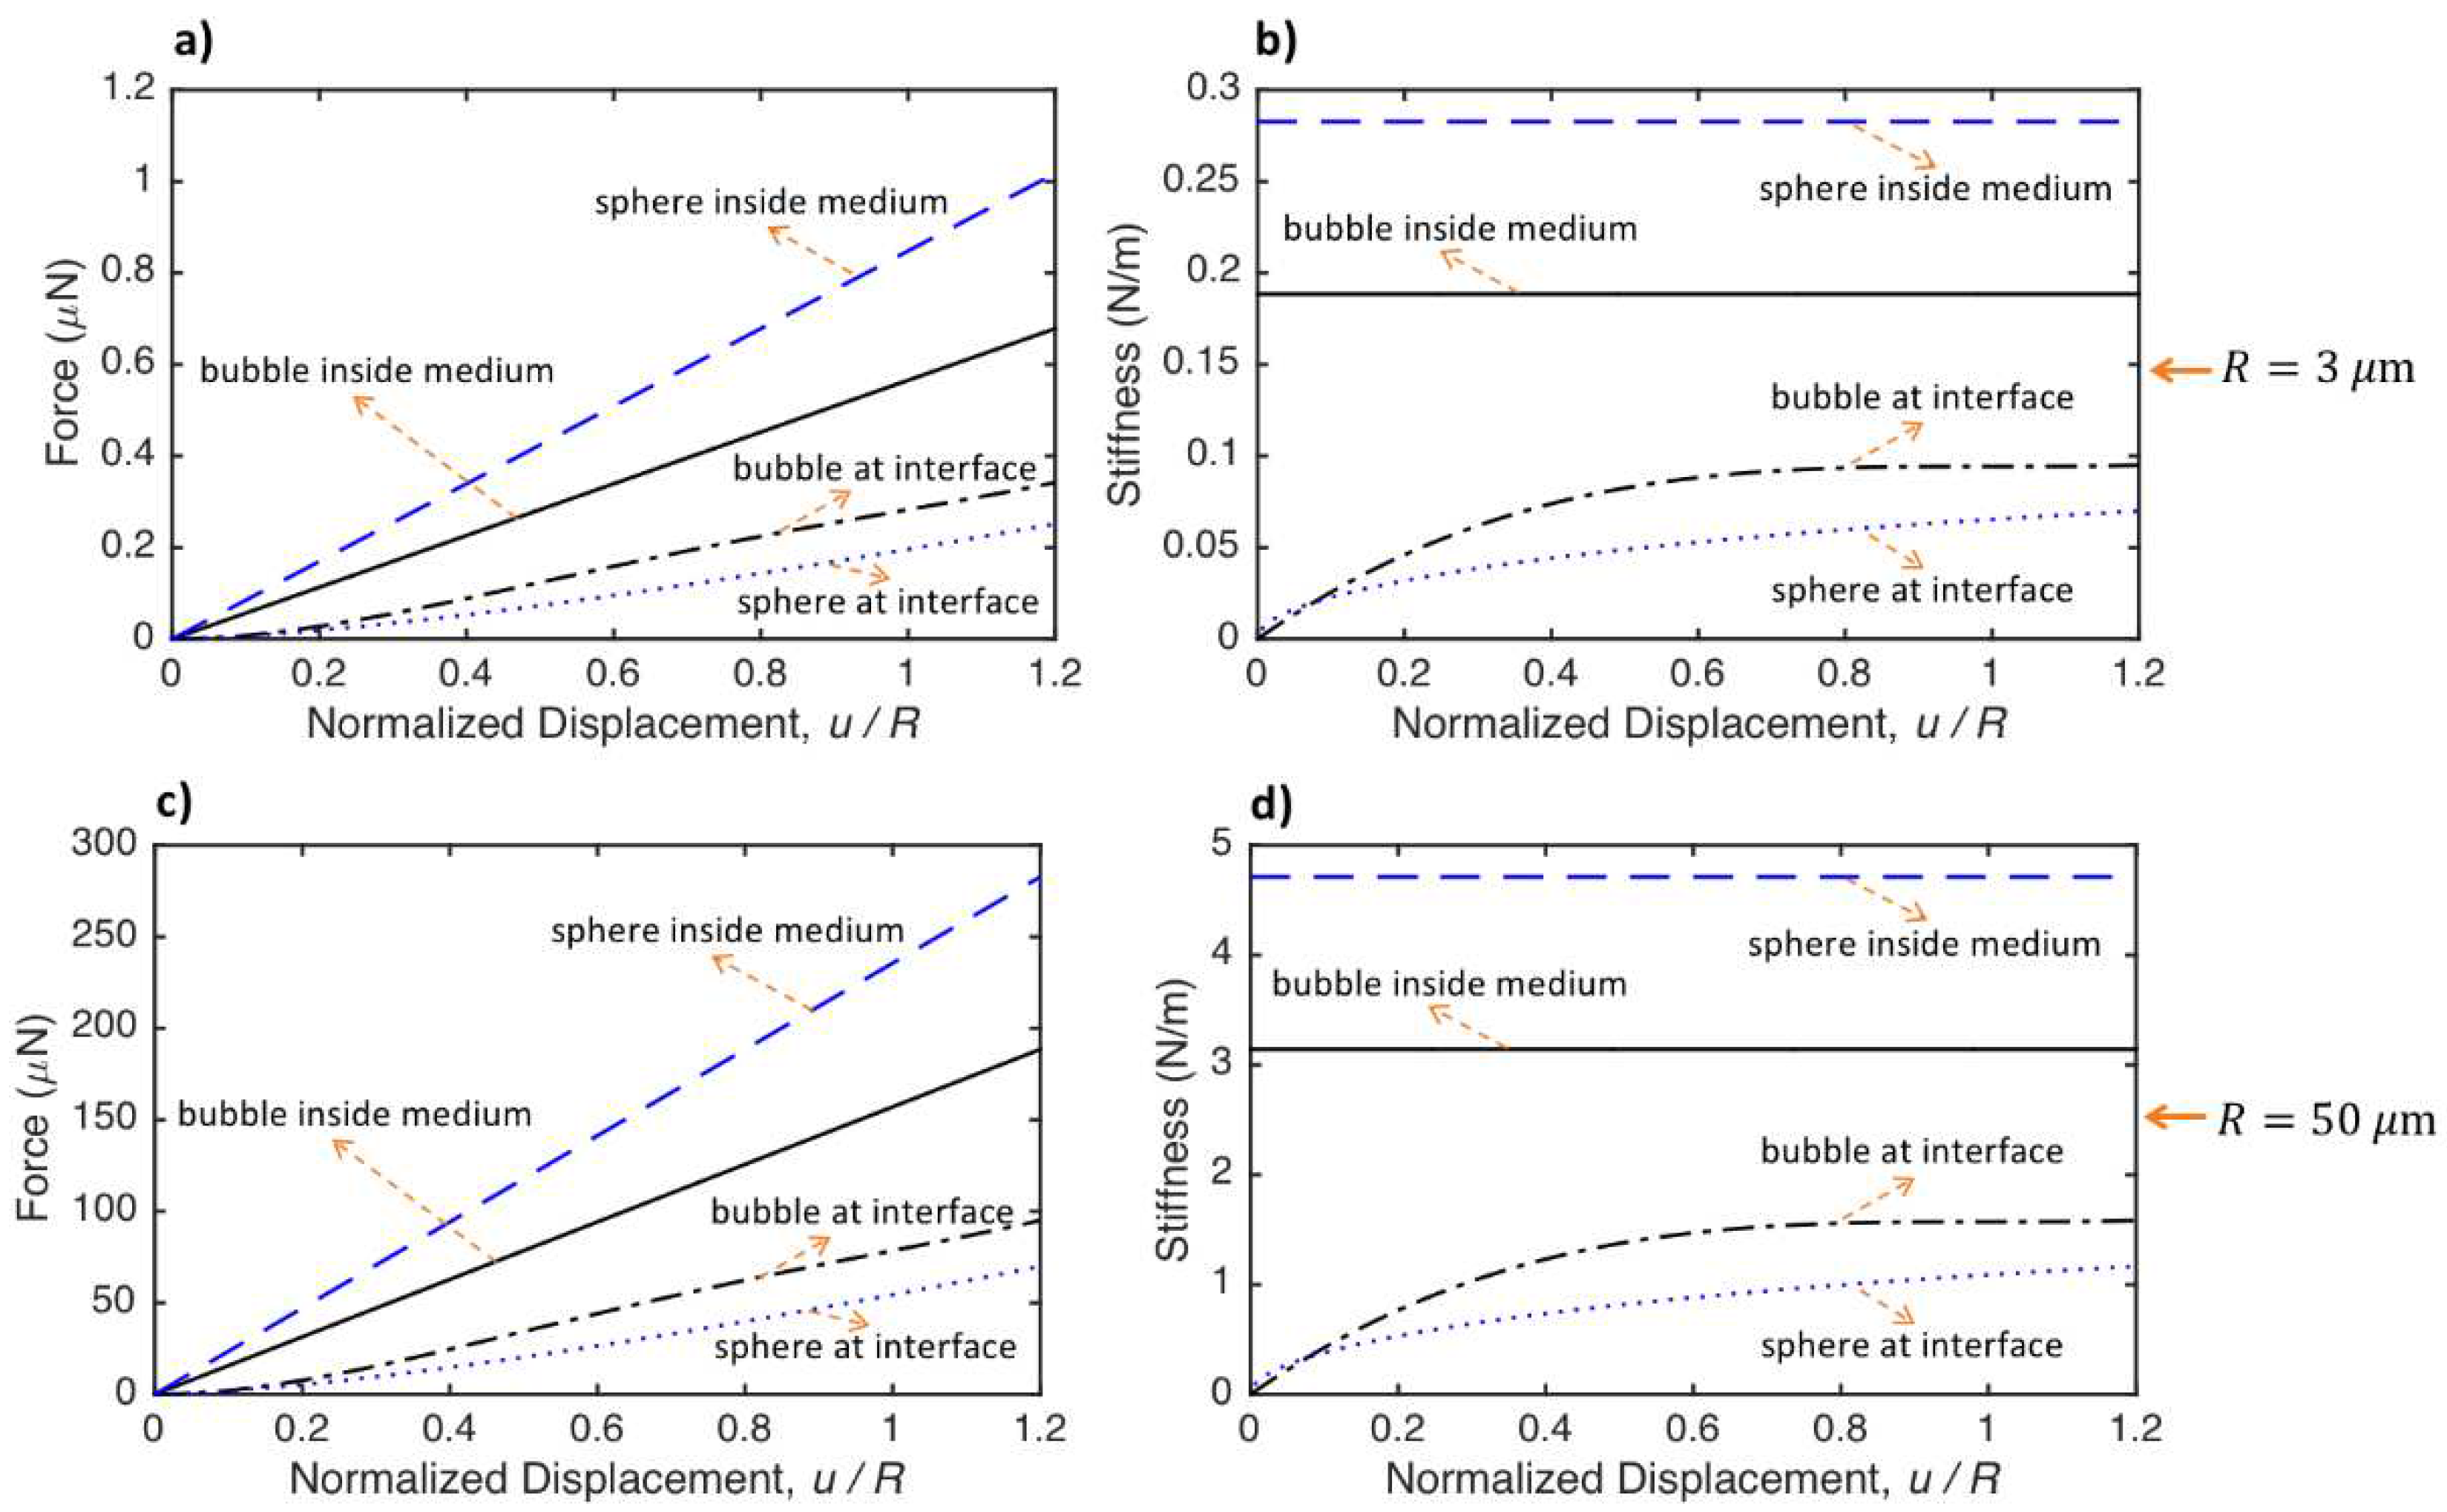
Figure 4.
The dynamic responses for a bubble inside the medium (Eq. (4)), a sphere inside the medium (Eq. (9)), a bubble located at the medium interface (Eq. (16)) and a sphere located at the medium interface (Eq. (22)) for m and Pas (a) and Pas (b) and m and Pas (c) and Pas (d). The medium properties are Pa, kg/m3 and and the sphere density is kg/m3. The force applied to the small and large particles is 0.05 and 50 N, respectively.
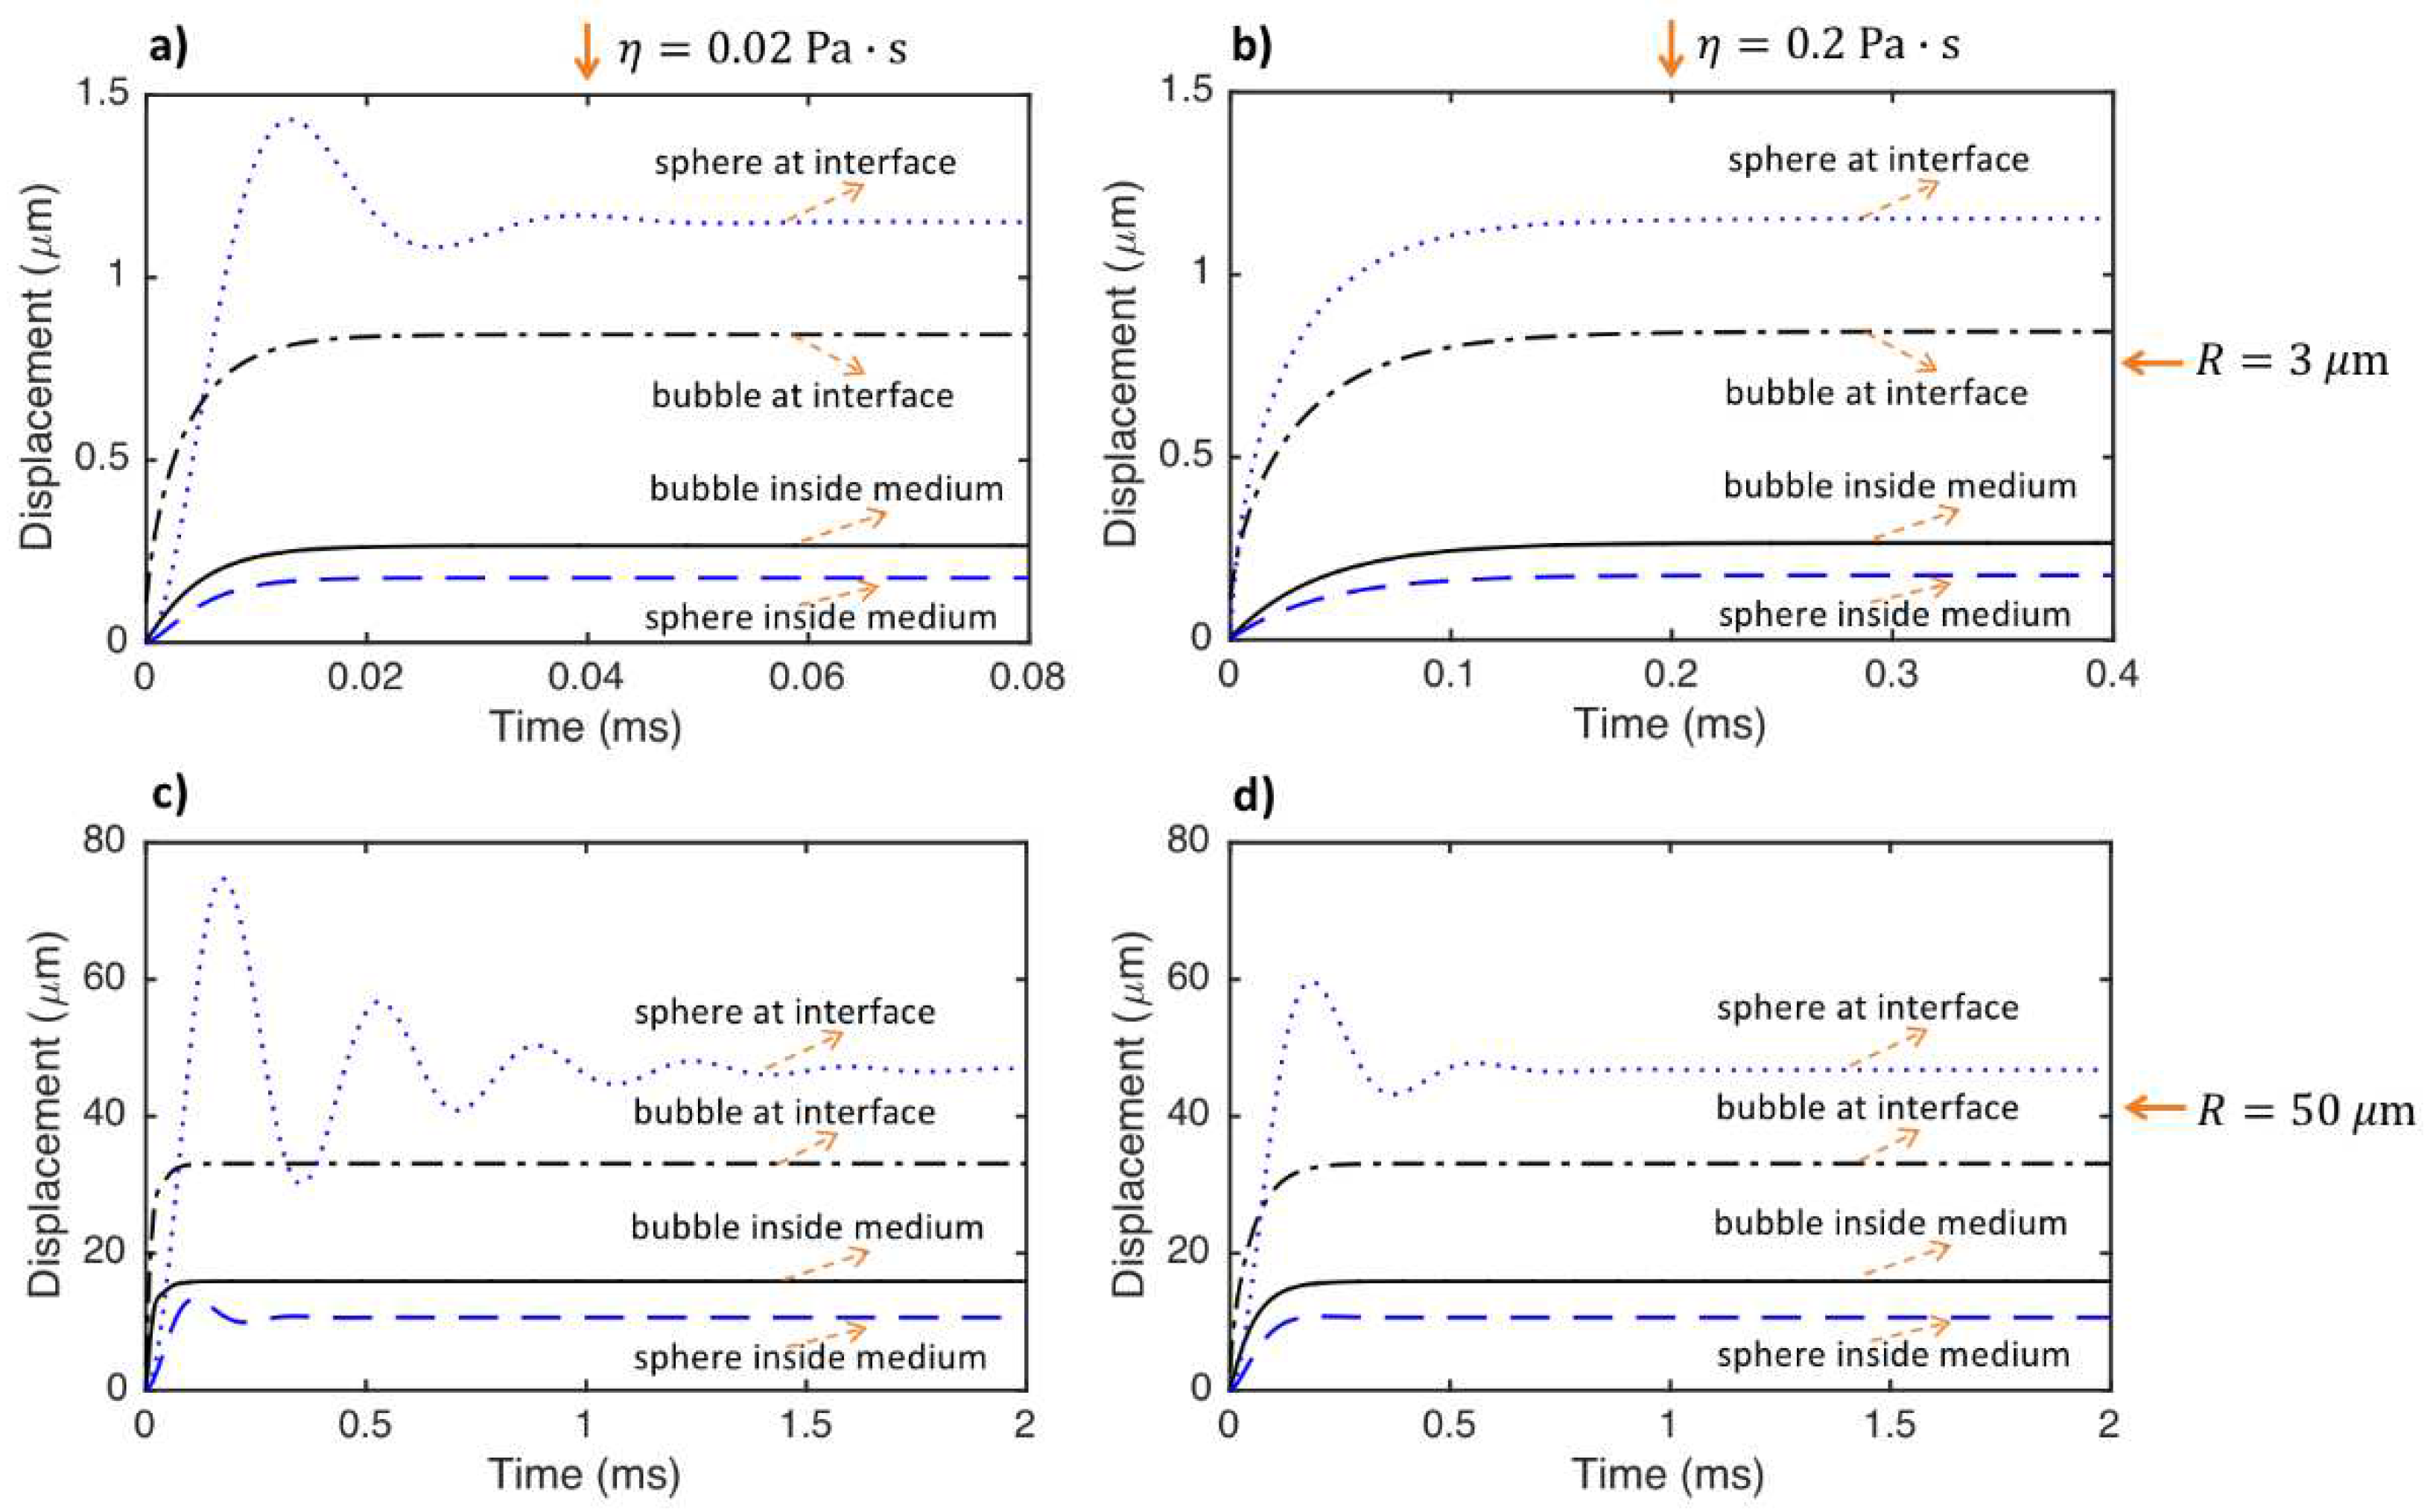
Figure 5.
The effect of medium shear modulus on the dynamic responses of a bubble inside the medium (Eq. (4)), a sphere inside the medium (Eq. (9)), a bubble located at the medium interface (Eq. (16)) and a sphere located at the medium interface (Eq. (22)) for m. The medium properties are kg/m3, Pas and and the sphere density is kg/m3. The force applied to the particles is 10 N.
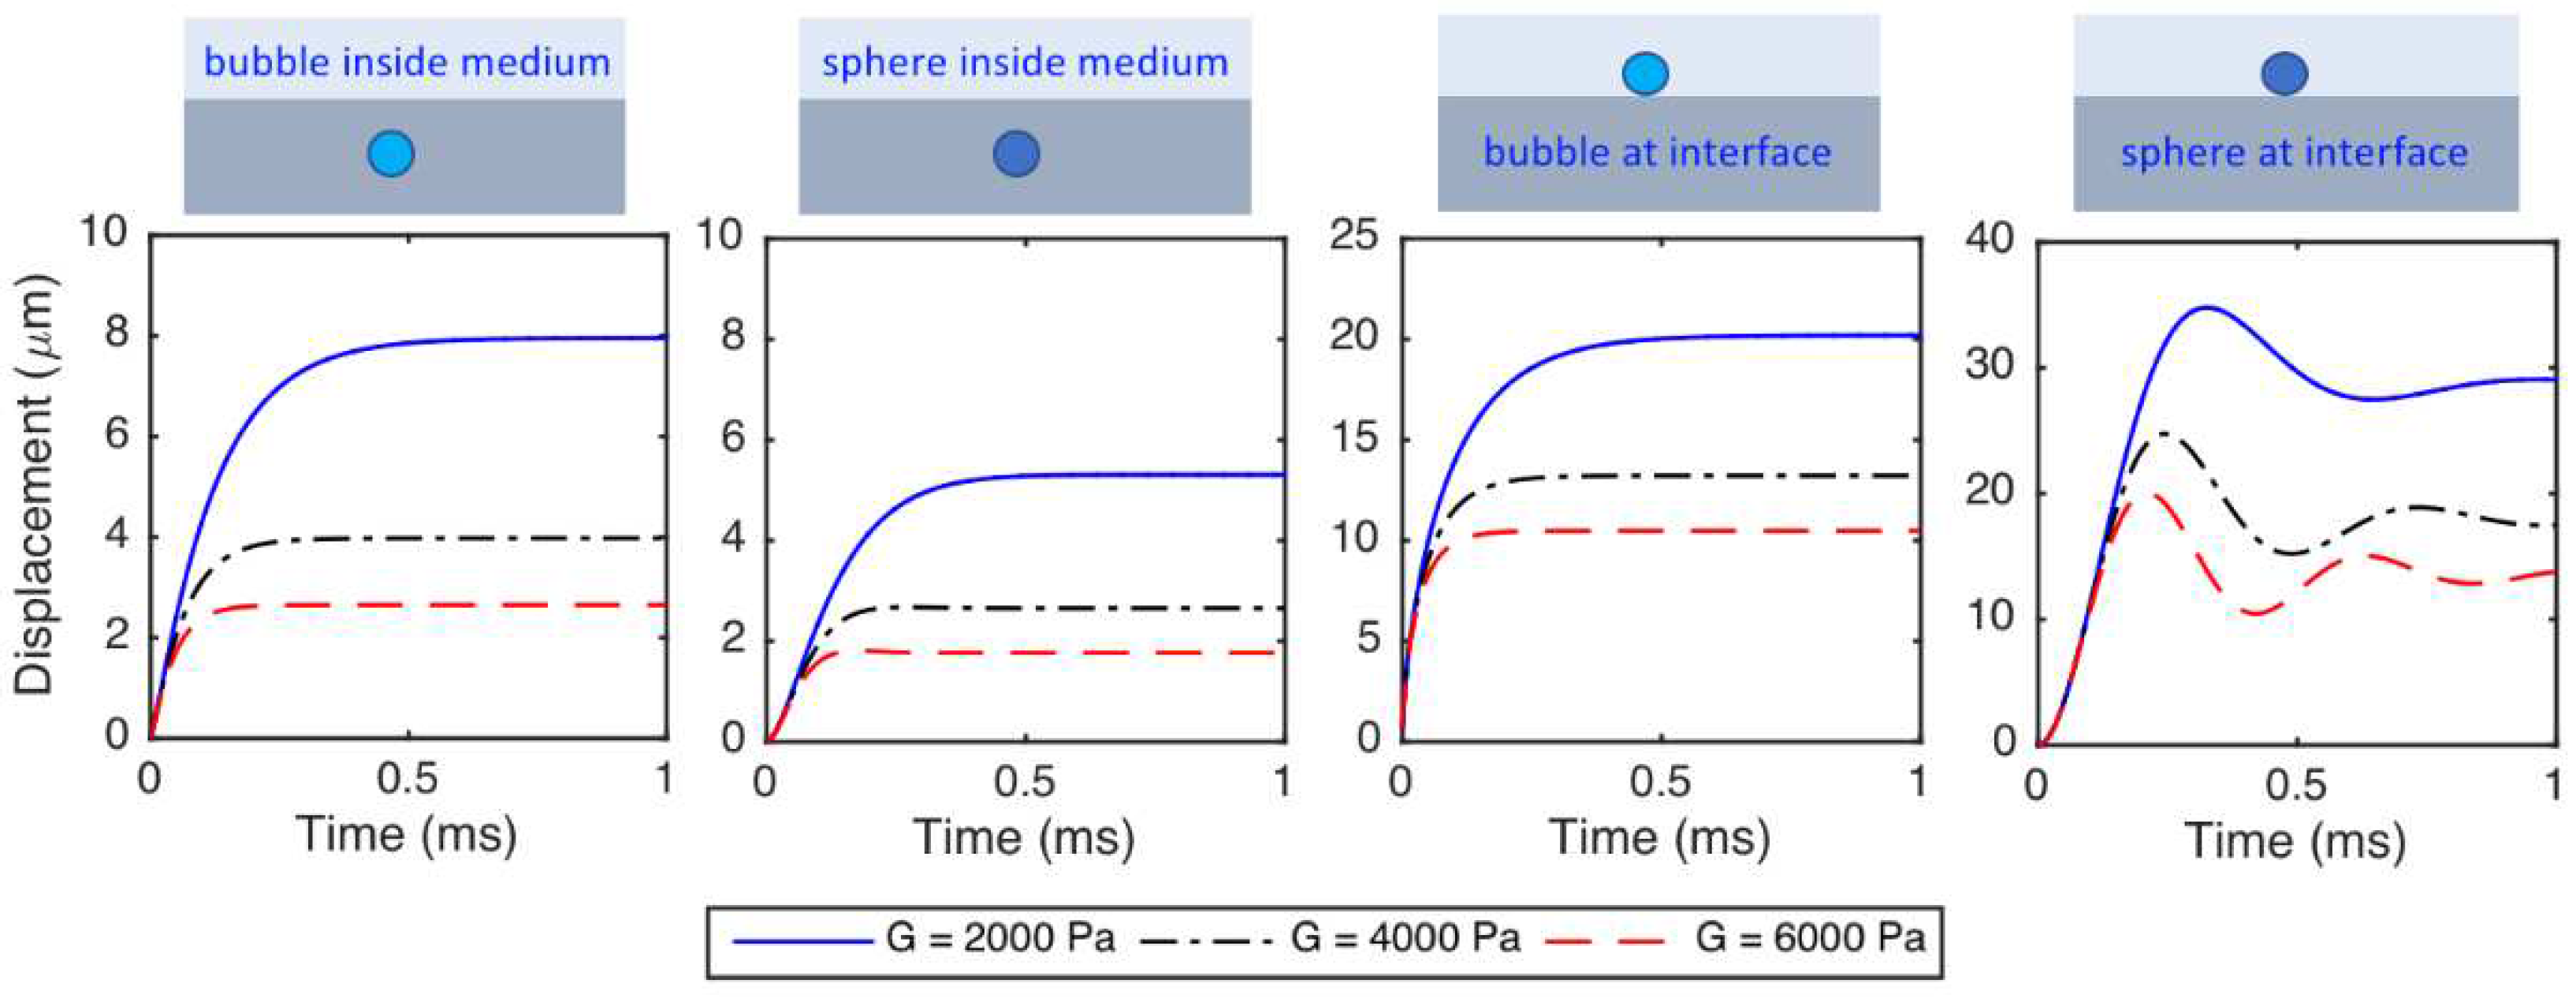
Figure 6.
The effect of medium viscosity on the dynamic responses of a bubble inside the medium (Eq. (4)), a sphere inside the medium (Eq. (9)), a bubble located at the medium interface (Eq. (16)) and a sphere located at the medium interface (Eq. (22)) for m. The medium properties are kg/m3, Pa and and the sphere density is kg/m3. The force applied to the particles is 10 N.
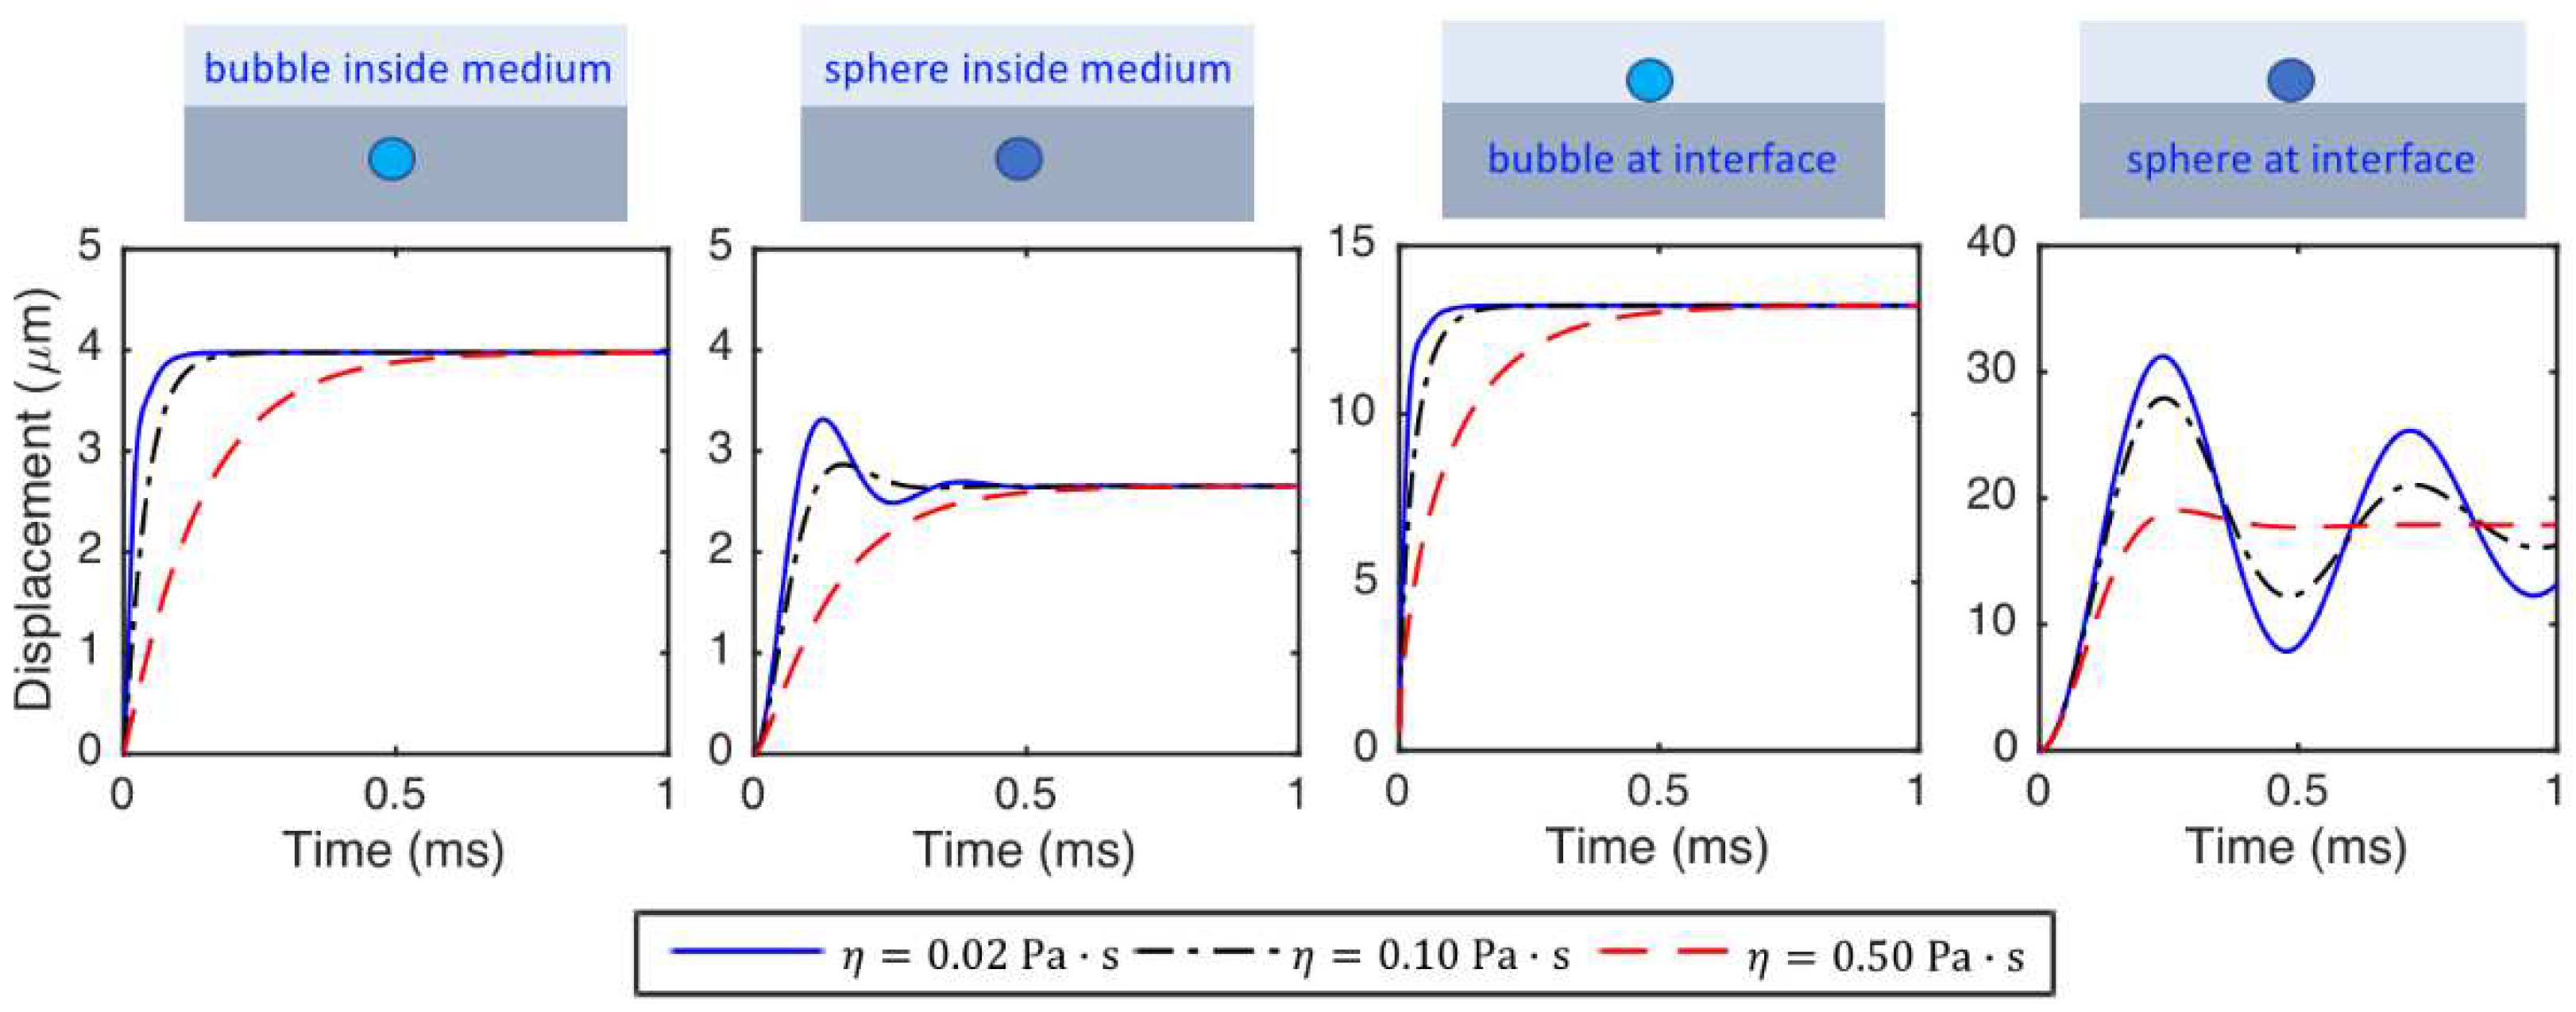
Figure 7.
The spectrum of the response of the sphere located at the medium interface for different medium shear moduli (left panel), densities (center panel), and viscosities (right panel) for m. The Poisson’s ratio of the medium is and the sphere density is kg/m3. The force applied to the particle is 10 N. The medium density and viscosity are kg/m3 and Pas for the left panel. The medium shear modulus and viscosity are Pa and Pas for the center panel. The medium shear modulus and density are Pa and kg/m3 for the right panel.
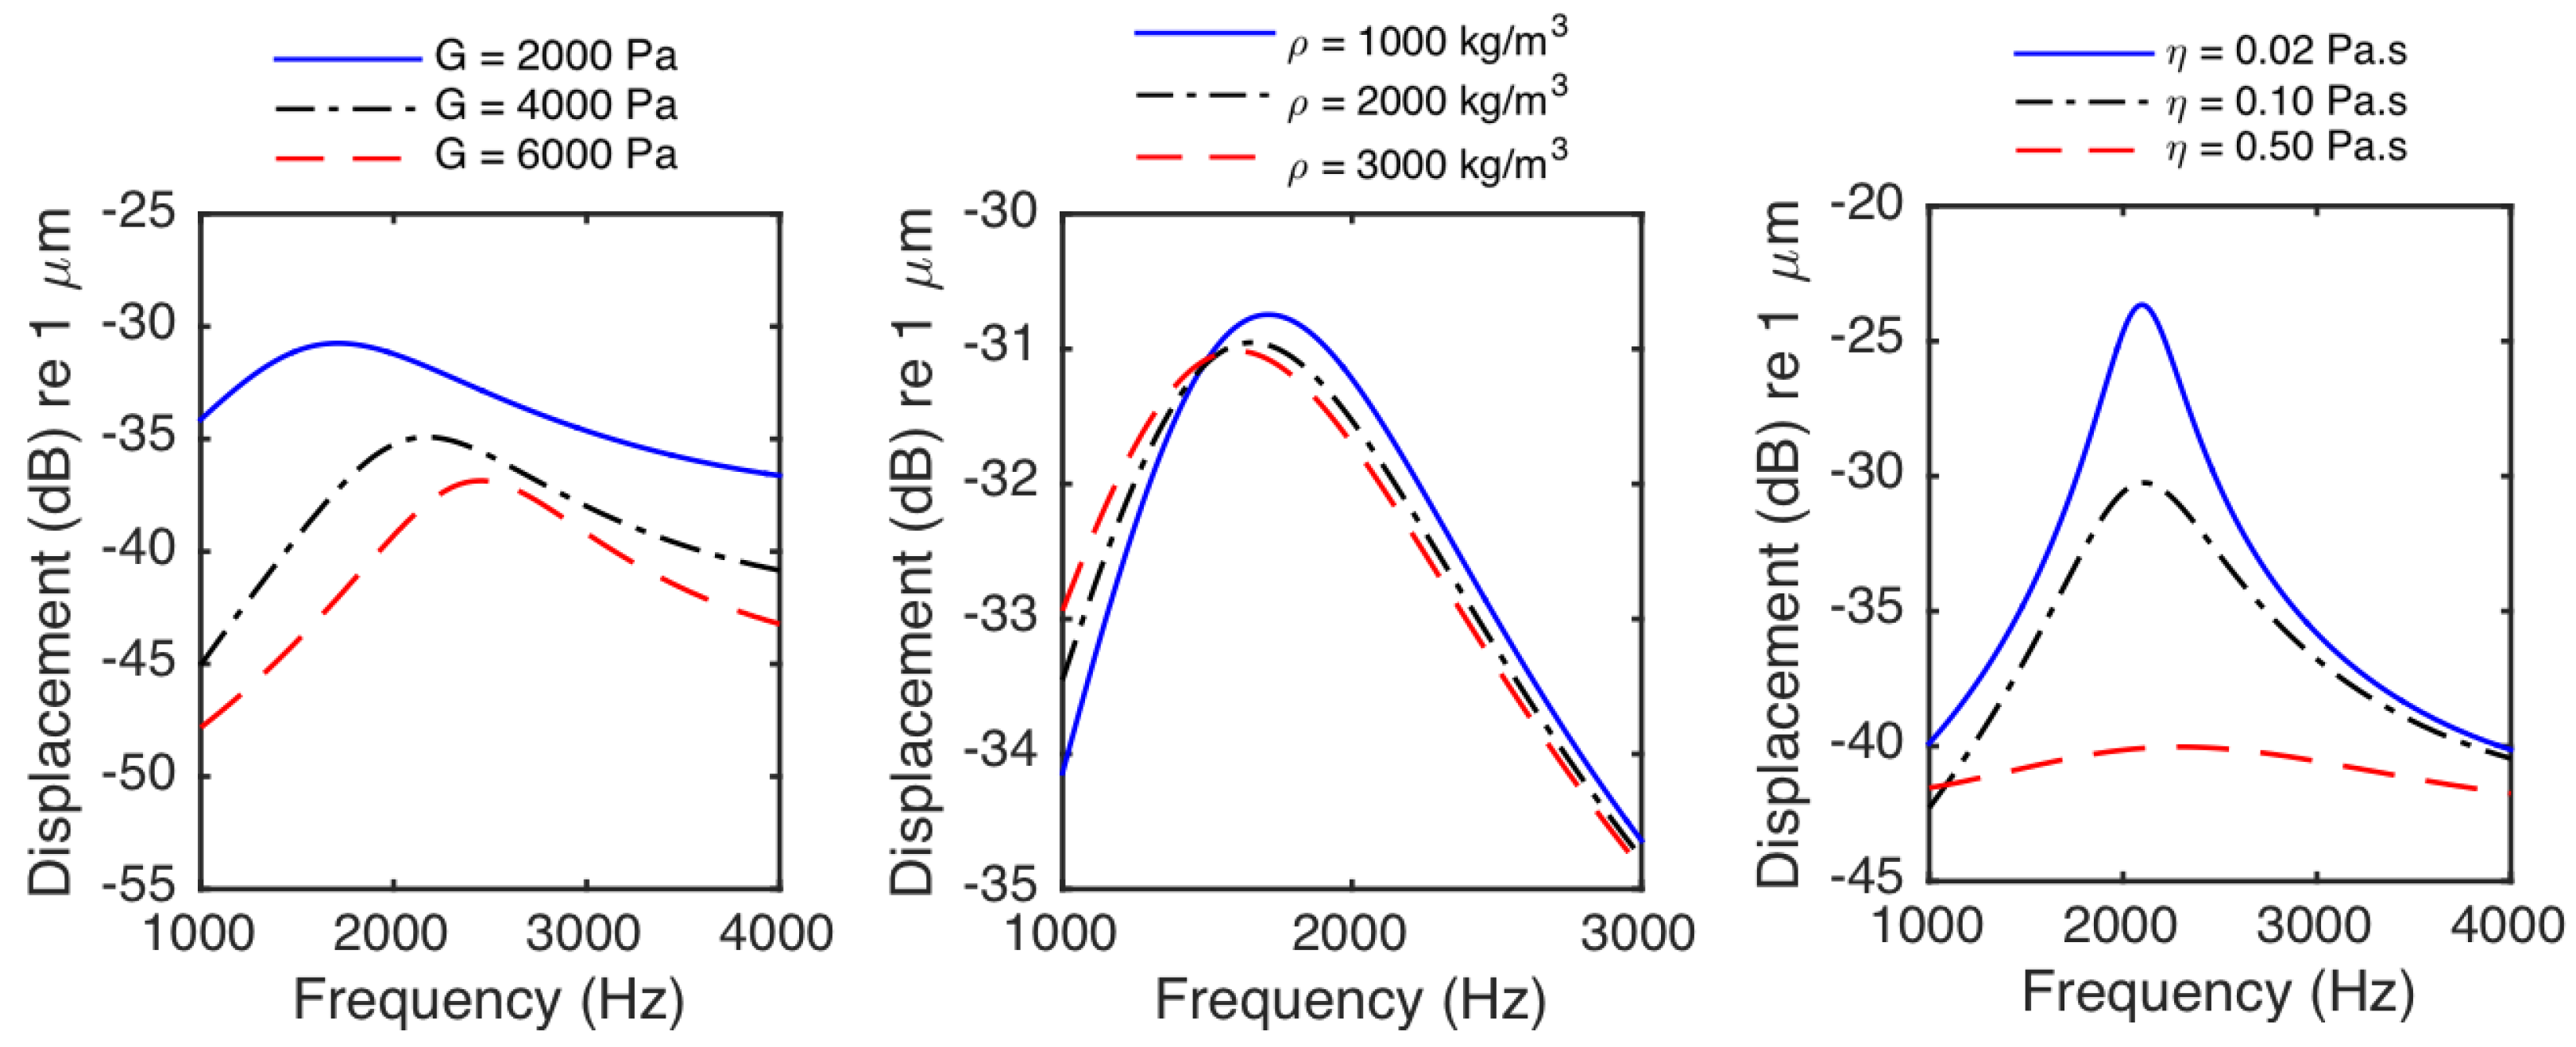
Figure 8.
The dynamic responses for a bubble inside the medium (Eq. (4)), a sphere inside the medium (Eq. (9)), a bubble located at the medium interface (Eq. (16)) and a sphere located at the medium interface (Eq. (22)) for m (a and c) and m (b and d) and medium viscosities (a and b) and 1.6 Pas (c and d). The medium properties are Pa, kg/m3 and and the sphere density is kg/m3. The force applied to the small and large particles is 0.1 and 30 N, respectively.
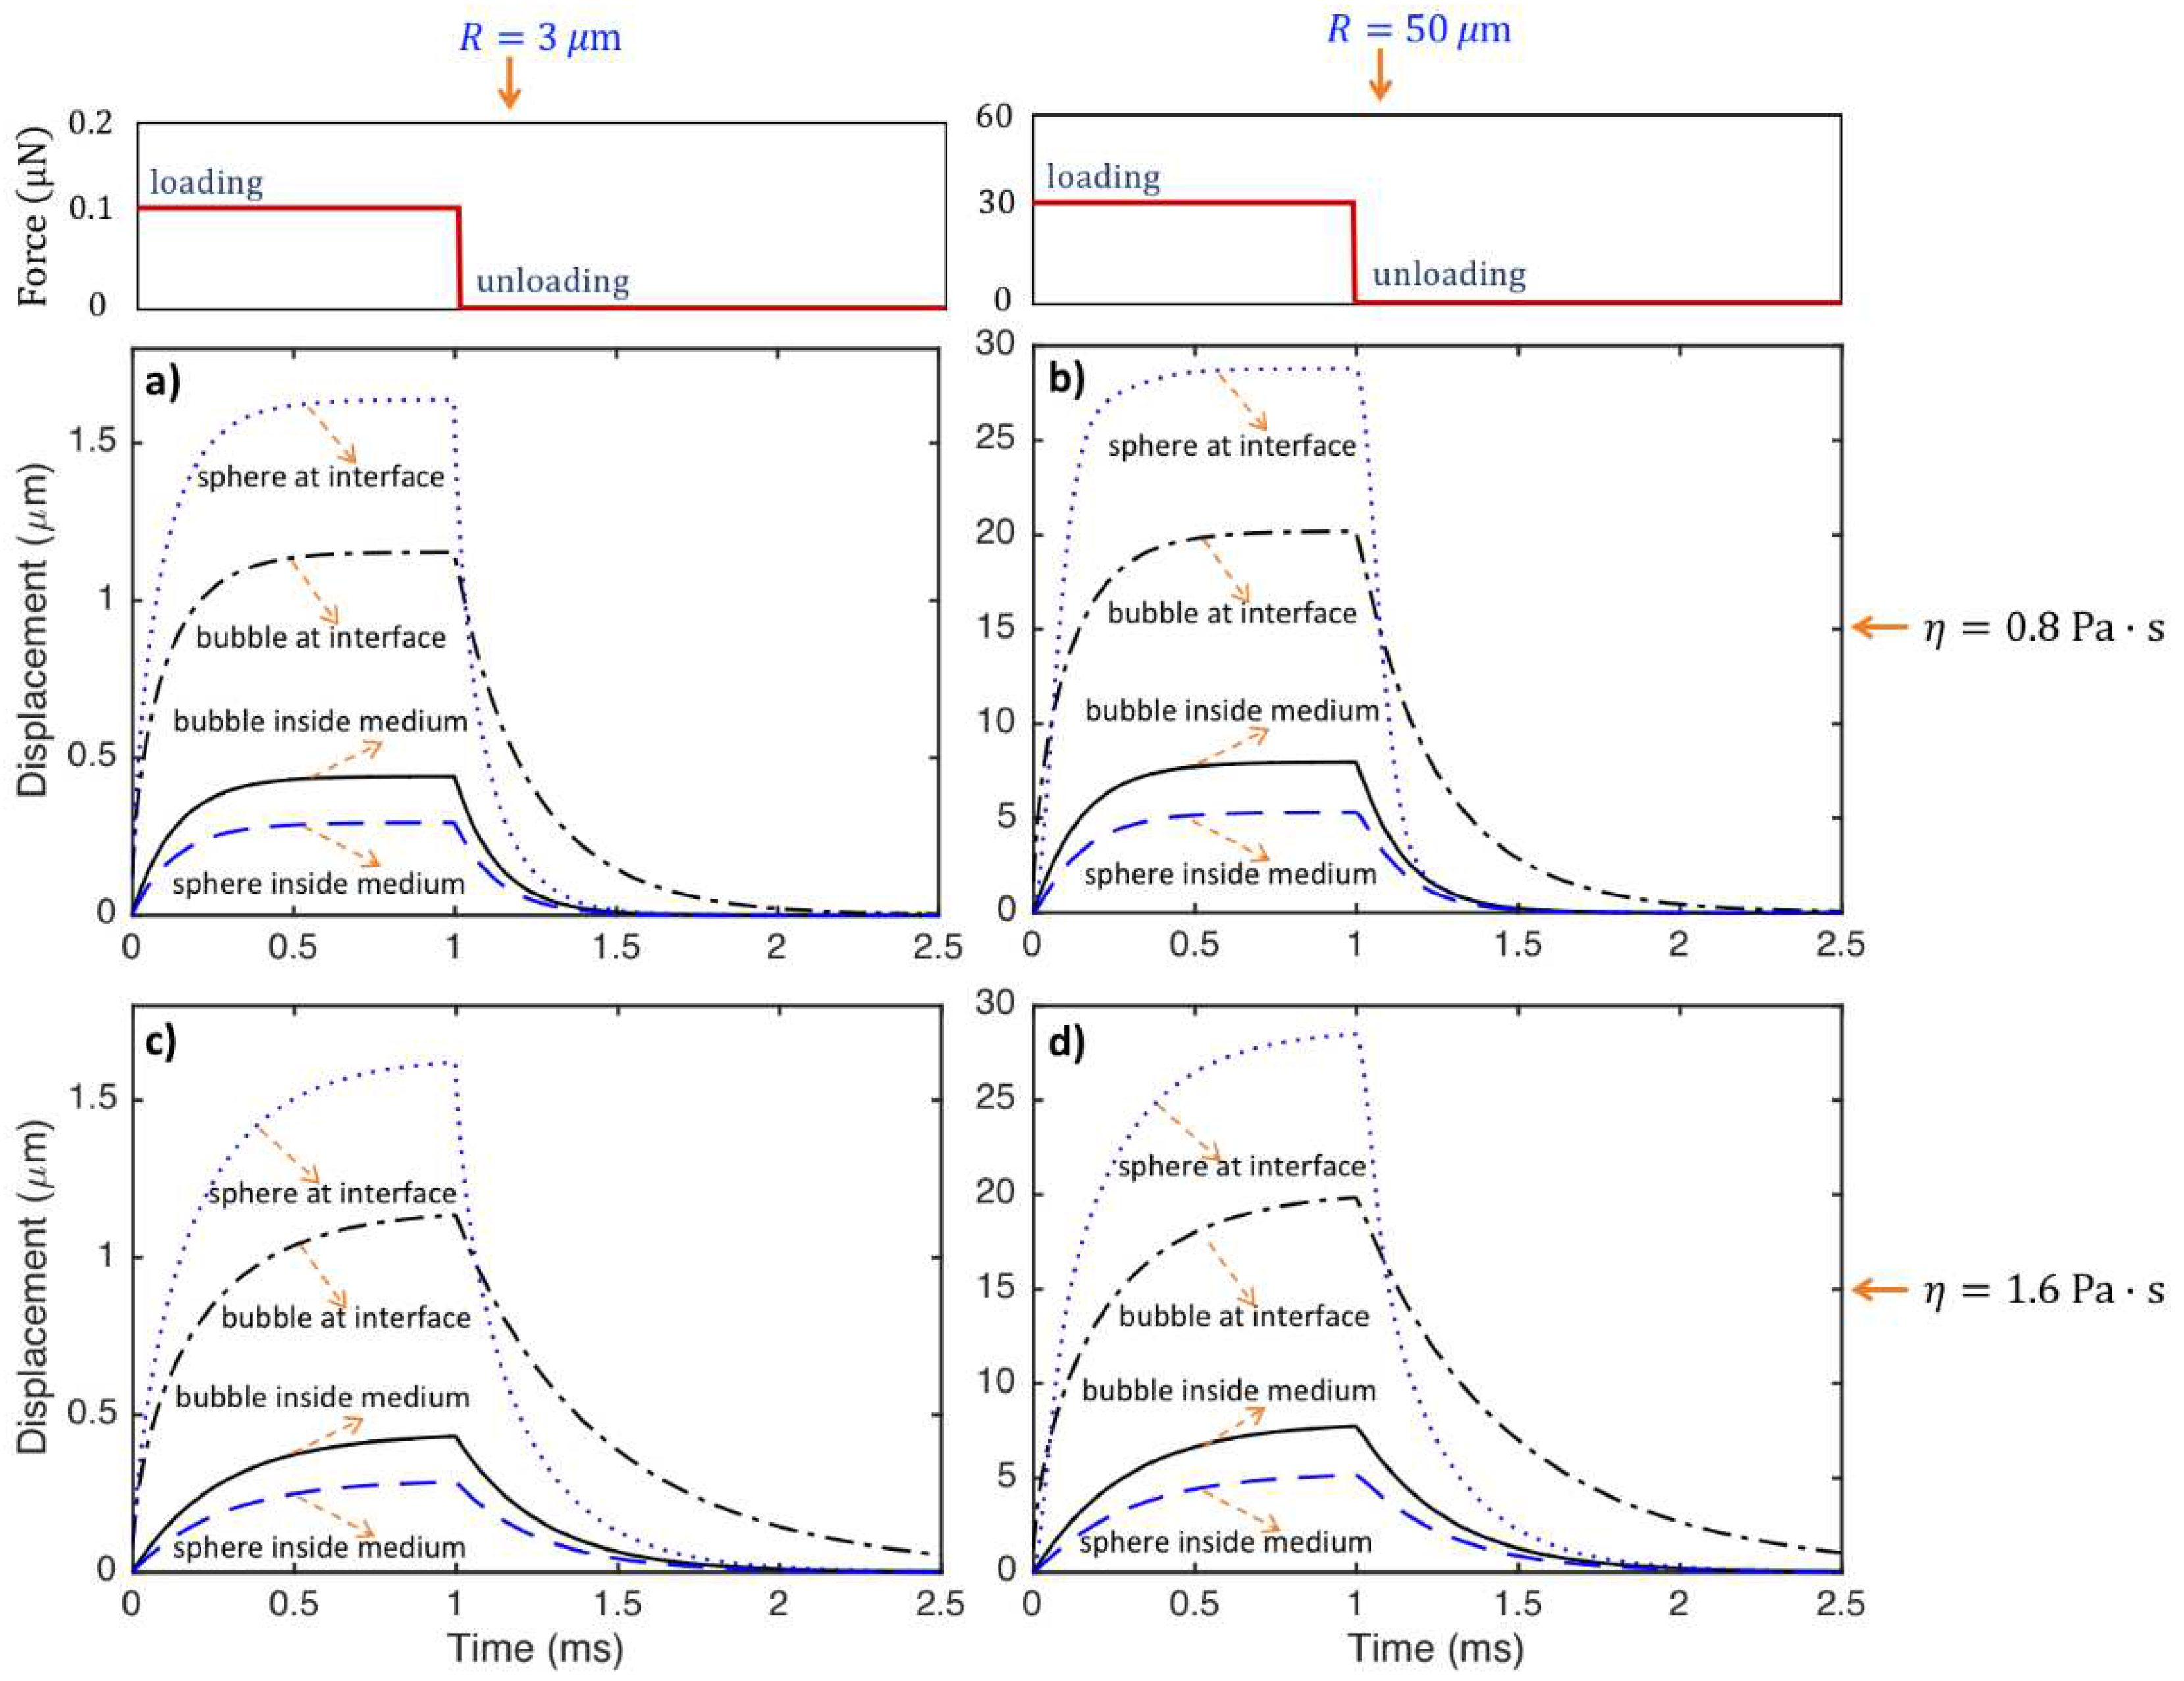

Table 1.
Some of the elasticity and viscoelasticity imaging studies.
| Particle Used | Particle Location | Excitation Method | Monitoring Method | Target Material | Identified Property | Reference |
|---|---|---|---|---|---|---|
| bubble | inside medium | ultrasonic | ultrasonic | gelation phantom | Young’s modulus | Erpelding et al. 2005 [20] |
| bubble | inside medium | ultrasonic | ultrasonic | human lenses | Young’s modulus | Hollman et al. 2007 [35] |
| bubble | inside medium | ultrasonic | ultrasonic | bovine and porcine crystalline lenses | Young’s modulus and viscosity | Yoon et al. 2013 [39] |
| sphere | inside medium | ultrasonic | ultrasonic | gelation phantom | shear modulus | Karpiouk et al. 2009 [41] |
| sphere | inside medium | ultrasonic | ultrasonic | porcine blood clots | shear modulus and viscosity | Huang et al. 2011 [43] |
| sphere | inside medium | magnetic | ultrasonic | gelation phantom | shear modulus and viscosity | Cebrecos et al. 2021 [45] |
| cloud of bubbles | at medium interface | ultrasonic | optical | gelation phantom | shear modulus | Koruk et al. 2015 [23] |
| bubble | at medium interface | ultrasonic | optical | hydrogel | shear modulus and viscosity | Bezer et al. 2020 [24] |
| sphere | at medium interface | magnetic | optical | gelation phantom | shear modulus and viscous damping ratio | Koruk et al. 2022 [57] |
| sphere | at medium interface | magnetic | optical | gelation phantom | shear modulus and viscosity | Koruk et al. 2022 [64] & Koruk and Pouliopoulos [65] |
Disclaimer/Publisher’s Note: The statements, opinions and data contained in all publications are solely those of the individual author(s) and contributor(s) and not of MDPI and/or the editor(s). MDPI and/or the editor(s) disclaim responsibility for any injury to people or property resulting from any ideas, methods, instructions or products referred to in the content. |
© 2023 by the authors. Licensee MDPI, Basel, Switzerland. This article is an open access article distributed under the terms and conditions of the Creative Commons Attribution (CC BY) license (http://creativecommons.org/licenses/by/4.0/).
Copyright: This open access article is published under a Creative Commons CC BY 4.0 license, which permit the free download, distribution, and reuse, provided that the author and preprint are cited in any reuse.


