1. Introduction
With the increasing depletion of traditional energy sources, it is urgent to find effective energy storage equipment [
1]. Supercapacitors have gained increased focus in recent times because of their rapid charging, impressive power density, and extended lifespan. Nonetheless, the practical applications of supercapacitors are restricted due to their limited energy density. Consequently, numerous investigations were carried out to enhance the energy density of supercapacitors [
2,
3,
4]. The energy storage performance of supercapacitor depends on the electrode materials [
1,
5]. Usually, there are three categories of electrode materials, specifically carbon substances, conductive polymer, and transition metal oxides [
5,
6,
7,
8]. Transition metal oxides, in comparison to carbon materials, exhibit a greater energy density and superior cycling stability when compared to conductive polymers. Consequently, transition metal oxide materials are widely used as electrode materials for supercapacitor [
8,
9,
10,
11,
12,
13,
14].
LaMnO
3 is a perovskite material with an ABO
3 structure, belonging to the space group Pm3m. In this structure, La is located at the A site in the cubic cell center, while Mn is situated at the B site in the octahedral center. Mn is connected to six oxygen ions in a coordinated manner [
7,
13,
15].The perovskite compounds exhibit minimal B−site cation defects and interstitial oxygen [
16], unlike perovskite materials containing B atoms (e.g. Manganese or Titanium possess a significant amount of imperfections in the A-site ions while upholding a consistent structure [
17]. Thus, A−site cation defects and oxygen anion vacancies are the main defects in perovskite materials.Pseudocapacitance relies on oxygen vacancies within perovskite as locations for storing charges [
18]. According to the findings, it is primarily the pseudocapacitance resulting from the intercalation of oxygen anion that contributes significantly to the high specific capacitance of perovskite materials [
1].The performance of pseudocapacitance is not solely dependent on the presence of oxygen vacancy, but also on the pathway of electron transfer or electron conductivity [
19]. Hence, enhancing the concentration of oxygen vacancies can optimize the specific capacitance of perovskite materials [
20,
21]
.
The structural distortion of the perovskite occurs due to the partial compensation of charge imbalance caused by the Mn
3+ ion, as stated by the Jahn−Teller effect [
22]. The arrangement of perovskite's molecular structure was found to significantly affect the concentration of oxygen vacancies, the diffusion of O
2−, and the resulting electrochemical capabilities. Wang et al investigated LSM as an electrode material for supercapacitors and found that the specific capacitance of LSM electrodes was higher (205 F/g) than that of LMO (178 F/g) at the same scan rate [
5]. According to the findings of Lang et al, the electrochemical performance of La
1−xSr
xMnO
3 was improved by the presence of a loosely organized granular structure, as reported in their study [
21]. In their study, Mo et al showed that the replacement of Ca
2+ ions significantly increased the specific capacitance of LaMnO
3, with a maximum value of 170 F/g [
7]. It is important to mention that the radius of Ca ion (r
Ca2+ = 0.99 Å) is slightly less than the radius of La ion (r
La3+ = 1.06 Å), whereas the radius of Sr ion (r
Sr2+ = 1.13 Å) is comparatively greater than that of La ion. Consequently, the incorporation of Ca and Sr elements has distinct impacts on both the composition and electrochemical properties of LaMnO
3. Several studies have reported the structural development and electronic behavior of La
1−xM
xMnO
3 (x = 0, 0.15; M = Ca, Sr) [
23,
24]. However, there is a lack of discussion regarding the electrochemical performance, which is closely associated with the assessment of the structure.
In this work, LaMnO3, La0.85Ca0.15MnO3, and La0.85Sr0.15MnO3 (referred to as LMO, LCM, and LSM, respectively) samples were prepared by the sol−gel method. We investigated the impact of substituting Ca and Sr at the A−site on the perovskite crystal structure and electrochemical capabilities of LMO. At 0.5 A/g, the specific capacitance of LCM and LSM electrodes is 248 F/g and 185.5 F/g, respectively.
3. Results and Discussion
To determine the calcination temperature of the LMO, LCM, and LSM samples, the LaMnO
3 precursors underwent
thermal gravity analysis (TG) in an air atmosphere. The analysis was conducted within a temperature range of 30 − 800°C, with a heating rate of 15 °C/min.
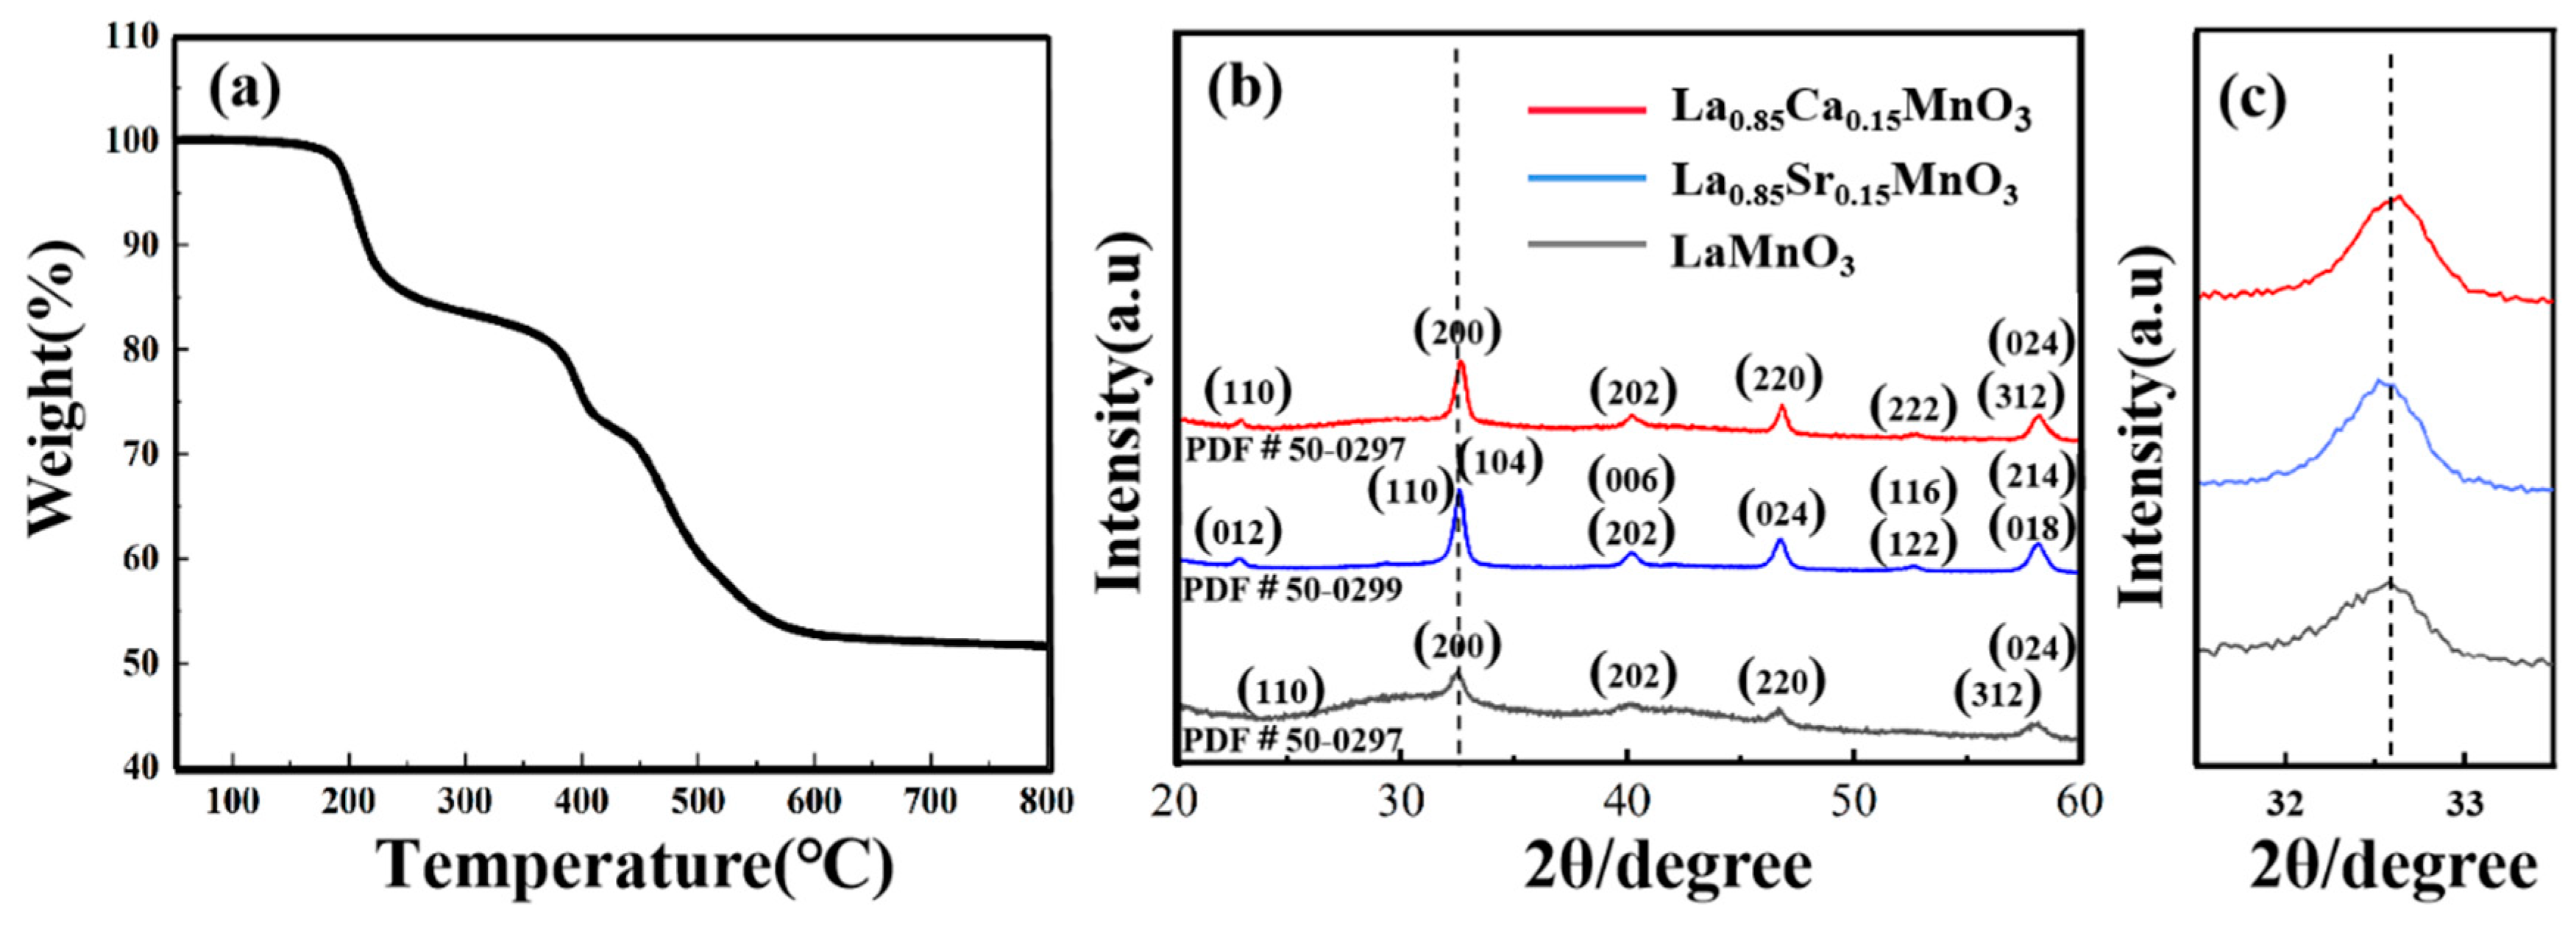
Figure 1a illustrates the process. At 250 °C, the precursor's mass reduces by 20% primarily because of the organic solvents volatilizing and gases and moisture evaporating from the specimen. A sharp decrement in the mass of the precursor was found at 300 − 600°C. The weight remained almost constant after the temperature higher than 600°C. Therefore, LMO precursors are subjected to a calcination temperature of 650°C. After XRD analysis revealed the absence of synthesized LMO, the calcination temperature was increased to 700 °C, resulting in subsequent XRD patterns confirming the successful production of LMO.
Figure 1b displays the XRD patterns of the LMO, LCM, and LSM samples after being heated at 700 °C for 2 hours. In comparison to the standard card (PDF 31−0255), every diffraction peak corresponds to the diffraction peak of the standard card, signifying the synthesis of single-phase LMO, LCM, and LSM samples.The diffraction peak of LCM in
Figure 1c exhibits a slight shift towards a greater angle, indicating a lattice distortion in the crystal structure. Doping causes a reduction in the average ionic radius at point A due to the larger ionic radius of La
3+ (103.2 pm) compared to Ca
2+ (99.0 pm). Alternating long and short A − site cation radii will lead to severe distortion of the MnO
6 octahedra and severe bending of the Mn−O−Mn bond angles [
25]. The significant disparity results in lattice deformations and Jahn−Teller phenomena along the c−axis in orthorhombic crystals. It is clear that replacing La
3+ with a smaller Ca
2+ reduces the lattice volume and thus increases the diffraction angle. On the other hand, the small change in the diffraction peak position of the LSM towards a smaller angle indicates that increased Sr
2+ substitutions result in a rhombohedral structure characterized by a significant c−value. The normal chalcogenide structure implies a significant lattice distortion along the c−axis. The Mn
3+ Jahn−Teller phenomenon results in a distortion of the lattice due to a mismatch in the oxygen octahedral structure [
16,
21]. Hence, the distinct structural evolution of Ca and Sr substitution for LaMnO
3 may have varying impacts on the electrochemical performance [
22,
23].
The SEM and TEM results of the LMO, LCM, and LSM samples are displayed in
Figure 2.
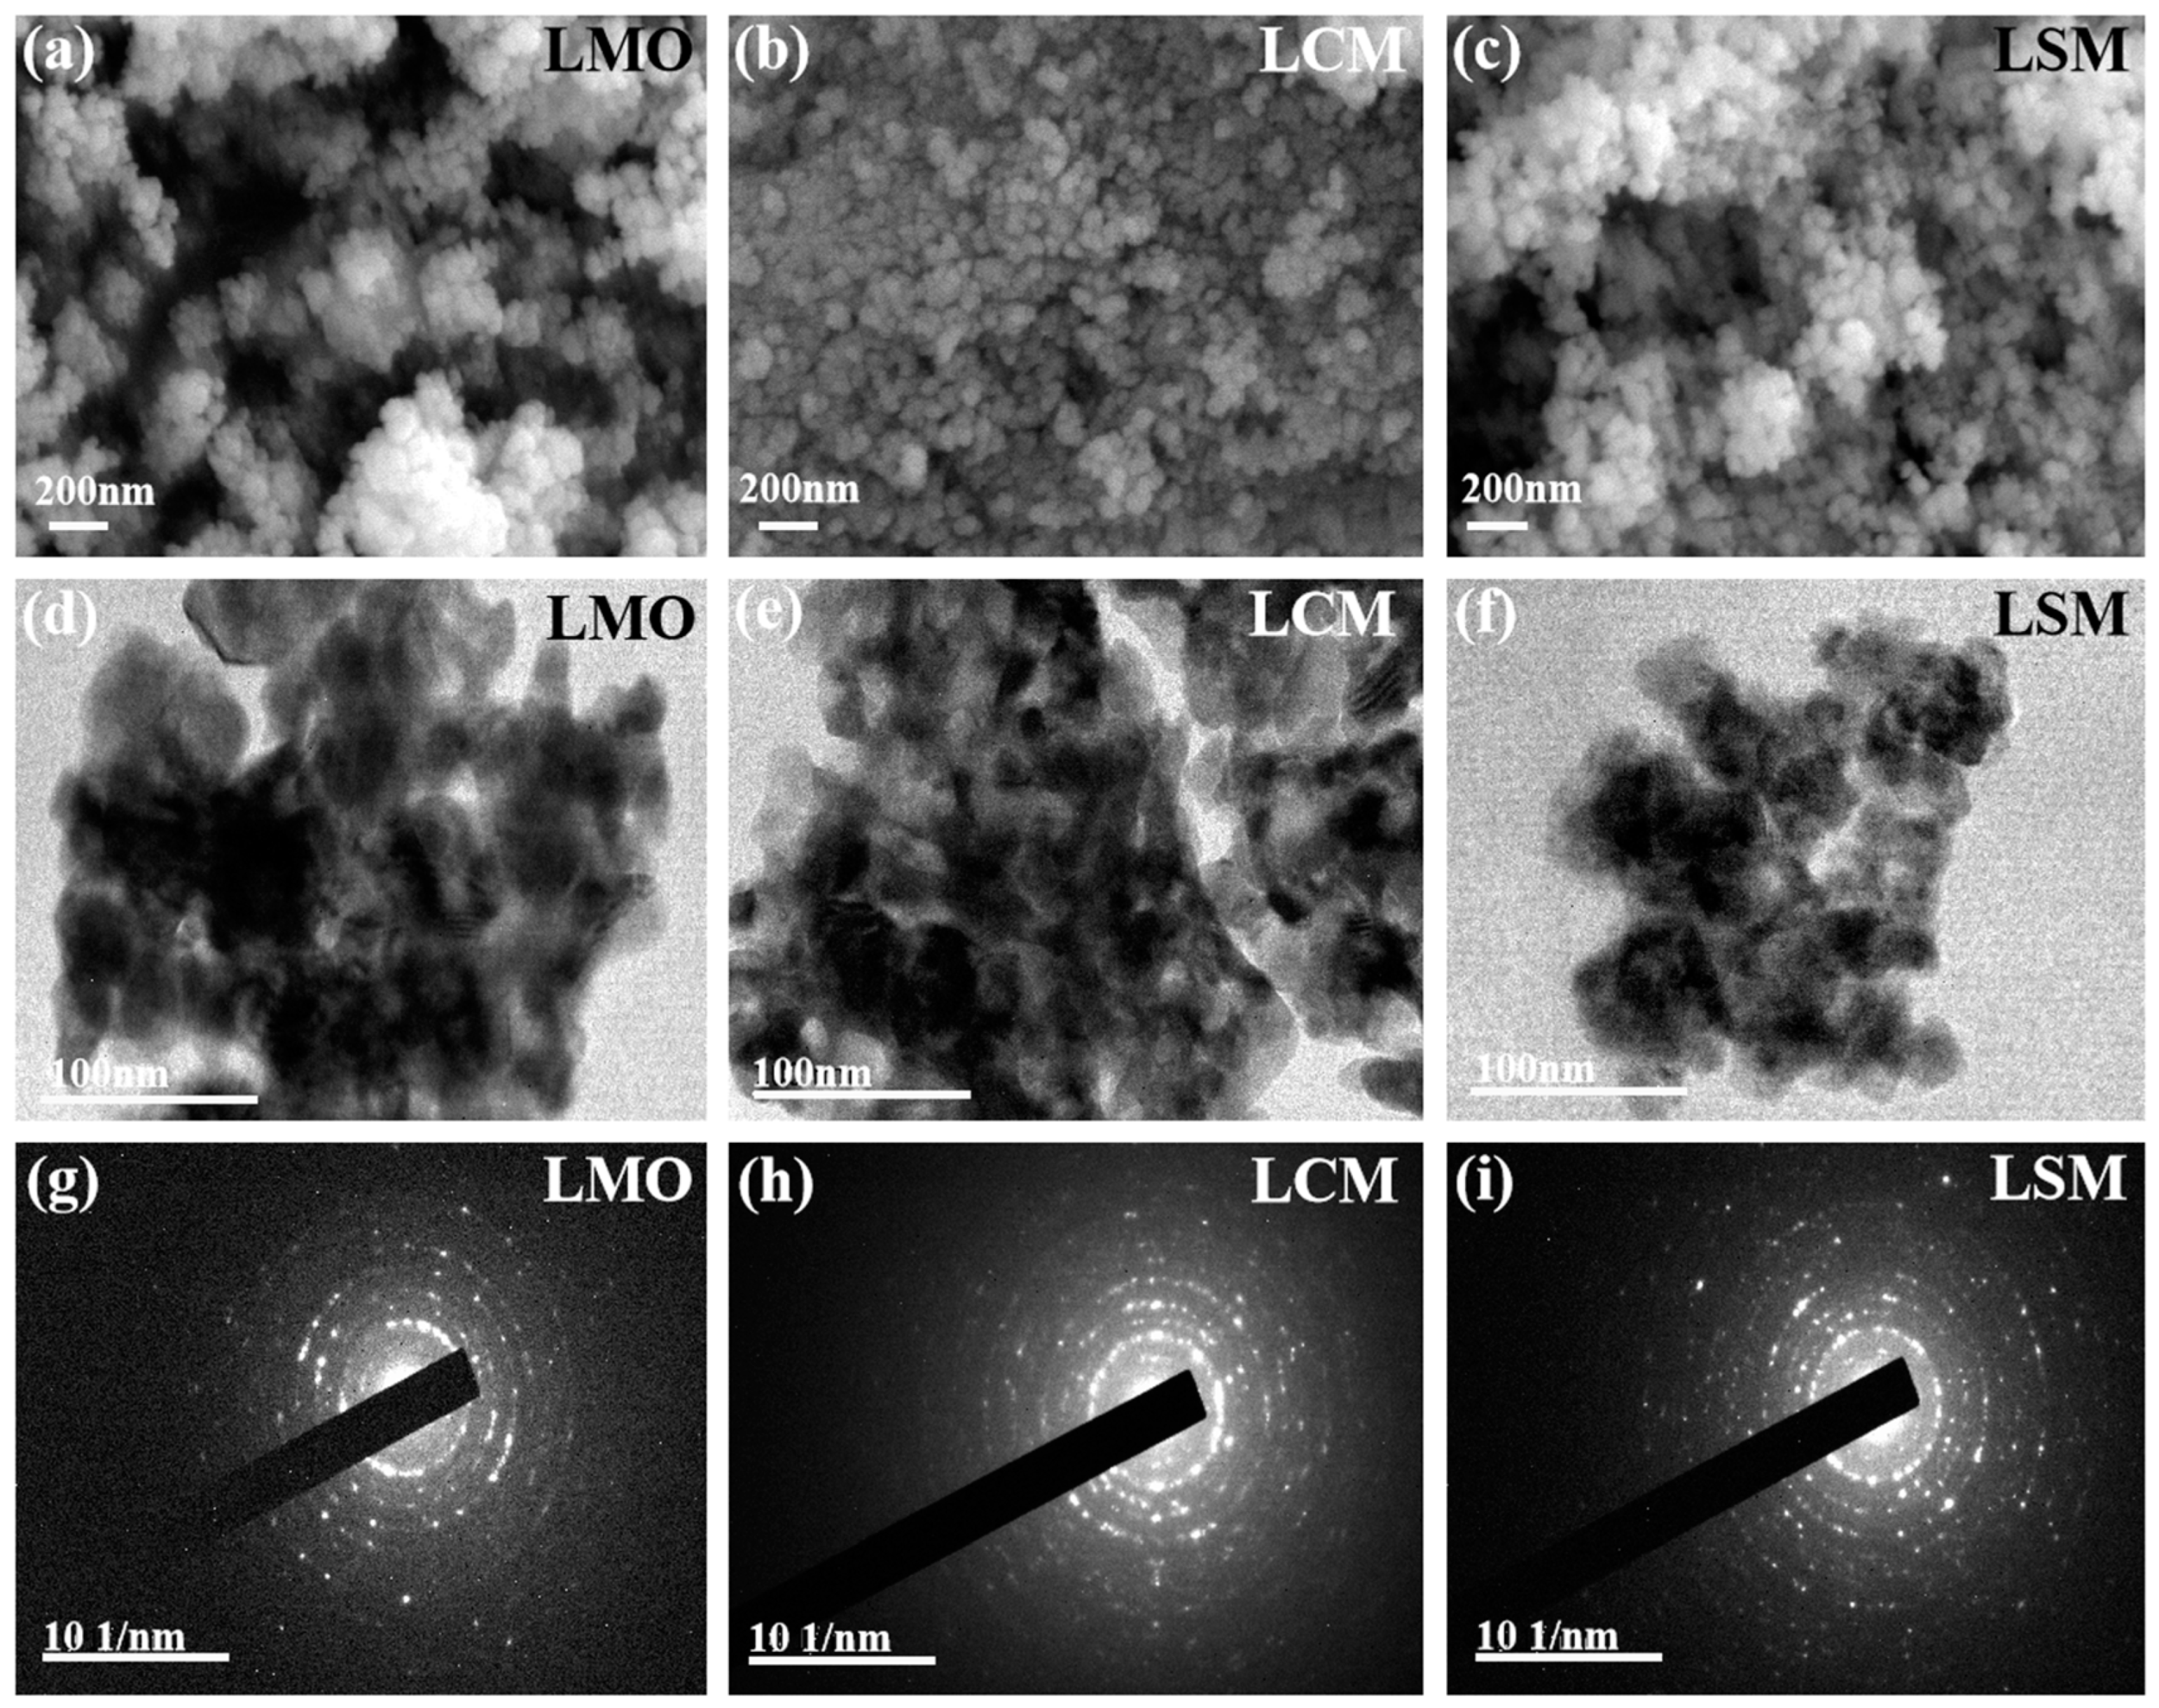
Figure 2a−c shows that the LMO, LCM, and LSM samples exhibit consistent grain size and fine grains in their microstructures.The three specimens primarily contain clumped particles, with LMO exhibiting the most rugged structure and the biggest clusters. The clusters of LCM and LSM are significantly smaller in size when compared to the pure LMO nanoparticle sample, measuring approximately 50 nm. The LSM sample consists of uniformly distributed fine nanoparticles with small grain size, and the analysis reveals that the pure LMO sample (about 50 nm) is much larger than the grain size of the LSM sample (about 25 nm). The LCM sample (about 22 nm) shows a fine and homogeneous agglomerate morphology with a smaller grain size compared to the LSM sample. The SEM image shows that the LMO nanoparticle size decreases with Ca and Sr doping and the LCM grain size is the smallest. The TEM analysis in
Figure 2d−f reveal additional intricate details regarding the morphology and structure of the LMO, LCM, and LSM samples. The results indicate that the agglomerates consist of layered stacks of nanoparticles exhibiting a fine and relatively uniform distribution of grain sizes. Notably, the grain size of the LCM and LSM samples is smaller compared to that of the LMO. Moreover, the LCM exhibits a relatively smaller grain size and superior dispersion. In
Figure 2g−i, it can be observed that the LMO, LCM, and LSM samples exhibit concentric ring patterns, suggesting that all three samples possess a polycrystalline structure.
The nitrogen adsorption and desorption isotherm curves in
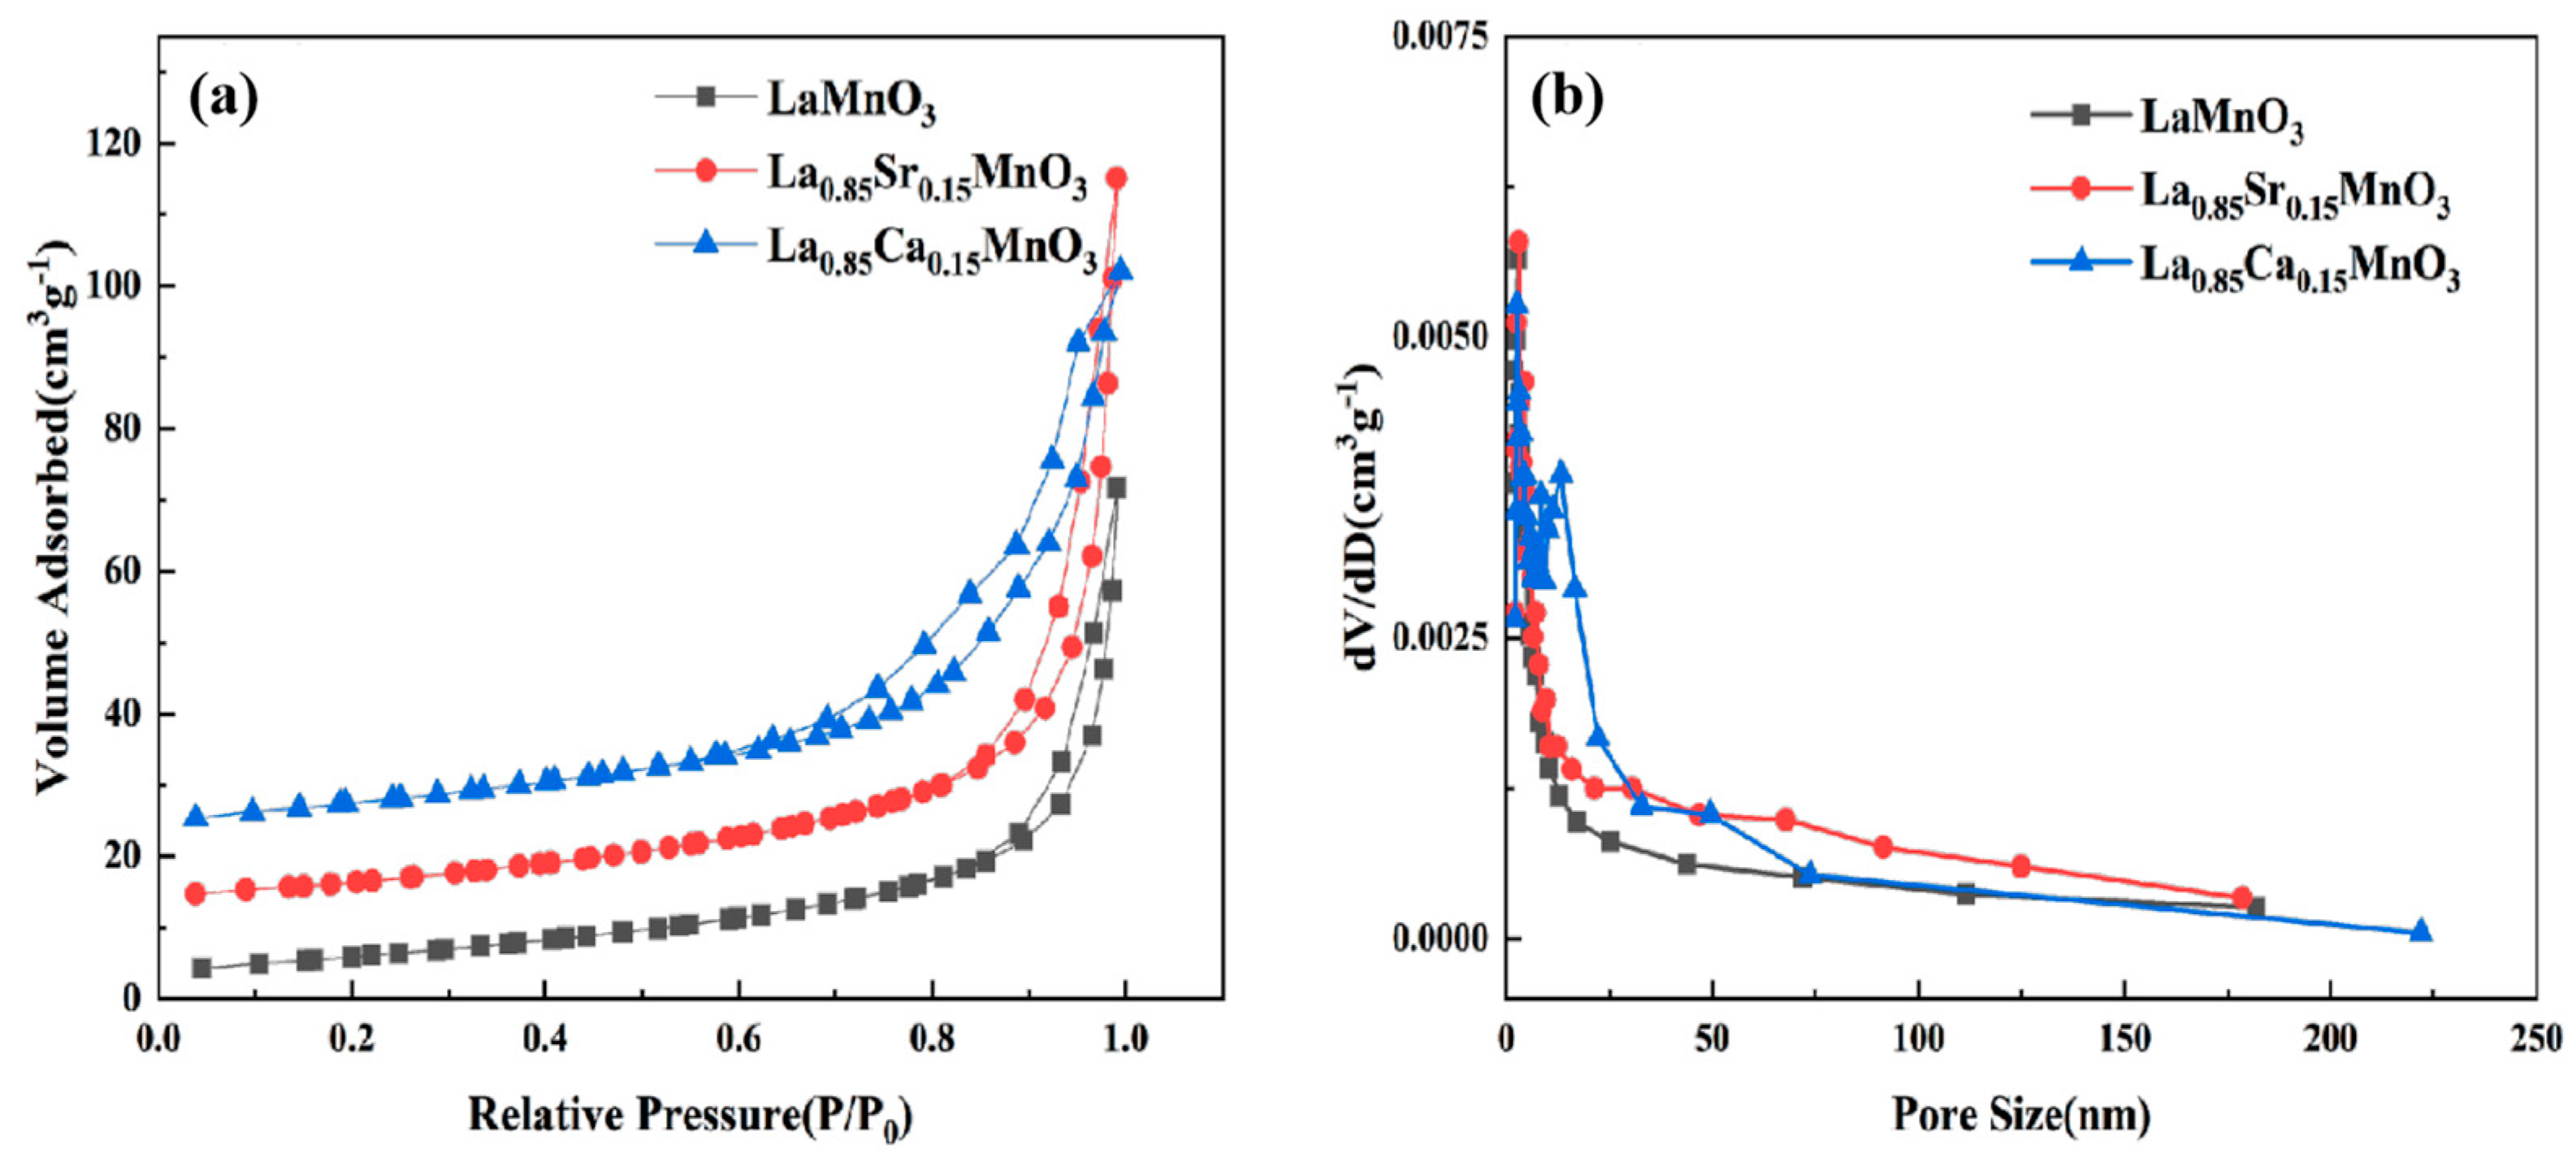
Figure 3a are Type IV curves [
26]. The specific surface area of the LCM samples is also greater than that of the LSM sample.
Figure 3b shows the pore size distribution of the LMO, LCM, and LSM samples. It can be seen that the average pore sizes of the LMO, LCM, and LSM samples were 3.048 nm, 2.539 nm, and 2.806 nm respectively. The average were both smaller than the average pore size of the pure LMO (3.048 nm). The results show that the LSM samples show more mesopores than the LMO samples and that the LCM samples have the most mesopores.
The XPS analysis in
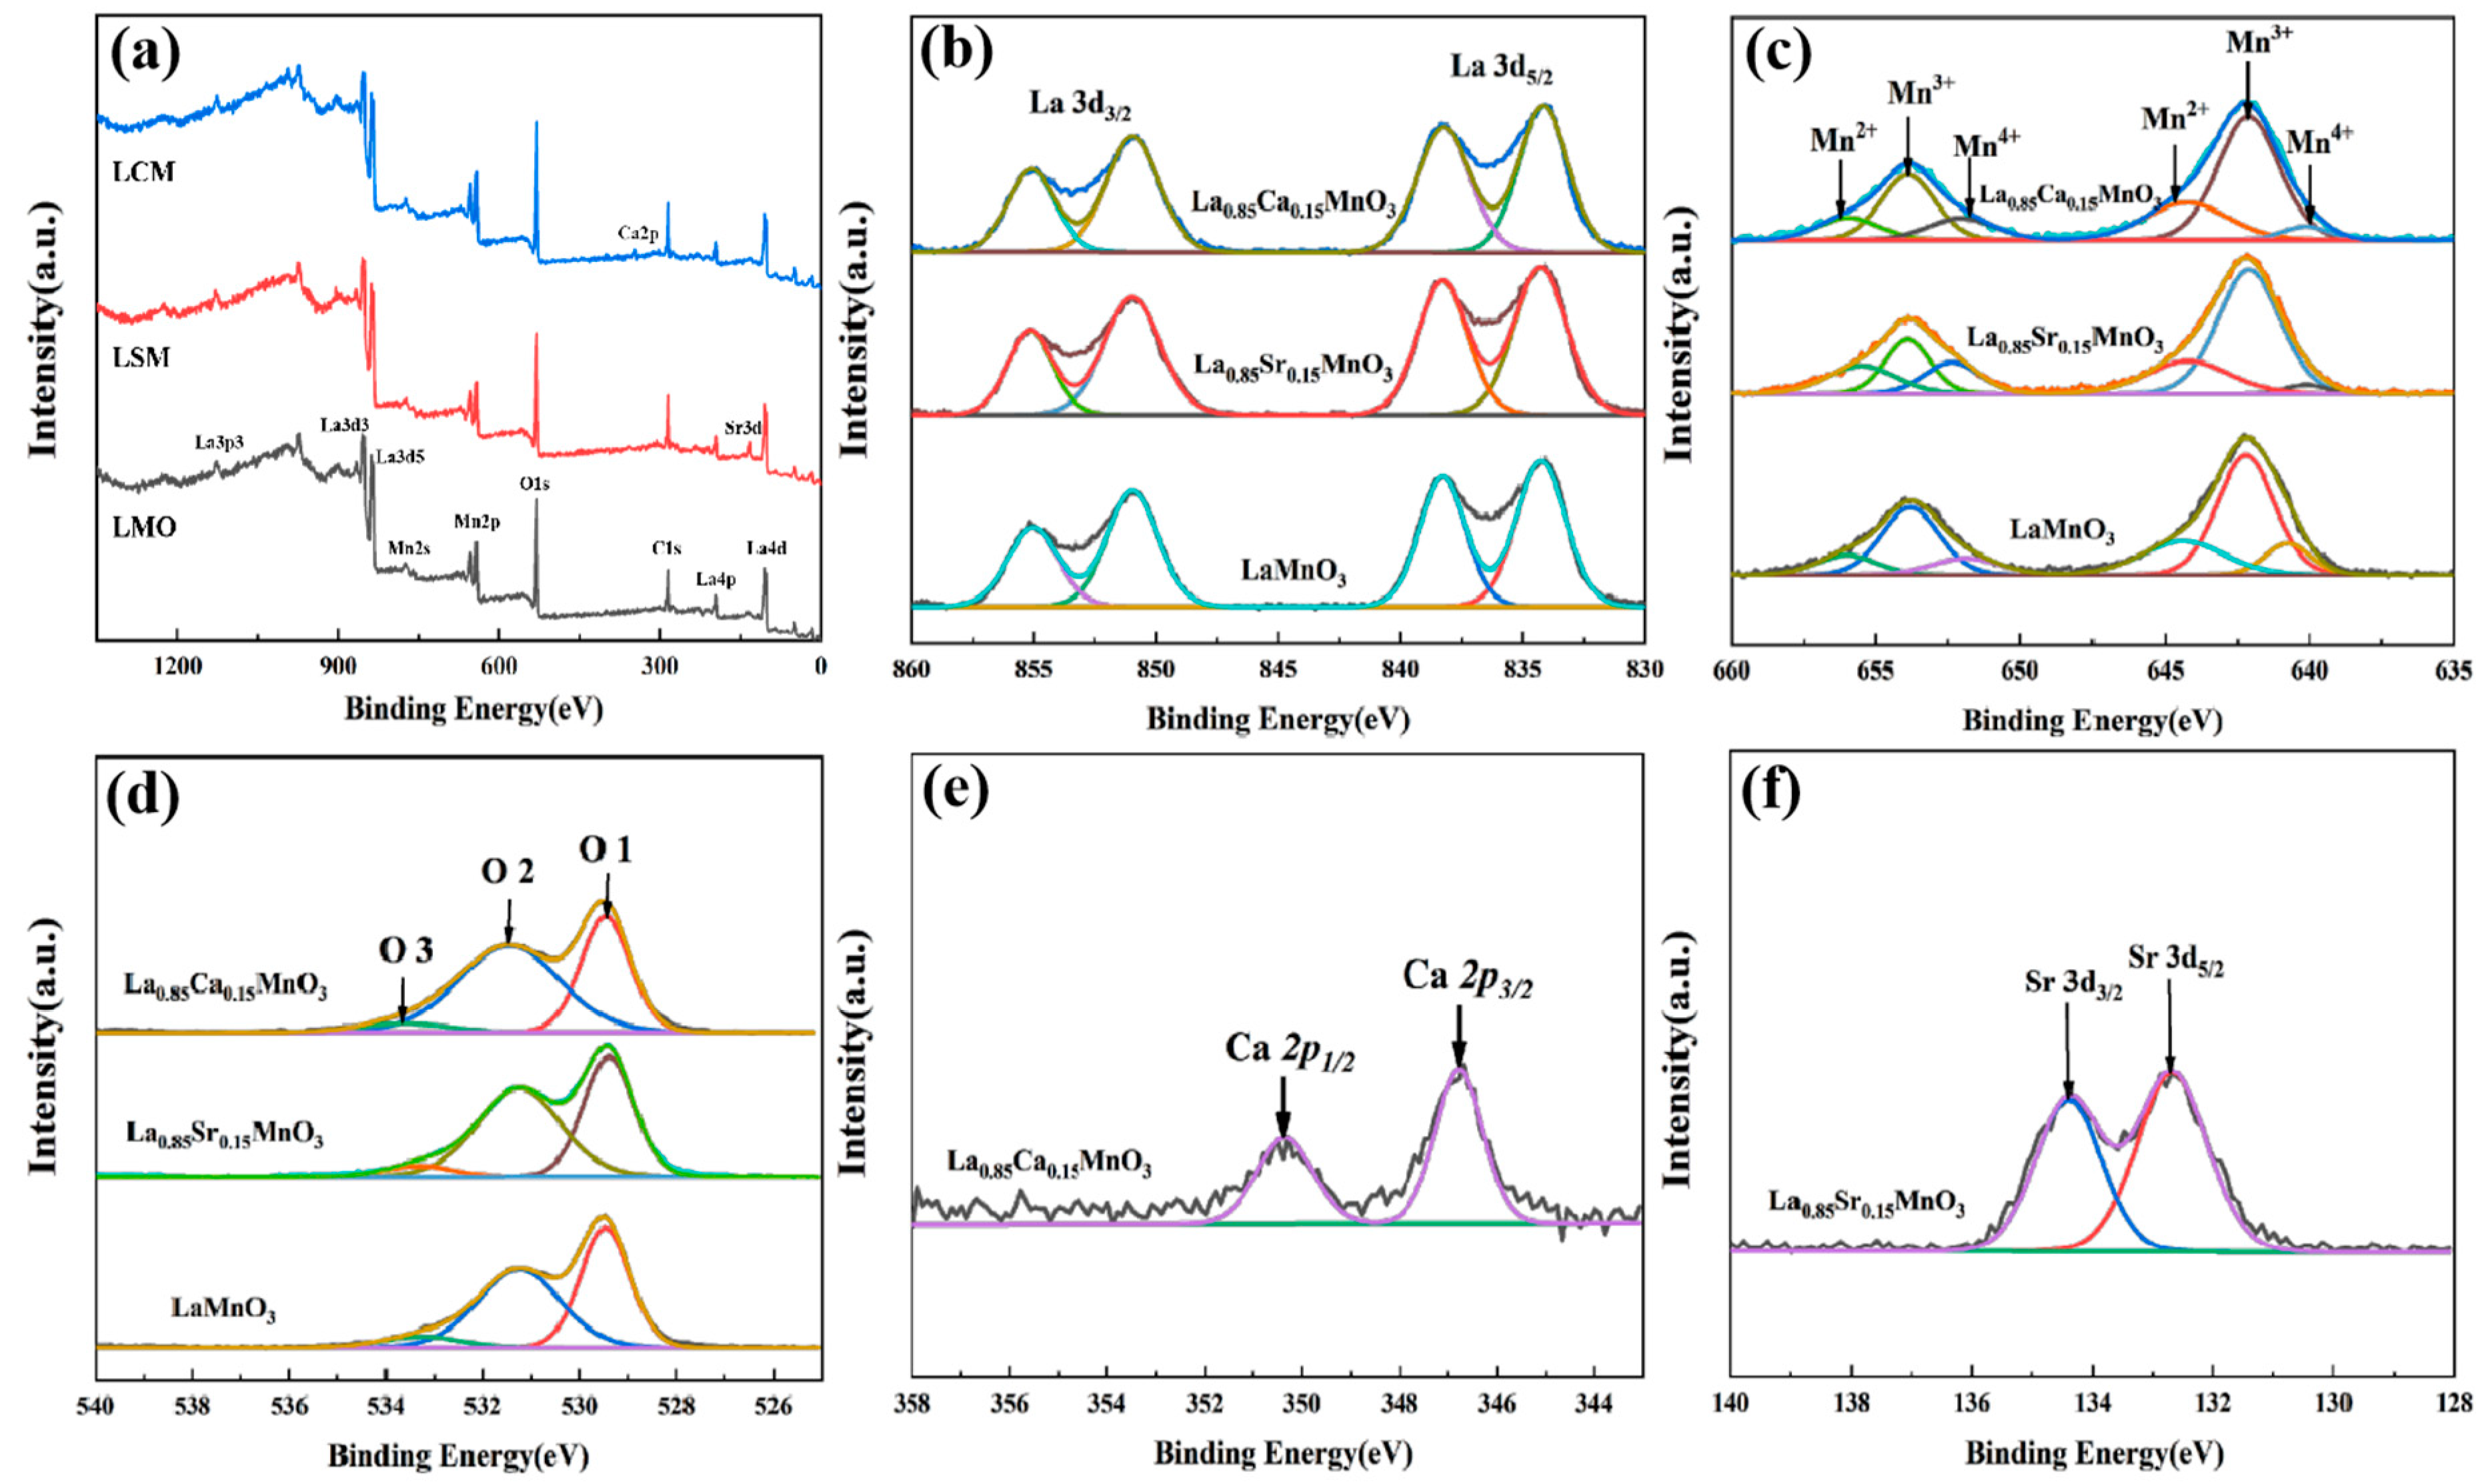
Figure 4 shows the changes in the surface oxidation state due to different A−site substitutions.The full XPS spectra for LMO, LSM and LCM samples in the binding energy from 0 to 1300 eV indicate no presence of impurities (
Figure 4a).
Figure 4b shows that the La
3d5/2 spin−orbital peaks are located at 834.3 and 838.1 eV; while the peaks at 850.6 and 855.6 eV correspond to the La
3d3/2 spin−orbital peaks. The above results indicate that the La element in the LMO, LCM, and LSM samples is present in the +3 valence state [
27]. The split peak fit analysis of the Mn
2p spectra of the three samples is shown in
Figure 4c. The two main peaks are shown: Mn
2p1/2 with a high binding energy and Mn
2p3/2 with a low binding energy, with the difference remaining at around 11.7 eV. The Mn
2p spectrum of LMO shows a wide emission line width and a clear maximum range, which indicates the presence of Mn in different oxidation states. The results of the split−peak fit indicate that Mn has three oxidation states: Mn
2+ (3d
5), Mn
3+ (3d
4), and Mn
4+ (3d
3). The Mn
2p3/2 peaks of the LMO samples were 644.41 eV, 642.31 eV, and 641.25 eV, corresponding to the Mn
2+, Mn
3+, and Mn
4+ oxidation states, respectively. The percentages of the three oxidation states in the LMO, LCM, and LSM in the element Mn are listed in
Table 1. The Mn
4+ content of the LMO sample is the lowest. The increment of Mn
4+ content in LCM sample is not enough to change its crystal structure, therefore both LCM and LMO remain orthorhombic. In addition, the LSM sample has the highest Mn
4+ content. The excessive Mn
4+ ions in LSM sample impels the transition of the LSM from an orthorhombic to a rhombic structure, which reduces the energy tendency of the Jahn−Teller effect [
28]. It is hypothesized that the smaller size and higher charge density of the Mn
4+ cation favors the contraction of the Mn−O bond, leading to the rhombic structure [
29]. The high−resolution spectrums of O 1s fitted by three peaks are shown in
Figure 4d. The three peaks at 529.5, 531.6, and 533.8 eV correspond to the O1, O2, and O3 components, respectively [
27]. O1, O2 and O3 denote lattice oxygen (O
2−), surface adsorbed oxygen (O
−, O
2− and O
22−) and oxygen−containing groups (OH), respectively. The relative concentrations of the three types of oxygen are shown in
Table 1. The oxygen vacancy concentration of the electrode material is closely related to the electrochemical performance. The higher the concentration of the O2 substance, the easier the adsorption of OH
−, which accelerates the surface redox reaction and will improve the electrochemical performance [
30]. The oxygen vacancy concentration is expressed as the O2/O1 molar ratio. It is calculated that the magnitude of oxygen vacancy concentration of LMO, LCM, and LSM samples is in the following order: LCM (1.47) > LSM (1.34) > LMO (1.06). Thus, LCM has better electrochemical performance compared to LSM and LMO.
Figure 4e shows the peak difference analysis of the Ca
2p spectrum of the LCM sample, showing the two main peaks formed by the low binding of 2p
1/2 and 2p
3/2, with the difference remaining around 5.2 eV and the Ca ion present in the sample in the +2 valence state [
31].
Figure 4f shows the peak difference analysis of the Sr 3
d spectrum of the LSM sample, showing the two main peaks formed by the low binding of
3d3/2 and
2p5/2, with the difference remaining around 2.2 eV, demonstrating that the Sr in the system is +2 valence [
32].
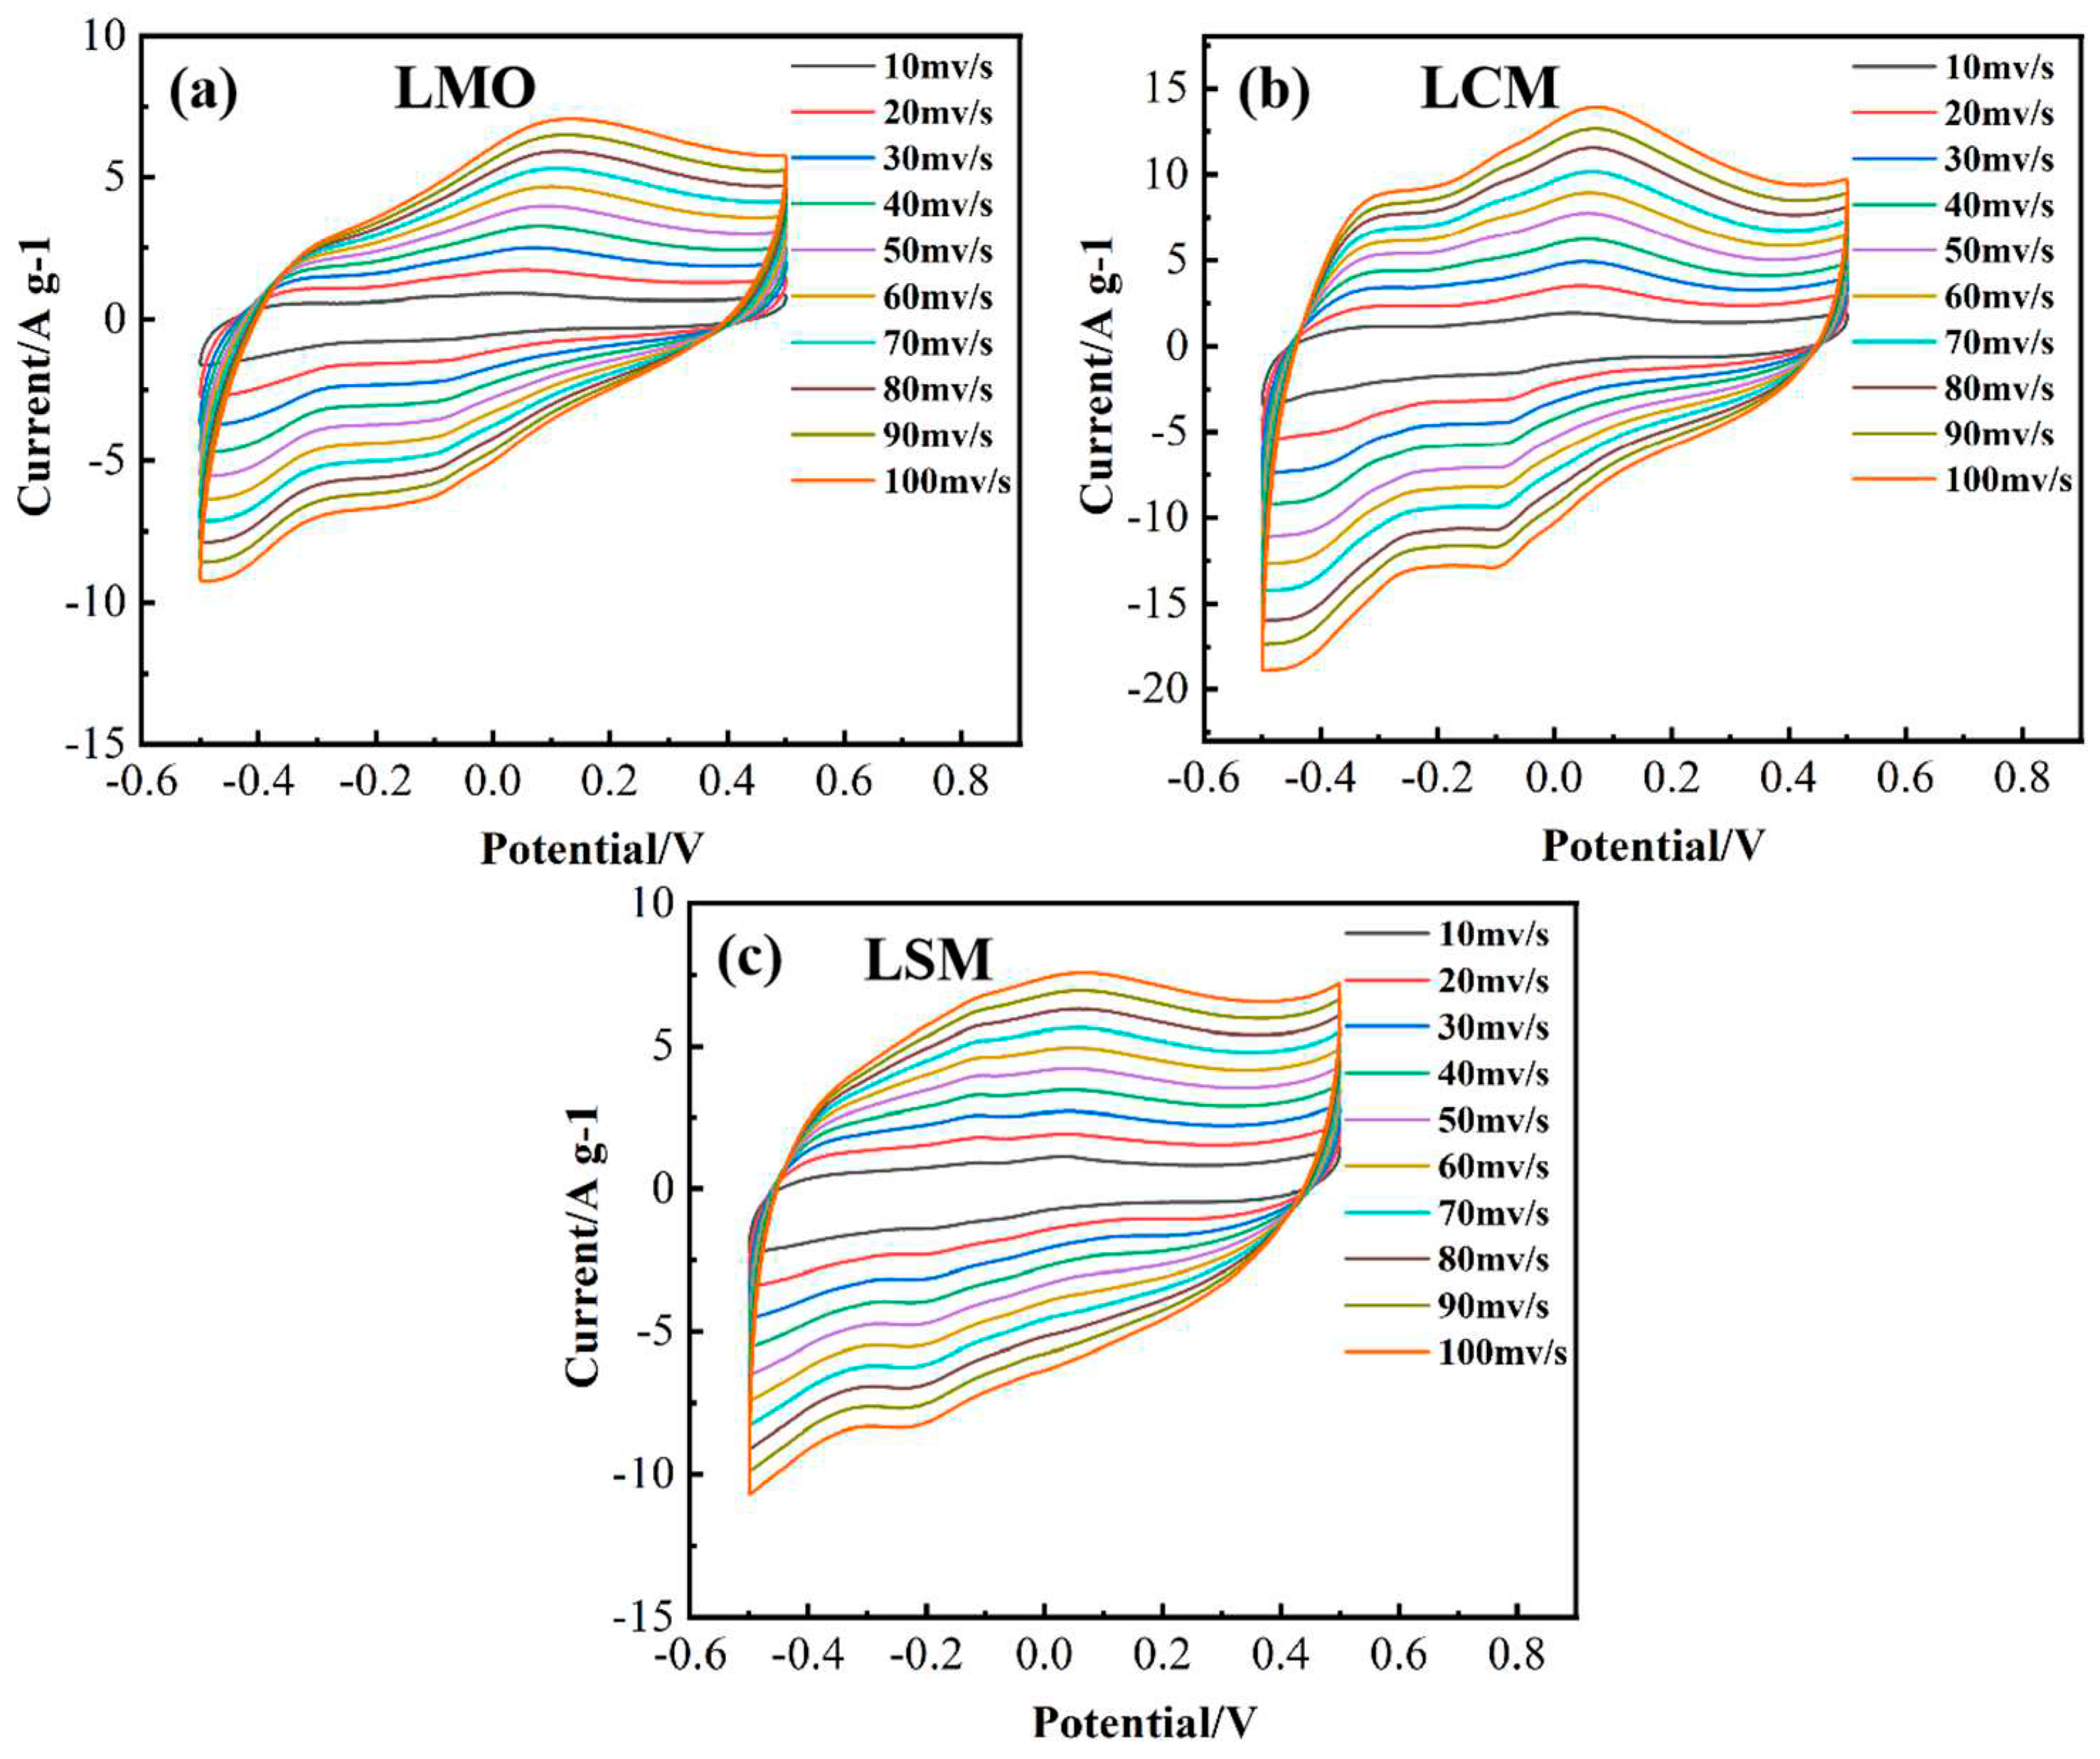
Figure 5 demonstrates the characterization of the cyclic voltammetric (CV) curves of LMO, LCM, and LSM electrode at a scan rate of 10 – 100 mV/s using 3 M KOH as the electrolyte, in order to examine the effect of Ca/Sr-doping on the electrochemical performance of LaMnO
3. The results indicate that the form of the CV curves remained largely unaltered as the scanning speed increased, suggesting favorable reversibility.In the meantime, the configuration of the CV curves demonstrates the pseudocapacitance characteristics of the LMO, LCM, and LSM electrodes. Additionally, the redox peaks, which correspond to the alteration of Mn
2+ and Mn
3+ valence states, are distinctly visible, with two peaks at 0.1 and − 0.1 V, respectively. Mefford et al. proposed an anion − intercalation mechanism, which suggests that the charge storage mechanism for LaMnO3 depends on the presence of oxygen excess or oxygen deficiency during the charge/discharge process [
33]. Equations (1) and (2) [
34] provide the comprehensive redox reaction equations.
During the initial stage of the oxygen intercalation procedure in the LaMnO
3 electrode, hydroxide ions (OH
−) are taken in by oxygen imperfections to produce superoxide ions (O
2−) and water (H
2O) in the alkaline electrolyte.Subsequently, O
2− ions are transported across the octahedral lattice to maintain the structural stability of oxygen vacancies.In the process of the reaction, the nearby Mn
2+ changes into Mn
3+ while releasing an electron, resulting in the formation of the neutral LaMn
3+O
3 (refer to Equation (1)). In Equation (2), the subsequent stage involves the emergence of manganese from the core of the oxygen octahedron. This leads to the incorporation of surplus oxygen into the outer region, causing the valence of the Mn cation to rise from Mn
3+ to Mn
4+, resulting in an oxygen excess.Because there are additional oxygen vacancies, the divalent element (Ca
2+/Sr
2+) takes the place of some La
3+ in the A site. Subsequently,the response transforms into the subsequent.
The oxidation process from Mn
2+ to Mn
3+ in La
0.85M
0.15MnO
3 samples exhibited similarities to the process described by Mefford et al. [
18]. The oxygen vacancy is filled by O
2− intercalation. Despite the oxidation of all Mn
2+ are oxidized to Mn
3+, La
0.85M
0.15Mn
3+O
2.925 still maintains a hypoxic state. As a result, the process of Mn
3+ oxidation to Mn
4+ consists of two distinct stages. During the initial phase, when δ is less than or equal to 0.075, the oxidation of Mn
3+ to Mn
4+ occurs by continuously removing O
2− to fill the remaining oxygen vacancies. Several oxygen vacancies migrate towards the surface of the material to form
. The second stage involves the same process of Mn
3+ oxidation to Mn
4+, resulting in the formation of
.
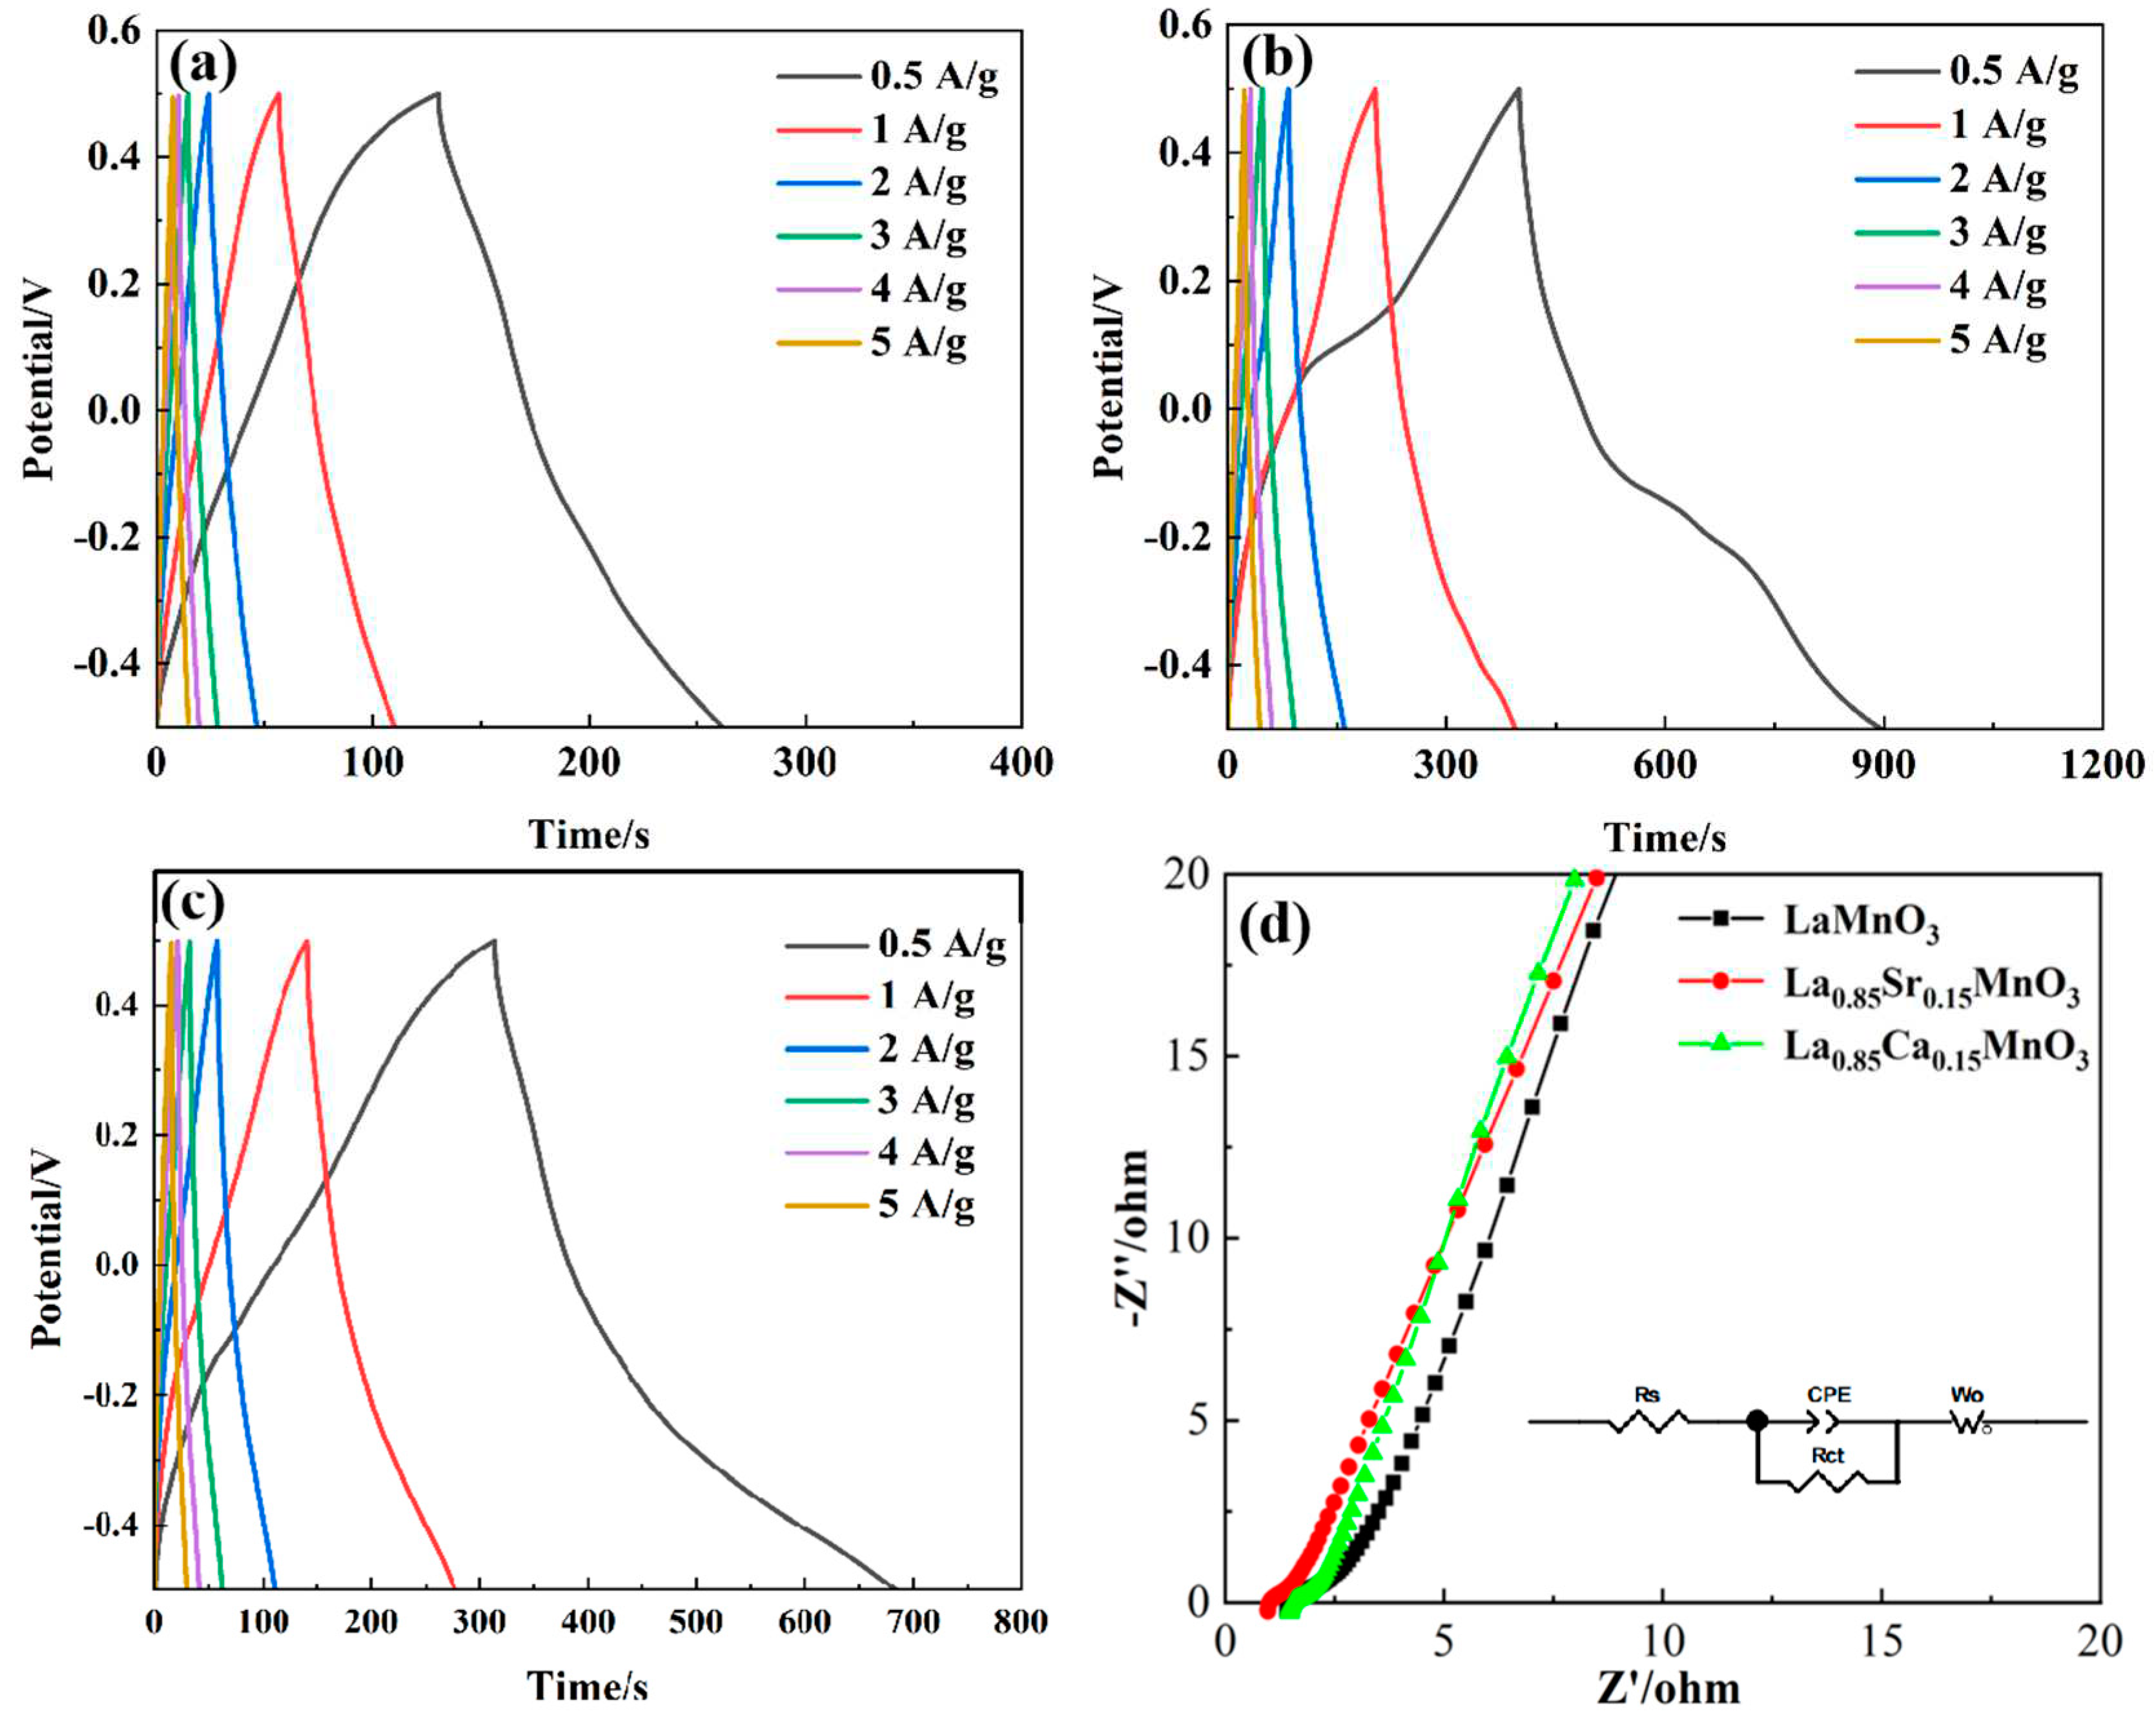
Figures 6a−c illustrate the variations in galvanostatic charge-discharge (GCD) profiles for LMO, LCM, and LSM under varying current densities.As the current density increases, the GCD curves of LMO, LCM, and LSM show a decrease. This is due to the rise in internal resistance at higher current density, resulting in a decline in specific capacitance. The LCM and LSM exhibit extended discharge durations compared to the LMO, suggesting that the substitution of A sit greatly enhances the capacitive performance.The charge−discharge curves exhibit asymmetrical triangular shapes, suggesting that the predominant capacitance in the samples is primarily pseudocapacitance. The impedance diagram can usually be divided into two parts in
Figure 6d.The AC impedance consists of a semi-circular, curved area that represents the high-frequency region and indicates the redox reactions happening at the electrode.The remaining portion is the linear segment, denoted as the low-frequency range of the AC impedance, characterized by the capacitance produced on the electrode's surface.The semi-circular arc portion in the impedance diagram represents the magnitude of the charge transfer resistance, which is equal to the diameter of the charge transfer resistance. By fitting the data in
Figure 6d, we can determine that the charge transfer resistance for LMO, LCM, and LSM is 0.48 Ω, 0.36 Ω, and 0.38 Ω, respectively. Notably, the LCM sample exhibits the least impedance.Ca and Sr belong to the same main group and the atomic radius of Ca is less than Sr.Doping Ca at the La site, as opposed to doping Sr, can enhance the formation of additional oxygen vacancies, thereby favorably enhancing the electrochemical characteristics of La−based perovskite structure materials [
34].
