
Submitted:
30 October 2023
Posted:
01 November 2023
You are already at the latest version
Abstract
Cultural Tourism (CT), which enhances the economic development of a region, aids a country in reinforcing its identities, enhancing cross-cultural understanding, and preserving the heritage culture of an area. Designing a proper tourism model assists the tourists in understanding the point of interest without the help of a local guide. However, owing to the need for the analysis of different factors, designing such a model is a complex process. Therefore, this article proposes a CT model for Riyadh for peak visitor time. Primarily, the map data and cultural event dataset are processed for location, such as grouping with Kriging Interpolation-based Chameleon (KIC), tree forming, and feature extraction. After that, the event dataset’s attributes are processed with word embedding. Meanwhile, the Social Network Sites (SNS) data like reviews and news are extracted with an external Application Programming Interface (API). The review data is processed with keyword extraction and word embedding, whereas the news data is processed with score value estimation. Lastly, the data are fused corresponding to a historical site and given to the Multi-Quadratic-Long Short Term Memory (MQ-LSTM) Recommendation System (RS); also, the recommended result with the map is stored in a database. Lastly, the database security is maintained with Locality Sensitive Hashing (LSH); moreover, by attaining higher performance values, the proposed model is experimentally verified.
Keywords:
cultural tourism (CT)
; multi‐quadratic‐long short term memory (MQ‐LSTM)
; social network sites (SNS)
; tourism recommendation (TR)
; geographic information system (GIS)
; Kriging interpolation‐based Chameleon (KIC)
1. Introduction
Tourism is valued in most countries owing to its contribution to economic, social, and cultural development. Previously, by sharing travel information with clients and suppliers, travel agencies aid in sustainable tourism development, which makes positive contributions to ensuring social-cultural and economic sustainability (Sung et al., 2021). However, tourism has entered a novel era of smart tourism with the rapid development of modern information as well as communication technology and the continuous refinement of the tourism market demand (Yang, 2022). Moreover, the big data era has triggered a complete change in CT development. Informationization has resulted in a fast spread of public opinion, which is directly associated with tourism destination survival (Zhang & Dong, 2021). Hence, researchers developed a smart CT information system comprising of tourism historical destinations that combines the Graphical Interface System (GIS) and historical information content of historical sites (Dar et al., 2022).
Moreover, in smart CT, the contextual suggestion has emerged as a modified RS. For providing the tourists with a list of suggestions grounded on contexts like location, time of day, or else the day of the week (weekdays or weekends), the contextual RS is integrated with larger databases (Rehman Khan et al., 2021). Grounded on the point of interest ratings and recommendations, various contextual tourism RSs were developed since they are valuable to tourists and enable them to explore new places for visiting (Stamatelatos et al., 2021). Moreover, for the tourism recommendations, several Machine Learning (ML) and Deep Learning (DL) approaches like collaborative filtering and CNN (He, 2022) were developed. But, the recommendation could not be reliable only with the contextual information. Therefore, for the modeling of cultural heritage sites, a GIS model, namely ArcGIS 10.5 was utilized during CT (Saha et al., 2021).
This GIS interpretation mainly aims in enabling visitors for understanding the place, sensitizing them to the surroundings, and making them aware of the significance of the nature and monuments of the visiting point of interest (Nowacki, 2021). Thus, for sustainable CT, a database model should be developed to provide information on the cultural sources of a region centered on spatial and contextual information. However, to get hold of tourists, any country should consider various factors like peak visitors’ time of the prevailing heritage place and its significance to providing convenient CT. Hence, for enhancing tourism, this article proposes an MQ-LSTM-based tourism model for RIYADH, the capital city of Saudi Arabia. Since the events have a strong as well as wide cultural effect on the local society, the cultural events of Riyadh are considered in this research (Alghamdi et al., 2020), which could attract tourists.
1.1. Problem Statement
Even though some researches are available for the tourism recommendation model, they exhibit several limitations, which are given as,
- During the busy hours in historical sites, the recommendation model for analyzing the culture of the place by recommending the most nearby cultural events is scarcely developed.
- In conventional works, when the recommendation is created only grounded on the reviews, the historical importance was neglected, which affects the recommendation of CT.
- When a tourism-centric database is created, there is no guarantee that the database is used by legal users only. This would cause a security threat to the historical sites, which are the cultural symbol of a country.
By analyzing the aforementioned issues, the objective of the proposed framework is to develop a smart CT model in a secure database and its contributions are,
- To develop KIC and CVC-MST schemes for analyzing the possible nearest cultural events to the historical sites and suggested to tourism planners.
- To develop an MQ-LSTM recommendation model considering the location, time, review along with historical significance.
- To establish an LSH hashing for providing the security of the tourism recommendation database using the user attributes.
2. Related Works
The (Li et al., 2022) established an RS for rural tourism routes grounded on the multiple data sources’ fusion model. Centered on the idea of tensor orthogonal decomposition, the RS was developed. The experimentation revealed that the developed model attained the lowest Error. Nevertheless, the algorithm was developed considering the ratings only, which could not be reliable since some popular places receive lower ratings.
(Konstantakis et al., 2022) presented a mobile RS for multi-profile cultural visitors grounded on visiting preferences classification named ACUX Recommender (ACUX-R). To assign profiles for cultural visitors, ACUX topology was leveraged. A study and questionnaire-based evaluation proved that the ACUX-R model satisfied the cultural visitors. But, the model was applicable only to local people, which limited the model to in-situ visitors only.
(Weng et al., 2022) employed ArcGIS 10.5 as an analysis tool for the temporal and spatial distribution of A-level tourist attractions in Chengyu. By utilizing the geographic detector model, an analysis was performed by the model on the factors affecting the distribution of tourist attractions. As per the outcomes, the impact factor of A-level tourist attraction was owing to the traffic, topography, river system, and socio-economic development model. Yet, the model neglected the cultural events, which might be an A-list tourist attraction.
(Wang, 2022) recommended a DL-centric spring festival holiday tourism data mining model. Primarily, the tourism information and key factors, which affected the choice of tourist attractions, were excavated. After that, grounded on the analyzed key factors, the recommendation was given. The experimental analysis revealed a better convergence rate of the scenic spots after optimization. The scheme also had a shortcoming, namely poor recommendation quality.
(Perles-Ribes et al., 2020) established an ML technique to predict over-tourism in Spain. Here, the ML models utilized were Linear Regression, SVM, and Naïve Bayes. The descriptive analysis displayed that the indicator and objective thresholds acted as the indication of overcrowding situations. Nevertheless, the exercise performed stated that the utilized competitiveness index was not a determinant of over-tourism.
(Andria et al., 2019) illustrated a heuristic fuzzy approach for the assessment and management of tourism sustainability. Here, for handling the involved variables’ inherent uncertainty as well as vagueness, fuzzy was wielded. Afterward, for the assessment of the relationship betwixt the obtained ranked outcomes and the obtained life score quality, a correlation analysis was introduced. The algorithm was applied for the Italy region and found to ensure a high level of versatility. However, with fuzzy logic, inappropriate decision-making rules would deteriorate the assessment results.
(Cao et al., 2023) recommended a model for the sentiment analysis of Chinese tourists toward Malaysia's cultural heritage grounded on online travel reviews. The sentiment analysis leveraged vocabulary filtering, semantic clustering technology, BERT, along with co-occurrence analysis. Lastly, the BERT-based emotions predicted with BERT obtained enhanced sentence predictive performance. But, the model was developed grounded on online content only, which might be false reviews.
(Wu et al., 2022) employed a personalized day tour design for urban tourists considering carbon dioxide emissions. For designing a personalized day tour route in Chengdu, China, the model developed an evolutionary system grounded on reinforcement learning. The outcomes indicated that the developed algorithm was superior to the selected baseline techniques. Nevertheless, for the day tour design, a limited number of factors were considered.
(Amato et al., 2020) presented a multi-agent-based scheme for the recommendation of cultural tours. The multi-agent model enclosed beliefs, desires, and intentions for the plan recommendation with the estimated user behavior and item similarity. The preliminary experimental results on the system validated the developed approach. However, in the multi-agent model, if the evaluation failed on beliefs, the action was not applied to the world.
(Sarkar et al., 2020) suggested a multiple itinerary tourists recommendation engine named MULTITOUR. The recommendation was grounded on the tourists’ interests and different constraints. The outcomes exhibited that regarding the accuracy, the MULTITOUR algorithm outperformed the baseline techniques. But, with the geotagged photos, long-time tourism could not be effectively recommended.
3. Proposed Methodology for the Cultural Tourism Accelerator in Riyadh
In 2000, Riyadh was chosen as the cultural capital of the Arab world by UNESCO. The city encloses various cultural centers. Therefore, a tourism model based on the MQ-LSTM is developed to enhance tourism in Riyadh to spread its culture. Figure 1 elucidates the proposed work’s block diagram.
3.1. Input Data
In the proposed system, the GIS map , Festival and events dataset , and Social Networking Site (SNS) data, namely Google reviews and news data are taken as input data and are expressed as,
3.2. Processing with Location
Primarily, the locations of the mapped historical sites and the cultural events along with the festivals near the historical sites data are processed. This process is for suggesting nearby cultural events and festivals, and also, for mitigating the waiting time of tourists, who wishes to know about the culture of Riyadh.
3.2.1. Spectral Grouping
To identify the nearest points, the locations of historical sites and cultural events are combined. Here, by utilizing the KIC clustering technique, the nearest nodes (i.e. nearest events of historical sites) are grouped as a single cluster. Here, the Chameleon clustering is considered owing to its efficiency in constructing graph-based clustering. However, the Chameleon clustering struggles in forming a single group with a few data values. Therefore, to overcome this problem, Kringing Interpolation (KI) technique is wielded in Chameleon clustering. The overview of KIC is depicted in Figure 2.
Graph construction: Initially, in KIC clustering, the sparse graph is constructed for the location data in grounded on the K-Nearest Neighbors (KNN), and the location data is signified as,
Wherein, symbolizes the historical site and cultural event location set, represents the locations of the historical site and cultural event. In the KNN-based graph generation, a node is connected with its closest neighbor by an edge that is given weight equal to the inversion of their distance. Hence, the graph constructed is defined as . After that, to form spectral clusters, the partitioning and merging of the graph process are carried out.
Partitioning: From the generated graph , the graph separation is performed with a graph partitioning algorithm, such that each cluster is divided into sub-clusters . This splitting is executed for minimizing the weight of the edges by cutting the edges. Therefore, the initial sub-clusters are obtained with the graph partitioning algorithm and the edge cut is signified as .
Merging: The relative inter-connectivity and Relative closeness are determined after the sub-clusters are obtained. The KIC clustering merges the pair of sub-clusters for which and are high. Thus, to merge and form a cluster even with a small number of data, the KI-based relative inter-connectivity is estimated as,
Where, symbolizes the distance function, , represents the edge cut of sub-clusters. After that, the relative closeness betwixt the sub-clusters is given as,
Where, indicates the edges’ average weights of the edges that belong to the min-cut bisector of sub-clusters , correspondingly, indicates the edges’ average weight that connects the vertices in to the vertices in . Then, after the and are determined, the sub-clusters with are merged to form spatial clusters, which are denoted as,
Where, signifies the cluster with the respective historical site and its nearest possible cultural events.
| Pseudocode of Proposed KIC grouping |
| Input: Locations |
| Output: grouped locations |
| Begin |
| Initialize locations, distance function |
| For input locations do |
| Construct graph with KNN |
| Perform partitioning of to |
| For merging do |
| Estimate KI relative interconnectivity closeness |
| Estimate relative closeness |
| If then |
| Merge sub-clusters |
| Else |
| Compare other sub-clusters |
| Repeat For2 |
| End If |
| End For |
| End For |
| Return cluster |
| End |
3.2.2. Tree Construction
After the locations are spatially clustered, by utilizing the proposed Cramer’s’ V Correlated-Minimal Spanning Tree (CVC-MST), the historical site with its nearest possible events is formed as a tree. This process is to arrange the historical site location and its nearest events in order. Here, the Minimal spanning tree is selected owing to its efficiency in path forming from the clustered graphs. However, the tree construction takes more time to create a child by looping repeatedly. Therefore, to solve this problem, the Cramer’s V Correlation (CVC) in a minimal spanning tree is introduced.
Sorting: From the graph , the edges are sorted in increasing order such that the parent node is formed as the historical site ; afterward, the child nodes are kept added to the tree grounded on the CVC correlation betwixt the parent and child nodes.
Correlation: The CVC correlation between and is equated to form the child without looping as,
Where, implies the chi-squared test result value, and signifies the total number of child nodes to be formed and the degree of freedom, correspondingly.
Construction: With the determined correlation value, the child node having a higher correlation is directly added to the parent node. Hence, by following this procedure, a reliable tree structure is formed. The developed tree is symbolized as .
3.2.3. Feature Extraction
After the tree is constructed, the features of nodes, such as edge weight, number of vertices, end-node, and starting nodes are extracted. The extracted features are given as,
Where, illustrates the feature set.
3.3. Event Data Processing
After the location of historical sites and cultural events features are obtained, the attributes of the cultural events are processed and the attribute set is represented as , which encloses the name, month, and date of the events.
3.3.1. Preprocessing
After is extracted, the data are pre-processed with missing value removal. This process is performed to mitigate the misclassification. Then, the pre-processed results is given as,
Where, epitomizes the preprocessed cultural event data.
3.3.2. Word Embedding
As the dataset contains the string values, such as month and festival name, it is then vectorized with the Bi-directional Encoder Representation from Transformers (BERT).
Tokenization: The BERT’s input layer is the pre-processed cultural event data . In the input layer of BERT, the tokens of each string are determined and represented within different classes (i.e. ), and each is separated by the separation function . The tokens of text are exemplified as,
Where, is the tokenized word.
Embedding layers: After that, the tokenized input are given to the embedding layer, which performs token embedding, segment embedding, and position embedding. Embedding is the representation of words in vector form.
BERT transformer layers: The token, segment, and position embedding are summed up and given to the BERT transformer encoder layer, which contains 12 transformers with twelve attention mechanisms and millions of parameters. The encoder encodes the string values, whereas the decoder determines the significant keywords and gives contextual embedding as,
Output layers: After the strings are processed by the transformer layers, it is then given to output layers to obtain the embedded output. In the output layer of BERT, strong links between the sentences are determined, which aids in word embedding. The output layer contains a simple classifier model with a fully connected layer and sigmoid activation. The loss in the classifier output is computed as,
Where, illustrates the target word embedding score, and is the output word embedding, which is computed utilizing,
Where, signifies the total number of hidden neurons in the fully connected layer, is the output of the hidden layer. Therefore, by utilizing BERT, word embedding is obtained in which the strings are converted to the corresponding vector format .
3.4. Processing with SNS Data
For a better understanding of the historical significance and public opinion of the historical sites, the SNS Google reviews as well as news are extracted with the Google External API and processed.
3.4.1. Processes with the Review Data
While recommending a tourist place, the opinion of previous visitors takes a vital role as the visitors give their opinion on the previously visited places. This will be helpful while planning for a travel to historical sites. Here, the review content set is extracted, which is expressed as,
Where, illustrates the extracted review.
- (i)
- Keyword Extraction
Only the keywords are extracted to recommend the opinion on the visited cultural sites since the reviews have large text contents. Here, the keywords are extracted with the unsupervised Rapid Automatic Keyword Extraction (RAKE) algorithm. To determine the most relevant words or phrases in a review text, the RAKE used a list of stop words and phrase delimiters.
- (a)
- Locating keywords
In RAKE, is split into arrays of words by the word delimiters. After that, the candidate keywords are located by removing the stop words like articles and prepositions. The words appearing between two stop-list words and punctuation marks are marked as candidate keywords. Thus, the identified keywords set are represented as,
Here, specifies the located candidate keyword in review .
- (b)
- Building score-weight matrix
After locating the keywords, the score value of the located keywords is determined and a score-weight matrix is constructed by calculating the word degree , word frequency , and ratio of the degree to frequency . Word frequency specifies the repeated occurrence of a term in the review content and implies the degree of co-occurrence of the words in the review content. Then, the ratio of degree to frequency is given as,
Where, implies the words that predominately occur in longer candidate keywords. Therefore, with these score values, the score weighted-matrix is formed.
- (c)
- Extracted keywords
From the matrix , RAKE looks for pairs of keywords that adjoin one another. After that, a new keyword is formed as the combination of such keywords with its interior stop words. By summing the member keyword scores present in the matrix , the score of the new combined candidate keyword is estimated. The scores of the new keywords are given as .
After the candidate keywords are scored, the top scored words are selected as the keyword of the review content and extracted. This is represented as,
Where, illustrates the extracted keyword. Then, for computational convenience, the extracted text is converted to embedding with BERT and is signified as .
3.4.2. Processing of News Data
After the review content is processed, the Google news data , which contains the news data about the historical sites, is processed to know its historical significance. This process is executed to avoid suggesting the tourist spot only grounded on the reviews as the reviews cannot be trusted always. The extracted news set is expressed as,
Where, news data is notated as .
- (a)
- Determining score value
After the news data are extracted, the news data’s frequency is determined and the score value for the news feed corresponding to the historical site is estimated. By doing this, if the historic site appears frequently in the news but has no satisfactory reviews, it can be recommended as a better tourist spot. Here, the score value is determined with the Term-Frequency Inverse Document Frequency (TF-IDF).
Step-1: Term frequency estimation
The TF-IDF determines the weight value for the historical site-centric words and determines the frequency of such words in the extracted news data. The term frequency of each word is determined utilizing,
Where, illustrates the frequency of historical site terms in news.
Step-2: Determine inverse document frequency
After the term frequency is determined, the Inverse Document Frequency (IDF) is estimated for estimating the in the overall news content. The IDF is expressed as,
Where, specifies the total number of news, implies the total number of news contains the term .
Step-3: Calculate the product
After that, the TF-IDF score is estimated centered on the product of term frequency and IDF as,
Hence, the determined score values of the historical sites are represented as,
Where, signifies the score value estimated for the historical site. From the score values estimated, the higher score values are regarded as the often repeated term and the historical site that has a higher score can be recommended to tourist planners for CT.
3.5. Data Fusion
After all the data are processed, the data are fused for training and testing the recommendation model. Here, the fused data are given as,
Where, signifies the fused data, which comprises the details of features of location, time and name of the festival, and score value as well as keywords of the respective Riyadh historical sites.
3.6. Recommendation
Lastly, the fused data is given to the MQ-LSTM to give recommendations grounded on the user's location and preference. Here, the LSTM is selected owing to its effectiveness in providing context recommendations. However, LSTM has the disadvantage of having a vanishing gradient problem without the proper activation of neurons. Thus, to solve this problem, the Multi-Quadratic (MQ) activation is applied in the LSTM model. Figure 3 elucidates the MQ-LSTM’s architecture,
Input: The MQ-LSTM receives along with spontaneously generated two vectors within the MQ-LSTM (i.e. hidden state and the cell state ), which is taken as the input at the time instant . Given the three input vectors , the MQ-LSTM regulates these vectors through the gates like the input gate , forgot gate , and output gate . The input gate, an output gate, and a forget gate control the state of memory cells. The MQ-LSTM process is mathematically represented as,
Where, illustrate the weight values of the input, forgot, and output gates, correspondingly, specifies the previous hidden state instant, indicates the bias value, and signifies the MQ activation, which is equated as,
Where, are random variables, which are changed to form multi-quadratic activation functions. are chained together to form an MQ-LSTM cell, where each cell in MQ-LSTM acts as the memory module. The information from the previous memory module is passed to the next cell to predict the final contextual output.
Output: Lastly, the MQ-LSTM output is determined from the hidden state as,
Where, epitomizes the final output, which is the hidden state of the final cell. This final value represents the final recommended contextual information of the CT spot. By doing this contextual information, the tourism planners can be well aware of the tourist spot and its nearby possible cultural events. Therefore, during peak visitor time, a tourist does not have to wait for a long time to visit a historical site.
| Pseudocode of proposed MQ-LSTM |
| Input: Fused data |
| Output: contextual recommendation |
| Begin |
| Initialize states , gates , time instance |
| Set initial |
| For time instant do |
| Determine gates outputs |
| Perform MQ activation |
| Update cell state with |
| Estimate output gate value |
| End For |
| Return output |
| End |
For the use of CT planners, this tourism recommendation along with the spatial map developed with ArcGIS is stored in a database.
3.7. Database Security
Since the recommendation model comprises more information about cultural events details, the database can't be accessed by legal users only. There are a lot of chances for the information to be corrupted by malicious users (hackers), who might change the data stored in the database. Hence, to avoid this problem, the user is authenticated for utilizing the data stored in the database.
3.7.1. Registration
A legitimate user registers their details, such as name , current location , date , preference , and type of trip package . This is mathematically represented as,
3.7.2. Hashcode Generation
During the registration process, a hash code is formed grounded on the registered time and name of the user . Here, with the LSH, the hashcode is generated. The LSH algorithm is designed to generate hash digests for the message , such that low distances betwixt the digests indicates that the corresponding messages are likely to be similar.
Primarily, the messages are processed by utilizing a sliding window of length and populates a hash bucket . After that, the messages are passed through the hash function of SHA-256 to obtain the hash value. This hash value is stored in the bucket .
After that, by estimating the quartile points from the bucket , the bucket is sorted. Then, the hashcode digest header is computed. The first three bytes of the SHA-256 hash are reserved for the digest header. The header of the digest contains the following parts.
The first byte contains the checksum of the string byte with the modulo function.
The second byte is computed from the logarithm of the string length , which can be represented as,
The third byte is the result obtained grounded on the second-byte ratio and first-byte ratio as,
Where,
After the header is obtained, the digest body is constructed from the bucket array. In this, by reversing the order in the bucket, the bucket is read. Here, the last element of the string is read first and the first element is read last. Lastly, the reversed elements are converted to hex form and are appended into the SHA-generated hashcode. Therefore, the generated hashcode at the user and the administer side is illustrated as .
Hashcode matching: The matching process takes place during the login after the hashcode is generated on the administrator and user side. During the login phase, the hashcode generated during the registration time is utilized. If the provided by the user side and the administrator side during the login phase are the same, then the user is considered as a legitimate user and is eligible to access the data stored in the database. However, when a malicious user tries to get the data using of a legitimate user and at a different time, a more similar hash digest will be produced but not the same hash value. Therefore, such requests will be declined in the proposed model.
Hence, it is analyzed that with the proposed CT accelerator model, the improvement in tourism can be achieved by the increased security and attractiveness of the recommendation model.
4. Results and Discussion
Here, the detailed exploration of the final outcome of the proposed tourism RS is explained. The proposed methodology is employed in the working platform of PYTHON utilizing the data collected from publically available sources.
4.1. Performance Analysis of the Recommendation System
This phase analyses the proposed MQ-LSTM’s efficacy by comparing its outcomes with the existing techniques like LSTM, Recurrent Neural Network (RNN), Deep Neural Network (DNN), and Artificial Neural Network (ANN).
The recommendation output of the proposed MQ-LSTM centered on a long tail plot is illustrated in Figure 4. This plot explores the popular trends in user-item interaction data grounded on the IDF score values of the historical sites. The head refers to the portion of historical sites that often have a high volume of recommendations. Even though the long tail contains the majority of items, recommendations for those items only account for a small portion of all recommendations. Therefore, the proposed model exhibited accurate recommendations along with user satisfaction and convenience.
Figure 5 elucidates the performance of the proposed MQ-LSTM grounded on the Recommendation Rate (RR), precision, F-measure, specificity, and recall. The proposed model attains an RR of 97.22%, whereas the existing models attain a lower RR of 96.32% for LSTM, 94.3% for RNN, 91.25% for DNN, and 90.6% for ANN. Likewise, the proposed model has obtained higher precision, F-measure, specificity, and recall values of 97.7%, 97.98%, 94.94%, and 98.27%, correspondingly. Thus, the proposed MQ-LSTM has better performance owing to the effective usage of location information, user reviews, and IDF scores; therefore, it has enhanced the historical site recommendations in Riyadh city.
Table 1 demonstrates the proposed MQ-LSTM’s performance grounded on the Misclassification Rate (MR), Negative Predictive Value (NPV), and Mathews Correlation Coefficient (MCC). The NPV and MCC of the proposed method exhibit an increase of 1.2% and 1.01%, correspondingly when analogized with the existing LSTM. Likewise, the NPV and MCC values of other existing methods also provide lower performance. In analyzing Table 1, the proposed method has achieved a lower MR of 2.78%. Overall, the usage of Multi-Quadratic activation in the LSTM recommender has shown superior recommendation output.
Figure 6 depicts the False Negative Rate (FNR), Mean Absolute Error (MAE), and False Discovery Rate (FDR) of the proposed and existing recommendation models. These measures indicate the negative recommendations made by the model and should be lower to prove the better performance of the model. Accordingly, the proposed MQ-LSTM achieves the least values of 0.023 of FDR, 0.0521 of MAE, and 0.0173 of FNR. Hence, it is revealed that the MQ activation is more reliable and superior to the existing recommendation approaches.
Table 2 displays the time taken for training by the proposed MQ-LSTM and existing methods. The proposed has exhibited a decrease in training time of 8482ms than the existing LSTM, 22538ms than RNN, 33638ms than DNN, and 45044ms than ANN. This shows that the recommendations made by the proposed technique are more accurate than the conventional frameworks.
Figure 7 exhibits the proposed MQ-LSTM and the existing model’s ROC curve. An effectual technique of assessing the recommendation model’s quality or performance is named ROC. By plotting True Positive Rate (TPR) against False Positive Rate (FPR), it is constructed. It is clear from the ROC curve that superior performance was exhibited by the proposed model in recommending the historical sites in Riyadh to the existing recommendation models.
4.2. Performance Analysis of Spectral Grouping
Here, the proposed KIC’s performance is analogized with other conventional methodologies like Chameleon clustering, Robust Clustering using Links (ROCK), Balanced Iterative Reducing and Clustering using Hierarchies (BIRCH), and Clustering Using Representatives (CURE).
Table 3 illustrates the time consumed for grouping by the proposed KIC and the existing models. For proving the spectral grouping’s efficacy, the time taken for grouping must be low. The proposed mechanism consumed 36017ms to group the locations of the sites. However, the existing models required higher grouping time than the time consumed by the proposed model. The inclusion of Kriging Interpolation in the existing Chameleon technique has improved the grouping process to a greater extent.
4.3. Comparative Measurement with Literature Papers
Here, the proposed methodology’s performance is contrasted with conventional recommendation approaches discussed in the literature survey.
Figure 8 depicts the performance of the proposed MQ-LSTM-based RS with existing systems developed by (Wang, 2022), (Cao et al., 2023), and (Perles-Ribes et al., 2020). From the analysis, it is clear that by obtaining a high RR of 97.22%, the proposed model exhibits superior performance. The recommendations by the prevailing approaches were comparatively lower than the proposed model. Therefore, the comparison reveals that considering the IDF score values, Google reviews and spectral grouping had improved the proposed RS for the tourism system for Riyadh's historical sites.
5. Conclusions
A CT accelerator based on MQ-LSTM with database security is proposed in this paper. The proposed work undergoes various steps like spectral grouping, attribute extraction, tree construction, word embedding, keyword extraction, score value estimation, and finally, a recommendation grounded on the collected details. After that, for evaluating the proposed mechanism’s performance, the performance, as well as the comparative analysis, are executed. The developed framework could handle various uncertainties and render more promising results. From the analysis, the proposed recommendation model achieved an RR of 97.22%, precision of 97.7%, recall of 98.27%, and MAE of 0.0521. Overall, it is concluded that the proposed system has outperformed comparable systems in terms of all metrics. Owing to the slack of data, this work only concentrates on the historical sites in Riyadh. Thus, the work will be extended in the future by collecting details regarding all the tourist spots in Riyadh and providing a tourism database model.
Acknowledgments
In The authors extend their appreciation to the Deputyship for Research and Innovation, Ministry of Education in Saudi Arabia for funding this research work through the project number ISP22-41.
Conflicts of Interest
Declare No potential conflict of interest was reported by the authors.
References
- Alghamdi, N.; Alageeli, N.; Sharkh, D.A.; Alqahtani, M.; Al-Razgan, M. An eye on riyadh tourist season: Using geo-tagged snapchat posts to analyse tourists impression. In Proceedings of the 2020 2nd International Conference on Computer and Information Sciences, Sakaka, Saudi Arabia, 13–15 October 2020. [Google Scholar] [CrossRef]
- Amato, F.; Moscato, F.; Moscato, V.; Pascale, F.; Picariello, A. An agent-based approach for recommending cultural tours. Pattern Recognition Letters 2020, 131, 341–347. [Google Scholar] [CrossRef]
- Andria, J.; di Tollo, G.; Pesenti, R. A heuristic fuzzy algorithm for assessing and managing tourism sustainability. Soft Computing 2019, 24, 4027–4040. [Google Scholar] [CrossRef]
- Cao, Z.; Xu, H.; Teo BS, X. Sentiment of chinese tourists towards malaysia cultural heritage based on online travel reviews. Sustainability 2023, 15, 1–17. [Google Scholar] [CrossRef]
- Dar, S.N.; Shah, S.A.; Wani, M.A. Geospatial tourist information system for promoting tourism in trans-himalayas: A study of leh Ladakh India. GeoJournal 2022, 87, 3249–3263. [Google Scholar] [CrossRef]
- He, S. Research on tourism route recommendation strategy based on convolutional neural network and collaborative filtering algorithm. Security and Communication Networks 2022, 2022, 1–9. [Google Scholar] [CrossRef]
- Konstantakis, M.; Christodoulou, Y.; Aliprantis, J.; Caridakis, G. ACUX recommender: A mobile recommendation system for multi-profile cultural visitors based on visiting preferences classification. Big Data and Cognitive Computing 2022, 6, 1–11. [Google Scholar] [CrossRef]
- Li, H.; Qiao, M.; Peng, S. Research on the recommendation algorithm of rural tourism routes based on the fusion model of multiple data sources. Discrete Dynamics in Nature and Society 2022, 2022, 1–10. [Google Scholar] [CrossRef]
- Nowacki, M. Heritage interpretation and sustainable development: A systematic literature review. Sustainability 2021, 13, 1–16. [Google Scholar] [CrossRef]
- Perles-Ribes, J.F.; Ramon-Rodriguez, A.B.; Moreno-Izquierdo, L.; Such-Devesa, M.J. Machine learning techniques as a tool for predicting overtourism: The case of Spain. International Journal of Tourism Research 2020, 22, 825–838. [Google Scholar] [CrossRef]
- Rehman Khan, H.U.; Kim Lim, C.; Ahmed, M.F.; Tan, K.L.; Mokhtar, M. Bin. Systematic review of contextual suggestion and recommendation systems for sustainable e-tourism. Sustainability 2021, 13, 1–27. [Google Scholar] [CrossRef]
- Saha, A.; Pal, S.C.; Santosh, M.; Janizadeh, S.; Chowdhuri, I.; Norouzi, A.; Roy, P.; Chakrabortty, R. Modelling multi-hazard threats to cultural heritage sites and environmental sustainability: The present and future scenarios. Journal of Cleaner Production 2021, 320, 128713. [Google Scholar] [CrossRef]
- Sarkar, J.L.; Majumder, A.; Panigrahi, C.R.; Roy, S. MULTITOUR: A multiple itinerary tourists recommendation engine. Electronic Commerce Research and Applications 2020, 40, 100943. [Google Scholar] [CrossRef]
- Stamatelatos, G.; Drosatos, G.; Gyftopoulos, S.; Briola, H.; Efraimidis, P.S. Point-of-interest lists and their potential in recommendation systems. In Information Technology and Tourism; Springer: Berlin Heidelberg, 2021; Volume 23, Issue 2. [Google Scholar] [CrossRef]
- Sung, P.L.; Hsiao, T.Y.; Huang, L.; Morrison, A.M. The influence of green trust on travel agency intentions to promote low-carbon tours for the purpose of sustainable development. Corporate Social Responsibility and Environmental Management 2021, 28, 1185–1199. [Google Scholar] [CrossRef]
- Wang, R. Spring festival holiday tourism data mining based on the deep learning model. Scientific Programming 2022, 2022, 1–13. [Google Scholar] [CrossRef]
- Weng, G.; Li, H.; Li, Y. The temporal and spatial distribution characteristics and influencing factors of tourist attractions in Chengdu-Chongqing economic circle. Environment Development and Sustainability 2022, 2022, 0123456789. [Google Scholar] [CrossRef]
- Wu, L.; Gu, T.; Chen, Z.; Zeng, P.; Liao, Z. Personalized day tour design for urban tourists with consideration to CO2 emissions. Chinese Journal of Population Resources and Environment 2022, 20, 237–244. [Google Scholar] [CrossRef]
- Yang, S. Analytic hierarchy process and its application in rural tourism service performance evaluation. Discrete Dynamics in Nature and Society 2022, 2022, 1–10. [Google Scholar] [CrossRef]
- Zhang, J.; Dong, L. Image monitoring and management of hot tourism destination based on data mining technology in big data environment. Microprocessors and Microsystems 2021, 80, 103515. [Google Scholar] [CrossRef]
Figure 1.
Architecture of the proposed model.
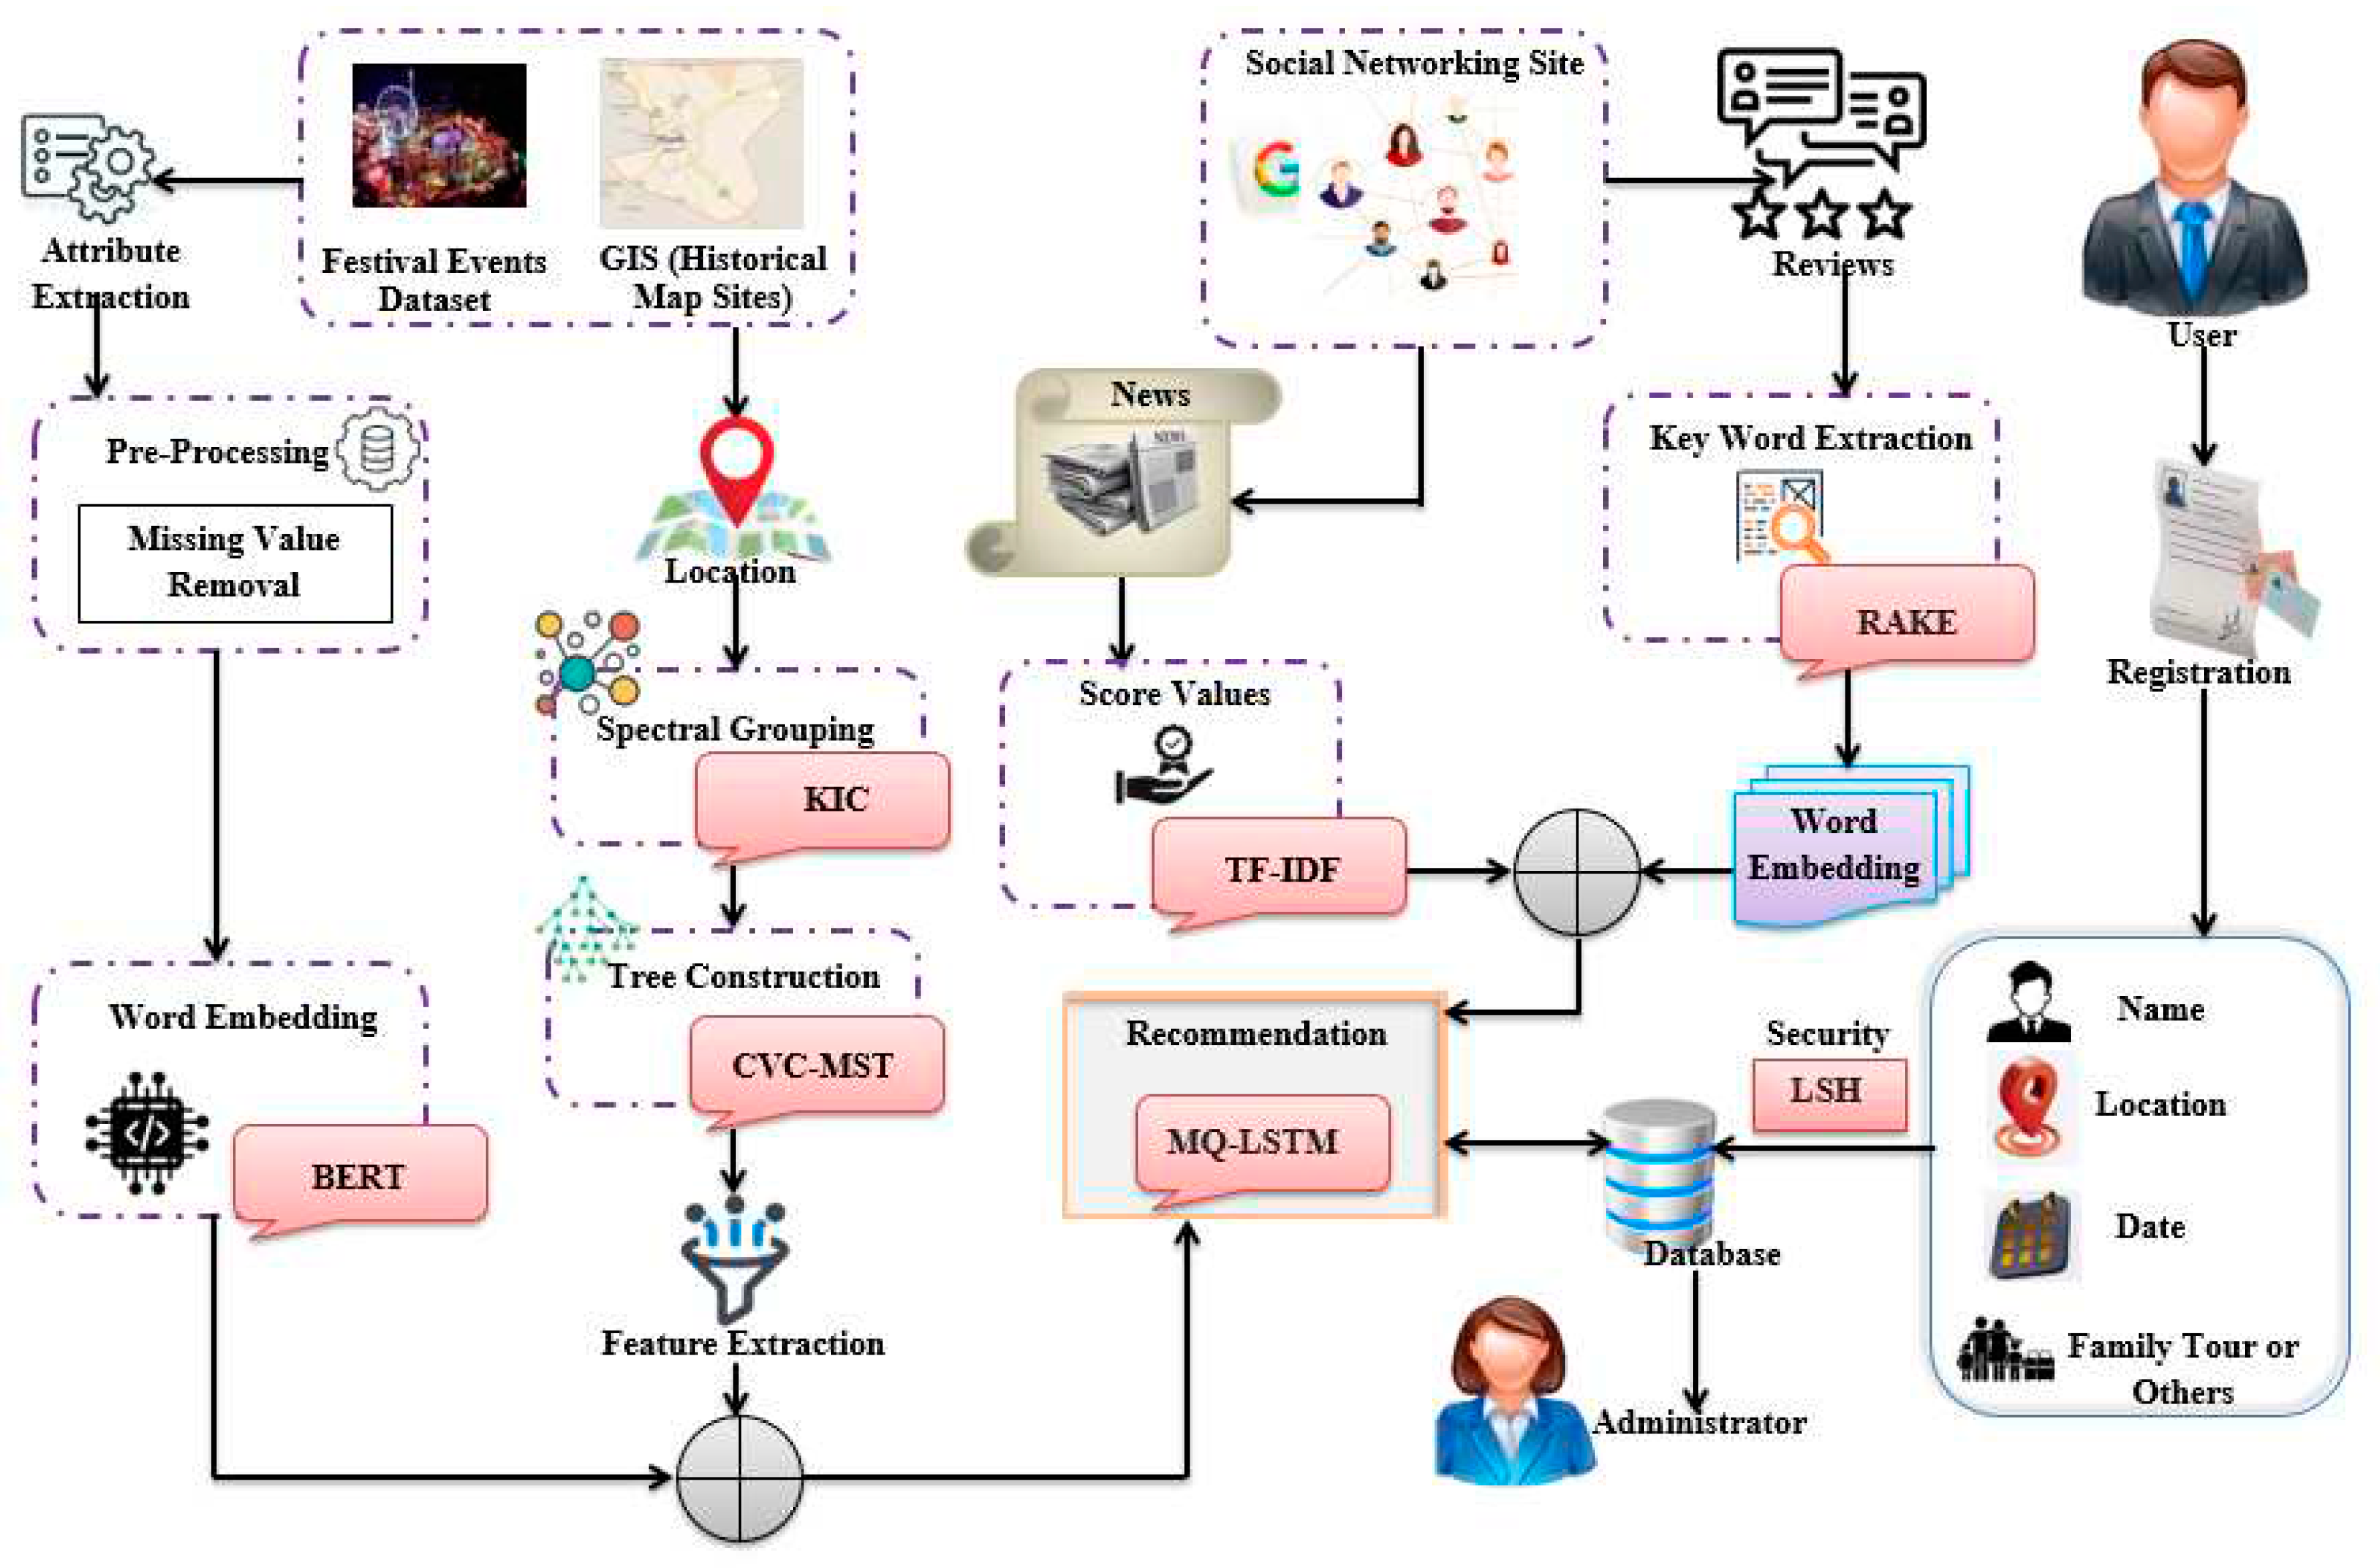
Figure 2.
Overview of KIC.
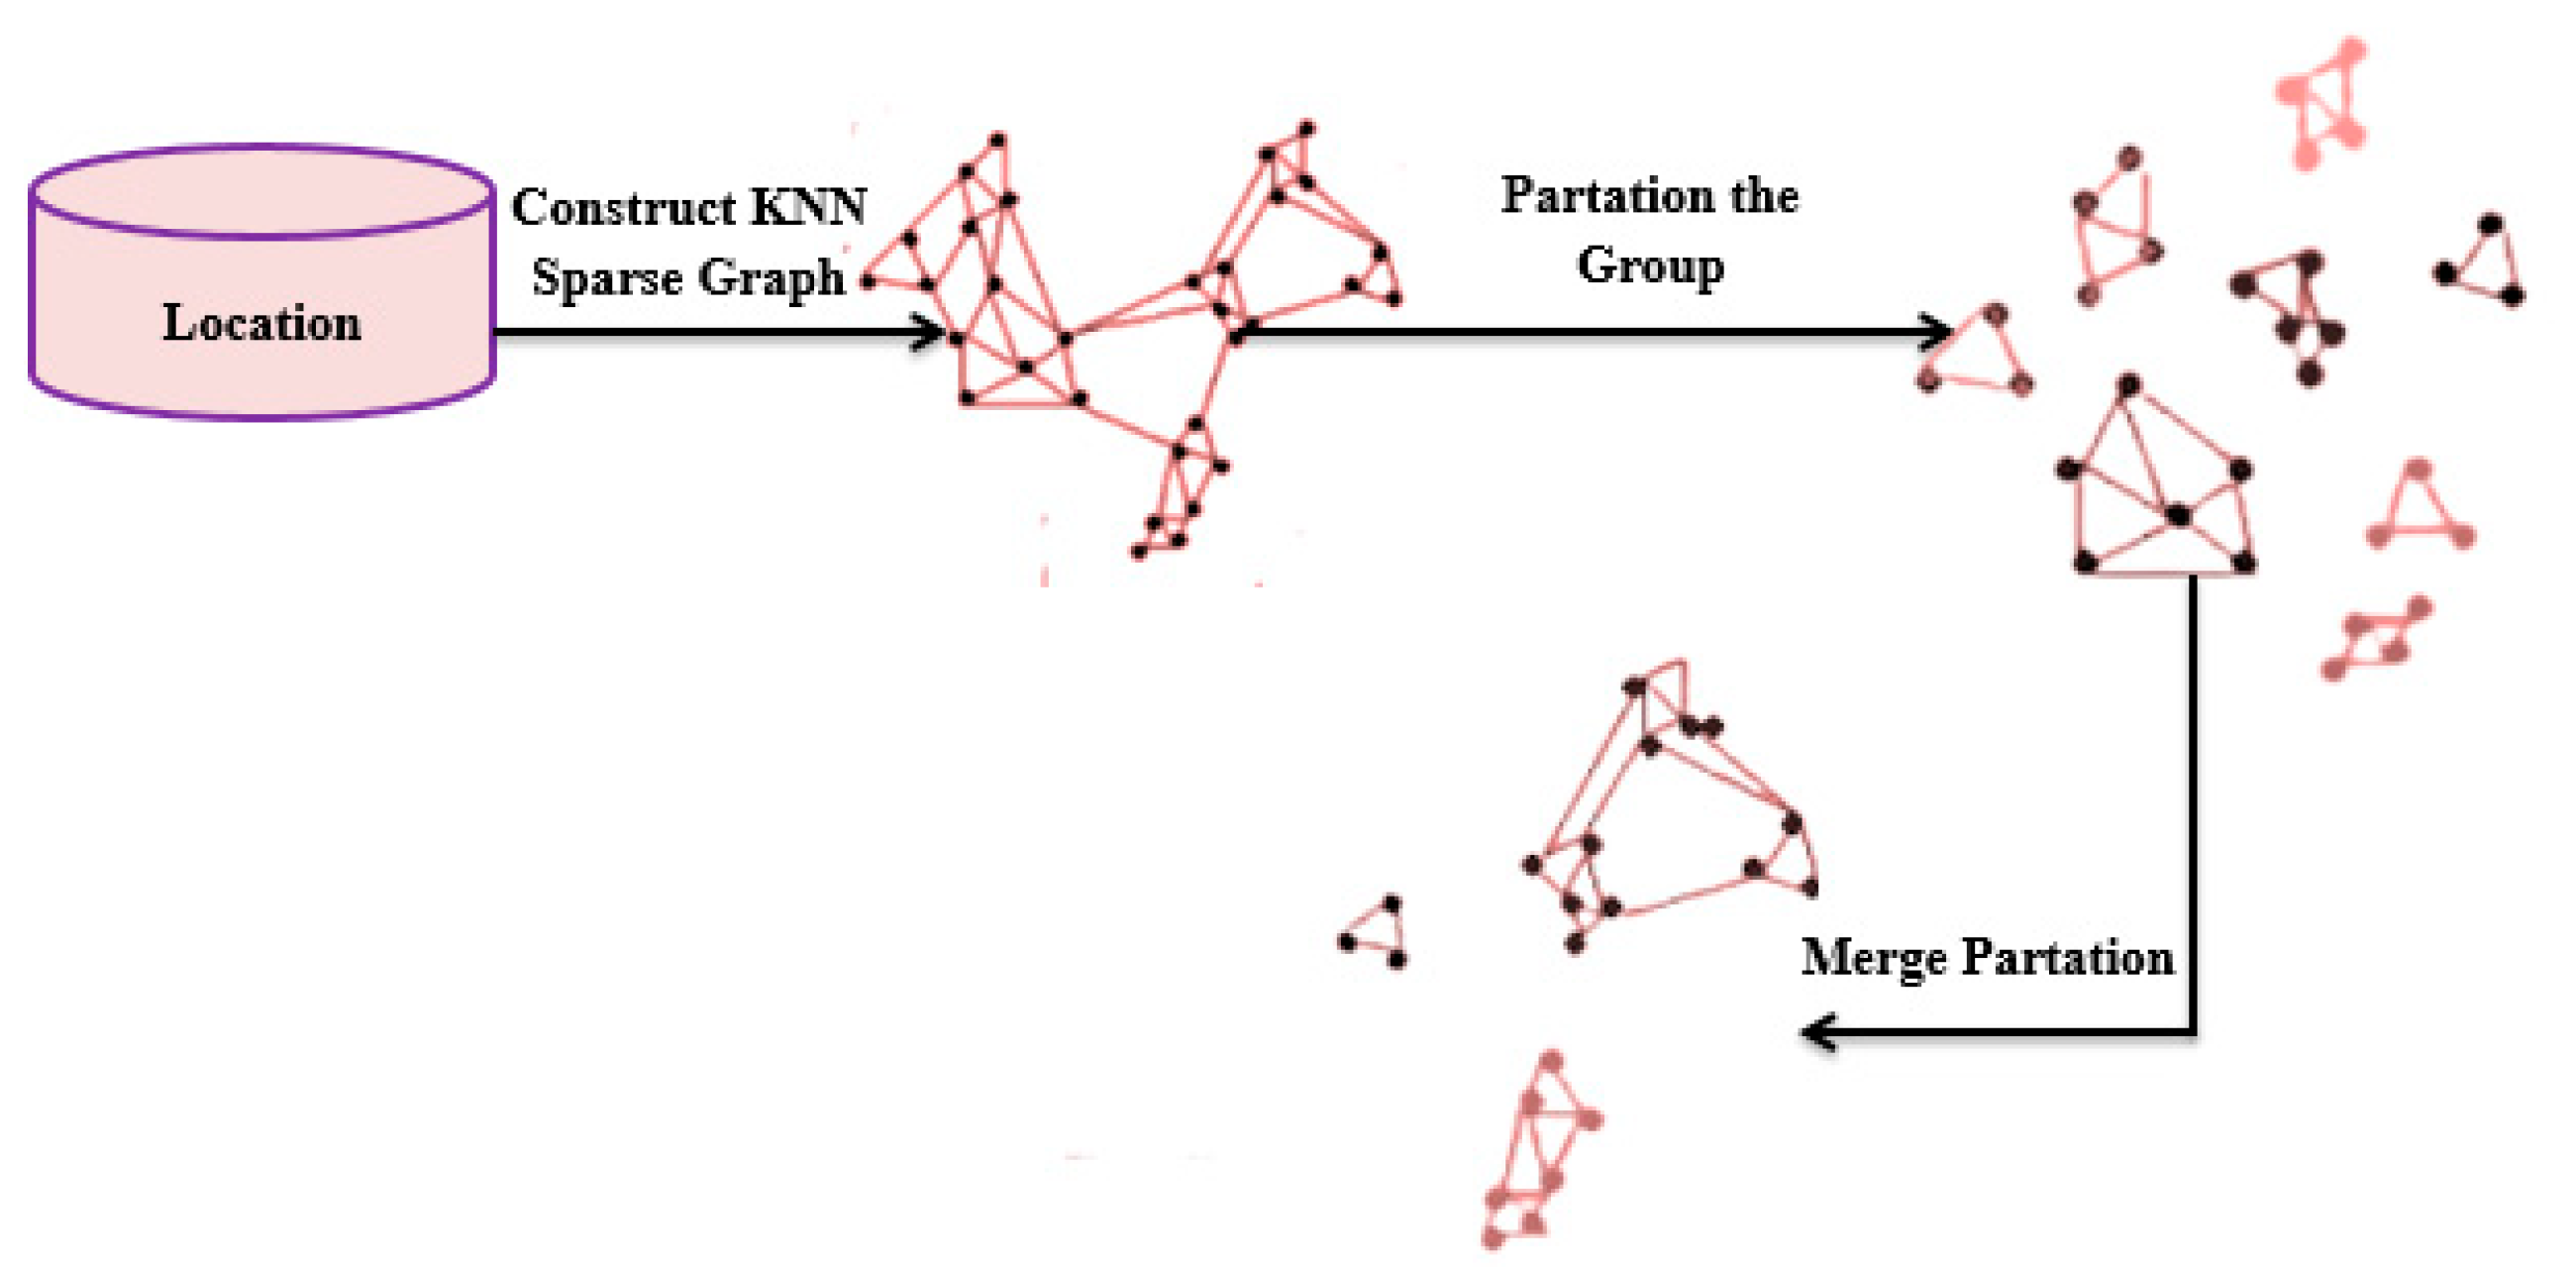
Figure 3.
Proposed MQ-LSTM architecture.
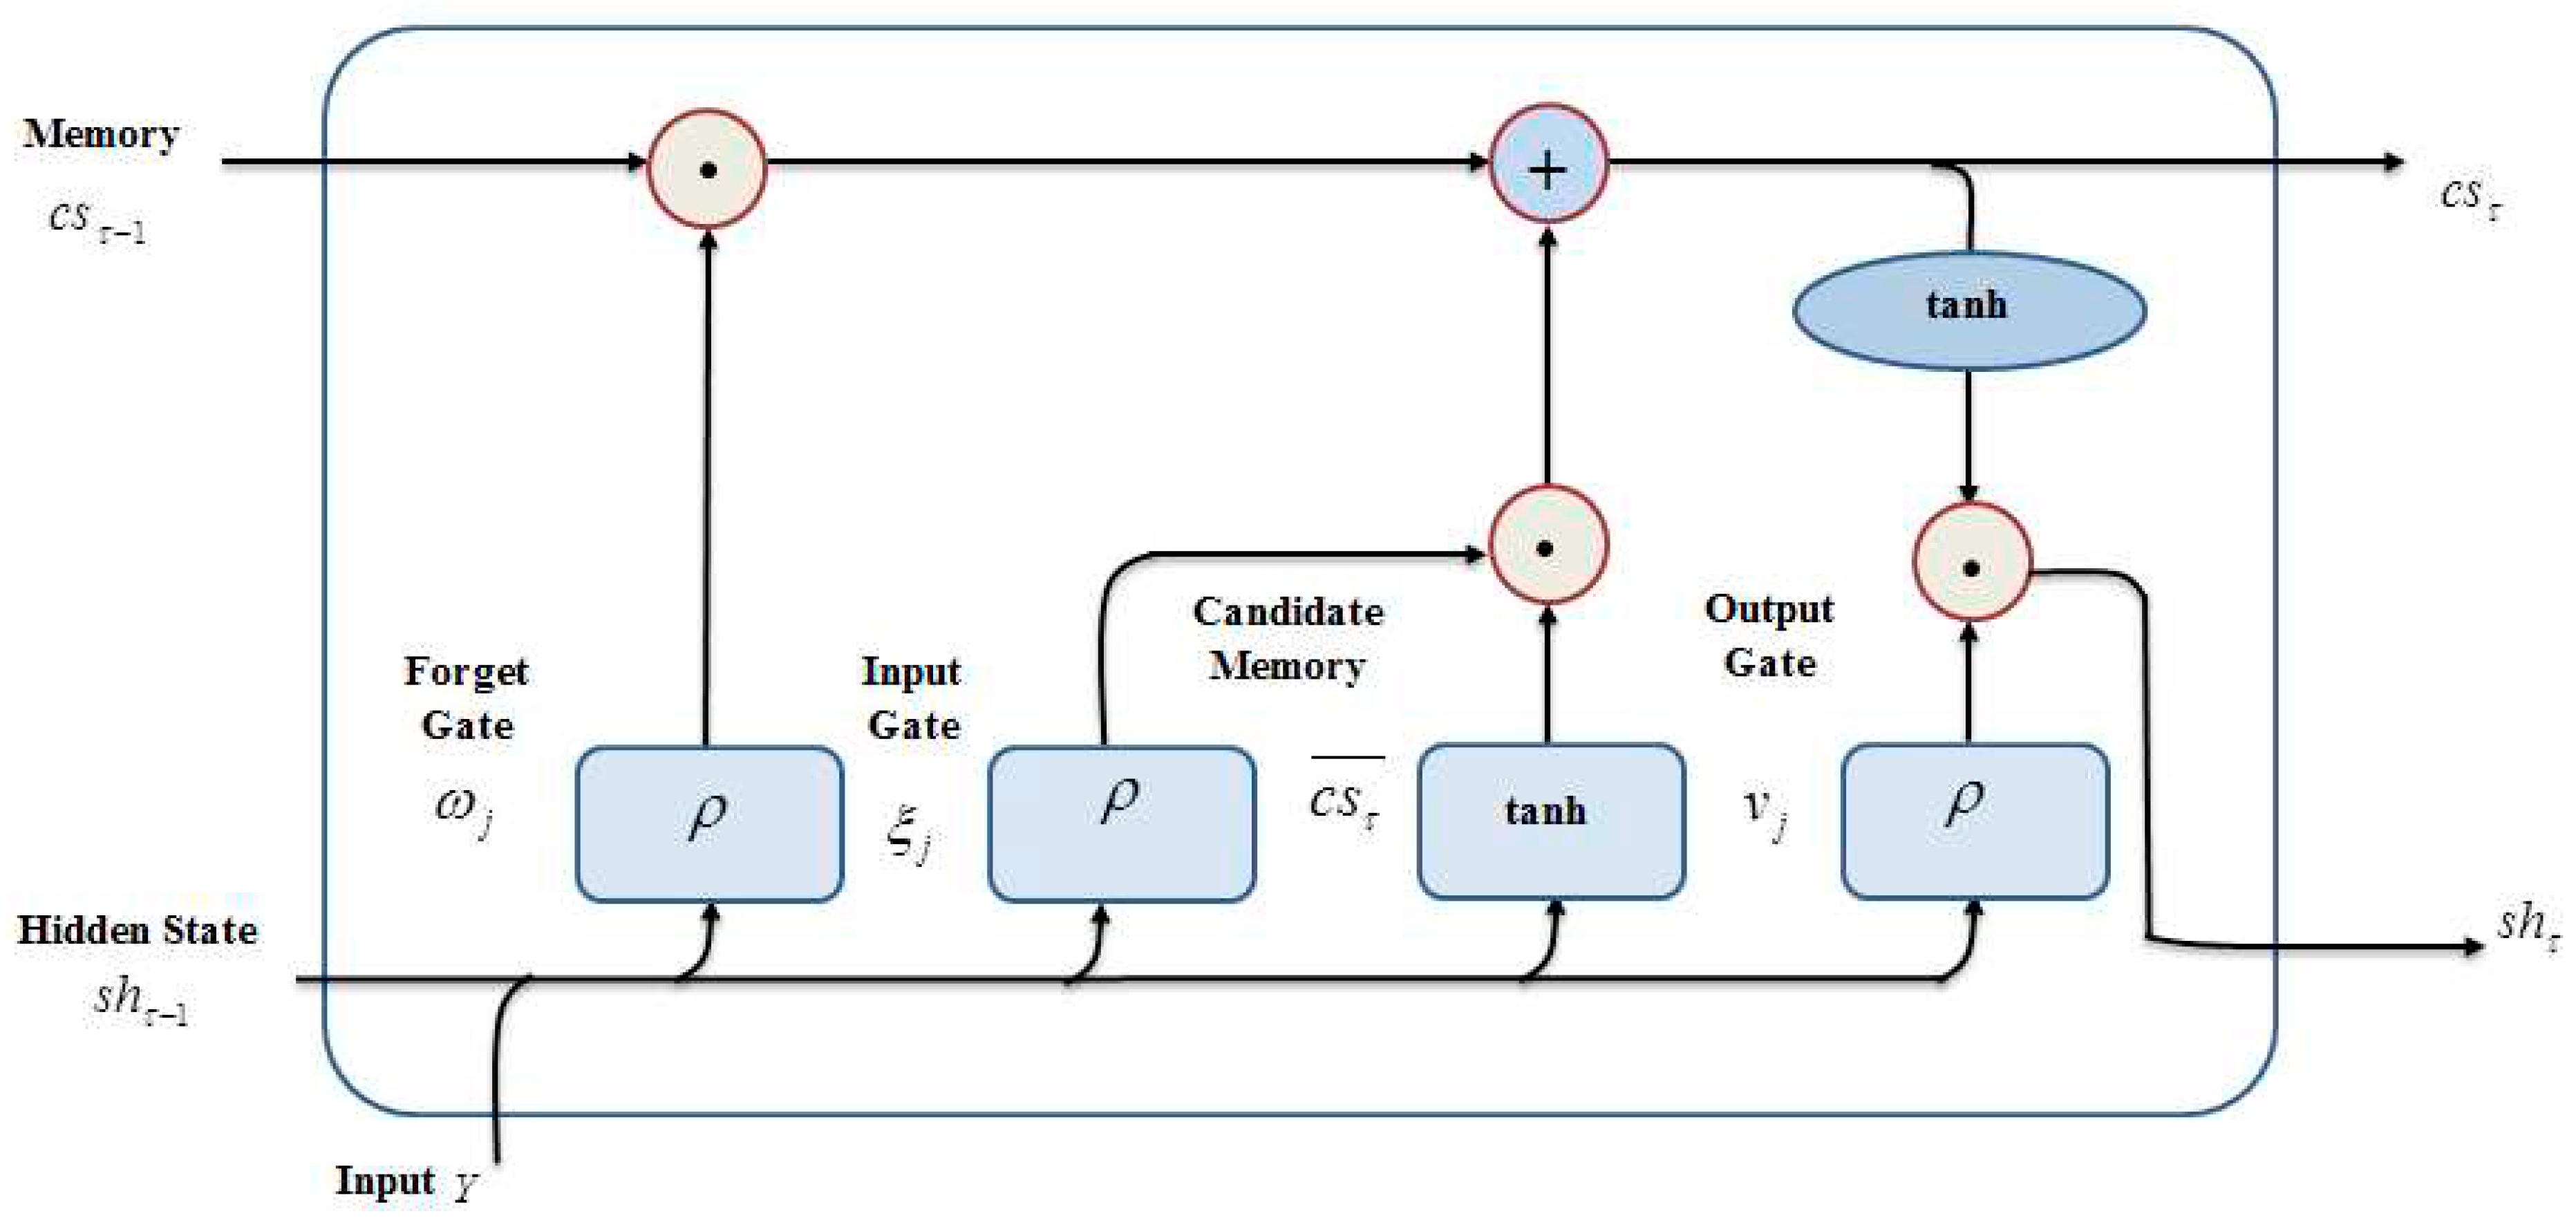
Figure 4.
Long Tail Plot Analysis.
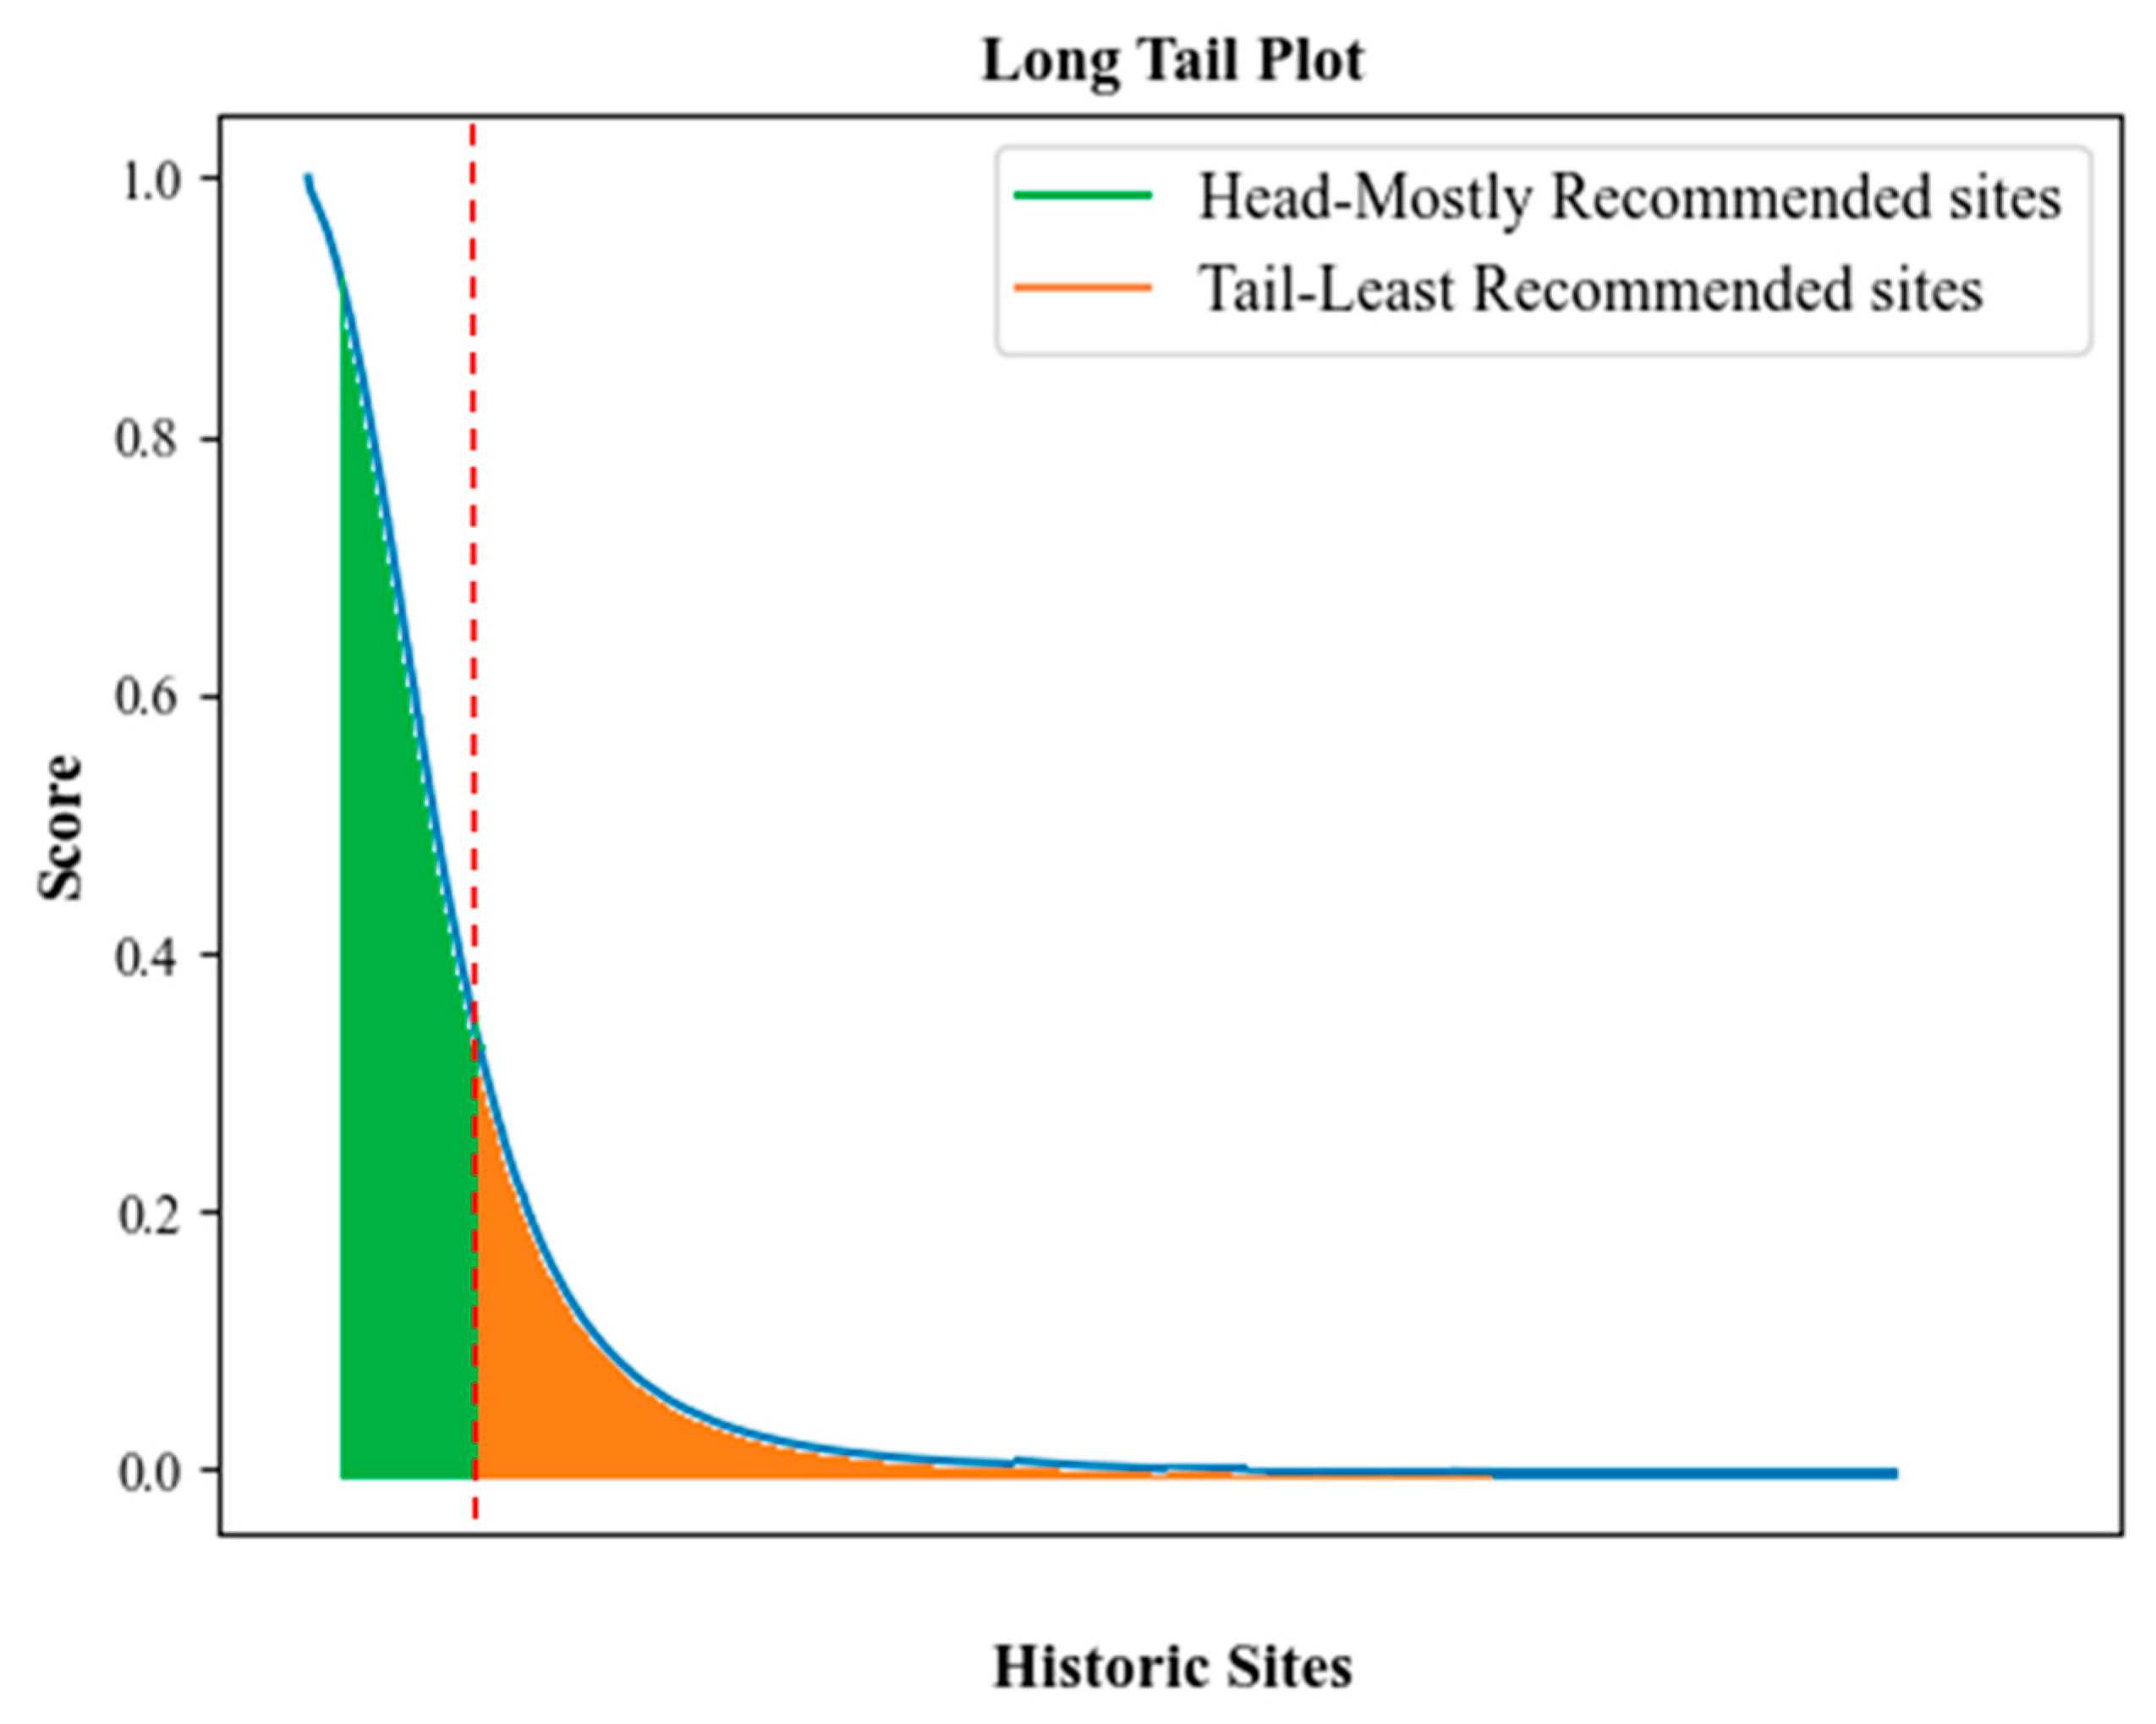
Figure 5.
Performance measure of proposed MQ-LSTM.
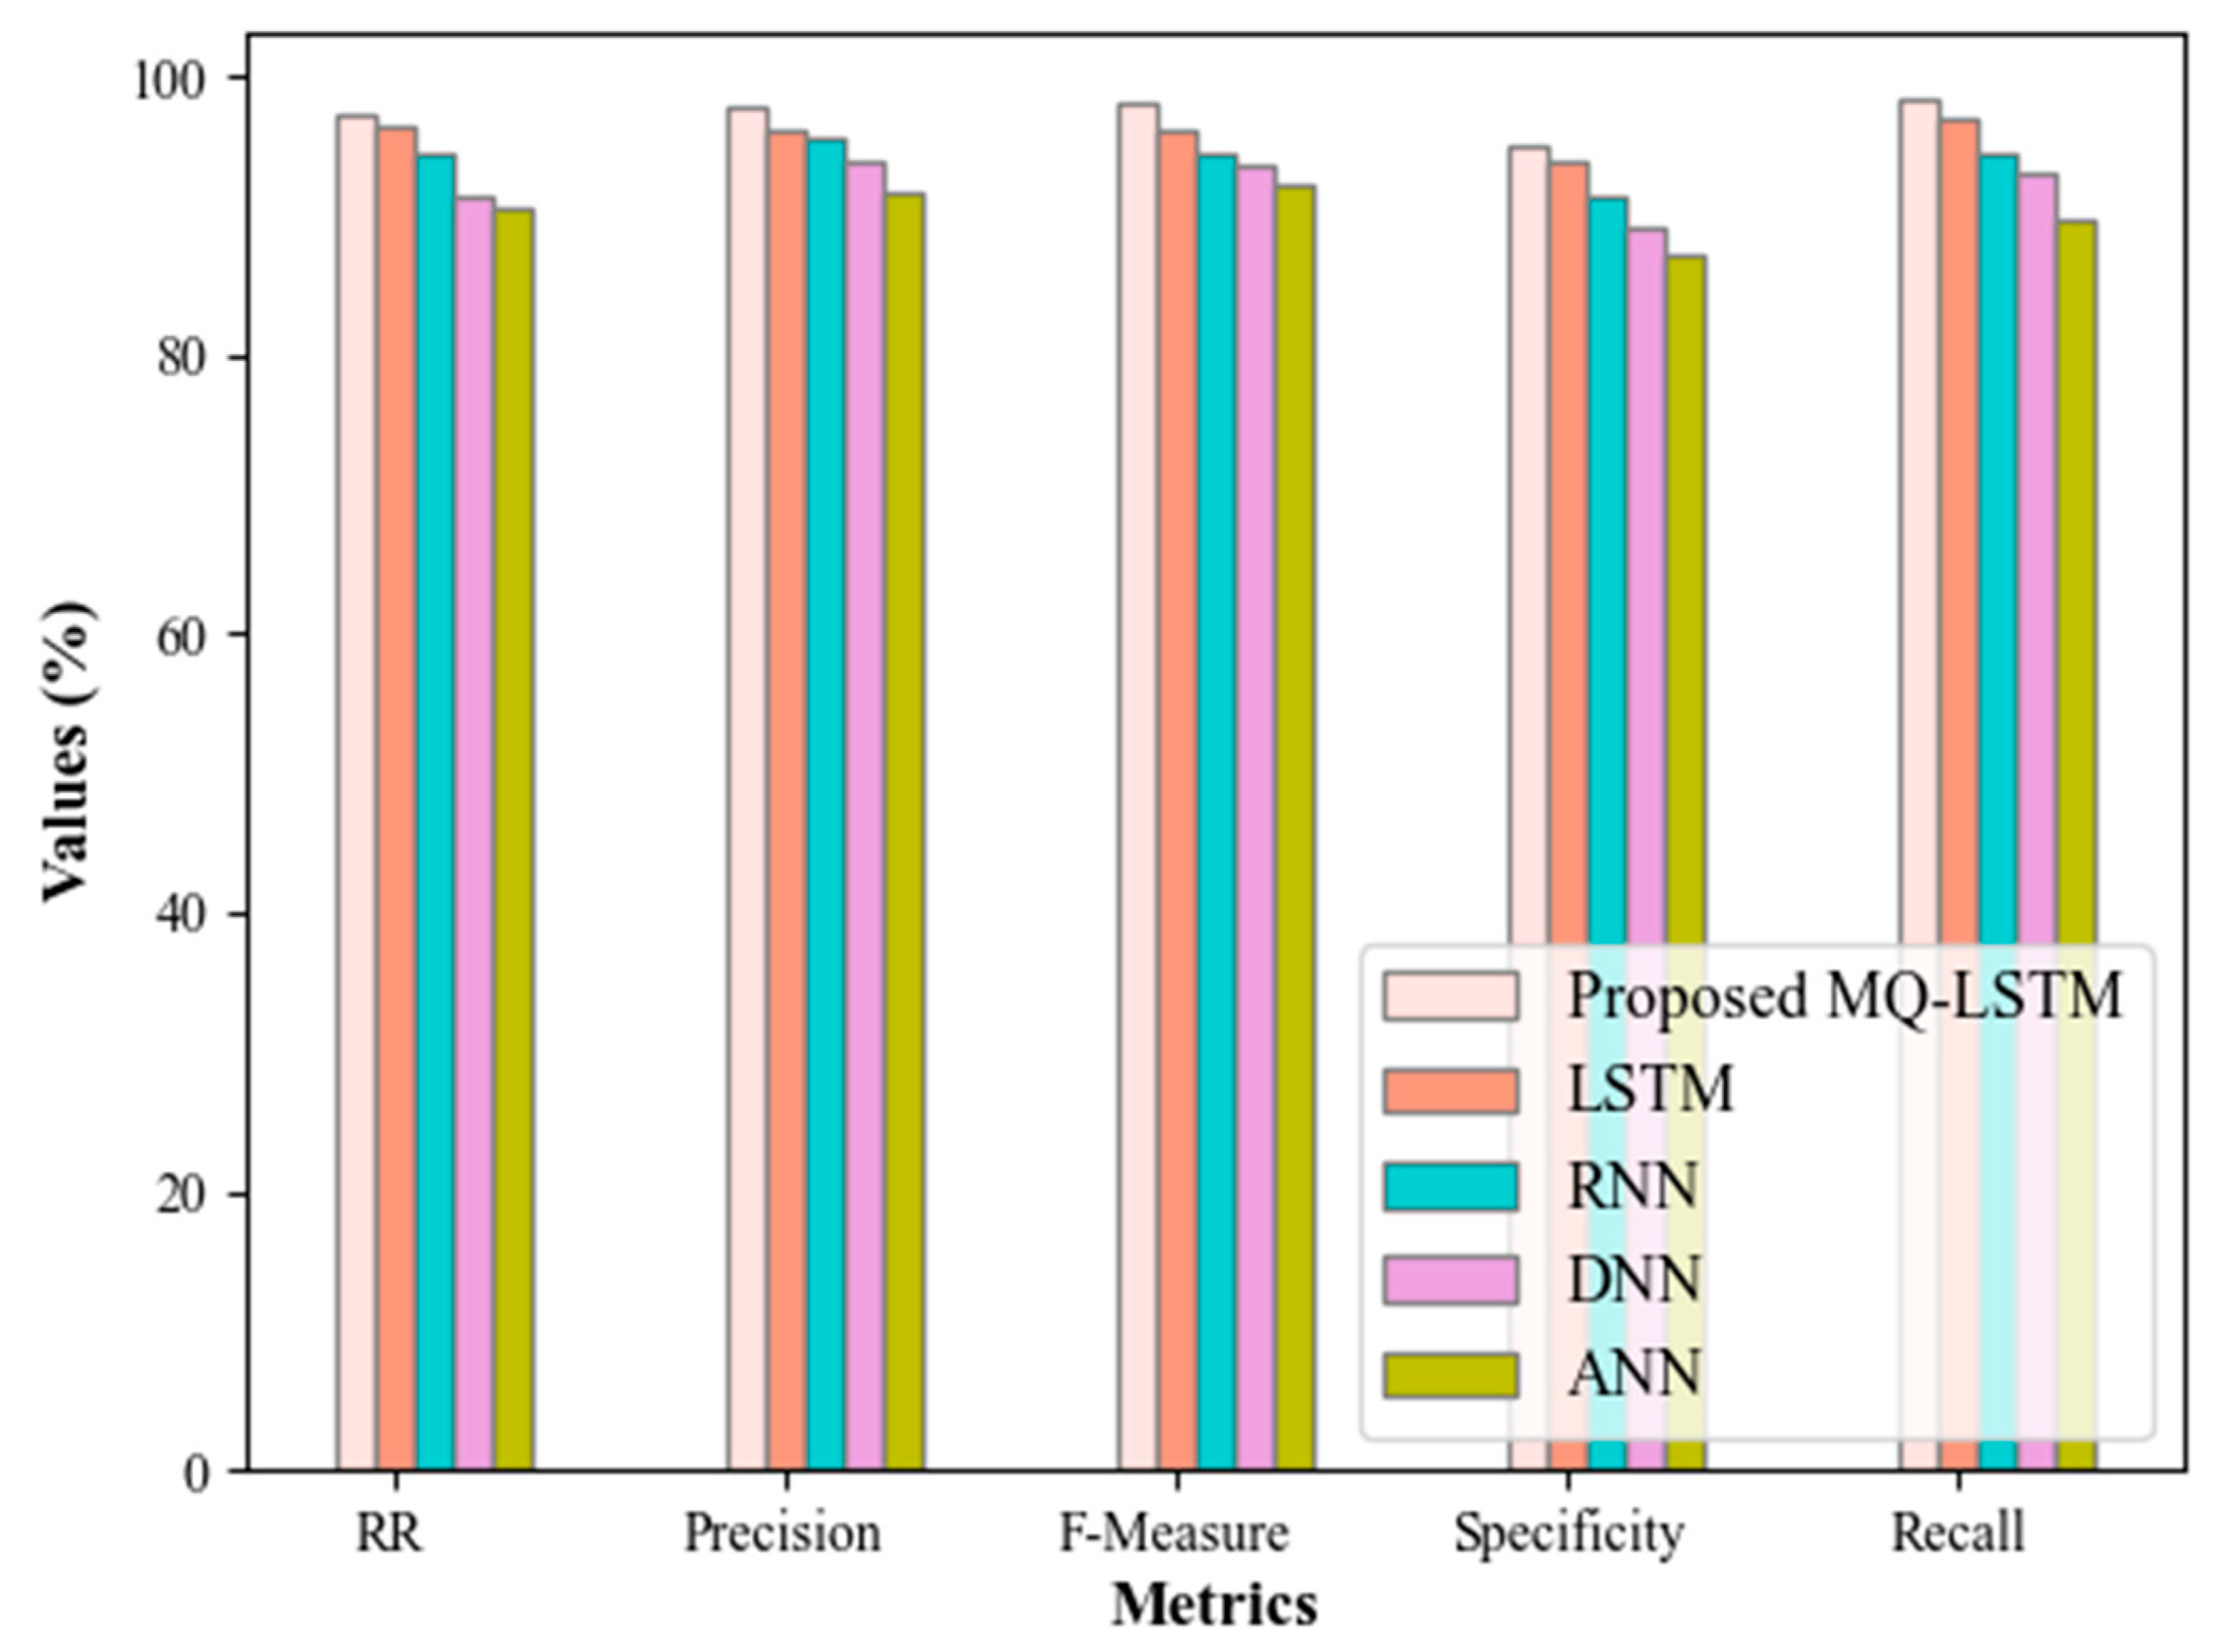
Figure 6.
Graphical representation of the proposed MQ-LSTM.
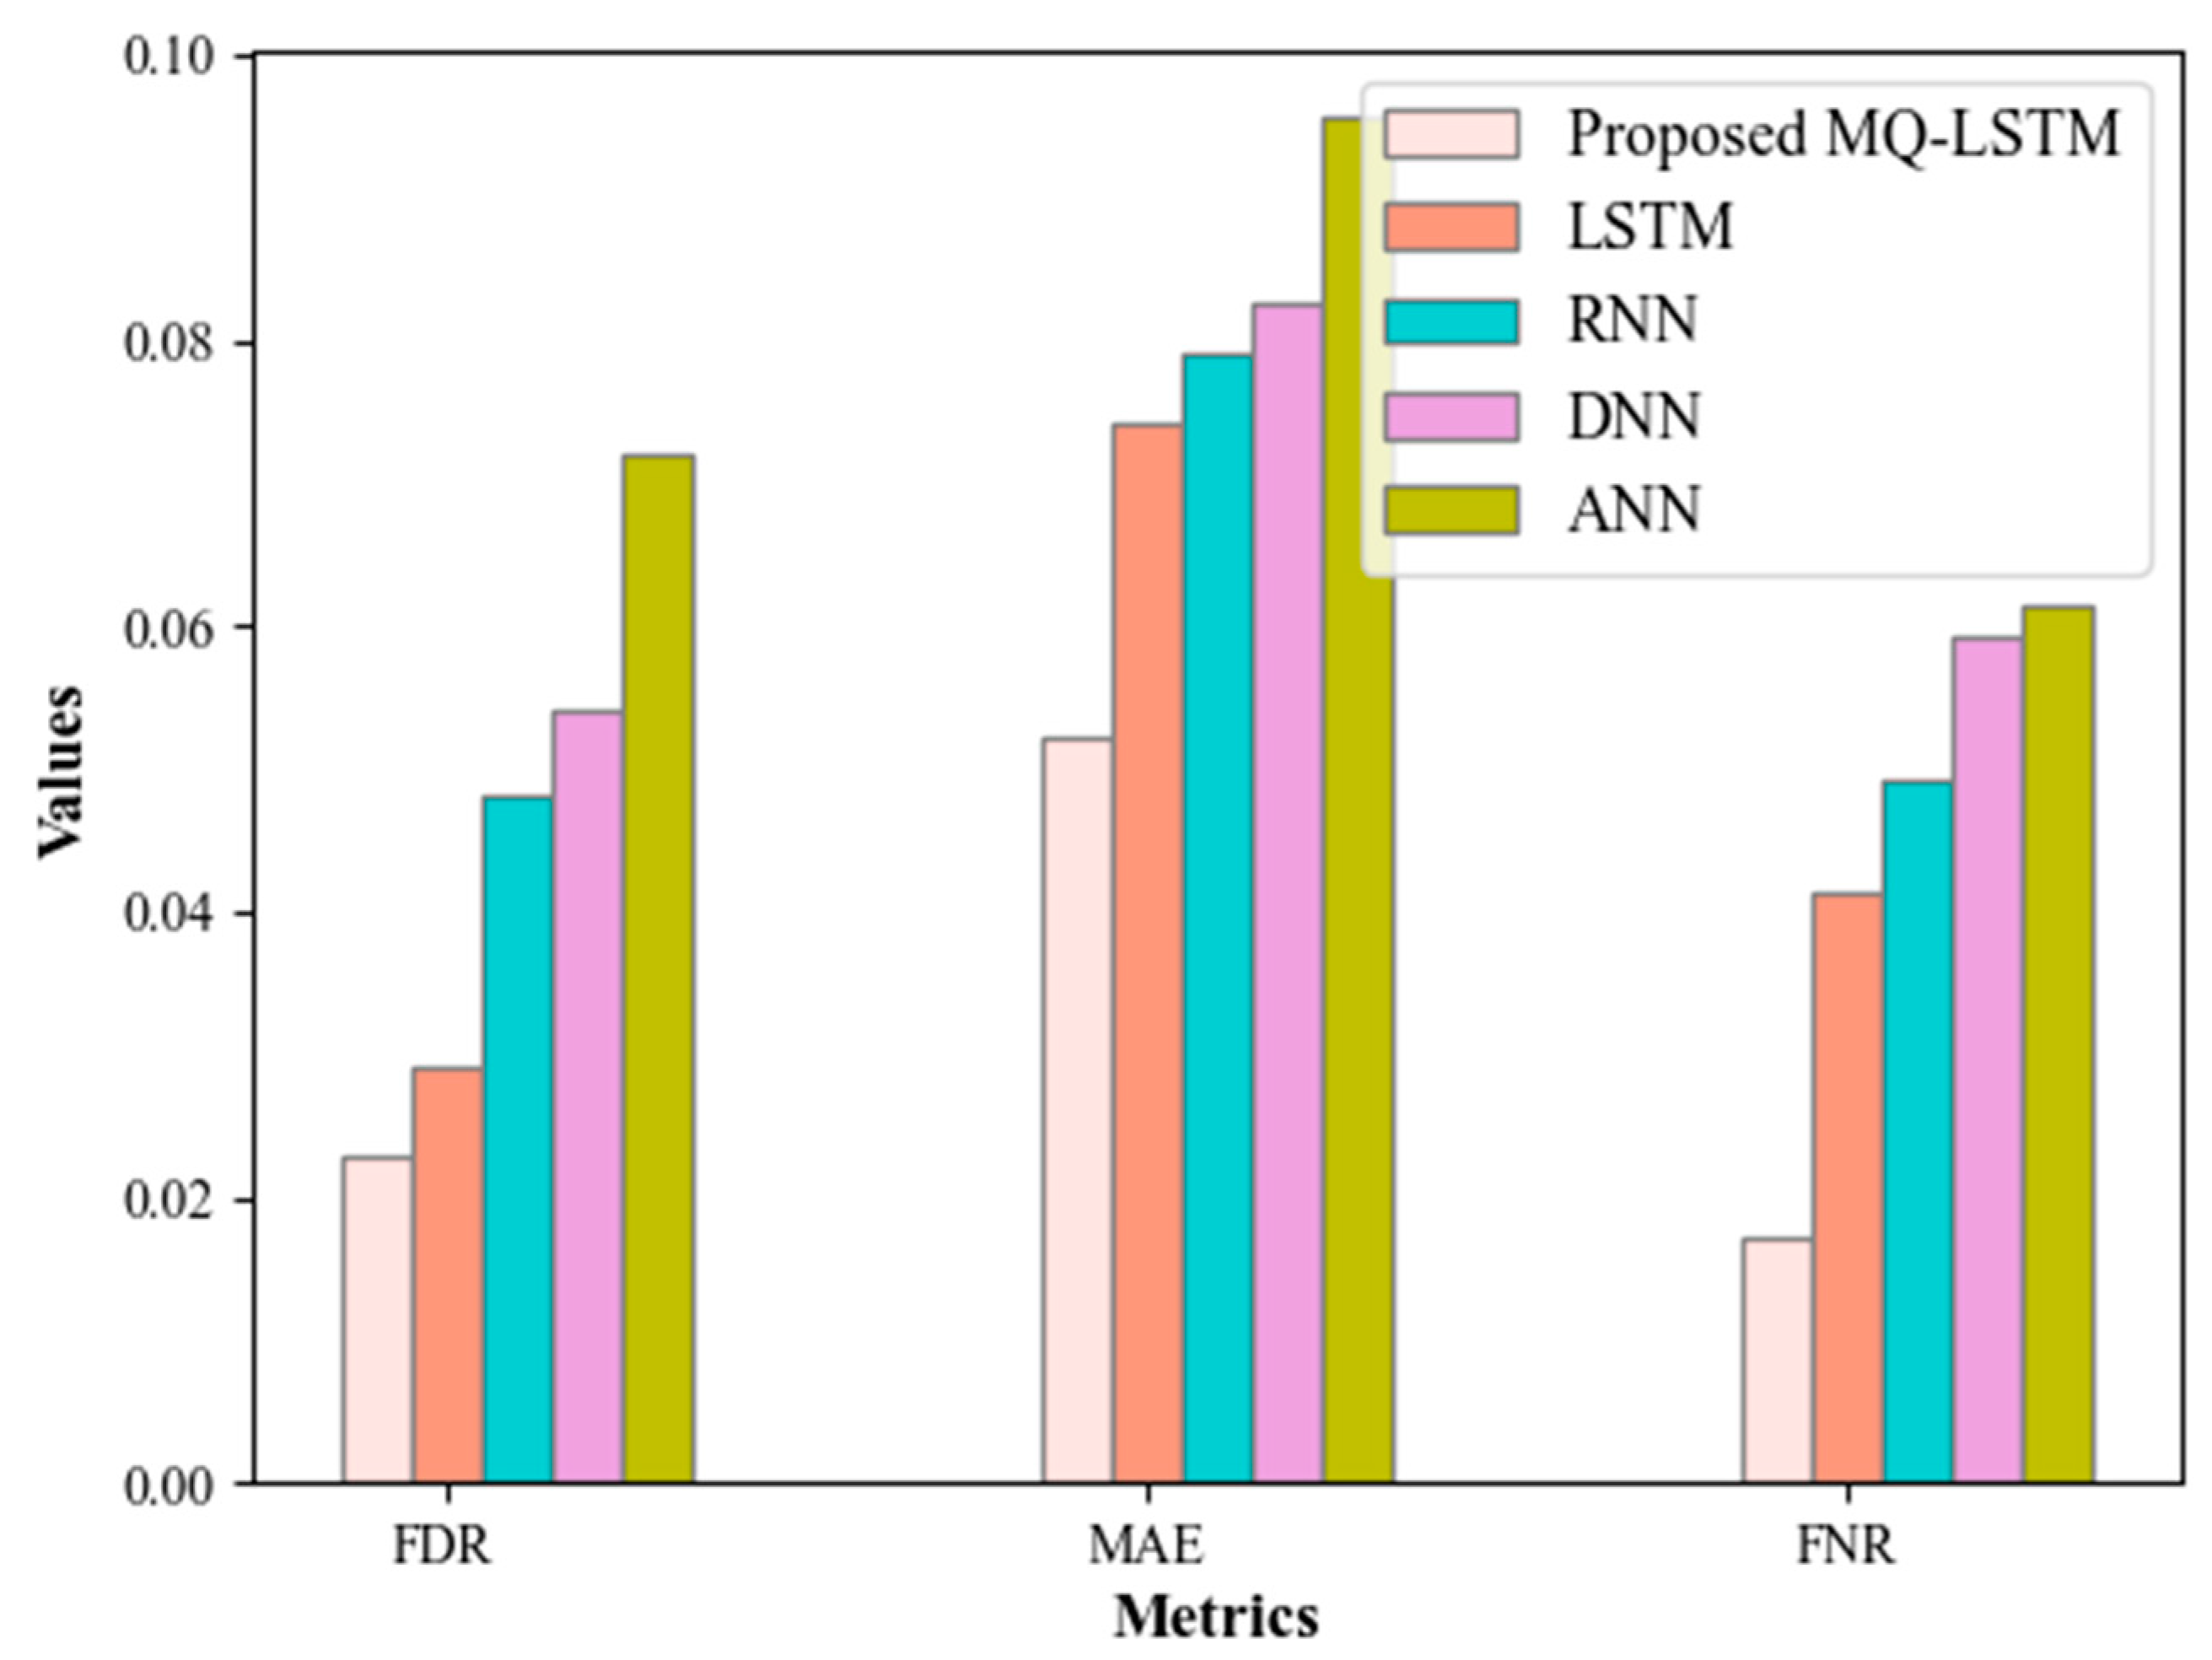
Figure 7.
ROC Curve Analysis.
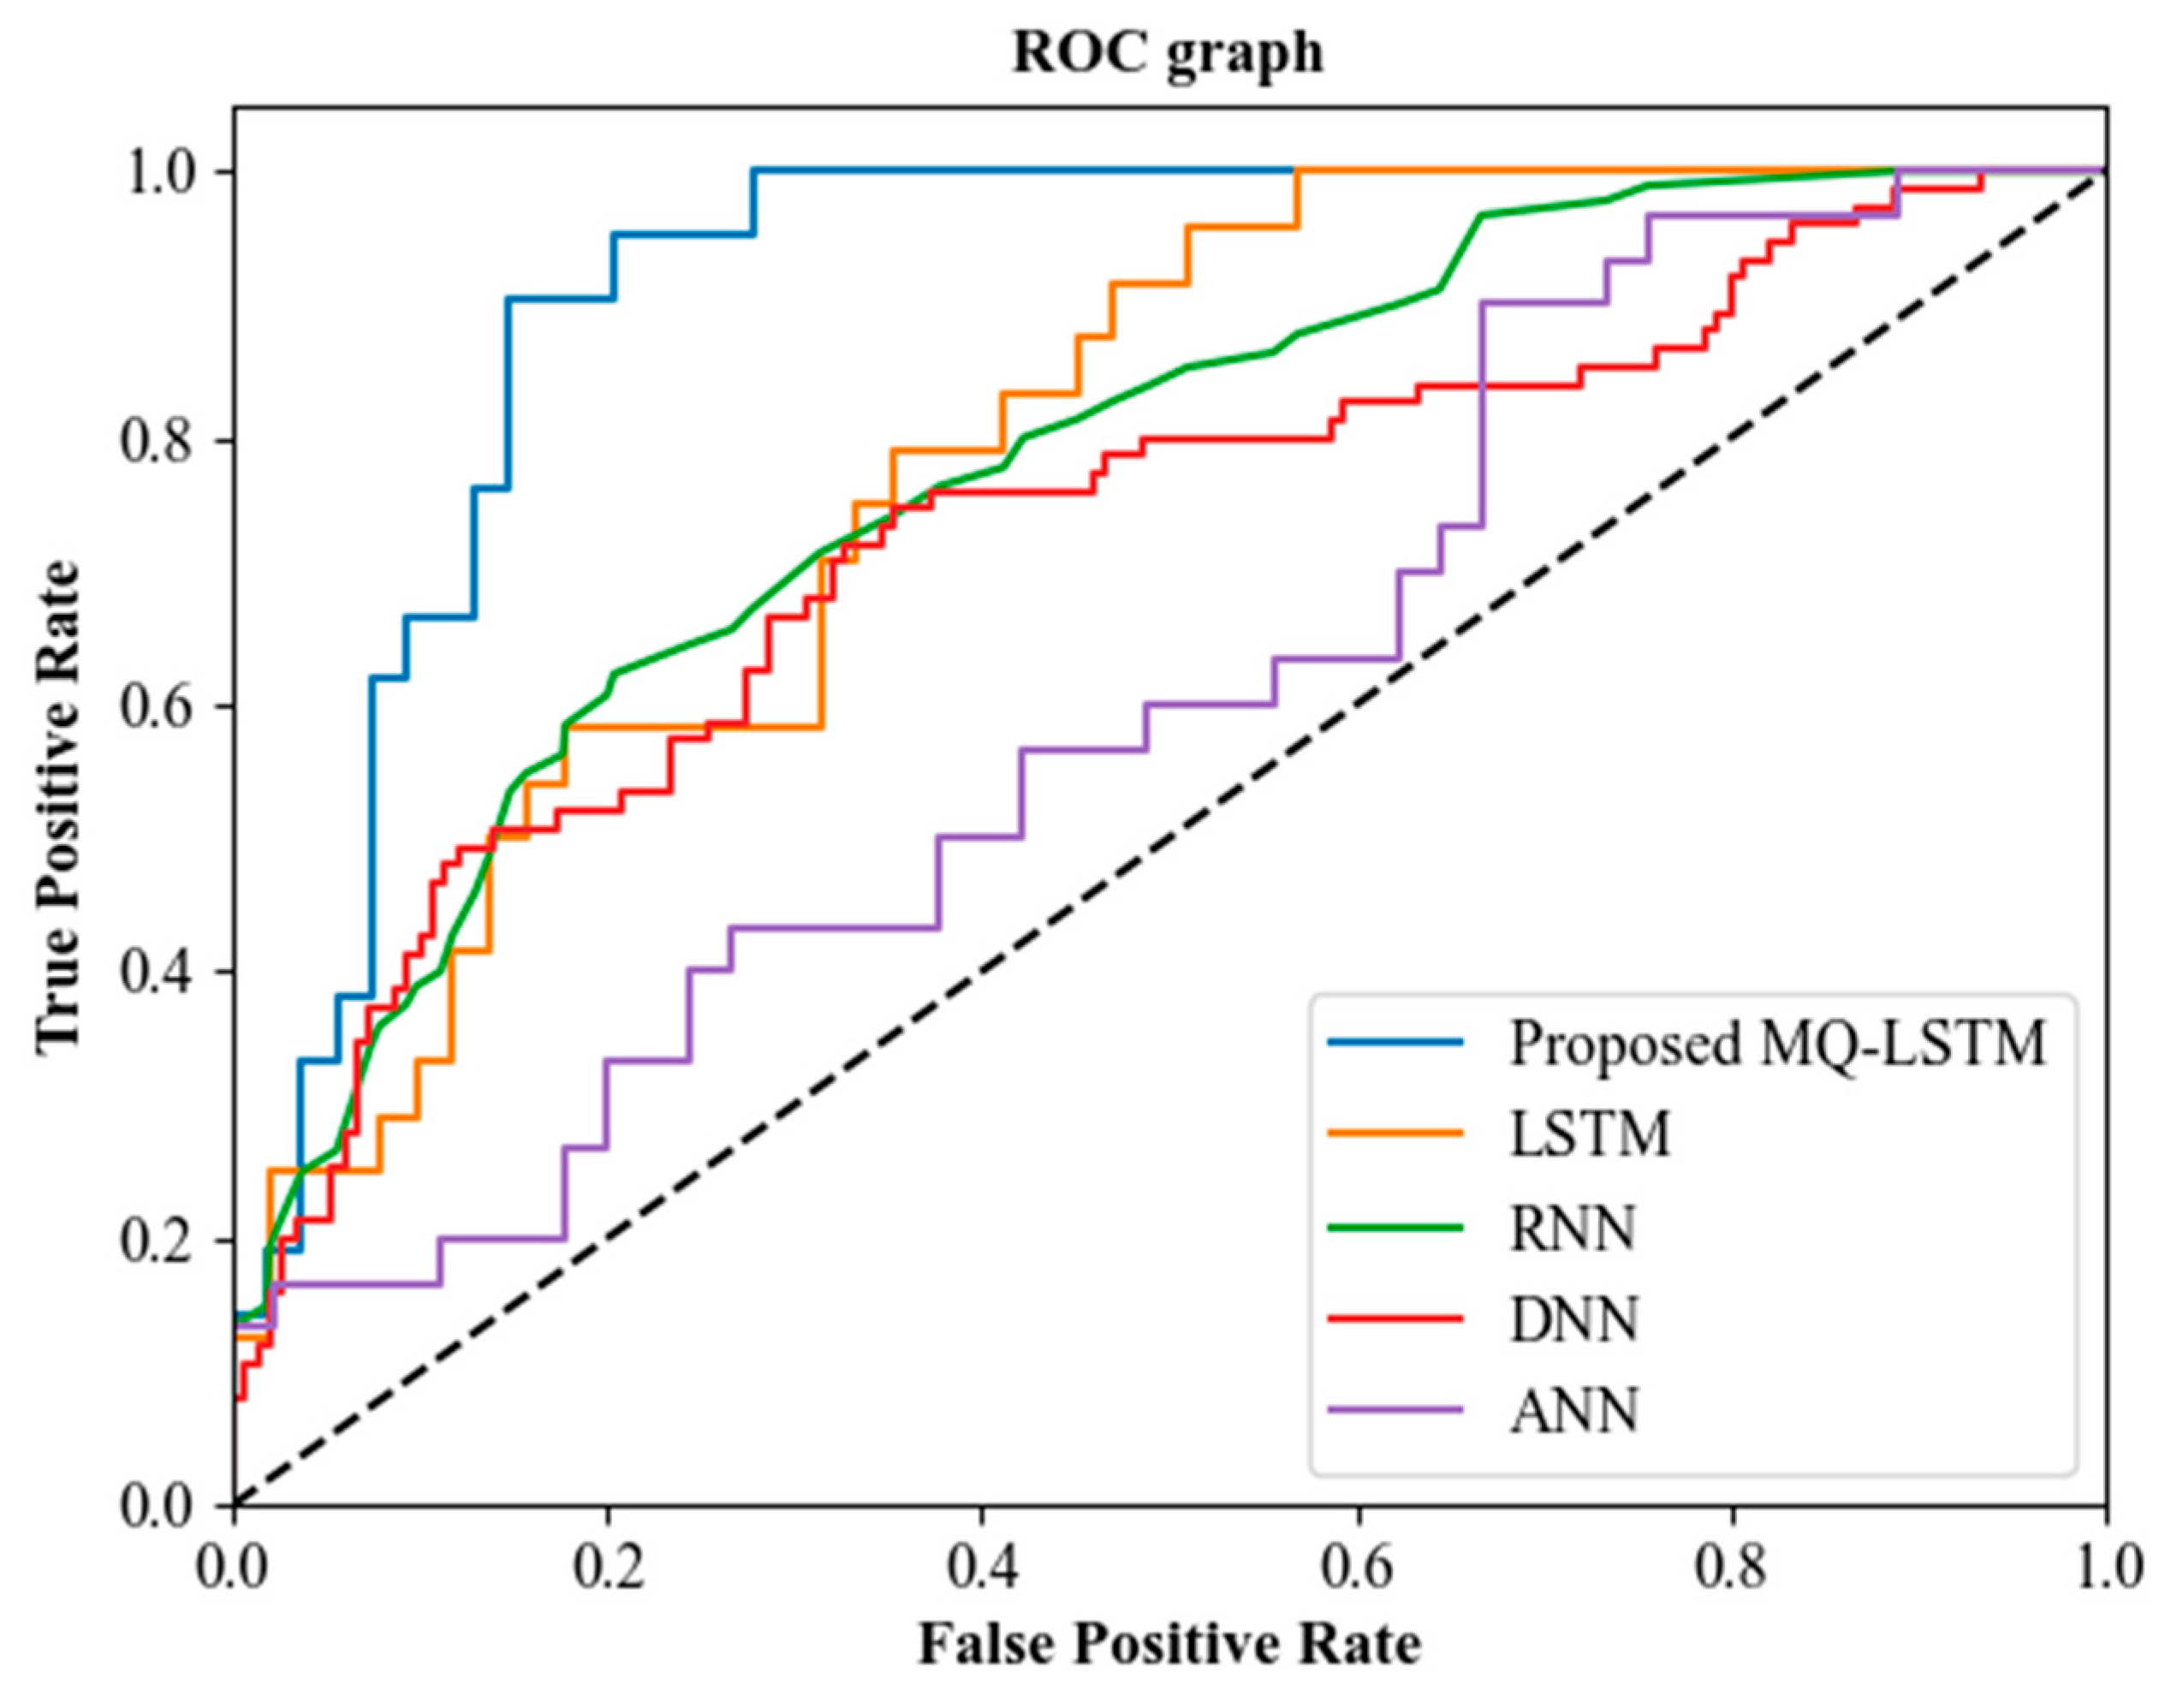
Figure 8.
Comparative Analysis based on RR.
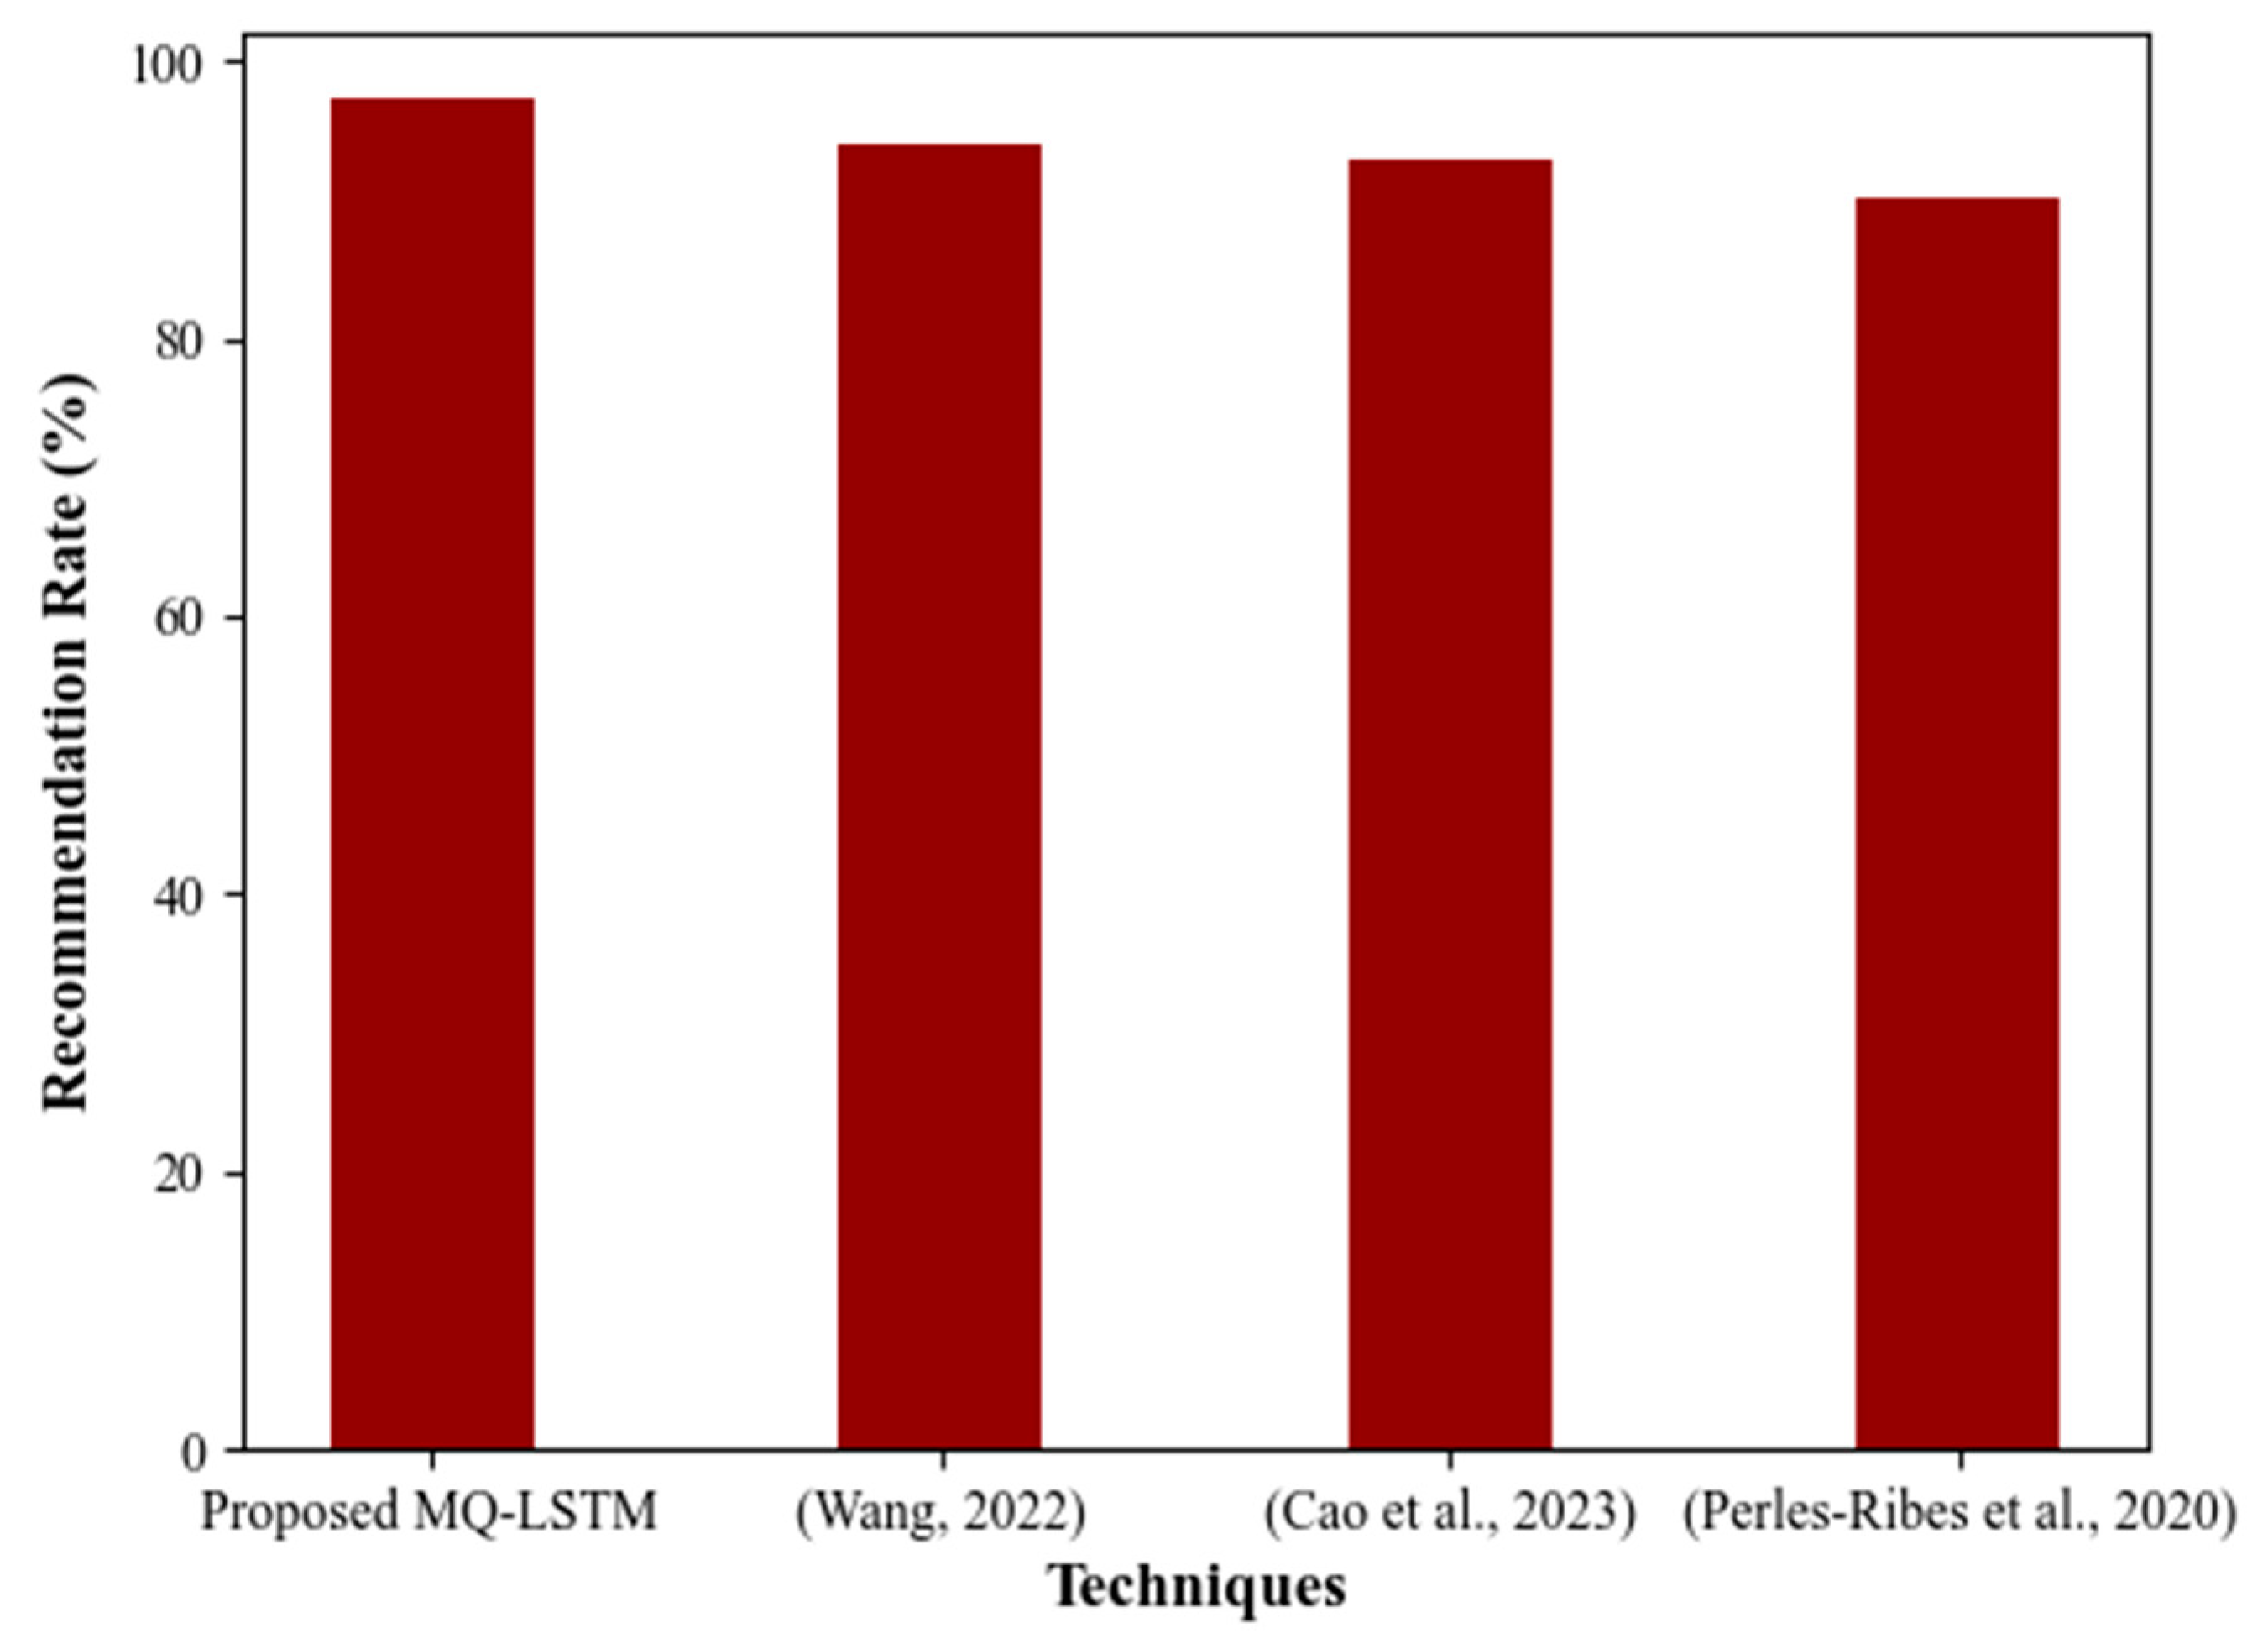

Table 1.
Performance analysis of Proposed MQ-LSTM.
| Techniques | MR (%) | NPV (%) | MCC (%) |
|---|---|---|---|
| Proposed MQ-LSTM | 2.78 | 96.15 | 93.53 |
| LSTM | 3.68 | 94.95 | 92.52 |
| RNN | 5.7 | 93.14 | 91.43 |
| DNN | 8.75 | 91.39 | 90.31 |
| ANN | 9.4 | 89.35 | 88.17 |
Table 2.
Performance Comparison Regarding Training Time.
| Techniques | Training Time (ms) |
|---|---|
| Proposed MQ-LSTM | 45005 |
| LSTM | 53487 |
| RNN | 67543 |
| DNN | 78643 |
| ANN | 90049 |
Table 3.
Performance Validation of Proposed KIC.
| Techniques | Grouping Time (ms) |
|---|---|
| Proposed KIC | 36017 |
| Chameleon | 43129 |
| BIRCH | 53012 |
| CURE | 65894 |
| ROCK | 78653 |
Disclaimer/Publisher’s Note: The statements, opinions and data contained in all publications are solely those of the individual author(s) and contributor(s) and not of MDPI and/or the editor(s). MDPI and/or the editor(s) disclaim responsibility for any injury to people or property resulting from any ideas, methods, instructions or products referred to in the content. |
© 2023 by the authors. Licensee MDPI, Basel, Switzerland. This article is an open access article distributed under the terms and conditions of the Creative Commons Attribution (CC BY) license (http://creativecommons.org/licenses/by/4.0/).
Copyright: This open access article is published under a Creative Commons CC BY 4.0 license, which permit the free download, distribution, and reuse, provided that the author and preprint are cited in any reuse.


