1. Introduction
Compound specific isotope analysis is the name given to a group of analytical techniques which generally consist of isolating the specific chemical compound and then measuring them for their stable isotope composition [
1]. The term is used to differentiate from the analysis performed without the initial separation step, which is known as bulk analysis. Common targets for compound specific isotope analysis are carbohydrates [
2,
3,
4], amino acids [
3,
5,
6,
7,
8] and fatty acids [
3,
9,
10].
High Performance Liquid Chromatography (HPLC) is a technique used to separate dissolved compounds in a liquid sample by making the solution go through a chromatographic column. The chromatographic column has stronger affinity to some compounds compared to others, and this makes them elute at different times. HPLC is one technique that enables compound specific isotope ratio mass spectrometry. There have been numerous studies in which samples separated by HPLC are subsequently measured using IRMS, for a range of chemical elements [
11,
12,
13,
14,
15,
16,
17,
18,
19]. HPLC-IRMS can be achieved using on-line HPLC-IRMS, where a HPLC is directly connected to an IRMS [
20], but this approach has some limitations: it is limited to carbon isotopes only (while IRMS can measure many different elements); it can only operate using low-flow water as the mobile phase (in contrast, HPLC can operate using many other solvents, including organic solvents, which cannot be used for on-line HPLC-IRMS); and it demands the use of corrosive chemicals and fragile membranes / filaments which make the operation of the system highly labor (and capital) intensive [
21]. Furthermore, on-line HPLC-IRMS demands specialized equipment that is not present in most IRMS laboratories [
21]. An alternative to on-line HPLC-IRMS is off-line HPLC-IRMS, where compounds separated by HPLC are physically collected then subsequent analysis with an IRMS. While not as efficient as the on-line approach, off-line HPLC-IRMS is arguably more flexible, robust and accessible, because there is no limitation of solvent or target element, there is no need of specialized interfaces between the HPLC and the IRMS, and HPLC is a very common technique present in many laboratories.
A key element of off-line HPLC-IRMS is the fraction collector, a device that automatically collects the compounds as they elute through HPLC. Here we show how a common 3D printer can be easily adapted to become a fraction collector with the ultimate aim of enabling stable isotope analyses for compounds separated using HPLC.
2. Design
2.1. Justification of the design
Fraction collectors for HPLC typically consist of delivery tubing and a container tray. The delivery tubing (or the tray) is moved so that the liquid eluting from the HPLC, corresponding to specific peaks of the various compounds separated by the HPLC, can be delivered to the individual compartments within the tray, so that the desired compounds are collected.
Fraction collectors can be seen as a kind of autosamplers. This means that they are among the simplest instruments in a laboratory. Despite their simplicity, commercial fraction collectors are arguably overpriced, as is most commercial scientific equipment [
22,
23,
24]. This has prompted scientists to build their own fraction collectors [
25,
26,
27,
28]. Adapting these designs, or some autosampler designs [
29,
30,
31,
32], could be an option for our purposes. However, we realized that a simpler approach would be to adapt commercially available 3D-printers to this end. The main advantages are: 1) low cost; 2) wide availability; 3) high similarity in function. This similarity consists in the ability of 3D-printers to move the extruder (equivalent to the delivery tubing) and the printing bed so that positions in the 3D space can be reached. Also, most current 3D-printers have an advantage compared to autosamplers for this purpose: 3D-printers are equipped with a heated bed, which is used to aid printing. A heated bed is convenient for a fraction collector because it allows the collected liquid to be simultaneously evaporated, so that only the non-volatile compounds remain in each container as dry powders. This way, the collected fractions can be immediately taken for diverse chemical measurements, including stable isotope analyses of carbon and nitrogen, which are our main interest.
2.2. 3D-printer modifications
The fraction collector used here consists of a 3D printer (3D printer touch, Balco) which had its extruder removed and replaced with a simple tube holder for the PEEK (polyether ether ketone) tubing coming from the HPLC. A metal tray (PAL TR98, CTC analytics) was placed on the heat bed of the 3D printer using double sided tape. A tube leading to a waste drum was attached to the side of the 3D printer body to allow for waste collection.
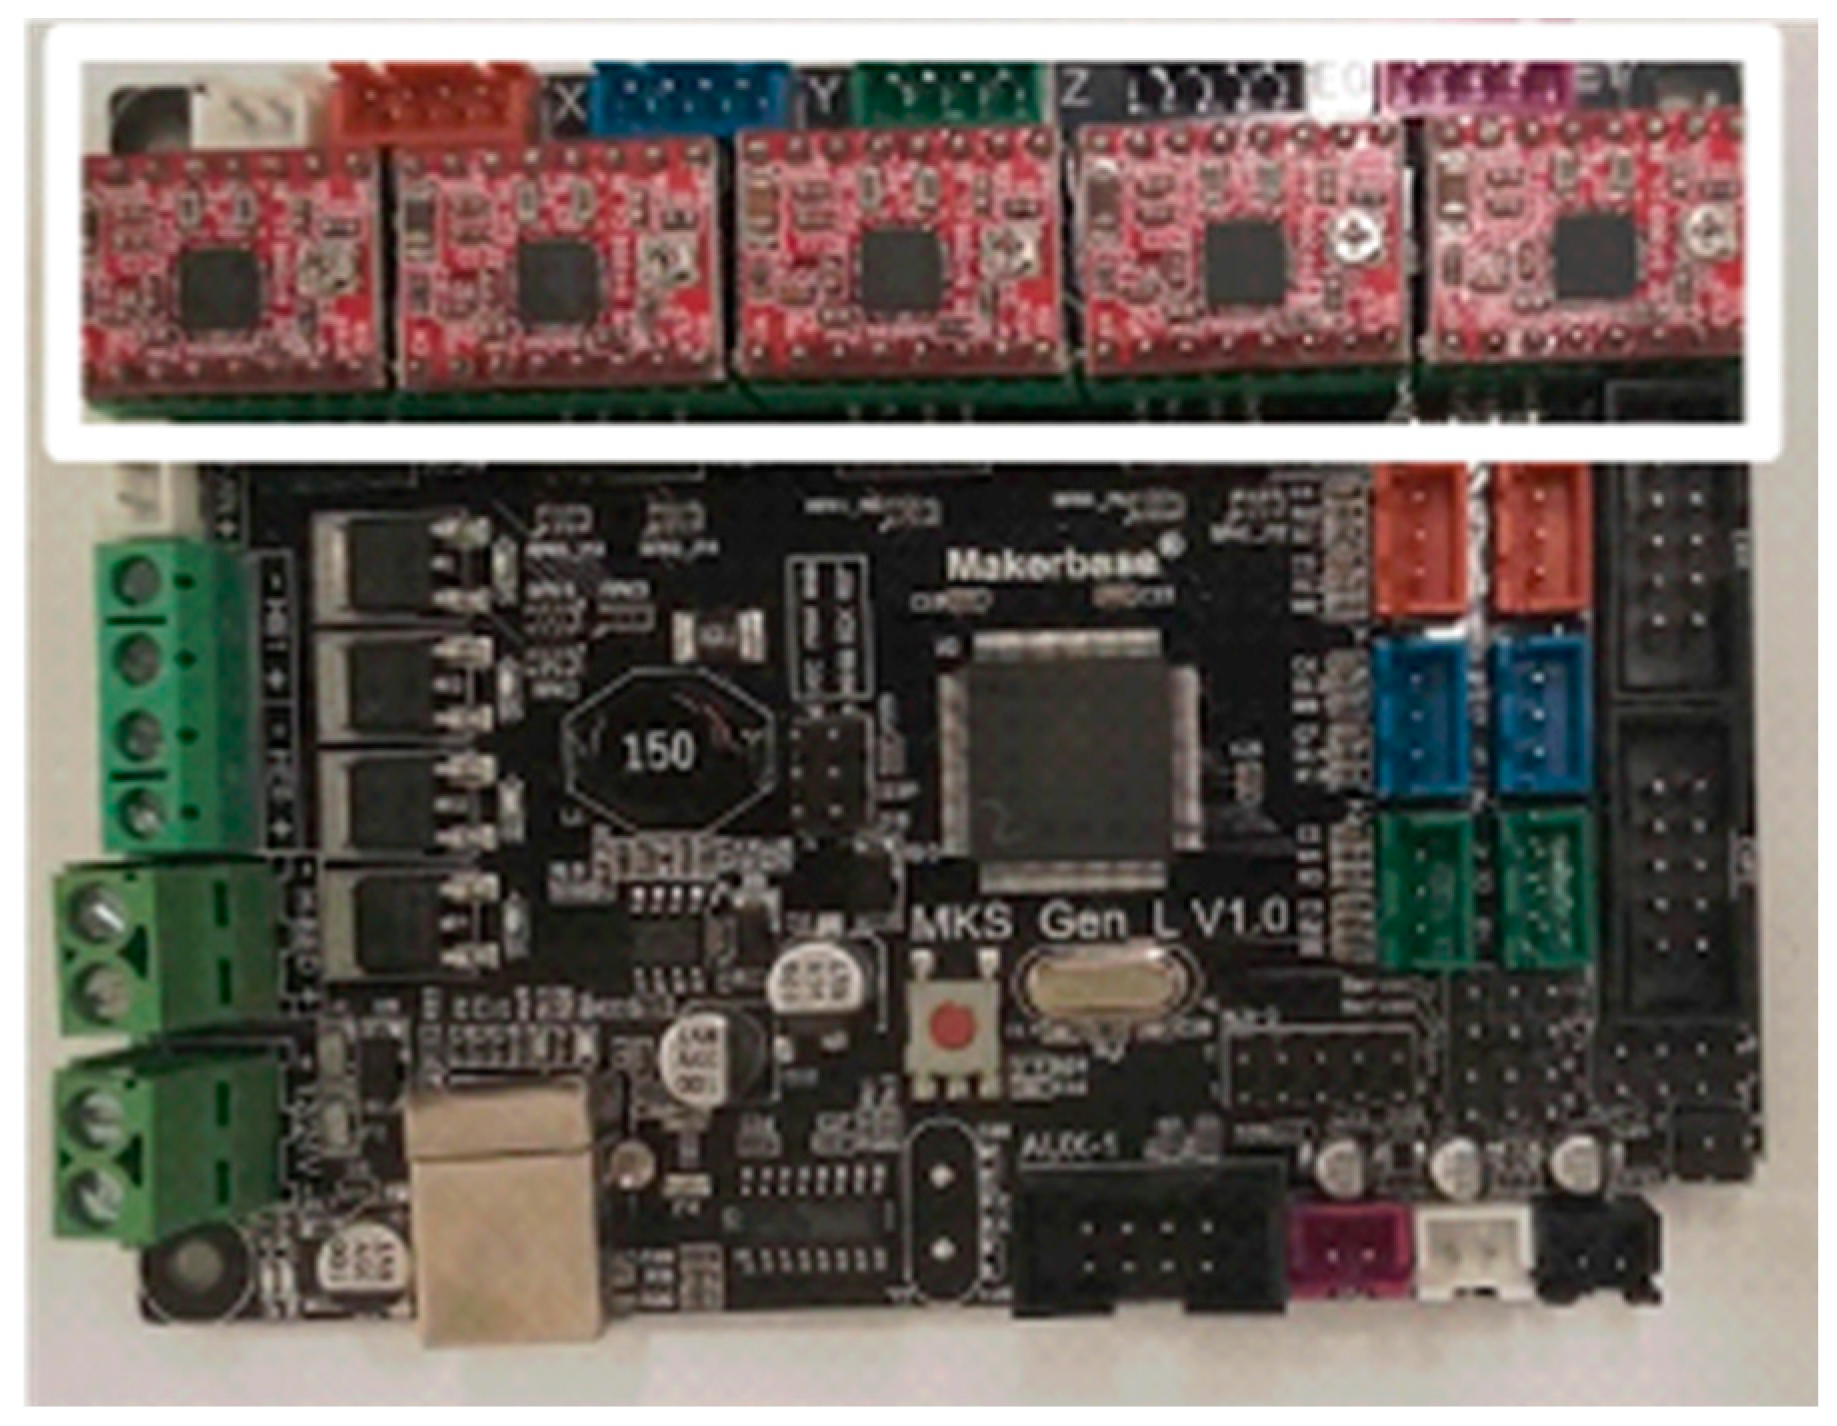
Instead of the original control board for the 3D printer, an MKS-GEN-L board (Makerbase) was connected to the stepper motors, the heat bed, and the power supply of the 3D printer. Replacing the control board is not strictly necessary, but we have familiarity with the MKS-GEN-L board, and thus opted for this approach. The Marlin firmware was uploaded to the board to allow the control of the stepper motors and heat bed. Stepper motor drivers (A4988) were installed on the board.
2.3. Bill of materials
Table 1.
Bill of materials.
Table 1.
Bill of materials.
| Component |
Source |
Cost |
| 3D printer Prusa I3 style1
|
https://www.ebay.com.au/itm/155077037136 |
AU$232.00 |
| |
|
|
| MKS GEN L board |
https://www.ebay.com.au/itm/354788810185 |
AU$70.00 |
| A4988 drivers (5 units) |
https://www.ebay.com.au/itm/134438897517 |
AU$11.00 |
| PAL TR98 tray |
https://www.palparts.com/product/pal-tr98/ |
AU$1045.00 |
| Male-female DuPont cable for stepper motors (5 units) |
https://3dprintingperth.com/products/stepper-motor-cable-male-to-female-extension-dupont-wire?variant=39471376826481 |
AU$15.00 |
| Adapter model BT7242A for stepper motors |
https://www.aliexpress.com/i/32881420875.html |
AU$5.00 |
| Waste tube |
https://www.labfriend.com.au/bsafe-corrugated-tubing-pp-ø-65-x-100-mm-t-175-mm |
AU$50.00 |
| Cable holder for waste tube |
https://www.ebay.com.au/itm/203860080384 |
AU$4.00 |
| M3 screw, nut, and space |
Hardware store |
Less than AU$5.00 |
| 3D-printed tube holder |
Appendix A |
Less than AU$1.00 |
| |
|
|
| Total |
|
AU$1438.00 |
3. Build Instructions
The instructions presented here are for one specific model of 3D-printer. However, they can be easily adapted for most other similar models available in the market.
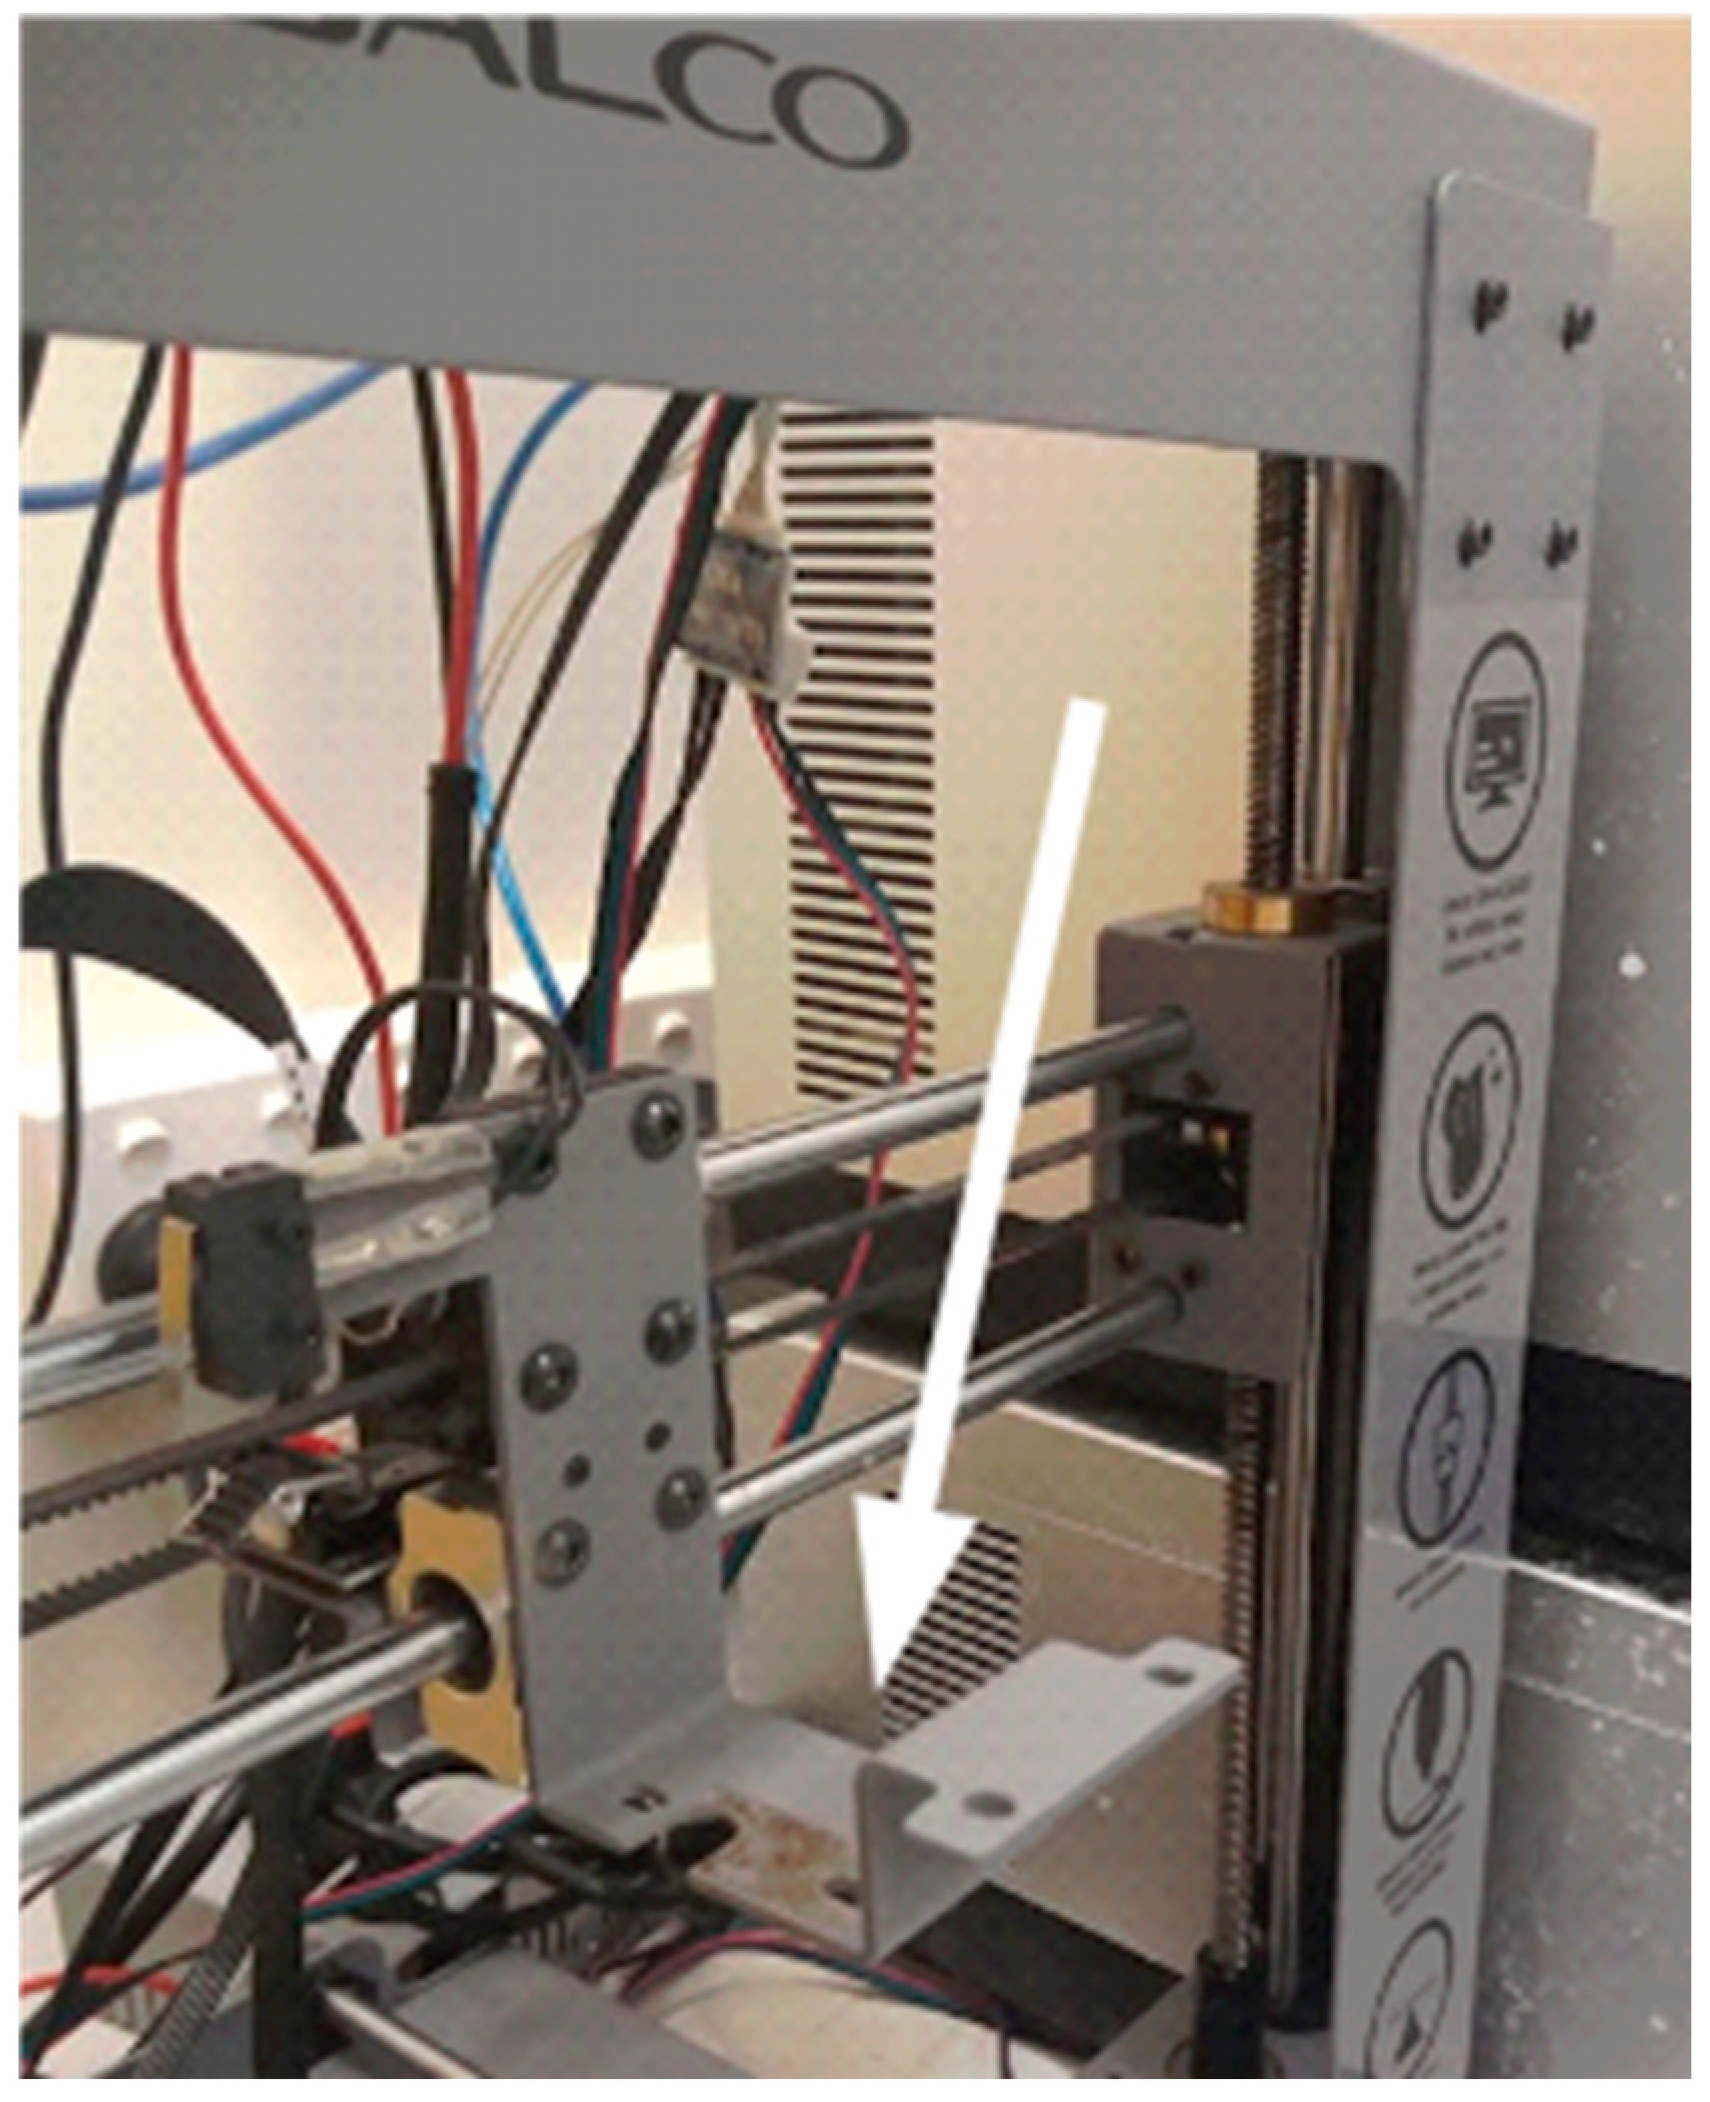
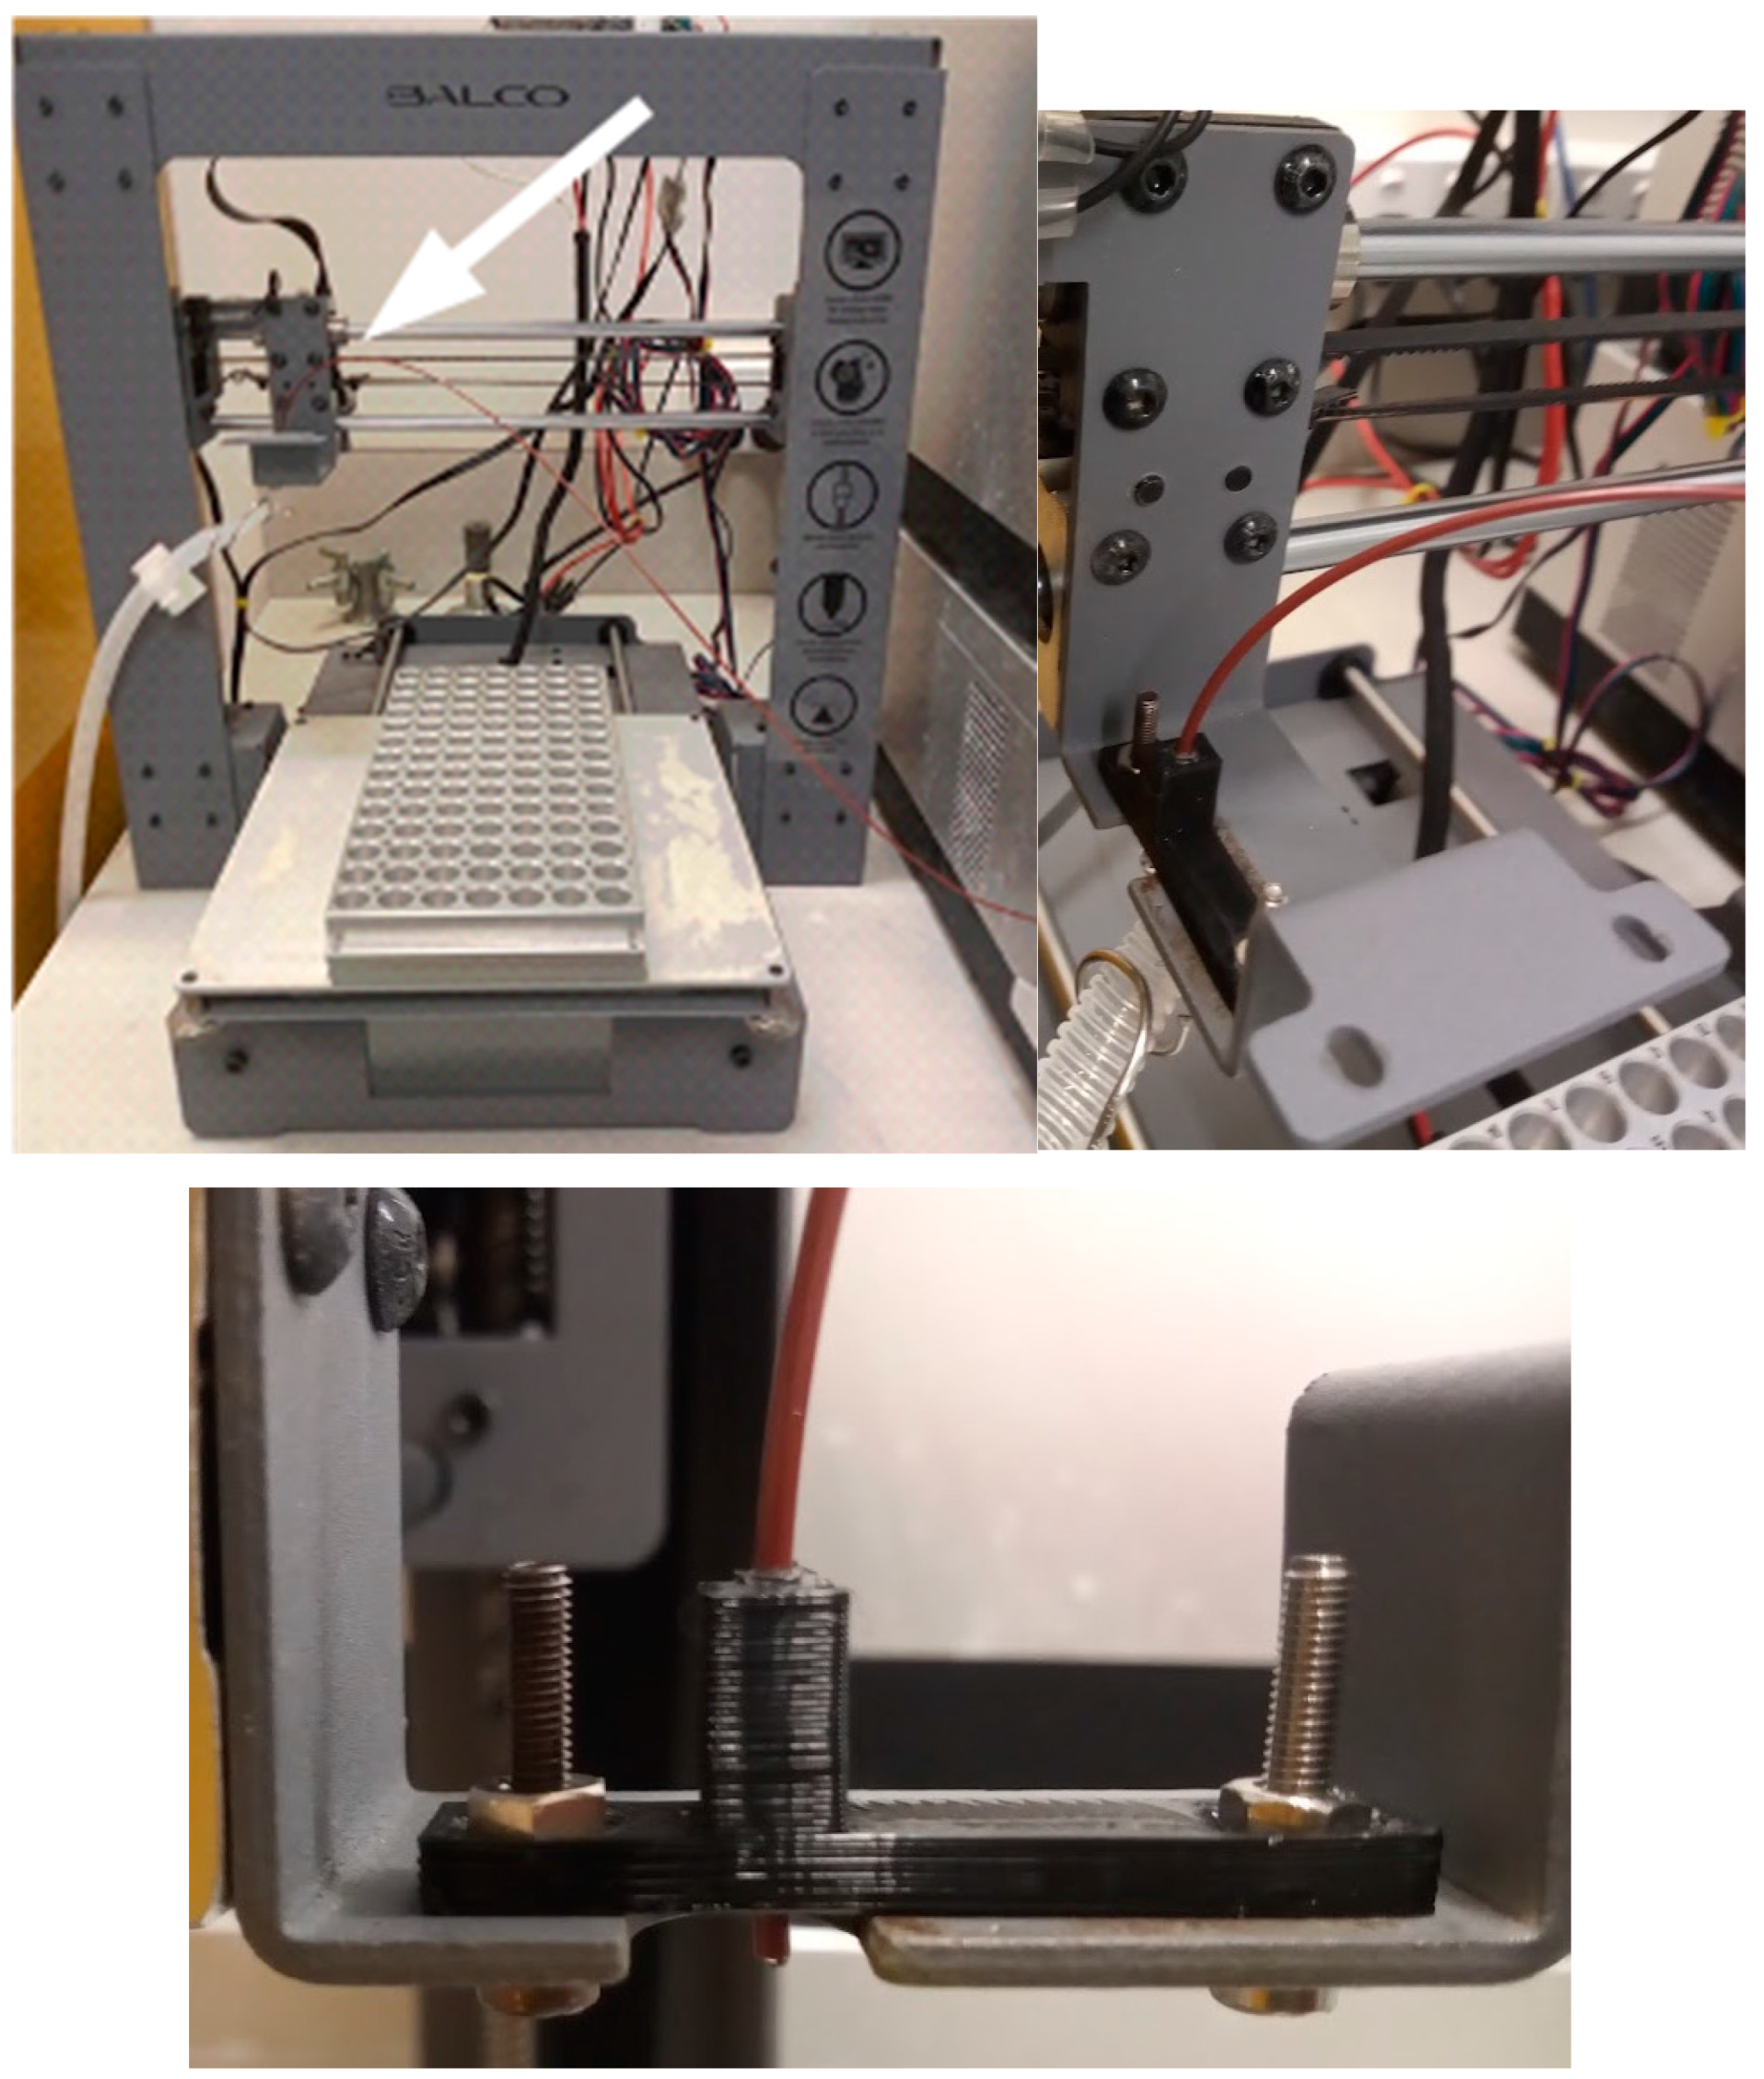
The first step is to remove the filament extruder (
Figure 1).
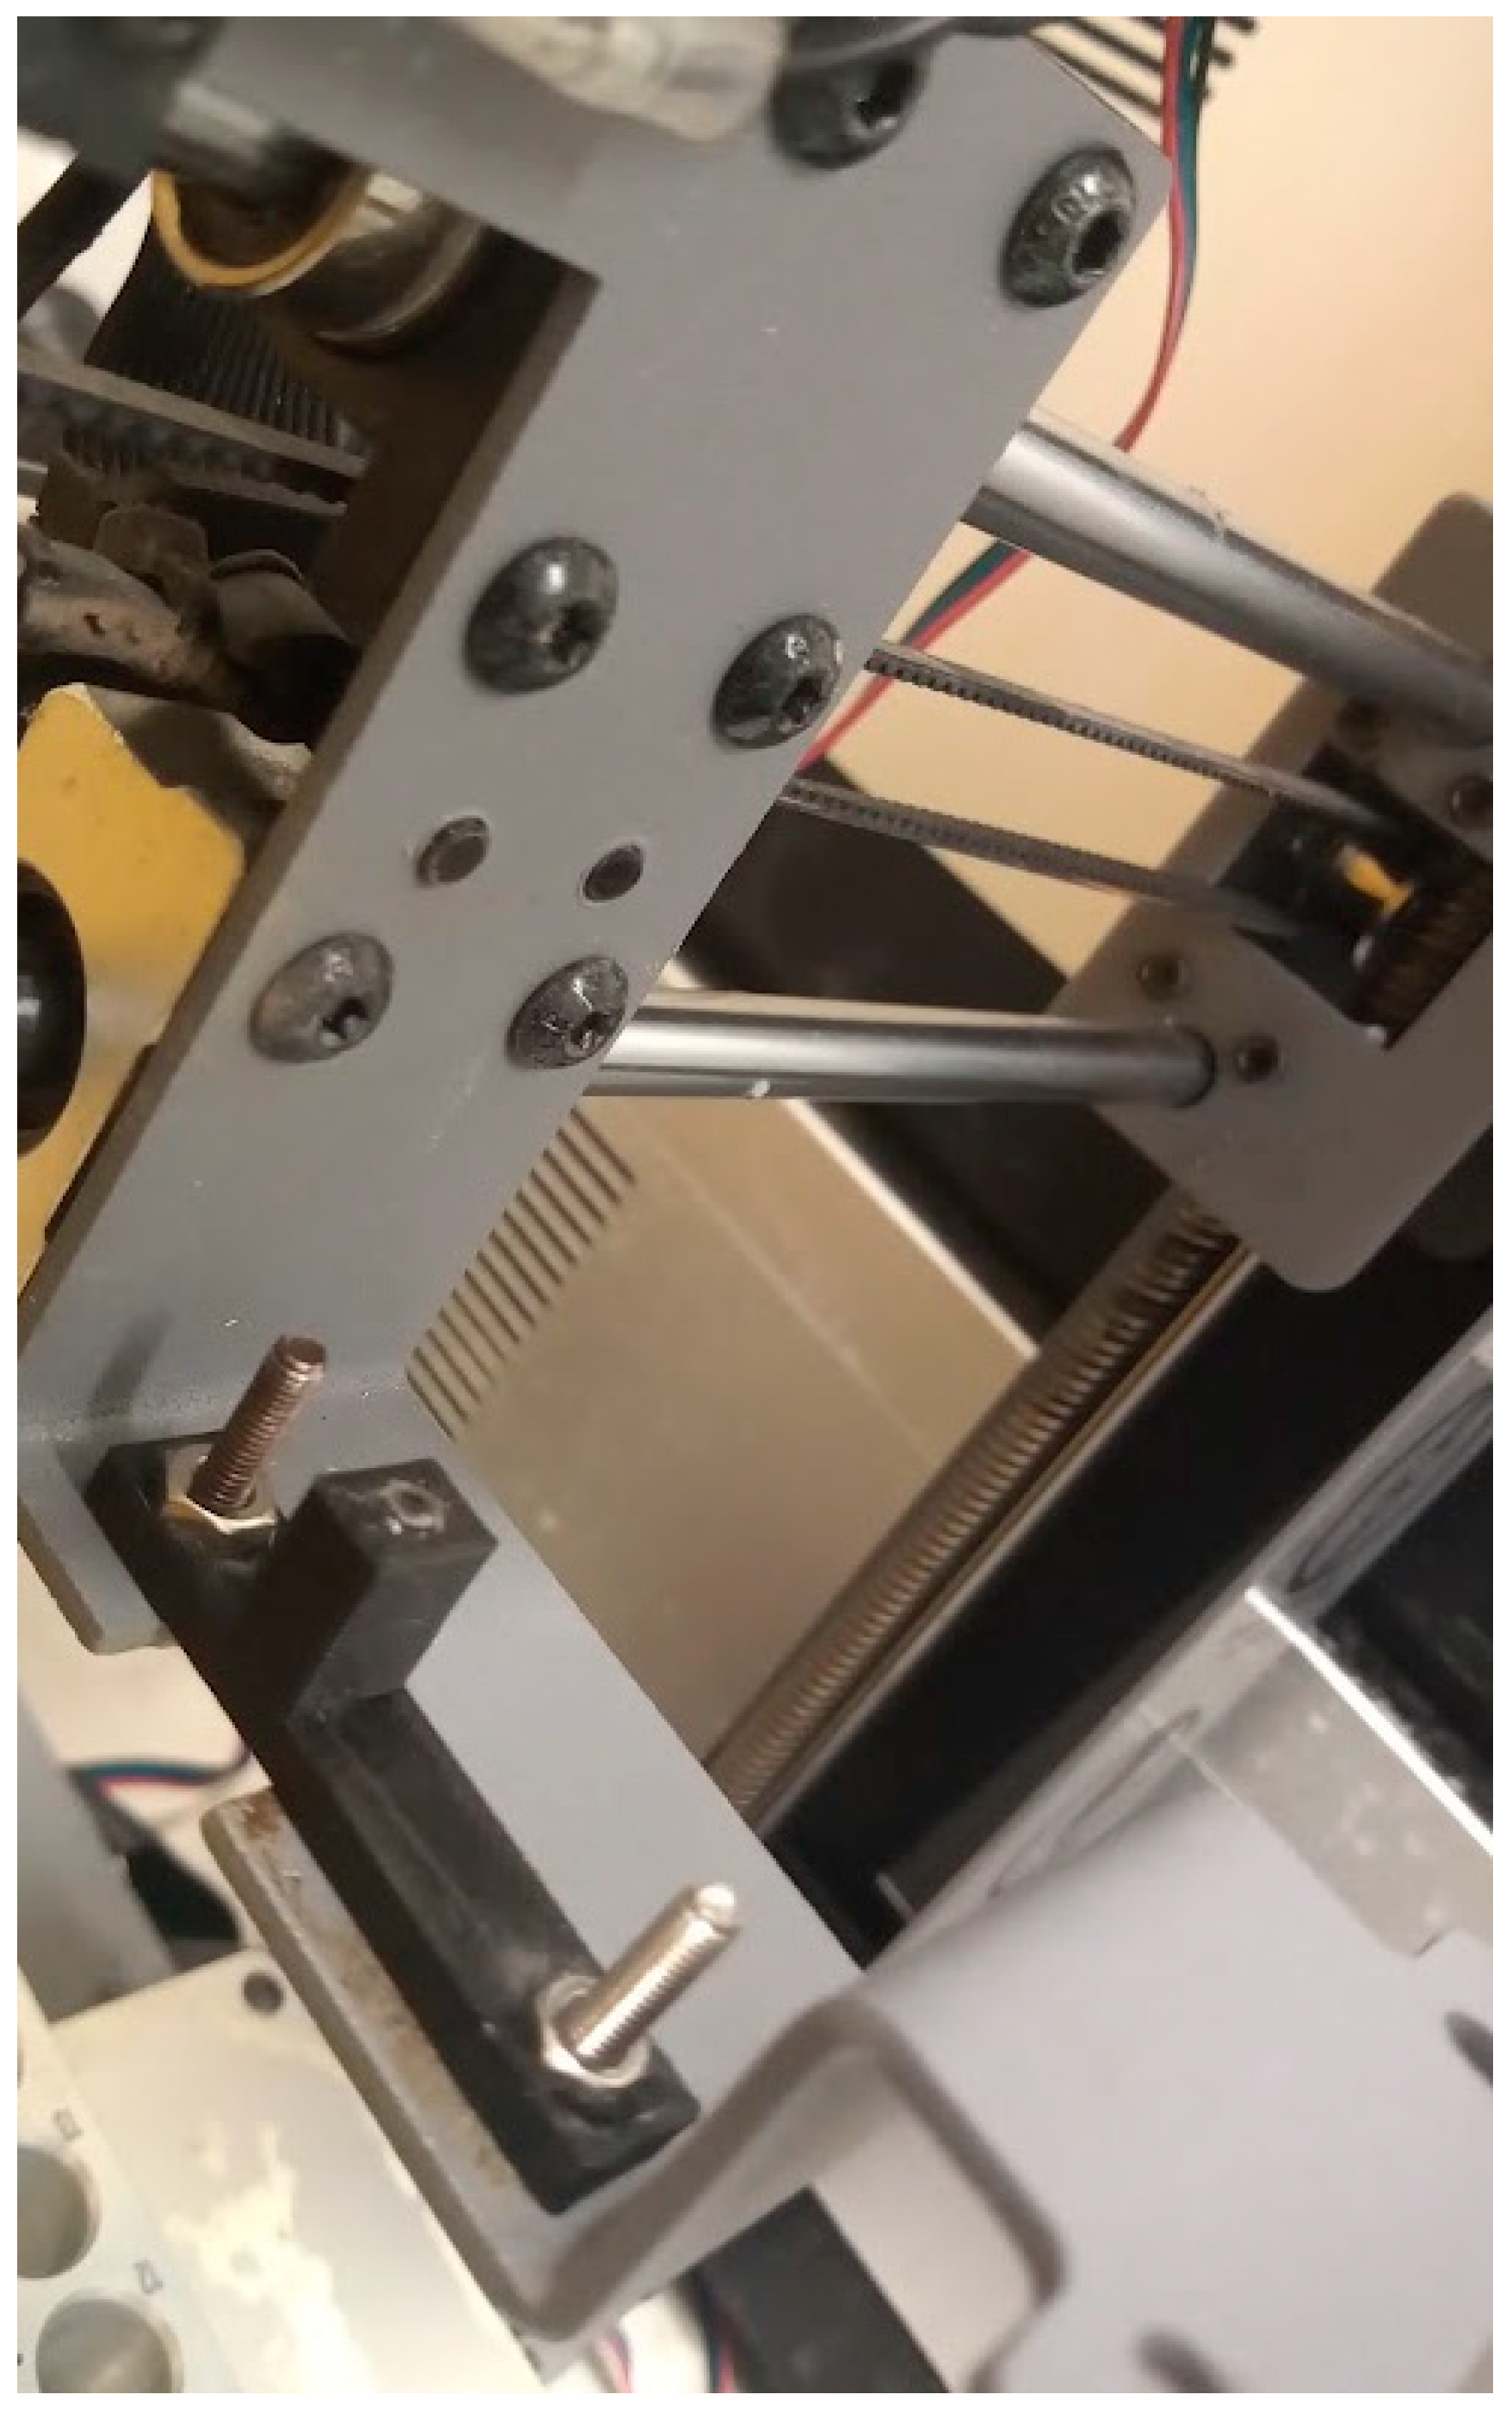
With the extruder removed, the tube holder can be attached to its place (
Figure 2) using two M3 screws and nuts. The design file for the tube holder is available from
https://doi.org/10.17605/OSF.IO/D24EK. Note that this tube holder was designed specifically for this 3D-printer and for the tube diameter (1.5 mm) used with the HPLC. Different dimensions will demand a different design.
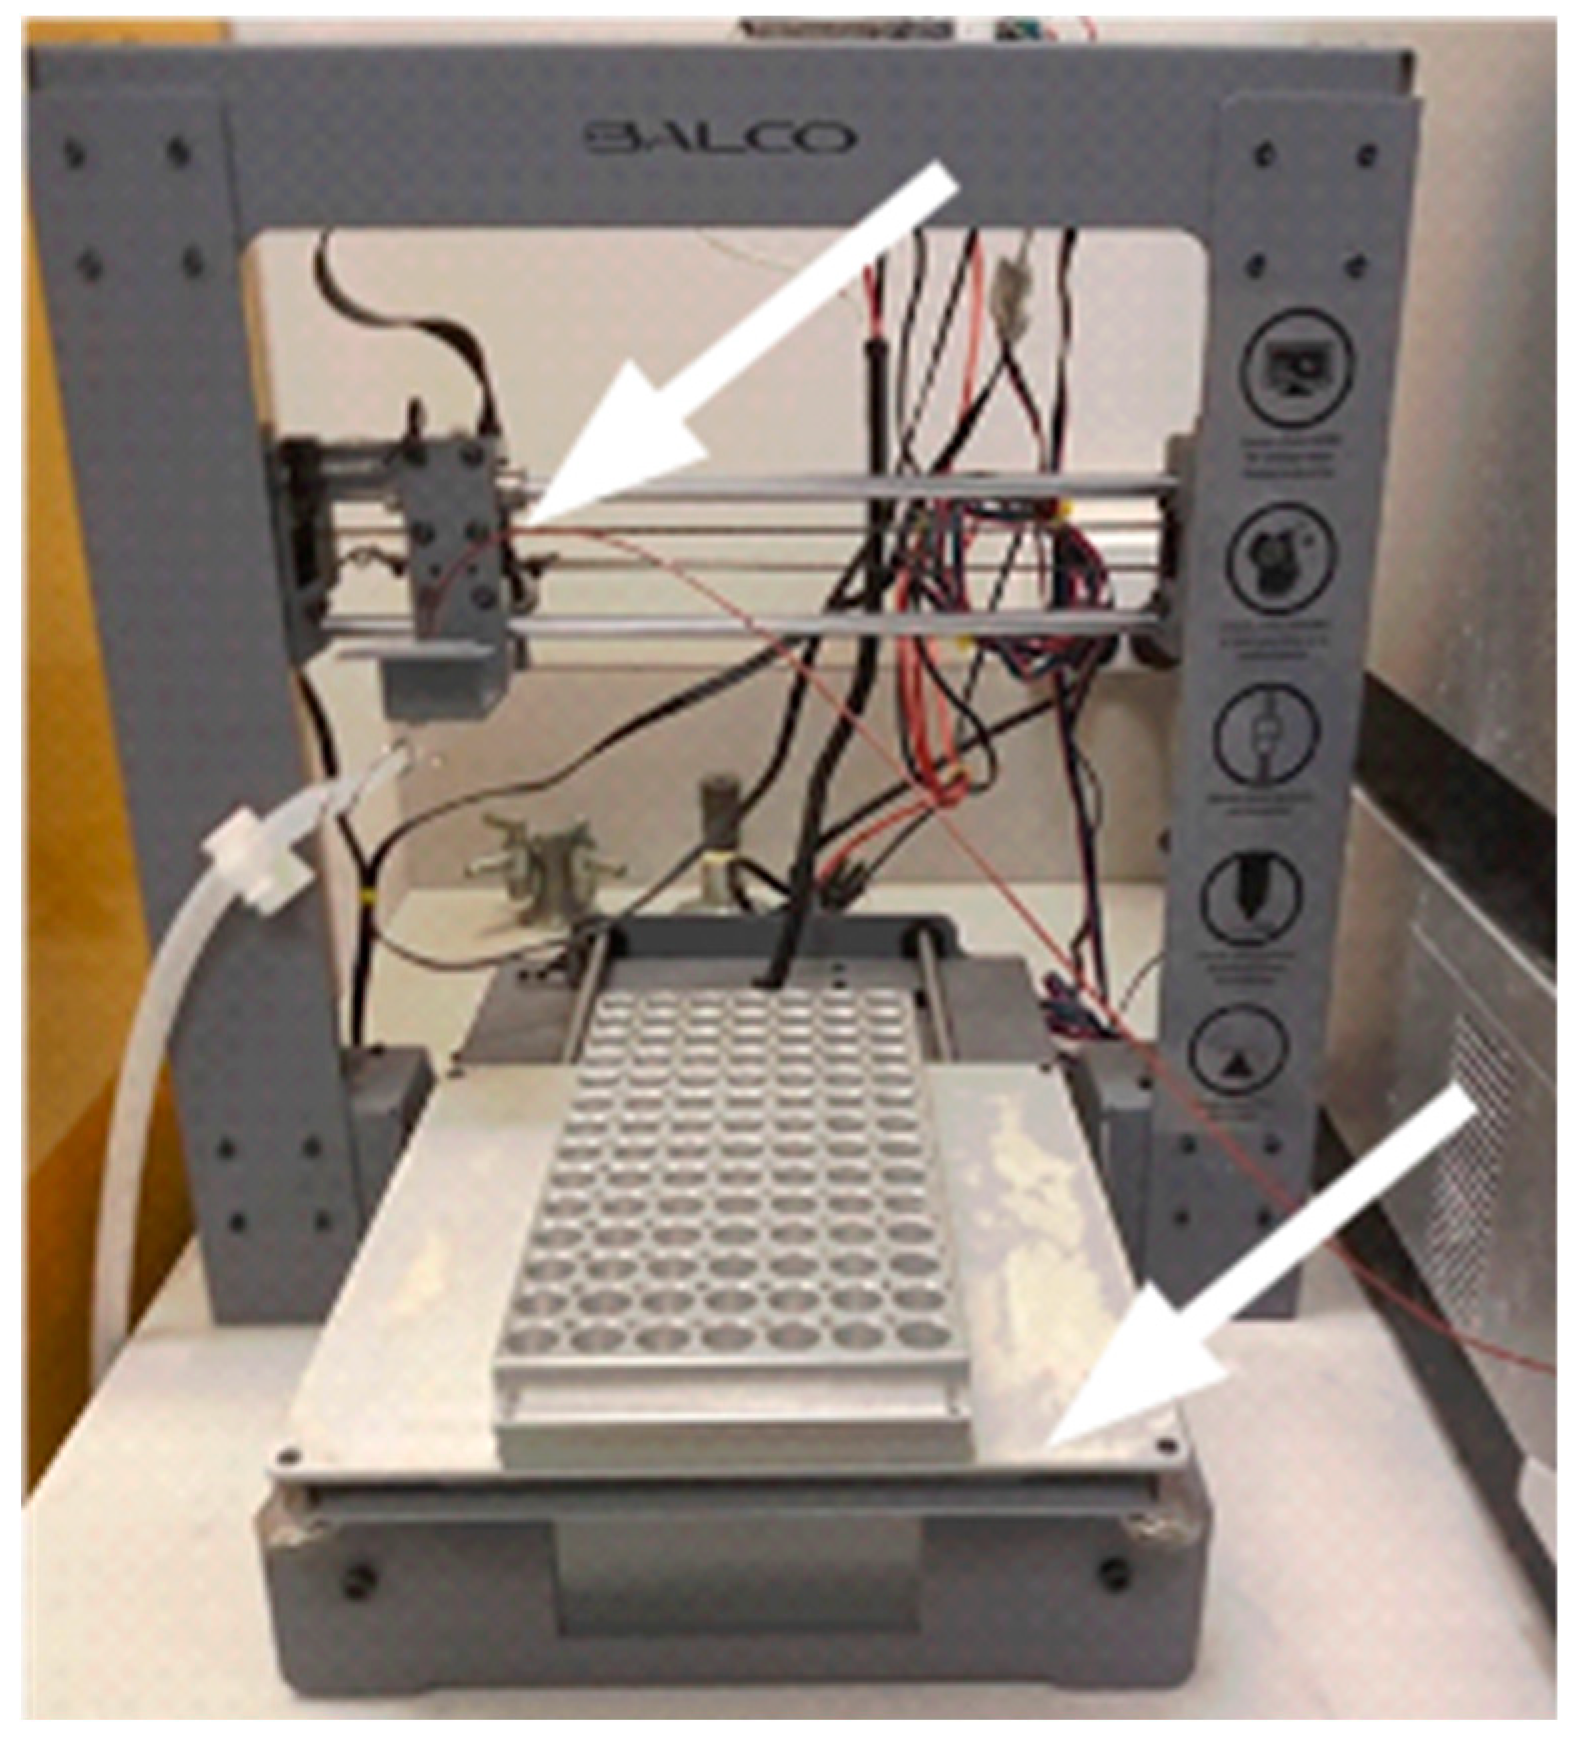
The next modification is to attach a metal tray to the printing bed (
Figure 3). Here we used a PAL TR98 tray from CTC analytics. Metal trays are suitable to allow heating, and thereby concentration, of the samples upon collection. We used double sided adhesive tape to attach the tray to the bed.
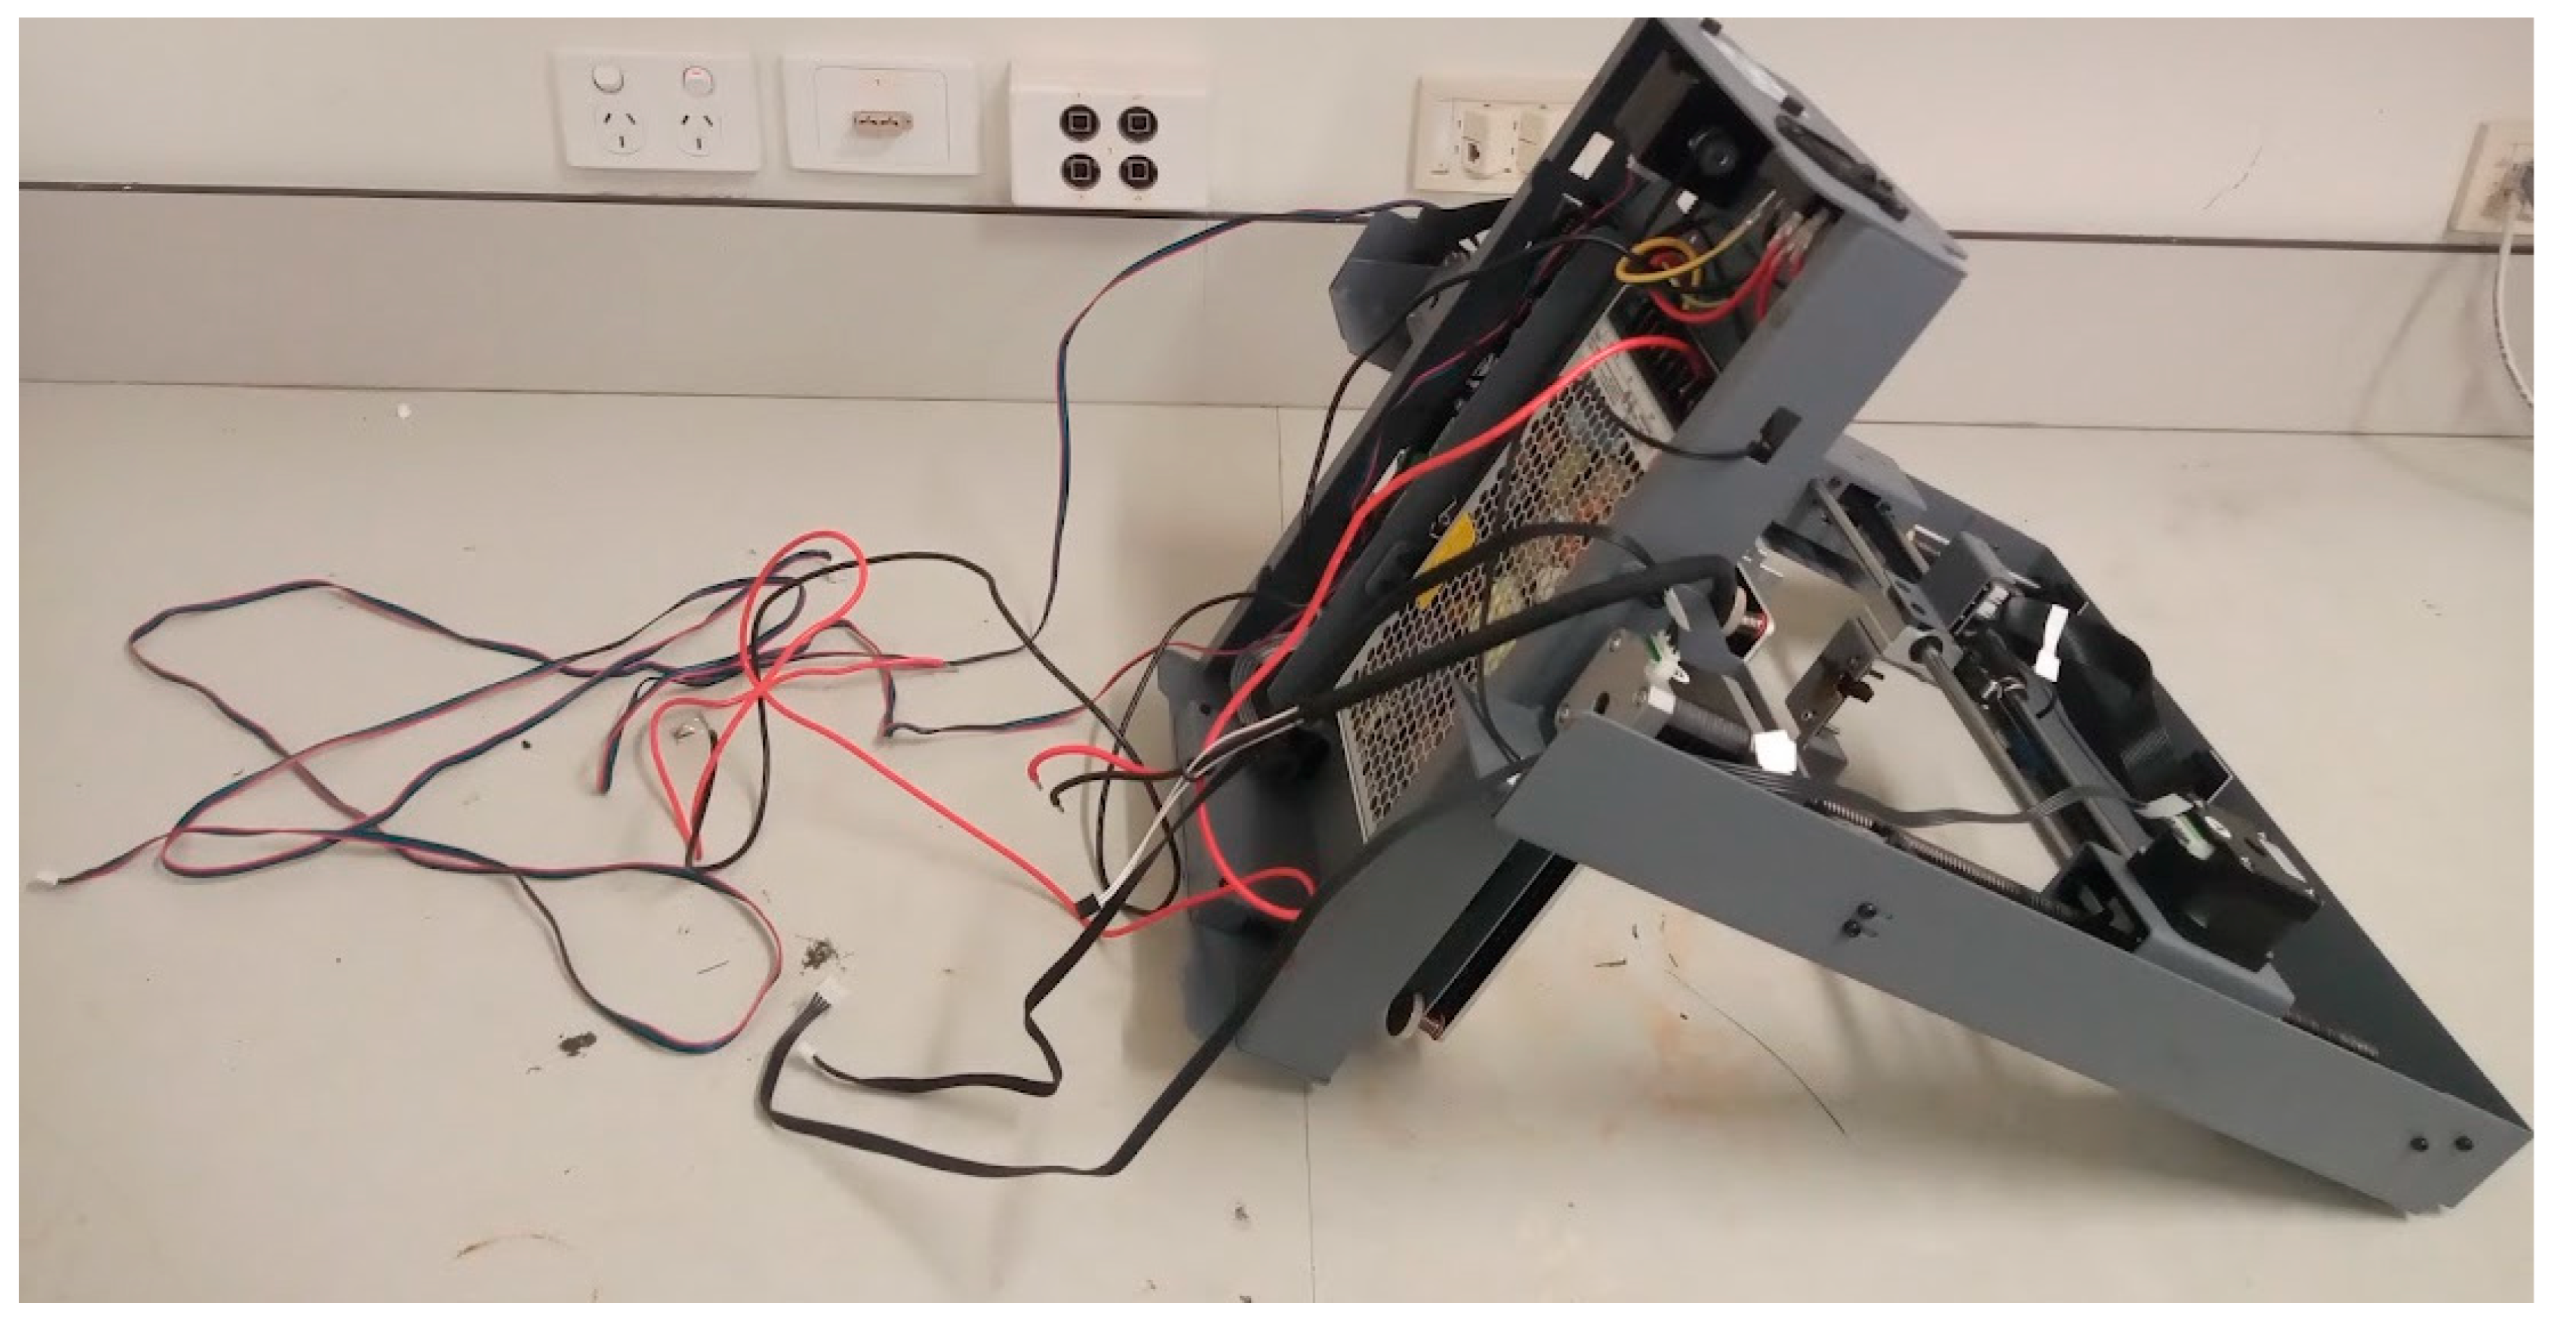
The next steps involve re-wiring the printer so that a different control board is used instead of the one that comes with the printer. By turning the printer upside down and removing the lower cover, the cables become accessible. The cables for the stepper motors, for the heated bed, and for the power supply must be disconnected from the main board (
Figure 4).
Instead of the original control board in the 3D printer, we used the MKS-GEN-L control board because of our familiarity with it [
30,
31,
33,
34]. The board needs to be prepared to be connected to the stepper motors. The first step is to upload the Marlin firmware (download from
https://doi.org/10.17605/OSF.IO/D24EK) to the board. This can be done by using the Arduino IDE (download from
https://www.arduino.cc/en/software). The board needs to be connected to a computer using a USB cable. The configuration parameters used in the firmware were optimized for this specific 3D-printer model. They may need to be modified for different 3D-printer models.
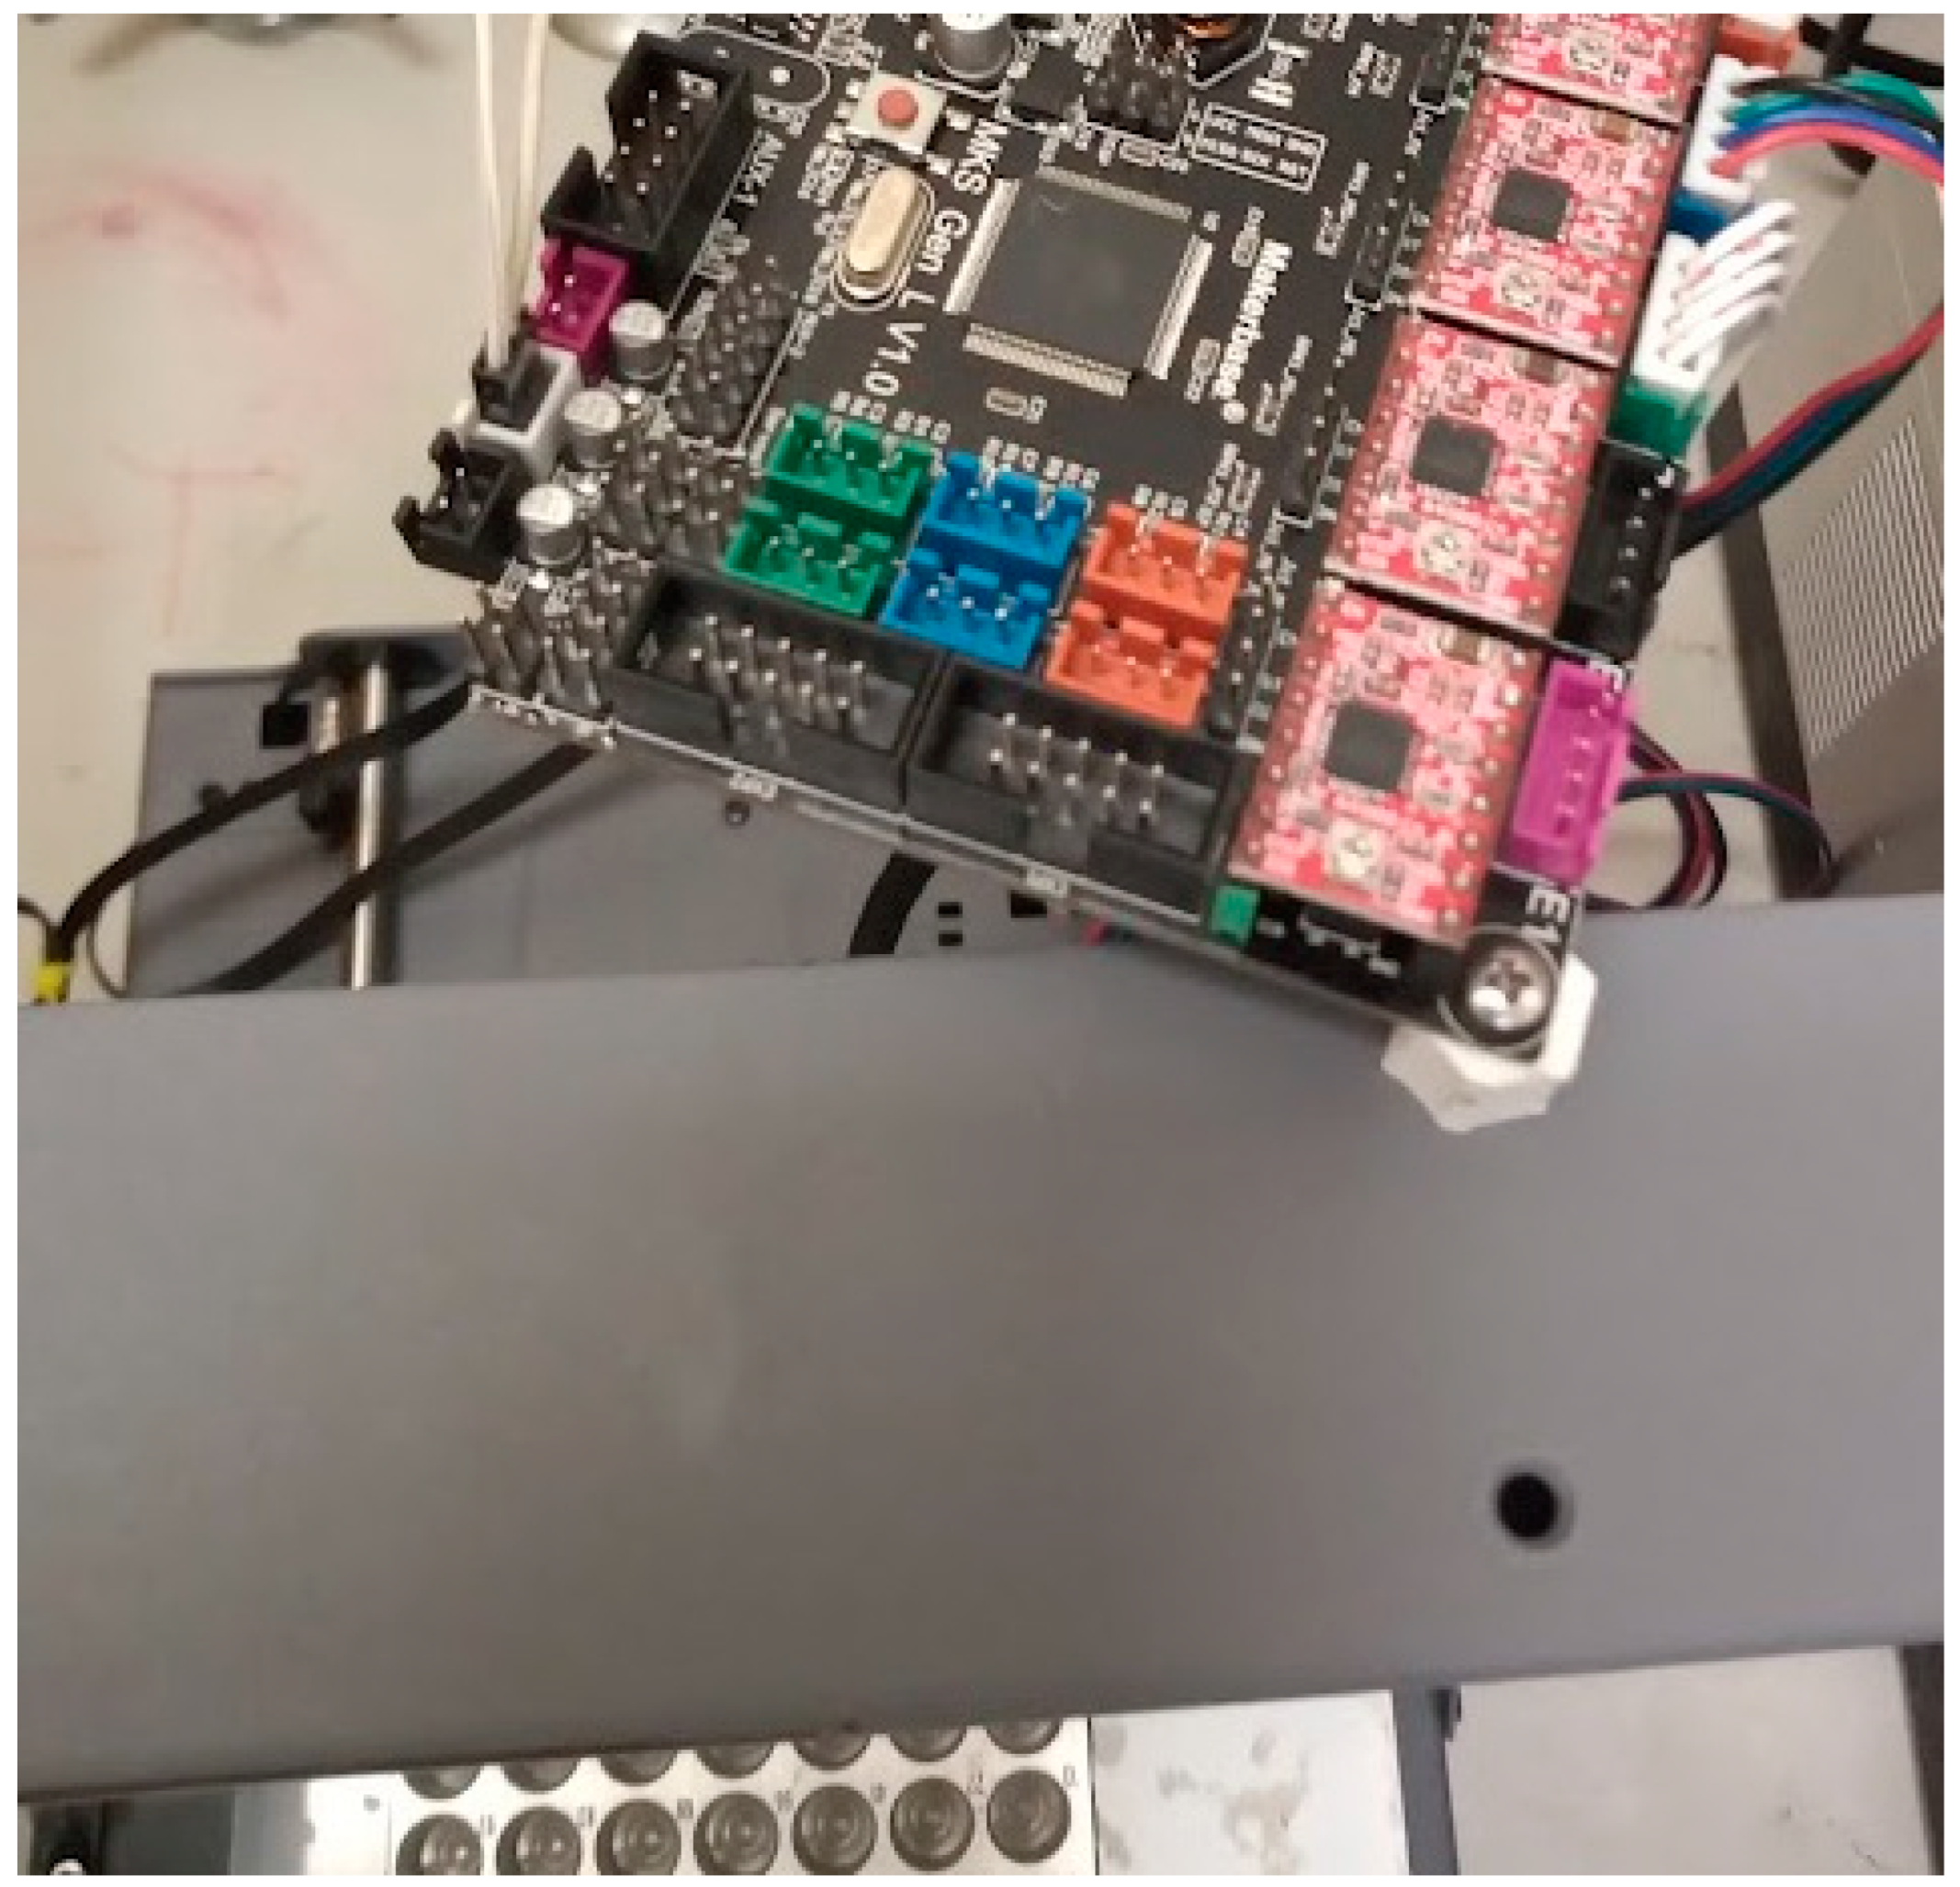
Once the board is disconnected from the computer, the stepper motor drivers can be connected to the board (
Figure 5). Here, A4988 drivers were used.
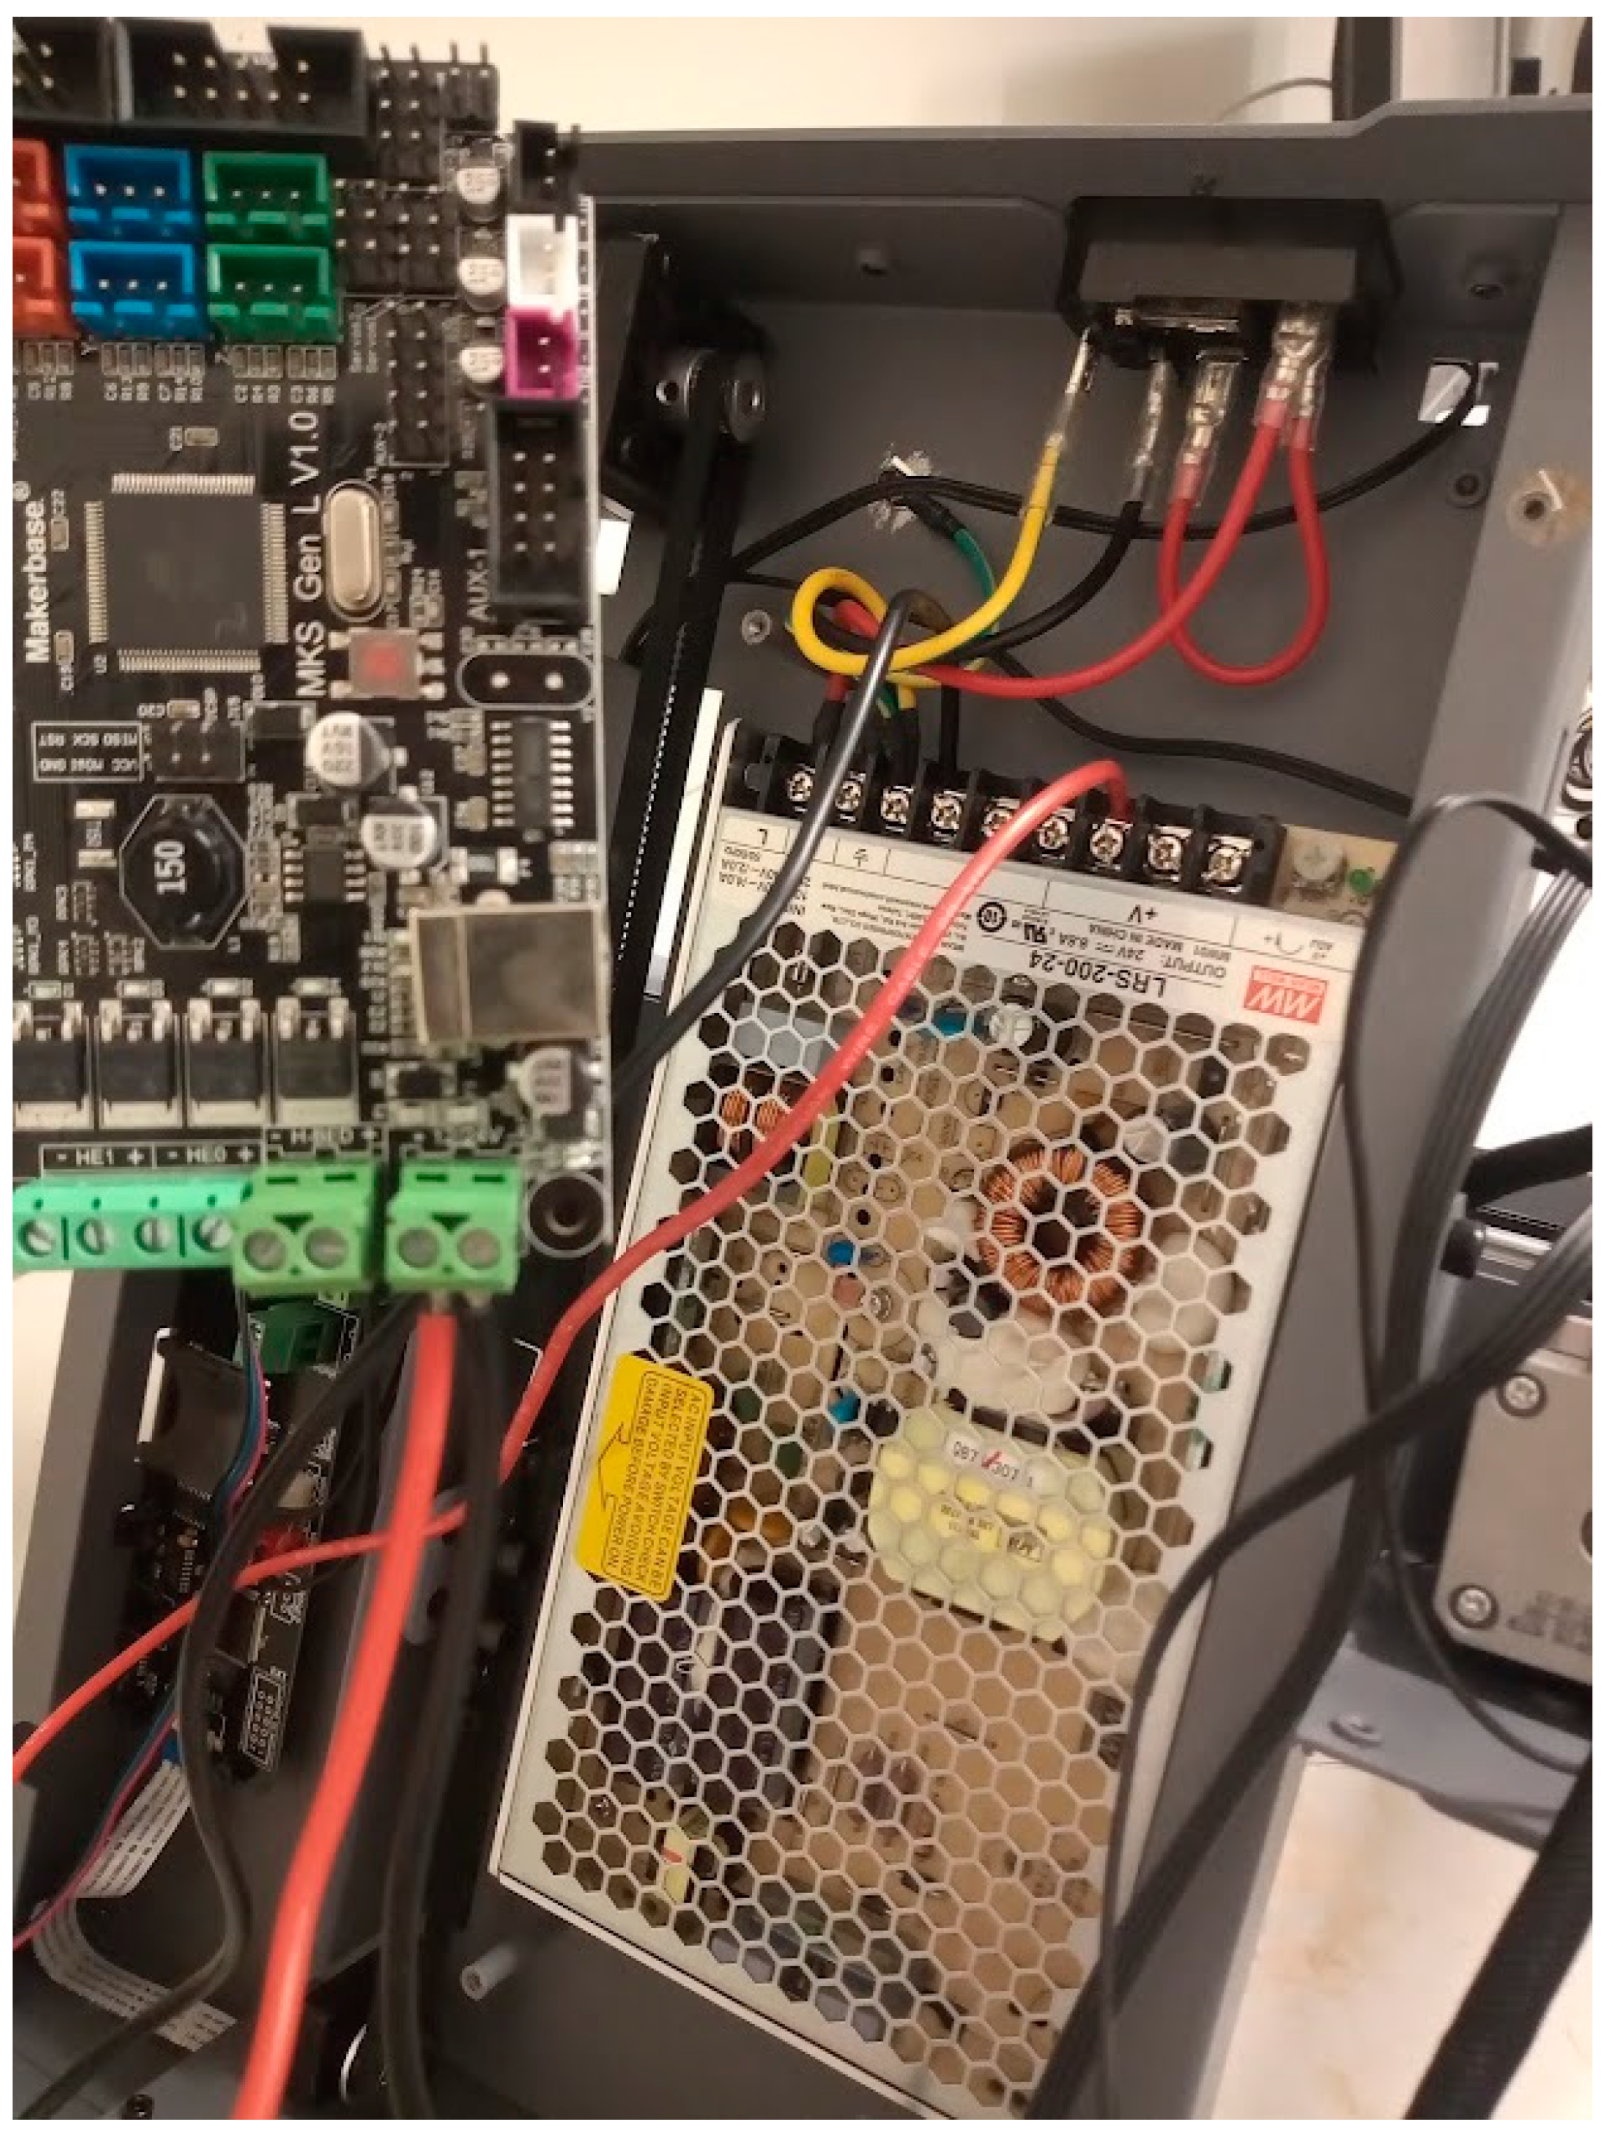
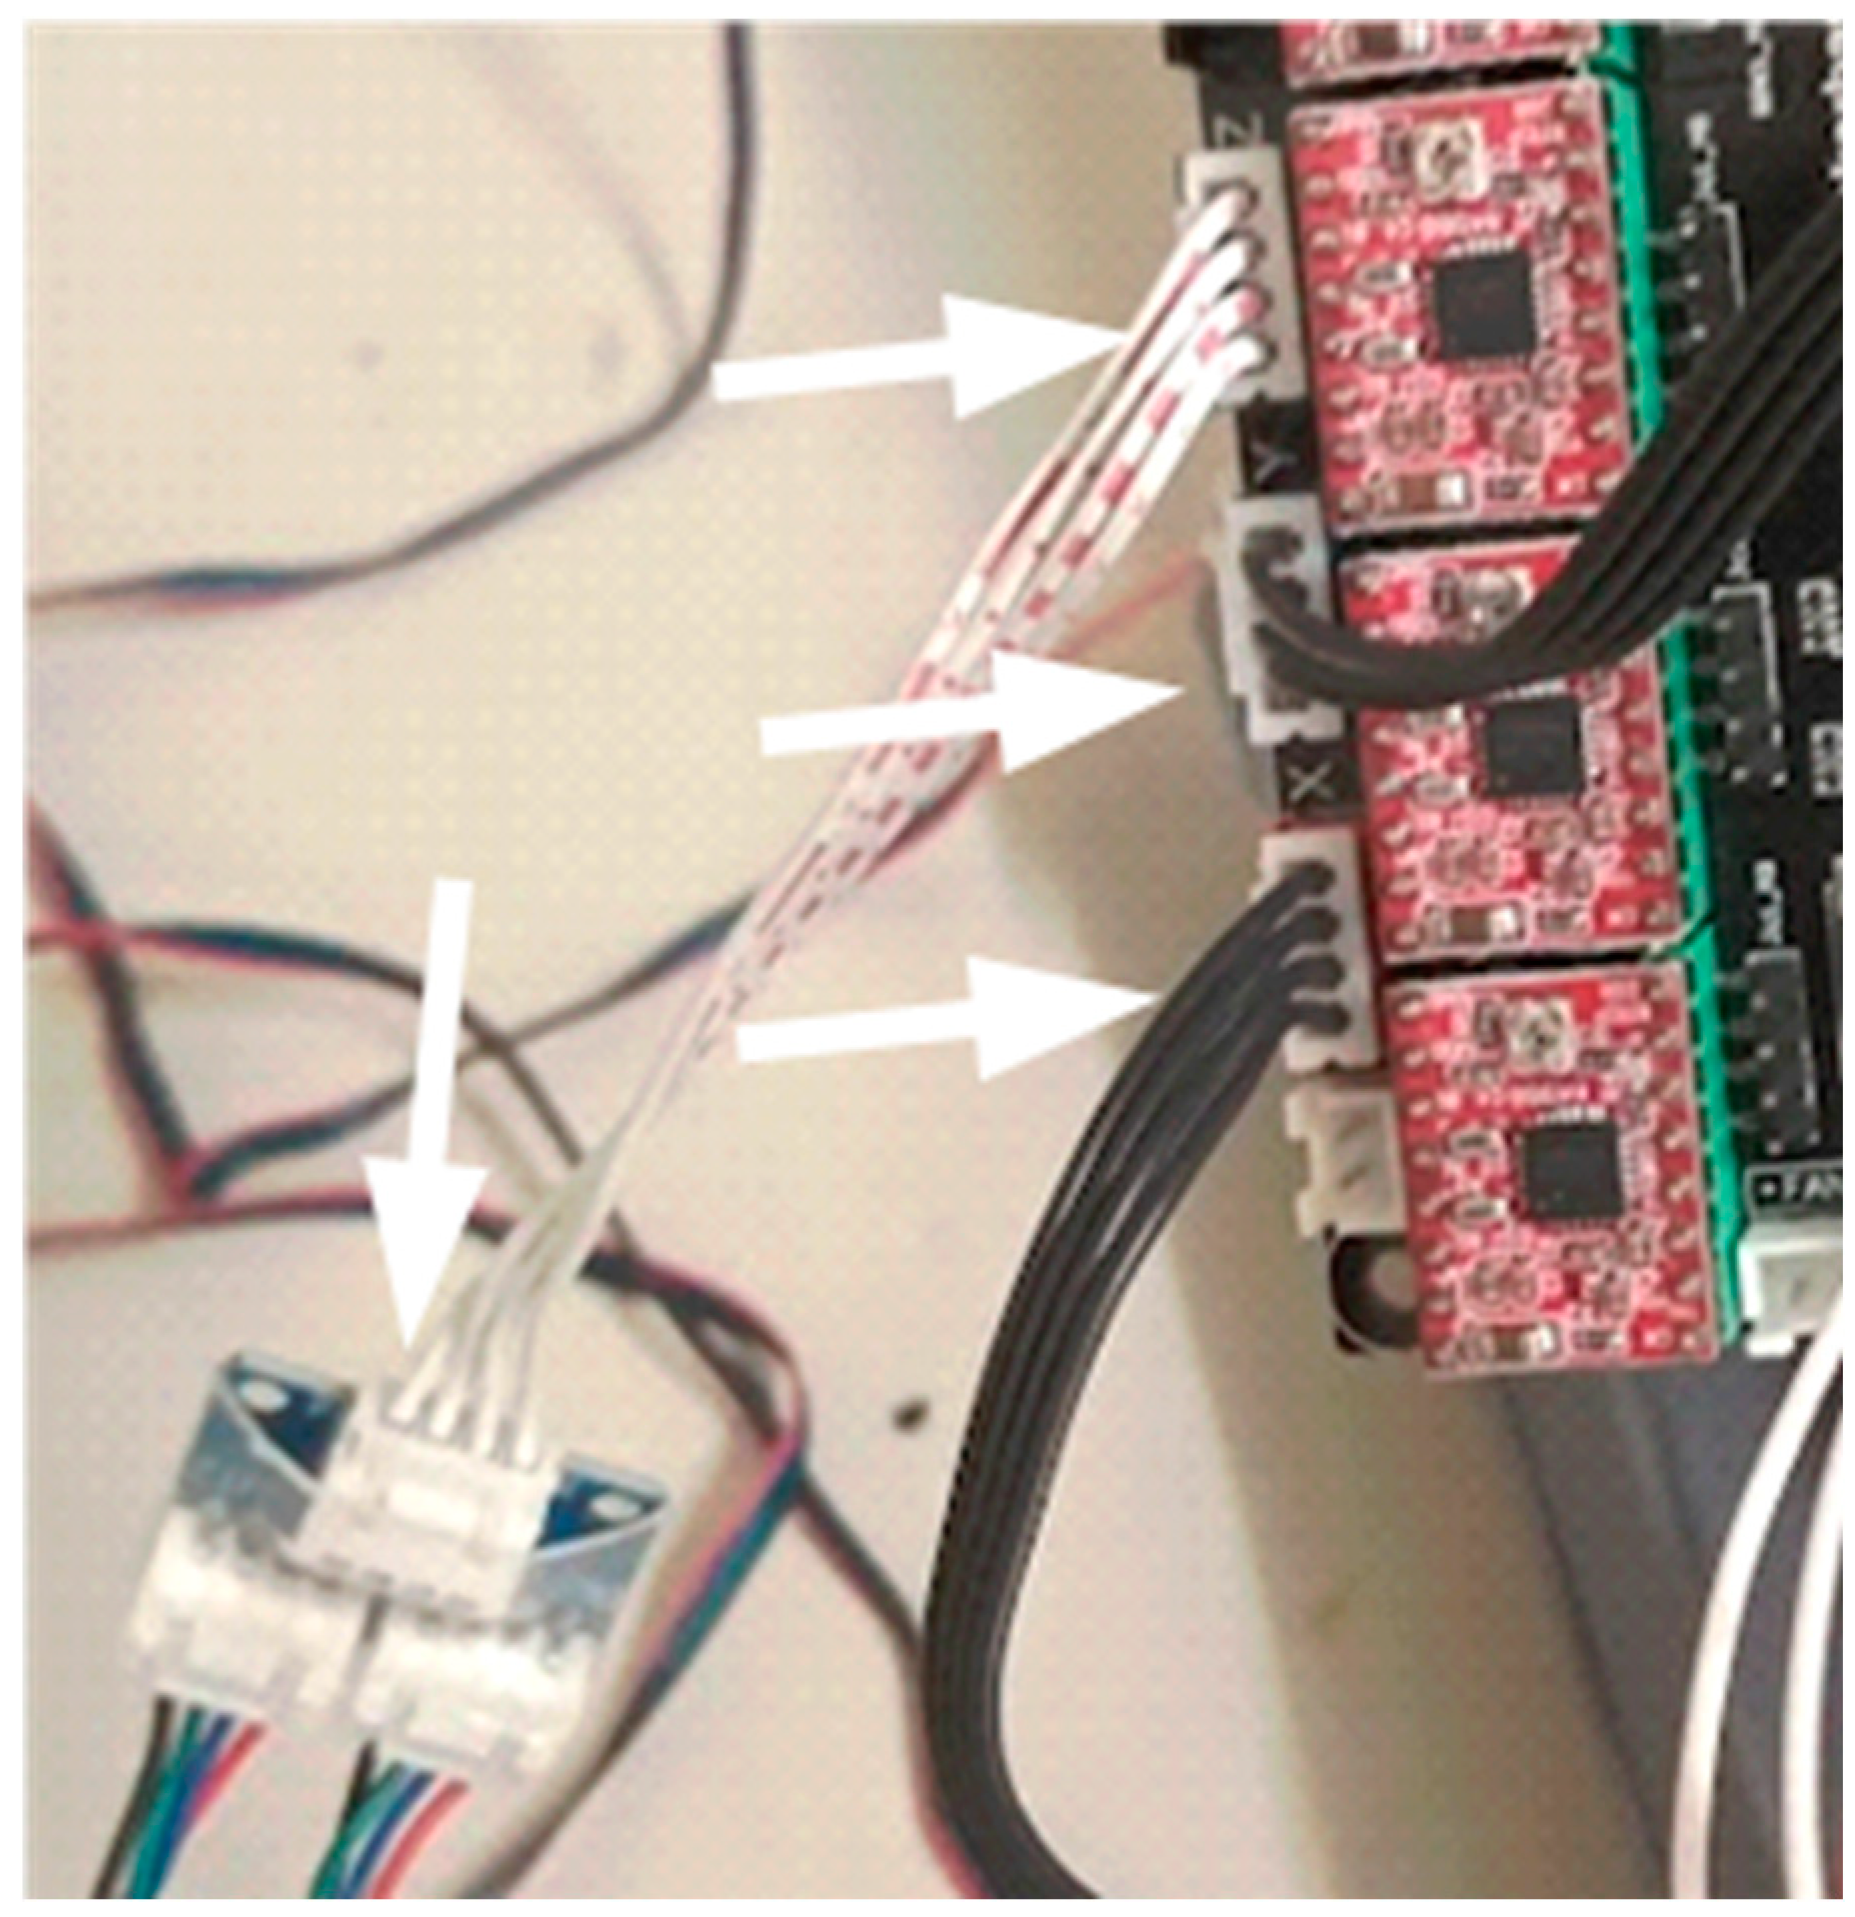
Once the control board is prepared, it can be connected to the power supply, heat bed and stepper motors (
Figure 6,
Figure 7 and
Figure 8). Notice that for the Z axis an adapter (model BT7242A) was used to enable two motors. Different 3D-printer models may need different arrangements.
Once all cable connections are complete, the control board should be attached to the top of the 3D-printer body using a M3 screw, nut, and a spacer (
Figure 9).
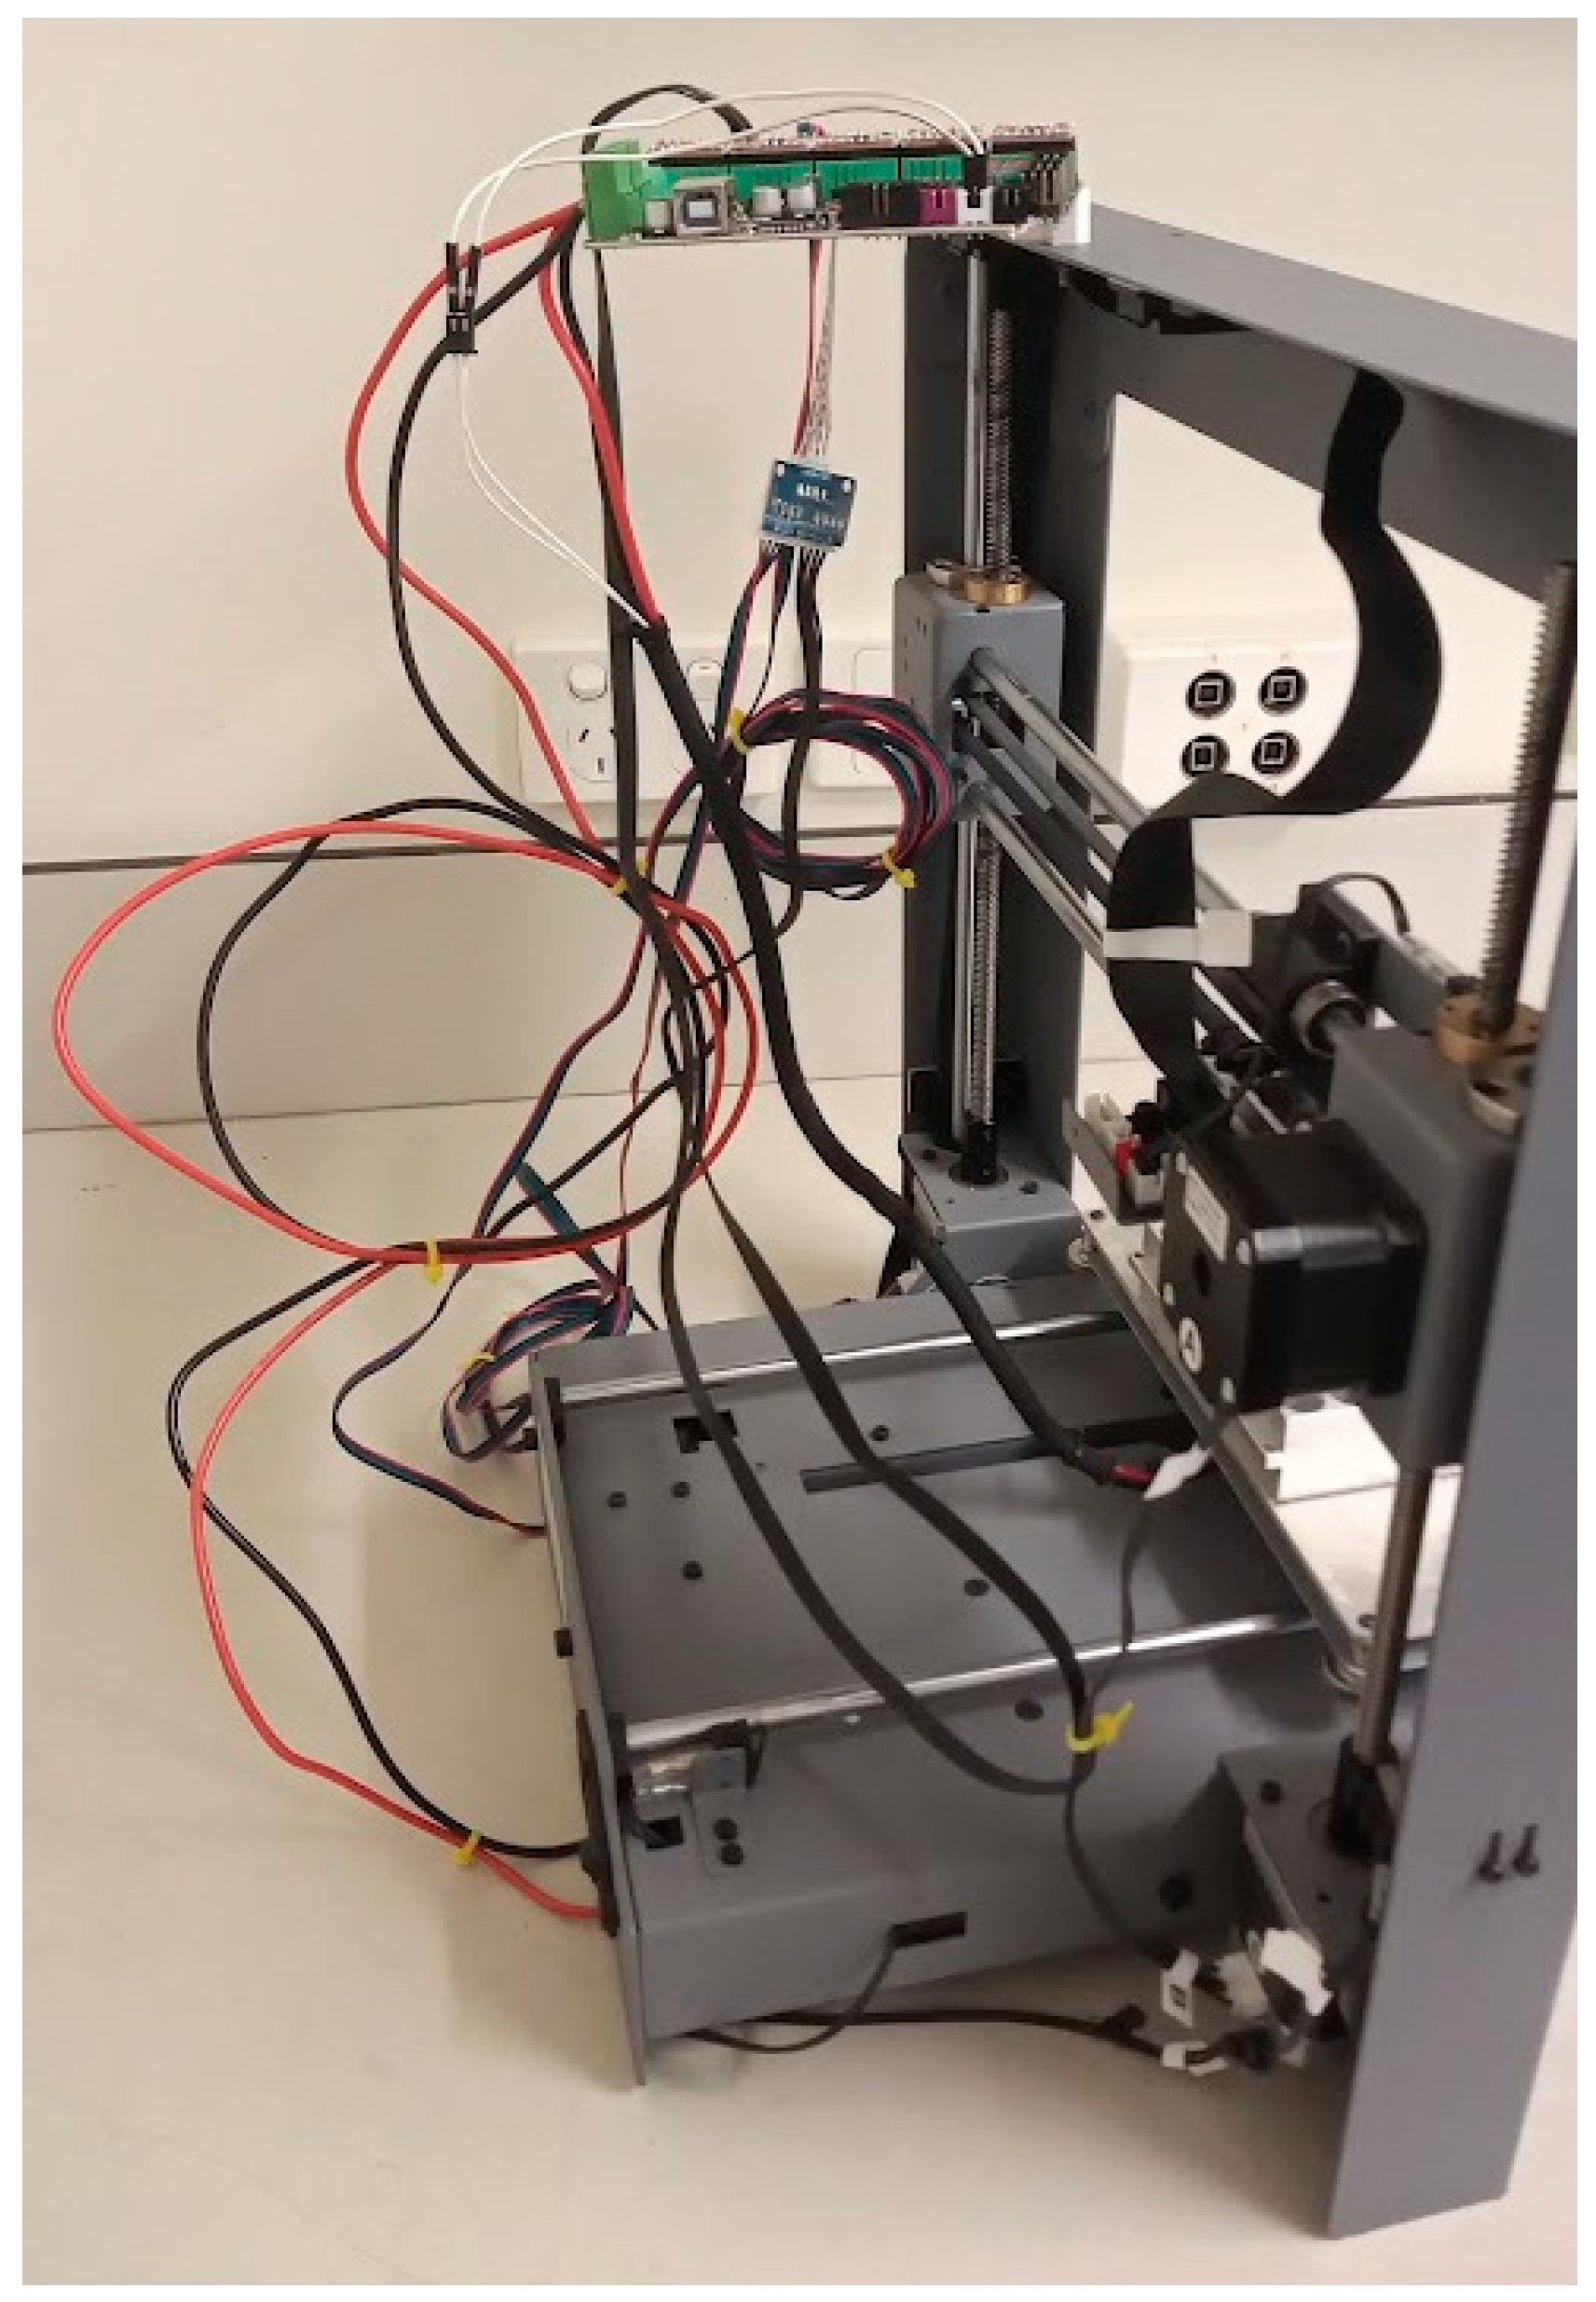
Organize the cables at the back of the 3D-printer paying attention to their possible interference with the path of the moveable parts (
Figure 10). Cable ties are useful for this purpose.
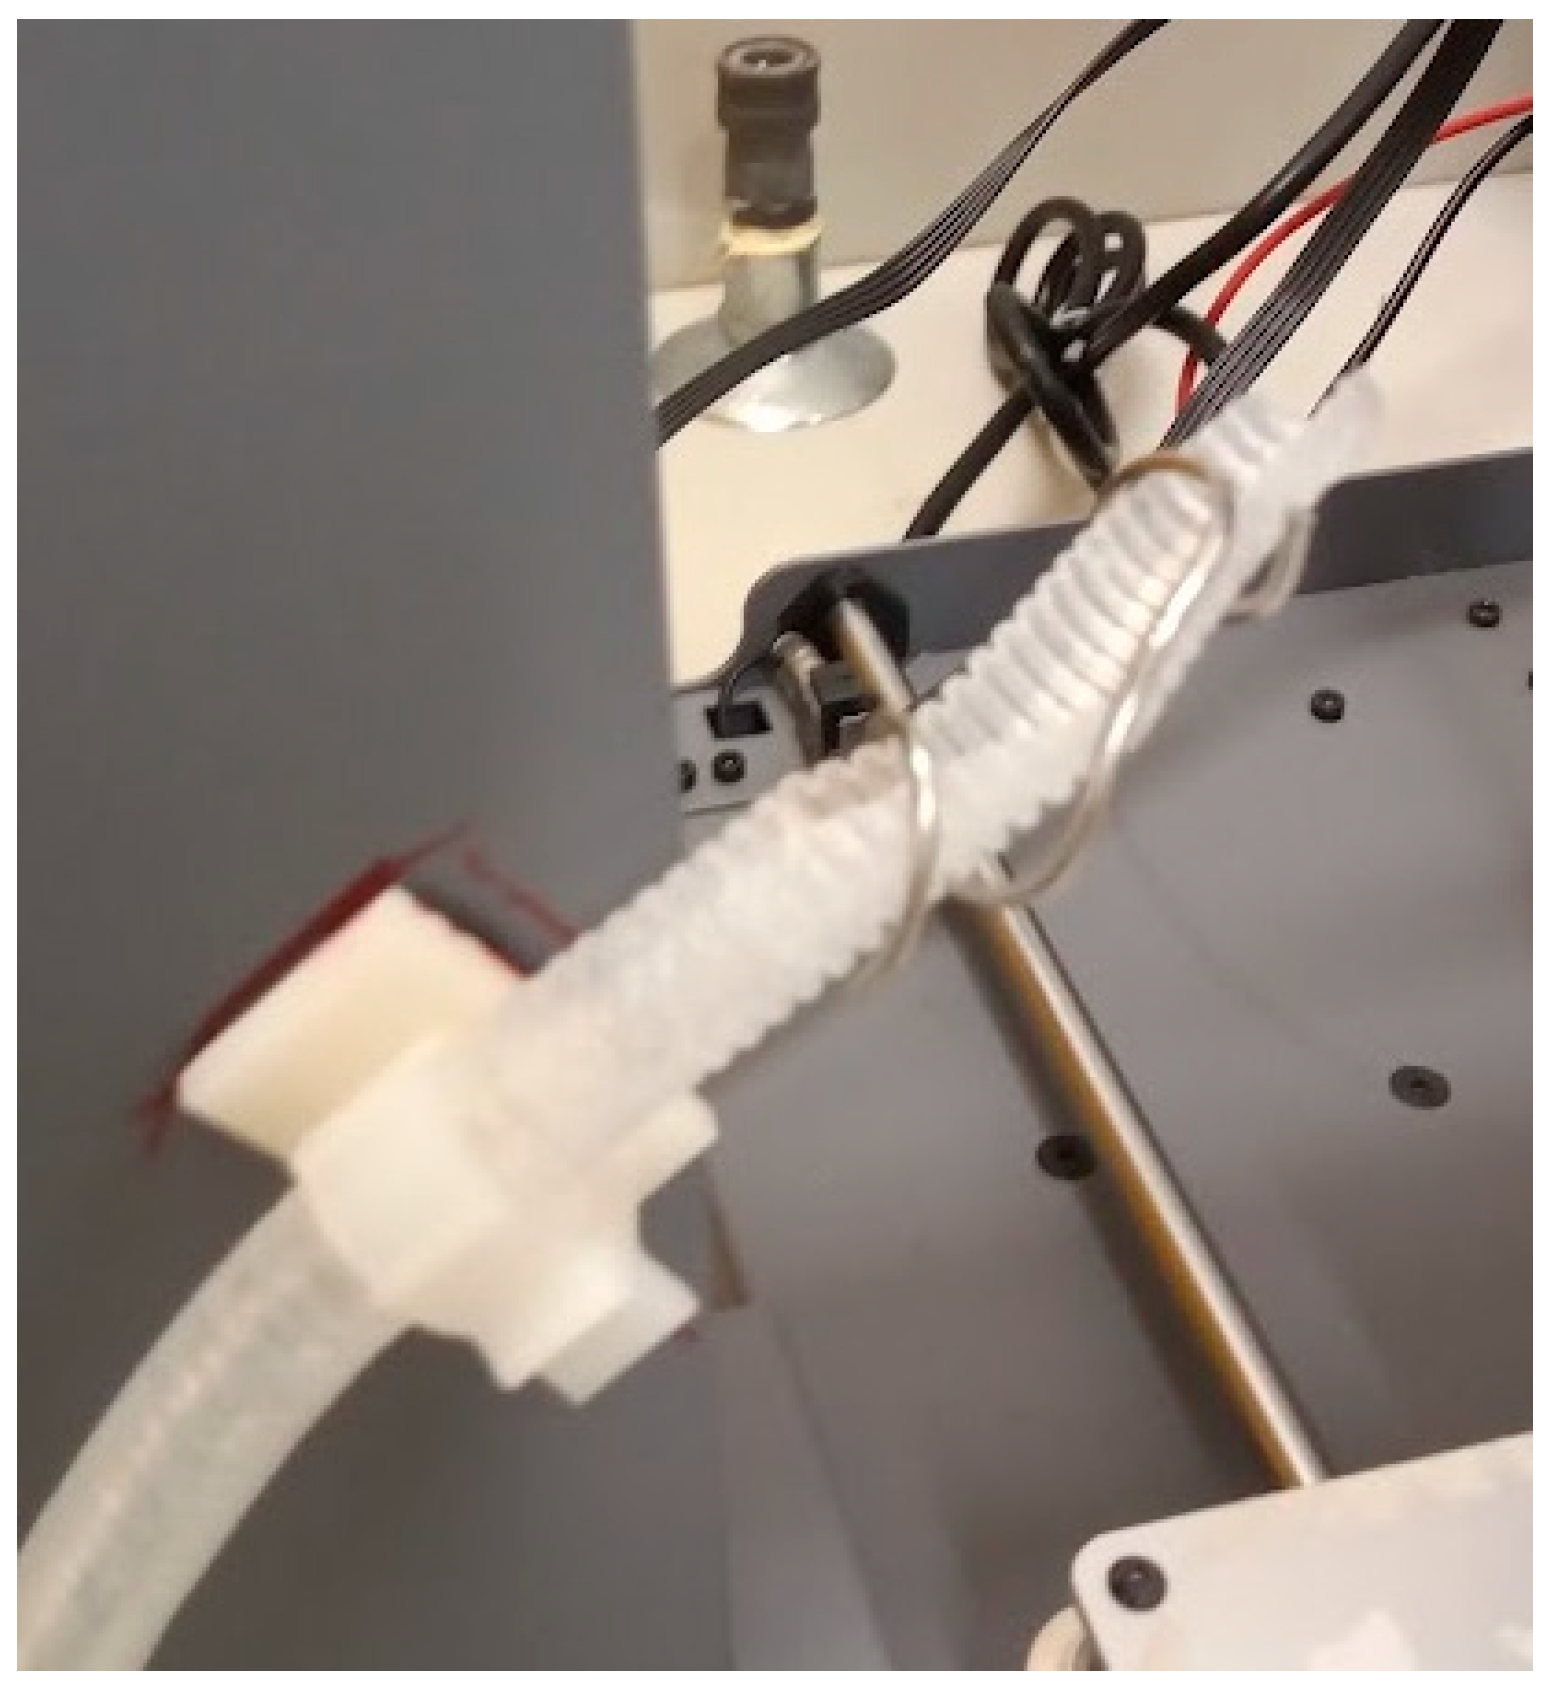
Attach the waste tube to the side of the 3D-printer body (
Figure 11). It must be in a position that can be reached by the tube holder that will support the HPLC delivery line, but not on top of the tray where the samples will be collected. In our configuration, the tube was cut in half to allow dripping from above and held in place using a metal tube. Using a waste tube connected to a waste drum allows for line purging and the discarding of undesired eluents.
Attach the delivery line from the HPLC to the tube holder on the 3D-printer (
Figure 12). A portion of the tube (about 3 mm) should hang beneath the holder so that the water dripping falls without interference from the holder. The delivery line should be as short as possible to minimize dispersion of the HPLC eluents before collection.
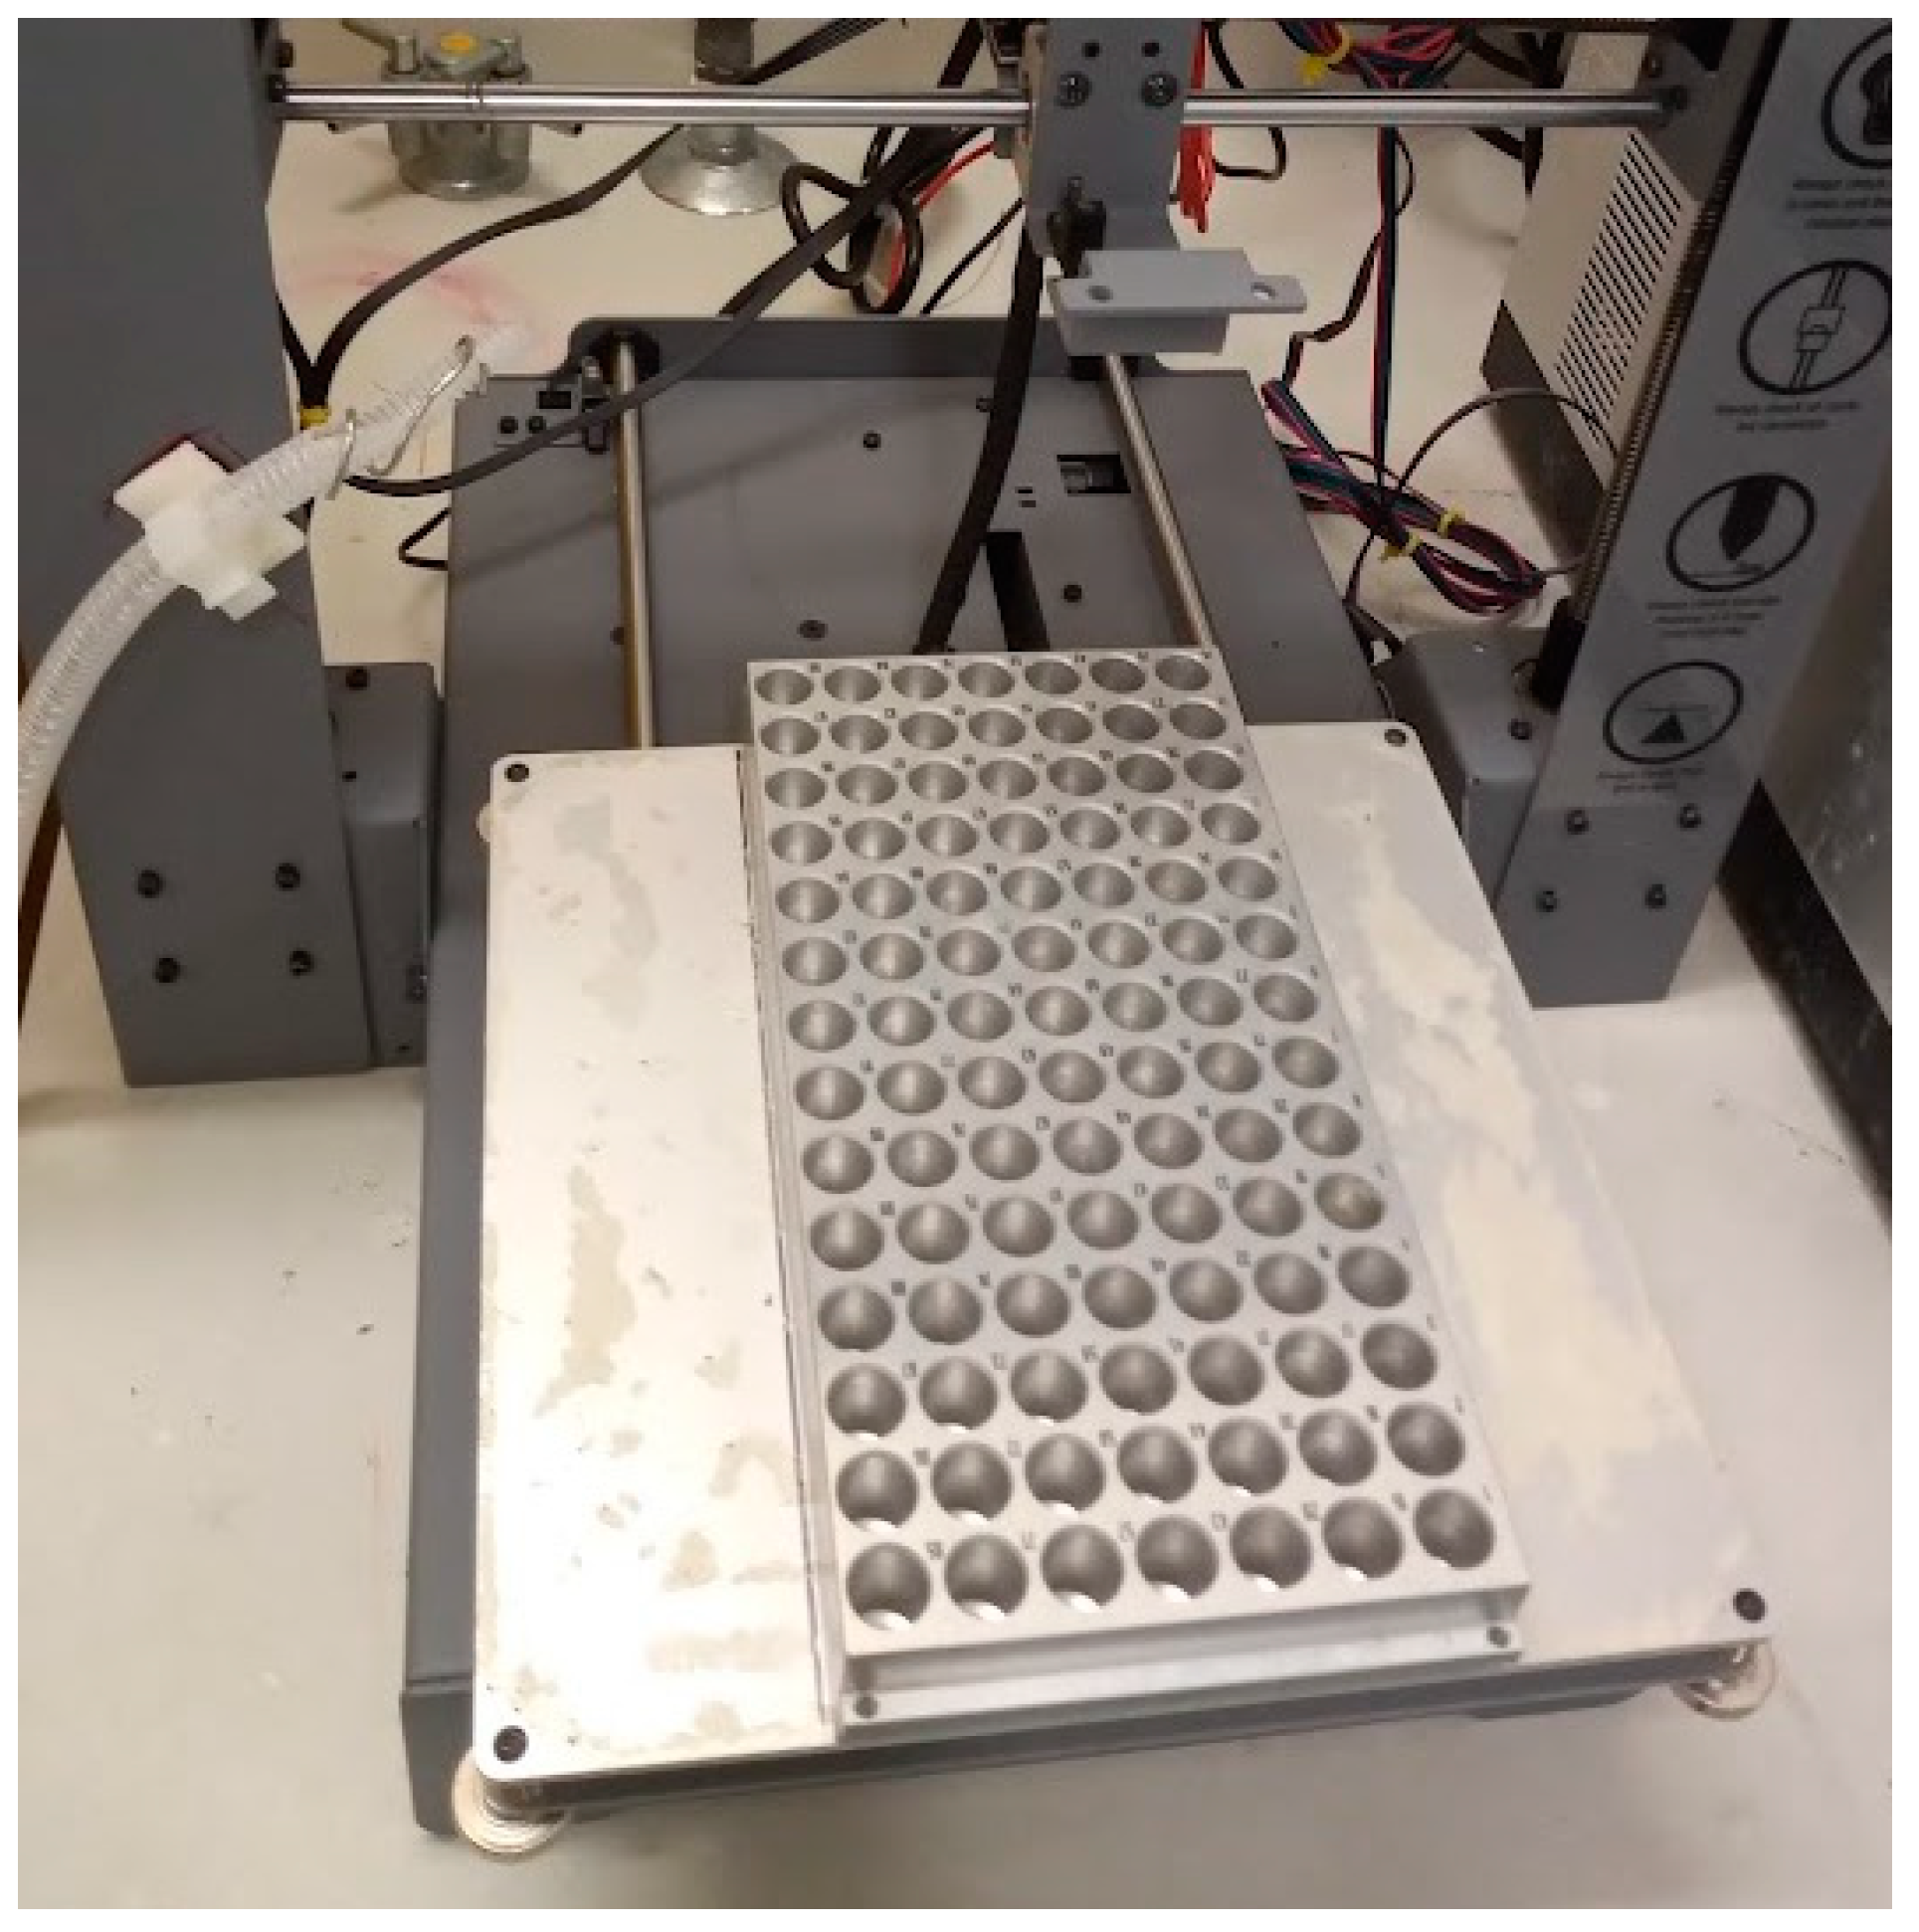
Once the fraction collector is assembled, the sample tray can be loaded with tin (PN SC9428, Sercon) or silver (PN SC1295, Sercon) capsules (
Figure 13). Silver capsules are needed if the eluent is corrosive. The capsule size (6 mm x 9 mm in diameter) was chosen to match the tray. A different tray would demand a different tin capsule size.
The control board is connected to the computer, and the power supply to the wall. When the power is turned on, the fraction collector will be ready to use. Of course, in addition to the fraction collector preparation, the HPLC system should also be prepared in accordance with the protocols used for the separation to be performed.
Finally, because the procedure takes many hours (often more than a full day) to complete, it is important that contamination (e.g. dust) is avoided. The system should be placed in a clean and quiet place, in a closed room, preferably with air conditioning.
4. Operating Instructions
4.1. Control board preparation
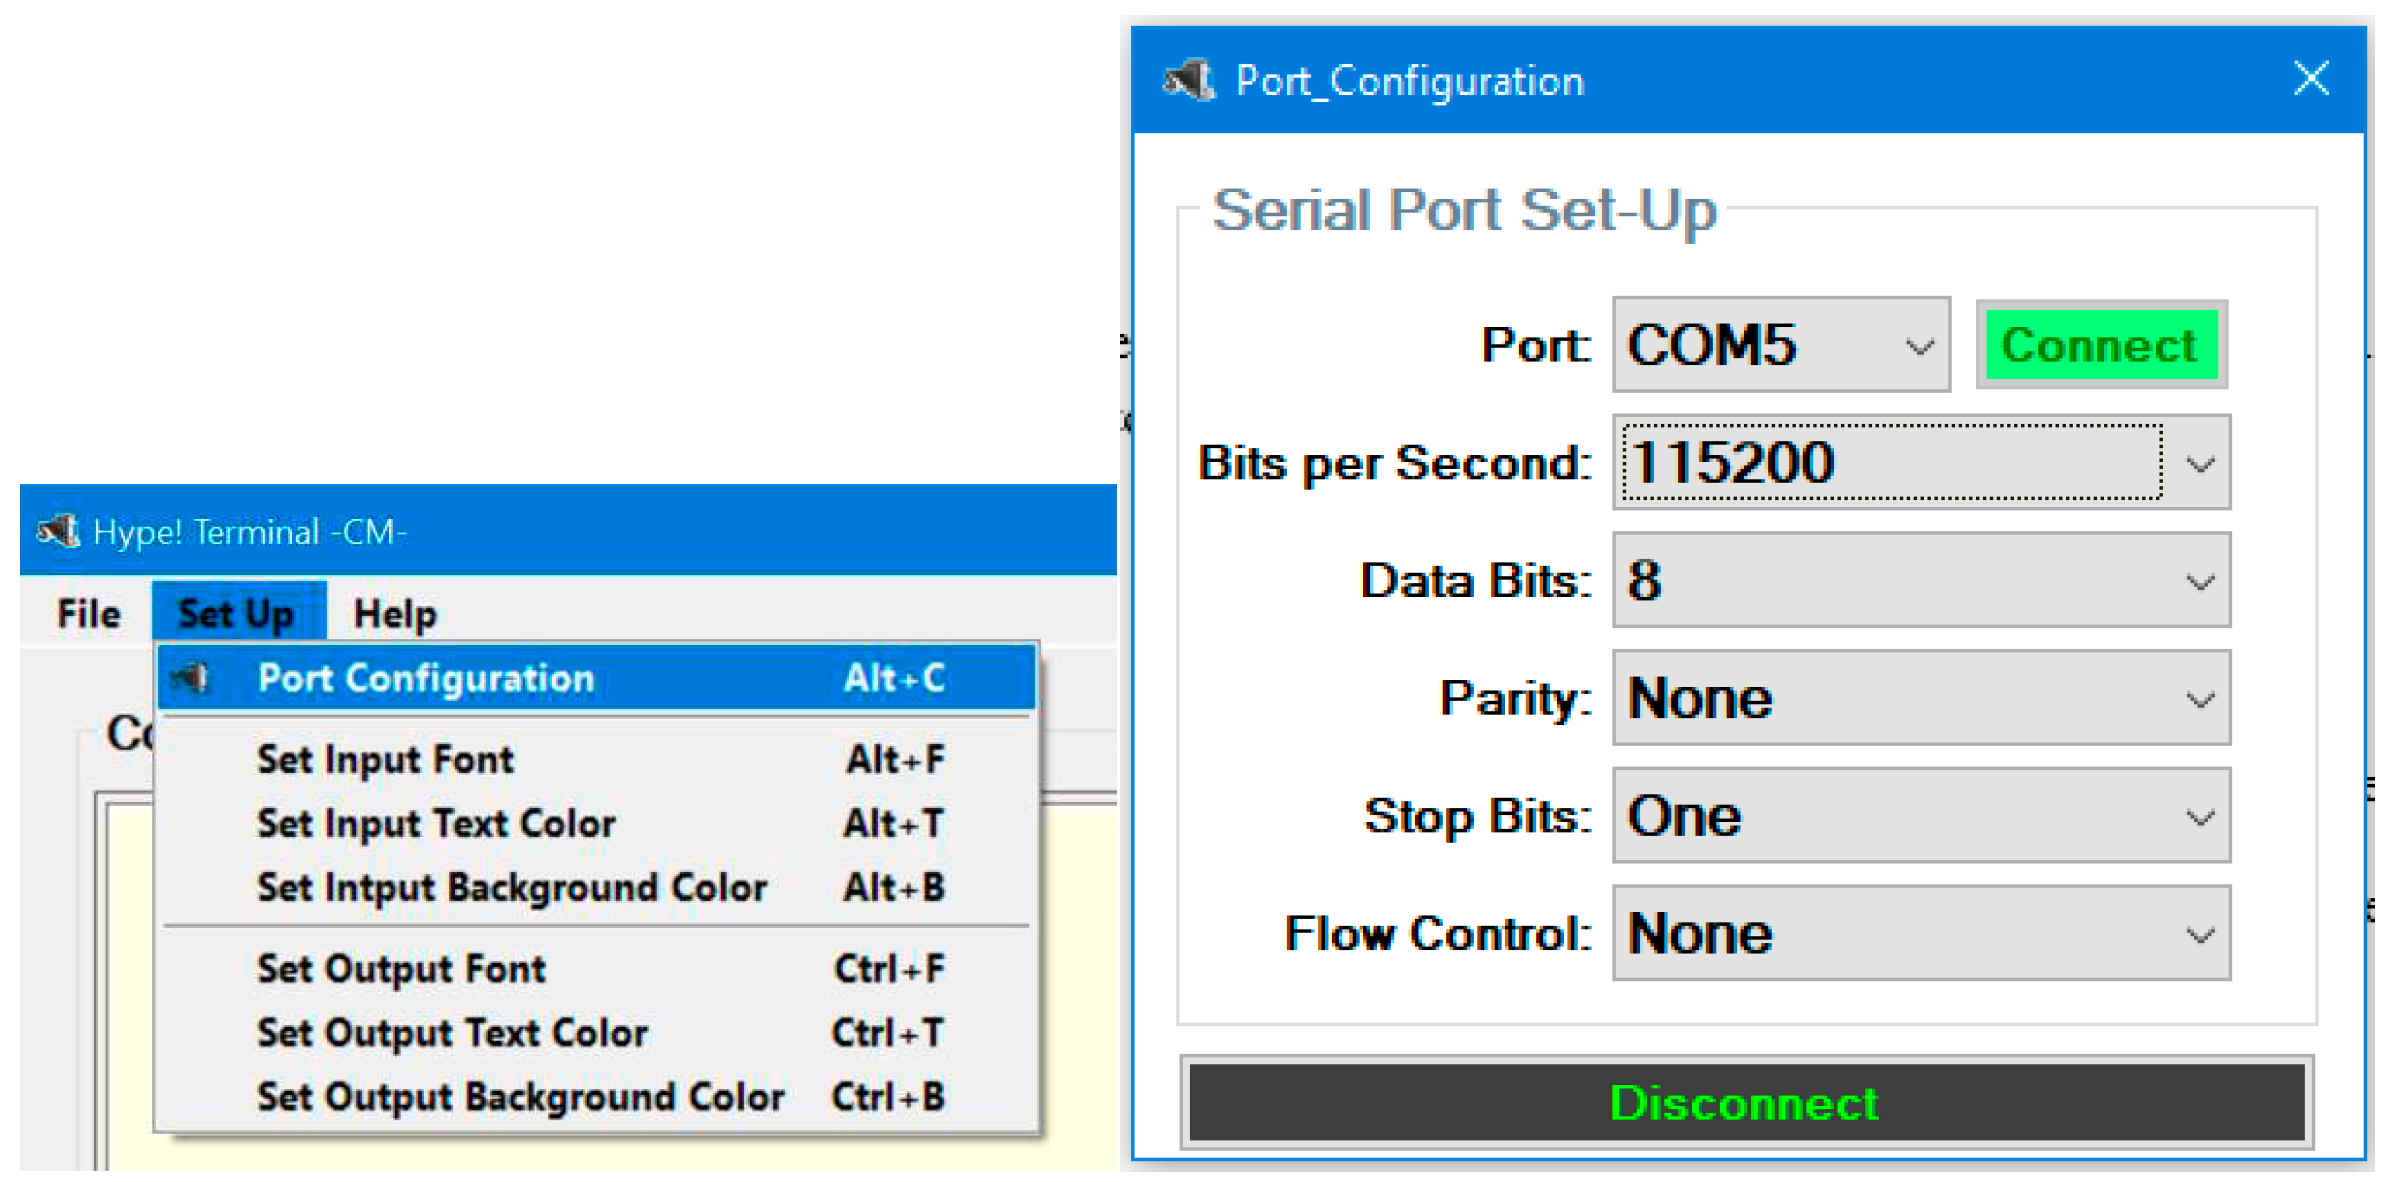
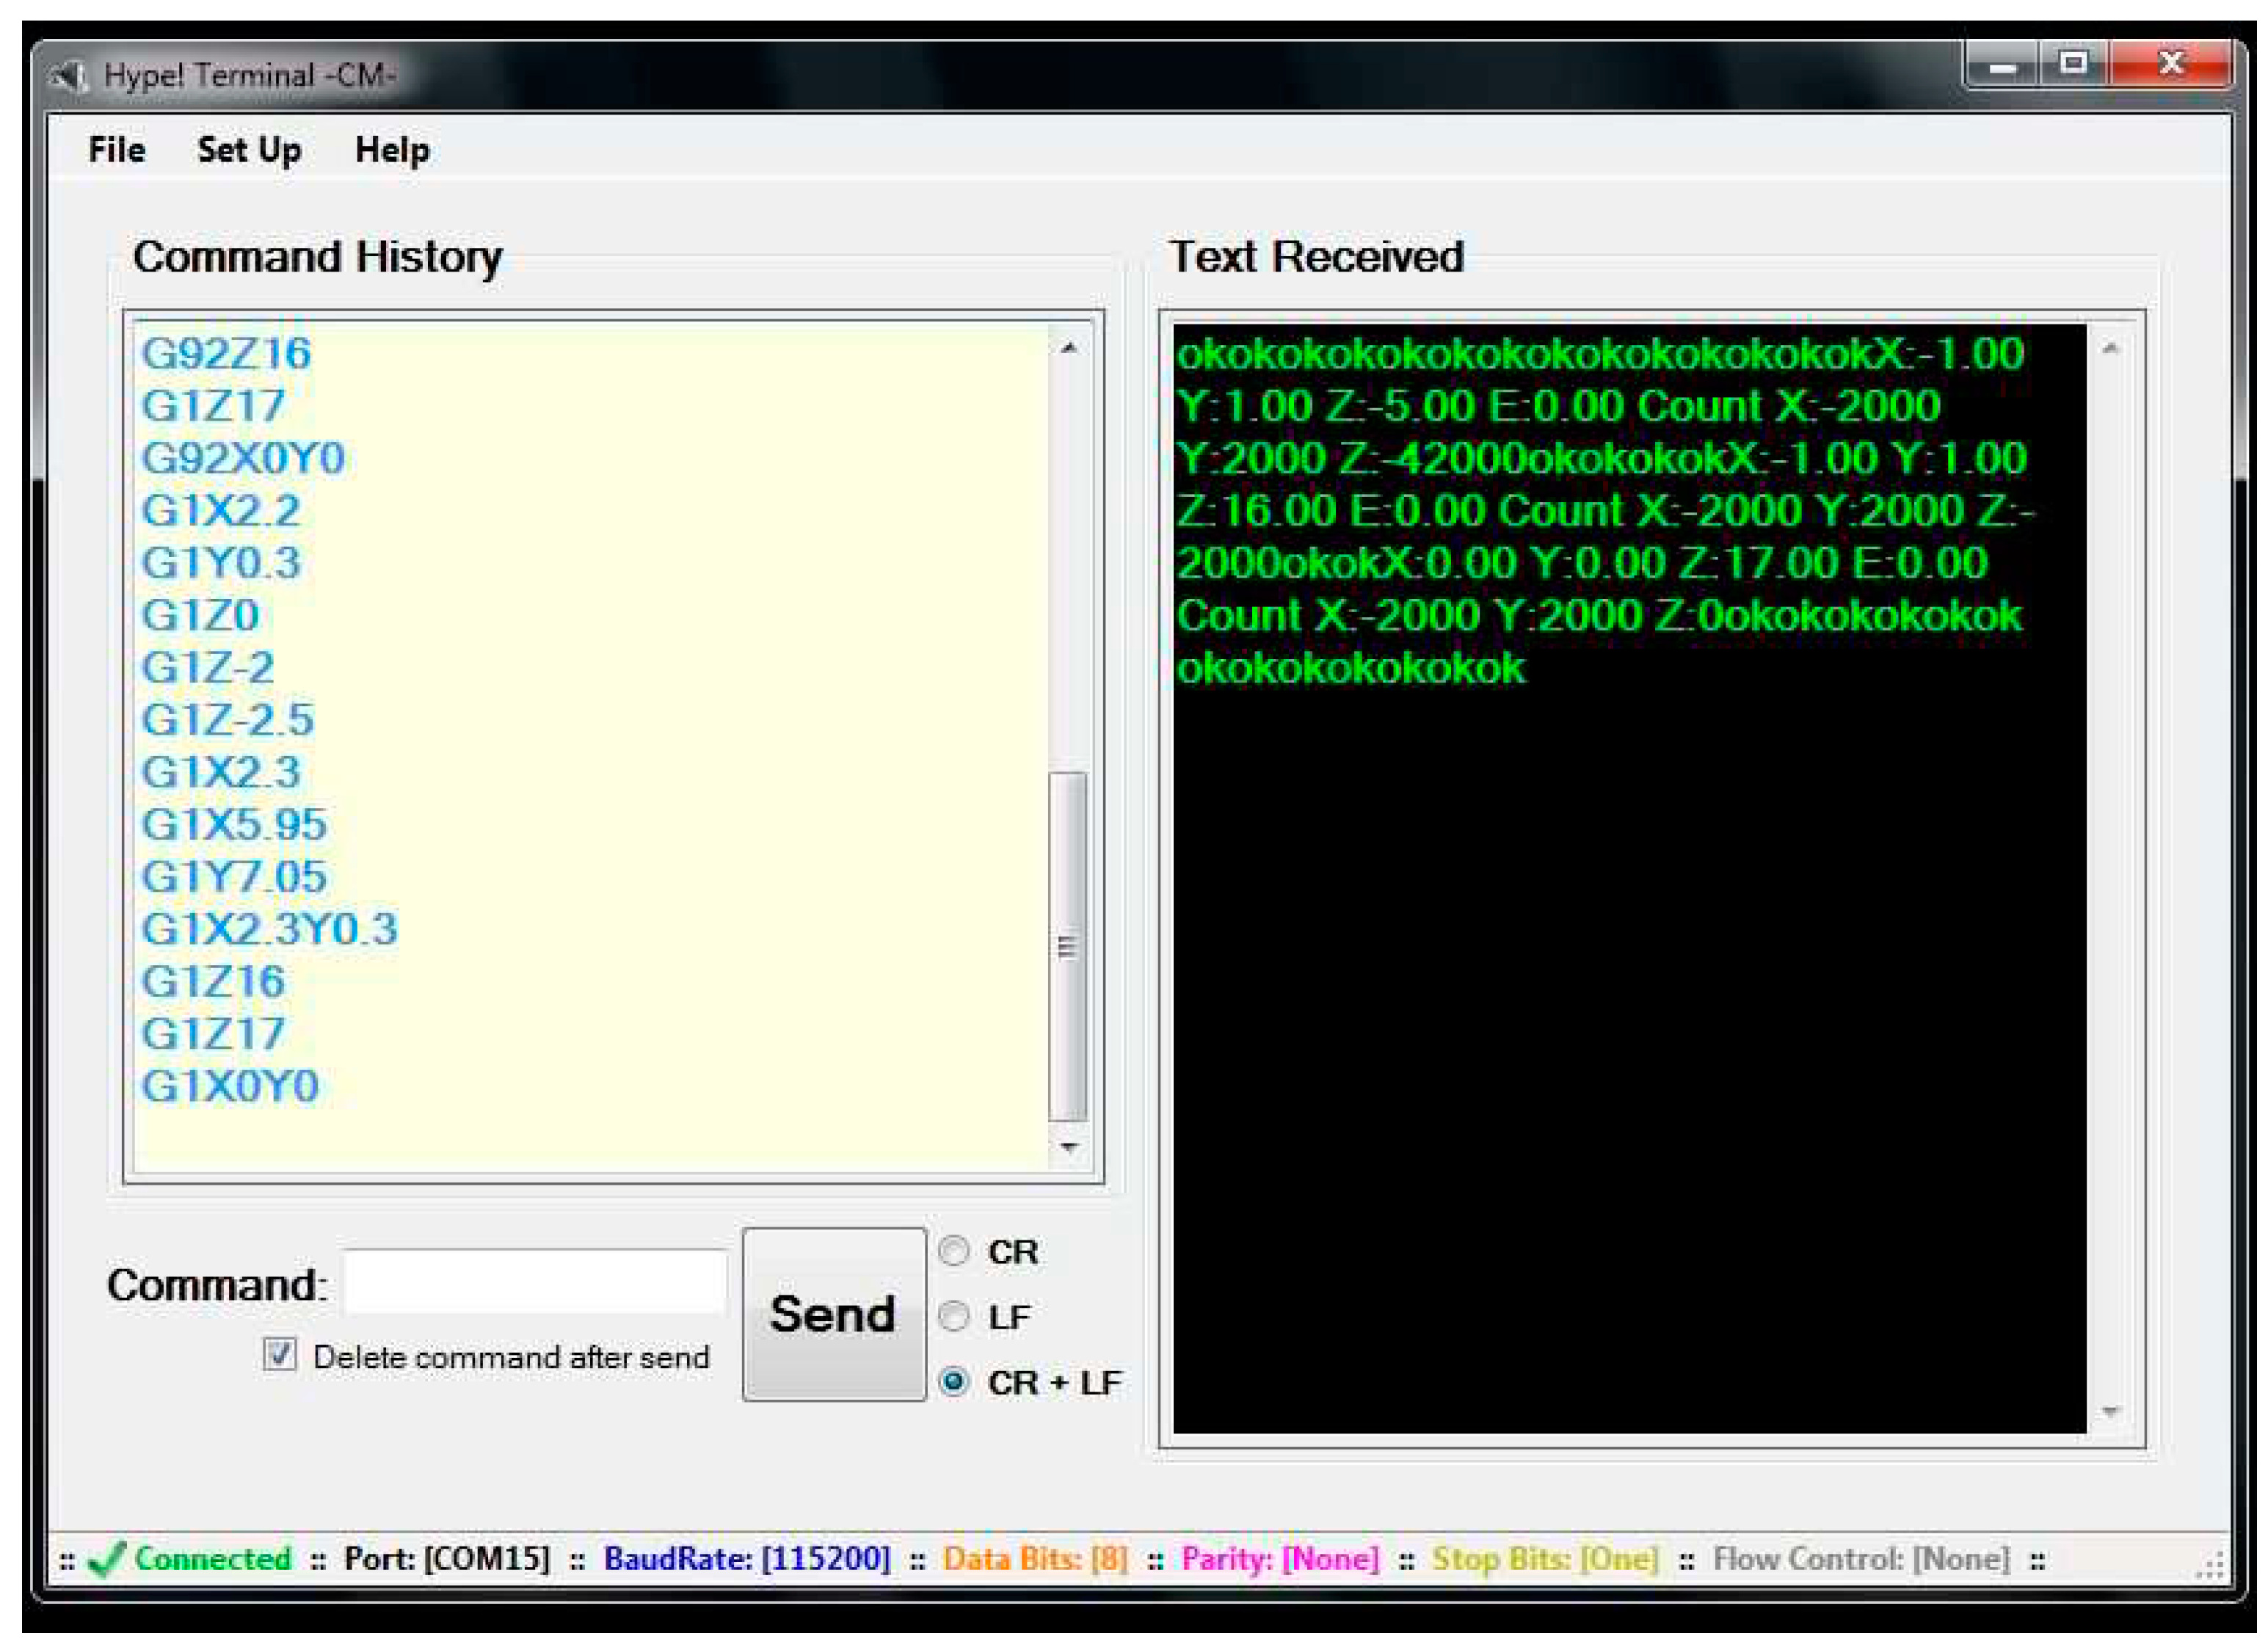
The fraction collector was controlled using the Hype!Terminal program (
https://doi.org/10.17605/OSF.IO/D24EK), which allows commands to be sent through COM ports (including USB, which connects the control board to the computer).
The first action when launching Hype!Terminal is to configure the COM port (
Figure 14). Most parameters in the configuration do not need to be changed, except for the port number and the BAUD rate (bits per second). The port number needs to be known previously (e. g., by checking the Device Manager utility on the Windows Operating System). Bits per second need to be changed to 115200.
Once the connection with the board is established, the command “M121” must be sent to allow the use of negative coordinates when sending commands to the stepper motors. This and the COM port configuration need to be done every time the program is started.
4.2. Basic commands
Once the control board is connected and negative coordinates can be used, the fraction collector can be controlled from the computer using Hype!Terminal. Movements are achieved using the command G1. For example, G1X1F500 moves the HPLC tube horizontally 1 unit with 500 speed units. G1Z2F500 moves it vertically 2 units. G1Y3F500 moves the heat bed (and consequently the tray) 3 units. More than a single axis can be used as input at any given time. For example, the command G1X3Y4F500 will move the HPLC tube and the tray simultaneously. The command M114 can be used to verify the current position. If it is desired that the current position becomes zero, the command is G92. For example, G92X0Y0Z0 forces all axes to have the value of zero.
The heat bed can be warmed using the command M140. Using M140S80 will warm the bed to 80oC. It is useful to preheat the sample tray, as it can take some minutes to reach the final temperature. To turn off the heat bed, use M140S0.
4.3. Determining important positions
Stepper motors do not use absolute positioning, but instead rely on positions that are relative to arbitrary origin points. When the board is connected, it assumes all positions (X, Y and Z) are equal to zero. It is, therefore, possible to determine all other relevant positions in relation to any initial position. However, it is more convenient to start from an easily reproducible position so that the other positions do not need to be redefined every time the machine is started. Here, the zero positions were determined as the leftmost possible position for X, the frontmost position for Y, and an arbitrary height for Z, at which the HPLC tube can move without touching the waste tube (
Figure 15).
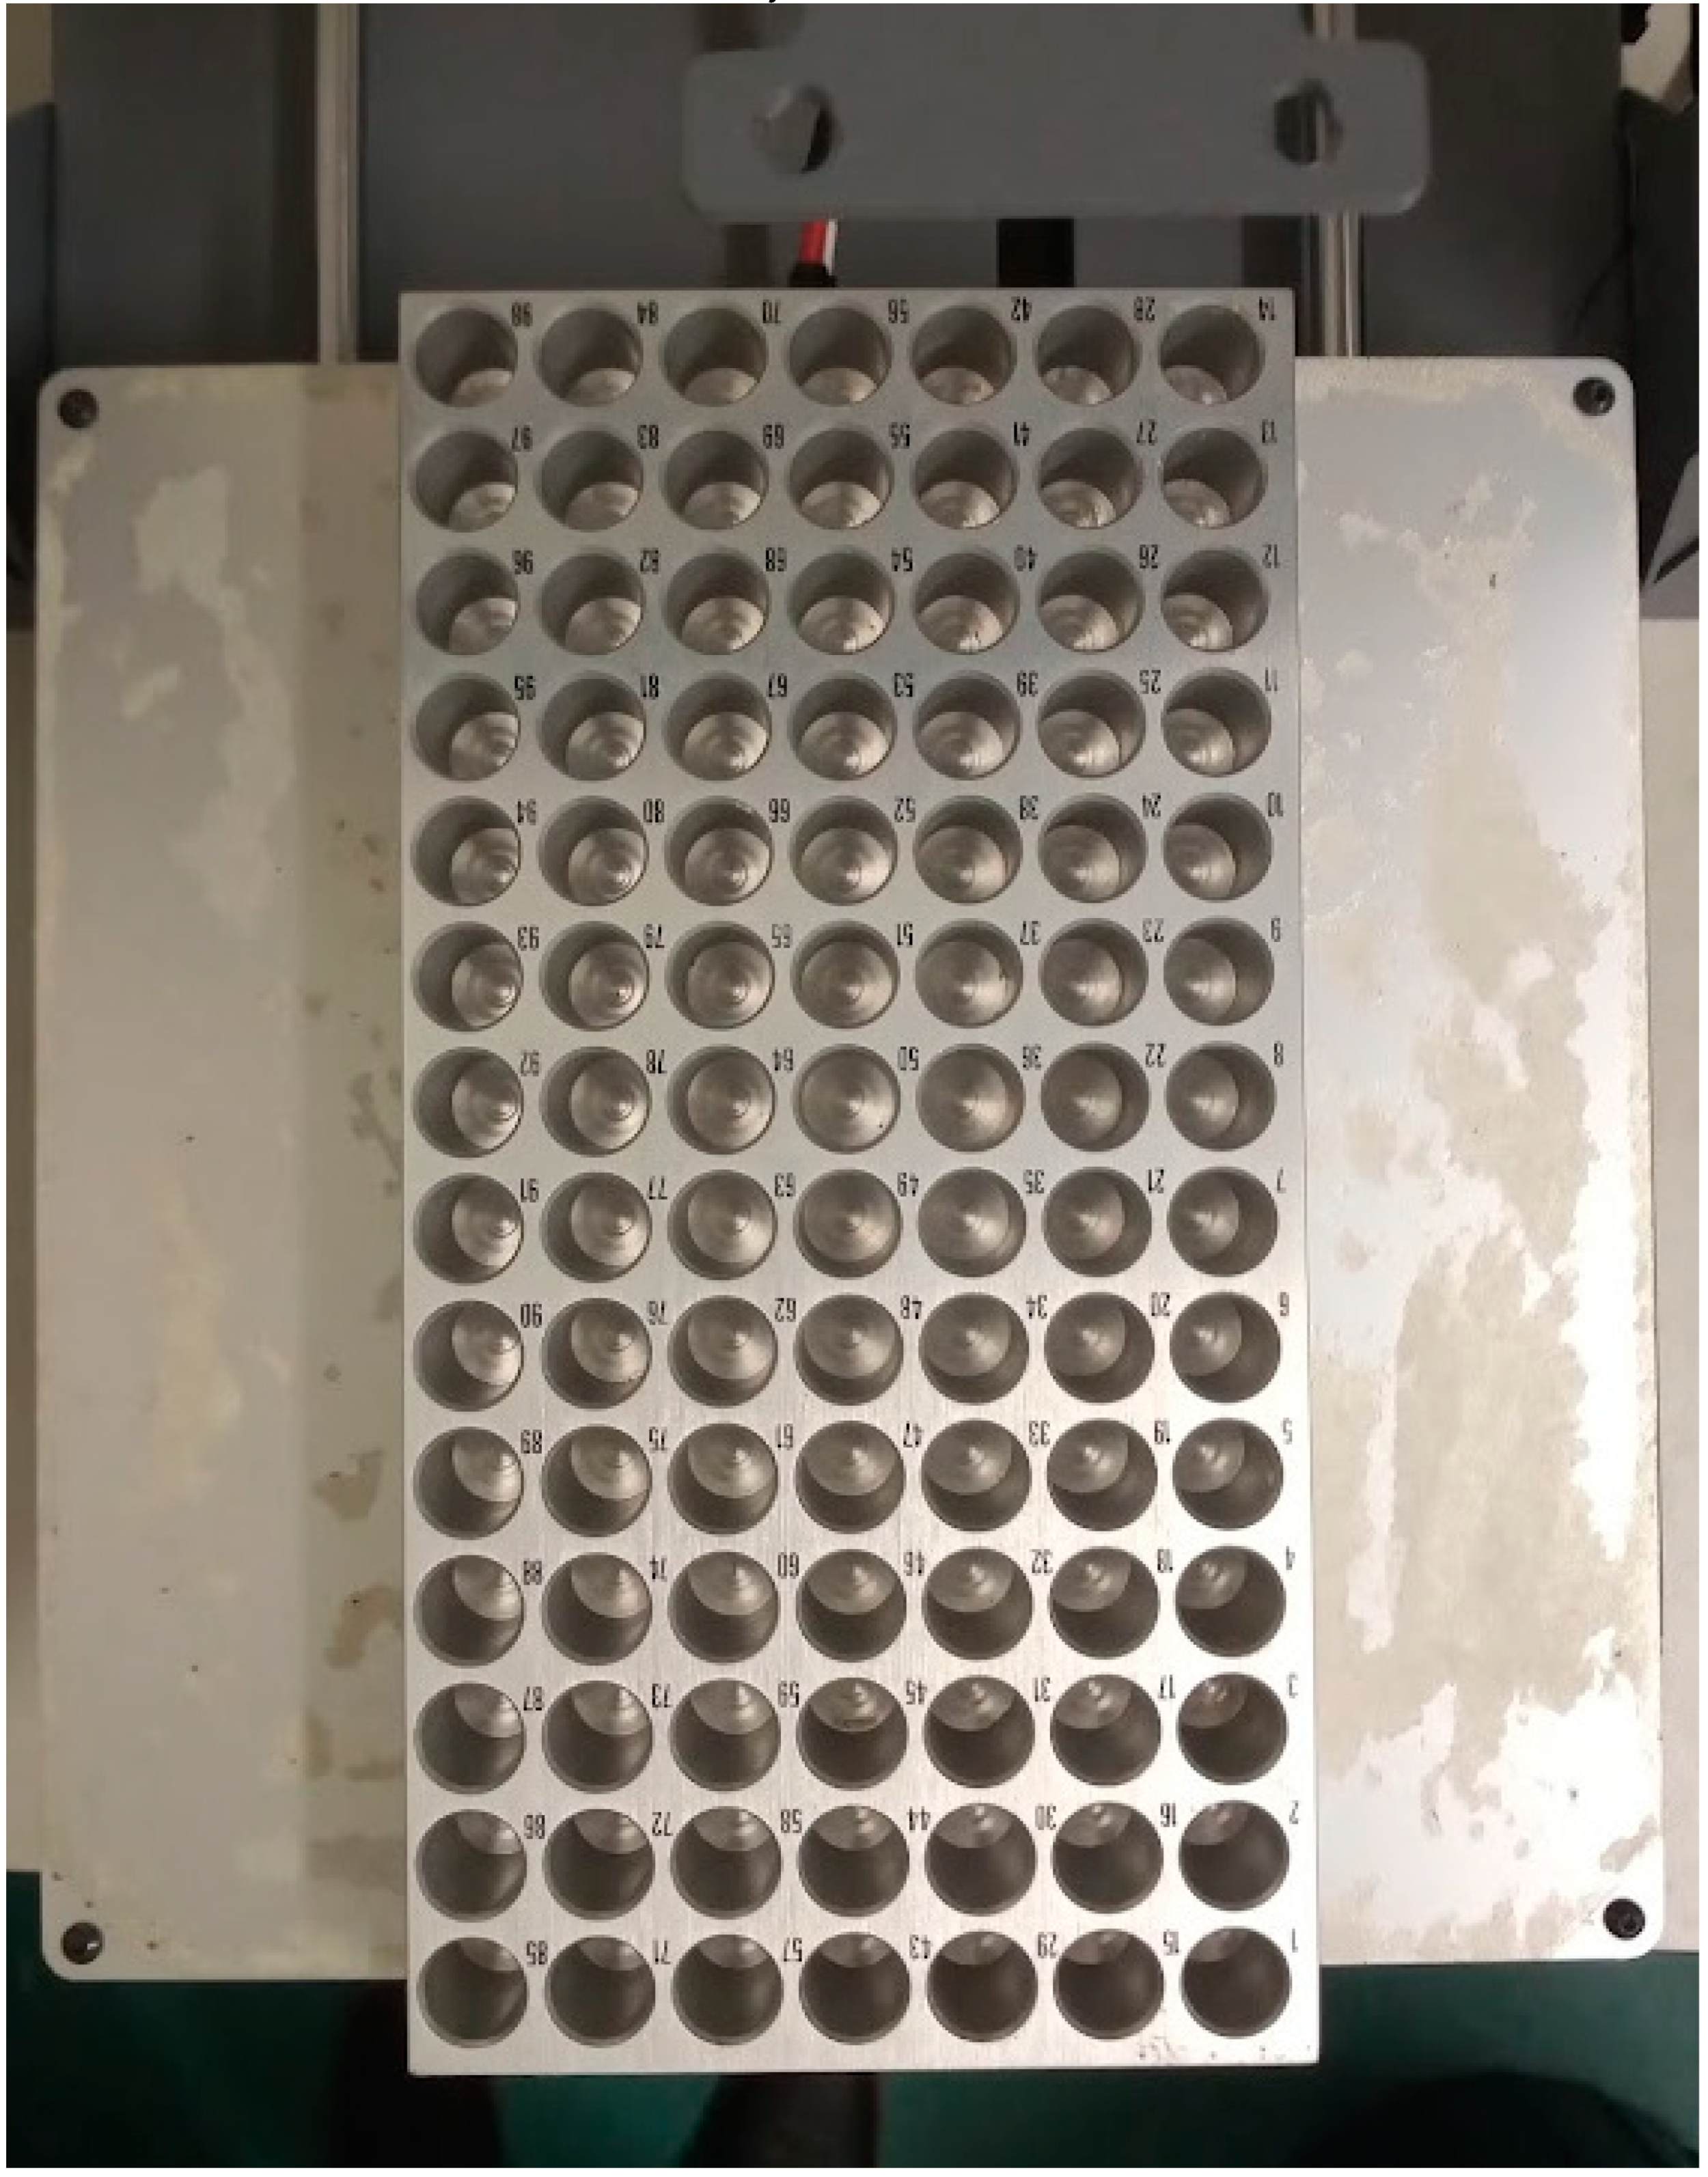
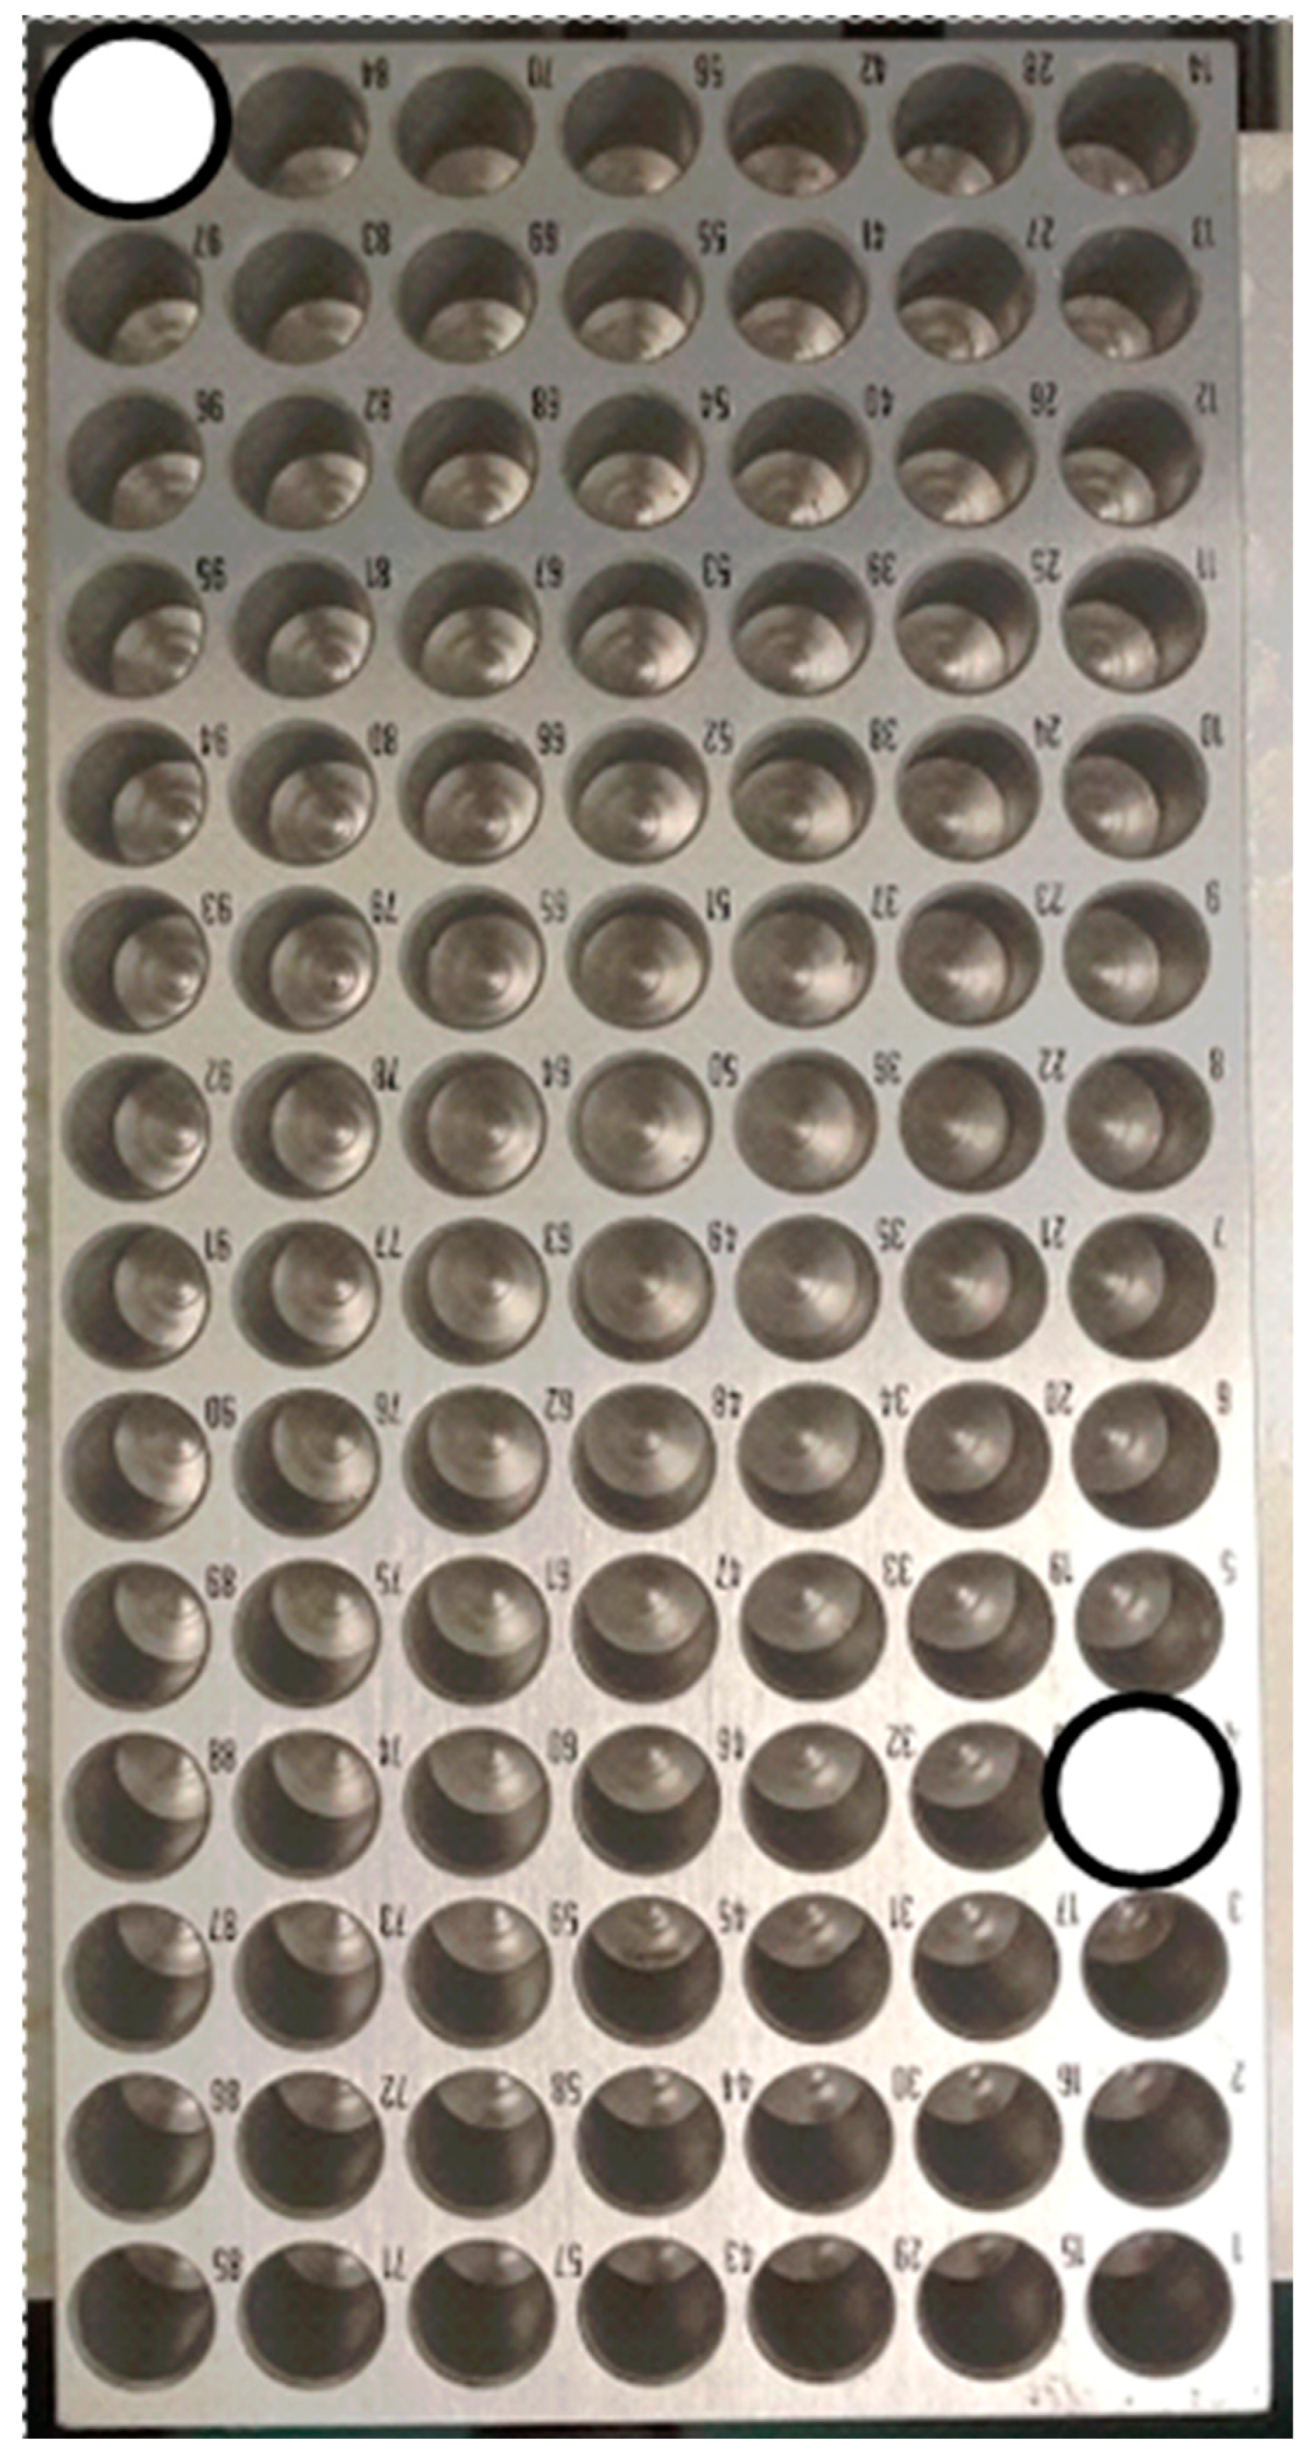
The next important positions are the four corners of the tray that can be reached by the HPLC tube (
Figure 16). Both the leftmost (X = 2.30; positions given here are likely to be different for different 3D-printers and trays) and rightmost (X = 5.95) positions of the tray are accessible, but only 11 of the14 back to front positions are accessible (Y from 0.30 to 7.05).
The remaining important positions are the vertical positions. For the waste, these were Z = -1. For moving above the tray, Z = -17, and for liquid delivery to the tray, Z = -19.
The determination of the positions normally only needs to be done once. It may need to be redone if the tray is removed and put back in place, for example.
4.4. Automated control
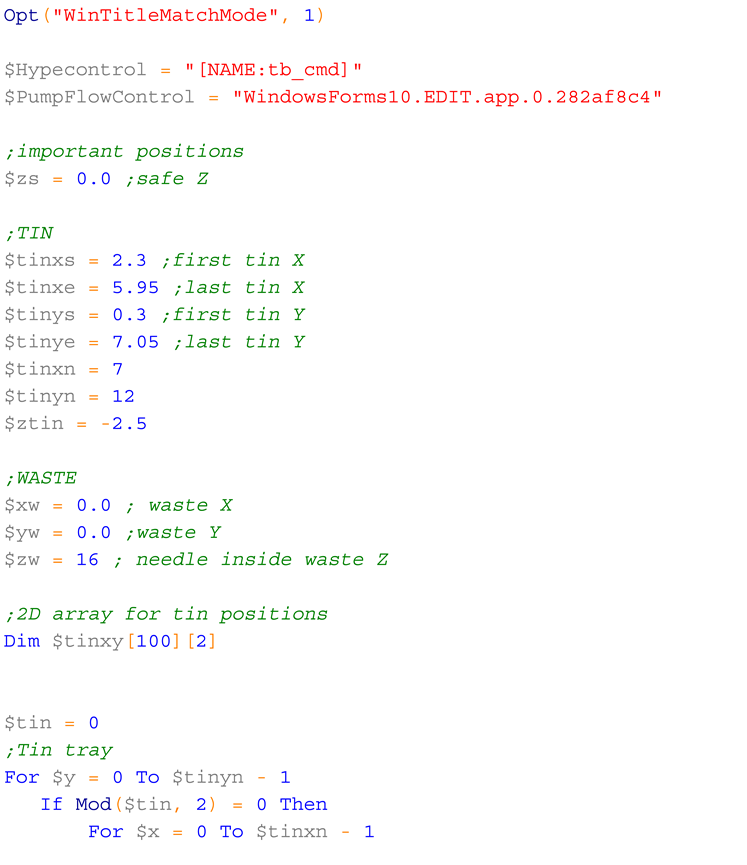
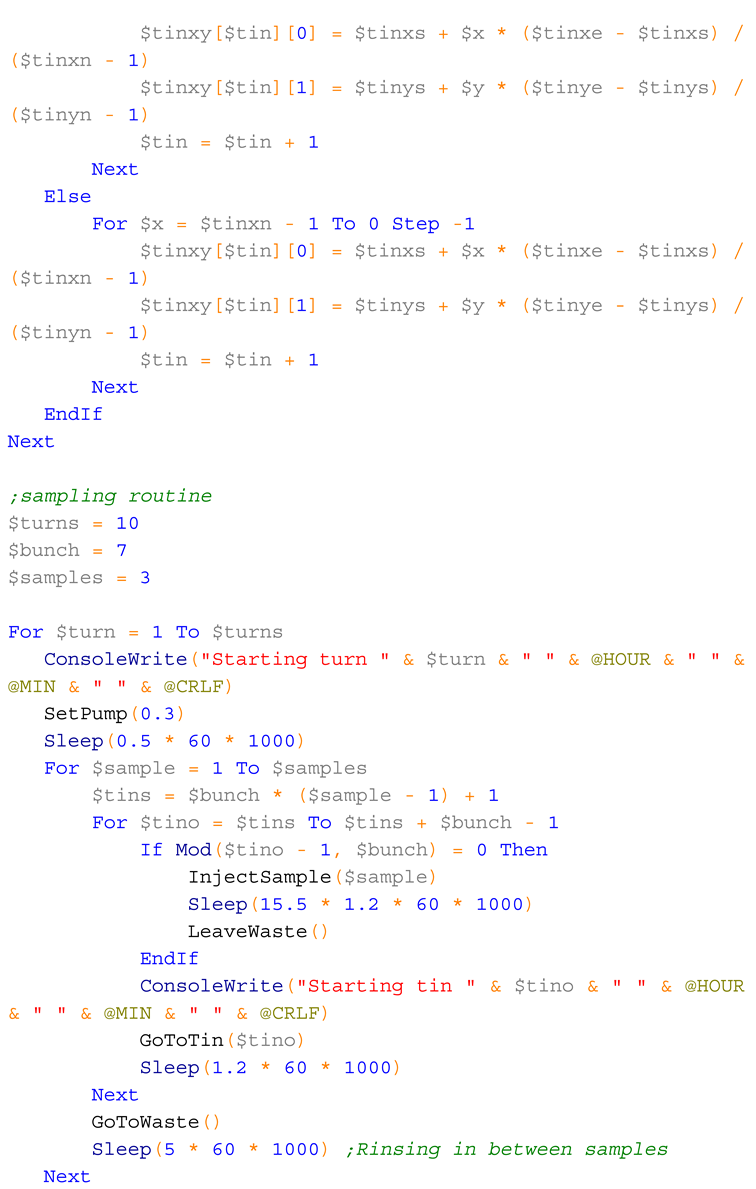
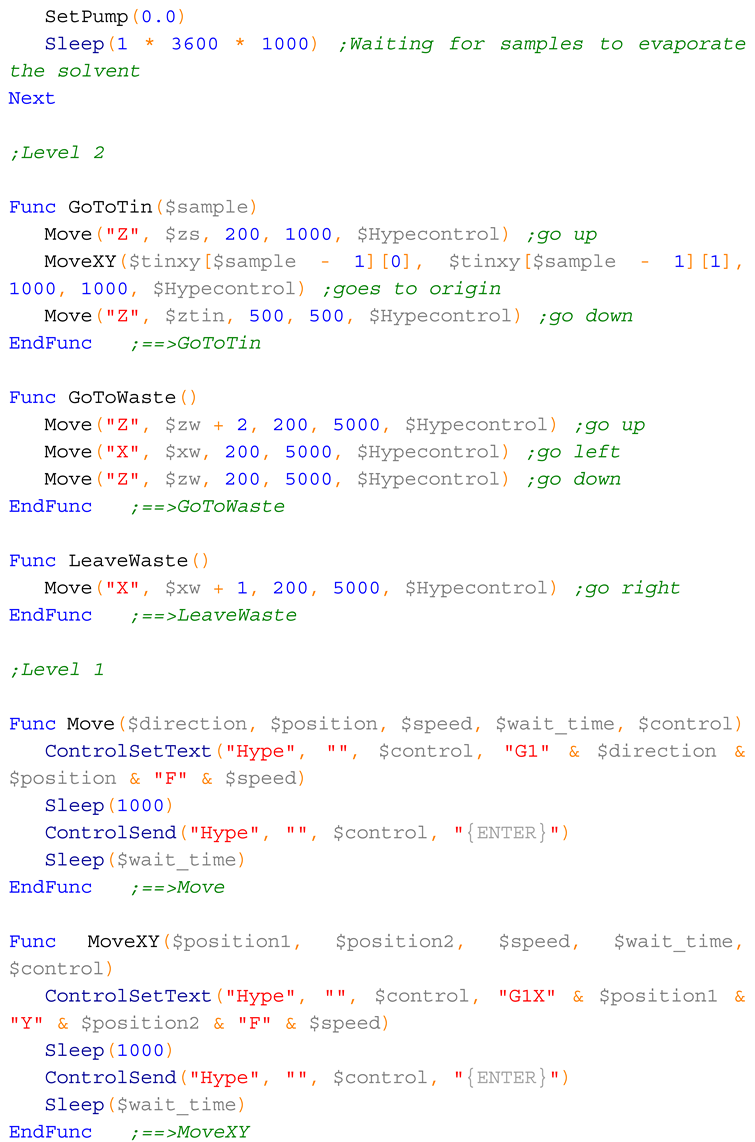
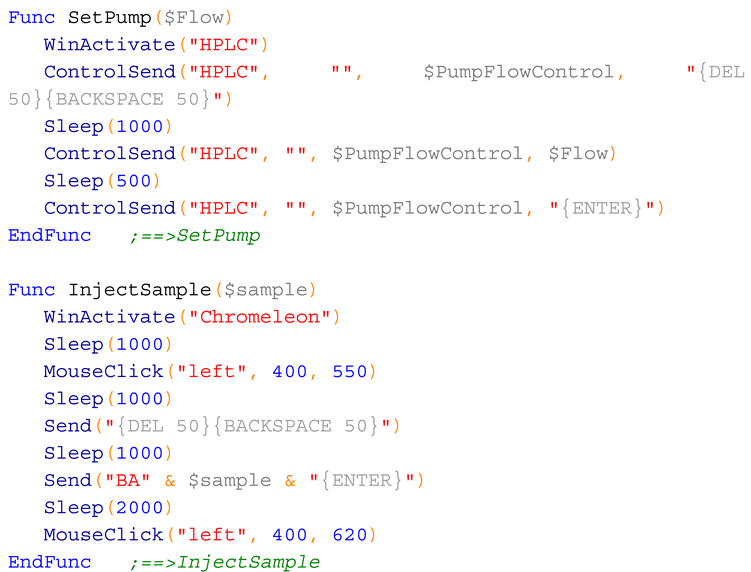
The fraction collector and the HPLC were integrated using an AutoIt script [
35]. AutoIt allows the integration of different programs using seamless control of the windows elements, or mouse click and keyboard entries [
35]. Here, we employed both approaches. To control Hype!Terminal, AutoIt sent seamless commands to the input field (
Figure 17).
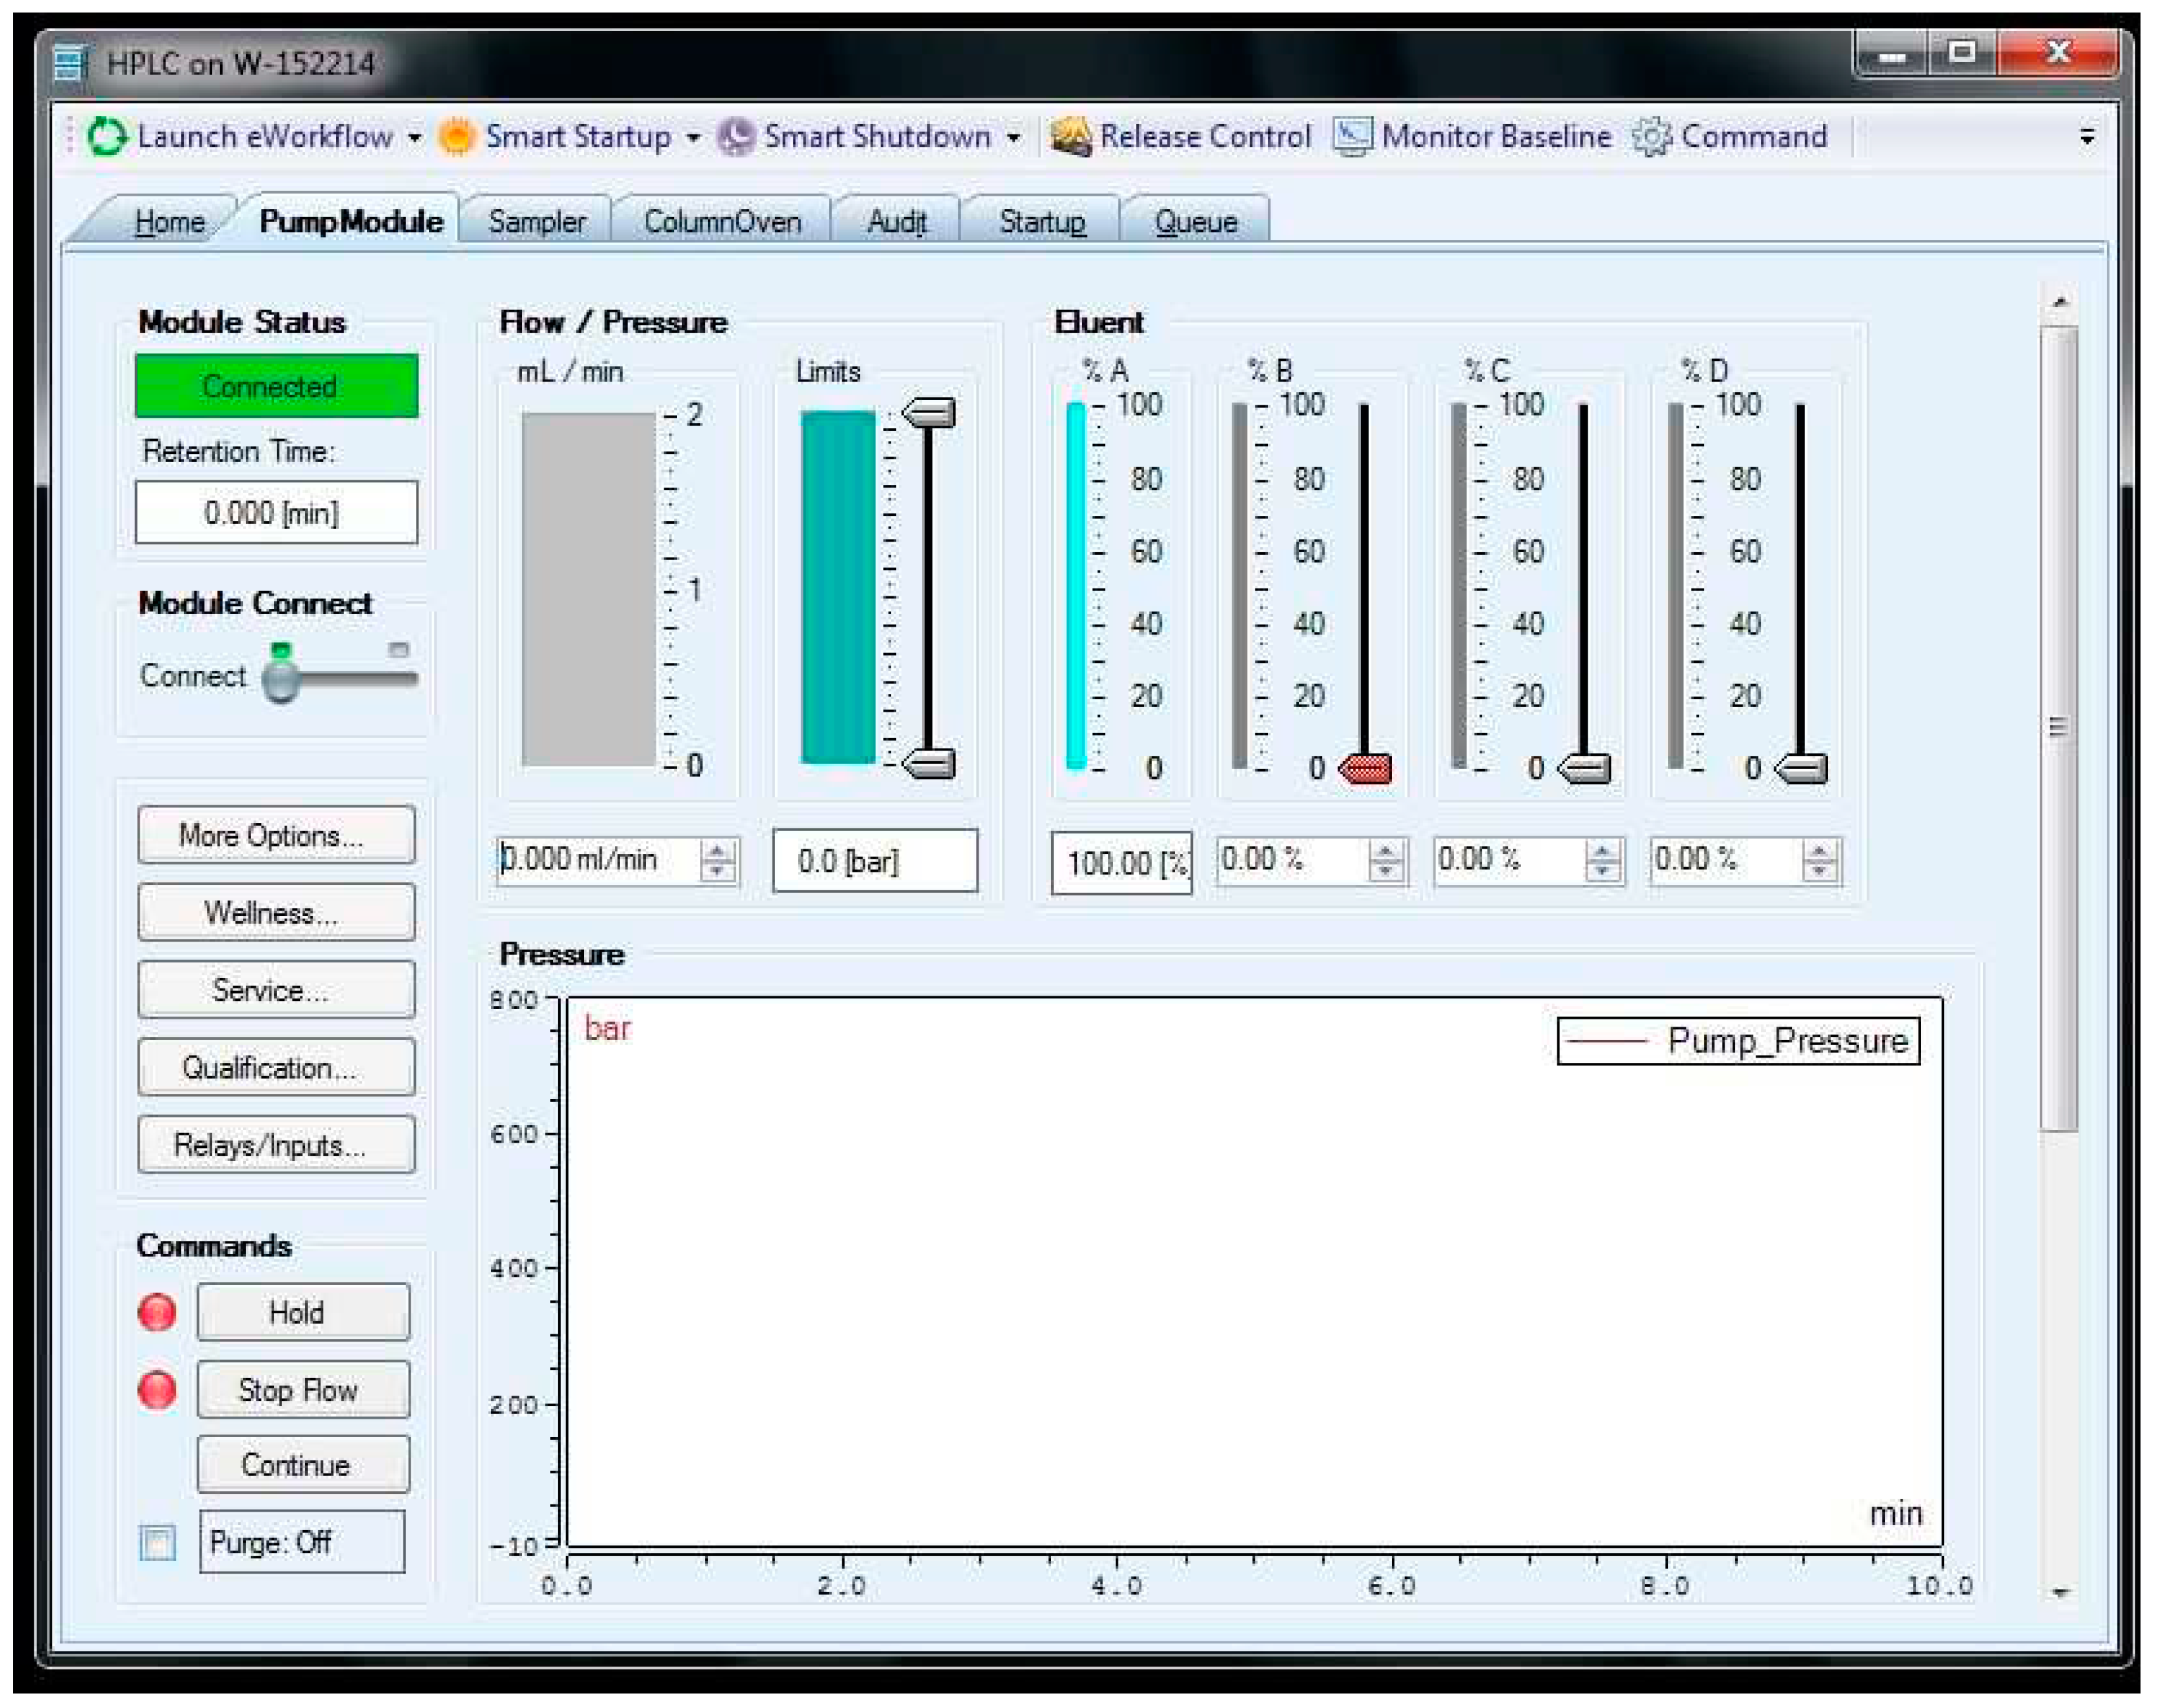
The fraction collector worked together with a HPLC (Ultimate 3000, Thermo Fisher), controlled with Chromeleon 7 (Thermo Fisher). The system was equipped with a solvent pump, an autosampler, and a column compartment with temperature control.
To control the HPLC pump, seamless commands were sent to the input field for flow control (
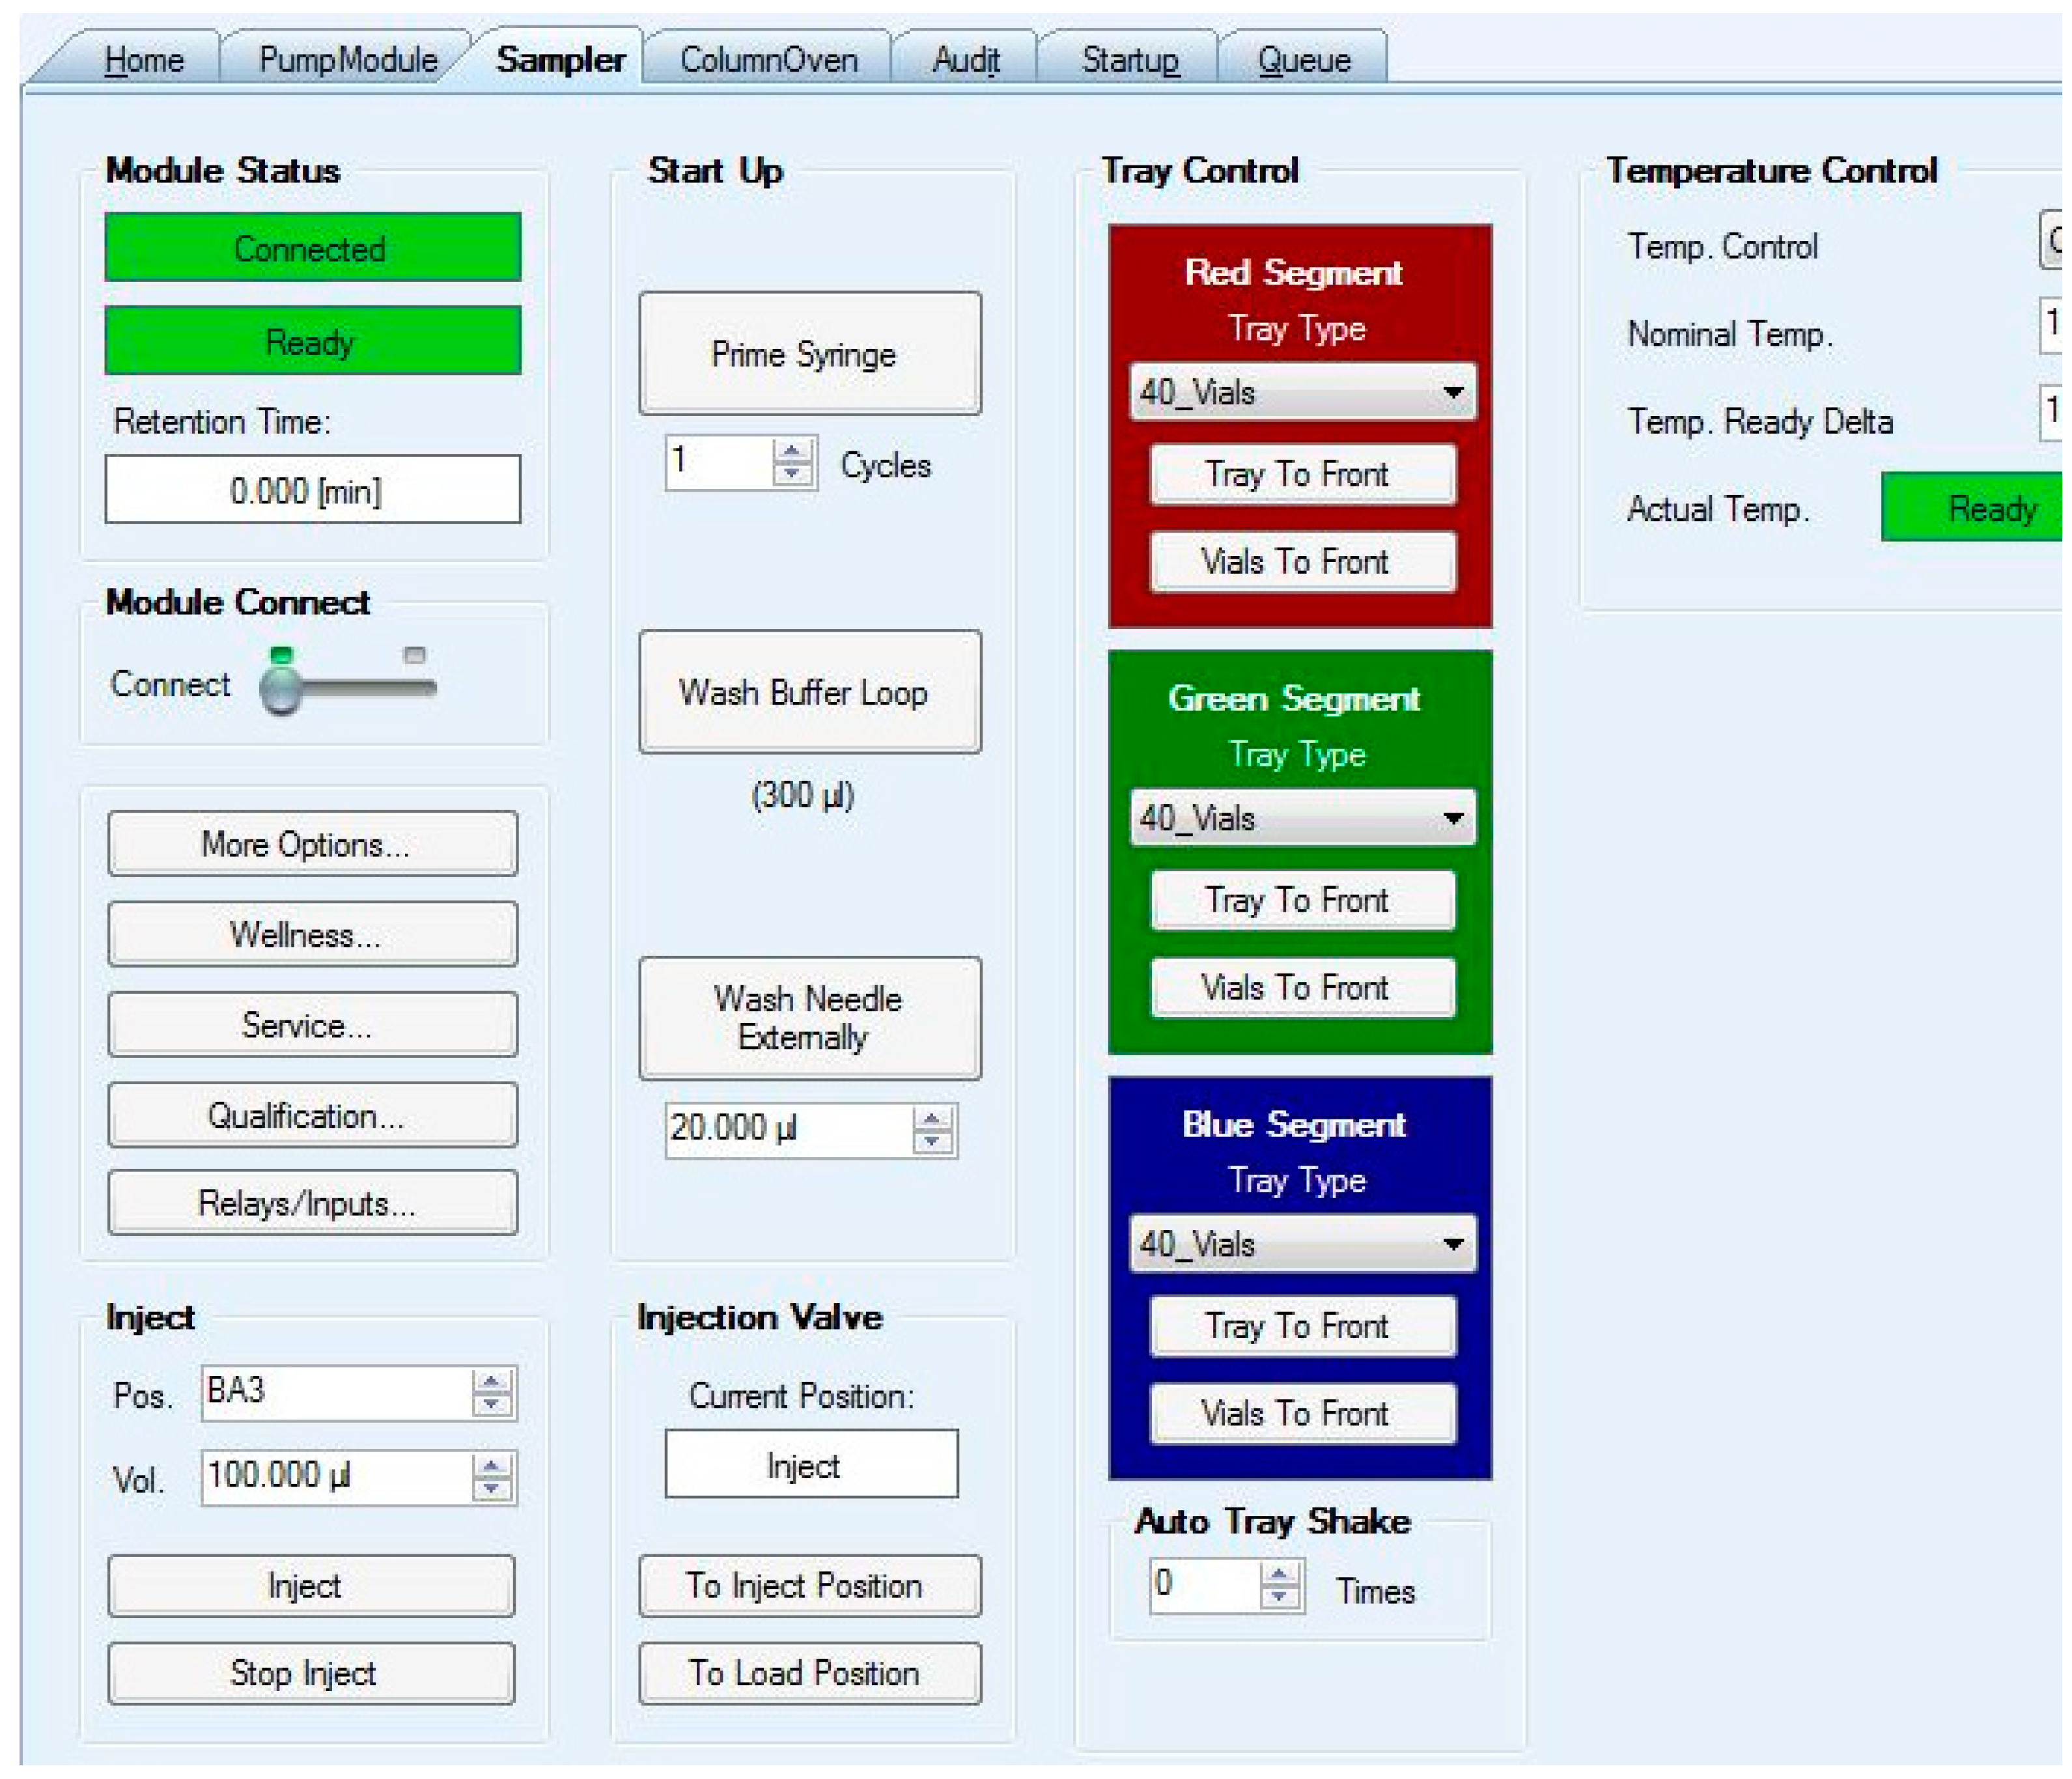
Figure 18). However, to control the HPLC autosampler seamless commands did work, and thus automated mouse and keyboard strokes were sent to the ”Pos.” input box, and to the “Inject” button (
Figure 18).
A typical script would consist of the following instructions:
1) Turn on the HPLC pump (by sending a command to the Chromeleon pump control interface);
2) Inject a sample volume from a sample in the HPLC autosampler (by sending a command to the Chromeleon sampler control interface);
3) Wait a predetermined time until the compound of interest is at the exit of the tube in the fraction collector (this needs to be determined beforehand without this wait time);
4) Move the HPLC tube to the first tin capsule (by sending commands to Hype!Terminal);
5) Wait for a predetermined time above the tin capsule so that the compound was completely collected in it;
6) Move to the next tin capsule (by sending commands to Hype!Terminal);
7) Repeat step 6 for as many compounds as are needed to be collected (by sending commands to Hype!Terminal);
8) Move to the waste tube (by sending commands to Hype!Terminal);
9) Turn the HPLC pump off (by sending a command to the Chromeleon pump control interface);
10) Wait until the collected liquid has completely evaporated completely;
11) Repeat all steps for multiple replicates of the sample, as required to collect sufficient material for elemental analysis coupled to isotope ratio mass spectrometry (EA-IRMS).
5. Validation
5.1. Stable carbon isotope analysis of glucose
The fraction collector was tested for accuracy in the measurement of glucose in a water solution The HPLC was equipped with a HyperRez XP Carbohydrate H+ (Thermo Fisher) column kept at 75 oC in the column compartment. A guard column (also HyperRez XP Carbohydrate H+) was used, as well as a frit between connections to prevent column clogging. The frit was replaced every time pressure surpassed 40 bar to avoid deterioration of the column. This limit also dictated the maximum flow rate that could be used, which was 0.6 mL min-1. Milli-q water was used as the solvent.
A glucose (Sigma Aldrich, 99.9% purity) solution was prepared using milli-q water (final concentration 4 mM as carbon). This solution was transferred to 2 mL vials which were placed in the HPLC autosampler. The autosampler injected 0.1 mL of the glucose solution into the HPLC. At a flow rate of 0.3 mL min
-1, glucose would be collected in 22 min, whilst at a flow rate was 0.6 mL min
-1, it would be collected at 11 min. These retention times were determined by doing preliminary injections and performing collections every minute. Based on these retention times, a narrow collection range, between 10 and 12 min for 0.6 mL min
-1, and between 20 and 24 min for 0.3 mL min
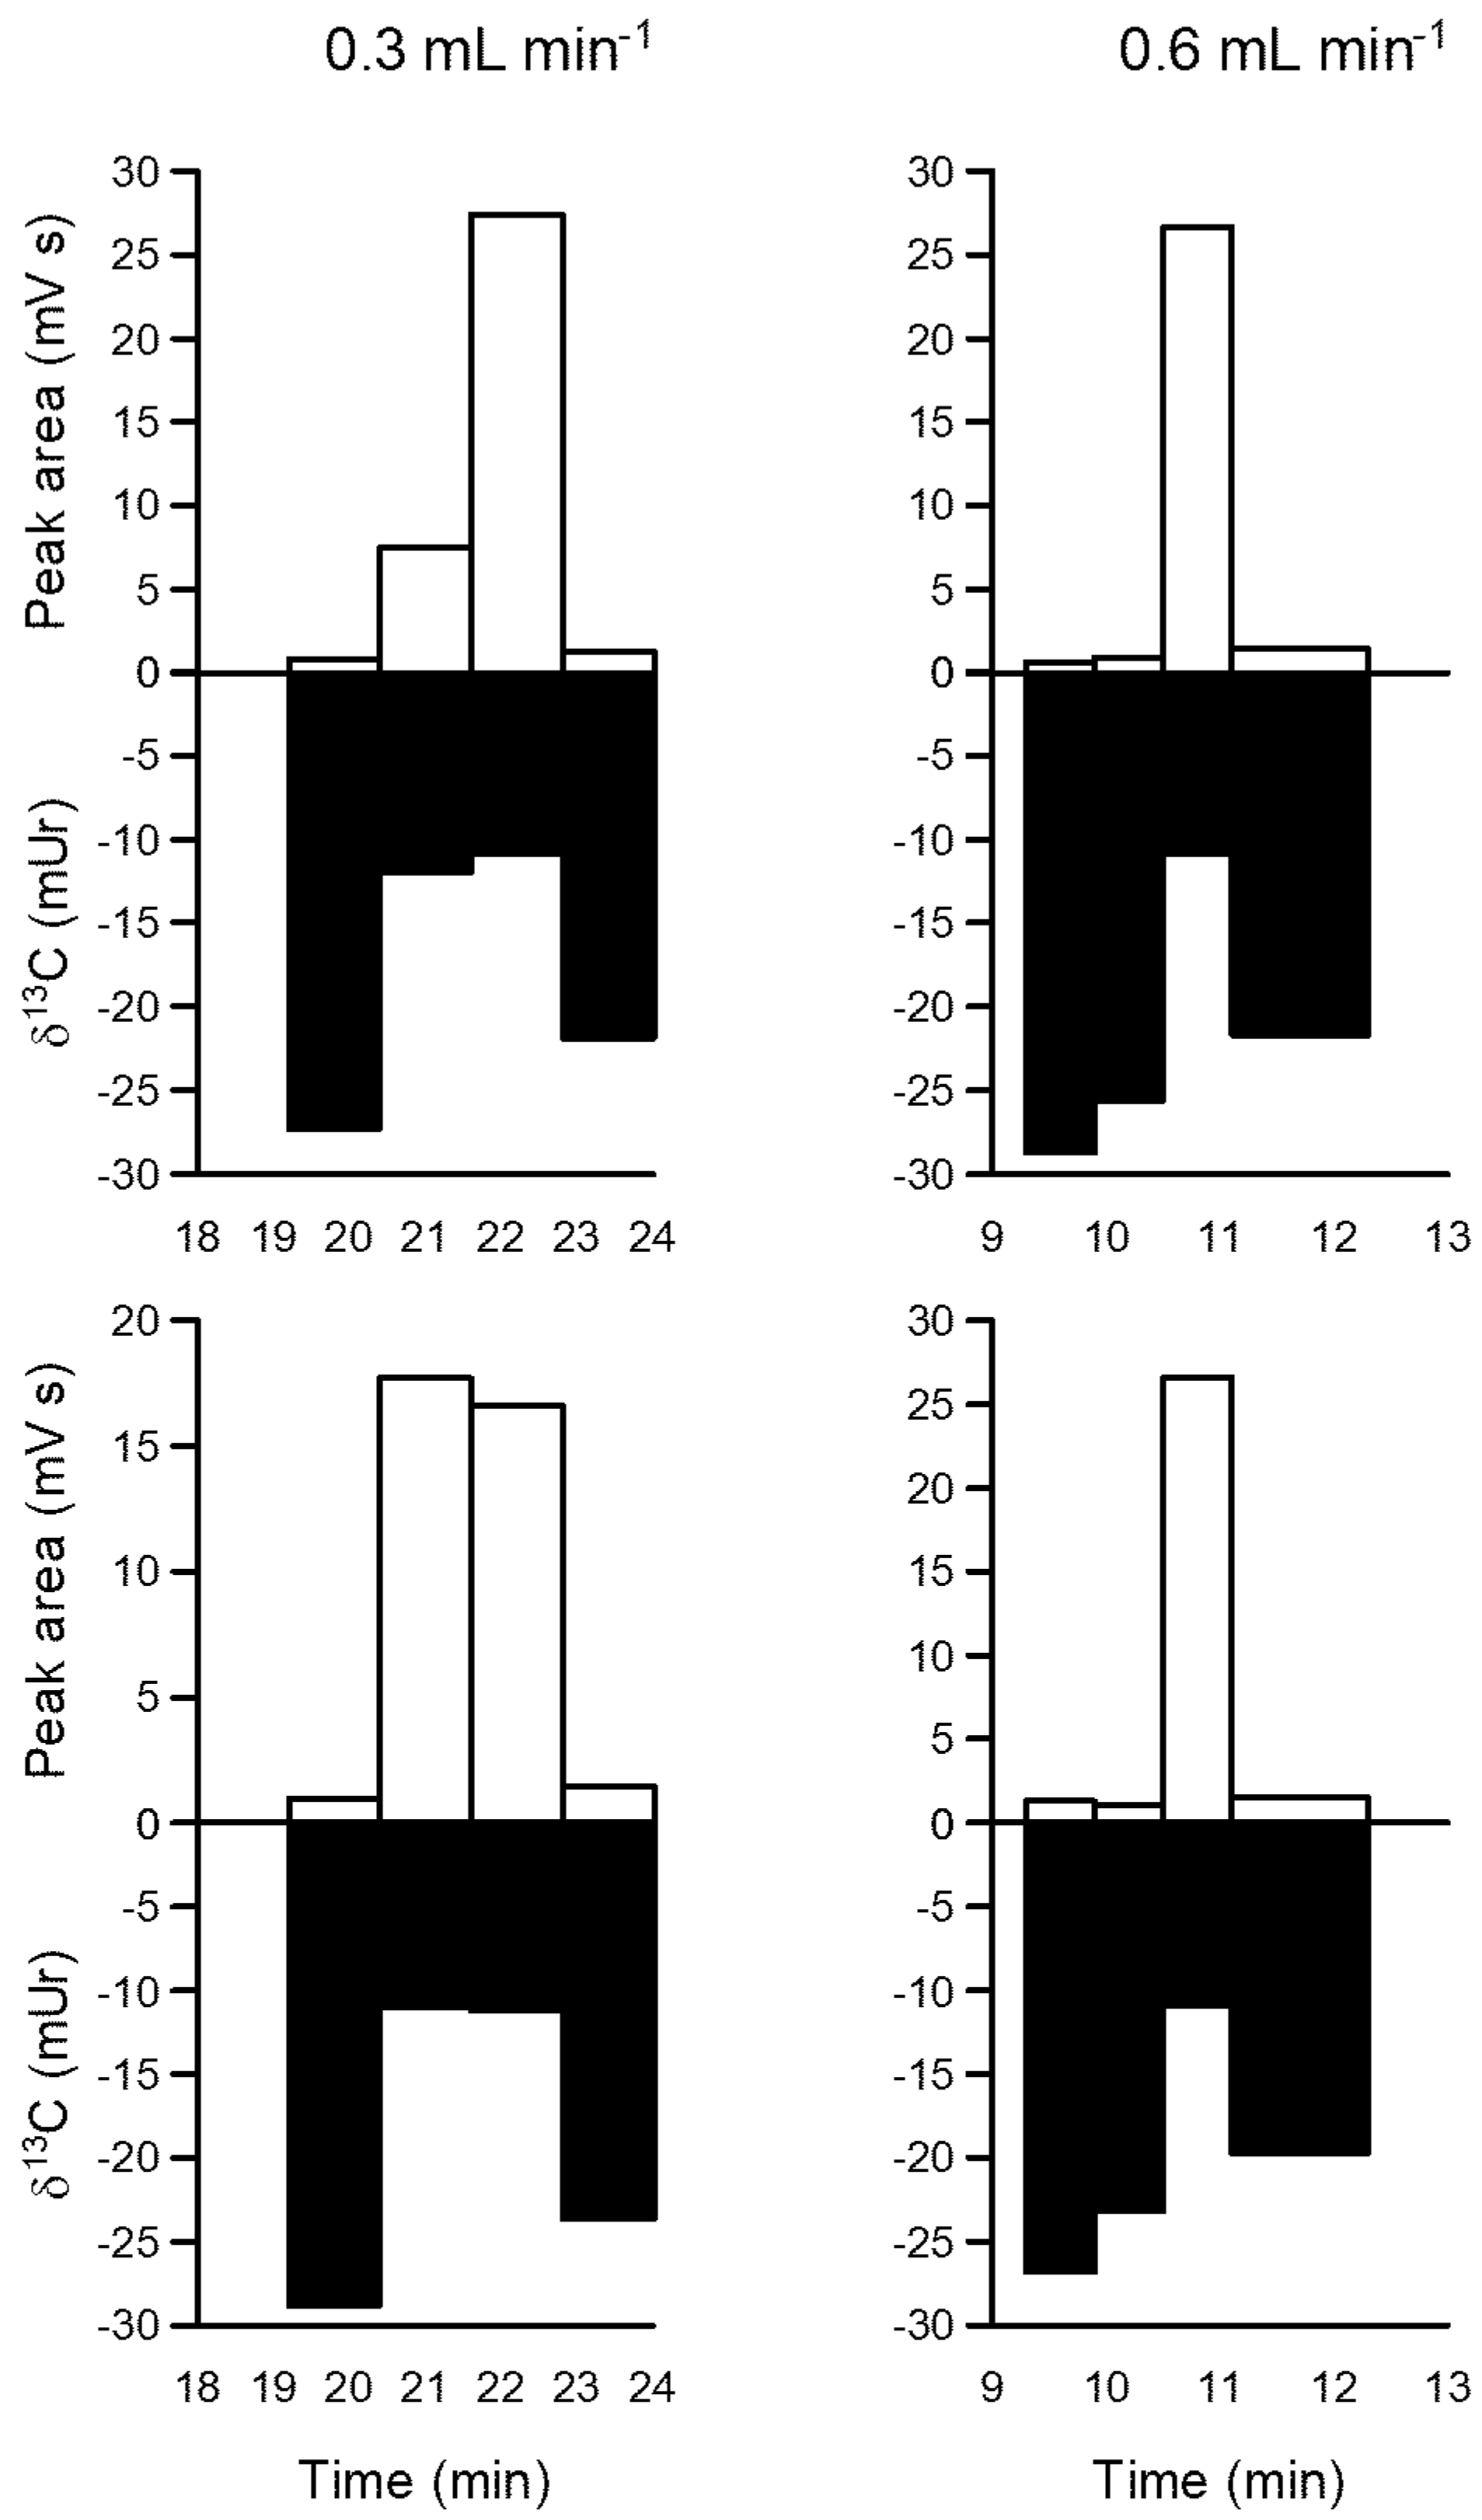
-1 were employed. Repeated injections were performed, and it was found that glucose was better collected using a flow rate of 0.6 mL min
-1. Not only the time spent was smaller, but more importantly the peak as sharper, as it concentrated only in a single tin capsule, while with 0.3 mL min
-1 it spread through 2 tin capsules (
Figure 20). Peak areas in the figure are proportional to the amount of carbon in the tin capsule, while δ
13C stands for the “delta” notation used to describe the abundance of
13C compared to
12C in a substance (SI units Ur). The δ
13C of glucose (-10.5 ± 0.1 mUr) was determined from previous measurements of the solid powder using the EA-IRMS. Therefore, empty tin capsules will have low areas and δ
13C different from the known value for glucose, while tin capsules containing glucose will have larger areas and δ
13C closer to the known value. The actual value for the compound (glucose, in this case) in the tin capsules can be calculated by assuming that the values for empty tin capsules are representative of the blank, and applying a mass balance. By doing so, it was found that for injections done at 0.6 mL min
-1 the average value for glucose was -10.4 ± 0.25 mUr, n = 7, while for 0.3 mL min
-1 results were -10.4 ± 0.13 mUr, n = 3. In both cases, results were very close to the known value.
6. Conclusions
The fraction collector presented here is a low-cost and easy to build solution to prepare compound-specific samples for stable isotope analyses. Compared to most other systems (open source and commercial), it has the added advantage of concentrating the compounds as the collection proceeds.
The 3D-printer used here was based on a very popular template (Prusa I3), and so the adaptation of any 3D-printer of this family should be as simple as for the one used here. Most other 3D-printer models should be also amenable to use, provided they are equipped with a heat bed.
The fraction collector has performed very well without issues for three days uninterrupted, and could potentially work for much longer, as no problems happened. Compared to the normal operation of a 3D printer, the fraction collector makes much less intensive use of the stepper motors, but equivalent or higher use of the heat bed.
Further improvements could come with the simultaneous use of a detector in the HPLC, as shown previously [
16], which could enable more optimized collection times.
Peak spreading (
Figure 20) and other issues, such as co-elution of different substances at the same time, are known challenges for compound specific isotope ratio mass spectrometry [
1]. Despite these problems, this is a technique with established scope in numerous scientific fields. We hope that the introduction of our fraction collector contributes to an even more widespread adoption of the fraction collection approach.
Supplementary Materials
The following supporting information can be downloaded at the website of this paper posted on Preprints.org. Video S1: FractionCollector.mp4.
Author Contributions
Conceptualization, methodology, software, validation: M.C., resources and writing: M.C. and J.O.; project administration and funding acquisition: J.O. All authors have read and agreed to the published version of the manuscript.
Funding
This research was funded by the Australian Research Council, ARC LIEF grant number LE130100153, awarded to J. O.
Acknowledgments
We thank Leslie Christidis and Graham Lancaster, both Southern Cross University, for their continuing support to open-source projects at the university.
Appendix A
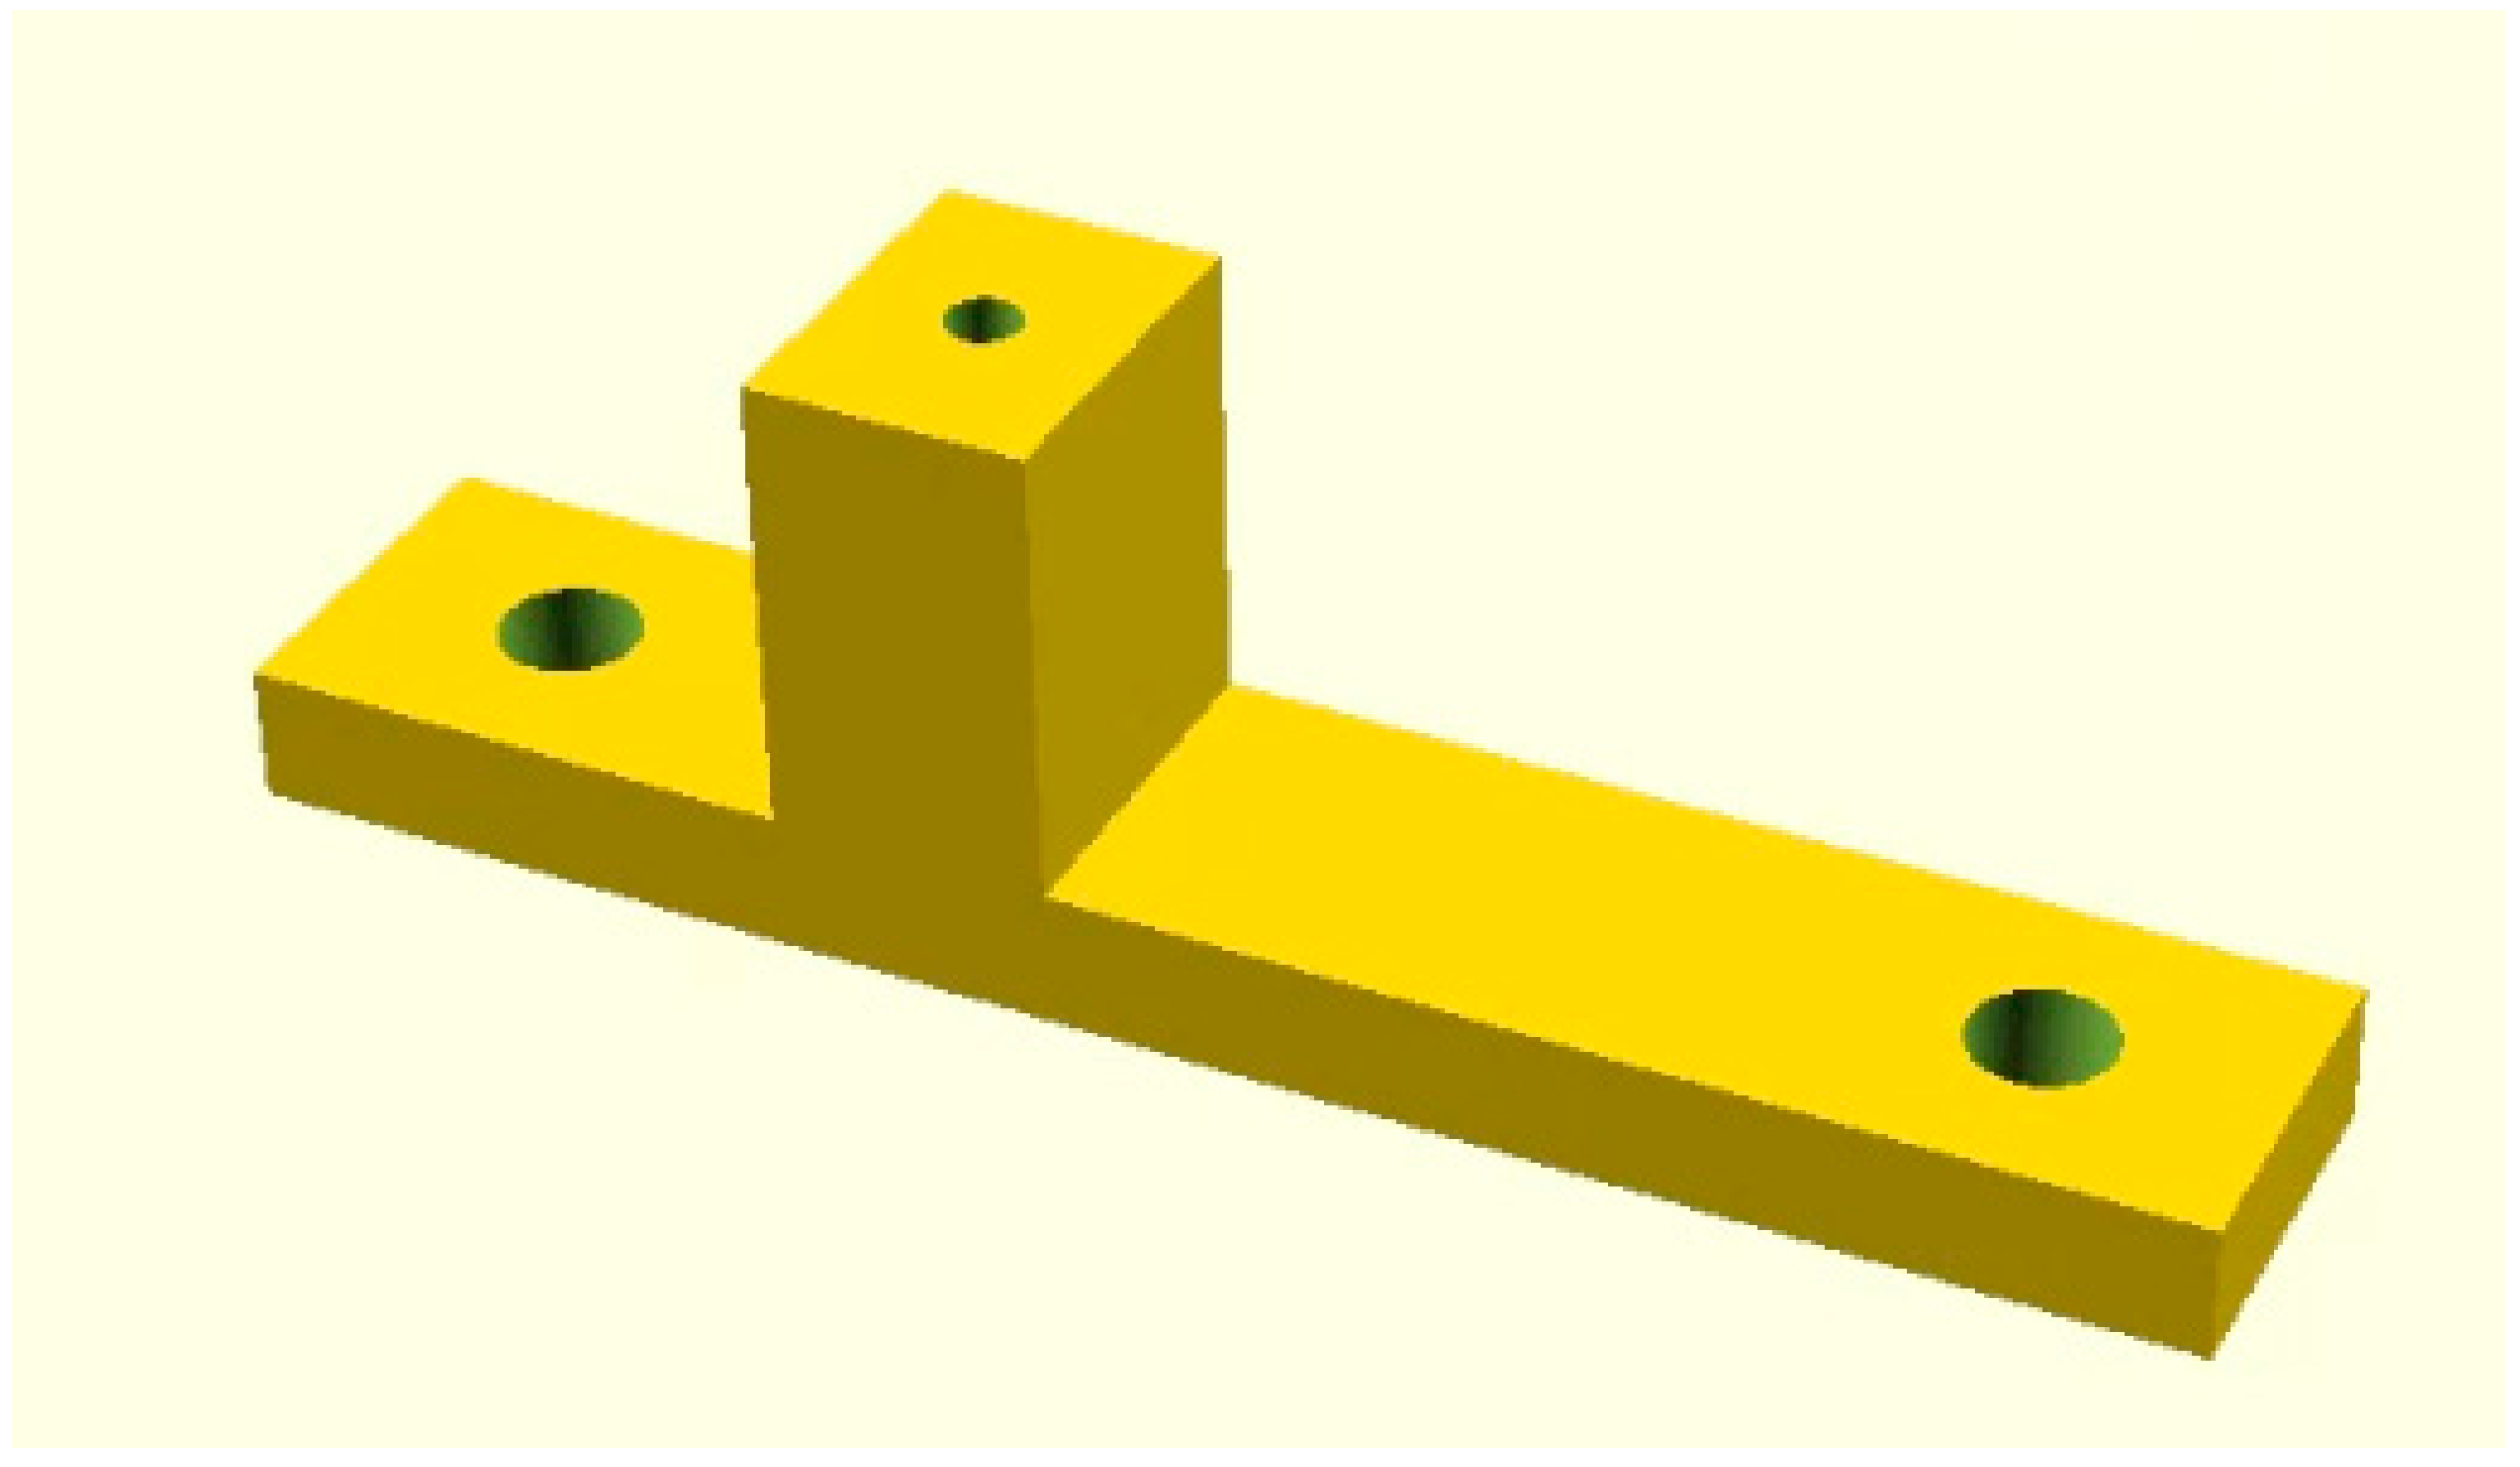
Open Scad code for the tube holder.
Figure A1.
3D drawing of tube holder.
Figure A1.
3D drawing of tube holder.
//lowest part of the block
basex = 42;
basey = 8;
basez = 3;
basetx = 0;
basety = 0;
basetz = 0;
//hole
holer = 1.5;
holez = basez;
holetx = basetx+5;
holety = basety+4;
holetz = basetz;
//neck
neckx = 6;
necky = 8;
neckz = 10;
necktx = 12;
neckty = 0;
necktz = basez;
$fn=64;
difference(){
translate([basetx,basety,basetz]){cube([basex,basey,basez]);}//base
#translate([holetx,holety,holetz]){cylinder( holez, holer, holer, false);}
#translate([holetx+10,holety,holetz]){cylinder( holez, 0.8, 0.8, false);}
#translate([holetx+32,holety,holetz]){cylinder( holez, holer, holer, false);}
}
difference(){
translate([necktx,neckty,necktz]){cube([neckx,necky,neckz]);}//base
#translate([holetx+10,holety,holetz]){cylinder( 20, 0.8, 0.8, false);}
}
References
- Meier-Augenstein, W. GC and IRMS technology for 13C and 15N analysis on organic compounds and related gases. In Handbook of stable isotope analytical techniques, volume 1, De Groot, H.J., Ed.; Elsevier: 2004; Volume 1, pp. 153-176.
- Oakes, J.M.; Eyre, B.D.; Middelburg, J.J.; Boshker, H.T.S. Composition, production, and loss of carbohydrates in subtropical shallow subtidal sandy sediments: Rapid processing and long-term retention revealed by 13C-labeling. Limnology & Oceanography 2010, 55, 2126–2138. [Google Scholar] [CrossRef]
- Veuger, B.; van Oevelen, D.; Middelburg, J.J. Fate of microbial nitrogen, carbon, hydrolysable amino acids, monosaccharides, and fatty acids in sediment. Geochim. Cosmochim. Acta 2012, 83, 217–233. [Google Scholar] [CrossRef]
- Moerdjik-Poortvliet, T.C.W.; van Breugel, P.; Sabbe, K.; Beauchard, O.; Stal, L.J.; Boschker, H.T.S. Seasonal changes in the biochemical fate of carbon fixed by benthic diatoms in intertidal sediments. Limnol. Oceanogr. 2018, 63, 550–569. [Google Scholar] [CrossRef]
- Oakes, J.; Riekenberg, P.; Eyre, B. Assimilation and short-term processing of microphytobenthos nitrogen in intertidal sediments. Limnol. Oceanogr. 2020, 65, 2377–2389. [Google Scholar] [CrossRef]
- Eyre, B.; Oakes, J.; Middelburg, J.J. Fate of microphytobenthos nitrogen in subtropical subtidal sediments: A 15N pulse-chase study. Limnol. Oceanogr. 2016, 61, 2108–2121. [Google Scholar] [CrossRef]
- Riekenberg, P.; Oakes, J.M.; Eyre, B.D. Uptake of dissolved organic and inorganic nitrogen in microalgae-dominated sediment: comparing dark and light in situ and ex situ additions of 15N. Mar. Ecol. Prog. Ser. 2017, 571, 29–42. [Google Scholar] [CrossRef]
- Riekenberg, P.; van der Heide, T.; Holthuijsen, S.J.; van der Veer, H.W.; van der Meer, M.T.J. Compound-specific stable isotope analysis of amino acid nitrogen reveals detrital support of microphytobenthos in the Dutch Wadden Sea benthic food web. Frontiers in Ecology and Evolution 2022, 10, 951047. [Google Scholar] [CrossRef]
- Oakes, J.; Rysgaard, S.; Glud, R.N.; Eyre, B.D. The transformation and fate of sub-Arctic microphytobenthos carbon revealed through 13C-labeling. Limnol. Oceanogr. 2016, 61, 2296–2308. [Google Scholar] [CrossRef]
- Riekenberg, P.; Oakes, J.M.; Eyre, B.D. Short-term fate of intertidal microphytobenthos carbon under enhanced nutrient availability: a 13C pulse-chase experiment. Biogeosciences 2018, 15, 2873–2889. [Google Scholar] [CrossRef]
- Broek, T.A.B.; McCarthy, M.D. A new approach to δ15N compound-specific amino acid trophic position measurements: preparative high pressure liquid chromatography technique for purifying underivatized amino acids for stable isotope analysis. Limnology and Oceanography: Methods 2014, 12, 840–852. [Google Scholar] [CrossRef]
- Phillips, A.A.; Wu, F.; Sessions, A.L. Sulfur isotope analysis of cysteine and methionine via preparatory liquid chromatography and elemental analyzer isotope ratio mass spectrometry. Rapid Communications in Mass Spectrometry 2020, 35, e9007. [Google Scholar] [CrossRef] [PubMed]
- Sun, Y.; Ogawa, N.O.; Ishikawa, N.F.; Blattmann, T.M.; Takano, Y.; Ohkouchi, N. Application of a porous graphitic carbon column to carbon and nitrogen isotope analysis of underivatized individual amino acids using high-performance liquid chromatography coupled with elemental analyzer/isotope ratio mass spectrometry. Rapid Communications in Mass Spectrometry 2023, 37, e9602. [Google Scholar] [CrossRef] [PubMed]
- Zhang, L.; Lee, W.-m.C.; Kreider-Mueller, A.; Kuhnel, E.; Baca, J.; Ji, C.; Altabet, M.A. High-precision measurement of phenylalanine and glutamic acid δ15N by coupling ion-exchange chromatography and purge-and-trap continuous-flow isotope ratio mass spectrometry. Rapid Communications in Mass Spectrometry 2021, 35, e9085. [Google Scholar] [CrossRef] [PubMed]
- Yun, H.Y.; Won, E.-J.; Choi, J.; Cho, Y.; Lim, D.-J.; Kim, I.-S.; Shin, K.-H. Stable Isotope Analysis of Residual Pesticides via High Performance Liquid Chromatography and Elemental Analyzer–Isotope Ratio Mass Spectrometry. Molecules 2022, 27, 8587. [Google Scholar] [CrossRef] [PubMed]
- Broek, T.A.B.; Walker, B.D.; Andreasen, D.H.; McCarthy, M.D. High-precision measurement of phenylalanine δ15N values for environmental samples: A new approach coupling high-pressure liquid chromatography purification and elemental analyzer isotope ratio mass spectrometry. Rapid Communications in Mass Spectrometry 2013, 27, 2327–2337. [Google Scholar] [CrossRef] [PubMed]
- Mauve, C.; Bleton, J.; Bathellier, C.; Lelarge-Trouverie, C.; Guérard, F.; Ghashghaie, J.; Tchapla, A.; Tcherkez, G. Kinetic 12C/13C isotope fractionation by invertase: evidence for a small in vitro isotope effect and comparison of two techniques for the isotopic analysis of carbohydrates. Rapid Communications in Mass Spectrometry 2009, 23, 2499–2506. [Google Scholar] [CrossRef]
- Thompson, R.A.; Morello, D.R.; Panicker, S.; Toske, S.G.; Li, L. Carbon and nitrogen isotopic analysis of morphine from opium and heroin samples originating in the four major heroin producing regions. Drug Testing and Analysis 2022, 14, 505–513. [Google Scholar] [CrossRef]
- Oakes, J.M.; Connolly, R.M.; Revill, A.T. Isotope enrichment in mangrove forests separates microphytobenthos and detritus as carbon sources for animals. Limnology & Oceanography 2010, 55, 393–402. [Google Scholar]
- Godin, J.-P.; Fay, L.B.; Hopfgarther, G. Liquid chromatography combined with mass spectrometry for 13C isotopic analysis in life science research. Mass Spectrometry Reviews 2007, 26, 751–774. [Google Scholar] [CrossRef]
- Perini, M.; Bontempo, L. Liquid Chromatography coupled to Isotope Ratio Mass Spectrometry (LC-IRMS): A review. Trends in Analytical Chemistry 2022, 147, 116515. [Google Scholar] [CrossRef]
- Pearce, J.M. Open-Source Lab: How to build your own hardware and reduce research costs; Elsevier: Waltham, 2014; p. 271. [Google Scholar]
- Pearce, J.M. Economic savings for scientific free and open source technology: A review. HardwareX 2020, 8, e00139. [Google Scholar] [CrossRef] [PubMed]
- Bravo-Martinez, J. Open source 3D-printed 1000 mL micropump. HardwareX 2017, 2. in press. [Google Scholar] [CrossRef]
- Caputo, M.; Lyles, J.T.; Salazar, M.S.; Quave, C.L. LEGO MINDSTORMS Fraction Collector: A Low-Cost Tool for a Preparative High-Performance Liquid Chromatography System. Analytical chemistry 2020, 92, 1687–1690. [Google Scholar] [CrossRef] [PubMed]
- Ficarro, S.B.; Alexander, W.M.; Tavares, I.; Marto, J.A. Open source fraction collector/MALDI spotter for proteomics. HardwareX 2022, 11, e00305. [Google Scholar] [CrossRef] [PubMed]
- Booeshaghi, A.S.; Kil, Y.; Min, K.H.; Gehring, J.; Pachter, L. Low-cost, scalable, and automated fluid sampling for fluidics applications. HardwareX 2021, 10, e00201. [Google Scholar] [CrossRef] [PubMed]
- Medina, D.A.V.; Lozada-Blanco, A.; Rodrígues, J.P.G.; Lanças, F.M.; Santos-Neto, A.J. An open-source smart fraction collector for isocratic preparative liquid chromatography. HardwareX 2023, 15, e00462. [Google Scholar] [CrossRef] [PubMed]
- Carvalho, M.C.; Eyre, B.D. A low cost, easy to build, portable, and universal autosampler for liquids. Methods in oceanography 2013, 8, 23–32. [Google Scholar] [CrossRef]
- Carvalho, M.C.; Murray, R.H. Osmar, the open source microsyringe autosampler. HardwareX 2018, 3, 10–38. [Google Scholar] [CrossRef]
- Carvalho, M.C. Miau, a microbalance autosampler. HardwareX 2021, 10. [Google Scholar] [CrossRef]
- Carvalho, M.C. Automated weighing in the stable isotope lab: when less is more. MethodsX 2023. [Google Scholar] [CrossRef]
- Carvalho, M.C.; Sanders, C.J.; Holloway, C. Auto-HPGe, an autosampler for gamma-ray spectroscopy using high-purity germanium (HPGe) detectors and heavy shields. HardwareX 2018, 4, e00040. [Google Scholar] [CrossRef]
- Carvalho, M.C.; Eickhoff, W.; Drexl, M. Open-source autosampler for elemental and isotopic analyses of solids. HardwareX 2020, 8, e00123. [Google Scholar] [CrossRef] [PubMed]
- Carvalho, M.C. Practical laboratory automation made easy with AutoIt; Wiley VCH: 2016; p. 290.
Figure 1.
3D printer without its filament extruder. Arrow points to the extruder support.
Figure 1.
3D printer without its filament extruder. Arrow points to the extruder support.
Figure 2.
Custom 3D-printed tube holder attached to the extruder support on the 3D printer.
Figure 2.
Custom 3D-printed tube holder attached to the extruder support on the 3D printer.
Figure 3.
Sample tray attached to the printing bed.
Figure 3.
Sample tray attached to the printing bed.
Figure 4.
3D-printer turned upside down with the cables disconnected from the control board.
Figure 4.
3D-printer turned upside down with the cables disconnected from the control board.
Figure 5.
MKS-GEN-L board with A4988 stepper motor drivers (circled in white in the figure) attached. The orientation of the drivers is important, as misplacement may lead to driver or board failure. Notice the small screws on each driver positioned to the right of the photo, and away from the power connections at the board.
Figure 6.
Power supply connected to the MKS-GEN-L control board.
Figure 6.
Power supply connected to the MKS-GEN-L control board.
Figure 7.
Heat bed connected to the MKS-GEN-L control board.
Figure 7.
Heat bed connected to the MKS-GEN-L control board.
Figure 8.
Stepper motors connected to the MKS-GEN-L control board. Connections indicated by arrows.
Figure 8.
Stepper motors connected to the MKS-GEN-L control board. Connections indicated by arrows.
Figure 9.
Control board attached to the top of the 3D-printer body using a screw and a spacer.
Figure 9.
Control board attached to the top of the 3D-printer body using a screw and a spacer.
Figure 10.
Cables at the back of the 3D-printer.
Figure 10.
Cables at the back of the 3D-printer.
Figure 11.
Waste tube attached to the 3D-printer.
Figure 11.
Waste tube attached to the 3D-printer.
Figure 12.
HPLC tube attached to the tube holder on the 3D printer.
Figure 12.
HPLC tube attached to the tube holder on the 3D printer.
Figure 13.
Sample tray loaded with tin capsules.
Figure 13.
Sample tray loaded with tin capsules.
Figure 14.
COM port configuration on Hype!Terminal.
Figure 14.
COM port configuration on Hype!Terminal.
Figure 15.
HPLC delivery line at the zero position.
Figure 15.
HPLC delivery line at the zero position.
Figure 16.
Sample tray with the two extreme positions that can be reached by the HPLC delivery line marked by white circles.
Figure 16.
Sample tray with the two extreme positions that can be reached by the HPLC delivery line marked by white circles.
Figure 17.
Hype!Terminal graphical interface. The input fields that received AutoIt instructions were the text box after “Command” and the “Send” button.
Figure 17.
Hype!Terminal graphical interface. The input fields that received AutoIt instructions were the text box after “Command” and the “Send” button.
Figure 18.
Chromeleon interface for pump control. Commands were sent to the “Flow/pressure” input box (it has a value of 0.000 in the figure).
Figure 18.
Chromeleon interface for pump control. Commands were sent to the “Flow/pressure” input box (it has a value of 0.000 in the figure).
Figure 19.
Chromeleon interface for autosampler control. Commands were sent to the “Pos.” input box, and to the “Inject” button.
Figure 19.
Chromeleon interface for autosampler control. Commands were sent to the “Pos.” input box, and to the “Inject” button.
Figure 20.
Typical results for glucose collected four times using the 3D printer fraction collected interfaced with an HPLC, and analysed using an elemental analyzer coupled to an isotope ratio mass spectrometer (EA-IRMS).
Figure 20.
Typical results for glucose collected four times using the 3D printer fraction collected interfaced with an HPLC, and analysed using an elemental analyzer coupled to an isotope ratio mass spectrometer (EA-IRMS).
|
Disclaimer/Publisher’s Note: The statements, opinions and data contained in all publications are solely those of the individual author(s) and contributor(s) and not of MDPI and/or the editor(s). MDPI and/or the editor(s) disclaim responsibility for any injury to people or property resulting from any ideas, methods, instructions or products referred to in the content. |
© 2023 by the authors. Licensee MDPI, Basel, Switzerland. This article is an open access article distributed under the terms and conditions of the Creative Commons Attribution (CC BY) license (http://creativecommons.org/licenses/by/4.0/).
