Submitted:
23 October 2023
Posted:
30 October 2023
You are already at the latest version
Abstract
Using banana peel as raw material, the adsorption properties of hydrothermal carbon pre-10 pared from banana peel modified with different concentrations of phosphoric acid solution for lead 11 ions in aqueous solution were studied. The surface structure and functional groups of the modified 12 hydrothermal carbon were analyzed by XRD and SEM. The results show that the surface of the 13 modified banana peel hydrothermal carbon prepared at 240℃ and 2mol/L phosphoric acid solution 14 has large pores. The adsorption capacity is larger when pH value is 6.When the concentration of 15 phosphoric acid solution was 2mol/L, the solid-liquid ratio was 2g/L, the adsorption capacity was 16 40.64mg/g, and the removal rate was 82.74%.When the initial concentration of lead solution in-17 creased to 100mg/L, the adsorption capacity of modified hydrothermal carbon for lead ion increased 18 to 76.81mg/g, and the removal rate decreased to 76.81%.The equilibrium adsorption time of banana 19 peel phosphoric acid modified hydrothermal carbon for lead ions in solution is 300min. The adsorp-20 tion process satisfies the pseudo-second-order kinetic model and Langmuir isotherm equation. The 21 reaction temperature is 313K, and the equilibrium adsorption capacity can reach 101.19mg/g. The 22 adsorption of Pb ions in aqueous solution by phosphoric acid modified hydrothermal carbon is 23 dominated by single layer chemisorption. The artificial neural network has a fitting correlation of 24 0.99, and the adsorption process includes physical adsorption, electrostatic attraction, ion exchange, 25 and surface complexation.
Keywords:
hydrothermal carbon
; Modification
; Adsorption
; Lead ion
; mechanism
1. Introduction
Heavy metals are of great harm after entering water, among which electroplating, metallurgy, mining, chemical industry and processing are the main sources of heavy metals [1].Direct discharge of industrial wastewater containing heavy metals will not only cause great damage to human body, but also destroy the ecological environment [2].
At present, the common treatment methods of heavy metals mainly include electroflocculation, electroflotation, chemical precipitation, ion exchange, membrane filtration, photocatalysis, nanotechnology, adsorption and other methods [3–7]. By comparison, the technical cost and economic benefits are ranked in order: adsorption > ion exchange > electroflotation > membrane filtration > electroflocculation > chemical precipitation > photocatalysis > nanotechnology. Compared with other technologies, adsorption method has the advantages of wide application range and simple preparation method, so it has great application prospect [8].
High temperature adiabatic carbonization and low temperature hydrothermal carbonization are common methods for biomass carbonization [9], and there are many studies on the preparation of activated carbon with high adsorption performance [10].Hydrothermal carbonization process is simple to operate [11], and the reaction raw materials do not need drying treatment. The prepared hydrothermal carbon is widely used in the adsorption and removal of pollutants [12].The process of hydrothermal carbonization is dehydration and decarboxylation of the functional groups of substances, resulting in increased carbon content, higher carbon density and better adsorption performance of the reactants [13].At the same time, hydrothermal carbon shows high adsorption characteristics of lead and arsenic [14].Bananas are the world's fifth largest crop and second largest fruit, accounting for about 16 percent of the total fruit production. With the rapid growth of China's industrialization process, banana cultivation has been gradually industrialized, and its output has increased rapidly [15], with the output exceeding 12.1 million tons in 2022. Banana peel, as a by-product in the processing of banana products (food, beverage, chemical), accounts for 30-40% of the total weight of bananas [16], and is a typical biomass waste. The main problem it faces is low recycling efficiency. Studies have shown that hydrothermal carbon with high added value can be obtained for heavy metal adsorption by using the hydrothermal method of banana peel [17], and it has good adsorption properties for lead and arsenic [18].In order to further improve the adsorption performance of hydrothermal carbon, modification is an effective way to change the surface activity of hydrothermal carbon. There are few studies on surface modification of banana peel hydrothermal carbon, improving functional groups and promoting surface affinity [19].Based on this, this study attempts to prepare modified hydrothermal carbon as adsorption material in the reaction kettle with banana peel under different phosphoric acid solutions at 240℃, to study the influence of hydrothermal carbon on the removal performance of lead ions in the solution under different phosphoric acid solutions, pH value, solid-liquid ratio and adsorption time, and analyze the surface morphology of hydrothermal carbon by XRD and SEM. In order to provide basic data and theoretical basis for the industrial application of preparation of hydrothermal carbon modified by phosphoric acid solution to remove lead ions from solution.
2. Materials and Methods
2.1. Raw Materials
Banana peel, bought from the food market in Taiyuan.
2.2. Reagents
Phosphoric acid (H3PO4), xylenol orange (C31H32N2O13S), ice acetic acid (CH3COOH), sodium acetate (CH3COONa), all the above reagents are analytically pure, from Shanghai Maclin Biochemical Technology Co, LTD; Hydrochloric acid is analytically pure, from Sinopharm Group Chemical Reagent Co, LTD.1000mL Lead Standard Solution from Shanghai Maclin Biochemical Technology Co, LTD.
2.3. Experimental methods
2.3.1. Preparation of banana peel hydrothermal charcoal
The banana peel purchased in the market was washed with tap water, put into a 105℃ drying oven to constant weight, and then crushed, over 80 mesh standard sample screening. Put into the reaction kettle and carry out hydrothermal carbonization under N2. The temperature rose from room temperature to 240℃ at 10℃/min, and the heat was kept for 120min.Naturally cooled to room temperature, put the hydrothermal products into a drying oven to constant weight, after secondary grinding, over 70 mesh standard sample screening, to prepare the banana peel hydrothermal charcoal.
2.3.2. Preparation of phosphoric acid modified hydrothermal carbon
Phosphoric acid solutions of different concentrations (1.0mol/L, 1.5mol/L, 2.0mol/L, 3.0mol/L) were mixed with banana peel, soaked in a constant temperature water bath oscillator (45℃,200rpm) for 6h, and then put into a hydrothermal reactor for hydrothermal carbonization under N2. The temperature rose from room temperature to 240℃ at 10℃/min, and the heat was kept for 120min.Naturally cooled to room temperature, the hydrothermal products into a drying oven to constant weight, after secondary grinding, over 70 mesh standard sample sieve, to prepare the modified hydrothermal carbon.
2.3.3. Adsorption experiment
Add ultra-pure water into the lead standard liquid, and configure it into 50mg/L, 100mg/L, 400mg/L and other lead ion reserve liquid. A certain amount of hydrothermal carbon was put into lead solution according to a certain ratio of solid to liquid, and then the adsorption experiment was carried out in a constant temperature water bath oscillator. After the oscillation was over, the supernatant was left standing and 10ml was taken into the centrifuge tube. After centrifugation, the absorbance of the supernatant was measured by spectrophotometry. According to the standard curve of lead solution, the adsorption capacity and removal rate of hydrothermal carbon were calculated according to formula (1) and (2). All experiments were conducted in triplicate, and the results were the average values of the three experiments.
where, qe is adsorption capacity, mg/g; η is removal rate, %; C0, Ce,t are respectively the initial and post-adsorption concentrations of lead solution, mg/L; V is the volume of the solution, L; m is the mass of modified hydrothermal carbon, g.
2.3.4. Characterization of hydrothermal carbon in banana peel
The pH value of the solution was determined by PHSJ-3F pH meter (precision 0.1, Shanghai Yizheng Scientific Instrument Co., LTD.). The concentration of lead in solution was determined by P4 UV-visible spectrophotometer (Shanghai Meida Instrument Co., LTD.).TESCANMIRALMS scanning electron microscope (Tesken (China) Co., LTD.) was used to obtain the surface morphology of hydrothermal carbon before and after modification. The accelerated voltage was 10kV.The properties of hydrothermal carbon surface before and after modification were analyzed with Empyrean X-ray diffractometer (Malven Instrument Co., LTD.).
3. Results
3.1. Surface structure and properties of hydrothermal carbon before and after modification
3.1.1. SEM analysis
Figure 1 shows the SEM images of hydrothermal carbon before and after modification. As can be seen from the figure, in Figure 1(a), the surface of the unmodified hydrothermal carbon is smooth and there are fewer carbon microspheres. In Figure 1(b), many carbon microspheres with different sizes are generated on the surface of the modified hydrothermal carbon. The smaller carbon particles are more numerous, and their diameters are only tens of nanometers. Thus, surface pores are formed [20]. Many gases such as CO2 and CxHy are generated, which change the carbon skeleton structure and form pores with different sizes and structures [21].
As shown in Figure 1(c), with the phosphoric acid concentration increasing to 1.5mol/L, the surface microspheres are larger and most microspheres are 2-3μm in diameter. In Figure 1(d), with the increase of phosphoric acid concentration, the etching in hydrothermal reaction gradually increases, and the surface of hydrothermal carbon becomes rough and uneven, and the surface pores increase. In Figure 1(e), as the concentration continues to increase, surface pores decrease, and it is predicted that the internal pore structure of hydrothermal carbon begins to collapse and the structure begins to be destroyed. This is because the high concentration of phosphoric acid will make the insoluble fatty acids will adhere to the hydrothermal carbon, a large number of hydrothermal carbon together, unable to participate in the reaction; It may also be caused by the serious destruction of pore structure caused by a large amount of gas [22].
3.1.2. FT-IR analysis
Figure 2 shows the FT-IR diagram of hydrothermal carbon before and after modification. It can be seen from the figure that most of the functional groups on the surface of the modified hydrothermal carbon before modification are retained, but there are also vibration peaks in different positions. In the functional group region, the vibration peaks on the surface of hydrothermal carbon at 2921cm−1 and 2851cm−1 before and after modification are attributed to aliphatic C-H stretching vibration.2500 ~ 2000 cm−1 has no obvious absorption peaks of the three key compounds, the absorption peak at 1719 cm−1 belongs to carboxyl groups, aldehydes, ketones and esters on the vibration of the C═O, appeared in 1000 cm−1 C-O-O-C/C vibration peak, shows that hydrothermal carbon surface has a large number of oxygen containing functional groups, Most of them are hydrophilic functional groups, which is conducive to the better dispersion of hydrothermal carbon in aqueous solution and provides more active sites for the occurrence of chemical reactions [23]. Appeared in the 1650 cm−1 C═C vibration, the reason may be due to the generated in the process of water thermal hydrolysis of small molecules formed by dehydration, condensation, and aromatization carbon carbon bond and double bond, generate the aromatic compounds [24].
With the increase of concentration of phosphoric acid solution, C═C、C═O and O/C or C-O-C stretching vibration increase fell, after the first in phosphoric acid solution concentration is 2 mol/L maximum stretching vibration, and obviously better than unmodified water burning charcoal, description of the modified water burning charcoal surface increased a lot of oxygen containing functional groups, largely increased the Pb(Ⅱ) adsorption, It is also one of the important reasons that hydrothermal carbon can act as an adsorbent. A strong stretching vibration peak appears at 1100cm−1, but does not appear on the surface of the modified hydrothermal carbon. The analysis of this peak is attributed to the characteristic peak of P-O [25], indicating that there are more phosphoric acid ions on the surface of the modified hydrothermal carbon, which can react with Pb(Ⅱ) and improve the removal rate of lead.
3.1.3. XRD analysis
Figure 3 shows the XRD pattern of hydrothermal carbon surface before and after modification. As can be seen from the figure, the positions of peaks in the figure are roughly the same, with characteristic peaks of potassium chloride appearing at 28.3°, 40.5° and 50.2°. When the diffraction Angle is about 22.3° or 22.5°, the corresponding peak belongs to the characteristic peak No. 002 of graphite, indicating that with the increase of phosphoric acid concentration, the width of the peak gradually increases and the carbonization degree of hydrothermal carbon increases [26]. The appearance of this peak also indicates that hydrothermal carbon before and after modification is amorphous carbon, which is suitable for use as adsorbent materials [27].
3.2. Analysis of adsorption performance of lead ions by modified hydrothermal carbon
3.2.1. Influence of phosphoric acid concentration on adsorption effect of hydrothermal carbon
The experimental conditions were as follows: adsorption temperature 25℃, initial concentration of lead ion 50mg/L, solid-liquid ratio 1g/L, adsorption equilibrium state. The adsorption experiments were carried out on hydrothermal carbon modified by different phosphoric acid solutions. Formulas (1) and (2) were used to calculate hydrothermal carbon adsorption capacity and hydrothermal carbon yield. The calculated results are shown in Figure 4.
As can be seen from Figure 4, the removal rate of lead from modified hydrothermal carbon increases with the increase of phosphoric acid concentration, and the overall trend is first increasing and then stabilizing. When the phosphoric acid concentration is 3.0mol/L, the adsorption capacity of modified hydrothermal carbon reaches 40.65mg/g, and the removal rate is 81.84%. Compared with the adsorption capacity of 15.32mg/g and removal rate of 30.64% before modification, the adsorption capacity increased by 2.6 and 2.7 times, respectively. This is related to the hydrolysis of cellulose and hemicelluloses in banana peel by phosphoric acid, resulting in the formation of many chain molecules that combine with phosphoric acid ions and increase the active groups on the surface of hydrothermal carbon to promote adsorption [28].In view of the large adsorption capacity of lead ions by modified hydrothermal carbon when phosphoric acid concentration is 2.0mol/L, phosphoric acid concentration is taken as the standard in the following adsorption experiments.
3.2.2. Influence of pH value on adsorption effect of lead ion
The experimental conditions were as follows: adsorption temperature 25℃, initial concentration of lead ion 50mg/L, solid-liquid ratio 1g/L, concentration of phosphoric acid solution 2mol/L, adsorption equilibrium, pH value of solution in the range of 2~7.The adsorption results of pH value on modified hydrothermal carbon are shown in Figure 5.
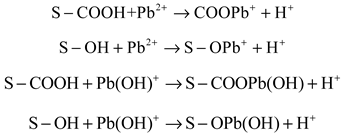
As can be seen from Figure 5, in the range of pH value from 2 to 6, the adsorption capacity and removal rate of Pb by modified hydrothermal carbon rapidly increase with the increase of solution pH value. When pH value was 6, the adsorption capacity and removal rate reached the peak, which were 41.37mg/g and 82.74%, respectively. When pH of solution was 2, the adsorption capacity and removal rate were lower, which were 14.84mg/g, 14.32mg/g and 27.68%, respectively. When pH=7, the adsorption capacity and removal rate began to decrease, indicating that pH value has a certain effect on the removal rate of lead. Lead ions exist in the following forms in solutions with different pH values: Pb+, Pb(OH)+,Pb(OH)2,Pb(OH)3- ,Pb(OH)42- , Pb2(OH)3+, respectively [29]. When the concentration of H+ in the solution is too high, lead ions will form a competitive relationship with H+. The higher the concentration of H+, the less competitive lead ions will be, which is unable to combine with the active site on the surface of hydrothermal carbon, which is not conducive to the smooth process of adsorption. At the same time, at a higher concentration of H+, the functional group is protonated [30], resulting in a strong interaction between the positive charge and lead ions, which is not easy to carry out the smooth adsorption. Literature [31] shows that there is a trade-off relationship between Pb ions and H+ in solution, and a series of displacement reactions may occur on the surface of hydrothermal carbon. The specific equation is as follows:
3.2.3. Influence of solid-liquid ratio on adsorption effect of hydrothermal carbon
The experimental conditions were as follows: adsorption temperature 25℃, initial concentration of lead ion 50mg/L, concentration of phosphoric acid solution 2mol/L, adsorption equilibrium, solid-liquid ratio in the range of 0.5~4g/L. The adsorption results of the solid-liquid ratio of modified hydrothermal carbon are shown in Figure 6.
As can be seen from Figure 6, in the range of 0.5~4g/L solid-liquid ratio, with the increase of solid-liquid ratio, the adsorption capacity of modified hydrothermal carbon for lead gradually decreases. When the solid-liquid ratio was 0.5g/L, the adsorption capacity was 48.56mg/g, and when the solid-liquid ratio was 4g/L, the adsorption capacity was 10.75mg/g. The removal rate increases first and then tends to be stable. The peak removal rate occurs when the solid-liquid ratio is 1g/L, reaching 83.25%. This trend is due to the rapid adsorption reaction of phosphate ions on lead when the solid-liquid ratio is low, which can quickly adsorb lead. With the increase of solid-liquid ratio, the active sites available for adsorption also increase, and hydroxyl (-OH ) and carboxyl (-COOH ) are more easily in contact with Pb(Ⅱ), and the adsorption effect is enhanced. When the solid-liquid ratio continues to increase, hydrothermal carbon agglomeration will occur [32], and the active sites on the surface cannot be fully utilized, the adsorption capacity decreases, the removal rate of heavy metals increases, but the economy decreases.
3.2.4. Analysis of adsorption performance and kinetics by adsorption time
The experimental conditions were as follows: adsorption temperature 25℃, initial concentration of lead ion 50mg/L, solid-liquid ratio 1g/L and phosphoric acid solution concentration 2mol/L. The adsorption reached equilibrium and the adsorption time was 0-300min.The influence of modified hydrothermal carbon on the adsorption effect as the adsorption time changes is shown in Figure 7.
As can be seen from Figure 7, with the increase of adsorption time, the adsorption capacity of modified hydrothermal carbon increased first and then tended to be flat. After 250min, the adsorption capacity of hydrothermal carbon for lead ions basically did not change, reaching 81.66%. The results showed that P-HTC adsorption occurred mainly in the first 60min. This is mainly because in the initial stage of adsorption, the relative concentration of lead ions in the solution is high, there are many unoccupied active sites, adsorbent and lead ions collision probability is high, easy adsorption. After 180min, with the decrease of lead ion concentration and the decrease of adsorption sites on the surface of the modified hydrothermal carbon, the probability of collision is greatly reduced, which is not conducive to adsorption [33].
where, qt is the adsorption capacity at time t, mg/g; qe is the equilibrium adsorption capacity, mg/g; k1 and k2 are rate constants, min−1; t is the reaction time, s; α and β are adsorption and desorption rate constants mg/(g·min−2), respectively.
The above data were fitted by the quasi-first-order dynamic model (3), quasi-second-order dynamic model (4) and Elovich model (5), and the fitting results were shown in Figure 8 and Table 1.
As can be seen from Table 1, among the three kinds of kinetic fitting, the correlation coefficients R2 from low to high are respectively Elovich model, quasi-first-order kinetic model and quasi-second-order kinetic model, in which the correlation coefficient R2 reaches 0.99 after the simulation of the experimental data by the quasi-second-order kinetic model. The calculated maximum adsorption capacity of the modified hydrothermal carbon (42.68mg/g) was close to the actual adsorption capacity (41.26mg/g), and the relative error was 3.3%.The assumption of the quasi-second-order kinetic model is that there is electron sharing or electron transfer between the adsorbent and the adsorbent during the adsorption process, and the adsorption rate mainly depends on chemisorption. The adsorption process of Pb(Ⅱ) by modified hydrothermal carbon is more consistent with the quasi-second-order kinetic model after fitting, which indicates that the adsorption process is limited by chemisorption, and also reflects that the process is mainly chemisorption [34].
3.2.5. Modified hydrothermal carbon isothermal adsorption analysis
Figure 9 shows the adsorption time 120min, initial solution concentration 0-500mg/L, adsorption time 120min, solid-liquid ratio 1g/L, the concentration of modified phosphoric acid 2mol/L, and the change curve of the removal rate of lead solution with different initial concentrations of modified hydrothermal carbon at different adsorption temperatures. As can be seen from the figure, with the increase of the initial concentration, the adsorption capacity of Pb(Ⅱ) by the modified hydrothermal carbon showed a rapid increase trend, and then tended to be flat, reflecting that the active site on the surface of the effluent hot carbon changed from unsaturated state to saturated state, and finally reached the adsorption limit and equilibrium state. The adsorption capacity of hydrothermal carbon is also different at different temperatures. With the increase of temperature, the adsorption capacity of hydrothermal carbon is gradually increasing. It was found that the increase of temperature was beneficial to the Brownian motion of molecules, increased the effective collision between Pb(Ⅱ) and surface active functional groups, and was conducive to the molecules entering the more internal pore structure and increasing the adsorption capacity, indicating that the increase of temperature was conducive to the adsorption. The isotherm fitting results combined with the kinetic fitting results showed that the adsorption of Pb(Ⅱ) by modified hydrothermal carbon was monolayer adsorption, and there was mutual repulsive force between the adsorbed Pb(Ⅱ) [35]. Pb(Ⅱ) had to find a new active site, and the process was relatively difficult, resulting in a slow increase in the adsorption rate, and the final adsorption and desorption rates were the same, reaching equilibrium.
As can be seen from Table 2, when the temperature is 293K, 303K and 313K, the correlation coefficients R2 (0.94, 0.92, 0.90) fitted by Freundlich isotherm model are all smaller than those fitted by Langmuir isotherm model (0.95, 0.97, 0.96).The fitted maximum adsorption capacity (103.24mg/g) in Langmuir model is closer to the actual maximum adsorption capacity (101.19mg/g), indicating that Langmuir model is more suitable to describe the adsorption process of Pb(Ⅱ) by modified hydrothermal carbon. Langmuir model assumes that in a fixed container, the adsorption capacity per unit area of the surface of the adsorbent is the same, and only one layer of adsorbent can be adsorbed at the surface adsorption site, that is, monolayer adsorption.
3.2.6. Artificial neural network model
In this study, Netrual Net Fitting module in MATLAB was used to build the artificial neural network structure as shown in Figure 10 [36], and the fitting results of the P-HTC adsorption data were simulated. The input values were solution pH, initial concentration, oscillation time, solid-liquid ratio and different temperatures corresponding to the adsorption. Corresponding to the Target parameter in the table (the actual calculated value), the Output value is the adsorption capacity and removal rate, corresponding to the output parameter in the table (the fitting value), the hidden layer is determined by Kolmogorov theorem [37].
As shown in Figure 11, solid and dotted lines represent fitted and actual values, and small black circles represent input data values. The fitting results are divided into four parts. The blue line is ANN's data fitting, and 70% of the data is input as training. The green line represents the fitting line used to verify the training results. Input 15% data value; The red line represents the fitting line of the test fitting data, input 15% of the data value; The black lines represent all of the above data fitting results.
As can be seen from Figure 11, the fitting degree of training data is 0.99, and the data used for testing and verification are both 0.99, indicating good fitting effect. After the simulation of artificial neural network, all the data are exported and saved. The module will automatically generate the code that can predict the adsorption capacity. Five variables are taken as input values, input the code into the program and run it.
where: qF -- represents the adsorption capacity predicted by ANN, mg/g; qe -- represents the concentration of adsorbent in solid phase at actual equilibrium, mg/g; |∆q|-- represents the error between predicted adsorption capacity and actual adsorption capacity, %; ηc-- represents the removal rate predicted by ANN, %; η-- represents the removal rate of actual adsorbent, %; |∆η|-- represents the error between predicted removal rate and actual removal rate, %.
As shown in Table 3, one of the single factors is selected as variable, and the other four single factors remain unchanged. There are five single factors in total, and five working conditions are taken. It can be seen that the error values of adsorption capacity and removal rate are not more than 5%. The reason why the error is close to 5% is that the experimental data of pH and solid-liquid ratio are less than the other three factors, resulting in a larger error after training, but the overall predicted value is close to the real value. It shows that this method can be used to predict the adsorption situation, avoid a lot of repeated experiments, can understand the adsorption effect of hydrothermal carbon faster, and provide a theoretical reference for the application of hydrothermal carbon to industrial design in the future.
3.2.7. Modified hydrothermal carbon isothermal adsorption analysis
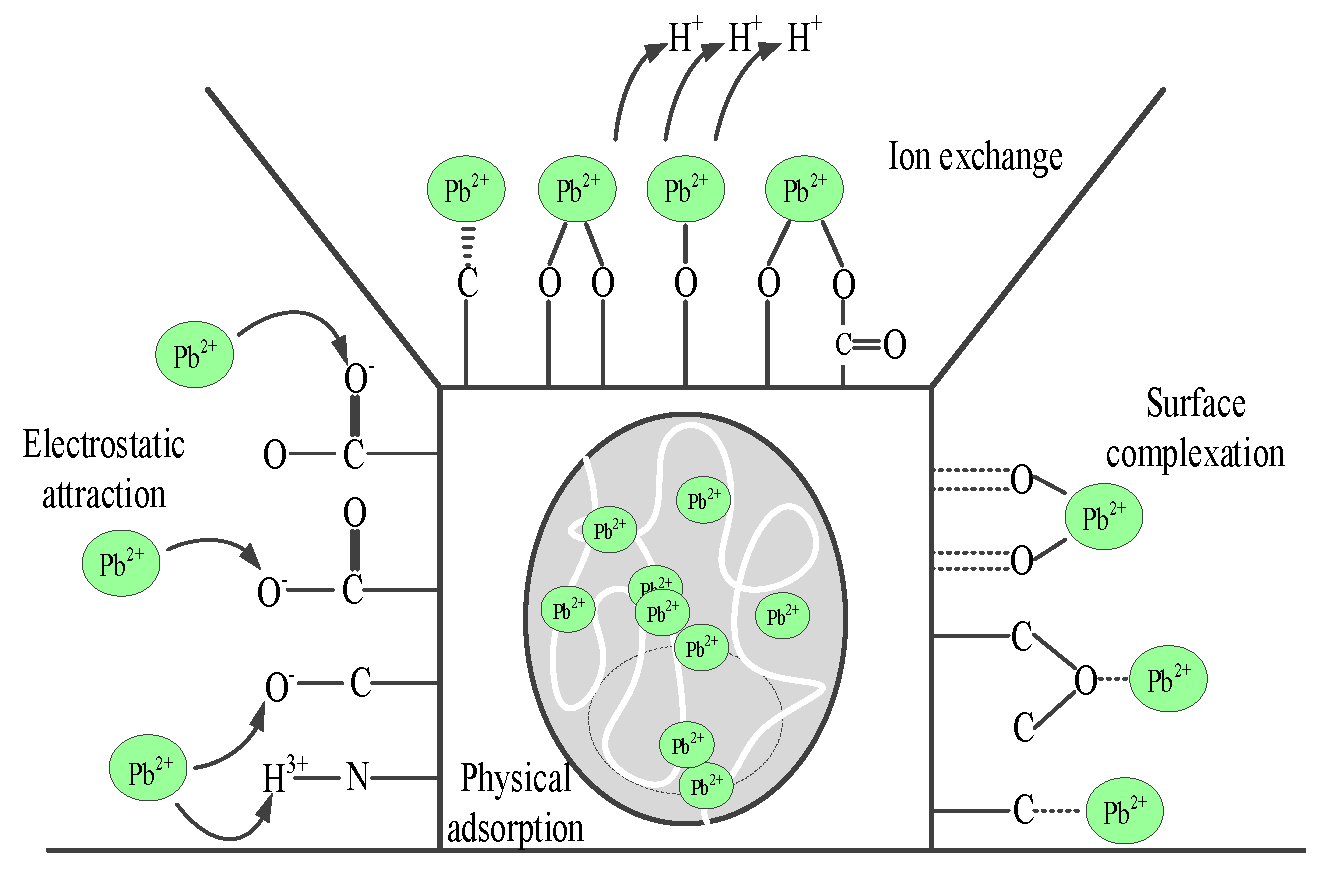
Figure 12 shows the adsorption mechanism of Pb(Ⅱ) by hydrothermal carbon, including four parts. Physical adsorption [38]. According to SEM images of hydrothermal carbon, there are abundant pores and fold structures on its surface, which increase the van der Waals forces between molecules and enhance the physical adsorption. With the process of adsorption, the surface adsorption sites decrease, and Pb(Ⅱ) will gradually diffuse from the surface to the interior of the hole to find new adsorption sites and complete the adsorption. Electrostatic attraction [39]. According to the FT-IR diagram of hydrothermal carbon, its surface contains a large number of oxygen-containing functional groups, such as -COO-, -OH-, -CO- and -NH3+, which are negatively charged due to deprotonation and will adsorb Pb(Ⅱ) by electrostatic attraction. On ion exchange [40], the unprotonated acidic functional group and protonated delocalized π electron pair (-Cπ-H3O+ ) hydrogen will be replaced by Pb(Ⅱ), and then H+ will be analyzed to form polyatoms, and Pb(Ⅱ) ion exchange adsorption. There may be π-π interaction in the adsorption process, forming π stacking structure and increasing ion exchange. Surface complexation [41]. According to the FT-IR diagram of hydrothermal carbon, the surface of hydrothermal carbon contains a large number of hydroxyl and carboxyl groups, and the lone pair electrons of hydroxyl and carbonyl groups can be shared with Pb(Ⅱ) and adsorbed on the surface of hydrothermal carbon.
Figure 12.
Schematic diagram of the mechanism of adsorption of Pb(Ⅱ) by the hydrothermal carbon.
4. Conclusion
The physicochemical properties of banana peel modified by phosphoric acid were studied by SEM, FT-IR and XRD. The effects of pH, adsorption time, solid-liquid ratio and initial concentration of phosphoric acid on the adsorption of modified hydrothermal carbon were studied. The adsorption mechanism of Pb(Ⅱ) by modified hydrothermal carbon was studied by means of adsorption thermodynamics and kinetics simulation. The following conclusions are drawn:
- (1)
- There is a large carbon sphere particle in the modified hydrothermal carbon, the diameter of 2-3μm, hydrothermal material is mainly amorphous carbon shape, its surface has a large number of oxygen-containing functional groups, which is conducive to adsorption.
- (2)
- The adsorption experiments of hydrothermal carbon modified with different concentrations of phosphoric acid showed that pH value, temperature, oscillation time and initial concentration were positively correlated with the adsorption capacity of Pb(Ⅱ) by hydrothermal carbon modified with different concentrations of phosphoric acid, while the solid-liquid ratio was opposite to the adsorption capacity.
- (3)
- Langmuir model of isotherm model is more suitable to describe the thermodynamic process of Pb(Ⅱ) adsorption by modified hydrothermal carbon, indicating that the adsorption is mainly monolayer chemisorption. The quasi-second-order kinetic model can better describe the kinetic adsorption process of Pb(Ⅱ) by hydrothermal carbon, indicating that the chemical adsorption is the main process. Artificial neural network fitting correlation R=0.99.
- (4)
- Through model fitting and characterization analysis, the adsorption mechanism of Pb(Ⅱ) on hydrothermal carbon was studied, including physical adsorption, electrostatic attraction, ion exchange and surface complexation.
References
- DING L, WANG P, LIU H, et al. Research Progress in Functionalized Metal-Organic Frameworks Materials for Adsorptive Removal of Lead Ions from Wastewater [J]. Material Guide, 2022, 36(20): 40-50. [CrossRef]
- ZHU J B, ZHAO J B, ZHOU S P, et al. Study on Adsorption Performance and Mechanism of Peanut Shell Biochar for Pb2+ and Cd2+ in Water [J]. Journal of Southwest Forestry University, 2022, 42(5): 78-86.
- Yao Jiakang,Wang Leiming,Zhang Guangwei,Tao Jinliang,Shi Xiaoping,Wei Feng. Plate structure optimization and performance study of a new continuous flow electrocoagulation reactor[J]. Chemical Engineering Research and Design,2023,194. [CrossRef]
- Madrid Felipe M Galleguillos,ArancibiaBravo María P,Sepúlveda Felipe D,Lucay Freddy A,Soliz Alvaro,Cáceres Luis. Ultrafine Kaolinite Removal in Recycled Water from the Overflow of Thickener Using Electroflotation: A Novel Application of Saline Water Splitting in Mineral Processing.[J]. Molecules (Basel, Switzerland),2023,28(9). [CrossRef]
- Song Wenxin,Gao Zhimin,Tan Fengxun,Cheng Xiaoxiang,Yang Tao,Wu Daoji,Yang Jingxin,Liang Heng. Calcium sulfite oxidation activated by ferrous iron integrated with membrane filtration for removal of typical algal contaminants[J]. Chemosphere,2023,333. [CrossRef]
- Abdul Sattar Jatoi,Humair Ahmed Baloch,Shaukat Ali Mazari,N. M. Mubarak,Nizamuddin Sabzoi,Shaheen Aziz,Suhail Ahmed Soomro,Rashid Abro,Syed Feroz Shah. A review on extractive fermentation via ion exchange adsorption resins opportunities, challenges, and future prospects[J]. Biomass Conversion and Biorefinery,2021(prepublish). [CrossRef]
- Gherbi Bachir,Laouini Salah Eddine,Meneceur Souhaila,Bouafia Abderrhmane,Hemmami Hadia,Tedjani Mohammed Laid,Thiripuranathar Gobika,Barhoum Ahmed,Menaa Farid. Effect of pH Value on the Bandgap Energy and Particles Size for Biosynthesis of ZnO Nanoparticles: Efficiency for Photocatalytic Adsorption of Methyl Orange[J]. Sustainability,2022,14(18).
- Wang Leshi,Hao Jiuxiao,Yu Xintian,Zhang Bingjie,Sui Jun,Wang Chuanxin. Method development for the identification, extraction and characterization of melanoidins in thermal hydrolyzed sludge.[J]. The Science of the total environment,2022.
- Chuan Chen,Guangmin Liu,Qing An,Lin Lin,Yong Shang,Chunli Wan. From wasted sludge to valuable biochar by low temperature hydrothermal carbonization treatment: Insight into the surface characteristics[J]. Journal of Cleaner Production,2020,263(C). [CrossRef]
- JAGADEESH N, SUNDARAM B. Adsorption of Pollutants from Wastewater by Biochar: A Review[J]. Journal of Hazardous Materials Advances, 2023, 9: 100226. [CrossRef]
- Sun W, Bai L, Chi M, et al. Study on the Evolution Pattern of the Aromatics of Lignin during Hydrothermal Carbonization[J]. Energies, 2023, 16. [CrossRef]
- WU K. Study on reaction mechanism and product formation mechanism of water heat treatment of cow manure [D]. Huazhong Agricultural University, 2019.
- PAULINE A L, JOSEPH K. Hydrothermal carbonization of oily sludge for solid fuel recovery – investigation of chemical characteristics and combustion behaviour[J]. Journal of Analytical and Applied Pyrolysis, 2021. [CrossRef]
- SHAHROKHI-SHAHRAKI R, BENALLY C, EL-DIN M G, et al. High efficiency removal of heavy metals using tire-derived activated carbon vs. commercial activated carbon: Insights into the adsorption mechanisms[J]. 2020.128455. [CrossRef]
- Lohn Pereira Nathan Roberto,dos Anjos Felipe Eduardo,Faverzani Magnago Rachel. Lignocellulosic Residues of Banana Cultivation: A Review of the Cellulose Extraction Chemical Processes[J]. Revista Virtual de Química,2019,11(4).
- JIANG F, CAO D, HU S, et al. High-pressure carbon dioxide-hydrothermal enhance yield and methylene blue adsorption performance of banana pseudo-stem activated carbon[J]. Bioresource Technology, 2022, 354: 127137. [CrossRef]
- NIZAMUDDIN S, SIDDIQUI M T H, BALOCH H A, et al. Upgradation of chemical, fuel, thermal, and structural properties of rice husk through microwave-assisted hydrothermal carbonization[J]. Environmental Science and Pollution Research, 2018, 25(18): 17529-17539.
- WU C, HUANG L, XUE S G, et al. Arsenic sorption by red mud-modified biochar produced from rice straw[J/OL]. Environmental Science and Pollution Research, 2017, 24(22): 18168-18178.
- JOHNSON V E, LIAO Q, JALLAWIDE B W, et al. Simultaneous removal of As(V) and Pb(II) using highly-efficient modified dehydrated biochar made from banana peel via hydrothermal synthesis[J]. Colloids and Surfaces A: Physicochemical and Engineering Aspects, 2023, 663: 131115.
- Quesada-Plata F, Ruiz-Rosas R, E Morallón, et al. Activated Carbons Prepared through H3PO4-Assisted Hydrothermal Carbonisation from Biomass Wastes: Porous Texture and Electrochemical Performance[J]. ChemPlusChem, 2016.
- CUI Y, ZHAO B, XIE F, et al. Study on the preparation and feasibility of a novel adding-type biological slow-release carbon source[J]. Journal of Environmental Management, 2022, 316: 115236. [CrossRef]
- SUN K, TANG J, GONG Y, et al. Characterization of potassium hydroxide (KOH) modified hydrochars from different feedstocks for enhanced removal of heavy metals from water[J]. Environmental Science and Pollution Research, 2015, 22(21): 16640-16651. [CrossRef]
- Liu A, Liu S, Liu P, et al. Water sorption on coal: effects of oxygen-containing function groups and pore structure[J]. International Journal of Coal Science and Technology, 2021, 8(5):20. [CrossRef]
- Wu Q, Yu S, Hao N, et al. Characterization of products from hydrothermal carbonization of pine[J]. Bioresource Technology, 2017:78. [CrossRef]
- WANG Y M. Hydrothermal preparation, adsorption properties and mechanism of corn cob carbon - based adsorbent [D]. Anhui Agricultural University, 2018.
- SHAKYA A, VITHANAGE M, AGARWAL T. Influence of pyrolysis temperature on biochar properties and Cr(VI) adsorption from water with groundnut shell biochars: Mechanistic approach[J]. Environmental Research, 2022, 215: 114243.
- LUO X, FU C, SHEN S, et al. Free–templated synthesis of N–doped PtCu porous hollow nanospheres for efficient ethanol oxidation and oxygen reduction reactions[J]. Applied Catalysis B: Environmental, 2023, 330: 122602.
- TIBERG C, SJÖSTEDT C, PERSSON I, et al. Phosphate effects on copper(II) and lead(II) sorption to ferrihydrite[J]. Geochimica et Cosmochimica Acta, 2013, 120: 140-157.
- B Y Z A, D Y Y A C, D G L A C, et al. Adsorption mechanism of cadmium on microplastics and their desorption behavior in sediment and gut environments: The roles of water pH, lead ions, natural organic matter and phenanthrene[J]. Water Research, 2020, 184. [CrossRef]
- Nagireddi S, Uppaluri R, Golder A. Role of protonation and functional groups in Pd(II) recovery and reuse characteristics of commercial anion exchange resin-synthetic electroless plating solution systems[J]. Journal of Water Process Engineering, 2018, 22:227-238.
- DEBEVC S, WELDEKIDAN H, SNOWDON M R, et al. Valorization of almond shell biomass to biocarbon materials: Influence of pyrolysis temperature on their physicochemical properties and electrical conductivity[J]. Carbon Trends, 2022, 9: 100214. [CrossRef]
- IGHALO J O, RANGABHASHIYAM S, DULTA K, et al. Recent advances in hydrochar application for the adsorptive removal of wastewater pollutants[J]. Chemical Engineering Research and Design, 2022, 184: 419-456.
- Fang D, Zhuang X, Huang L, et al. Developing the new kinetics model based on the adsorption process: From fitting to comparison and prediction[J]. Science of The Total Environment, 2020, 725:138490.
- Chen M, Wang X, Zhang H. Comparative research on selective adsorption of Pb(II) by biosorbents prepared by two kinds of modifying waste biomass: Highly-efficient performance, application and mechanism[J]. Journal of Environmental Management, 2021, 288:112388. [CrossRef]
- Ting Wang, Liu W, Xiong L, et al. Influence of pH, ionic strength and humic acid on competitive adsorption of Pb(II), Cd(II) and Cr(III) onto titanate nanotubes[J]. Chemical Engineering Journal, 2013. [CrossRef]
- Rostami S, Toghraie D, Shabani B, et al. Measurement of the thermal conductivity of MWCNT-CuO/water hybrid nanofluid using artificial neural networks (ANNs)[J]. Journal of Thermal Analysis and Calorimetry, 2021, 143(2):1097-1105.
- Věra Krková. Kolmogorov's theorem and multilayer neural networks[J]. Neural Networks, 1992, 5( 3):501-506. [CrossRef]
- Abd A A, Naji S Z, Hashim A S, et al. Carbon dioxide removal through Physical Adsorption using Carbonaceous and non-Carbonaceous Adsorbents: A review[J]. Journal of Environmental Chemical Engineering, 2020, 8(5):104142.
- Jawad A H, Abdulhameed A S, Mastuli M S. Acid-factionalized biomass material for methylene blue dye removal: a comprehensive adsorption and mechanism study[J].
- Peng H, Guo J. Removal of chromium from wastewater by membrane filtration, chemical precipitation, ion exchange, adsorption electrocoagulation, electrochemical reduction, electrodialysis, electrodeionization, photocatalysis and nanotechnology: a review[J]. Environmental Chemistry Letters, 2020. [CrossRef]
- Swa B, Jhkb C, Msid E, et al. Biochar surface complexation and Ni(II), Cu(II), and Cd(II) adsorption in aqueous solutions depend on feedstock type - ScienceDirect[J]. Science of The Total Environment, 712. [CrossRef]
Figure 1.
SEM diagram of hydrothermal carbon surface before and after phosphoric acid modification.
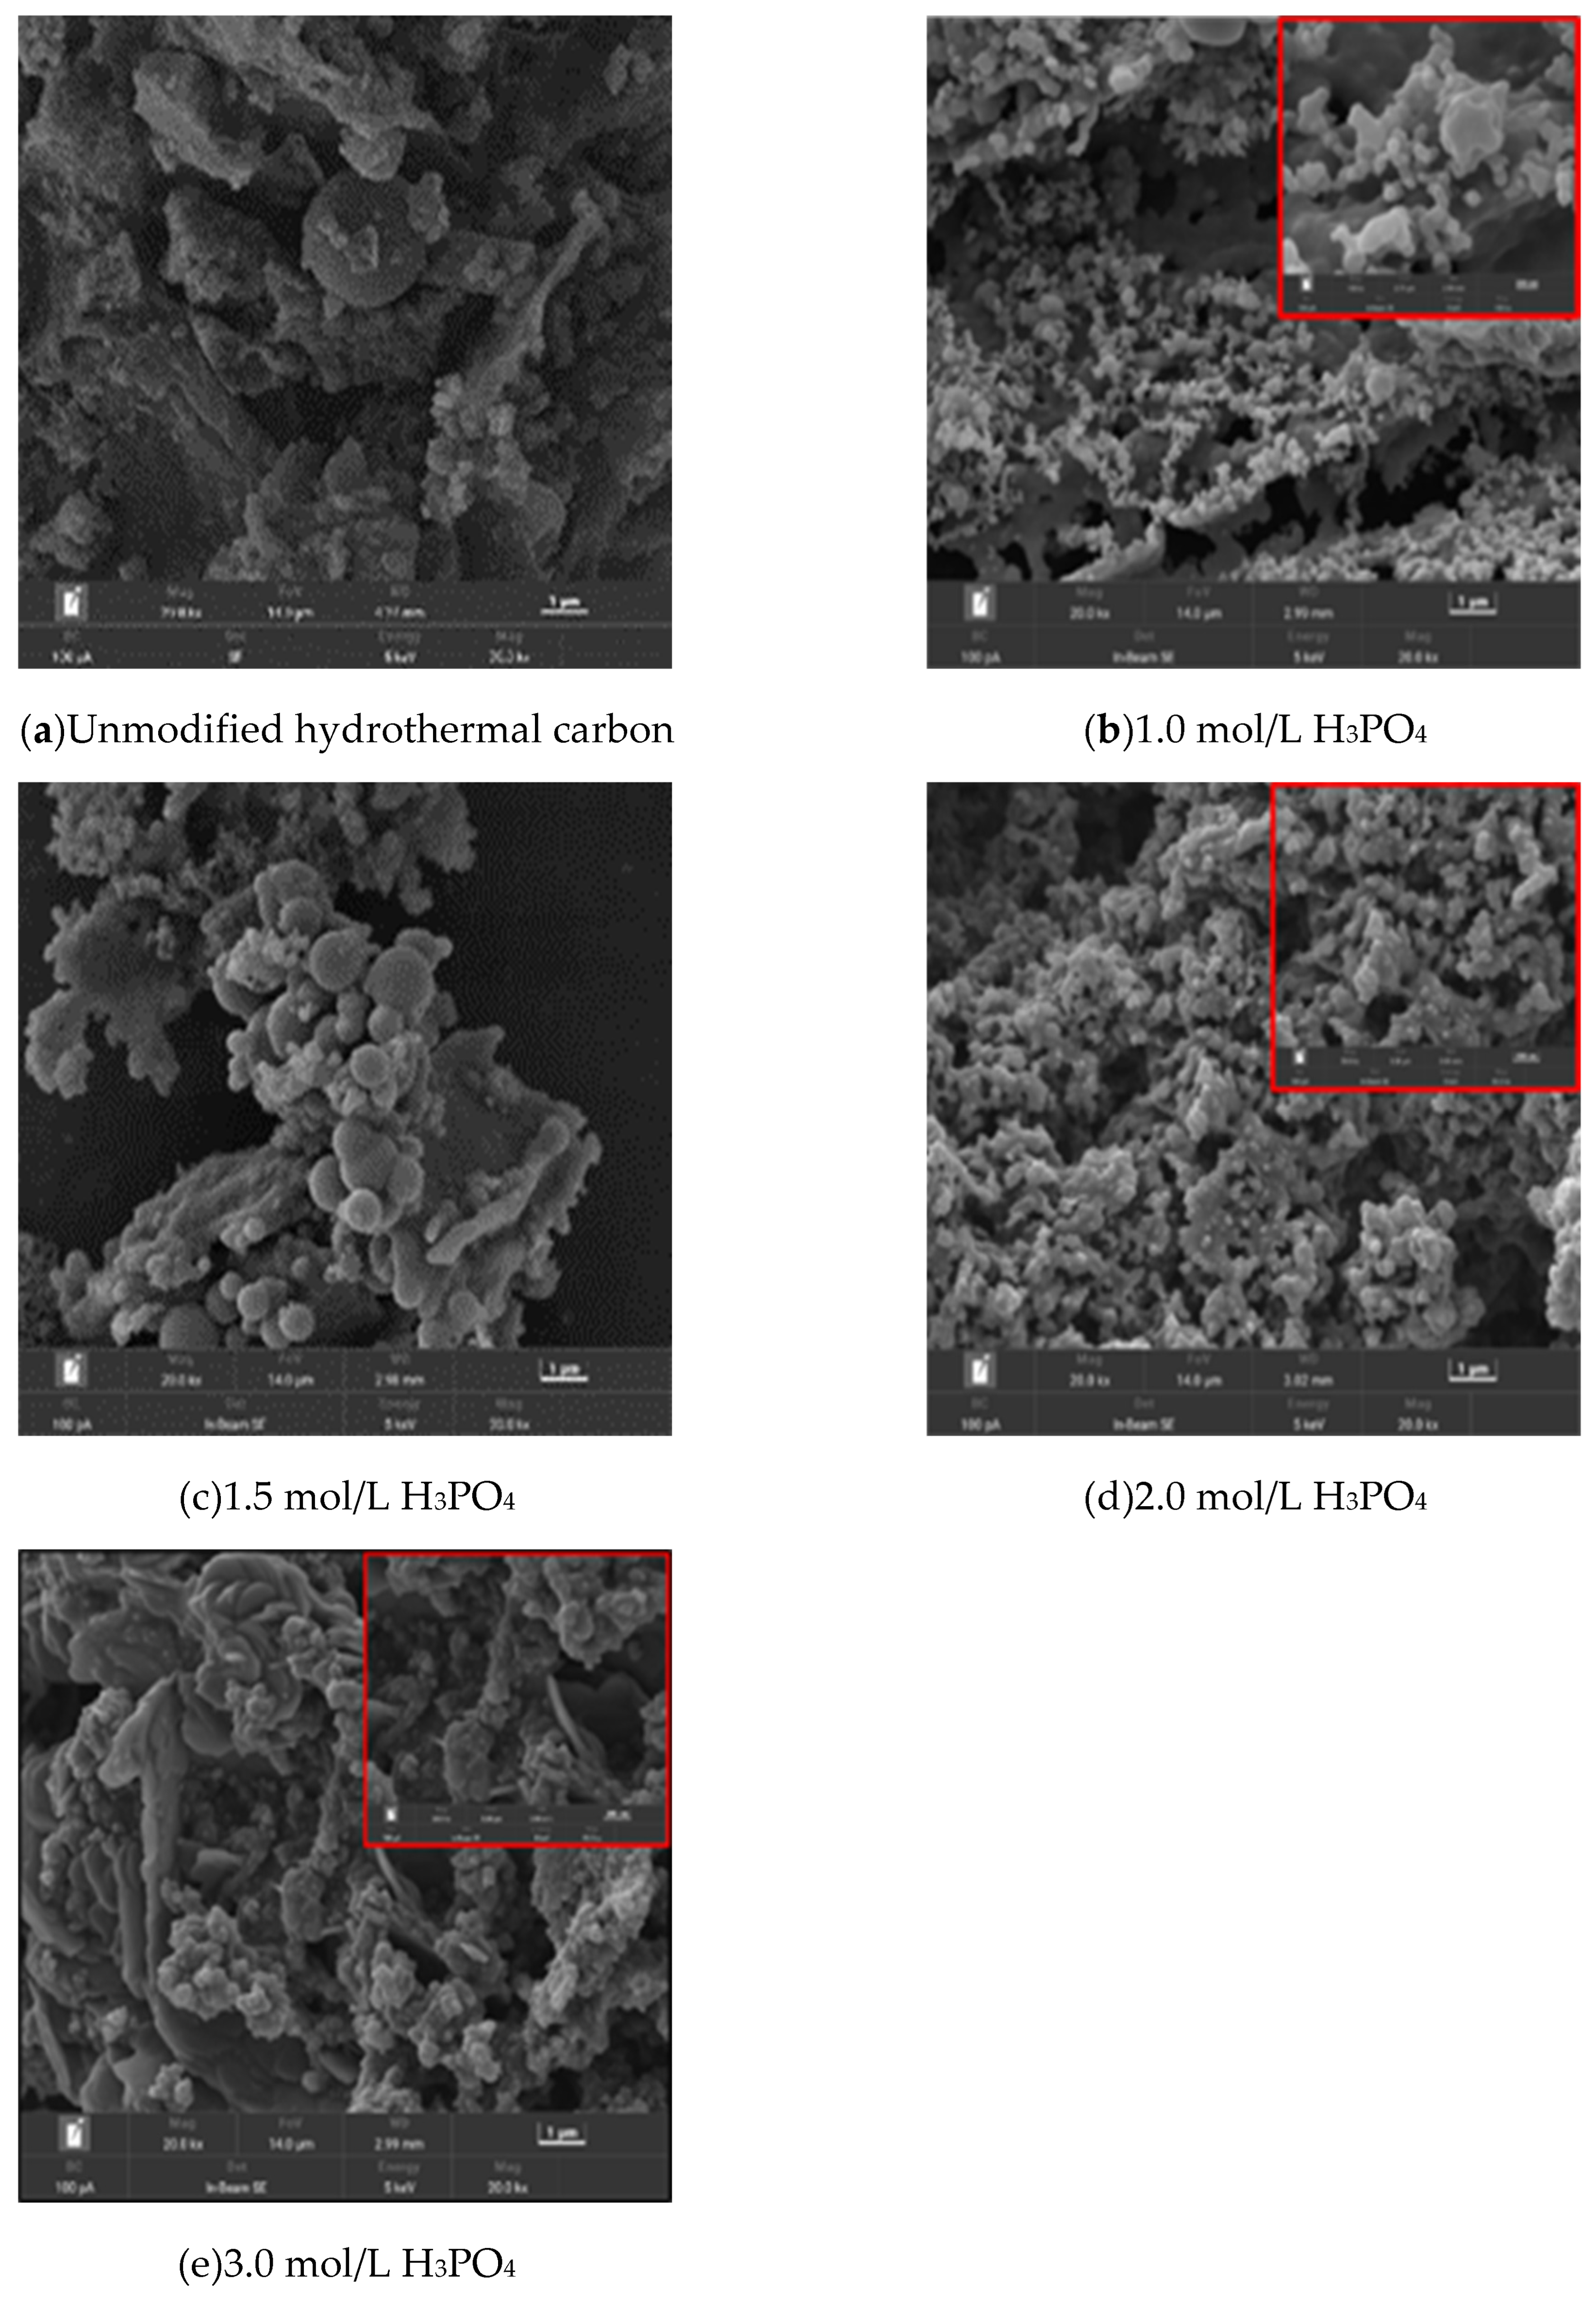
Figure 2.
FT-IR diagram of hydrothermal carbon before and after phosphoric acid modification.
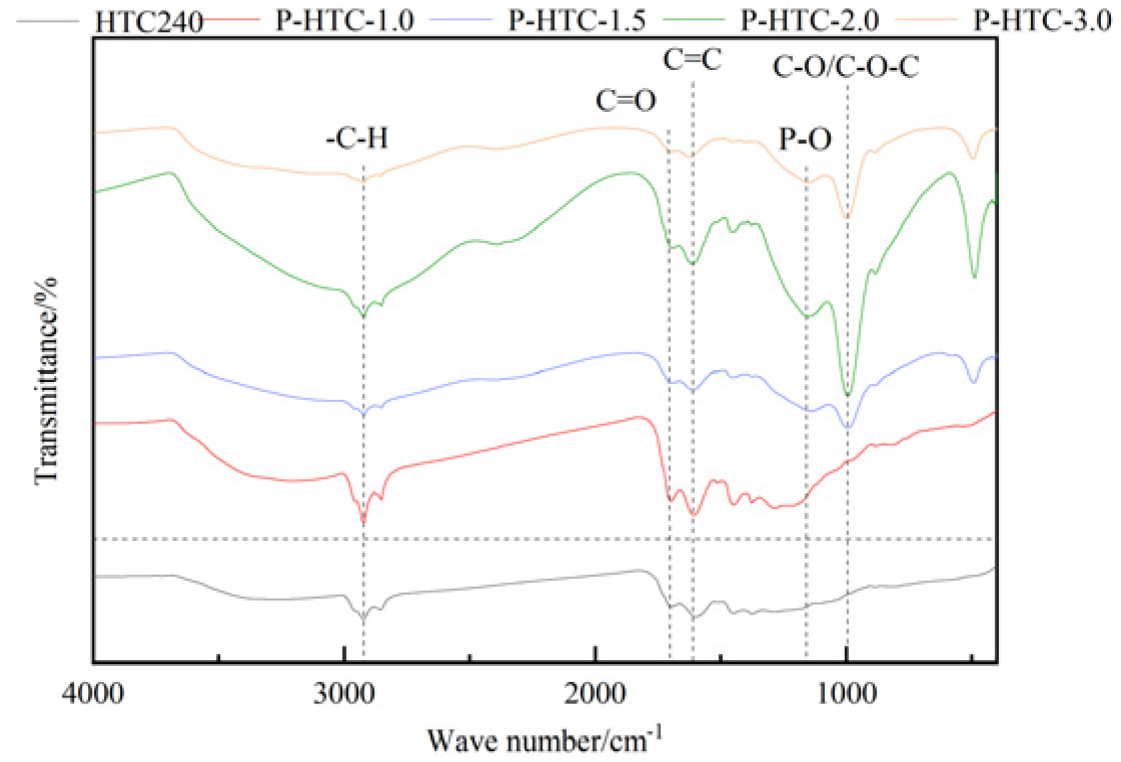
Figure 3.
XRD patterns of unmodified and phosphoric acid modified hydrothermal carbon.
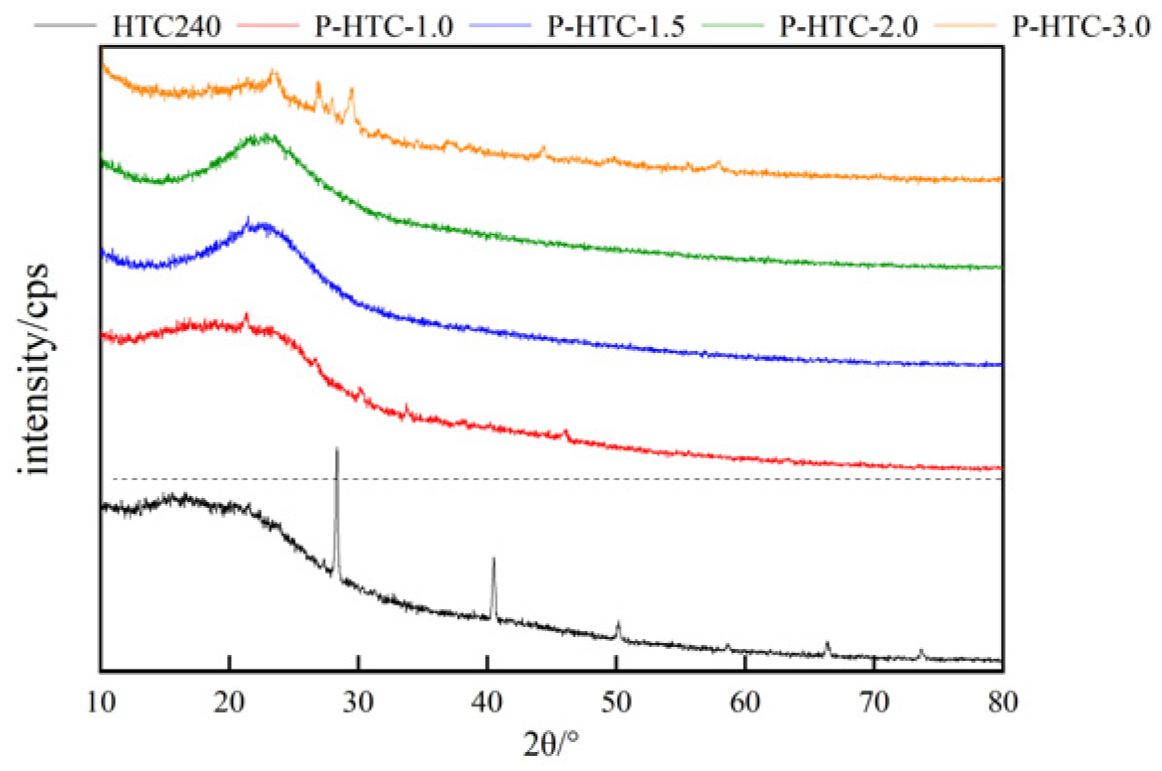
Figure 4.
Effect of different phosphoric acid concentration on the adsorption of hydrothermal carbon.
Figure 4.
Effect of different phosphoric acid concentration on the adsorption of hydrothermal carbon.
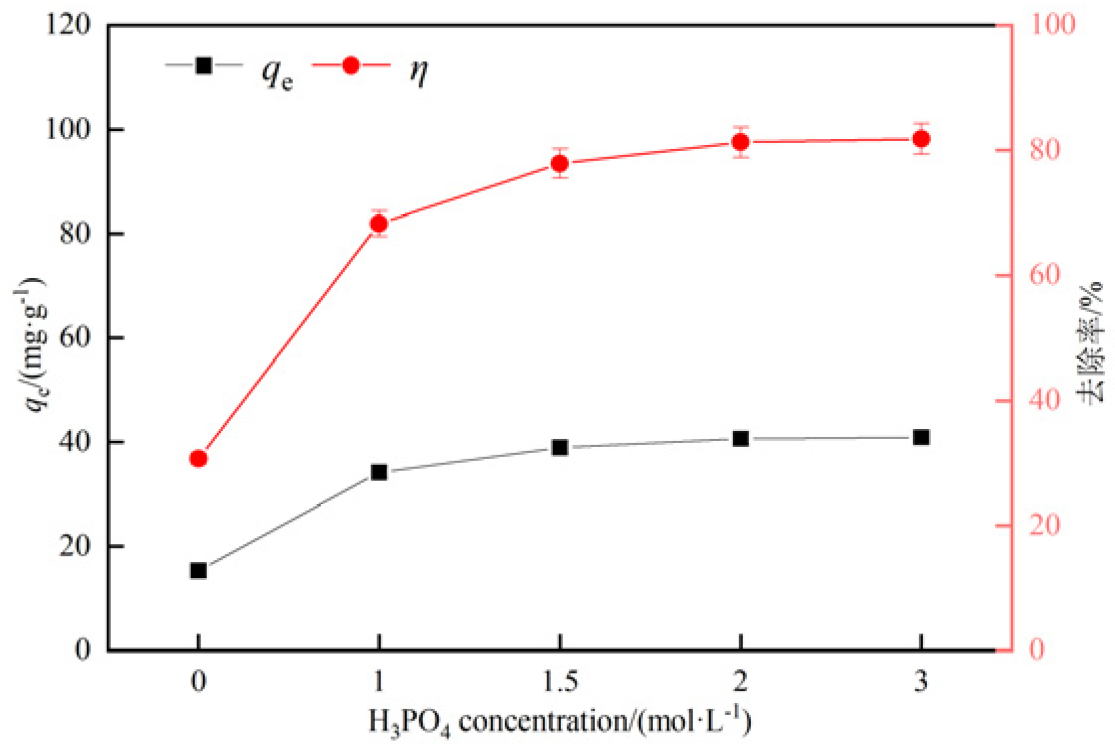
Figure 5.
Effect of pH value on adsorption of PB (II) by modified hydrothermal carbon.
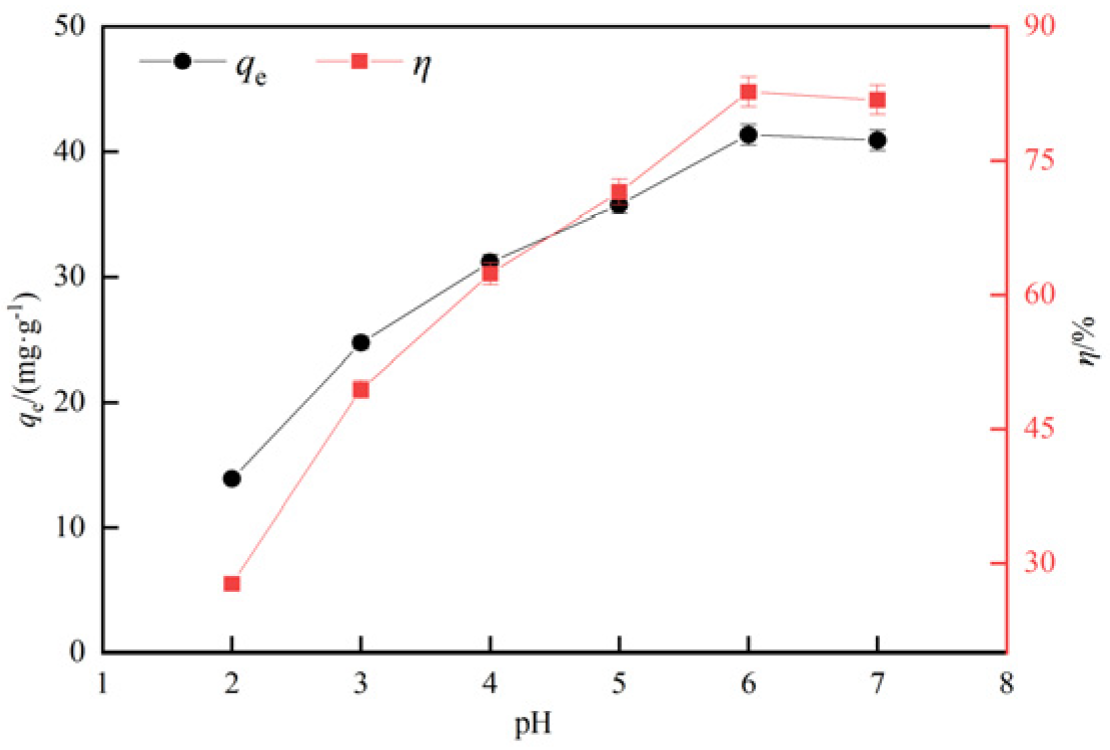
Figure 6.
Effect of solid-liquid ratio on Pb (II) adsorption by hydrothermal carbon.
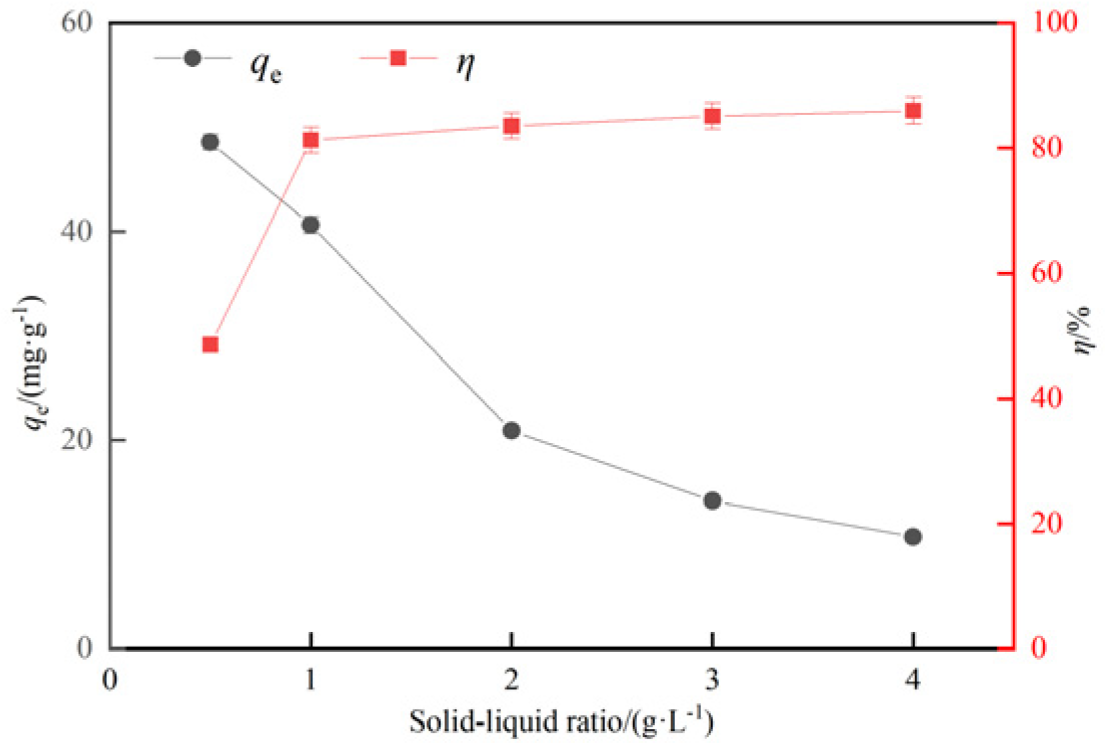
Figure 7.
Effect of adsorption time on adsorption of Pb (II) by hydrothermal carbon.
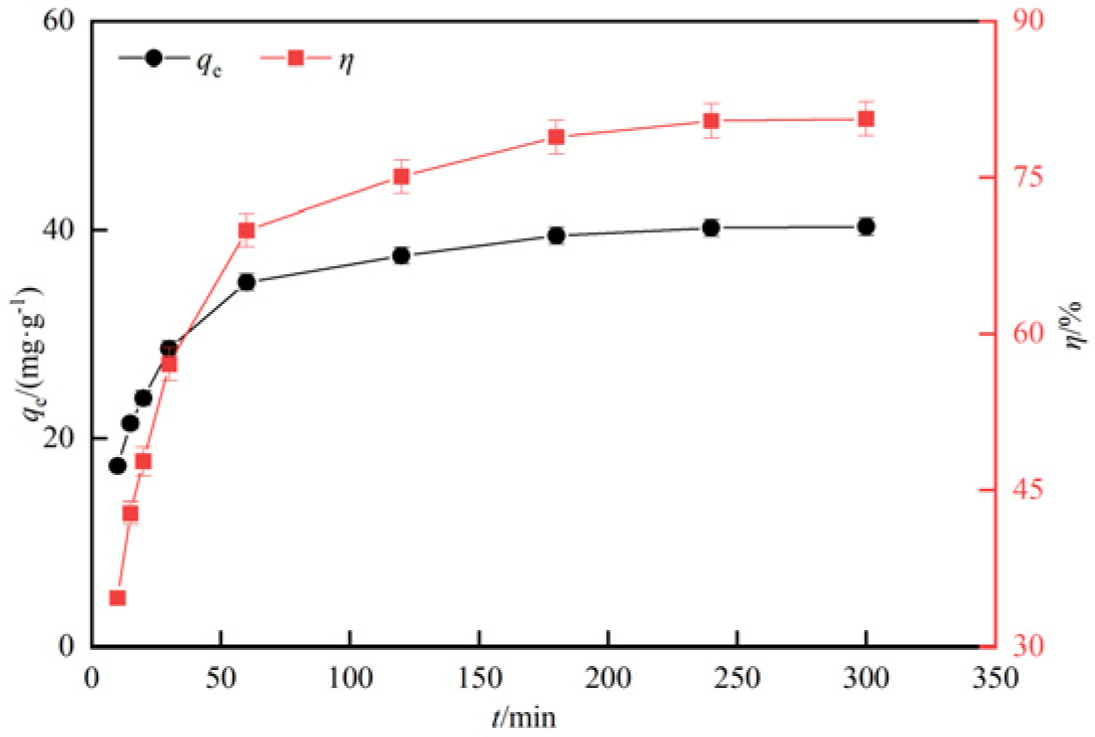
Figure 8.
Kinetic analysis of adsorption of modified hydrothermal carbon.
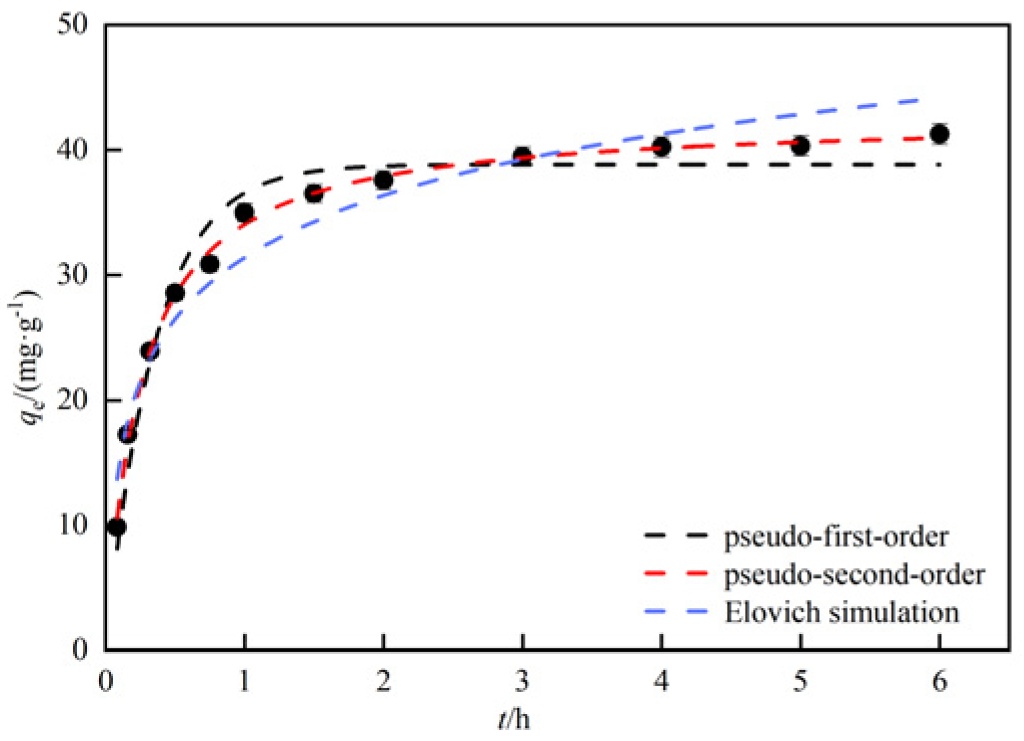
Figure 9.
Thermodynamic analysis of modified hydrothermal carbon
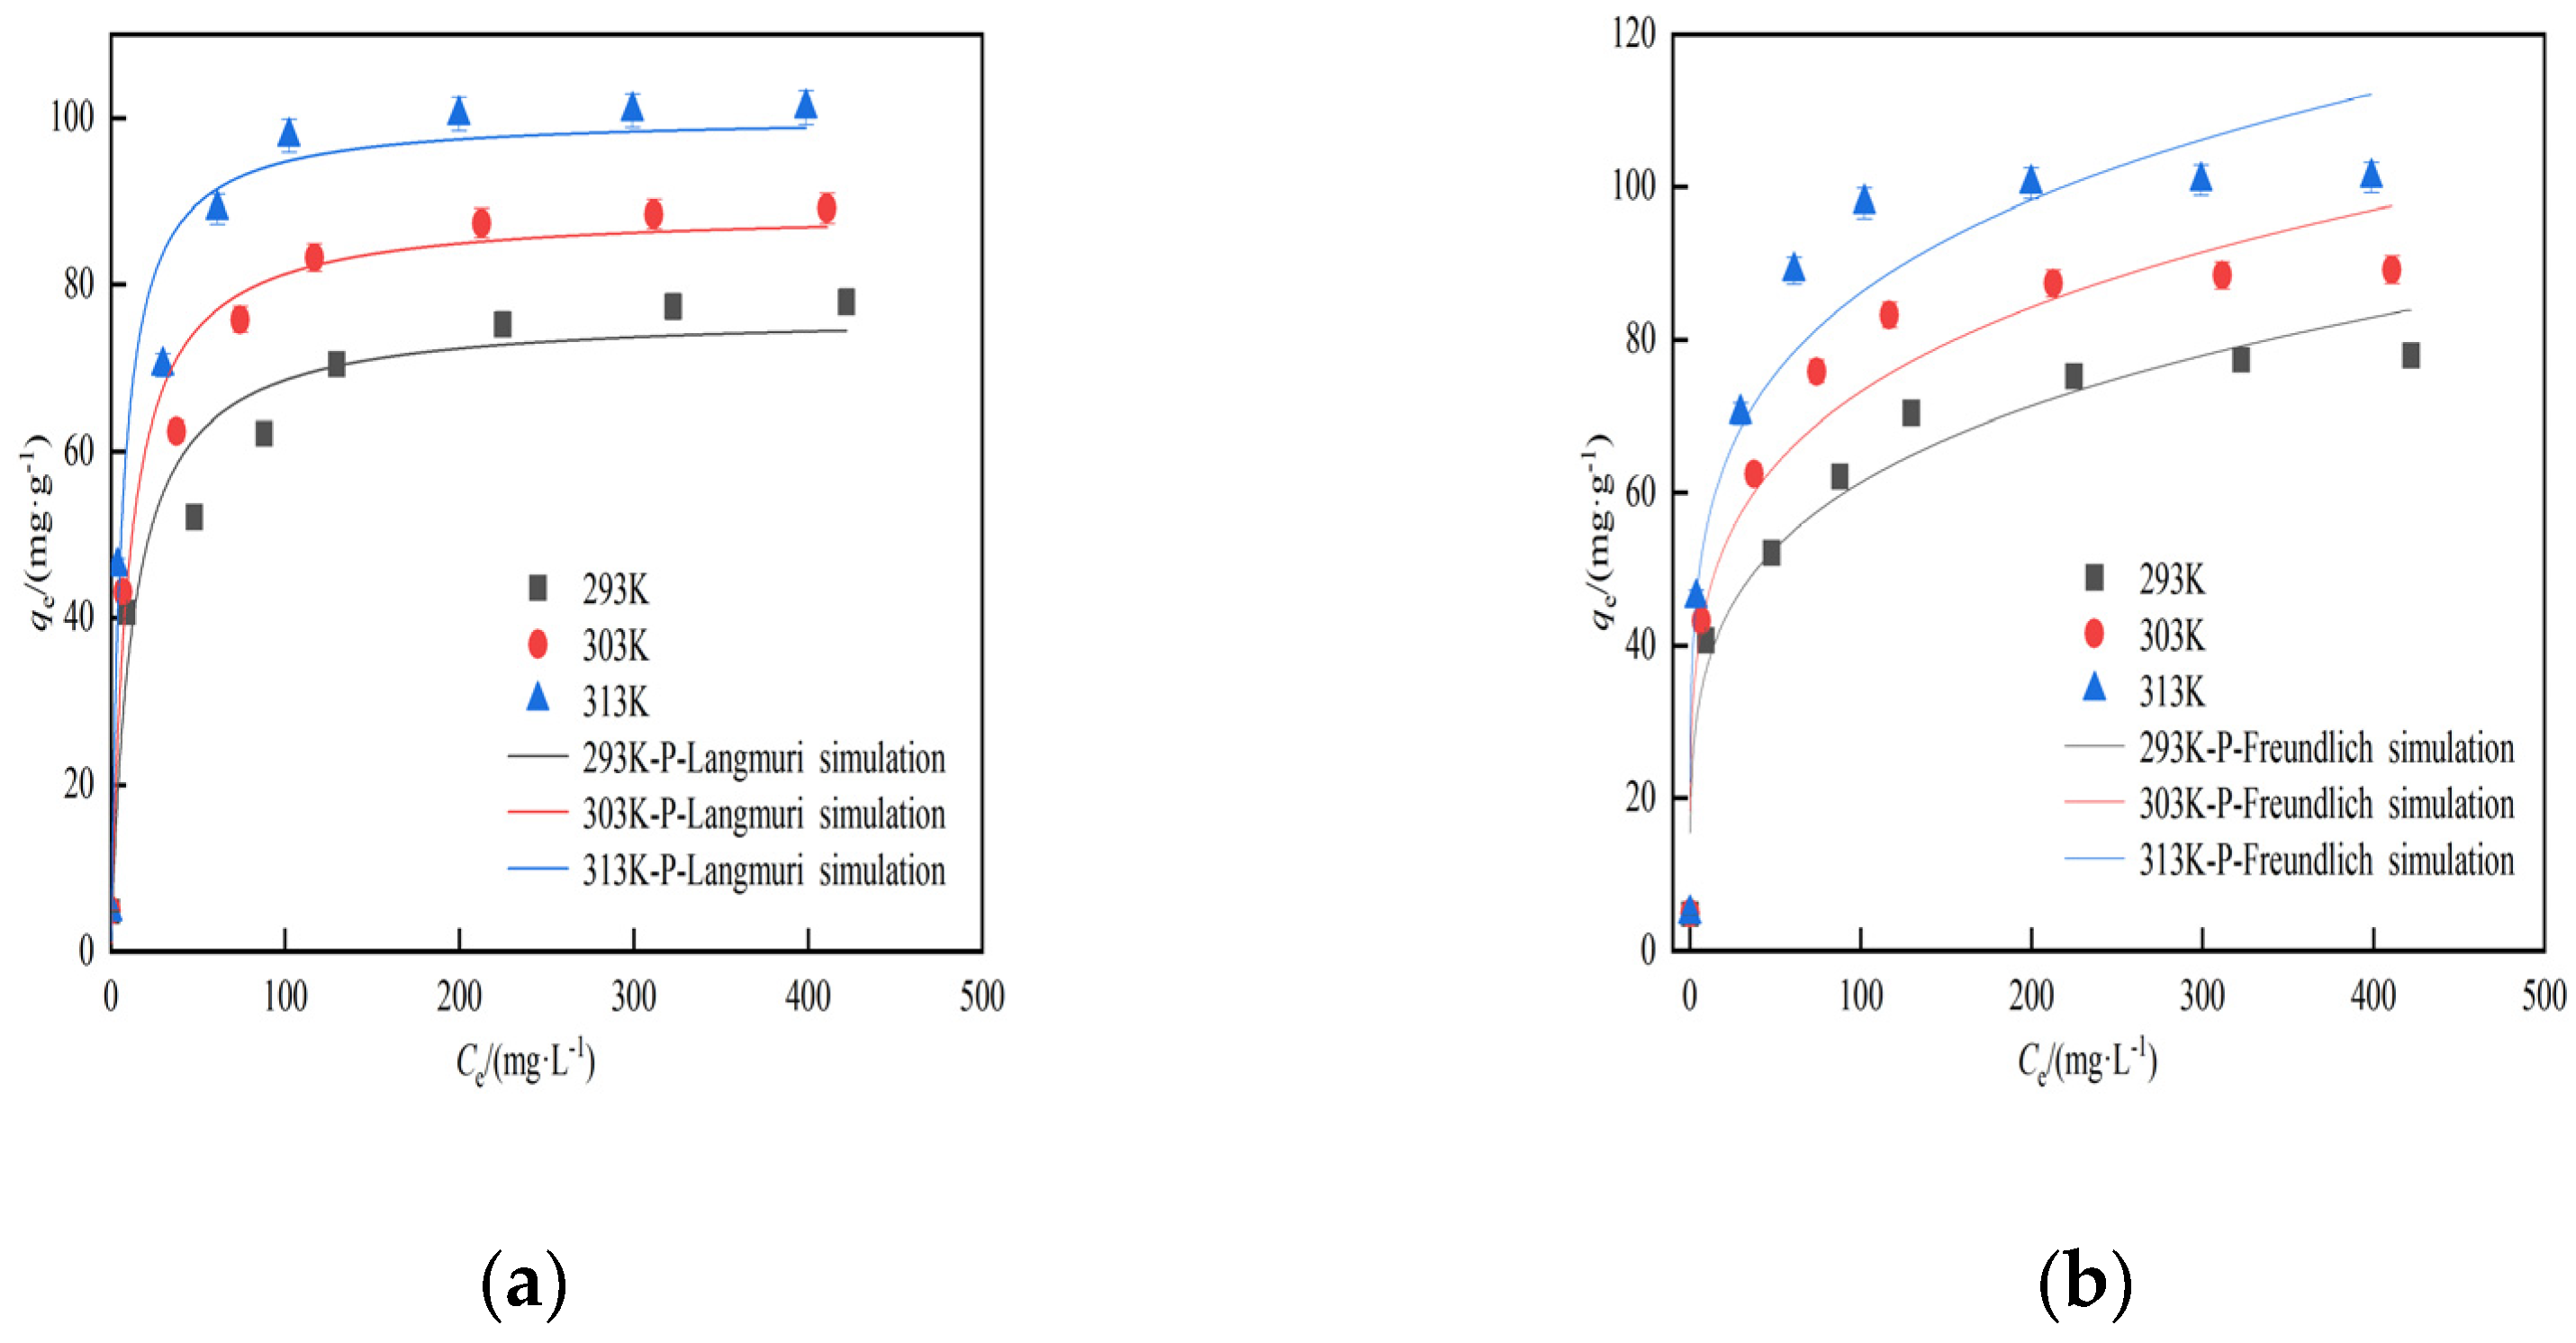
Figure 10.
Structure diagram of artificial neural network.
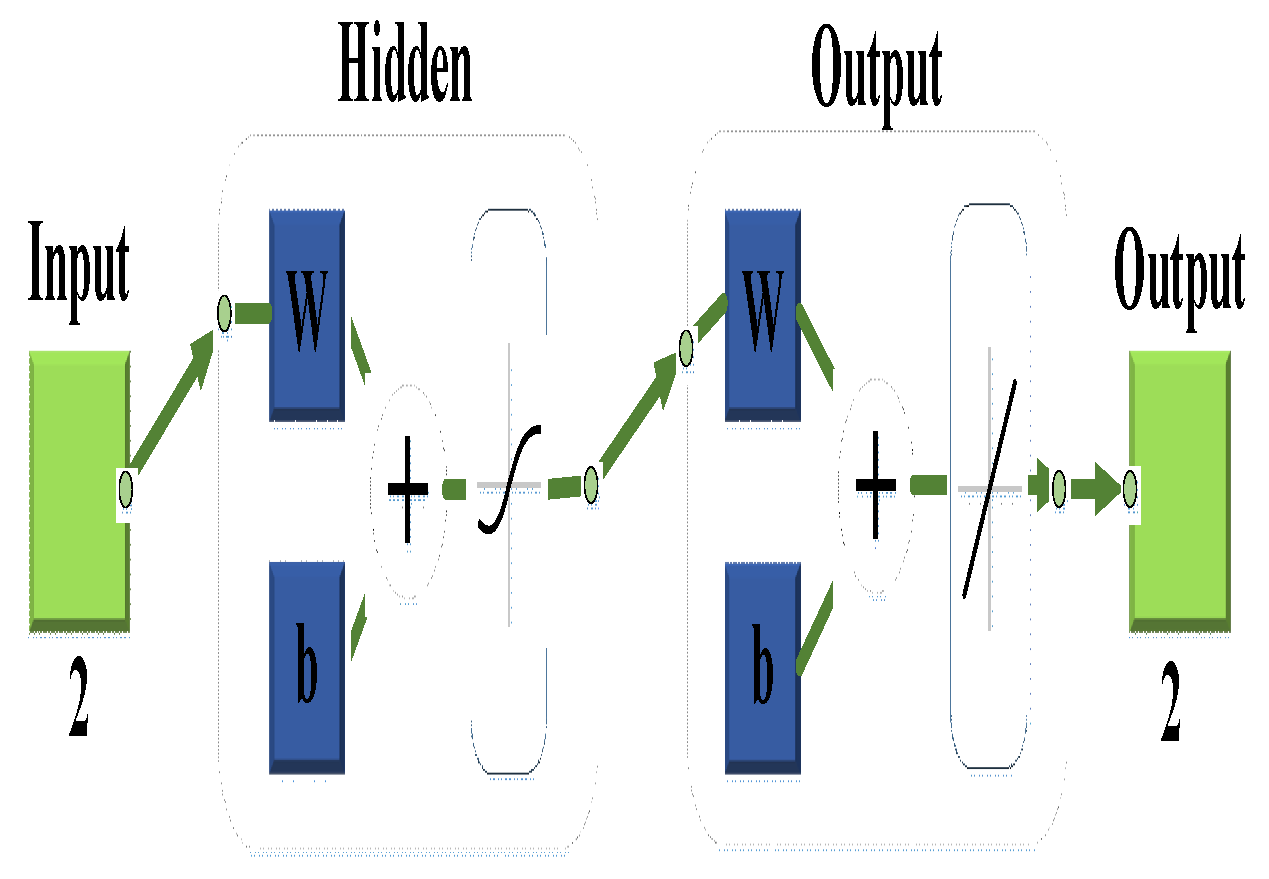
Figure 11.
ANN fitting diagram of Pb(II) adsorption experimental data.
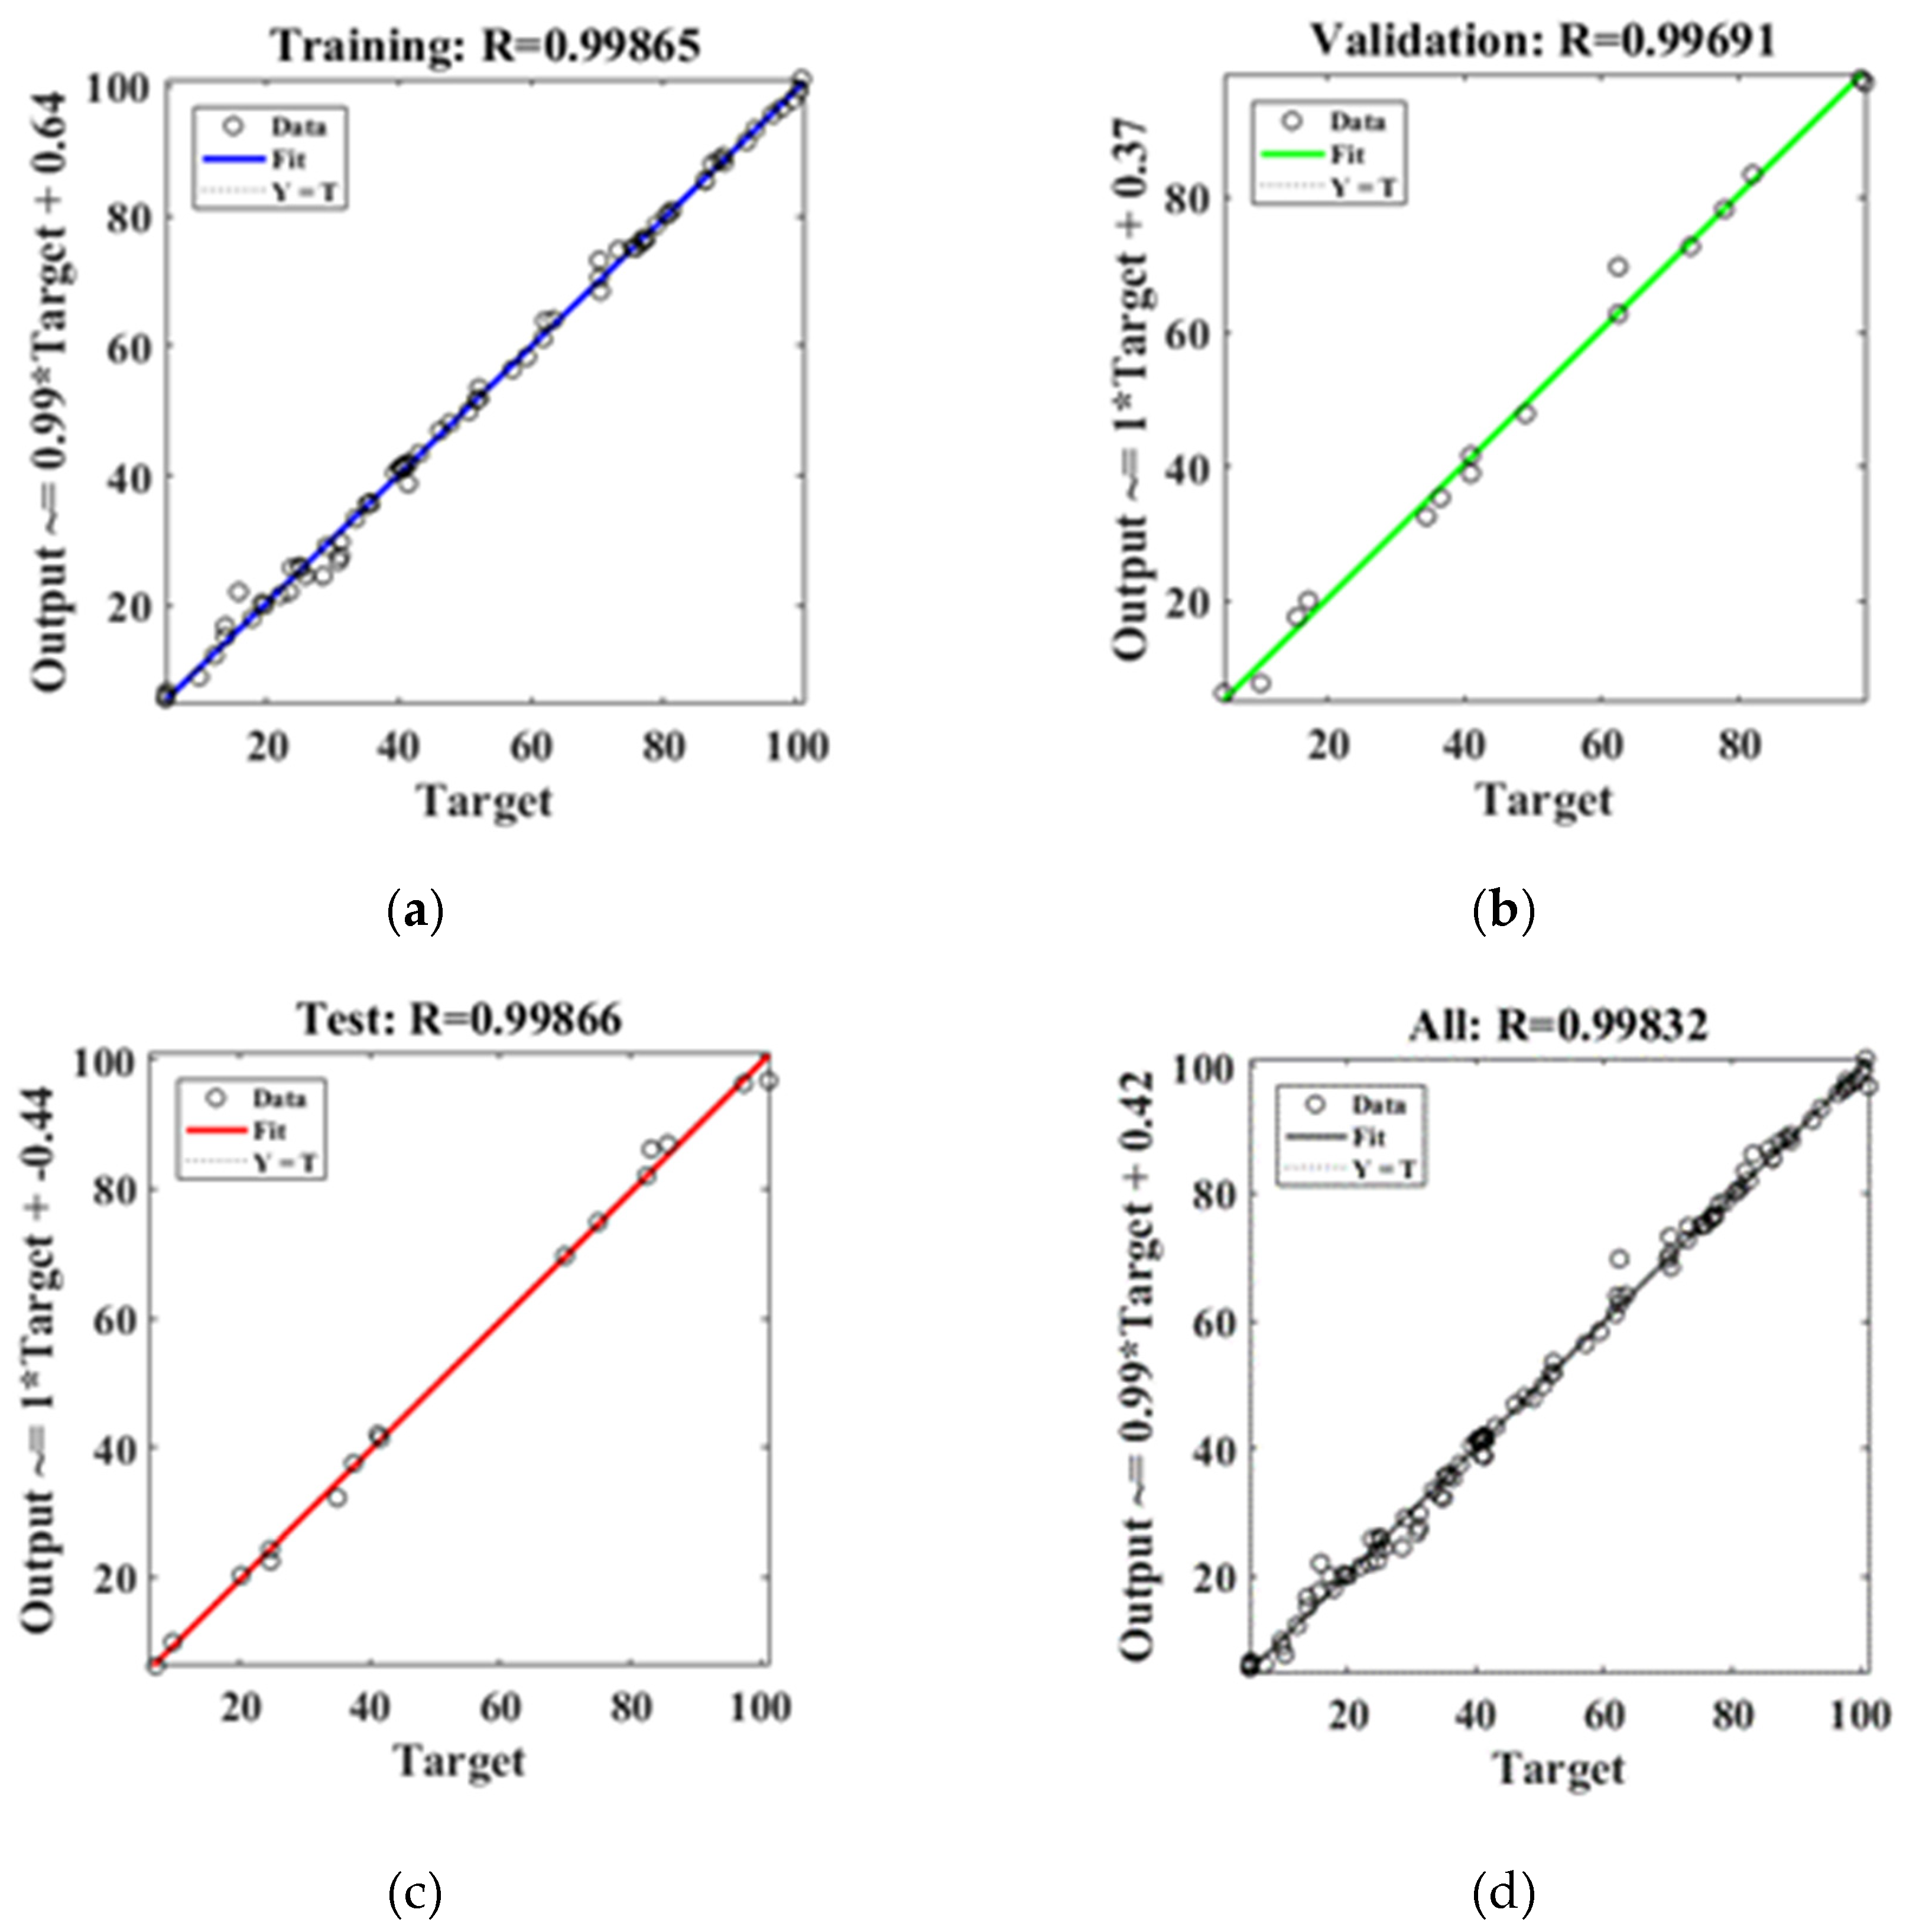

Table 1.
Table of kinetic adsorption correlation coefficient.
| Dynamic model | Parameters and correlation coefficients | |||
|---|---|---|---|---|
| pseudo-first-order | K1 | qe | h0 | R2 |
| 1/min | mg/g | mg/(min∙g) | ||
| 2.8241 | 38.84 | 109.53 | 0.95 | |
| pseudo-second-order | K2 | qe | h0 | R2 |
| g/(mg∙min) | mg/g | mg/(min∙g) | ||
| 0.0928 | 42.68 | 169.04 | 0.99 | |
| Elovich | α | β | - | R2 |
| 582.59 | 0.14 | - | 0.94 | |
Table 2.
Table of Sorption isotherm parameters and correlation coefficients.
| Isotherm model | Experimental conditions | Parameters and related parameters | ||
|---|---|---|---|---|
| Langmuir | T/K | KL/L∙mg−1 | qm/mg∙g−1 | R2 |
| 293 | 0.0853 | 76.54 | 0.95 | |
| 303 | 0.1057 | 88.94 | 0.97 | |
| 313 | 0.1704 | 103.24 | 0.96 | |
| Freundlich | T/K | KF(mg/g(1/mg)1/n) | 1/n | R2 |
| 293 | 22.4625 | 0.22 | 0.94 | |
| 303 | 28.7186 | 0.20 | 0.92 | |
| 313 | 35.8388 | 0.19 | 0.90 | |
Table 3.
ANN prediction and actual adsorption statistics.
| Input value | Predicted value | Actual value | Error value | |||||||
|---|---|---|---|---|---|---|---|---|---|---|
| pH | Temperature | Time | Solid-liquid ratio | Initial concentration | qF | ηc | qe | η | |∆q| | |∆η| |
| K | min | g/L | mg/L | mg/g | % | mg/g | % | % | % | |
| 2 | 293 | 120 | 1 | 50 | 13.1 | 13.2 | 13.8 | 27.6 | 5 | 4.3 |
| 7 | 313 | 120 | 1 | 50 | 44.4 | 87.8 | 46.2 | 92.4 | 3.8 | 4.9 |
| 7 | 293 | 300 | 1 | 50 | 40.9 | 80.2 | 40.3 | 80.7 | 1.5 | 0.6 |
| 7 | 293 | 120 | 2 | 50 | 15.23 | 60.4 | 15.8 | 63.4 | 3.6 | 4.8 |
| 7 | 293 | 120 | 1 | 150 | 74.1 | 24.8 | 75.2 | 25.1 | 1.5 | 1.2 |
Disclaimer/Publisher’s Note: The statements, opinions and data contained in all publications are solely those of the individual author(s) and contributor(s) and not of MDPI and/or the editor(s). MDPI and/or the editor(s) disclaim responsibility for any injury to people or property resulting from any ideas, methods, instructions or products referred to in the content. |
© 2024 by the authors. Licensee MDPI, Basel, Switzerland. This article is an open access article distributed under the terms and conditions of the Creative Commons Attribution (CC BY) license (https://creativecommons.org/licenses/by/4.0/).
Copyright: This open access article is published under a Creative Commons CC BY 4.0 license, which permit the free download, distribution, and reuse, provided that the author and preprint are cited in any reuse.


