Preprint
Article

The Impact of Electric Vehicle Charging Stations on Light Duty Electric Vehicle Adoption and Rebates in California.

Altmetrics

Downloads

338

Views

105

Comments

0

This version is not peer-reviewed

Submitted:

27 October 2023

Posted:

30 October 2023

Read the latest preprint version here

Alerts
Abstract
Abstract: This study investigates the effect of Electric Vehicle Charging Stations (EVCS) on light-duty Electric Vehicle sales and the Total California rebates. Electric Vehicle Charging Stations (EVCS) are infrastructure facilities that allow for the charging of electric vehicles (EVs). I applied the before and after model with California state county using its community-level attributes and used the difference-in-difference design to identify a strategy for estimating the causal effects of these attributes. These attributes include EVCS installations by time, EV sales by time, rebate applications by time, the number of multi-unit housing units, and the median income levels. The empirical ev-idence of this study shows the estimated relationship between public EV charging installation and EV sales overall by community income level, housing density, and other relevant factors, the result shows that EVCSs is highly correlated with light duty Electric Vehicle adoption. For the investors, policymakers, and other stakeholders, this study provides evidence of a threshold of EVCS on Light Duty Electric Vehicle adoption and rebate in California.
Keywords: 
Subject: Social Sciences  -   Government

1. Introduction

Electric vehicles (EVs) have gained traction recently as a preferred substitute to traditional gasoline-powered cars due to their environmental benefits, technological advancements, and low operating costs. However, EV adoption still faces significant challenges, including range anxiety, high upfront costs, and a lack of charging infrastructure. Therefore, governments and private entities have been investing in building EV charging stations to encourage EV adoption. To create pathways to Net-Zero Greenhouse Gas emissions by 2050. The US has committed to reducing net GHG emissions by 50-52% below 2005 levels by 2030 [1]. According to the United States Environmental Protection Agency, vehicles contribute to the largest carbon emissions in the USA. To decarbonize the USA, the importance of EVs must be emphasized to achieve this goal as important as EV adoption is, and more importantly, the EVCS, which determines the viability of EV adoption. Therefore, Charging Stations' availability is a significant factor in determining EV adoption.
Rebates are a popular incentive program that governments and organizations around the world have used to encourage the adoption of EVs. Rebates typically provide consumers with a financial incentive to purchase an EV by offering a cash rebate or a tax credit. These incentives help offset the higher upfront cost of purchasing an EV and make them more affordable for consumers.
In California, the Clean Vehicle Rebate Project (CVRP) offers rebates ranging from $1000 to $7000 for the purchase or lease of selected light-duty electric vehicles, further reducing the price barrier for California residents. Given the interplay between EV Public Charging Stations (EVCS) and EV adoption and rebates, this study seeks to address the following questions:
  • Are local EV adoption rates and rebate applications correlated with the installation of public EV chargers?
  • If there is a correlation, what is the quantitative relationship between the installation of charging stations and changes in EV sales or rebate application rates?
  • Does this relationship vary based on community characteristics such as commute distance, housing density, or income level?
To answer these questions, this study employs a difference-in-differences design to estimate the causal impact of electric vehicle charging stations on EV adoption and rebate utilization in California. It begins by dividing the data into two groups: "before" and "after" the installation of EV charging stations. Subsequently, the study calculates the mean of EV adoption for each group and conducts statistical tests to determine if a significant difference exists in EV adoption before and after the installation of EV charging stations.

1.1. Factors that Affect EV Adoption

The factors that affect EV adoption play a critical role in understanding the impact of EVCS on EV adoption. Generally, these factors can be organized into an understanding of three different factors, which are:
  • Manufacturing Factors: These factors affect the EV industry, including incentives and charging infrastructure. [2]
Table 1. Characteristics of EV Charging Stations. Source: (1).
Title 1 Level 1 Level 2 DC Fast Charging
Connector Type CCS/SAE connector
J1772 connector J1772 connector CHAdeMO connector
Tesla connector Tesla connector
Typical Power Output 1 kW 7 kW-19 kW 50-350 kW
Estimated PHEV Charge Time from Empty 5-6 hours 1-2 hours N/A
Estimated BEV Charge Time from Empty 40-50 hours 4-10 hours 20 minutes-1 hours
Typical Locations Home Home, Workplace, Public
and Public
2.
The personal/driver factors include the range, charging speed, the awareness and desire of the driver to adopt an EV, cost, and incentives or rebates available for the purchase. One important factor in determining the purchase of an EV is its range, that is, the ability to travel farther on a charge. Over the past decade, battery technology has improved EV ranges. Three electric vehicle charging speeds are currently available in the USA, which are level 1, the slowest, and providing charging through a standard residential 120-volt AC outlet. The level 2 equipment offers charging through 240V or 280V, and the Direct Current Fast Charging (DCFC) has the fastest charging speed. Other variables that affect EV ranges, such as weather, at a temperature below 200 F, can cause EVs to lose around 12% of their range, rising to 41 % if heating is turned on inside the vehicle [3]. Another important factor is the cost which is represented as the Manufacturer's Suggested Retail Price (MSRP)
Table 2. Personal driving factors for EV adoption.
Year Avg. EV Range Maximum EV Range Average MSRP
2010 79 miles (127 km) N/A N/A
2011 86 miles (138 km) 94 miles (151 km) N/A
2012 99 miles (159 km) 265 miles (426 km) N/A
2013 117 miles (188 km) 265 miles (426 km) N/A
2014 130 miles (209 km) 265 miles (426 km) N/A
2015 131 miles (211 km) 270 miles (435 km) N/A
2016 145 miles (233 km) 315 miles (507 km) $33,380
2017 151 miles (243 km) 335 miles (539 km) $58,965
2018 189 miles (304 km) 335 miles (539 km) $64,300
2019 209 miles (336 km) 370 miles (595 km) $55,600
2020 210 miles (338 km) 402 miles (647 km) $54,668
2021 217miles (349 km) 520 miles (837 km) $64,249
2022 211 miles (341 km) 520 miles (837 km) $65,291
3.
Environmental and External Factors: to establish net-zero emissions by 2050, the need for EV adoption is ever-increasing with the rising gas price.
In conclusion, this paper addresses a critical knowledge gap by examining the relationship between EVCS installations, EV adoption, and rebate applications in California, shedding light on the quantitative impact of charging stations on these outcomes. By investigating the interplay between various community-level attributes and EVCS, this study offers insights valuable to investors, policy-makers, and stakeholders in the pursuit of sustainable transportation solutions. The subsequent sections of this paper will delve into the methodology, data analysis, and findings, providing a comprehensive roadmap for the study's exploration of the EV adoption landscape in California.
In the related literature on EVs' quantitative and qualitative characteristics, recent studies have been conducted to compare the characteristics of EVs to that of non-EV. [4] Studied the impact of household-specific factors, which include frequency of charging, frequency of long-distance trips, and frequency of overlaps between vehicles on electric vehicle miles travelled (eVMT), fuel consumption within two-car households, and utility factor. And found that Plug-in hybrid electric vehicles (PHEVs) with a range of at least 35 miles and some short-range battery electric vehicles (BEVs) can electrify a similar share of total household miles and up to 70% electrification on long-range BEVs [5] stated that EVs depend on public fast charging, especially when traveling outside a single charge range, and therefore a network of fast charging stations is of high importance. Individuals who see electric vehicles (EVs) as a viable solution for reducing the adverse impacts of the existing transportation system and whose travel habits align with the practicality of EV use are more likely to adopt for electric vehicles irrespective of the rebate [10].

1.2. Qualitative Characteristics

One of EVs' most significant qualitative characteristics is that they emit no tailpipe emissions, making them environmentally friendly and contributing to improved air quality. This characteristic particularly appeals to environmentally conscious consumers who wish to reduce their carbon footprint. Furthermore, EVs provide a quiet and smooth driving experience, and many models have advanced features, such as regenerative braking, that can improve their performance and efficiency.
Another significant qualitative characteristic of EVs is that they offer a lower total cost of ownership (TCO) than traditional gas-powered vehicles. While EVs have a higher upfront cost but lower operating costs due to their lower fuel and maintenance costs. This makes EVs particularly attractive to consumers interested in long-term savings and a sustainable lifestyle.
EV charging stations also have unique qualitative characteristics. They are typically designed to be compact and unobtrusive, allowing them to blend in with their surroundings. Additionally, many charging stations are equipped with advanced technology, such as mobile applications and smart charging systems, which allow consumers to monitor their charging progress and optimize their charging patterns. These features enhance the convenience and accessibility of EV charging stations, making them more attractive to consumers.

1.3. Quantitative Characteristics

One of the EVs' most significant quantitative characteristics is their range and vehicle type of light-duty EVs. The vehicle type for the light-duty EV is Fuel Cell Electric Vehicle (FCEV), Battery Electric Vehicles (BEV), or Plug-in Hybrid Electric Vehicle (PHEV). EVs have a range that is typically shorter than that of traditional gas-powered vehicles, making them less suitable for long-distance travel. However, advances in battery technology have led to longer ranges, and many newer EV models have ranges that can rival those of traditional gas-powered vehicles. Improvements in charging infrastructure have also led to faster charging times, which can further enhance the convenience and accessibility of EVs.
Another significant quantitative characteristic of EVs is their efficiency. EVs are typically more efficient than traditional gas-powered vehicles, requiring less energy to travel a distance. This efficiency can result in significant cost savings for consumers and contribute to reducing carbon emissions.
EV charging stations also have unique quantitative characteristics. The charging speed of an EV charging station is a critical factor in its appeal to consumers. Faster charging speeds allow consumers to spend less time charging their vehicles and more time driving. Furthermore, the number of charging stations available in each area can significantly impact the convenience and accessibility of EV charging for consumers.
In conclusion, EVs and their charging stations have unique qualitative and quantitative characteristics distinguishing them from traditional gas-powered vehicles and gasoline refuelling stations. These characteristics contribute to their appeal to consumers, particularly those who are environmentally conscious and interested in long-term savings. Advances in battery technology and charging infrastructure continually improve EVs' range, efficiency, charging speed, and charging stations, making them more accessible and convenient for consumers. As these technologies continue to evolve, we can expect to see continued growth in the adoption of electric mobility.
The International Electrotechnical Commission (IEC), CHAdeMO Association, and Society of Automotive Engineering (SCE) are the institutions responsible for standardizing the electric characteristics of EV charging stations [6]. IEC’s recent revision of the International EV charging standards: [7] includes some of the following technical changes:
  • Changes to the temperature rise test to include additional points of measurement.
  • Additional tests for accessories to address thermal stress and stability, mechanical wear and abuse, and exposure to contaminants.
  • Additional requirements for contact material and plating
The EV charging stations aim to create reliable support for EV drivers to ensure that affordable and fast charging is available. In California, EV drivers attribute a reliable EV charging station to the following:
  • Charging Cable Plug Compatibility: one of the major concerns for EV drivers is the compatibility of the outlet of the charging station to their respective EVs. Unlike gasoline vehicles, which have one universal outlet plug for gasoline, the EV currently has four different outlets for charging. There are two types of AC plugs (type 1 and type 2) and two types of DC plugs (CHAdeMO and CCS)
  • Charging Efficiency: the amount of time it takes to charge an EV is important in determining EV adoptions and charging. The situation determines the charging efficiency for an instant. A fast-charging station of about 15-20 minutes will be required on highways and freeways, but a shop and charge may require 1 to 2 hours for a full charging process of around 22KW. And a home charger may hold up to 3.6KW power and require 6 to 8 hours for a full charging process.
  • Diverse Payment Options: paying depends on the charger point operators or network for public charging stations that are not free. Many networks provide subscriptions or memberships that lower the monthly fees, and these payments are usually made through an app, fob, or an RFID card. However, almost all public charging stations have options for card payments.
  • Strategic location: a strategic location is a crucial attribute in determining the reliability of an EV charging station. On average rapid chargers will take between 20-30 minutes to provide between 60-200 miles of ranges.
Electric vehicles (EVs) and their charging stations have unique qualitative and quantitative characteristics distinguishing them from traditional gas-powered vehicles and gasoline refuelling stations.

1.4. Role of Rebate in EV Adoption

In 2021 the US government spending on electric cars tripled to USD 2 billion, which is $3,200 per-unit basis the per-unit basis of USD 3,200. Rebates have accounted for the major government spending on electric vehicles, especially in California [8]. Rebates have been shown to be effective in driving the adoption of EVs. A study by the International Council on Clean Transportation found that rebates can increase EV sales by up to three times. Furthermore, a report by the National Renewable Energy Laboratory found that rebates can significantly reduce the payback period for EVs, making them a more attractive option for consumers. In addition to rebates, other incentive programs have been implemented to encourage the adoption of EVs. These programs include free or discounted charging, access to high-occupancy vehicle (HOV) lanes, and reduced tolls. These incentives can help address consumers’ concerns about EVs’ limitations, such as range anxiety and the lack of charging infrastructure.
Government programs have played a critical role in the adoption of EVs. Governments around the world have implemented a range of incentive programs to promote the adoption of EVs, including rebates, tax credits, and other incentives. These programs have been successful in driving the adoption of EVs in countries such as Norway, where EVs account for over 50% of new car sales.
Rebates and other incentive programs have had a positive impact on the environment. These programs have helped reduce greenhouse gas emissions and improve air quality by encouraging the adoption of low-emission vehicles. A study by the Union of Concerned Scientists found that EVs in the United States could reduce greenhouse gas emissions by up to 30%, depending on the source of electricity used to power the vehicles.
Rebates and other incentive programs have played a critical role in driving the adoption of EVs and other low-emission vehicles. These programs have helped make EVs more affordable and accessible to consumers while also addressing concerns about range anxiety and charging infrastructure. They have also positively impacted the environment and society by reducing greenhouse gas emissions and supporting the development of a more sustainable transportation system. As the EV industry continues to grow, we can expect to see continued investment in rebate and incentive programs to support the adoption of this important technology.
Rebates and other incentive programs have also had a positive impact on society. By promoting the adoption of EVs, these programs have helped reduce dependence on fossil fuels and support the development of a more sustainable transportation system. They have also created new job opportunities in the EV industry, which is expected to grow significantly in the coming years.
The best years to use for the analysis would depend on the availability and reliability of the data for the different variables involved in the analysis. However, to capture the impact of the rebates and incentives available in California for Electric Vehicles and Electric Vehicle Infrastructure, it would be ideal to use the years when the incentives and rebates were most significant and implemented.
Some of the significant incentives and rebates for electric vehicles and infrastructure in California include:
  • California's Zero Emission Vehicle (ZEV) mandate, which was adopted in 1990 and requires automakers to sell a certain number of ZEVs in California each year.
  • The California Clean Vehicle Rebate Project (CVRP) offers rebates for purchasing or leasing new electric vehicles. The program began in 2010 and has undergone several rebate amounts changes.
  • The California Electric Vehicle Infrastructure Project (CALeVIP), which offers incentives for the installation of EV charging stations. The program began in 2015 and has also gone through several changes in incentive amounts over the years.
Based on these incentives and their implementation dates, we will be using the date period from 2010-2022.
This literature review provides a foundation for understanding the qualitative and quantitative characteristics of EVs, the role of rebates in promoting their adoption, and the impact of incentive programs on the environment and society. As the EV industry continues to evolve, incentives and rebates are expected to play a crucial role in supporting the adoption of electric mobility.

2. Data and Methodology

This study aimed to evaluate the impact of electric vehicle charging stations on light-duty electric vehicle adoption and rebates in California, using publicly available data from the years 2010-2022
The post-period of 2019 was chosen for the analysis based on current happenings in California related to the adoption of electric vehicles. In recent years, California has set aggressive targets to reduce greenhouse gas emissions, with a goal of achieving carbon neutrality by 2045. As a result, there has been a significant push to increase the adoption of electric vehicles in the state.
In September 2018, Governor Jerry Brown signed a bill into law that set a target of 5 million zero-emission vehicles (ZEVs) on California's roads by 2030. This includes battery-electric, plug-in hybrid, and fuel-cell vehicles. This target is part of California's broader efforts to reduce greenhouse gas emissions, improve air quality, and support innovation in the transportation sector.
Given these recent developments and the push to increase the adoption of electric vehicles in California, the year 2019 was chosen as the post-period for the analysis. This allows for a comparison of EV adoption rates before and after implementing policies and programs aimed at increasing the adoption of electric vehicles in California.
Using 2019 as the intervention year is likely justified by some external factors or policy changes in California during that period, which may have affected EV charging station installation and adoption rates. For example, in 2019, California increased its incentives for electric vehicles and announced new regulations requiring ride-hailing companies to transition to zero-emission vehicles gradually. These policy changes may have led to an increase in the installation of EV charging stations and, in turn, a rise in EV adoption rates. Using 2019 as the intervention year, we can compare the changes in EV adoption rates before and after these policy changes took effect. In this case, 2019 was chosen as the intervention year because it was the year when a significant increase in the installation of EV charging stations was observed in California.

3. Discussion

The findings of this study provide valuable insights into the impact of Electric Vehicle Charging Stations (EVCS) on Electric Vehicle (EV) adoption and rebates in California. The analysis focused on publicly available data from the years 2010 to 2022, with the post-period chosen as 2019 due to significant developments in California's efforts to increase EV adoption and reduce greenhouse gas emissions.

3.1. Rebate Analysis

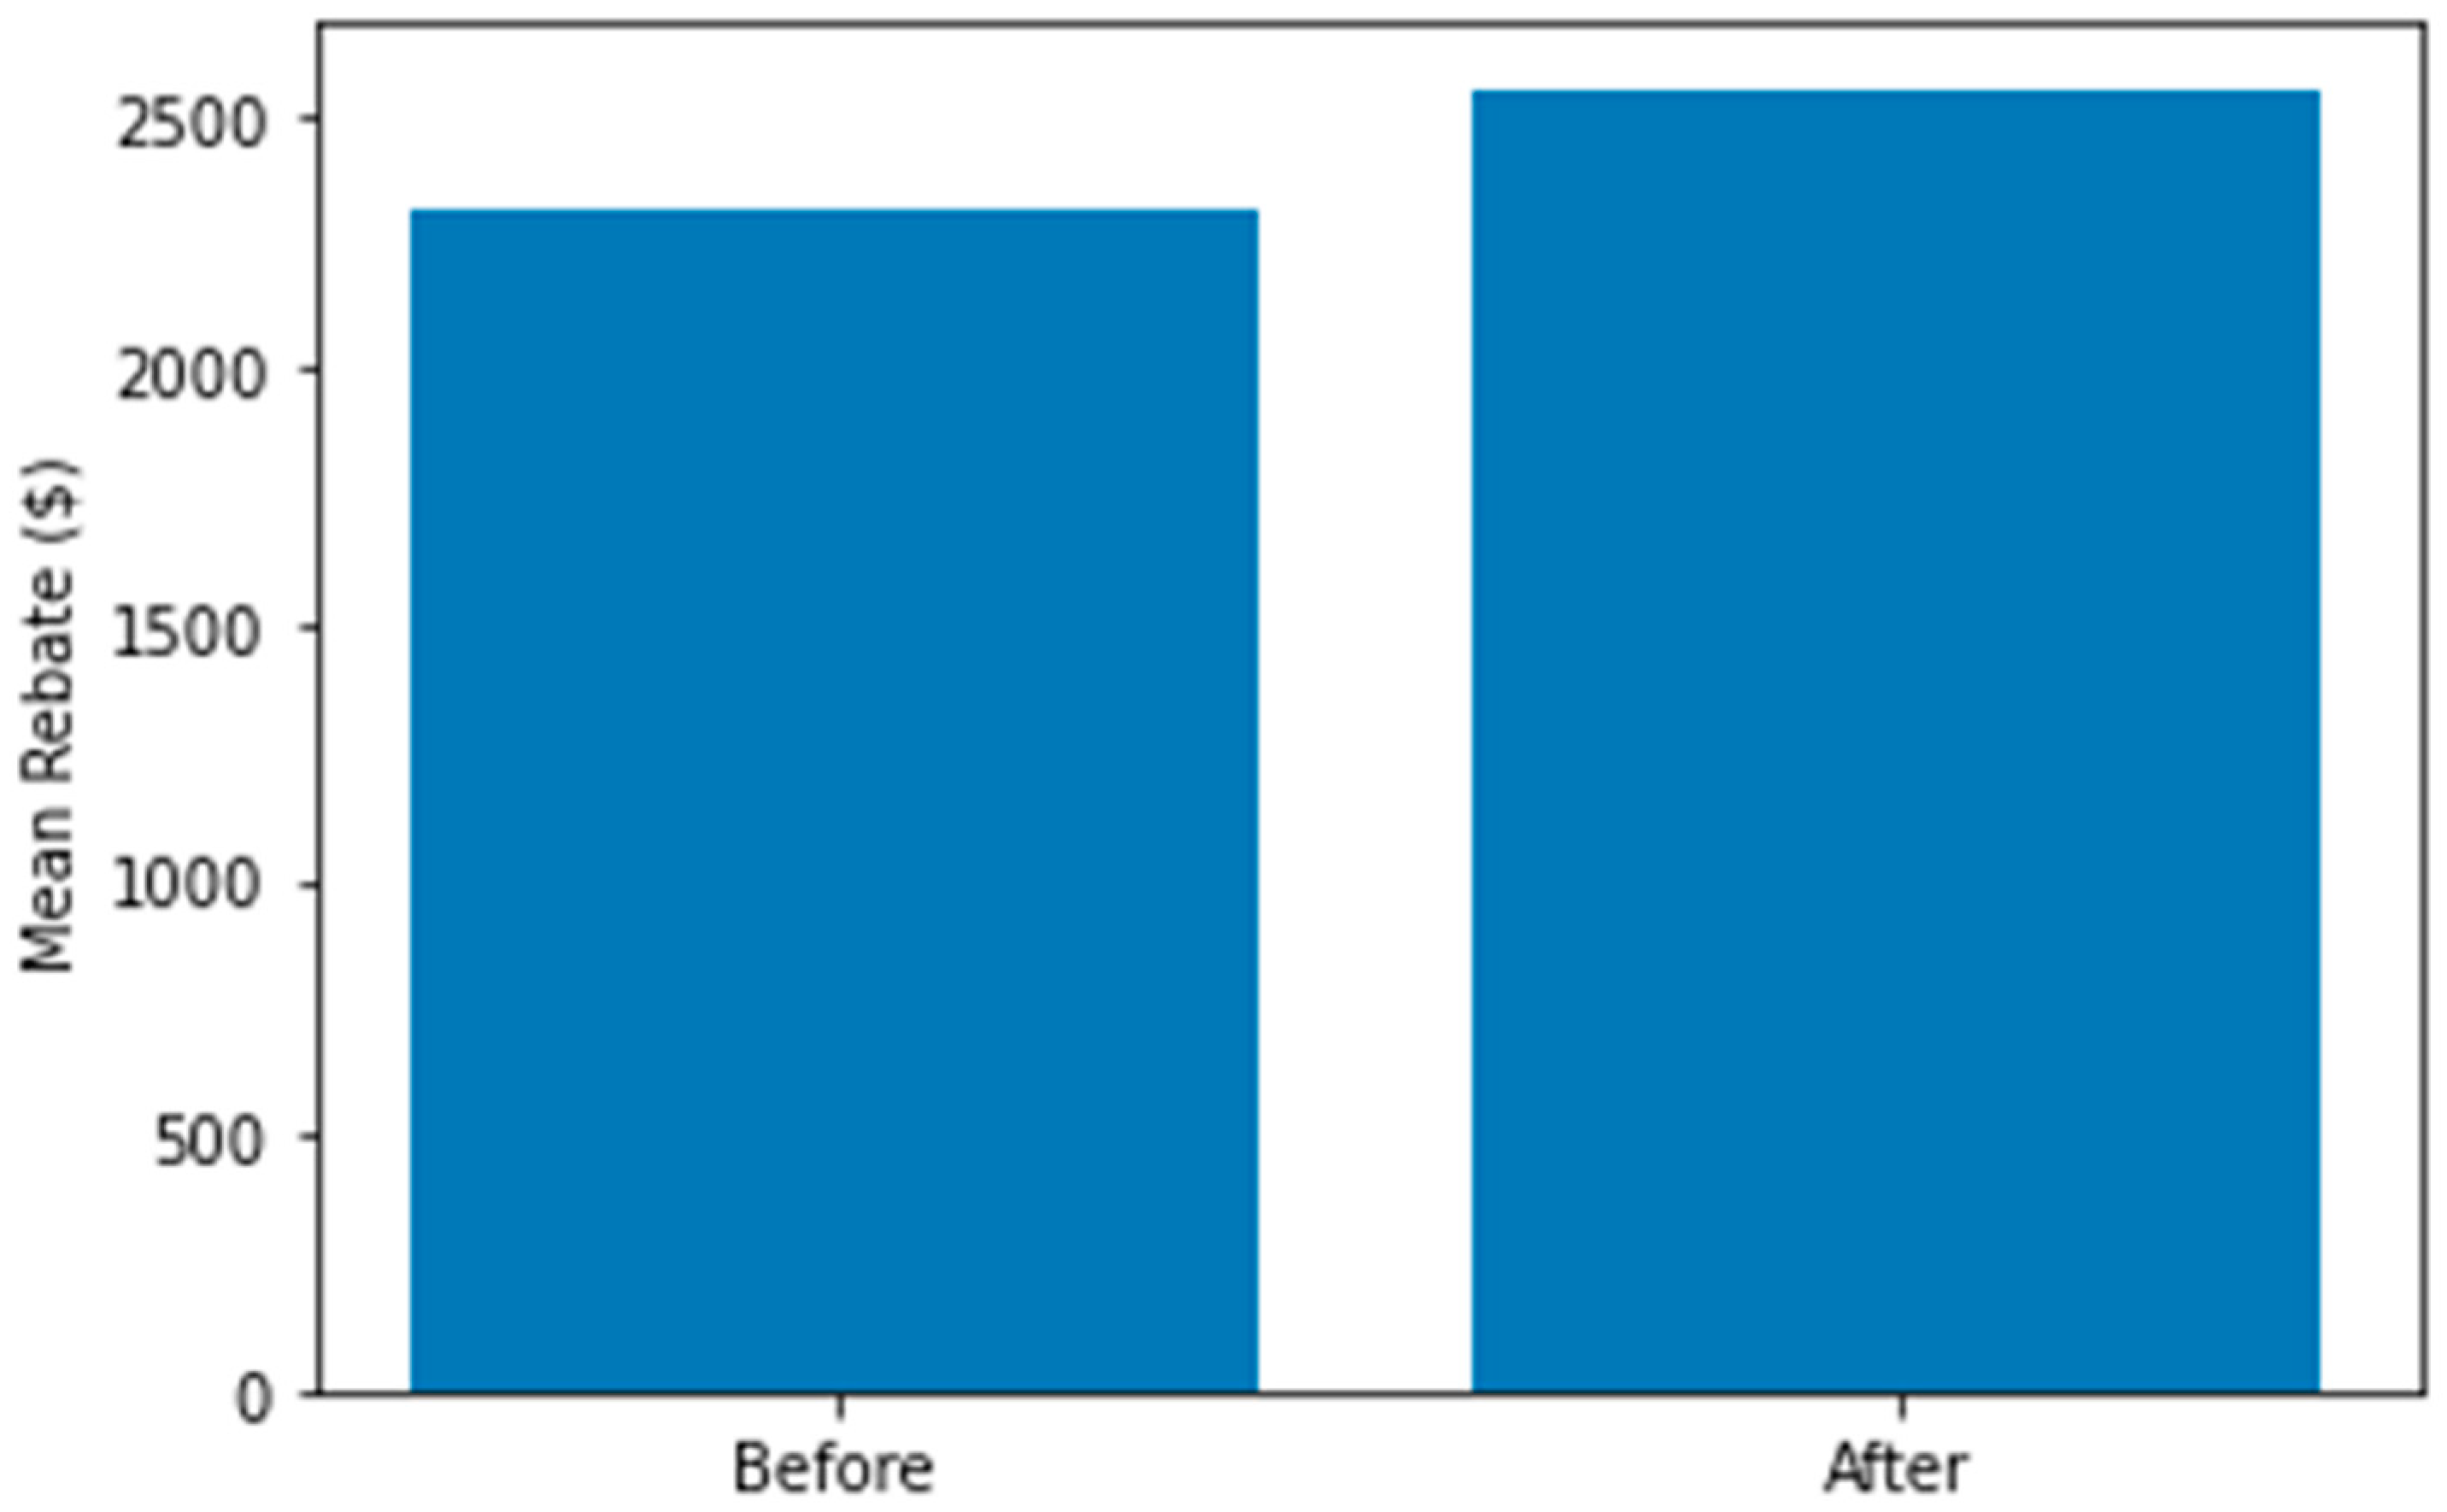
The analysis of rebates revealed an interesting dynamic. Before the installation of EV charging stations, the mean dollar amount of rebates was approximately $2,307.76, and it increased to $2,549.23 after the installation. However, the p-value indicated that this increase was not statistically significant. While this might seem counterintuitive, it suggests that the presence of charging infrastructure alone may not directly influence the dollar amount of rebates.
This finding prompts further exploration into the factors that contribute to the dollar amount of rebates. It may be influenced by a range of variables, including government policies, consumer preferences, and the overall growth of the EV market. Future research could investigate these variables in greater detail to better understand the determinants of rebate amounts.
Table 3. Impact on Rebates.
Methodology Description
Data Source California Energy Commission (CEC), California Department of Motor Vehicles, California Air Resources Board (CARB), and U.S. Census Bureau
Period 2010-2022
Treatment Installation of EV charging stations
Control Group N/A
Pre-Period >2019
Post-Period <2019
Outcome Variable The dollar amount of the Rebate
t-statistics nan
Figure 1. Impact on Rebate.
Preprints 88976 g001

3.2. EV Adoption Analysis

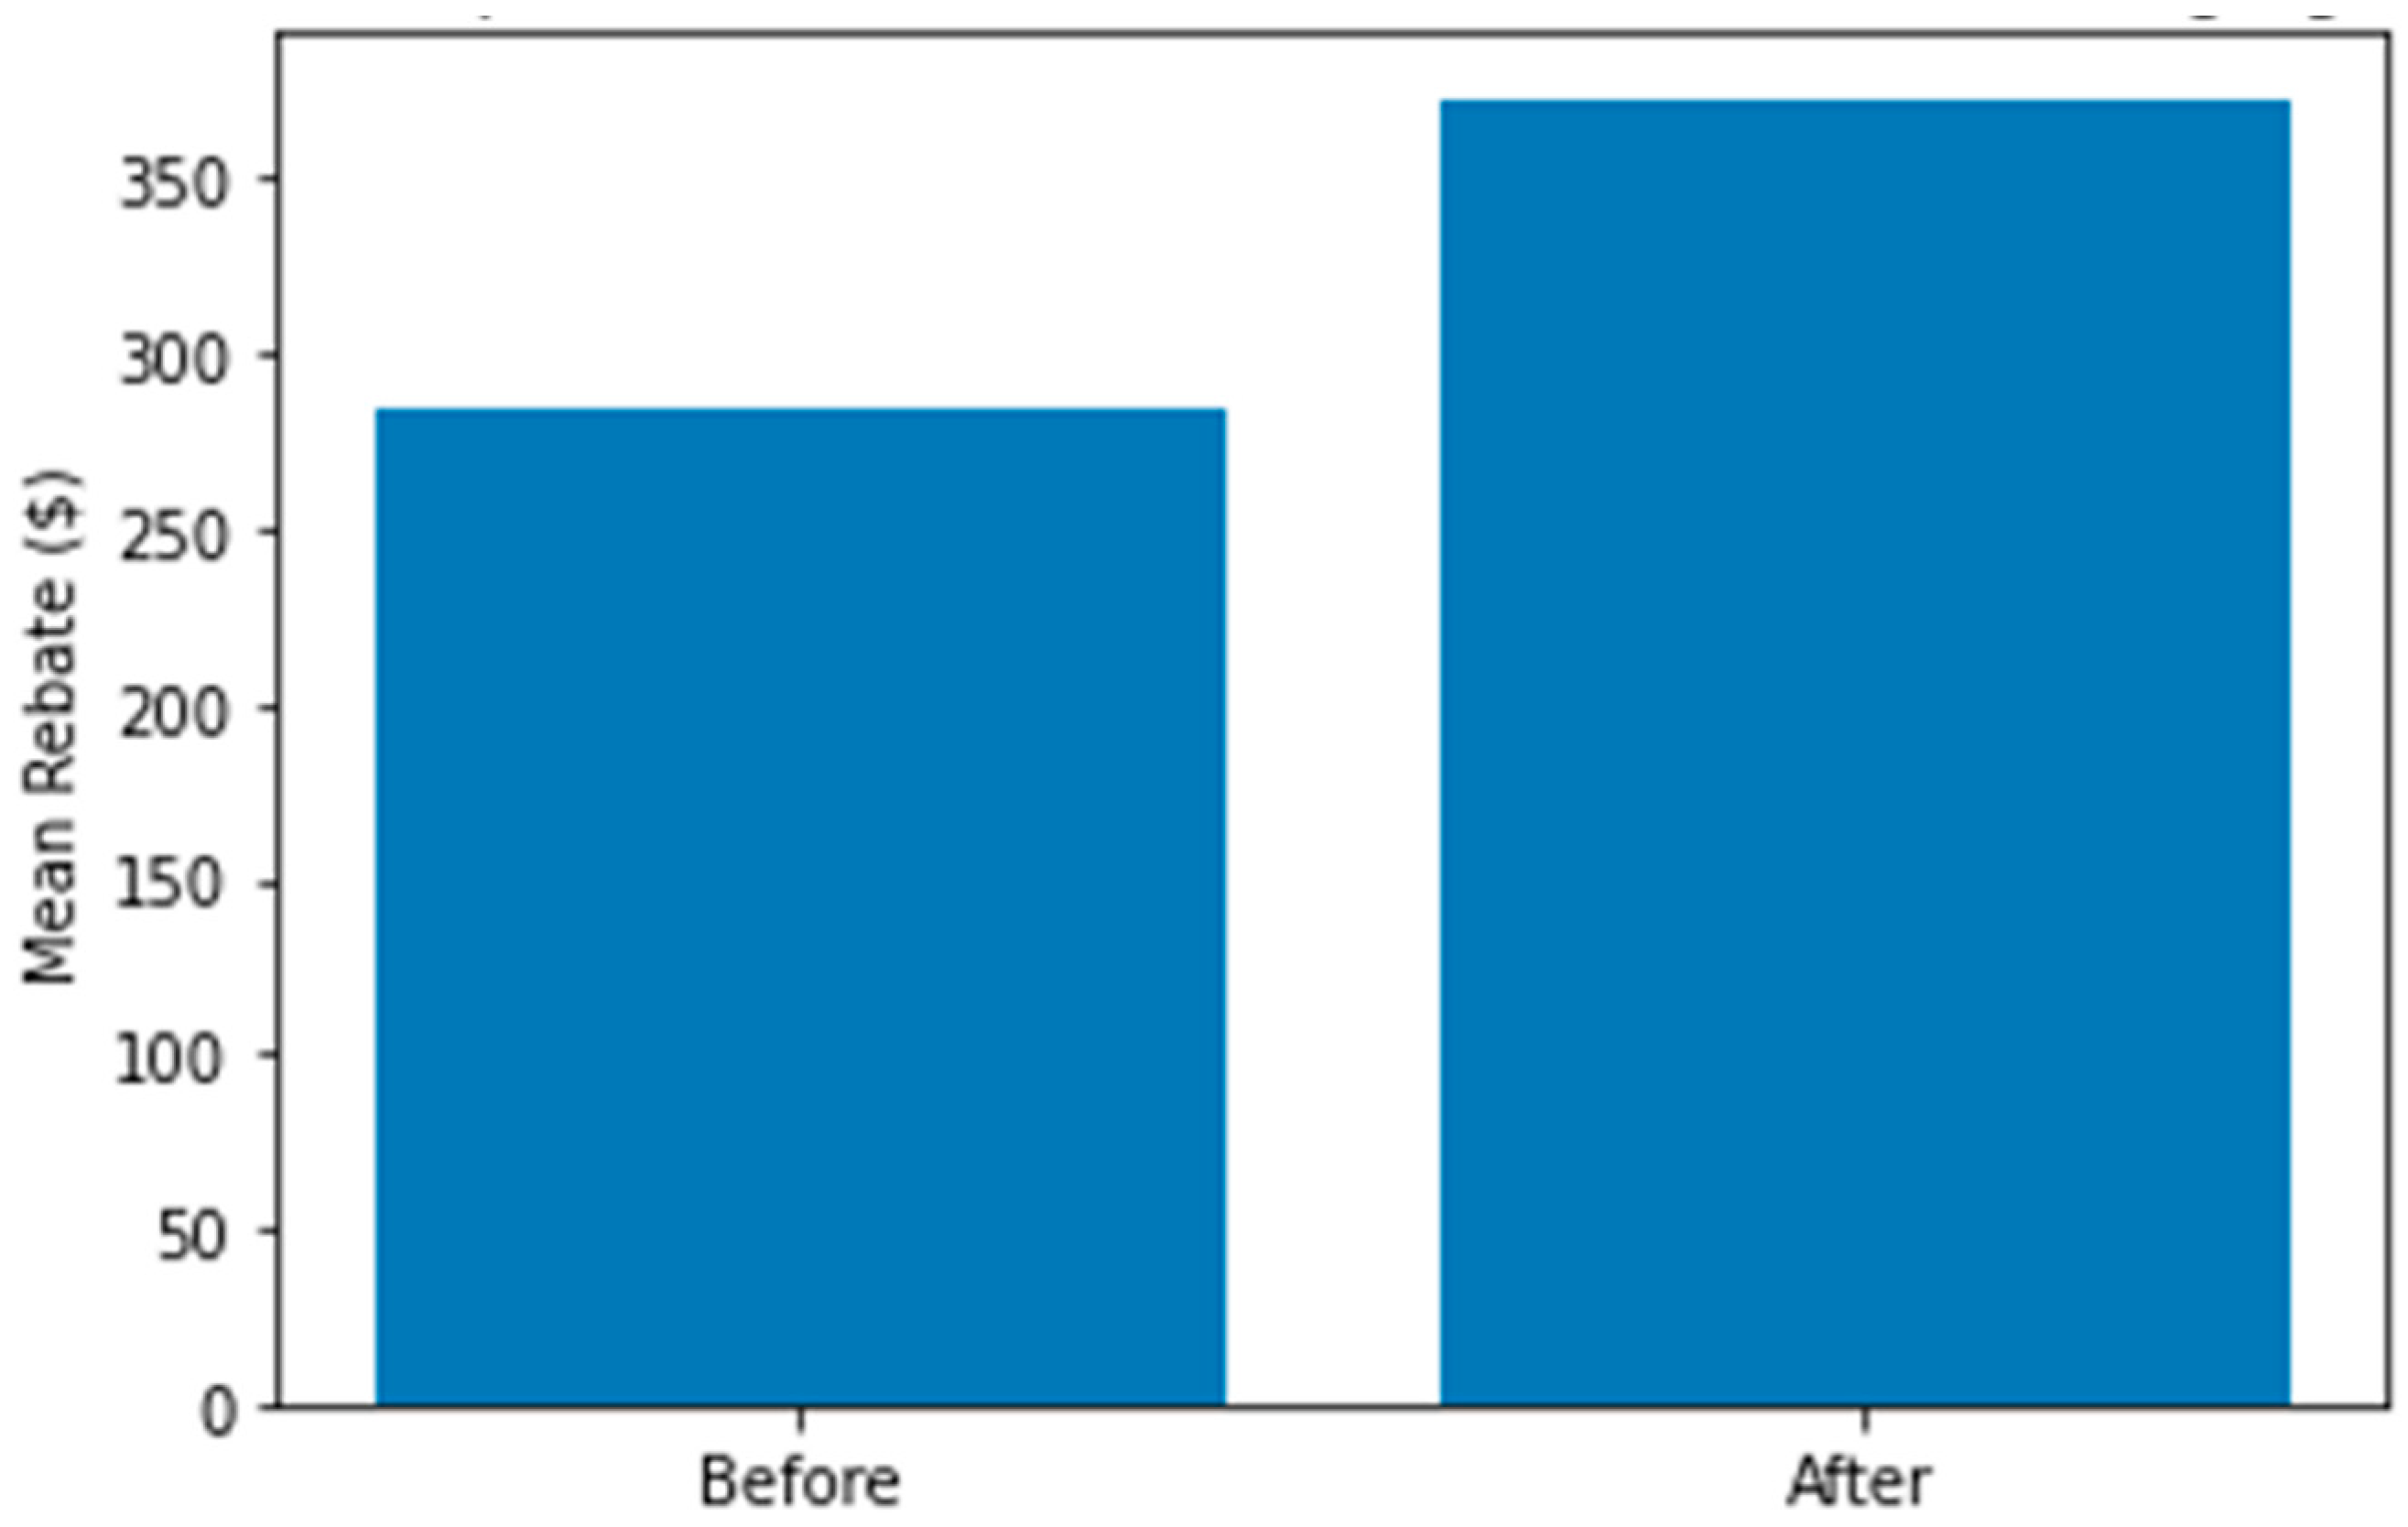
The more compelling aspect of this study lies in the analysis of EV adoption rates. Before the installation of EV charging stations, the mean EV adoption count was 283, which significantly increased to 373.02 after the installation. The p-value for this analysis was less than 0.05, indicating strong statistical significance. This result underscores the positive and significant impact of EVCS on the adoption of electric vehicles.
Several key insights emerge from this finding:
  • Infrastructure Accessibility Matters: The increased adoption of electric vehicles after the installation of charging stations highlights the importance of accessibility to charging infrastructure. Consumers are more likely to embrace EVs when they have confidence in their ability to find convenient and reliable charging points.
  • Reducing Range Anxiety: Charging station installations contribute to reducing "range anxiety," a common concern among potential EV adopters. Knowing that charging stations are readily available can alleviate fears of running out of power during trips, making EVs a more attractive choice for daily use and longer journeys.
  • Policy Implications: Policymakers can draw significant lessons from these results. Investments in expanding the charging network can yield substantial returns in terms of increased EV adoption, aligning with California's ambitious emissions reduction goals.
  • Consumer Behavior: Understanding the impact of charging infrastructure on adoption provides insights into consumer behavior. It suggests that the decision to switch to an electric vehicle is not solely based on the environmental benefits but is also influenced by practical considerations, including charging convenience.
  • Future Growth: As the EV market continues to expand, the role of charging infrastructure will become increasingly critical. With ongoing technological advancements and infrastructure development, the EV adoption rate is likely to continue rising.
While the statistical analysis demonstrates the significant impact of charging stations on EV adoption, it's important to acknowledge that other factors also play a role. These include government incentives, the availability of EV models, and the overall economic environment. Future research could explore the interplay between these variables to provide a more comprehensive understanding of EV adoption dynamics.
Table 4. Impacts on EV adoption.
Methodology Description
Data Source California Energy Commission (CEC), California Department of Motor Vehicles, California Air Resources Board (CARB), and U.S. Census Bureau
Period 2010-2022
Treatment Installation of EV charging stations
Control Group N/A
Pre-Period >2019
Post-Period <2019
Outcome Variable EV adoption count
t-statistics -23.89
Significance Level (p-value) 0.000
Figure 2. Impacts on EV adoptions.
Preprints 88976 g002
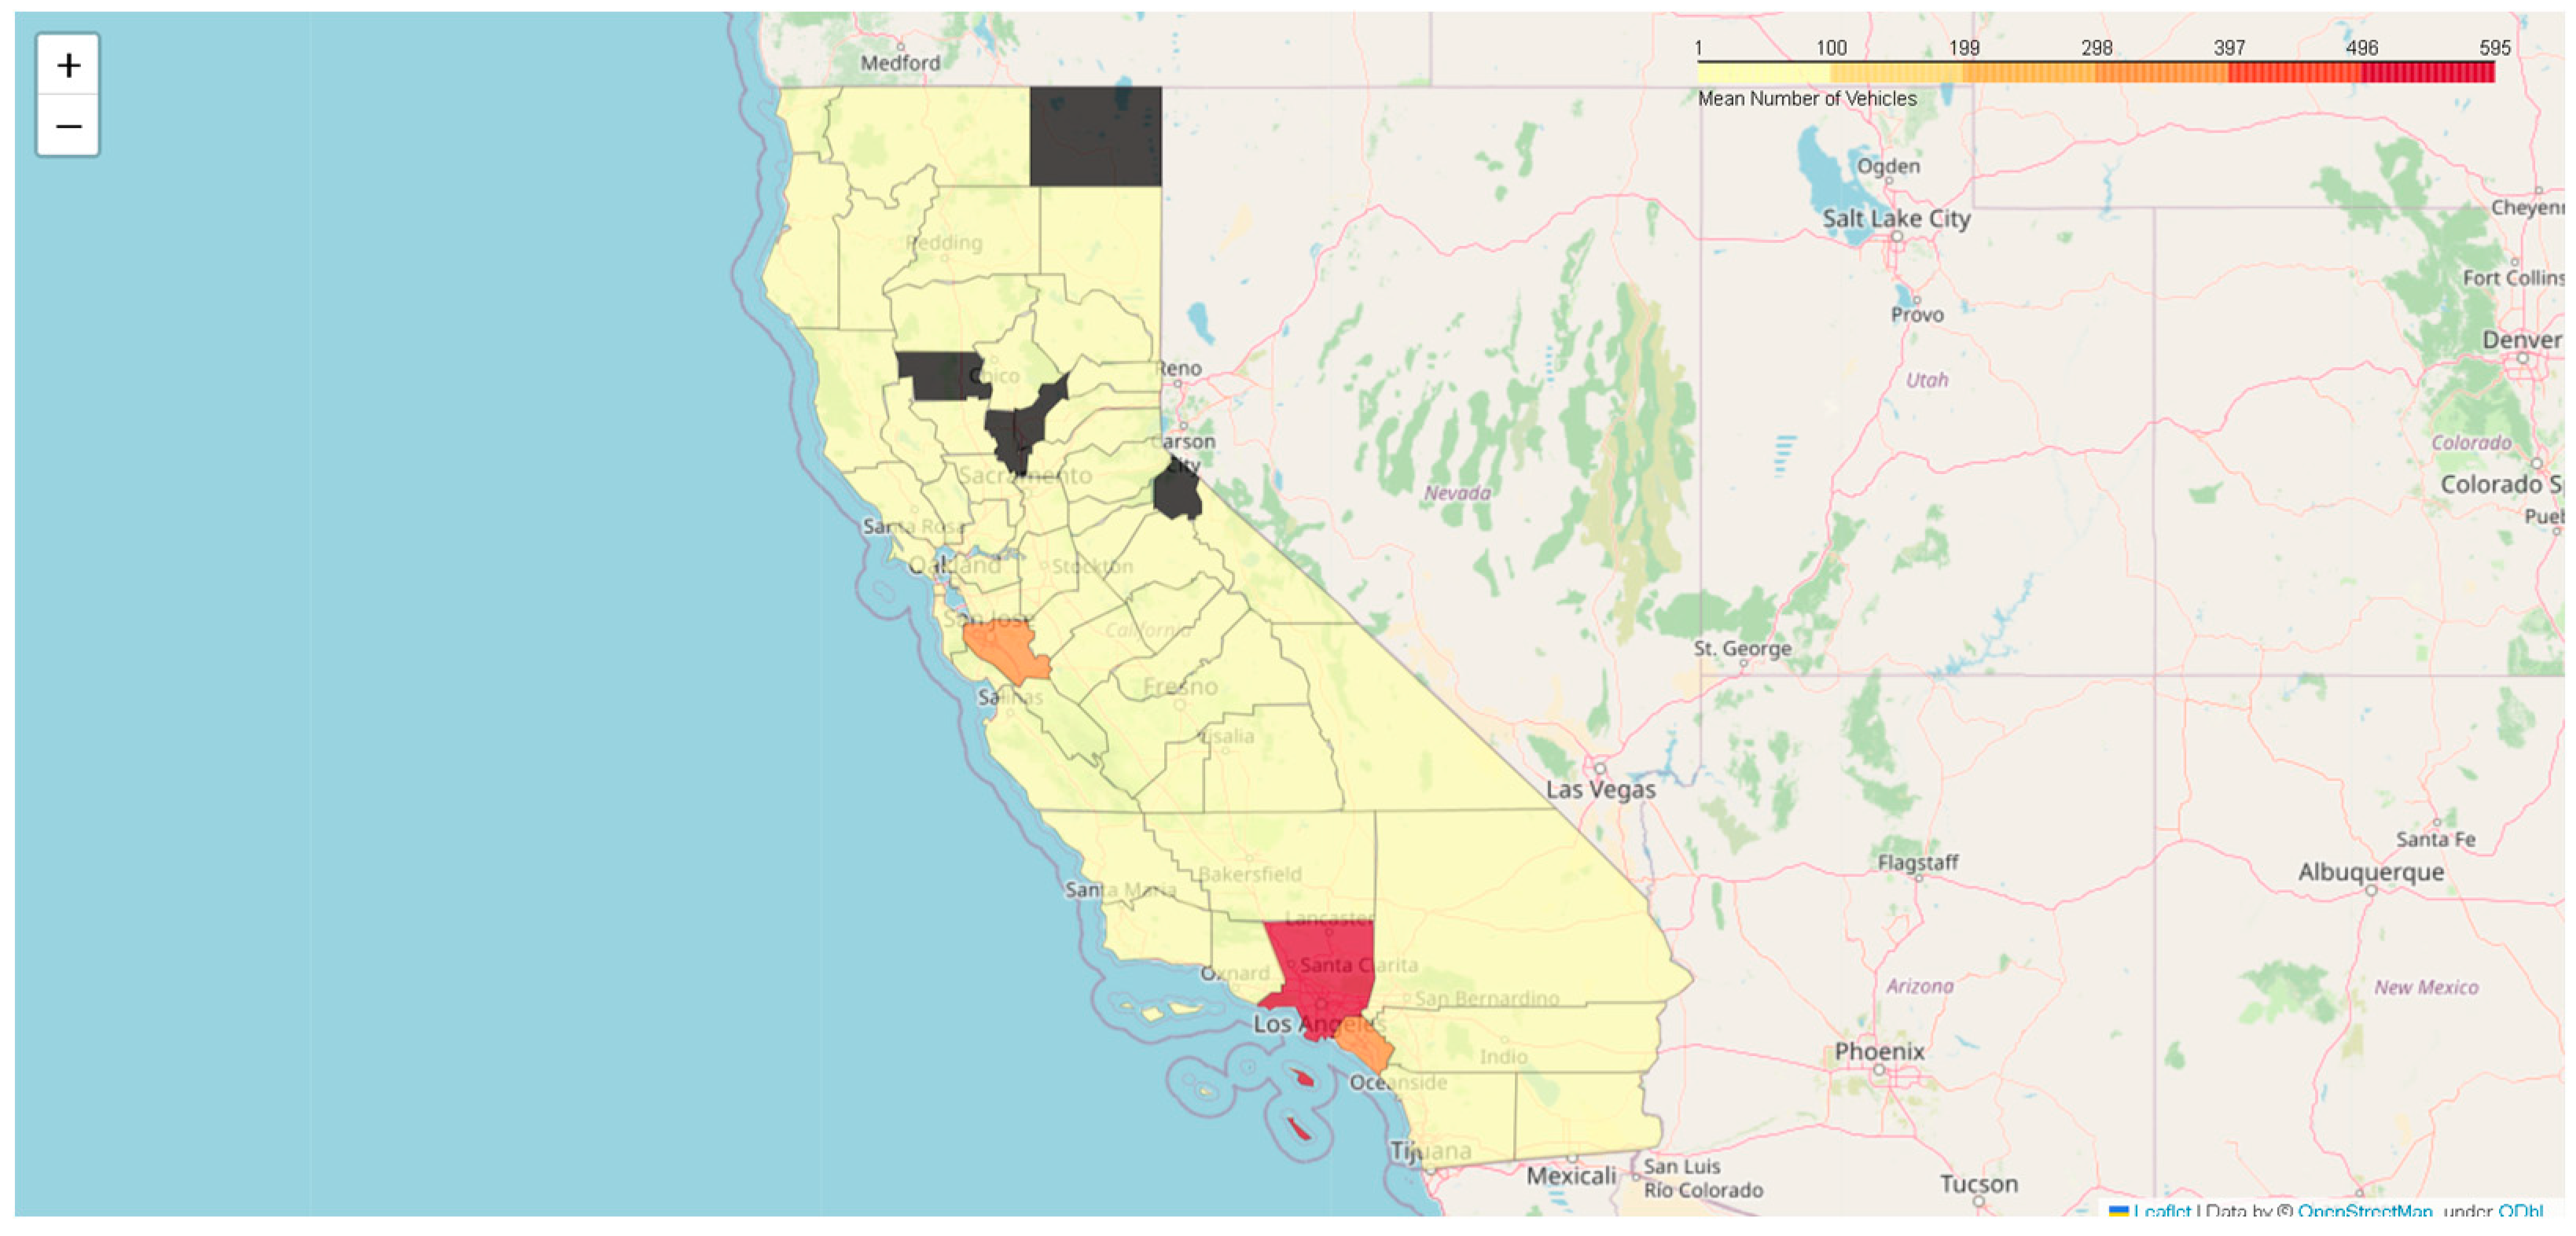
Figure 3. Choropleth map of EV adoption in California.
Preprints 88976 g003
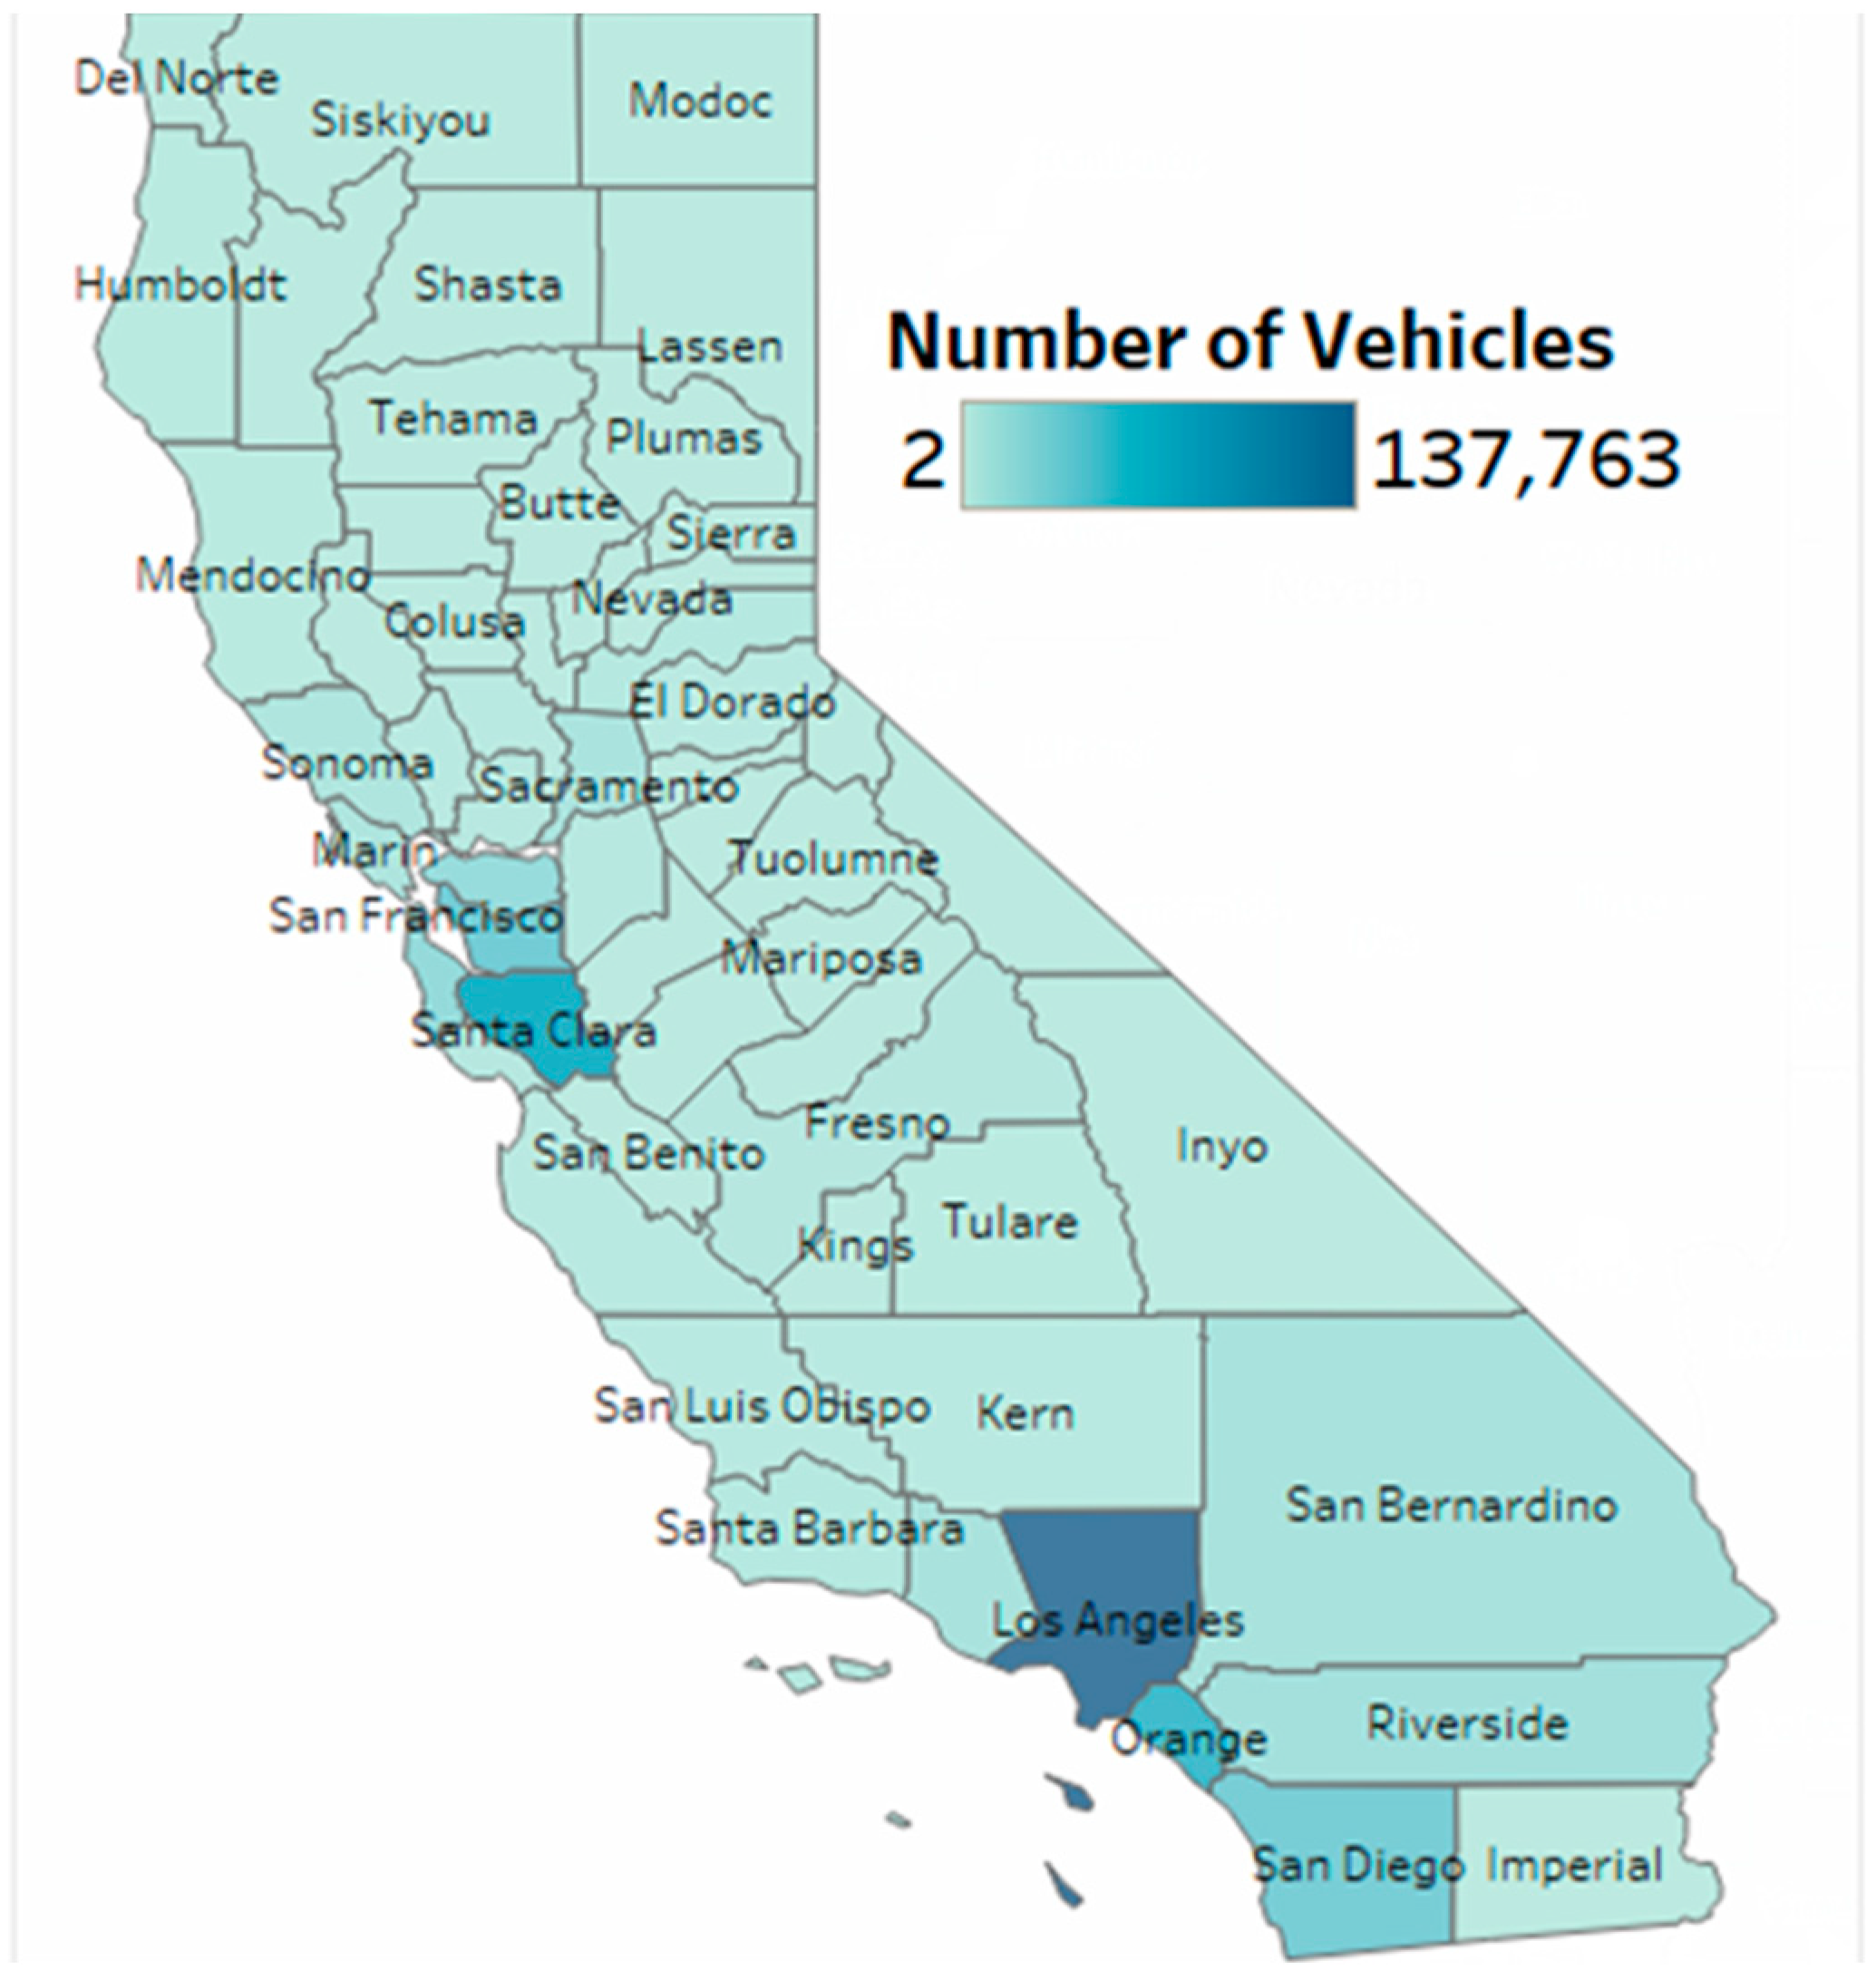
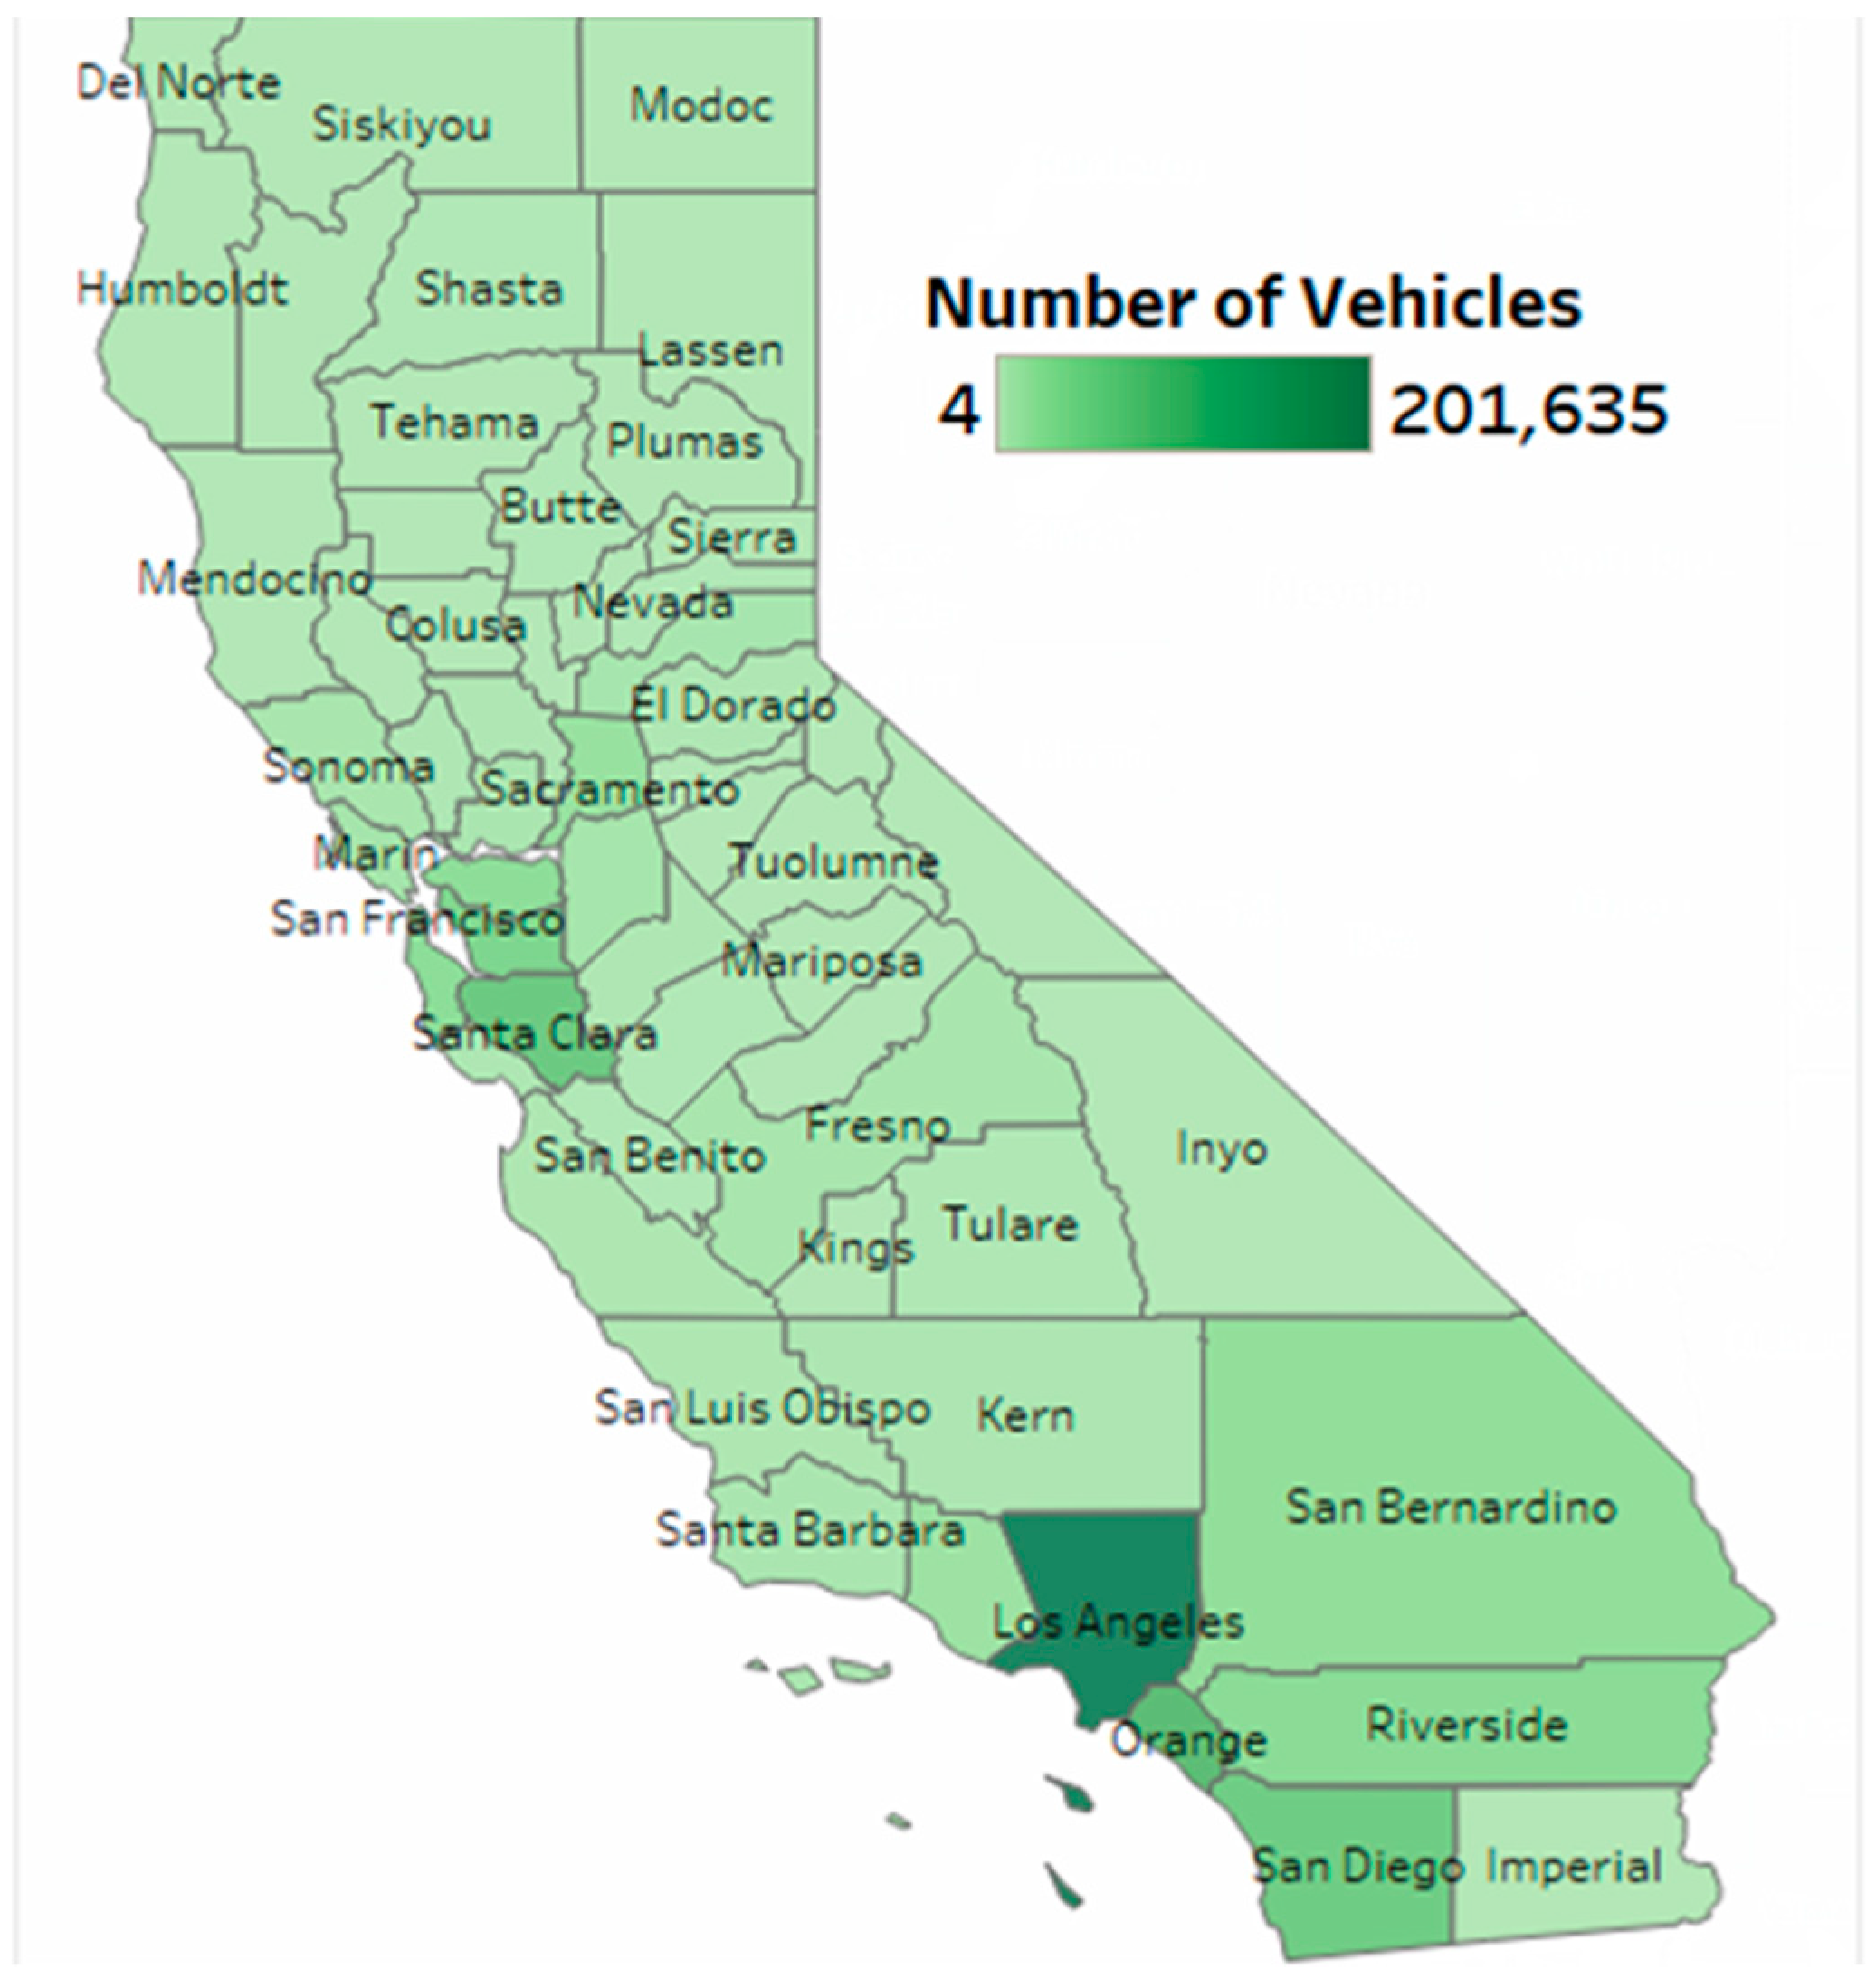
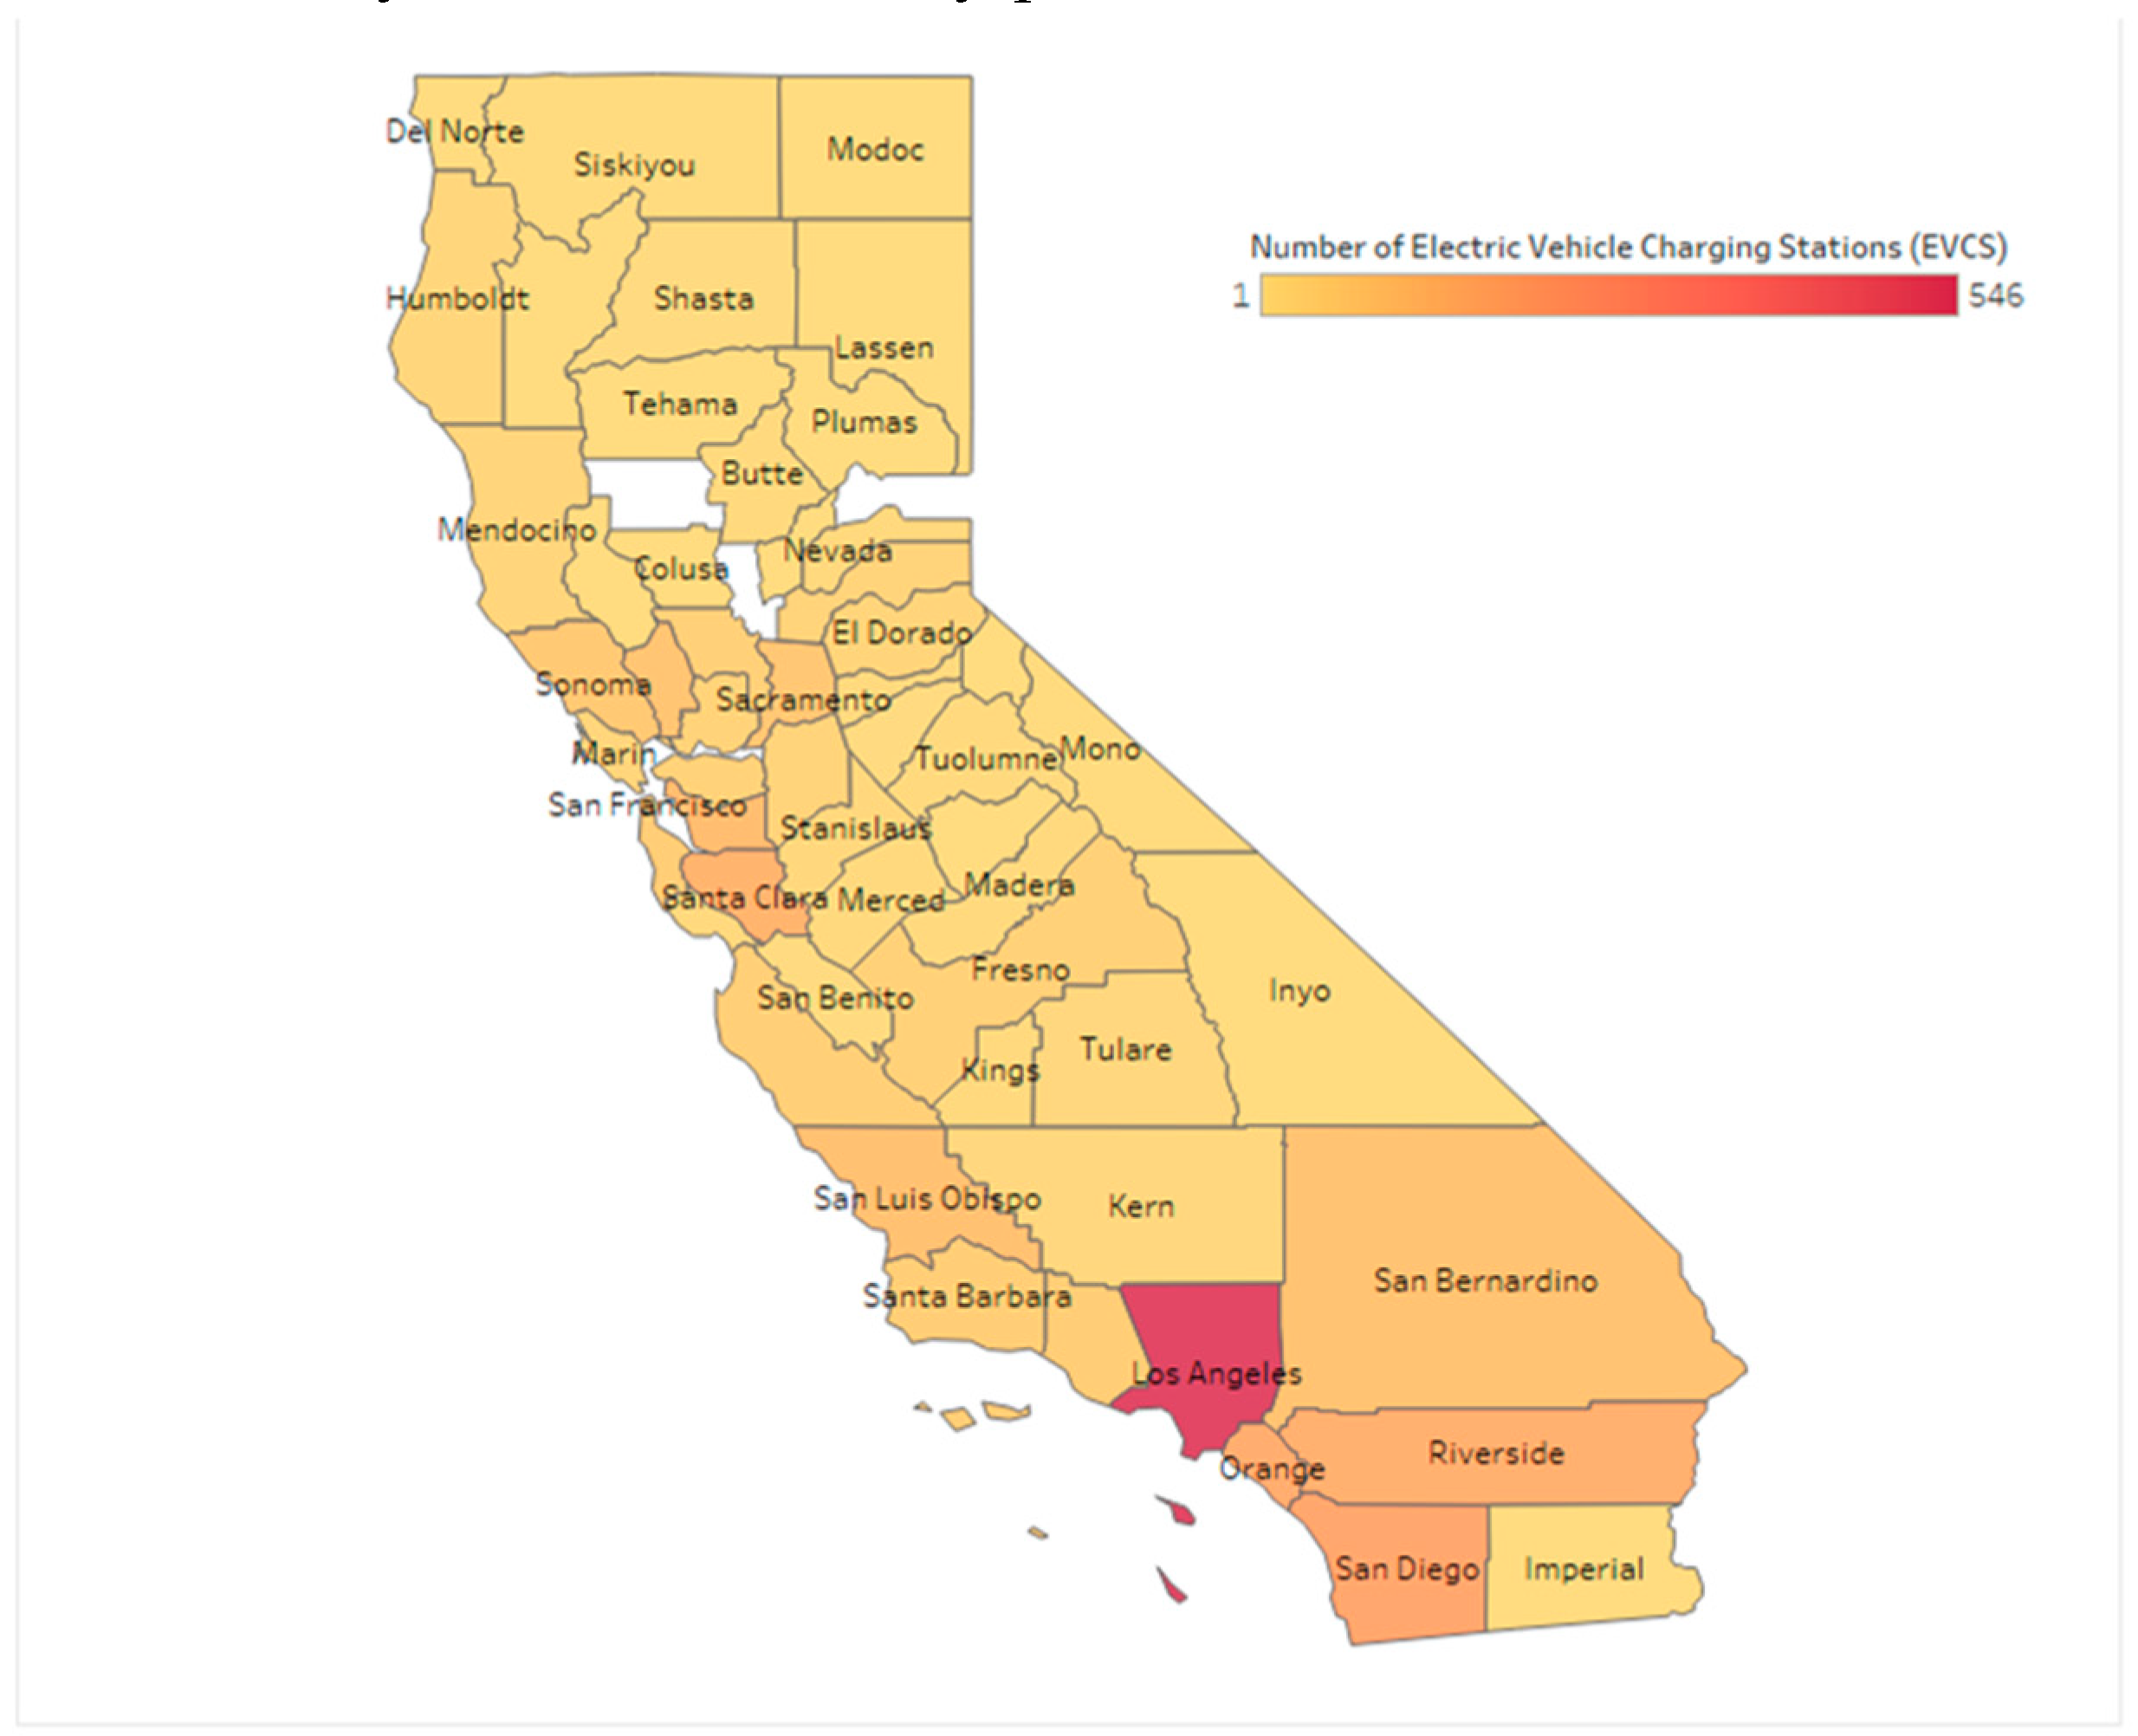
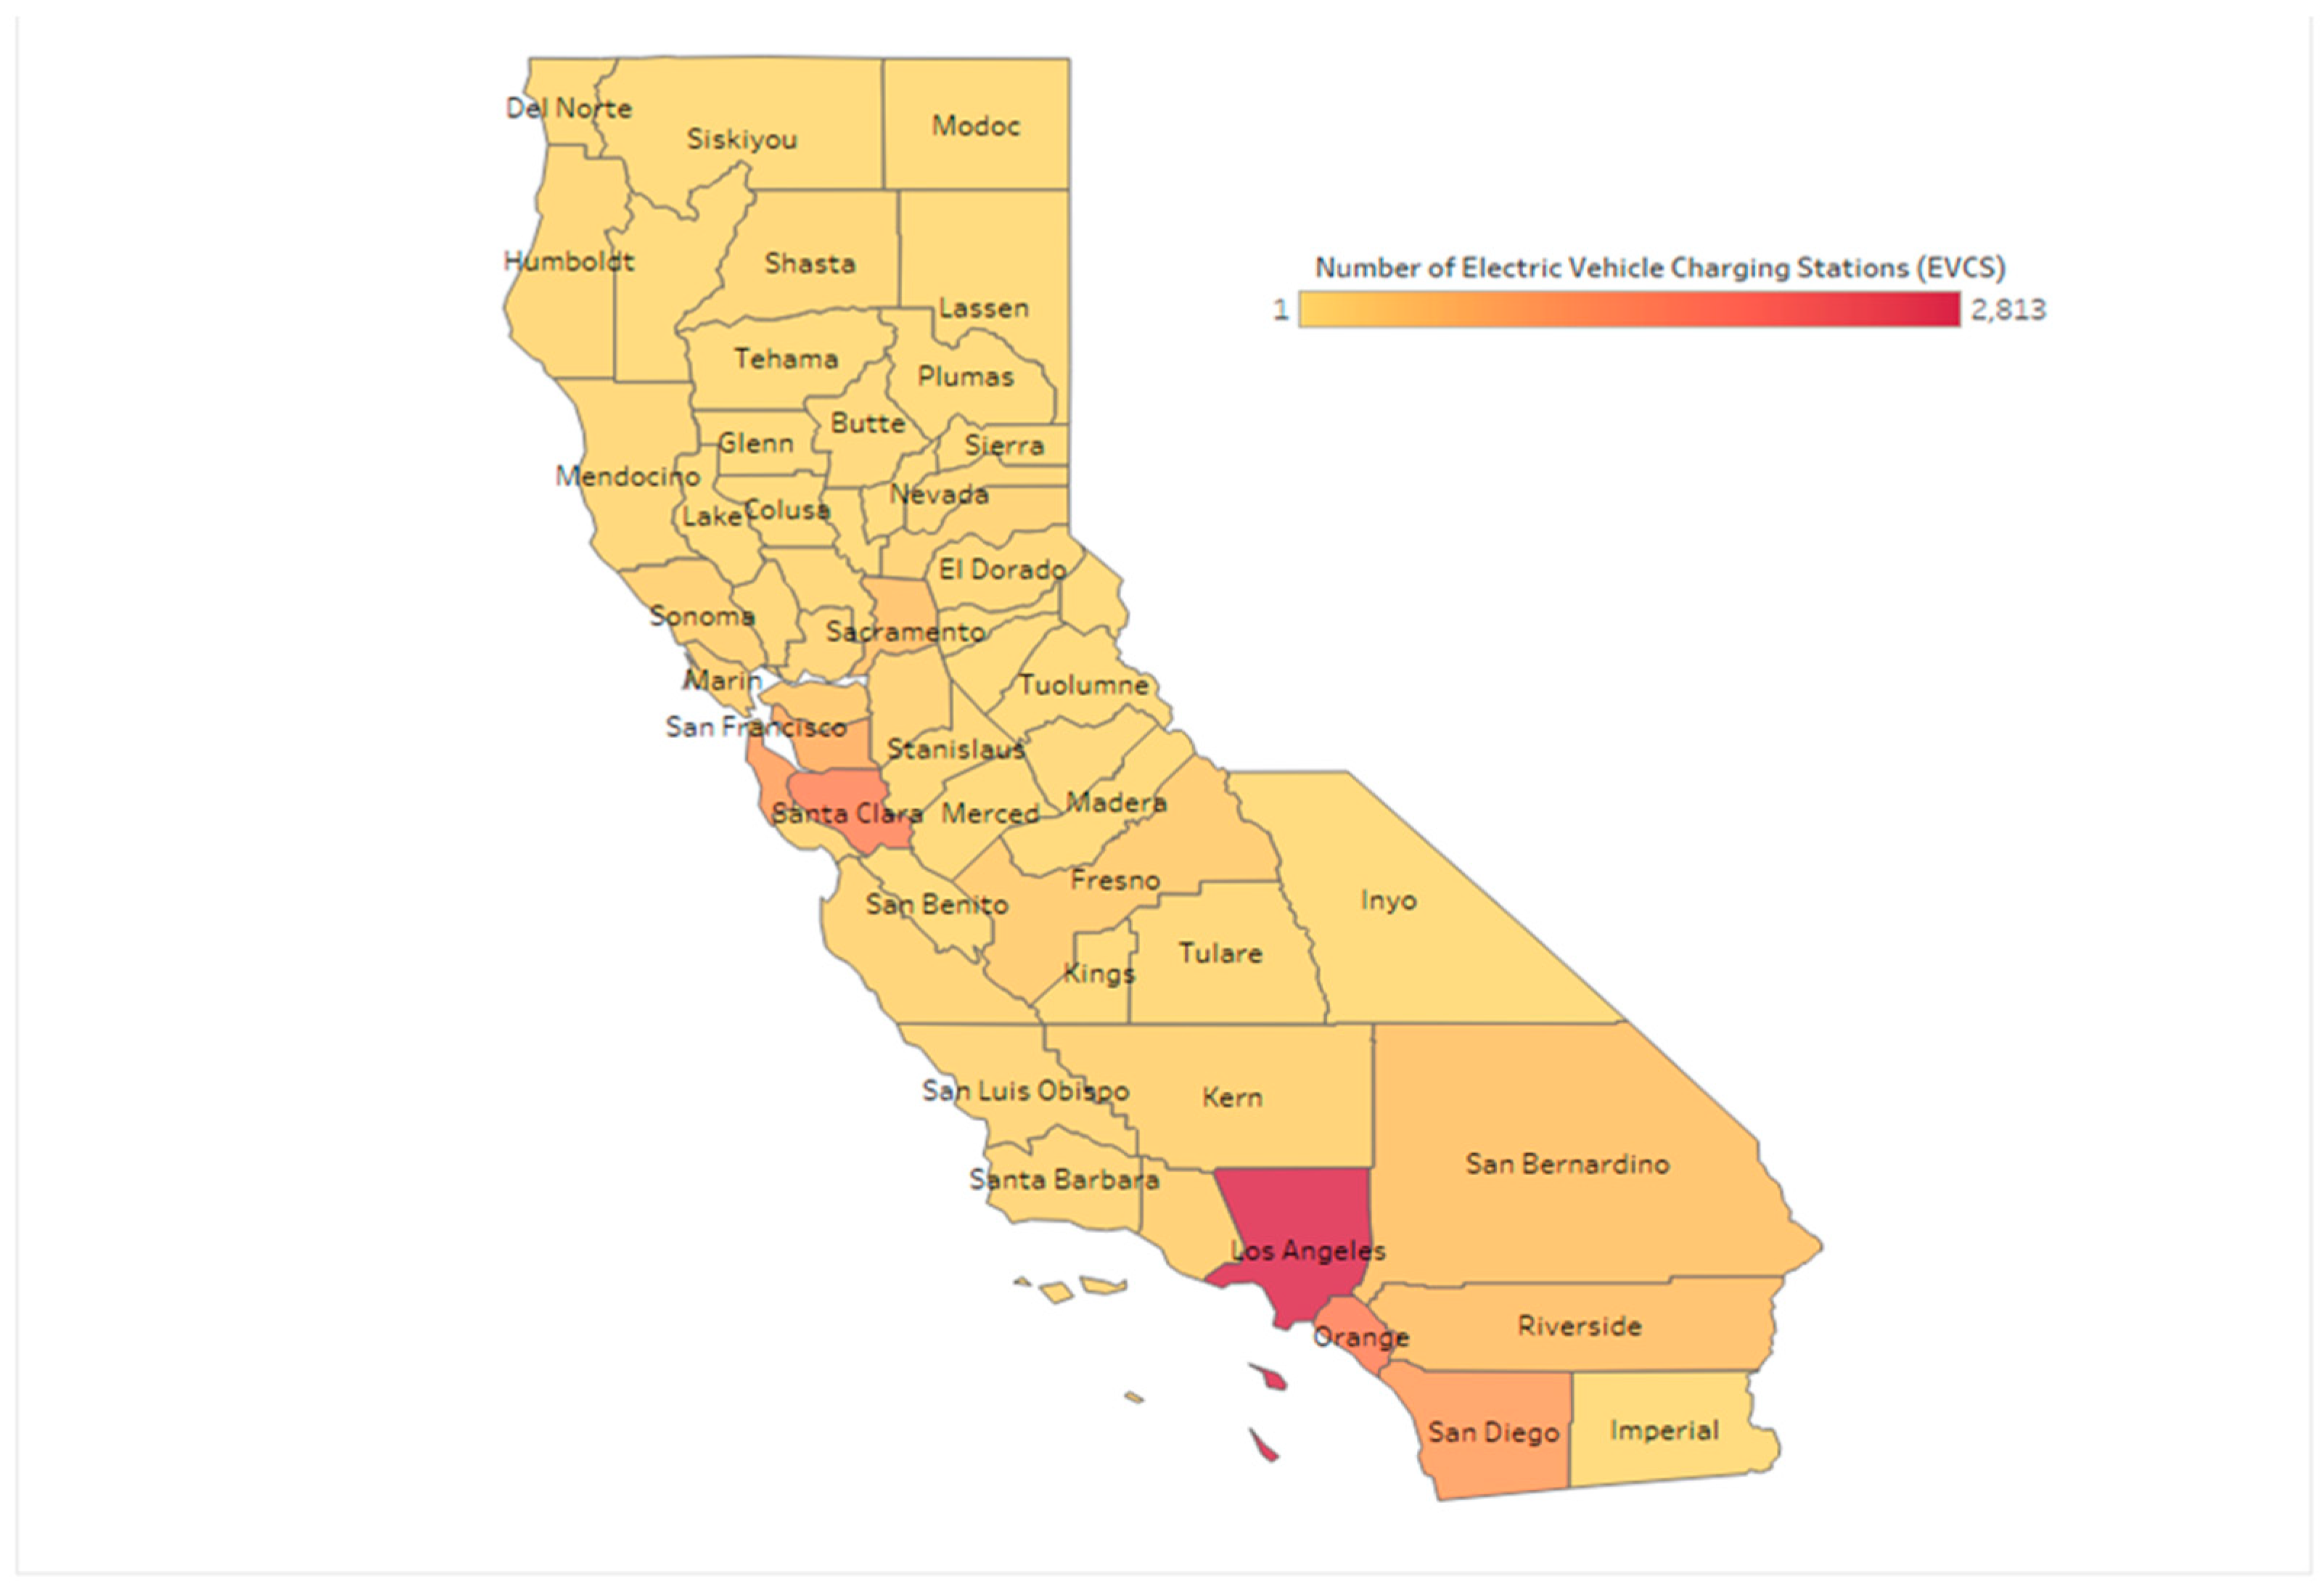
In conclusion, this study provides empirical evidence supporting the idea that expanding EV charging infrastructure positively influences EV adoption rates. As California and other regions worldwide strive to reduce greenhouse gas emissions and transition to cleaner transportation options, the role of EV charging stations in facilitating this transition cannot be underestimated. Policymakers, industry stakeholders, and researchers should continue to work together to optimize the growth and accessibility of charging infrastructure, paving the way for a more sustainable and electrified future. The Choropleth map provides a visualization of the level of electric vehicle (EV) adoption across counties. The colour scheme uses a range of hues to indicate different levels of EV adoption. The black regions on the map signify low levels or no adoption of EVs. The yellow regions represent an average EV adoption rate of approximately 1 to 100 annually, whereas the orange regions reflect an average range of 298-397 annual EV adoptions. The map's red regions represent an average annual EV adoption range of 496-595. This map provides a helpful tool for understanding the variations in EV adoption across different counties in the region. Appendix A and B shows the number of EVs adopted in California by county. And Appendix C and D the number of total EVCS in California by County.

4. Policy Implications/Conclusion

The findings of this study have important policy implications for policymakers, government agencies, and stakeholders interested in promoting the adoption of electric vehicles (EVs) and achieving emissions reduction goals. The analysis suggests that expanding Electric Vehicle Charging Stations (EVCS) can have a positive and statistically significant impact on EV adoption. Here, we provide a deeper analysis of these policy implications:
  • Investment in Charging Infrastructure: The statistically significant increase in EV adoption after the installation of EV charging stations underscores the importance of continued investment in charging infrastructure. Policymakers should prioritize the expansion of charging networks to improve accessibility and convenience for EV owners. This includes increasing the number of charging stations in urban areas, along highways, and in public places.
    • Analysis Support: The statistical analysis showed that the mean EV adoption count increased significantly from 283 to 373.02 after EVCS installation, indicating the direct impact of infrastructure accessibility on adoption.
  • Reducing Range Anxiety: One of the major barriers to EV adoption is range anxiety, the fear of running out of battery power while driving. By strategically placing charging stations, policymakers can help alleviate this concern and encourage more consumers to transition to EVs.
    • Analysis Support: The significant increase in EV adoption rates can be attributed to reduced range anxiety, as consumers have more confidence in their ability to find charging stations conveniently.
  • Supporting Emission Reduction Goals: Many regions, including California, have set ambitious goals to reduce greenhouse gas emissions. The study's results suggest that promoting EV adoption through infrastructure development can contribute to achieving these targets. Policymakers should align their EV policies with broader environmental objectives.
    • Analysis Support: As EVs produce lower emissions compared to traditional vehicles, the increase in EV adoption contributes to reducing overall greenhouse gas emissions.
  • Incentives and Regulations: While infrastructure expansion is crucial, policymakers should also consider a comprehensive approach that includes financial incentives, tax credits, and regulations that promote EV adoption. These measures can work in tandem with infrastructure development to drive consumer interest.
    • Analysis Support: The study did not directly account for incentives and regulations, but their role in EV adoption is well-documented in the literature, and they likely interact with infrastructure availability.
  • Long-Term Planning: Policymakers should consider the long-term sustainability of charging infrastructure. This includes addressing issues related to maintenance, technology upgrades, and ensuring that charging stations remain accessible and functional over time.
    • Analysis Support: While the study's data covers up to 2022, long-term planning is essential to support the continued growth of the EV market beyond the scope of this analysis.
  • Public-Private Partnerships: Collaborations between government entities and private sector stakeholders, including charging station providers and automakers, can help accelerate the deployment of EVCS. Policymakers can create a conducive environment for such partnerships.
    • Analysis Support: The study's findings provide evidence that the installation of EVCS positively impacts EV adoption, making the case for continued collaboration between public and private sectors.
In summary, the analysis highlights the role of EV charging infrastructure in promoting EV adoption, which is vital for reducing greenhouse gas emissions and achieving sustainable transportation goals. Policymakers should view charging infrastructure as a critical component of their broader EV adoption strategy and consider it in conjunction with incentives, regulations, and long-term planning to create a supportive environment for the transition to electric mobility. The study's findings provide empirical evidence to support these policy implications.

4.1. Future Research Directions

While this study provides valuable insights into the impact of EV charging stations on EV adoption and rebates in California, there are several avenues for future research that can further enhance our understanding of this topic.
  • Long-Term Impact: This study focused on a relatively short-term period from 2010 to 2022. Future research could explore the long-term impact of EV charging stations on EV adoption and rebates over several decades. This would provide a more comprehensive view of how charging infrastructure influences the evolution of the electric vehicle market.
  • Regional Variations: California is a diverse state with varying demographics and geographic features. Future research could delve deeper into regional variations in the impact of EV charging stations on EV adoption and rebates. This would help identify areas where charging infrastructure has a more significant effect and tailor policies accordingly.
  • Consumer Behavior: Understanding consumer behavior is crucial in promoting EV adoption. Future research could investigate the psychological and sociological factors that influence individuals' decisions to purchase EVs, even in the presence of charging infrastructure. This could include factors like social norms, peer influence, and perceived environmental benefits.
  • Economic Analysis: A more comprehensive economic analysis could be conducted to assess the cost-effectiveness of EV charging station installations compared to other policy measures aimed at promoting EV adoption. This would help policymakers allocate resources more efficiently.
  • Policy Evaluation: Evaluating the effectiveness of specific policies, such as rebate programs and incentive schemes, in conjunction with charging infrastructure expansion could provide valuable insights into the most impactful strategies for accelerating EV adoption.
  • Technological Advancements: With rapid advancements in battery technology and charging infrastructure, future research should keep pace with these developments. Assessing how emerging technologies, such as fast-charging stations and higher-capacity batteries, impact EV adoption will be essential.
  • Environmental Impact: While this study briefly touched on the environmental benefits of EV adoption, future research could delve deeper into quantifying the reduction in greenhouse gas emissions attributable to increased EV adoption facilitated by charging infrastructure.
  • Public Perception: Understanding how the public perceives EV charging stations and their role in the transition to electric mobility is crucial. Future studies could explore public attitudes, concerns, and awareness regarding EV infrastructure.
In conclusion, this research serves as a valuable foundation for understanding the relationship between EV charging stations, EV adoption, and rebates in California. However, the electric vehicle landscape is rapidly evolving, and ongoing research is essential to inform effective policies and strategies that promote sustainable transportation and reduce greenhouse gas emissions.

4.1. Limitations

While this study provides valuable insights into the relationship between Electric Vehicle Charging Stations (EVCS) and Electric Vehicle (EV) adoption in California, it is important to acknowledge certain limitations that should be considered when interpreting the results and implications:
  • Causality and Correlation: The analysis presented in this study establishes a correlation between the installation of EV charging stations and increased EV adoption. However, it does not establish causality. While the presence of charging infrastructure is associated with higher EV adoption rates, other unmeasured factors may also contribute to the observed trends.
  • Data Limitations: The study relies on publicly available data sources, which may have limitations in terms of accuracy and completeness. Additionally, the data might not capture all relevant variables that could influence EV adoption, such as local economic conditions, consumer preferences, and advertising campaigns.
  • Temporal Scope: The analysis covers the period from 2010 to 2022, with a post-period defined as 2019. While this choice was made to align with significant policy developments, it may not capture longer-term trends and the full impact of charging infrastructure on EV adoption.
  • Regional Specificity: The study focuses on California, a state known for its strong commitment to environmental initiatives and EV adoption goals. Findings from this study may not be directly applicable to regions with different policies, economic conditions, and cultural attitudes toward EVs.
  • Other Policy Factors: While this study focuses on the role of EVCS, it does not account for other policy factors, such as tax incentives, rebates, and emissions regulations, which can also influence EV adoption rates. Isolating the specific impact of EVCS can be challenging given the complex interplay of multiple policy initiatives.
  • Future Developments: The analysis is based on historical data, and the EV landscape is rapidly evolving. Future developments in technology, government policies, and consumer attitudes may impact EV adoption differently, and the study's findings may not fully reflect these changes.
  • Sample Size: The study's sample size, especially when examining subgroups based on factors like income and housing density, may limit the generalizability of results. Larger and more diverse datasets could provide a more comprehensive understanding.
  • Consumer Behavior: The study primarily focuses on quantitative data and does not delve deeply into the underlying motivations and decision-making processes of consumers when adopting EVs. Qualitative research could provide additional insights into the driving factors behind EV adoption.
  • External Factors: External events and unforeseen circumstances, such as global economic downturns or natural disasters, can influence EV adoption rates. These factors are difficult to account for in retrospective data analysis.
Despite these limitations, this study contributes to our understanding of the relationship between EV charging infrastructure and EV adoption, offering valuable insights for policymakers and stakeholders. Future research should aim to address some of these limitations by incorporating more comprehensive data, considering a broader geographical scope, and exploring the multifaceted drivers of EV adoption in greater detail.

Acknowledgments

The author thanks Zach Henkin, Regina McCormack, Francis Alvarez, James Tamerius, and John Anderson for their tremendous support and for always believing in me.

Conflicts of Interest

The authors declare no conflict of interest.

Appendix A

The number of EV adoption by county in California pre-2019
Preprints 88976 g004

Appendix B

The number of EV adoption by county in California post-2019
Preprints 88976 g005

Appendix C

The total EVCS by California county pre-2019
Preprints 88976 g006

Appendix C

The total EVCS by California county post-2019
Preprints 88976 g007

References

  1. The WhiteHouse. Available online: https://www.whitehouse.gov/briefing-room/statements-releases/2021/04/22/fact-sheet-president-biden-sets-2030-greenhouse-gas-pollution-reduction-target-aimed-at-creating-good-paying-union-jobs-and-securing-u-s-leadership-on-clean-energy-technologies/ (accessed on 22 April 2021).
  2. Evconnect. Available online: https://www.evconnect.com/blog/10-factors-affecting-ev-adoption (accessed on 27 April 2022).
  3. Bhutada, G. Visualcapitalist. Available online: https://www.visualcapitalist.com (accessed on 30 September 2022).
  4. Mandev, A.; Sprei, F.; Tal, G. Electrification of Vehicle Miles Traveled and Fuel Consumption within the Household Context: A Case Study from California, U.S.A. S.A. World Electr. Veh. J. 2022, 1–15. [Google Scholar] [CrossRef]
  5. Pearre, N. S.; Swan, L. G.; Burbidge, E.; Anctil, J. Regional Electric Vehicle Fast Charging Network Design Using Common Public Data. World Electr. Veh. J. 2022. [CrossRef]
  6. Youssef, C.; Fatima, E.; Najia, E.-s.; Chakib, A. A technological review on electric vehicle DC charging stations using photovoltaic sources; IOP Publishing: Morocco, 2014. [Google Scholar] [CrossRef]
  7. International Electrotechnical Commission. IEC 62196-1:2022 CMV. International Electrotechnical Commission, 2022.
  8. Agency, I. E. Global EV Outlook Securing supplied for an electric future. International Energy Agency 2022.
  9. U.S. Department of Transportation. Available online: https://www.transportation.gov/rural/ev/toolkit/ev-basics/charging-speeds (accessed on 27 December 2022).
  10. Joram, H.M.; Joel, L.; Franklin, P.; Susilo, O. The effect of policy incentives on electric vehicle adoption. Energy Policy 2016, 94, 94–103. [Google Scholar] [CrossRef]
Disclaimer/Publisher’s Note: The statements, opinions and data contained in all publications are solely those of the individual author(s) and contributor(s) and not of MDPI and/or the editor(s). MDPI and/or the editor(s) disclaim responsibility for any injury to people or property resulting from any ideas, methods, instructions or products referred to in the content.
Copyright: This open access article is published under a Creative Commons CC BY 4.0 license, which permit the free download, distribution, and reuse, provided that the author and preprint are cited in any reuse.
Prerpints.org logo

Preprints.org is a free preprint server supported by MDPI in Basel, Switzerland.

Subscribe

© 2024 MDPI (Basel, Switzerland) unless otherwise stated