

Submitted:
26 October 2023
Posted:
27 October 2023
You are already at the latest version
Abstract
This study investigates why young adults live with their parents in Sweden. As young adults’ living arrangements affect decisions about marriage, education, childbirth, and participation in the workforce, more knowledge for policy makers is crucial to implementing effective policies to support young adults and promote financial independence and well-being. Using a data set from 1998 to 2021 at the municipal level in Sweden, we used a spatial autoregressive panel data model to examine the proportion of young adults living at home and regional disparities. The study uncovers intraregional variations, illustrating how different municipalities within Sweden exhibit different patterns of young adults living at home. Our findings reveal that economic factors, such as unemployment, significantly impact this pattern. The dynamics of the housing market, demographic factors, cultural differences, and location-specific characteristics also play an essential role in explaining this pattern. The findings suggest that the key drivers are the lack of rental housing, high unemployment rates, a high degree of urbanisation, interregional migration, and lack of social capital.
Keywords:
young adults
; housing
; living at home
; spatial autoregressive panel data model
; Sweden
1. Introduction
The purpose of the paper is to analyse why the proportion of young adults1 living at home varies between regions and time within the same country. Young adults face difficulties in finding housing, and an increasing proportion choose to reside in their family homes or are compelled to do so [1,2]. Although the preceding generation may have aspired to leave home and achieve independence sooner, the economic and social landscape has changed. For many young people, staying home has become a more practical and viable alternative [3,4]. The choice of the initial housing arrangement for young adults is crucial. For instance, the first housing choice significantly impacts their housing situation even eight years after leaving home [5], and it can have long-term consequences on decisions related to childbearing and higher education [6].
In many countries, the housing market poses significant challenges, especially for young adults aiming to enter the housing market [1,4] (Grander, 2023; Sompolska-Rzechuła and Kurdyś-Kujawska, 2022). Various thresholds, such as the need for savings for a down payment, high-income requirements for rent, interest costs, and amortisation [7], limit housing affordability. This situation is exacerbated by a general housing shortage that drives up housing prices and rents [8].
Typically, when describing the housing market and its shortages, one refers to high housing prices, rental costs, and a lack of available vacancies. However, the percentage of young adults still residing at home may not always be a reliable indicator of housing shortages [9]. Although there are exceptions, there is limited knowledge about the factors that influence the proportion of young adults who remain at home. In Europe, we observe a higher percentage of young adults staying at home in southern and eastern parts of Europe compared to northern Europe [4,10]. Economic factors can explain some of these patterns, but cultural differences can also explain many [11]. Researchers have explored the impact of financial factors on young adults’ decisions to live at home [12], with high student loan debt, limited job opportunities, and increasing living costs contributing significantly.
Furthermore, the current economic climate, marked by job instability, inflation, and stagnant wages, makes it increasingly difficult for young adults to pay the expenses associated with independent living. Although many studies examine migration decisions using individual-level microdata and some analyse national trends, few investigate interregional and intraregional differences within a country.
Understanding the driving forces behind the proportion of young adults living at home with their parents is crucial. This living arrangement can have profound social, cultural, economic, demographic, and psychological implications [13]. For example, it can influence how young adults are perceived by their peers and society [14], as well as their self-perception. It can also impact decisions related to marriage, education, childbirth rates, participation in the labour force, and overall productivity [6]. Furthermore, it can delay the development of independence and autonomy. Understanding these driving forces can help policy makers develop policies that support young adults and their families, such as providing affordable housing or financial assistance.
Sweden, the focus of our case study, has a relatively well-developed welfare system and high-quality housing, making it more socially acceptable for young adults to live with their parents without feeling stigmatised or seen as financially dependent. Furthermore, Sweden’s high level of gender equality can influence young adults’ decisions regarding living arrangements. However, the country also faces relatively high housing costs, particularly in urban areas, which can pose challenges for young adults just starting their careers or pursuing higher education, as they may lack the financial resources to live independently.
The available data are disaggregated at the municipal level. Sweden comprises 290 municipalities, and we have collected data from 1998 to 2021. These extensive data cover numerous economic cycles, including downturns and upswings. It includes a wealth of variables, with the main focus being the proportion of young adults living at home. Other variables include socioeconomic, housing market, demographic, and cultural factors.
The econometric model employed is a spatial autoregressive panel data model with spatially lagged errors. We used a contiguity-based spatial weight matrix. Given the high correlation among variables within different categories, principal component analysis will be applied to reduce the number of explanatory variables. Our analysis aims to identify the critical underlying factors that explain the variation in the proportion of young adults who live with their parents over time and between regions. Factors such as the shortage of rental housing, high unemployment rates, urbanisation levels, interregional migration, and social capital play a fundamental role in explaining why young people stay home more frequently.
Although the research question is not new, our study contributes by analysing aggregated data at the regional level over an extended period. Although some studies use individual-level data and others examine aggregated data at the national level cross-sectional, the regional and temporal dimension, in particular, remains underexplored, and our study fills this research gap. In addition, we have included numerous factors in our model that have not been previously tested. Finally, we have estimated a spatial autoregressive panel data model to control for spatial dependence. Furthermore, we have used principal component analysis to reduce the number of underlying factors and categorise them into the housing market, socioeconomic, demographic, cultural, and location factors, a unique approach not previously undertaken in this context.
The disposition of the article is as follows. In Section II, a summary of the literature in the field is given, followed by Section III, which presents methodological choices. Section IV presents and discusses the results. The article ends with the conclusions of Section V.
2. Review of the literature
The transition to adulthood has changed in recent decades and one of the most notable changes is the patterns of leaving and returning home. In the past, it was common for young adults to leave home after completing their education, find a job, and start their own independent lives. However, young adults often delay leaving home, and some even return to live with their parents after a period of independence (Goldscheider and Goldscheider, 1999) [15] and later (Sompolska-Rzechuła and Kurdyś-Kujawska, 2022) [4].
In this section, we will try to synthesise and analyse the literature on the proportion of adults living at home, highlighting the key theories, concepts, and findings of the field in the field. In addition, we want to identify literature gaps and explain how our study will address these gaps.
The literature will be categorised into themes: pull and push factors. Pull factors might include a strong family bond, a desire to stay close to friends and family, or a need for support from their parents. These factors can force young adults to stay with their parents and maintain close family ties. However, push factors could include a desire for independence, career opportunities in another location, or a desire for a change of scenery. These factors can lead young adults to move away from their parents and seek new experiences.
a) Pull factors (stay home)
An early analysis by (Aquilino, 1990) [16] finds that family structure and parental characteristics in the United States are significant factors that affect the probability of coresidence. The results indicate that the probability of residency is higher for adult children who have never married, are divorced or separated, or have lower levels of education. Additionally, they found that the probability of residency is higher for older widowed parents or those with health problems. They also suggested that the findings highlight the importance of family structure and parental characteristics in understanding the likelihood of parent-adult child coresidence. Recent research indicates that young adult education and employment status correlate with co-residence status [17].
The obligation to provide a home to their elderly parents and adult children in need varies greatly depending on their family experiences [18]. Those who grew up in intergenerational coresidence were more committed to providing it themselves, and nonfamily living in young adulthood, particularly for women who left home before marriage, decreased support for intergenerational coresidence. The changing societal norms toward individualism and independence have contributed to a decline in support for intergenerational coresidence, mainly as people live longer and marriage ages increase. Goldscheider and Lawton (1998) [18] suggested a decline in the extent that these obligations are felt, particularly for those who did not experience intergenerational continuity in their upbringing.
Choi (2003) [19] examines the factors influencing whether ageing parents or adult children decide to live together. They found that parents were more likely to initiate coresidence if they had health problems or financial difficulties, while adult children were more likely to initiate coresidence if they were unmarried or had children of their own.
Later Messineo and Wojtkiewicz (2004) [20] analysed the trend of adult children living with their parents in the United States from 1960 to 1990. They find that, contrary to popular belief, the propensity of adult children to live at home with their parents has not increased over time. Over three decades, they used data from the United States Census to analyse the prevalence of coresidence or the living arrangements of adult children with their parents. Although there was an increase in coresidence during the 1970s, the prevalence of adult children living with their parents remained relatively stable from 1960 to 1990. It suggests that the perception of an increasing trend in coresidence may be due to several factors, including changes in family structure and the increasing age of first-time homebuyers. However, the findings indicate that the prevalence of coresidence has not increased with time.
On the other hand, Iacovou, (2010) [11] analyses the factors that influence young people’s decision to leave their parents’ home and how they vary between European countries. It finds that economic factors such as affordable housing and job opportunities are important, but parental preferences also play a role. They show that young people in all countries prefer independence, and that parental income is associated with a lower probability of leaving home for partnerships when children are ‘too young’ and a higher probability at older ages. However, the age at which parental income becomes associated with a higher probability of leaving home for partnerships varies greatly between northern and southern European countries, suggesting that family ties are stronger in the South [10]. The study also finds a disjuncture between parents and their children’s preferences for independence, particularly in southern Europe.
b) Push factors (move away-move back)
(Blumenberg et al., 2016) [21] examines the factors that influenced the mobility of young people and adults in the United States from 1990 to 2009 and finds that factors such as education, employment, and family structure significantly impact mobility. Specifically, they find that education has become increasingly important for young people and adults in terms of mobility and suggest that this may be due to the increasing importance of knowledge-based industries in the economy, which require a highly educated workforce. Employment is also a significant factor in mobility, particularly for adults, because job opportunities are often a major reason people move. Finally, the family structure has changed and significantly affected mobility. Specifically, single-parent households are less likely to move than two-parent households, possibly due to the financial and social support provided by having two parents.
Many young adults are also moving home to their parents. Research suggests many reasons young adults return home after moving out from their parents, including economic difficulties, job loss, relationship breakdowns, and educational pursuits [22]. They show that young adults often return to their families, who financially support them while away, especially when the parent’s income is lower.
More recent research shows that divorce is associated with an increased probability of coresidence, particularly for men, those with low educational levels, and those who live close to their parents [23] (Albertini et al., 2018). However, using data on individuals in Sweden, they find that economic factors do not solely drive the decision to move back with parents, but are also influenced by the strength of family ties and a sense of intergenerational solidarity. (Albertini et al., 2018) [23] suggests that intergenerational coresidence can be seen as a manifestation of latent family solidarity, where adult children seek support from their parents during times of hardship, including divorce.
c) Research gap
Based on the findings by (Aquilino, 1990; Messineo and Wojtkiewicz, 2004) [16,20], more research could be performed to understand the underlying reasons for coresidence patterns, such as examining the impact of economic factors and cultural norms. Furthermore, future research could investigate whether observed trends in coresidence are consistent between different demographic groups and geographic regions and how they may be affected by changes in societal norms and values over time.
Many of the previously published articles use disaggregated data and analyse individual-specific characteristics that make a young adult choose to stay or move. Few studies relate the percentage of young adults living at home with more aggregated regional data within a country that allows analysis of the importance of available dwellings in the housing market.
3. Methods
This section presents the data used to test the hypotheses, the included variables, and the analytical approach.
a) Data Source and Sample
Our secondary data are available at Statistics Sweden (SCB). The data are aggregated at the municipality level, and we analyse the period 1998-2020. Variables of primary interest are the proportion of adults living at home in the population as a percentage of the total population by region.
b) Variables and Measurements
What can explain the variation in the proportion of young adults living at home over time and between regions? The literature review emphasises, above all, socioeconomic factors as important for the decision to stay or to move away from home, and only a few studies have explicitly analysed what the housing market looks like, that is, whether it is possible for young adults to find housing or are the thresholds too great to take the first step in the housing career. Therefore, we will focus more on the variables of the local housing market. We will include variables that describe the socioeconomic situation and show demographic and cultural differences.
Housing market condition. The housing market will be characterised by housing prices (HP), the number of houses (HS), and the proportion of rental apartments (HR) in the municipality. Higher house prices and fewer dwellings are expected to have a negative impact on the proportion of households with young adults living at home. On the other hand, larger rental apartment markets are expected to decrease the proportion of young adults living at home. For example, (Filandri and Bertolini, 2016) [10] emphasise that the influence of housing systems, labour markets, welfare states, and the social classes of individual origin is different in each country. The welfare state is equal within a country, but the housing and labour market have a regional variation that can explain the regional differences of the proportion of young adults living at home.
Economic and educational differences. We will include income (I), taxes and transfers (TR), education level (HC), and employment status (E) as a proxy for socioeconomic factors that impact on the proportion of young adults living at home. Young adults are less likely to leave their parents’ homes if the unemployment rate increases (Garasky, 2002) [24]. Young adults with a higher income will move away from home to a greater extent than those with a lower income and are less likely to return to the parental home (Ermisch, 1999) [25].
As one of the education variables (HC1), we used the proportion of people eligible for an upper secondary school in the population, measured as a percentage by municipality and year. The second variable (HC2) is the proportion of people eligible for higher education at the university level in the population, measured as a percentage by municipality and year.
A higher income level in the municipality and lower income taxes are expected to have an inverse impact on the proportion together with educational level, while unemployment is expected to increase the proportion of young adults living at home. The rationale behind the fact that the level of education can affect whether young adults live at home is that it can impact long-term income. Increased financial stability increases the possibility of moving away from home. If you can study at university, it also increases the likelihood that you will move in connection with your higher studies.
In Sweden, there are 16 universities spread across many municipalities. In addition, there are 12 colleges. More young people will be in these locations and the demand for smaller apartments will increase. If the supply does not respond by, for example, more student housing, many young adults will be forced to stay at their parents’ homes. We have included a variable (UNIV) that indicates the municipality’s number of students in higher education.
Demographic differences. We also include the proportion of men who live in the municipality (M) and the average age (A). More men are expected to increase the proportion of households with young adults living at home, while older people are expected to decrease the proportion.
Cultural differences. (Grundy, 2000) [26] stresses both economic and cultural factors as necessary preconditions of adult child/elderly parent coresidence. However, measuring cultural differences between regions can be complex and challenging, as culture is a multidimensional concept that encompasses many factors, such as beliefs, values, customs, language, and traditions. The proportion of people born abroad could be used as a variable to measure cultural differences between municipalities within the same country. The proportion of people born abroad can reflect the diversity of cultural backgrounds within a municipality, which can indicate different cultural practices, values, and norms [27]. Therefore, we include the proportion of immigrants born abroad (FB).
Research shows that voting participation and social capital influence each other to the extent that increased social capital increases the propensity to vote, but voting also affects social capital [28] (Krishna, 2002). We have included three measures of participation in voting at the EU (VoteEU), national (VoteSwe), and local municipal levels (VoteMuni).
Location differences: We also included the degree of urbanisation (URB) and the population density (DEN) in the model. (Garasky, 2002) [24] shows a difference in young adults’ propensity to move depending on whether they live in an urban area or in the countryside. Furthermore, (Blumenberg et al., 2019) [26] show that young adults are more likely to live in urban neighbourhoods than older adults. The coordinates (XC and YC) are also included in the model to mitigate some of the spatial dependence on the data.
c) Analytic approach
In the empirical analysis, we will relate the proportion of young adults living at home in many municipalities and regions over time. Many municipalities depend on, for example, the housing situation and the labour market in neighbouring municipalities. There is a considerable commute between municipalities, which means there is spatial dependence between the municipalities. To consider this, we have estimated a spatial autoregressive model for panel data. As we have many independent variables, we have analysed these with principal component analysis (PCA) within each category of variables because PCA can help identify the most significant dimensions (principal components) that capture the most variance in the data. This can lead to simpler models and improved computational efficiency.
Principal Component Analysis: Our study uses various variables, including housing prices, housing stock, income, and employment status, which exhibit strong mutual correlations. This creates a challenge in isolating the individual impact of each variable. To navigate this, we employ factor analysis, a statistical approach that uncovers underlying structures among observable variables. This technique entails scrutinising correlations between variables to generate new composite variables called factors. These factors then take the place of the original variables in our analysis.
This method unveils the latent framework of variables based primarily on their interrelations [29]. Variables that strongly load on a factor are intrinsically associated with that factor. Conversely, the correlation between factors generally tends towards zero. Principal component analysis can be performed using exploratory factor analysis (EFA) and confirmatory factor analysis (CFA). The former takes an exploratory stance with the aim of unveiling the underlying factors and their arrangements. On the other hand, the latter adopts a confirmatory position, evaluating whether a postulated factor arrangement fits the data.
In our study, we opt for EFA due to our primary objective of reducing the variable count and generating novel factors. By analysing intervariable correlations, we reveal the underlying relationship structure. This, in turn, allows us to categorise variables into factors based on their shared correlations. This process involves assessing the variance of each variable and how much is shared with others. The variance of a variable can be partitioned into three parts: shared variance, unique variance, and unexplained variance.
Our analysis can be conducted on the total variance (factor analysis) or the shared variance (principal component analysis) among variables. The latter approach is appropriate to reduce the variable count, especially when the unique variance is relatively minor compared to the total variance.
We begin by creating the first factor, a linear combination of variables that captures a substantial portion of the overall variance. Subsequent factors are then formed by linearly combining variables to account for as much remaining variance as possible. This sequence continues until the number of factors aligns with the number of variables. The decision about the number of factors to retain is based on a criterion based on the explanation of variance. Factors with eigenvalues exceeding one are significant, whereas those below one are considered less significant. These significant factors will serve as attributes in our equation of living with your parents.
Spatial autoregressive panel data models: We will analyse and test the hypotheses with a spatial autoregressive panel data model. A spatial autoregressive panel data model is a statistical technique for analysing spatially dependent data over time [30,31,32,33,34,35]. This model is used to examine how behaviour in one municipality is affected by the behaviour of its neighbouring municipalities. The advantage of using a spatially autoregressive panel data model is that it accounts for spatial relationships between municipalities, leading to more accurate and robust estimates [33]. In addition, it allows for the identification of spatial spillover effects that may not be apparent in other types of panel data model. However, this approach also has some limitations. For example, the model assumes that the spatial relationships between municipalities are invariant over time, which may not be valid. It also requires a relatively large sample size and can be computationally intensive, which may limit its practical application in certain situations.
Our dependent variable (Y) is the proportion of households with young adults living at home, which will be related to the independent variables in the municipality where they live. However, if spatially lagged, independent variables will also be tested to see whether they affect the proportion of young adults living at home in neighbouring municipalities. Moreover, the housing market in one municipality may affect how the dependent variable in neighbouring municipalities is affected. Therefore, we included a spatially lagged dependent variable and a spatially lagged error term in the model [33]. The model will also include fixed or random effects [36]. In general, the model we estimate will have the following form:
Here, Y is the dependent variable, X is a vector of independent variables, and W is the spatial weight matrix. The spatial weight matrix is a row-standardised weight matrix based on contiguity between municipalities. The parameter a represents the fixed or random effect that varies across space (j) and over time (t). The parameter r equals the dependent variable with impact of the spatial lagged dependent variable, g equals the impact of the spatial lagged independent variables, and l represents the impact of spatial lagged errors. The fixed effect model will be estimated using the maximum likelihood approach [35], and the random effect model will use a generalised spatial two-step least squares approach [38].
4. Results
The following section presents the results of the regression analysis, including the coefficients of each variable and the significance levels of each variable. We will also interpret the results in light of the research question and objectives and explain what the results suggest about the factors associated with the proportion of adult children living at home. We will divide the section into descriptive statistics, factor analysis, and the spatial autoregressive panel data model.
a) Descriptive statistics
Table 1 presents the variables included in the survey, as well as descriptive statistics.
The panel consists of 6960 observations. The proportion of households living in rented accommodation is, on average, across all municipalities and years, just over 22%. However, the variation is significant, with a standard deviation of 8%, but the range goes from barely 3% to as much as 80%. If, instead, we measure the number of rental units and the total housing stock, we can observe that the variation is significant between municipalities, as the population size varies widely. The proportion of rental properties in the total housing stock is approximately 27% on average but varies from a low of 2.22% to 83.61%. The extent of a rental housing market in the municipality is expected to have a negative impact on the proportion of young adults who live at home. The greater the rental housing market, the greater the opportunity to leave home. We can also note that the share of rental properties in a municipality increases with the size of the rental market and the housing market; that is, the housing markets in metropolitan municipalities have not only a larger rental housing market in number but also more extensive measured as a share of the total housing market.
To measure how affordable the housing market is, we have also analysed average housing prices for single-family homes in the municipality. Although it is a segment that may not appeal to young adults, it is a good approximation of housing prices in general. The average purchase price is SEK 1.47 million, but the standard deviation is high, around SEK 1.33 million. Housing prices are highly correlated with the size of the housing market; larger housing markets and population agglomerations are associated with higher prices. Housing prices are also highly correlated with income level; the higher the average income in the municipality, the higher the housing prices.
Finally, we have included the number of apartment buildings in the municipality for all years to characterise the local housing market. Fewer new housing is expected to make it more difficult for young adults to enter the market. Although new construction may not directly target this group, cheaper housing may be available through the filtering process. The number of newly built homes is only 70 on average, but the standard deviation is as high as 291 multi-family homes. Many municipalities show zero construction of apartment buildings in the municipality in certain years. More construction is positively correlated with the size of the housing market, where more people live in rental properties and higher housing prices.
The average income amounts to 5.15 base amount (which corresponds to 48 300 SEK in 2022) with a standard deviation of just over 1 (the range is from 3.2 to 20.2). The average income measured in SEK is around 230,000. We can note that the average income is highly correlated with the unemployment rate, the number eligible for higher studies, and the age group 20-64 for all born in Sweden. As expected, all correlations are negative. We can also observe that income is lower in municipalities where the rental market is more dominant than the owner-occupied market.
The spatial and temporal variation in unemployment is also significant. On average, unemployment has been 13% in all municipalities and years, with a standard deviation of just under 4%. Long-term unemployment has averaged 1.3%, but the variation is significant, with a standard deviation of about half of the average. At its lowest, it has been 0.1% in a municipality during a given year, and at its highest, 5.1%. Unemployment is expected to increase the proportion of young adults living at home with their parents.
The percentage of people eligible for an upper secondary school in the population is, on average, high (approximately 88%), where the variation between municipalities and years has a standard deviation of 5%. However, some municipalities show a low percentage of just over 50%. The percentage of those who have passed upper secondary school eligible for higher studies at university is somewhat lower, just under 80%. However, the variation between municipalities is significantly higher, with a standard deviation of 13%. The correlation between edu1 and edu2 is 0.43 (statistically significant at the level of significance of 99%). The correlation between education variables and income is lower but positive (0.13), while that between education variables and unemployment is higher (0.23-0.33).
Regarding the age structure, we can observe significant differences between those born in Sweden and those with a foreign background. The proportion in the age group 20-64 of those born in Sweden is just under 54%, while the figure in the group with a foreign background is 63%.
The main variable of interest is the proportion of young adults living at home. The average proportion is around 40%, but there is some variation between municipalities and over time. Figure 1 shows the distribution among municipalities and over time.
Note. The figure on the left (a) describes the distribution between municipalities (all years). It is a so-called Violin plot [44] (Hintze and Nelson, 1998) where we, in the middle, have a box plot [45] (Tukey, 1977) with median, 25th, and 75th percentile and outliers. The contour around the box plot shows the cumulative distribution. The plot on the right (b) shows the box plots per year from 1998 to 2021.
Research by (Maroto and Severson, 2020) [38] suggests that the proportion of young adults living at home has increased in Canada since 2001. We cannot support these findings in Sweden. The distribution between municipalities regarding the proportion of households with young adults at home is relatively stable, as also (Messineo and Wojtkiewicz, 2004) [20] found for the US. The median value is approximately 40%. Half of the municipalities are in the 35-45% range, but some have significantly higher or lower values. Over time, the proportion has been roughly the same for the past 25 years. At the end of the 1990s, households with young adults in the home represented only 40%. The proportion rose to just over 40% during the 2010s and fell again. The variation between municipalities has also been relatively constant over the years. One difference that can be observed is that the number of outliers (1.5 standard deviations higher than or lower than the median) on the downside was greater in the late 1990s. Since the beginning of the twentieth century, these outliers have disappeared. The number of upside outliers has remained unchanged over the years. The conclusion that can be drawn is that the housing market is not that problematic for young adults, at least not measured, as the proportion of households with young adults in the household does not vary as dramatically as is perhaps claimed in the political debate. The second conclusion is that in most municipalities, roughly the same proportion of young adults live at home, but some municipalities have problems where it is difficult for young adults to enter the housing market. As a consequence of this, housing policy could be specific rather than general.
The spatial dependence between municipalities can be illustrated using maps (Figure 2) or, more formally, Moran’s I test for each variable, presented in Table 1. Moran’s I statistics based on the contiguity spatial weight matrix show that almost all variables have spatial dependence. Visually, we can observe that more young adults live with their parents in the metropolitan regions of Stockholm, Göteborg, and Malmö as a proportion of all young adults (darker blue colour). However, we can also see that many young adults in more sparsely populated areas live with their parents in northern Sweden.
b) Principal Component Analysis
The housing market, socioeconomic and demographic factors, and cultural differences can explain the proportion of households with young adults at home. In the explanatory model, we have several variables that can individually explain the variation in the proportion between municipalities. However, the problem is that many of these variables correlate and partially measure the same thing. Therefore, we have used principal component analysis to reduce the number of independent variables and it was done separately within each category.
These analyses show that the variables are reduced to two or three variables depending on the category (see Figure 3, which shows the scree plot for each category).
Note. The screeplot was introduced by [46] (Cattell, 1966) and relates the eigenvalue for each component from the principal component analysis. Here, we use the cutoff value of one to decide the number of components to be used in the later spatial autoregressive panel data models. The first five show the eigenvalues sorted from the largest to the lowest from the principal component analysis from each category (Housing Market, Socio-economic, Demographic, Culture and Location), and the last figure shows the eigenvalues from a principal component analysis of all variables. We have used the command pca and screeplot in Stata.
The result of the principal component analysis within each category of variables shows that 2-3 components explain enough of the total variation between the included variables in the category. Within the Housing Market category, we use six original variables regarding the local housing market. The PCA analysis shows that two components explain enough of the variation. Based on the scoring coefficient, the following variables have a coefficient exceeding the absolute value of 0.3 for component 1: housing stock, rental housing stock, share of rental housing and construction of apartments in multifamily houses. Component 2 consists of the following loaded variables: rental housing stock, share of rental housing, housing prices, and housing construction with a negative load on the component. We call the components (1) housing stock and (2) Rental housing stock.
Within the socioeconomic category, the result is that the nine included variables can be summarised into three components. The first component comprises unemployment and health problems (positive loading), while income is negatively loaded. The second component includes unemployment, long-term unemployment and income taxes, while the eligibility variables regarding education are loaded negatively. Finally, the third consists of long-term unemployment and the number of students in universities and colleges, while the income tax is loaded negatively. Surprisingly, neither income nor the percentage of people qualified for different levels of higher education are included in any component. We have named components (1) unemployment and health, (2) Income tax, and (3) long-term unemployment based on the variable with the highest score in each component.
The PCAs concerning the demographic category result in two components. The first refers to the proportion of young people, migration to the municipality, and population size (name Young people). The second component can be described as the population size, migration and average age of the municipality (name Population and migration). The two components are similar, with the difference being that in the first it is the proportion of young adults in the municipality instead of age as in the second component. The proportion of men in the municipality is not included in any of the components.
In the category of cultural differences, the first component refers to the percentage of people who have voted in various elections (name Voting participation), and the second component includes only the percentage of young adults with a foreign background (name Young people born abroad). In the Location category, the first component refers to the coordinates (name Coordinates), and the second refers to the degree of urbanisation and population density (name Urbanisation and density).
c) Spatial autoregressive panel data model
The model we will estimate is a spatial autoregressive model with a spatially lagged dependent variable with fixed and random effects and a spatial weight matrix defined based on contiguity. The results are presented in Table 2. All models include all the components of the principal factor analysis.
The models presented in Table 2 are spatial autoregressive models in which the spatial lagged dependency and the error variable are included. The model in column 1 is a random-effects model, and in column a fixed-effects model. We note that the parameter estimates regarding the spatial variables are statistically significant but have reversed signs depending on whether it is a random- or fixed-effects model. We have tested the specification with the Hausman test and found that the fixed-effects model is preferable. We can also note that the AIC is smaller, favouring the fixed-effects model.
The result shows that the variables in the housing market statistically impact the proportion of young adults living at home. Similar results can be found, for example, recent studies by [40,41]. The parameter estimates for both components are negative, which means that the size of the housing stock, the proportion of rental properties, and the proportion of people living in them negatively impact the proportion of people living at home. An interpretation could be that if the housing stock increases and the proportion of people living in rental properties increases, it is easier for young adults to move away from home, and thus enter the housing market. It should be noted that housing prices are not included, which could be interpreted as housing affordability in the ownership market is less important. At the same time, the availability of apartments, and above all rental apartments, is more important for young adults to be able to enter the housing market.
Regarding demographic factors, only component one (young adults) has statistically significant parameter estimates. The parameter is negative, which means that the more young adults live in the municipality, the larger the population of the municipality, and the higher the immigration of the municipality, the fewer young adults live at the parental home. The results are in accordance with, for example(Blumenberg et al., 2016) [21]. The effect is not expected, but can be interpreted as immigration regions with a more significant proportion of young adults who have moved from their home municipality and their parents’ home.
Regarding the socio-economic component, we can note that the parameter estimates are positive for component one (Unemployment). This means that if unemployment and health problems increase in the municipality, the proportion of young adults living at home increases. Unemployment and health problems are closely connected [41], and previous studies indicate a connection between job literacy and health problems and the housing market [42]. If long-term unemployment increases and the municipality is a university town, component three shows that the proportion of young adults living at home increases. Component two, which also measures long-term unemployment and income taxes in the municipality, has a negative parameter estimate, which means that as component two increases, the proportion of young adults living at home decreases. The interpretation here goes against the expected effect. However, we can state that the parameter estimate is significantly smaller than for components one and three. An interpretation is that higher taxes partially counteract the effect of long-term unemployment.
Cultural differences between municipalities, measured as the percentage of voters in elections and the percentage of young adults with a foreign background, also impact the percentage of young adults who live at home. The more people who vote in various elections (EU, national and municipality) have a positive impact, which means that more young adults live at home. Perhaps somewhat unexpected, but the result is relatively strong, as the parameter estimate is statistically different from zero. On the other hand, social capital affects health, unemployment and income [43,44], making interpretation complex. Our results indicate that social capital can also impact the choice to move away from home.
The proportion of young adults with a foreign background also positively impacts the proportion of young adults who live at home. It is difficult to discern whether this is a cultural difference or due to something else, but the model controls for factors such as unemployment, income, and eligibility for higher studies. Finally, we can state that the degree of urbanisation and population density have a negative impact on the proportion of young adults living at home. In the big cities, fewer people live at home as more young people have moved to the region. However, the impact of urbanisation rate and density is not statistically significant in the fixed effect model.
Using maps (see Figure 4) of statistically significant components, we can illustrate which factors are essential to explain the proportion of young adults living at home. In the following, we present four maps regarding the components: Rental housing stock, unemployment and health, Income tax, and urbanisation and density.
The interpretation of the maps is as follows: the redder the region, the rental housing stock is more dominant, which indicates that this component is less important in explaining why young adults live at home in those regions. Light-red municipalities indicate that it is more important to analyse the availability of rental housing. Dark blue means that unemployment and health problems in the region make many young adults live at home. The lighter the blue colour, the fewer labour market-related problems that keep young adults living at home. Dark green indicates a lower percentage of young adults living at home. The component symbolises income tax, but also includes many other socio-economic variables. The greyscale map refers to the effect of urbanisation and fault coning density. The darker the grey, the higher the degree of urbanisation and density and the lower the proportion of young adults living at home.
By analysing regional differences over time regarding the proportion of young adults living in parental homes, we can identify several underlying factors that explain the variation in time and space. Lack of rental housing, high unemployment, high degree of urbanisation, intra-regional migration, and social capital explain why more young adults stay home. We analyse aggregated data, which can provide large patterns, but at the same time it places limitations on interpreting the impact of individual factors. Furthermore, there is a multicollinearity problem, as many variables measure approximately the same thing, that is, we have a high correlation between individual variables. We have tried to remedy this with principal component analysis, but differentiating between different effects makes that more difficult. Many regions are connected to a larger labour market, meaning that many people live in one municipality but work in another. Problems in the housing market in a municipality will undoubtedly also affect the housing market of surrounding municipalities. However, through our approach to estimating spatial autoregressive models, the problem of spatial dependence has been minimised. Finally, there may be endogeneity problems, making interpreting causality difficult. However, we assess that the endogeneity problem is relatively limited.
5. Conclusion
The purpose is to analyse the proportion of young adults living at home over time, as well as regional variations within a country. The case study focusses on Sweden, a country with relatively few young adults living at home, but where the proportion has varied over time and significant differences exist between different municipalities.
Descriptively, we can note that the proportion of young adults living at home has been relatively constant over the years, with low temporal variation, but the variation between regions can be significant. The proportion of young adults living at home is high, especially in metropolitan regions and sparsely populated areas of northern Sweden. The above means that (1) the problem has not grown over the years; it is not worse now compared to before, and (2) general measures for Sweden are unnecessary; more specific measures for the metropolitan regions are probably more accurate. The housing situation in sparsely populated areas should be handled separately and may not be solved cost-effectively with general measures.
We examine various factors that influence the living arrangements of young adults. We employ spatial autoregressive models, differentiating between random-effects and fixed-effects models. In particular, the findings reveal that variables in the housing market have a significant impact on young adults. Factors such as the size of the housing stock, the proportion of rental properties, and the number of people living in rental properties all play a role in influencing whether young adults live with their parents. Mackie (2016) [45] draws a similar conclusion about the future challenges we have as a society. His conclusion is that the "private rented sector and further provision of shared housing" are the key to improving access and the possibility of good and affordable housing for young adults. Surprisingly, our empirical results show that housing prices are not explicitly included, suggesting that housing affordability in the ownership market may not be as important as the availability of apartments.
In addition, we explore socioeconomic and demographic factors. Higher unemployment, health problems in a municipality, and specific factors such as increased long-term unemployment and income taxes influence the likelihood that young adults reside with their parents. The fact that unemployment is an important factor is also confirmed by (García-Andrés et al., 2021) [17], although their results indicate that it only applies to men. Interestingly, some unexpected trends emerge, such as the counterintuitive impact of higher taxes on this living arrangement. Demographic factors also play a role, with population size, immigration, and cultural differences that affect young adults’ living situations.
In summary, our research uncovers a complex interplay of factors that shape young adults’ living choices, highlighting the importance of the dynamics of the housing market, socioeconomic variables, and demographic and cultural considerations in this context. In some regions, it is, above all, labour market measures that need to be implemented to increase the opportunity for young adults to move away from home, while in other regions, it is measures on the housing market that need attention, such as a better match on the housing market or the construction of more rental housing.
| 1 | The numerator consists of individuals aged 21-24 who are registered at the same property as at least one parent. The denominator consists of the population aged 21-24. |
References
- Grander, M. 2023. The inbetweeners of the housing markets – young adults facing housing inequality in Malmö, Sweden, Housing Studies, vol. 38, no. 3, 505–22. [CrossRef]
- Hoolachan, J., McKee, K., Moore, T., and Soaita, A. M. 2017. ‘Generation rent’ and the ability to ‘settle down’: economic and geographical variation in young people’s housing transitions, Journal of Youth Studies, vol. 20, no. 1, 63–78. [CrossRef]
- Billari, F. C. and Liefbroer, A. C. 2010. Towards a new pattern of transition to adulthood?, Advances in Life Course Research, vol. 15, no. 2, 59–75. [CrossRef]
- Sompolska-Rzechuła, A. and Kurdyś-Kujawska, A. 2022. Generation of Young Adults Living with Their Parents in European Union Countries, Sustainability, vol. 14, no. 7, 4272. [CrossRef]
- Mulder, C. H. 2003. The Housing Consequences of Living Arrangement Choices in Young Adulthood, Housing Studies, vol. 18, no. 5, 703–19. [CrossRef]
- Enström Öst, C. and Wilhelmsson, M. 2019. The long-term consequences of youth housing for childbearing and higher education, Journal of Policy Modeling, vol. 41, no. 5, 845–58. [CrossRef]
- Engelhardt, G. V. 1994. House Prices and the Decision to Save for Down Payments, Journal of Urban Economics, vol. 36, no. 2, 209–37. [CrossRef]
- Yates, J. 2016. Why Does Australia Have an Affordable Housing Problem and What Can Be Done About It?, Australian Economic Review, vol. 49, no. 3, 328–39. [CrossRef]
- Young, C. 1996. Are young people leaving home earlier or later?, Journal of the Australian Population Association, vol. 13, no. 2, 125–52. [CrossRef]
- Filandri, M. and Bertolini, S. 2016. Young people and home ownership in Europe, International Journal of Housing Policy, vol. 16, no. 2, 144–64. [CrossRef]
- Iacovou, M. 2010. Leaving home: Independence, togetherness and income, Advances in Life Course Research, vol. 15, no. 4, 147–60. [CrossRef]
- Åsberg, P. 1999. Housing Decisions of Young Swedish Adults, Journal of Housing Economics, vol. 8, no. 2, 116–43. [CrossRef]
- Honjo, K., Tani, Y., Saito, M., Sasaki, Y., Kondo, K., Kawachi, I., and Kondo, N. 2018. Living Alone or With Others and Depressive Symptoms, and Effect Modification by Residential Social Cohesion Among Older Adults in Japan: The JAGES Longitudinal Study, Journal of Epidemiology, vol. 28, no. 7, 315–22. [CrossRef]
- Arnett, J. J. 2014. Emerging Adulthood: The Winding Road from the Late Teens Through the Twenties, Oxford University Press.
- Goldscheider, F. and Goldscheider, C. 1999. The Changing Transition to Adulthood: Leaving and Returning Home, Thousand Oaks, California, SAGE Publications, Inc.
- Aquilino, W. S. 1990. The Likelihood of Parent-Adult Child Coresidence: Effects of Family Structure and Parental Characteristics, Journal of Marriage and Family, vol. 52, no. 2, 405–19. [CrossRef]
- García-Andrés, A., Martinez, J. N., and Aguayo-Téllez, E. 2021. Leaving the Nest or Living with Parents: Evidence from Mexico’s Young Adult Population, Review of Economics of the Household, vol. 19, no. 3, 913–33. [CrossRef]
- Goldscheider, F. K. and Lawton, L. 1998. Family Experiences and the Erosion of Support for Intergenerational Coresidence, Journal of Marriage and Family, vol. 60, no. 3, 623–32. [CrossRef]
- Choi, N. G. 2003. Coresidence between Unmarried Aging Parents and their Adult Children: Who Moved in with Whom and Why?, Research on Aging, vol. 25, no. 4, 384–404. [CrossRef]
- Messineo, M. J. and Wojtkiewicz, R. A. 2004. Coresidence of Adult Children with Parents from 1960 to 1990: is the Propensity to Live at Home Really Increasing?, Journal of Family History, vol. 29, no. 1, 71–83. [CrossRef]
- Blumenberg, E., Ralph, K., Smart, M., and Taylor, B. D. 2016. Who knows about kids these days? Analyzing the determinants of youth and adult mobility in the U.S. between 1990 and 2009, Transportation Research Part A: Policy and Practice, vol. 93, 39–54. [CrossRef]
- Da Vanzo, J. and Goldscheider, F. K. 1990. Coming Home Again: Returns to the Parental Home of Young Adults, Population Studies, vol. 44, no. 2, 241–55. [CrossRef]
- Albertini, M., Gähler, M., and Härkönen, J. 2018. Moving back to “mamma”? Divorce, intergenerational coresidence, and latent family solidarity in Sweden, Population, Space and Place, vol. 24, no. 6, e2142. [CrossRef]
- Garasky, S. 2002. Where are they going? A comparison of urban and rural youths’ locational choices after leaving the parental home, Social Science Research, vol. 31, no. 3, 409–31. [CrossRef]
- Ermisch, J. 1999. Prices, Parents, and Young People’s Household Formation, Journal of Urban Economics, vol. 45, no. 1, 47–71. [CrossRef]
- Blumenberg, E., Brown, A., Ralph, K., Taylor, B. D., and Turley Voulgaris, C. 2019. A resurgence in urban living? Trends in residential location patterns of young and older adults since 2000, Urban Geography, vol. 40, no. 9, 1375–97. [CrossRef]
- Britton, M. L. 2013. Race/Ethnicity, Attitudes, and Living With Parents During Young Adulthood, Journal of Marriage and Family, vol. 75, no. 4, 995–1013. [CrossRef]
- Krishna, A. 2002. Enhancing Political Participation in Democracies: What is the Role of Social Capital?, Comparative Political Studies, vol. 35, no. 4, 437–60. [CrossRef]
- Hair, J. F., Black, W. C., Babin, B. J., Anderson, R. E., and Tatham, R. L. 2006. Multivariate data analysis 6th Edition, Pearson Prentice Hall. New Jersey. humans: Critique and reformulation. Journal of Abnormal Psychology, vol. 87, 49–74.
- Arbia, G., Espa, G., and Giuliani, D. 2021. Spatial Microeconometrics, Routledge. [CrossRef]
- Belotti, F., Hughes, G., and Mortari, A. P. 2017. Spatial Panel-data Models Using Stata, The Stata Journal, vol. 17, no. 1, 139–80. [CrossRef]
- Elhorst, J. P. 2010. Applied Spatial Econometrics: Raising the Bar, Spatial Economic Analysis, vol. 5, no. 1, 9–28. [CrossRef]
- Kapoor, M., Kelejian, H. H., and Prucha, I. R. 2007. Panel data models with spatially correlated error components, Journal of Econometrics, vol. 140, no. 1, 97–130. [CrossRef]
- Lee, L. and Yu, J. 2010. Estimation of spatial autoregressive panel data models with fixed effects, Journal of Econometrics, vol. 154, no. 2, 165–85. [CrossRef]
- Wilhelmsson, M. 2002. Spatial Models in Real Estate Economics, Housing, Theory and Society, vol. 19, no. 2, 92–101. [CrossRef]
- Wang, D., Zhou, T., Lan, F., and Wang, M. 2021. ICT and socio-economic development: Evidence from a spatial panel data analysis in China, Telecommunications Policy, vol. 45, no. 7, 102173. [CrossRef]
- Kelejian, H. H. and Prucha, I. R. 1998. A Generalized Spatial Two-Stage Least Squares Procedure for Estimating a Spatial Autoregressive Model with Autoregressive Disturbances, The Journal of Real Estate Finance and Economics, vol. 17, no. 1, 99–121. [CrossRef]
- Maroto, M. and Severson, M. 2020. Owning, renting, or living with parents? Changing housing situations among Canadian young adults, 2001 to 2011, Housing Studies, vol. 35, no. 4, 679–702. [CrossRef]
- Arundel, R. and Ronald, R. 2016. Parental co-residence, shared living and emerging adulthood in Europe: semi-dependent housing across welfare regime and housing system contexts, Journal of Youth Studies, vol. 19, no. 7, 885–905. [CrossRef]
- Dewilde, C. and Flynn, L. B. 2021. Post-crisis developments in young adults’ housing wealth, Journal of European Social Policy, vol. 31, no. 5, 580–96. [CrossRef]
- Hammarstrom, A. 2002. Early unemployment can contribute to adult health problems: results from a longitudinal study of school leavers, Journal of Epidemiology & Community Health, vol. 56, no. 8, 624–30. [CrossRef]
- Laamanen, J.-P. 2017. Home-ownership and the Labour Market: Evidence from Rental Housing Market Deregulation, Labour Economics, vol. 48, 157–67. [CrossRef]
- Groot, W., van den Brink, H. M., and van Praag, B. 2007. The Compensating Income Variation of Social Capital, Social Indicators Research, vol. 82, no. 2, 189–207. [CrossRef]
- Liu, G. G., Xue, X., Yu, C., and Wang, Y. 2016. How does social capital matter to the health status of older adults? Evidence from the China Health and Retirement Longitudinal Survey, Economics & Human Biology, vol. 22, 177–89. [CrossRef]
- Mackie, P. K. 2016. Young people and housing: identifying the key issues, International Journal of Housing Policy, vol. 16, no. 2, 137–43. [CrossRef]
- Hintze, J. L. and Nelson, R. D. 1998. Violin Plots: A Box Plot-Density Trace Synergism, The American Statistician, vol. 52, no. 2, 181–84. [CrossRef]
- Tukey, J. 1977. Exploratory data analysis, Reading, MA: Addison-Wesley.
- Cattell, R. B. 1966. The Scree Test For The Number Of Factors, Multivariate Behavioral Research, vol. 1, no. 2, 245–76. [CrossRef]
Figure 1.
Young adults living at home are distributed across municipalities and over time.
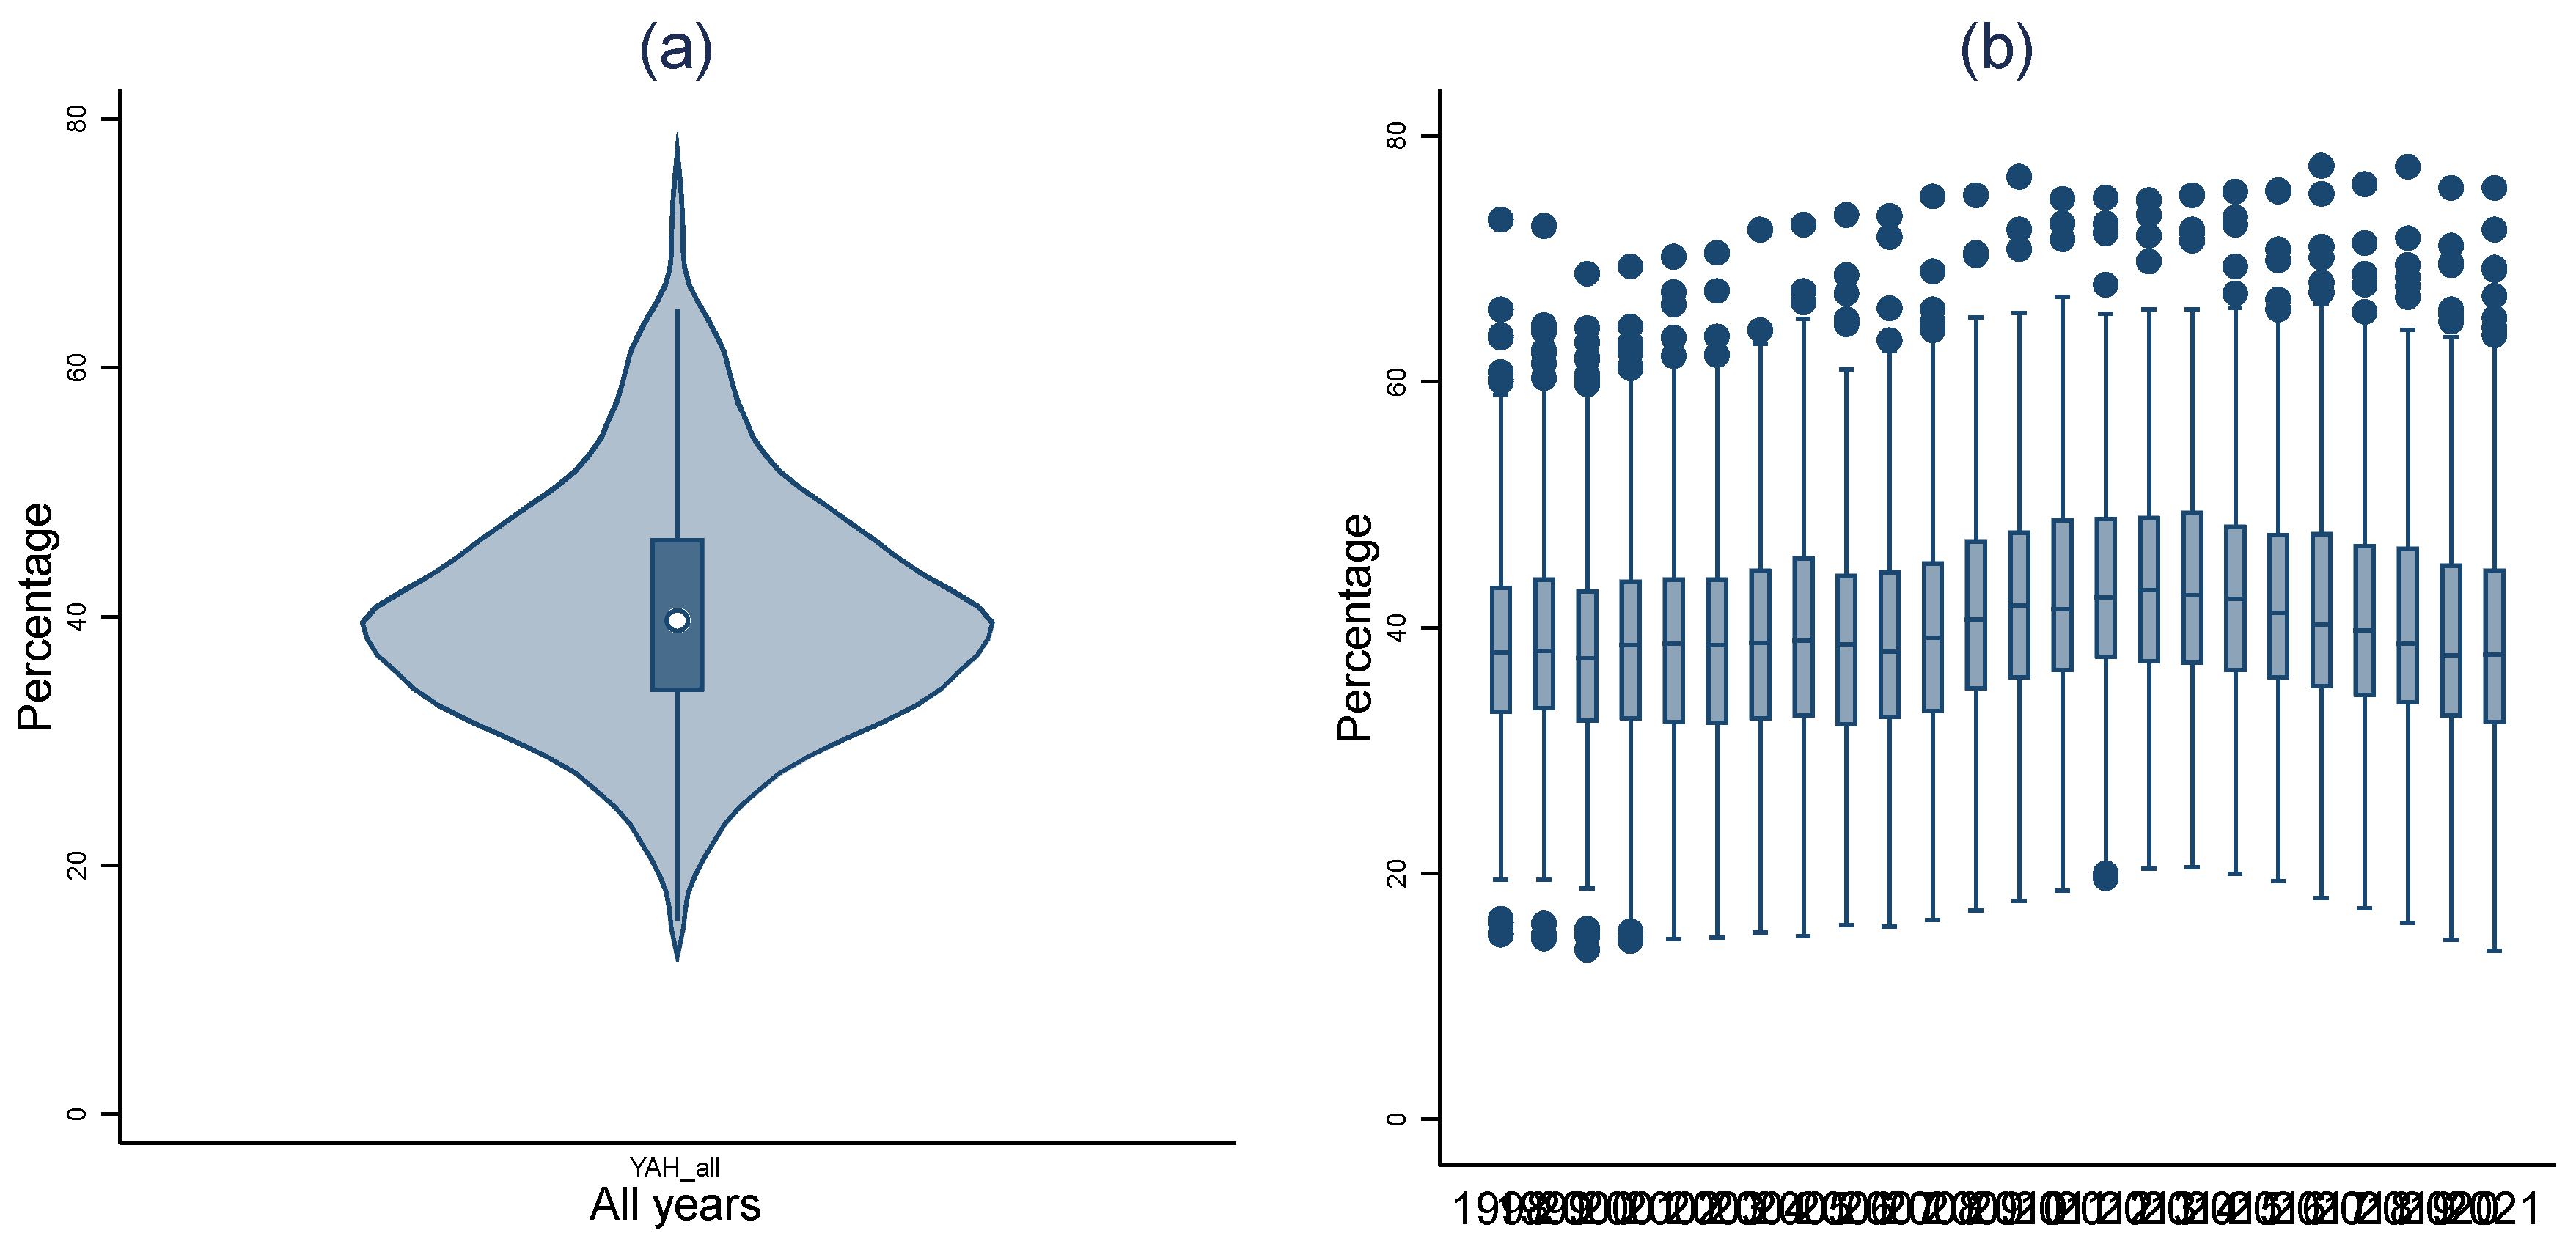
Figure 2.
Spatial distribution of young adults living at home.
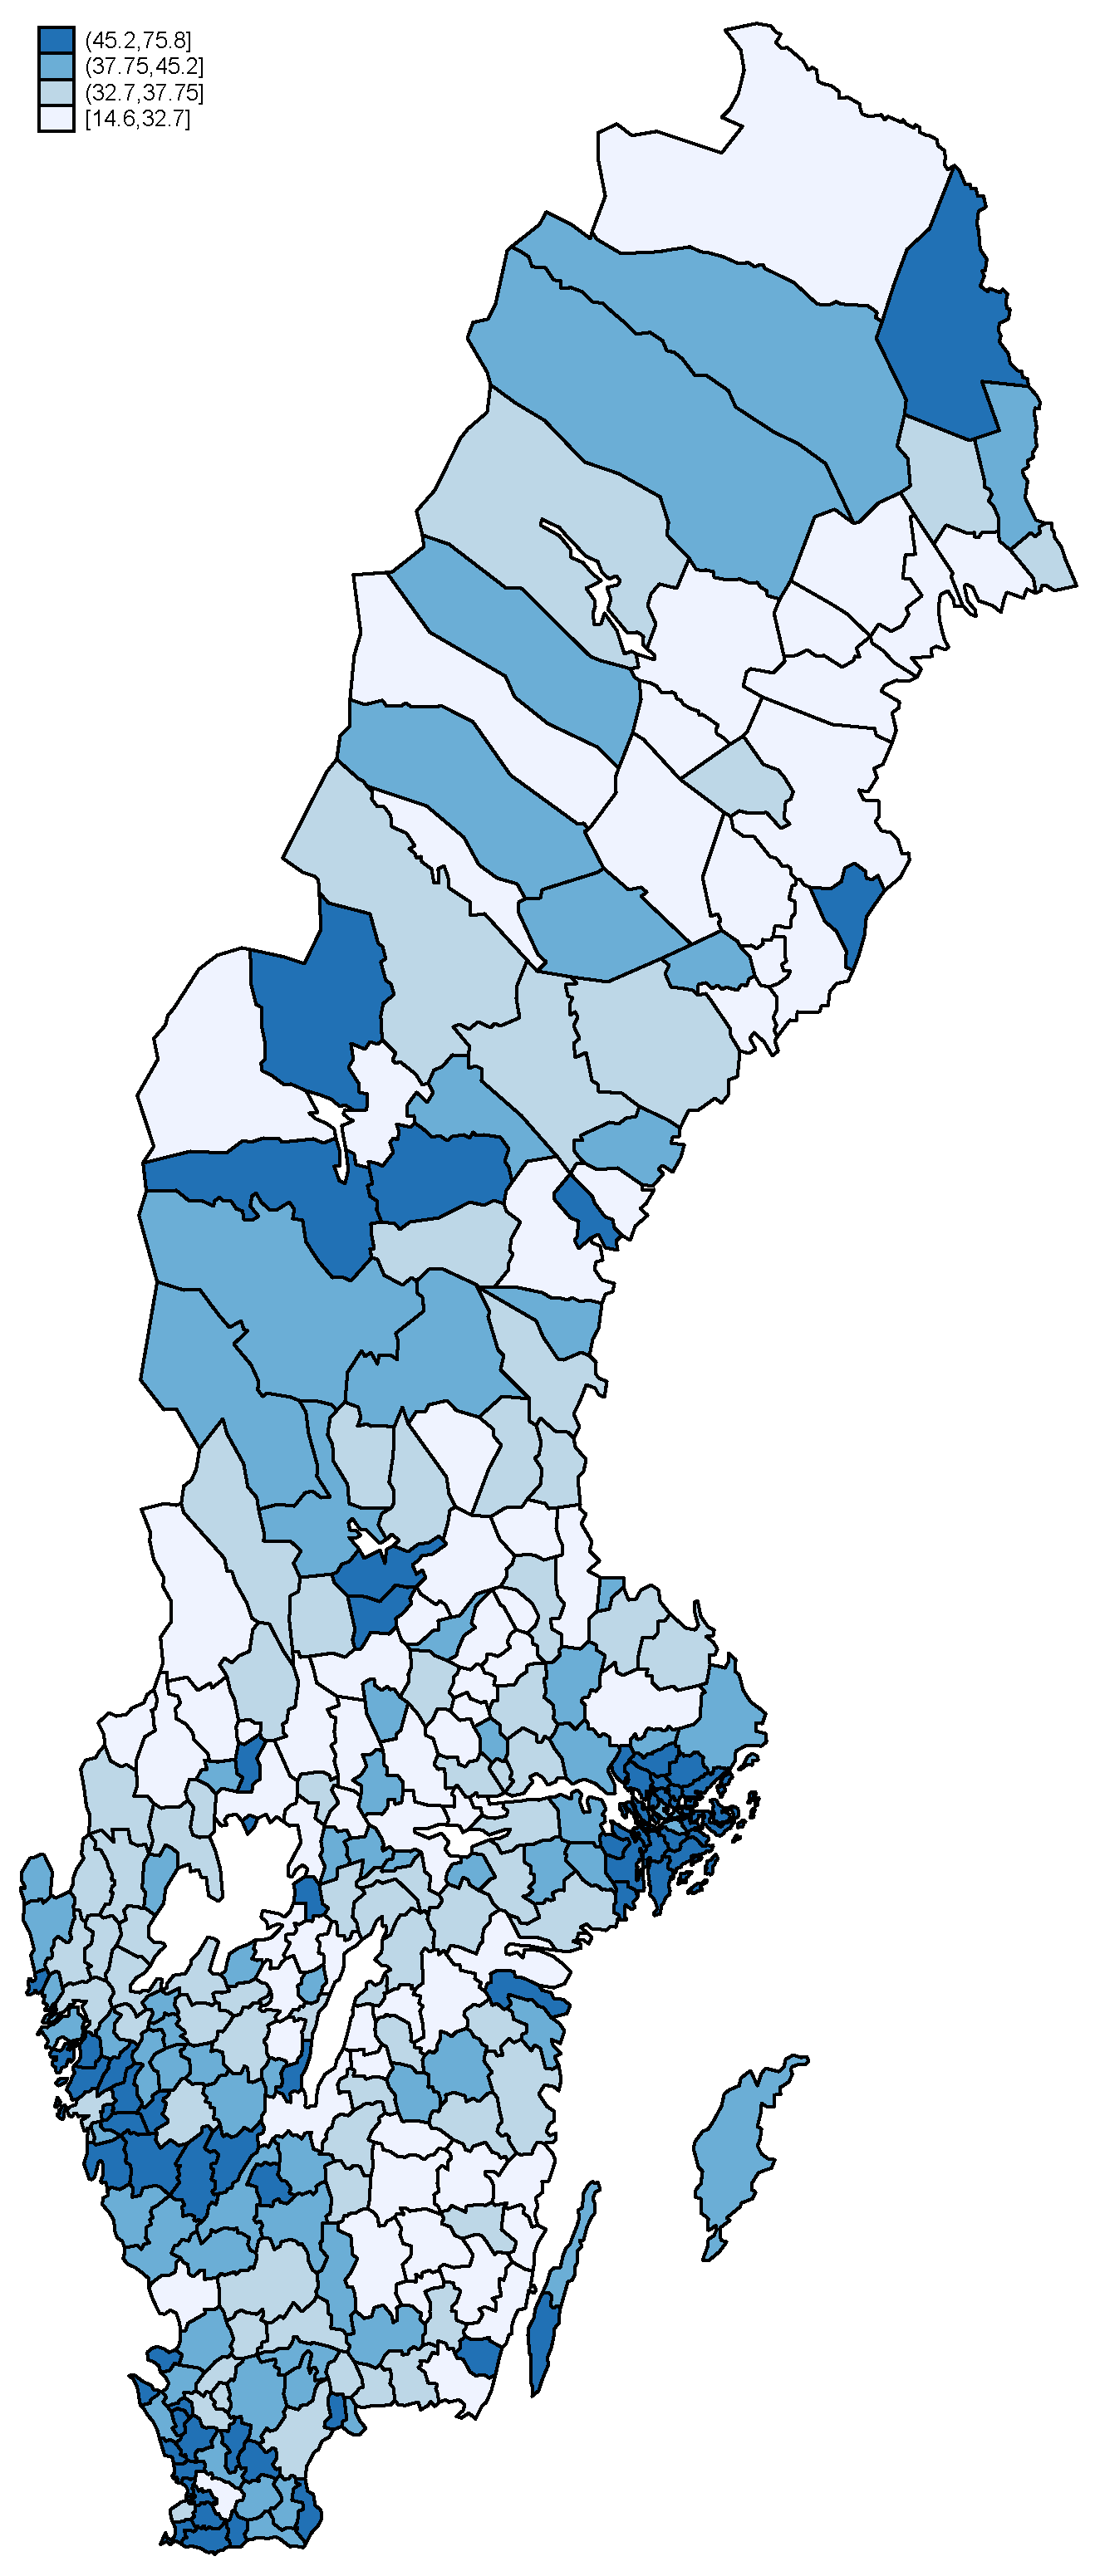
Figure 3.
Scree plots of the eigenvalues after PCA for each category.
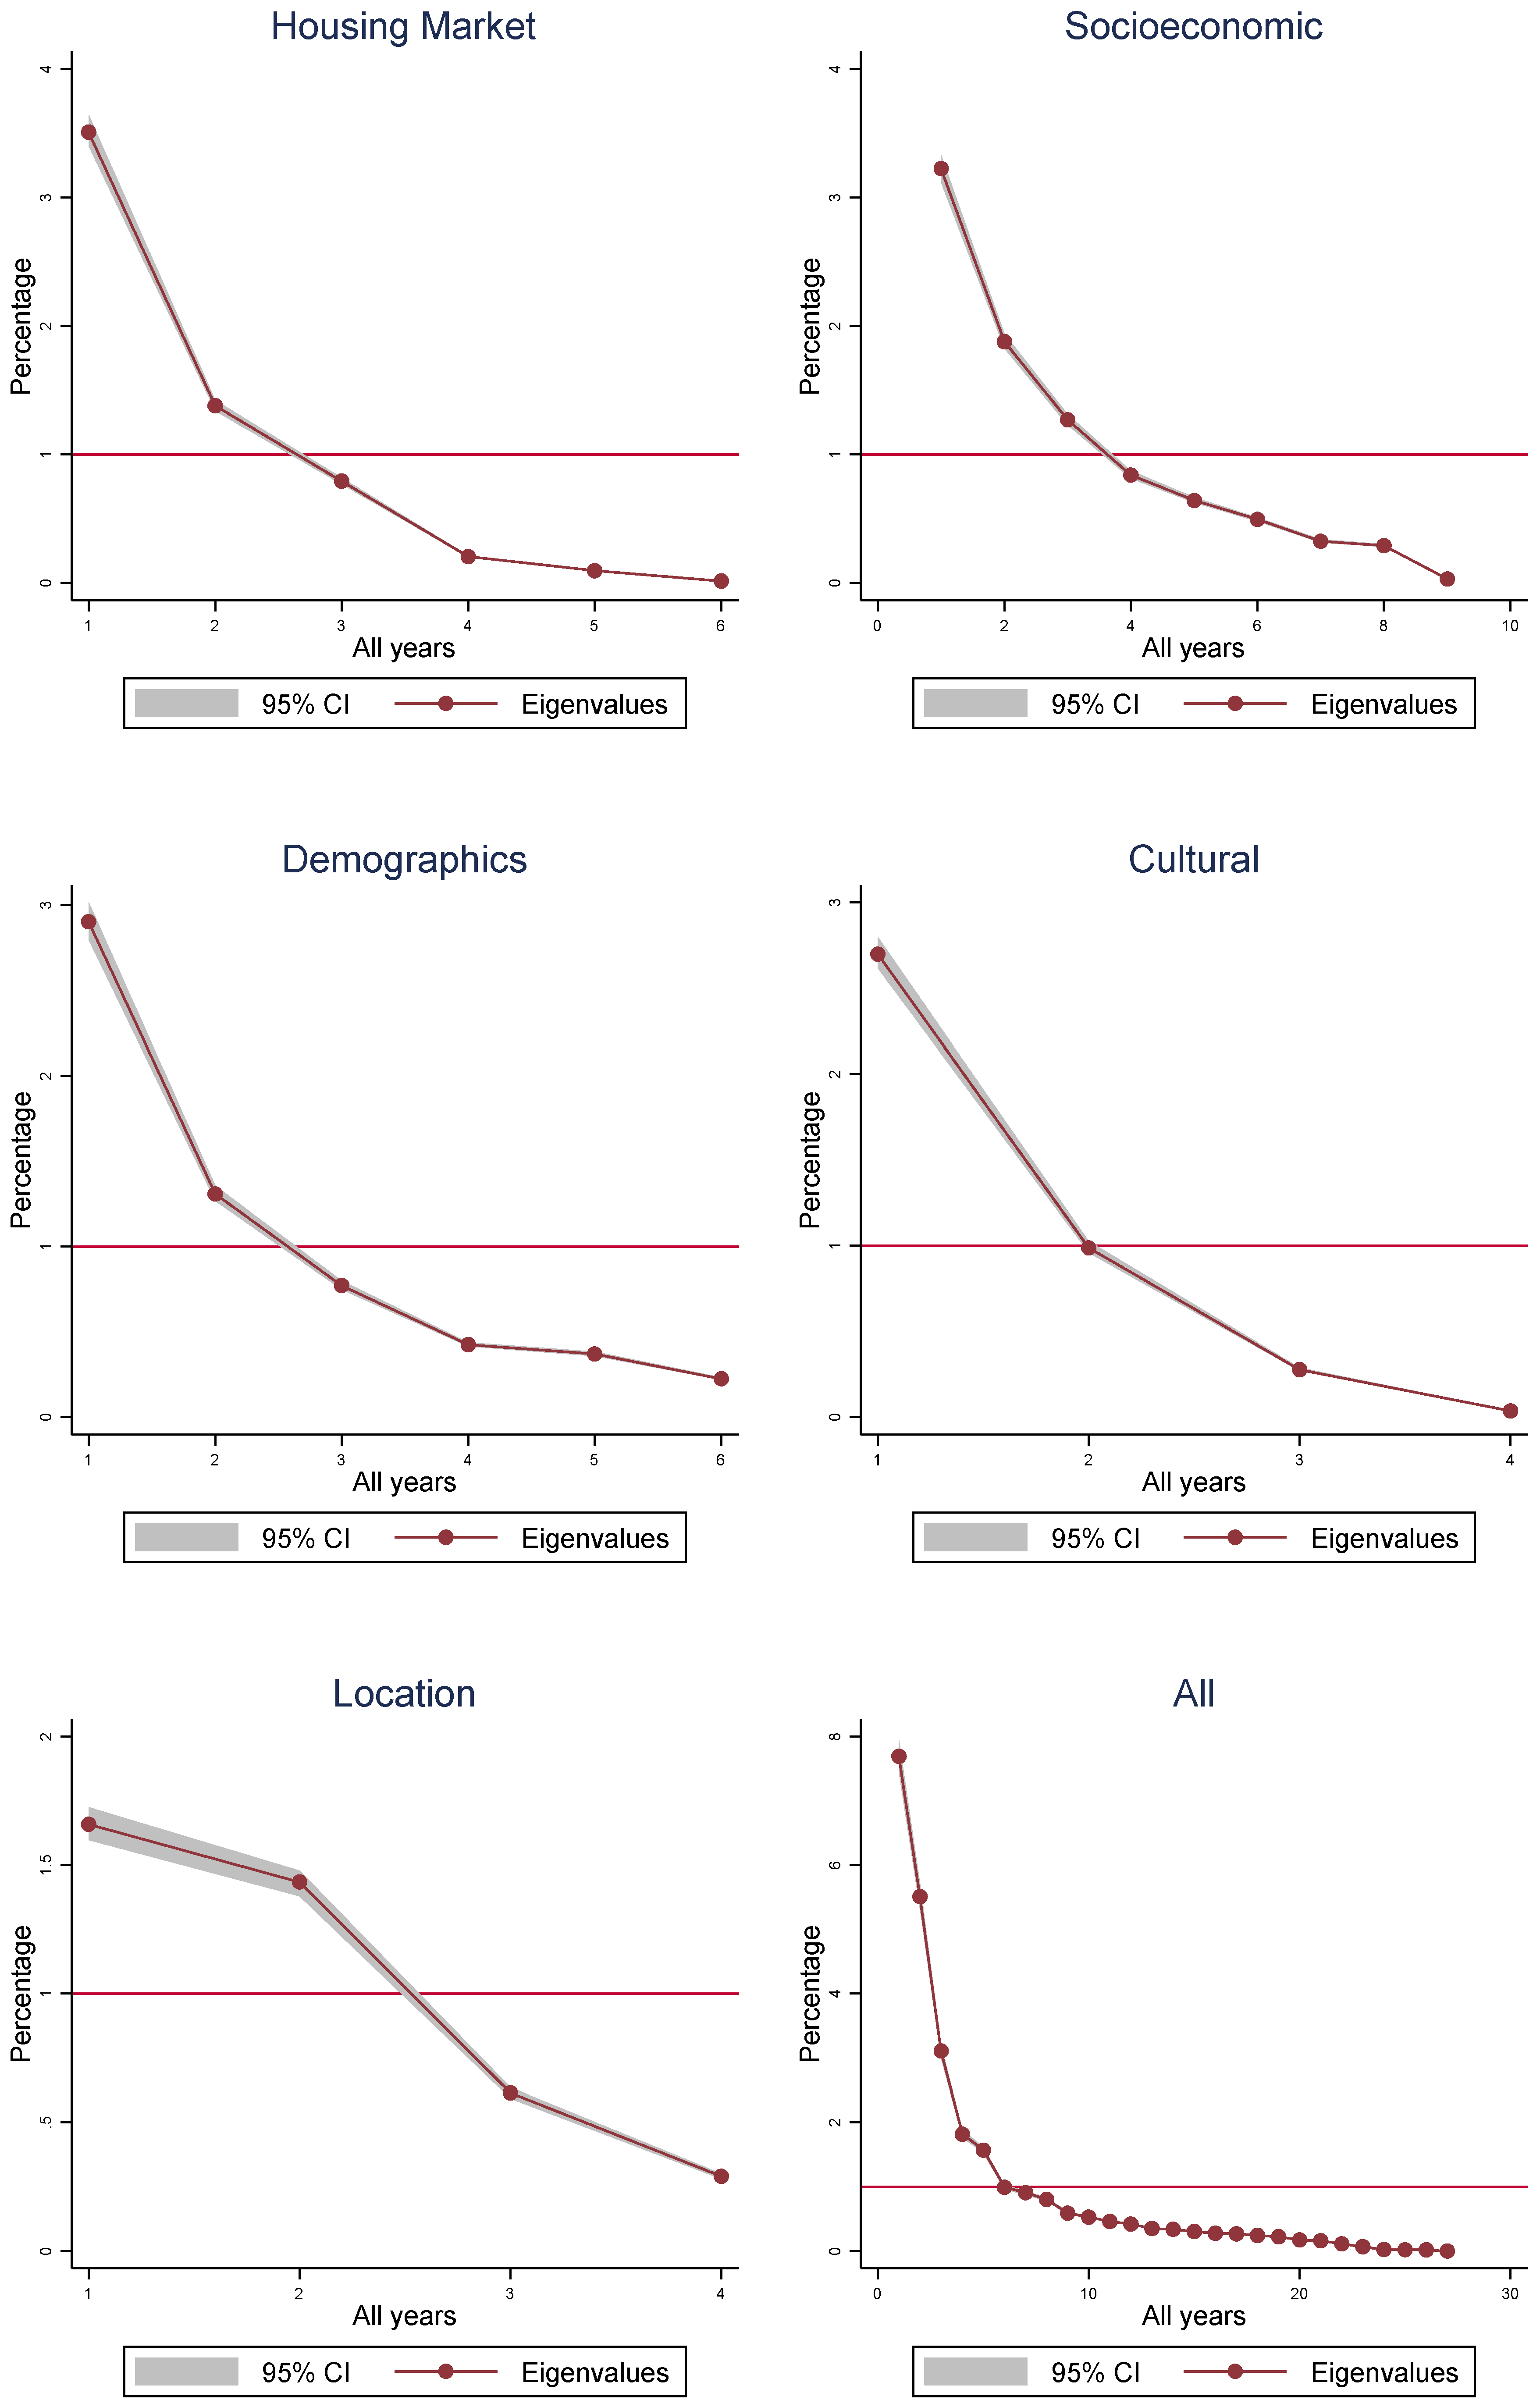
Figure 4.
Maps based on components from the principal component analysis.
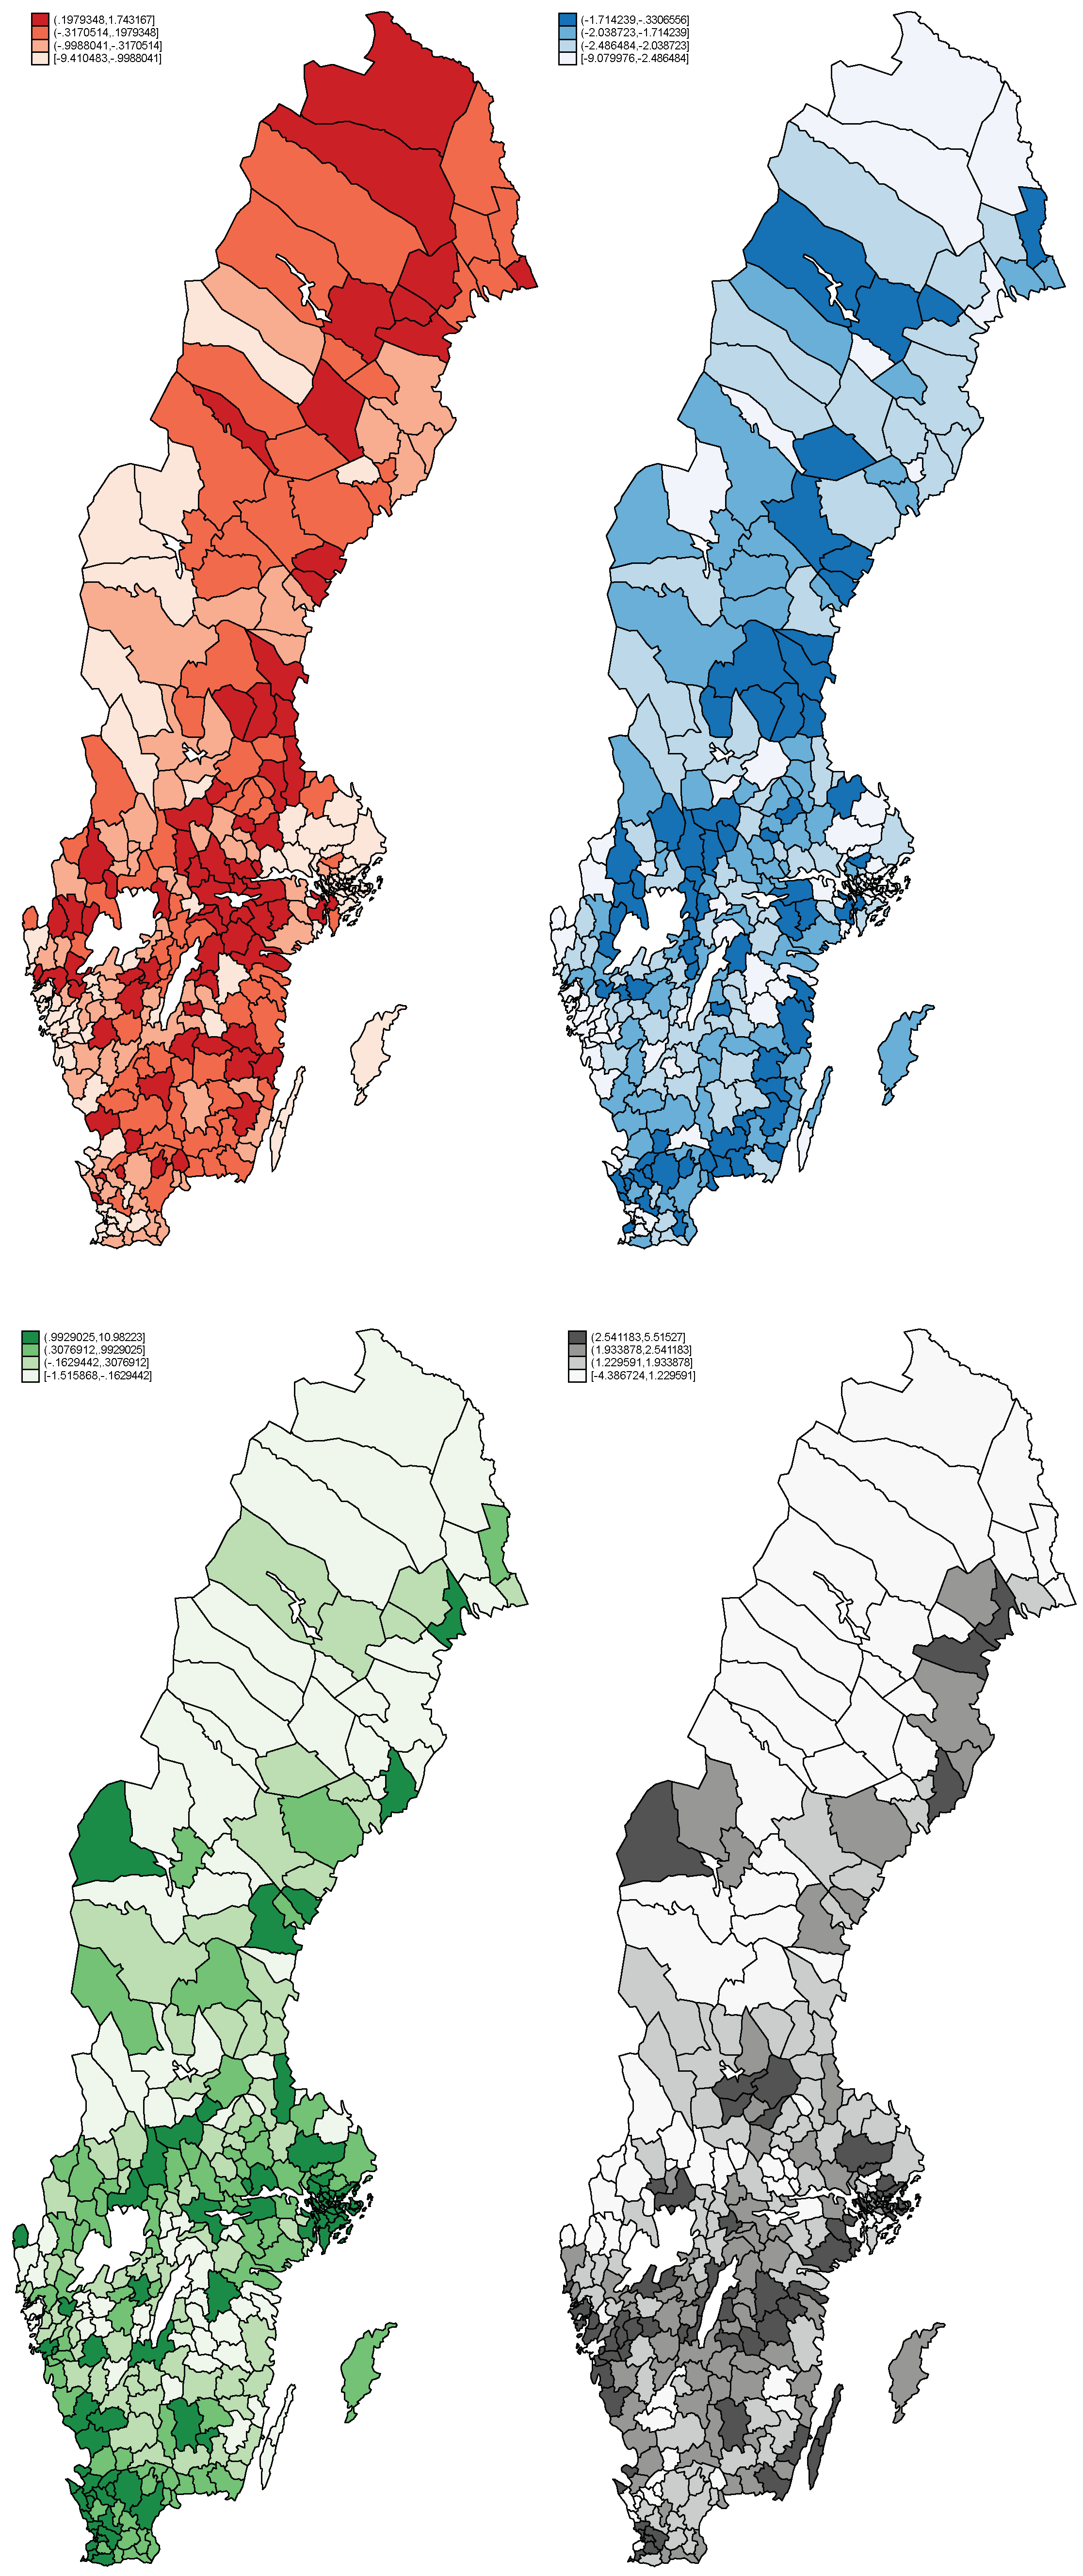

Table 1.
Variable Definition and Descriptive Statistics.
| Variable | Unit | Mean | Std. Dev. | Min | Max | Moran’s I |
| Young adults at home | % | 40.62 | 9.981 | 13.7 | 77.6 | 79.81 |
| Housing Market Conditions | ||||||
| Living in rental housing | % | 22.321 | 8.32 | 2.7 | 80.4 | 2.26 |
| Rental housing stock | number | 5495.706 | 15969.719 | 82 | 263138 | 0.02 |
| Housing stock | Number | 15807.972 | 33514.224 | 1125 | 505845 | |
| House prices | 1000 SEK | 1470.575 | 1331.521 | 198 | 13345 | 268.69 |
| Construction multifamily housing | Number | 70.721 | 291.065 | 0 | 5382 | 4.99 |
| Socioeconomic and educational differences | ||||||
| Unemployment | % | 13.054 | 3.912 | 3.9 | 31.5 | 36.86 |
| Long-term unemployment | % | 1.363 | .634 | .1 | 5.1 | 92.46 |
| Income 1 | Index | 5.154 | 1.069 | 3.2 | 20.2 | 91.82 |
| Income 2 | 1000 SEK | 229.453 | 53.723 | 134.2 | 598.3 | 137.91 |
| Income tax | % | 32.122 | 1.32 | 26.5 | 35.15 | 326.37 |
| Health | Index | 37.328 | 11.019 | 9.9 | 81.7 | 96.67 |
| Proportion eligible to secondary school | % | 88.091 | 5.559 | 54.8 | 100 | 28.18 |
| Proportion eligible to university | % | 79.813 | 12.402 | 26.9 | 100 | 58.75 |
| University student | Number | 224.773 | 1034.039 | 0 | 13902 | 3.92 |
| Demographic differences | ||||||
| Population | Number | 32705.341 | 65296.481 | 2387 | 978770 | 5.89 |
| Proportion in age 20-64 born in Sweden | % | 53.567 | 2.733 | 43.3 | 63 | 37.93 |
| Migration | Number | 176.136 | 560.936 | -4966 | 13054 | 2.61 |
| Men | % | 50.631 | 1.027 | 47.7 | 58.5 | 67.33 |
| Average age | Year | 42.622 | 2.604 | 35.1 | 51.4 | 179.79 |
| Cultural differences | ||||||
| Proportion age 20-64 born aboard | % | 63.326 | 3.903 | 42.2 | 76 | 147.41 |
| Voting participation EU | % | 41.939 | 7.885 | 0 | 73.6 | 113.75 |
| Voting participation Sweden | % | 83.33 | 3.781 | 67.2 | 93.9 | 44.95 |
| Voting participation municipality | % | 80.938 | 4.064 | 57.8 | 92.9 | 38.57 |
| Location differences | ||||||
| Population density | Ratio | 138.31 | 485.682 | 0 | 6171 | 245.40 |
| Urbanisation | % | 74.759 | 14.482 | 30 | 100 | 73.79 |
Note. The table defines the variables in the survey and provides descriptive statistics regarding the average, standard deviation, and minimum and maximum, respectively (range) - Moran’s I statistics. The spatial weight matrix is based on contiguity. We use the Stata command spmatrix to produce the spatial weight matrix, asdoc sum to produce the descriptive statistics table, and estat moran to calculate Moran’s I. The Moran’s I test for spatial dependence shows the estimate. High values indicate spatial dependence.
Table 2.
Spatial autoregressive panel data model with components from each category.
| (1) | (2) | |||
| Random effect | t-value | Fixed effects | t-value | |
| Housing Market | ||||
| Housing stock | -0.0242*** | (-6.33) | -0.0102** | (-2.74) |
| Rental housing stock | -0.0635*** | (-20.49) | -0.0398*** | (-13.54) |
| Demographic | ||||
| Young people | -0.0110** | (-2.78) | -0.00758* | (-2.30) |
| Population and migration | -0.000626 | (-0.20) | 0.00157 | (0.61) |
| Socio-economic | ||||
| Unemployment and health | 0.0226*** | (8.23) | 0.0147*** | (9.01) |
| Income tax | -0.00426* | (-2.18) | -0.00951*** | (-7.27) |
| Long-term unemployment | 0.00652** | (2.60) | 0.00184 | (1.21) |
| Cultural | ||||
| Voting participation | 0.0256*** | (8.97) | 0.0185*** | (10.07) |
| Young people born abroad | 0.00930** | (2.74) | 0.00590* | (2.14) |
| Location | ||||
| Coordinates | -0.00627 | (-0.77) | 0.125 | (1.75) |
| Urbanisation and density | -0.0282*** | (-3.71) | -0.0257 | (-1.02) |
| Constant | 3.887*** | (129.41) | ||
| W | ||||
| lnyah_all | -0.0704*** | 0.803*** | ||
| (-7.46) | (53.53) | |||
| e.lnyah_all | 0.642*** | -0.551*** | ||
| (41.89) | (-13.77) | |||
| sigma_u | ||||
| Constant | -0.173*** | |||
| (-22.74) | ||||
| sigma_e | ||||
| Constant | 0.0806*** | 0.0760*** | ||
| (109.55) | (95.59) | |||
| AIC | -12816.3 | -13703.2 | ||
| Observations | 6670 | 6670 |
Note. Two models have been estimated in Table 2. The first refers to a spatial autoregressive fixed effect model, and the second is a spatial autoregressive fixed effect model. We used a spatial weight matrix based on contiguity in both models. We have used Stata’s spmatrix and spxtregress commands to estimate the models. The models include both a spatially lagged dependent variable and a spatially lagged error term. The dependent variable is the natural logarithmic proportion of young adults living at home in each municipality and year. The independent variables are the components within each category (Housing market, Socio-economic, Demographic, Cultural, and Location) estimated using principal component analysis. t statistics in parentheses, * p < 0.05, ** p < 0.01, *** p < 0.001.
Disclaimer/Publisher’s Note: The statements, opinions and data contained in all publications are solely those of the individual author(s) and contributor(s) and not of MDPI and/or the editor(s). MDPI and/or the editor(s) disclaim responsibility for any injury to people or property resulting from any ideas, methods, instructions or products referred to in the content. |
© 2023 by the authors. Licensee MDPI, Basel, Switzerland. This article is an open access article distributed under the terms and conditions of the Creative Commons Attribution (CC BY) license (http://creativecommons.org/licenses/by/4.0/).
Copyright: This open access article is published under a Creative Commons CC BY 4.0 license, which permit the free download, distribution, and reuse, provided that the author and preprint are cited in any reuse.


