Preprint
Article

HRFNet: A Novel Hierarchical Rich-scale Fusion Network for Remote Sensing Semantic Segmentation

Altmetrics

Downloads

98

Views

38

Comments

0

This version is not peer-reviewed

Submitted:

17 October 2023

Posted:

27 October 2023

You are already at the latest version

Alerts
Abstract
The semantic segmentation of high-resolution remote sensing images (HR-RSI) is crucial for a wide range of applications, such as precision agriculture, urban planning, natural resource assessment, and ecological monitoring. However, accurately classifying pixels in HR-RSI faces challenges due to densely distributed small objects and scale variations. Existing techniques, including Convolutional Neural Networks (CNNs) and other methods for hierarchical feature extraction and fusion of remote sensing image, often do not achieve the desired accuracy. In this paper, we propose a novel approach called the Hierarchical Rich-scale Fusion Network (HRFNet) to address these challenges. HRFNet utilizes advanced information rating and image partition techniques to extract rich-scale features within image layers. This allows for the adaptive exploration of both local and global contextual information. Moreover, we introduce a structured intra-layer to inter-layer feature aggregation module, which enables the adaptive extraction of fine-grained details and high-level semantic information from multi-layer feature maps in a highly flexible manner. Extensive experimentation has been conducted to validate the effectiveness of our proposed method. Our results demonstrate that HRFNet outperforms existing techniques, achieving state-of-the-art (SOTA) results on benchmark datasets, specifically the ISPRS Potsdam and Vaihingen datasets.
Keywords: 
Subject: Computer Science and Mathematics  -   Computer Vision and Graphics

1. Introduction

In recent years, the rapid advancement of satellite and airborne remote sensing technologies has resulted in the acquisition of a massive volume of high-resolution remote sensing images. These images provide rich spatial details and geometric feature information, making them valuable resources for precision agriculture [1], urban building planning [2], efficient natural resource utilization [3,4], and disaster assessment [5,6]. Semantic segmentation, as a dense prediction task, assigns a category label to each pixel, enabling accurate surface feature extraction and land cover classification. Consequently, it has emerged as a critical research focus in remote sensing image interpretation.However, remote sensing images present unique challenges that differentiate them from pixel-level classification tasks in natural images. Firstly, these images often exhibit complex backgrounds and rich diversity within each class. The presence of diverse environmental conditions and variations in illumination, weather, and seasonality further complicates the interpretation and classification of remote sensing images. Secondly, in remote sensing images, small objects are densely distributed in relation to the overall frame size. This high object density leads to subtle differences between classes, making accurate classification more challenging. Lastly, remote sensing images often involve a wide range of target scales, with large targets such as buildings and water bodies coexisting with small targets like vehicles and vegetation. The significant difference in scales further adds to the complexity of accurately segmenting and classifying objects in remote sensing images. Due to these inherent challenges, existing image semantic segmentation methods designed for natural images are not sufficient for effectively addressing the unique characteristics and requirements of remote sensing images. Therefore, it is imperative to develop novel approaches and techniques specifically tailored for remote sensing image analysis to achieve more accurate and reliable results.
Remote sensing image semantic segmentation encompasses both traditional methods based on manual design and feature extraction, as well as methods utilizing deep learning techniques. Traditional methods include unsupervised clustering [7], supervised maximum likelihood [8], and support vector machines [9,10]. However, these methods heavily rely on the design of feature descriptors and are sensitive to parameter settings and data, making it challenging to achieve efficient, accurate, and dense prediction for large-scale high-resolution remote sensing images. Consequently, the advent of deep learning technology, particularly CNNs, and the utilization of hierarchical feature map extraction methods, such as the classic Fully Convolutional Network (FCN) [11] , have significantly improved the effectiveness of semantic segmentation in high-resolution remote sensing images [12], establishing them as the mainstream approaches. Nevertheless, CNNs inherently possess a local inductive bias and lack the ability to model context and long-distance dependencies [13]. To address these limitations, various methods have been proposed to enhance CNNs remote sensing image segmentation. These methods include dilated convolutions [14,15], expanding the size of convolutional kernels [16], feature pyramids [17], and the incorporation of attention [18,19] and self-attention mechanisms [20,21]. These techniques aim to capture both local and global information, enabling more comprehensive feature representation and improving the accuracy of semantic segmentation remote images.
However, in the context of complex land cover analysis in high-resolution remote sensing images, non-adaptive feature extraction at all positions within each layer of feature maps proves to be insufficient. This inadequacy stems from the fact that the amount of information present in different image positions varies significantly. For instance, areas with dense or sparse small targets and scale variations pose unique challenges, as illustrated in Figure 1. Consequently, employing convolutional kernels of the same size and shape for the original image and each layer of feature map fails to extract the most appropriate features for pixel-level classification. To elaborate further, in regions with dense small targets, it may be crucial to precisely capture higher-density boundary features, making it unacceptable to lose information through downsampling. Conversely, downsampling is less sensitive in areas with relatively larger connectivity. Thus, employing non-discriminatory downsampling and feature extraction methods for feature maps is suboptimal. Recognizing this limitation, we propose a novel In-Layer Rich-Scale Attention Network that adaptively extracts rich-scale features within each layer by quantifying and classifying image information. This approach involves partitioning the feature maps within the same layer to extract features that are more suited to the specific scales present in the image. Additionally, we perform in-layer and inter-layer aggregation of rich-scale features, combining global and local features to enhance the overall segmentation performance.
In this study, we propose a comprehensive approach to address the limitations of existing methods in remote sensing image semantic segmentation. Our proposed method consists of three key components. Firstly, we introduce a feature extraction scheme that quantifies and grades image information, allowing for the differentiation of features extracted from different locations within the image. This enables the model to effectively capture the varying degrees of importance and relevance of different image regions. Secondly, we present a partition-based in-layer rich-scale feature extraction method. This method adapts to extract features from both large-scale sparse feature regions and dense small targets using different-sized receptive fields. By utilizing receptive fields of varying sizes, we can capture features at different scales, ensuring that the model can effectively represent the diverse characteristics present in the image. Lastly, we propose a fusion-attention rich-scale feature aggregation module. This module facilitates the fusion of feature maps with different resolutions within the same layer and across different layers. By combining low-level features from the shallow layers with high-level semantic features from the deep layers, the model can leverage both local and global information to achieve more accurate and robust semantic segmentation. To evaluate the effectiveness of our proposed method, we conducted extensive experiments on two widely-used public datasets, namely ISPRS Potsdam and Vaihingen. The experimental results demonstrate the superior performance of our approach. Specifically, our proposed method achieves a mean Intersection over Union (mIoU) of 86.47 and 83.31 on the ISPRS Potsdam and Vaihingen datasets, respectively. These results highlight the effectiveness and potential of our approach in semantic segmentation of high-resolution remote sensing images.
To sum up, our contribution is mainly Three points:
(1)
We propose an information quantification and grading strategy to evaluate and quantify the amount of information contained in different positions within the image. This method allows us to assess the significance and relevance of various image regions.
(2)
We introduce a novel intra-layer rich-scale feature extraction module. This module is specifically designed to perform feature extraction on targets with large-scale. By adaptively extracting features at different we effectively capture the intricate and variations present in the image, leading to improved segmentation performance.
(3)
We propose an intra- and inter-layer feature aggregation module, this module allows for the refinement of feature maps and the aggregation of low-level features, such as edge features, with high-level semantic features.
(4)
Based on the above intra-layer rich-scale feature extraction module and intra- and inter-layer feature aggregation module, we construct a network specifically designed for high-resolution remote sensing image semantic segmentation.
The organization of the remainder of this paper is as follows. In Section 2, we introduce research related to remote sensing image semantic segmentation and multi-scale contextual feature extraction and fusion methods. In Section 3, we provide detailed information on the proposed method. In Section 4, we demonstrate the effectiveness of our method through extensive experiments and result analysis. Finally, in Section 5, we draw conclusions.

2. Related Work

2.1. Remote Sensing Image Semantic Segmentation

Thanks to universal semantic segmentation methods such as FCN [11], U-Net [22], and the DeepLab series [14,23,24,25], the primary focus of remote sensing image semantic segmentation research lies in extracting features through CNN layers, with end-to-end segmentation results generated based on the encoder-decoder architecture.
In recent years, significant efforts have been made to improve the encoder-decoder architecture [26,27,28,29]. Many researchers have focused on modifying either the encoder or decoder and adjusting the hierarchical feature fusion to better utilize high-level and low-level feature maps. For example, Long et al. [26] integrated a Transformer encoder in parallel with CNN to capture fine-grained spatial details in the remote global context. Jin et al. [28] proposed a combined void convolution with different inflation rates to enhance the preservation of small target information in the feature maps. Tan et al. [29] introduced feature focus (FF) and context focus (CF) modules in the decoder to enhance the model’s multi-scale feature representation capability. Wang et al. [30] constructed a hierarchical and lightweight Transformer decoder with global-local transformer blocks to capture multi-scale global and local features. These methods have shown promising results in improving the feature extraction and fusion abilities of the encoder-decoder architecture.
Moreover, there are also methods [31,32] that enhance both the feature extraction ability of the model at the encoder side and the feature fusion ability at the decoder side. Yang et al. [33] incorporated a dense connection and multi-scale maximum pool module at the encoder end, while adding the ECA attention mechanism module to the decoder for simultaneous feature mapping from different coding layers. This enables the fusion of low-level and high-level semantic information and improves the classification ability of features, especially for small objects. Zhang et al. [34] replaced convolution with a Focus operation on the encoder side to reduce information loss and utilized Swin Transformer and CBAM hybrid attention for feature extraction. They also used Focus and upsampled feature maps for feature enhancement at the decoder side. These methods further enhance the overall feature extraction and fusion capabilities of the encoder-decoder architecture.
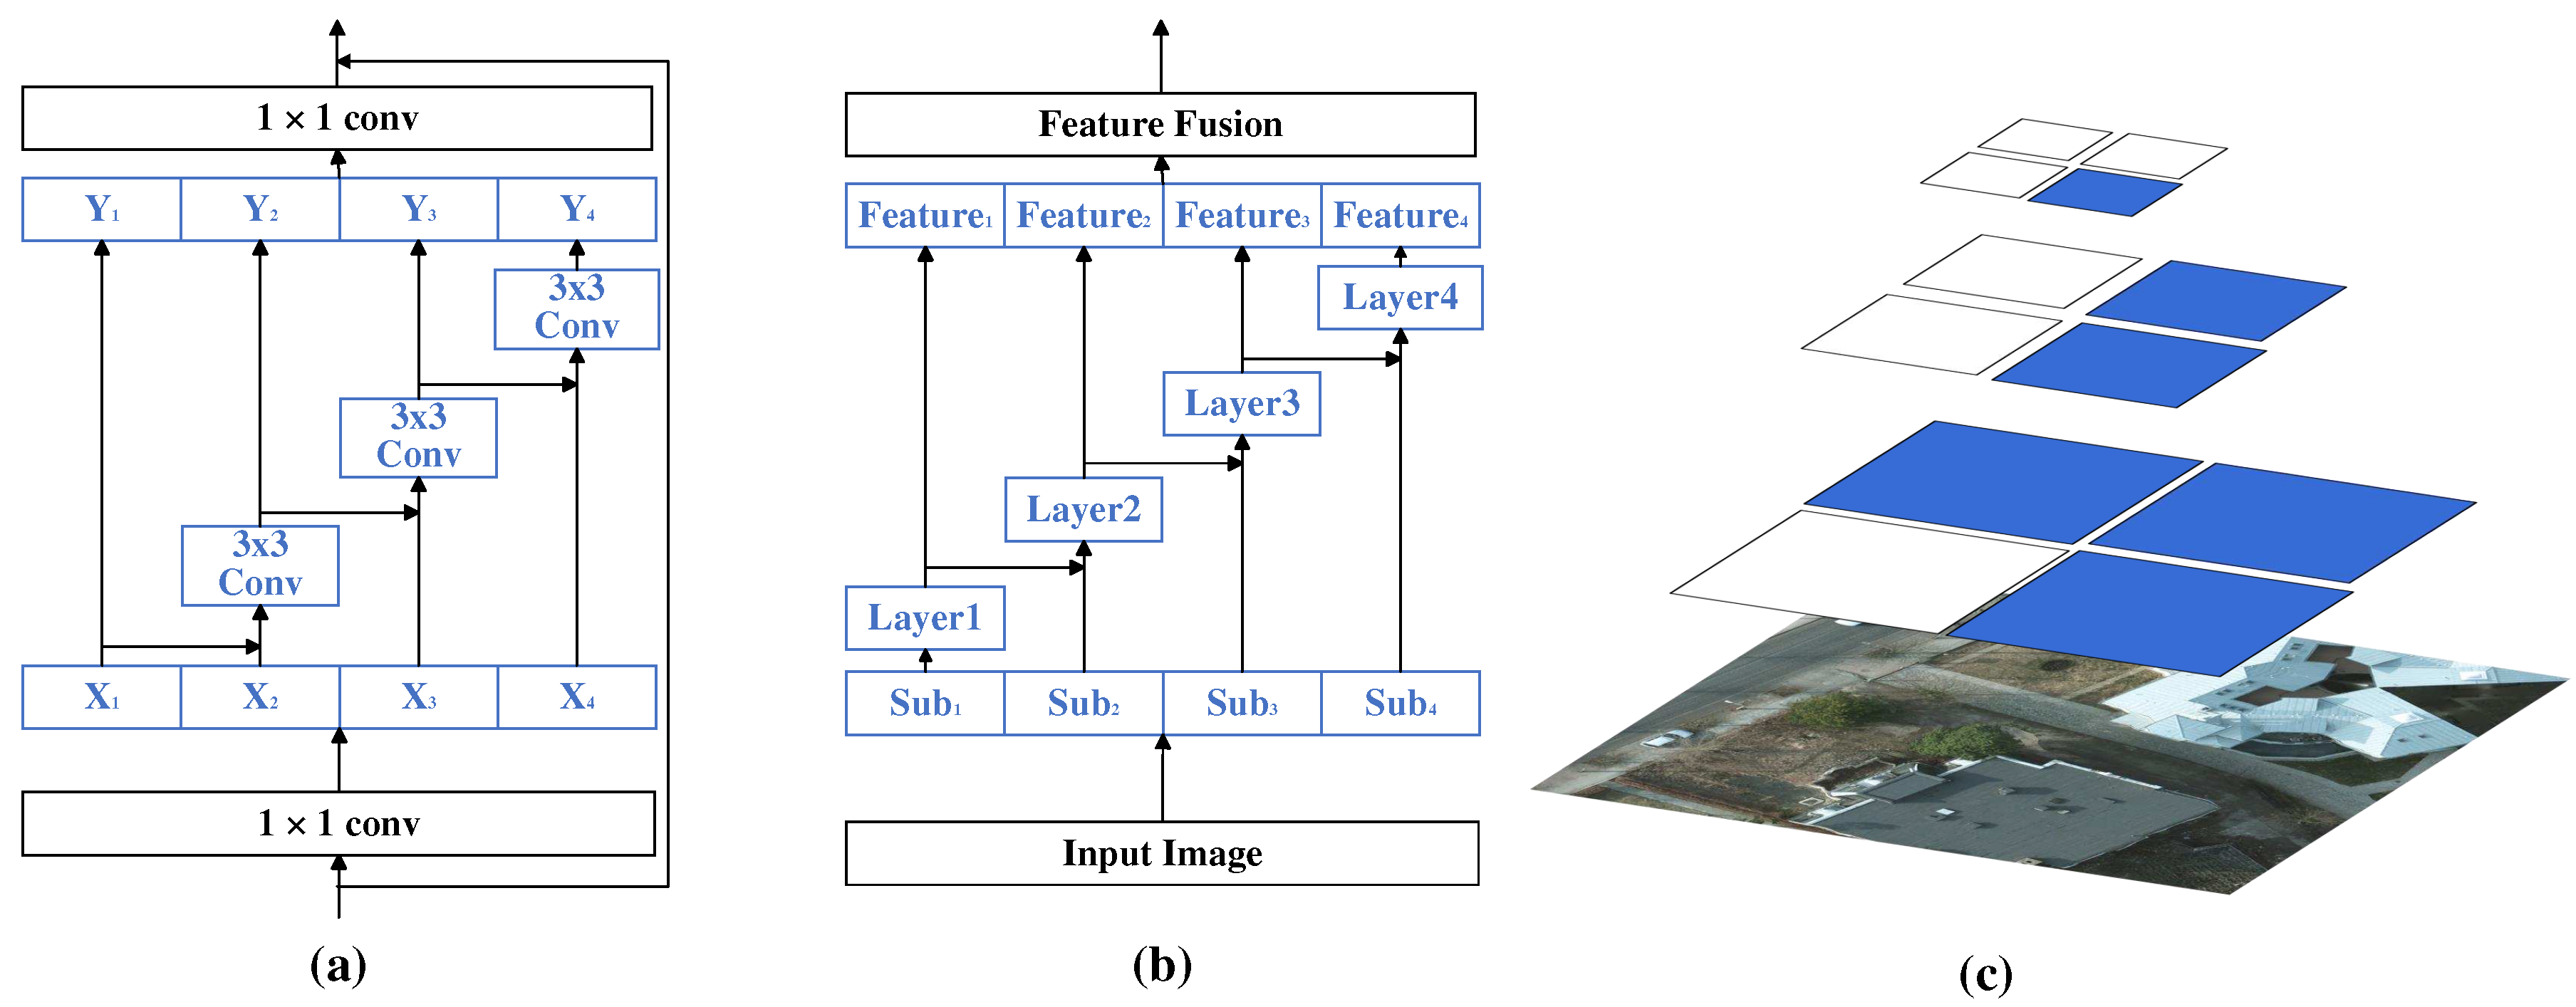
However, despite these advancements, current methods still perform the same operations on the feature maps of each layer during feature extraction and fusion, as shown in Figure 2. Moreover, they only perform feature fusion between layers and do not fully exploit the rich-scale features within each layer or aggregate the features within the layer. This limitation indicates the need for further research to explore more effective methods for feature extraction, fusion, and enhancement within each layer of the encoder-decoder architecture.

2.2. Multi-scale Context Feature

At present, the utilization methods of multi-scale context information [35,36,37,38] can be broadly categorized into two main approaches. The first approach focuses on increasing the receptive field by modifying the convolution operation. For example, Xiao et al. [35] proposed directional convolution and large-field convolution to capture gradient changes in different directions and expand the receptive field. Wu et al. [39] introduced a sample-proxy dual triplet (SPDT) loss function, in conjunction with a multi-proxy softmax (MPS) loss function, to learn fusion features effectively. Li et al. [40] enhanced the feature representation and extraction capabilities of convolutional layers by utilizing asymmetric convolutions. Xie et al. [41] proposed viewpoint-robust knowledge distillation (VRKD), which focuses on learning multi-stage features through a combination of a sophisticated teacher network and a streamlined student network. Although these methods modify the convolution operation they do not fundamentally address the inherent local inductive bias, as the same operation is still performed at all locations within each layer of the feature map.
Another category of methods [42,43,44,45,46] utilizes attention mechanisms to model long-range dependencies on channels or spatial dimensions. For instance, Xu et al. [42] employed an adaptive Transformer to suppress background noise, enhance foreground saliency, and extract detailed information through spatial attention and channel attention. Wang et al. [30] introduced Swin Transformer as the encoder and proposed a DCFAM at the decoder side to enhance the spatial and channel relationships of semantic features using Shared Spatial Attention (SSA) and Shared Channel Attention (SCA). HPGN [47] proposed a pyramid graph network that focuses on exploring multi-scale spatial structural features, which is tightly connected behind the backbone network. He et al. [48] proposed a Swin Transformer encoder structure with a spatial interaction module (SIM) parallel to the CNN encoder. However, current attention mechanisms do not fully leverage the existing local contextual priors captured by convolutions and fail to effectively utilize features extracted by CNN.
Both categories of methods have made significant advancements in enhancing and fusing contextual information. However, whether it is modifying the convolution kernel or employing attention mechanisms, the same operation is still performed on all parts of the feature maps within the same layer. This approach lacks the ability to adaptively extract features from positions that contain varying amounts of information. Therefore, there is a need for further research to explore methods that can dynamically extract features from different positions within the feature maps based on the local contextual information.

3. Method

In this section, we present a comprehensive overview of our method, highlighting its key components and discussing the underlying ideas. To begin with, we introduce the concept of information quantization and rating strategy, which is realized through our Information Rating Module. This module plays a crucial role in effectively quantifying and rating the information within the input data. By assigning appropriate ratings to different information elements, we can prioritize their importance and guide subsequent processing steps. Next, we delve into the module of Intra-layer Rich-scale Feature Enhancement, which comprises two sub-modules: Intra-layer Rich-scale Feature Extraction and Inter- and Intra-layer Feature Fusion. The Intra-layer Rich-scale Feature Extraction module focuses on extracting rich-scale features within each layer of the network. This allows us to capture fine-grained details and local contextual information, enhancing the discriminative power of the network. The Inter- and Intra-layer Feature Fusion module, on the other hand, aims to fuse the extracted features across different layers, facilitating the integration of global and local information. Finally, we discuss the sources of inspiration for our method and provide an overview of the overall network structure.

3.1. Information Rating Module

According to Shannon’s information theory, entropy is a mathematical measure of uncertainty and is commonly used to represent the probability of occurrence of discrete random events. In the context of image analysis, the entropy value provides valuable insights into the richness of information present in an image.In an image, when the entropy value is high, it indicates that the image contains a diverse range of objects and densely packed elements. This implies that there are multiple types of objects present in the image, and they are distributed in a dense manner. Such high entropy values suggest that the image carries a significant amount of information and exhibits a high level of complexity. In our method, we recognize the importance of entropy in quantifying the richness of information within an image. By incorporating the concept of entropy, we can effectively evaluate and leverage the information content for improved analysis and decision-making. The quantification of information can be expressed as
H ( x i ) = i = 1 P ( x i ) log ( P ( x i ) ) ,
where P ( x i ) denotes probability of random event x i . Generalized to the image, there is the entropy of image I
H I ( x c i , j ) = c = 1 P ( x c i , j ) log P ( x c i , j ) .
Similarly, where I ( x c i , j ) represents the the category of pixels at position ( i , j ) in image I is c, and P ( x c i , j ) denotes the probability of I ( x c i , j ) .
In order to measure the amount of information contained in different positions in an image, we propose an information quantization and classification module based on image local entropy. Specifically, first, we calculate the entropy of the image according to formula 2 and optimize the result to get the information quantization graph as shown in Figure 3. Then, according to the quantized information, The information of the image is divided into several levels R n , where n represents the total quantity of quantized classification.
To accurately measure the information content in different positions of an image, we introduce a novel information quantization and classification module based on local image entropy. Firstly, we calculate the entropy of the image using a specified formula (referring to formula 2). This entropy calculation provides us with a quantitative measure of the uncertainty or randomness present in the image. The optimized entropy serves as the basis for generating an information quantization graph, as shown in Figure 3, which visually represents the distribution of information across the image. Next, based on the quantized information obtained from the information quantization graph, we partition the information in the image into several distinct levels, denoted as R n . The parameter n represents the total number of quantized classifications. This step allows us to effectively categorize and classify the information present in the image, enabling a more detailed analysis of its content. By leveraging this information quantization and classification approach, we gain valuable insights into the distribution and characteristics of information within the image. This enables us to identify and prioritize regions or positions that contain significant amounts of information, as well as those that may be less informative. The quantized classification of information provides us with a finer-grained representation of the image content, facilitating subsequent analysis and decision-making processes. By considering the different levels of quantized information, we account for the varying importance and relevance of the information in different regions of the image. In summary, our proposed method offers an effective approach to measure and classify the information content in an image. By quantizing the information based on local entropy and dividing it into distinct levels, we can better understand and utilize the information available within the image.
For high-resolution remote sensing images, the density of objects in different locations varies greatly, so we partition the image by R n , and obtain sub-regions I k r I , r ( 1 , R ) , k denotes index of sub-regions. By partitioning the image into sub-regions, we can specifically analyze and process the different areas based on their respective levels of quantized information. This allows us to focus our analysis and processing efforts on specific regions that may contain important or informative objects, while also considering the less dense or less informative areas separately. This finer-grained analysis helps to improve the overall performance and reliability of our image processing techniques, particularly in the context of high-resolution remote sensing images where the object density can vary significantly.

3.2. Intra-layer Rich-scale Feature Enhancement

Both the image pyramid and the feature pyramid [17] apply the same processing to the image or feature map at each level, which hinders the adaptive extraction of features from different positions in the image. As a result, objects located at different positions exhibit varying levels of accuracy in feature maps due to differences in scale and shape. To address this issue, our HRFNet quantifies and grades the information, enabling adaptive feature enhancement. By performing hierarchical feature extraction and fusion on subgraphs containing different amounts of information, HRFNet improves the accuracy of prediction.

3.2.1. Intra-layer Rich-scale Feature Extraction

Through the aforementioned IRM, the image I is partitioned into k subgraphs I R n k . These subgraphs are then processed by the Res2Net50 encoder to extract features. Specifically, for the subgraph with the lowest information rank I R 1 k , we extract the low-level feature F 0 and the-level feature map F 4 , resulting in feature maps F 0 I R 1 k and F 4 I R 1 k . Similarly, for the subgraph I R 2 k with information level R 2 , we extract the feature maps F 0 I R 2 k , F 1 I R 2 k , and F 4 I R 2 k from different layers, the corresponding feature maps F 0 I R 2 k , F 1 I R 2 k and F 4 I R 2 k . This process is repeated for the remaining, I R 3 k and I R 3 k , respectively.
Subsequently, all the obtained feature maps are inputted into the decoder for intra-layer inter-layer feature fusion, as well as resolution restoration.

3.2.2. Inter- and Intra-layer Feature Fusion

After undergoing intra-layer rich-scale feature extraction in the encoder, we obtain a hierarchical feature map that corresponds to each sub-map. This feature map is obtained from multiple feature layers and possesses different receptive fields. To enhance the utilization of features, we perform both inter-layer and intra-layer feature fusion on these feature maps. This fusion process allows us to aggregate information from different scales and spatial locations, thereby improving the efficiency of feature utilization.
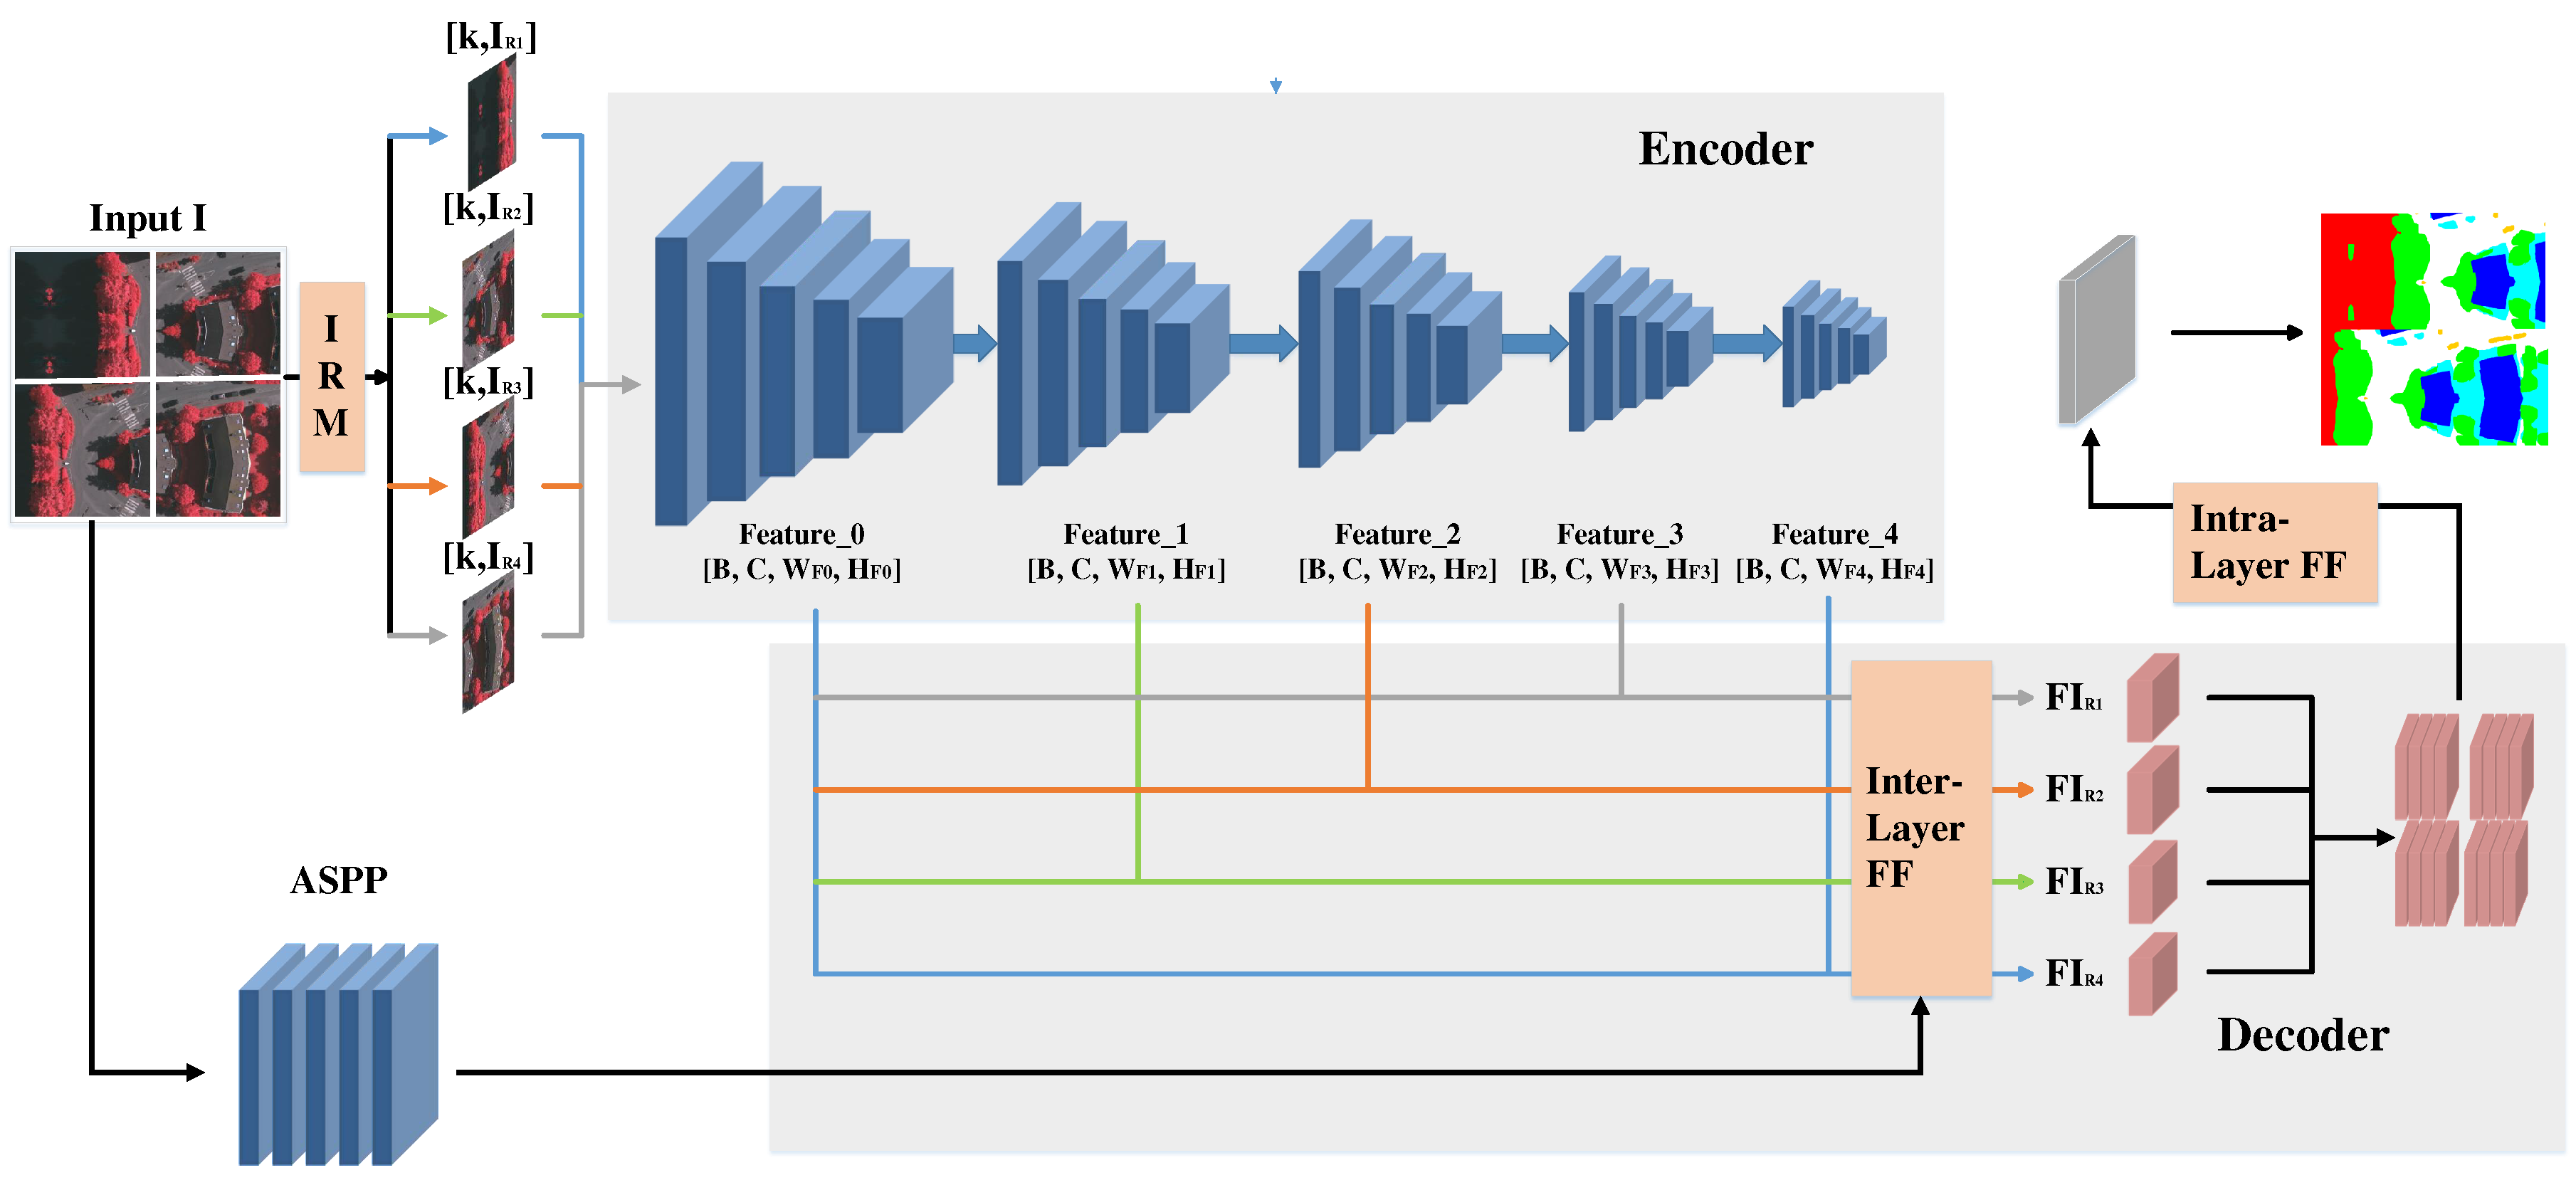
Inter-layer Feature Fusion. After applying IRM and dividing the input image into four sub-images with varying amounts of information, we extract feature maps with different dimensions for each sub-image in the encoder. To begin, we perform feature fusion within the same sub-image across different layers, resulting in feature maps F I R 1 k , F I R 2 k , F I R 3 k and F I R 4 k of the four sub-images. Taking subgraph I R 1 k as an example, the feature maps F 0 I R 1 k and F 4 I R 1 k extracted by the encoder have shapes of B , C F 0 , W F 0 , H F 0 and B , C F 4 , W F 4 , H F 4 , respectively. These two feature maps are resized to the same dimensions of W and H, and then concatenated to obtain a feature map with a of B , C F 0 + C F 4 , W 1 , H 1 . Similarly, the dimensions of feature maps F I R 2 k , F I R 3 k and F I R 4 k obtained after intra-layer feature fusion of sub-images I R 2 k , I R 3 k , and I R 4 k are B , C F 0 + C F 1 + C F 2 + C F 4 , W 3 , H 3 and B , C F 0 + C F 1 + C F 2 + C F 3 + C F 4 , W 4 , H 4 , respectively. Next attention is employed for feature fusion in each high subgraph feature map.
Recover Spatial Position by Index. After applying IRM, the order of the sub-graphs is altered. Therefore, following inter-layer feature fusion, it becomes necessary to restore the spatial position of the sub-graph based on the sub-graph index k. Specifically, we rearrange the spatial positions of the subgraphs based on the specified index k of subgraph I k r in IRM. This allows us to restore their original spatial arrangement.
Intra-layer Feature Fusion. The direct splicing of the four sub-images would introduce inconsistencies at the edges and other undesired phenomena due to the discrepancy in scales between feature map upsampling, downsampling, and inter-layer feature fusion (as shown in Figure 4). To overcome this challenge, we propose an intra-layer feature fusion module that effectively combines the feature maps of the four sub-maps. The process of our proposed method is illustrated in Figure 5. After splicing the four sub-images, a 1x1 convolution operation is applied to facilitate cross-channel information interaction. Following this, global feature fusion is performed on the spliced image I . Inspired by the DeepLab v3+ architecture, we utilize two sets of 3x3 convolution layers, incorporating batch normalization (BN) and rectified linear unit (ReLU) activations, to fuse the feature maps. Finally, linear interpolation and upsampling techniques are employed to restore the original image size.

3.3. Combined with Sota Method

In this section, we present a review of the conceptual origins behind our approach, which focuses on enhancing the representation of rich scale features within individual layers. Additionally, we outline the overall framework of our proposed method.

3.3.1. Review Res2Net

Building upon the ResNet, one of the most prominent CNN networks, Gao et al. [49] introduced the Res2Net network (illustrated in Figure 6). This network aims to effectively capture information from various scales, enabling robust object classification across different scales and enhancing the understanding of the contextual relationship with objects. The Res2Net achieves this by incorporating hierarchical class residual links within a single residual block at a finer level of multiscale, thereby increasing the receptive field of each layer of the feature map.
Let the feature map after 1x1 convolution be X, and divide it evenly into s subgraphs, setting the set of feature subgraphs x i X , where i [ 1 , s ] . The feature subgraph feed to 3x3 convolution layer except x 1 , has output
y i = x i , 3 × 3 c o n v ( x i ) , 3 × 3 c o n v ( x i + y i 1 ) , i = 1 ; i = 2 ; i > 2 .
Although each 3x3 convolution has a fixed receptive field size, a significant portion of the feature maps can receive indirect receptive fields from other locations through class residuals within the layers. This allows for a combination of different numbers and sizes of receptive fields, thereby implicitly capturing long-distance contextual information. By employing various operations on the feature map of the same layer, one can effectively leverage features of multiple scales and enhance the representation capability. Motivated by this observation, we contend that the conventional image pyramids and feature pyramids treat images at the same layer of the feature map in a suboptimal manner. To address this limitation, we propose a novel hierarchical rich-scale fusion method, which elaborated in Section 3.1 and Section 3.2.

3.3.2. Overall of Network Architecture

As depicted in Figure 7, our proposed network begins by passing through an Image Rating Module (IRM), which partitions and arranges the input image based on quantized and graded image entropy. This process yields sorted sub-regions, where each sub-region corresponds to a specific image entropy level. The backbone network is then employed to extract feature maps from different layers for each sub-region. Subsequently, these feature maps from different layers are selectively fused based on the image entropy level of the corresponding sub-region. Finally, the final segmentation map is obtained through intra-layer and inter-layer feature fusion processes.

4. Experiments

4.1. Dataset

To demonstrate the effectiveness of our HRFNet, we conducted experiments on several widely used public datasets, with a particular focus on the ISPRS Potsdam and Vaihingen datasets. Through extensive experimentation, we validate that our proposed approach outperforms existing state-of-the-art methods in terms of performance metrics.
Potsdam. The dataset comprises 38 patches, all of which are of the same size (6000 × 6000). These patches were extracted from very high-resolution TOP mosaics with a ground sampling distance (GSD) of 5 cm. The dataset covers an area of 3.42 square kilometers in Potsdam and includes complex buildings and dense settlement structures. For the purpose of semantic segmentation research, the dataset is annotated with six categories: car, tree, low vegetation/grass, building, impervious surfaces, and clutter. Each image in the dataset is provided in three channel combinations: IR-R-G, R-G-B, and R-G-B-ir, and also includes a digital surface model (DSM). Due to limitations in our computational resources, we selected DSM-free R-G-B images for our experiments.
Vaihingen. The dataset consists of 33 TOP images of varying sizes, with the maximum image size being 3816x2550 and the minimum size being 1388x2555. These images cover an area of 1.38 square kilometers in Vaihingenngen. The ground sampling distance (GSD) of the dataset is approximately 9 cm. Each TOP image in the dataset includes IR, red (R), and green (G) channels. The images are annotated with six categories for semantic segmentation. Similar to our previous experiments, we selected DSM-free images based on the computational resources available for our experiment.

4.2. Evaluation Metrics

The average intersection over union ratio (mIoU) is recognized as the primary evaluation criterion for segmentation tasks. It measures extent to which predicted segmentation mask overlaps with the ground truth mask, providing an overall assessment of segmentation accuracy. The calculation formula is
mIoU = 1 k + 1 i = 0 k p ii i = 0 k p i j + i = 0 k p j i p i i ,
where k denotes foreground class, i denotes ground truth, j denotes prediction, that is, p i j denotes the case where i is predicted to be j.
Furthermore, for the land cover classification task, there are commonly used evaluation metrics such as overall accuracy (OA) and F1-score. The F1-score is calculated based on precision and recall, providing a comprehensive evaluation of the classification performance.
O A = i = 0 k T P i = 0 k T P + F P + F N + T N ,
F 1 = 2 · p r e c i s i o n · r e c a l l p r e c i s i o n + r e c a l l .
Moreover, the calculations for precision and recall are as follows.
p r e c i s i o n = T P T P + F P , r e c a l l = T P T P + F N .
Where, TP represents the number of true positive predictions for the positive class, FP represents the number of false positive predictions where the prediction result is a positive class but the ground truth is a negative class, and FN represents the number of false negative predictions where the prediction result is a negative class but the ground truth is a positive class. Additionally, FP represents the number of true negative predictions for the negative class. Therefore, the mean intersection over union (mIoU) can also be considered equivalent to
mIoU = 1 k + 1 i = 0 k T P F N + F P + T P .

4.3. Experiment Setting and Complement Details

The experimental environment utilized a server equipped with an Intel(R) Xeon(r) Gold 6230R CPU @2.10GHz and an Nvidia A10 24G GPU, running on Linux version Ubuntu 20.04.4LTS. The ResNet50 backbone, pre-trained on ImageNet, was employed in this study. For the training set, random scaling and cropping techniques [50] were applied, with an input size of 1024 × 1024. The AdamW optimizer was utilized with an initial learning rate of 6 e 4 and a weight decay of 2.5 e 4 . To manage the learning rate, we adopted the Cosine Annealing Strategy with Warmup [51] and restart, where T-0 was set to 15 and T-mult to 2. Moreover, a batch size of 8 and 200 epochs were set for the Potsdam and Vaihingen datasets, respectively.

4.4. Results and Analysis

4.4.1. Comparison with State-of-the-art Methods

In this study, we conducted a series of comparative experiments on three datasets and achieved highly promising results. Our analysis primarily centered around evaluating the performance of various methods and techniques in addressing the given problem. The experiments were meticulously designed to compare the accuracy of different approaches and determine the most effective ones. The obtained results clearly indicate that our proposed method surpasses the other methods in terms of accuracy, as demonstrated in Table 1 and Table 2.
The tables present the Intersection over Union (IoU) values for each category and the mean IoU (mIoU) for all categories obtained with different models. Firstly, it is evident that the classic semantic segmentation networks, such as SegNet, FCN, and DeepLab, which were not specifically designed for remote sensing images, yield unsatisfactory results. Particularly for low vegetation/grass and trees, two easily confused targets, SegNet and DeepLab exhibit the lowest IoU, both below 70. Conversely, all models specifically tailored for remote sensing achieve an IoU higher than 70 for all categories. This can be attributed to the fact that these methods take into account the unique characteristics of remote sensing images. Notably, the proposed HRFNet in this study attains an IoU higher than 80 for nearly all categories, surpassing all other methods. Specifically, we achieve mIoU values of 86.47 and 83.31 on the two datasets, which are nearly 10 percentage points higher than the classic segmentation model FCN and the DeepLab v3+ network. When compared to DANet, LANet, and other models designed for remote sensing image segmentation, our method still demonstrates a 1-2 percentage point improvement in mIoU. Out of these improvements, our method shows a 1.5 percentage point enhancement for low vegetation/grass and trees. Moreover, improvements can also be observed to varying degrees for building and car categories. We attribute these improvements to the fusion of feature maps from different layers, as our method effectively captures local detail features such as edges outside the discriminative region of the target.
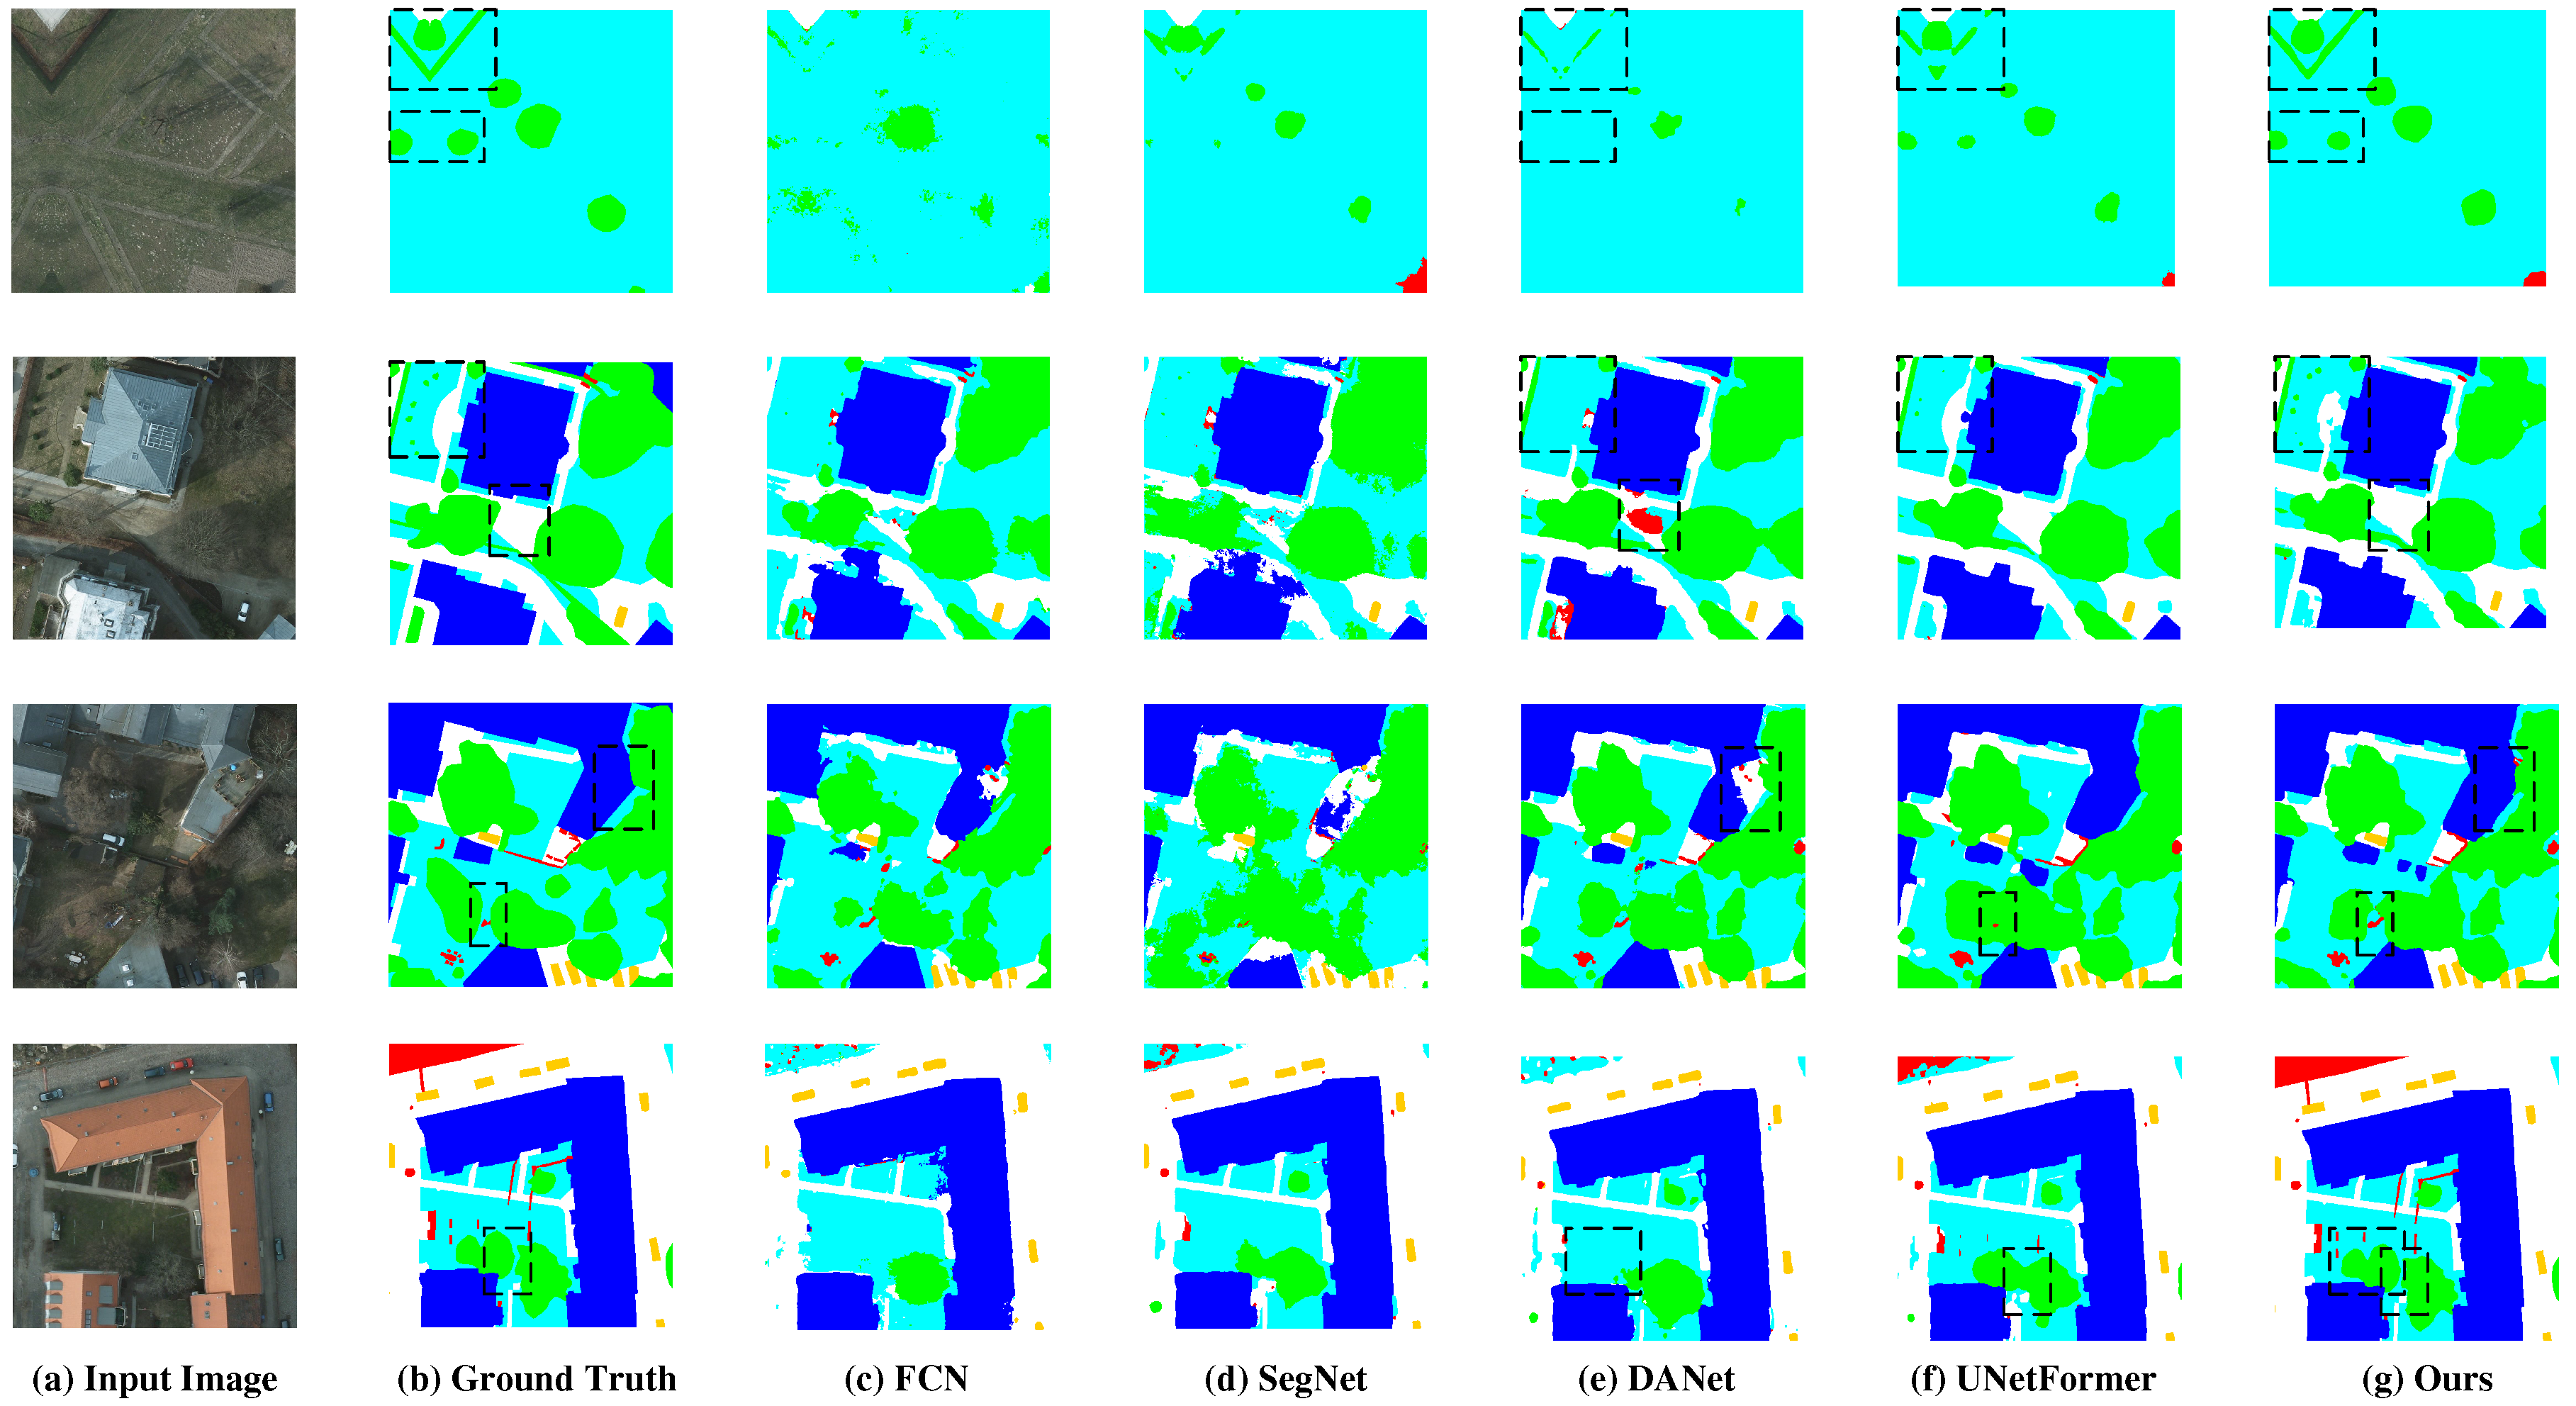
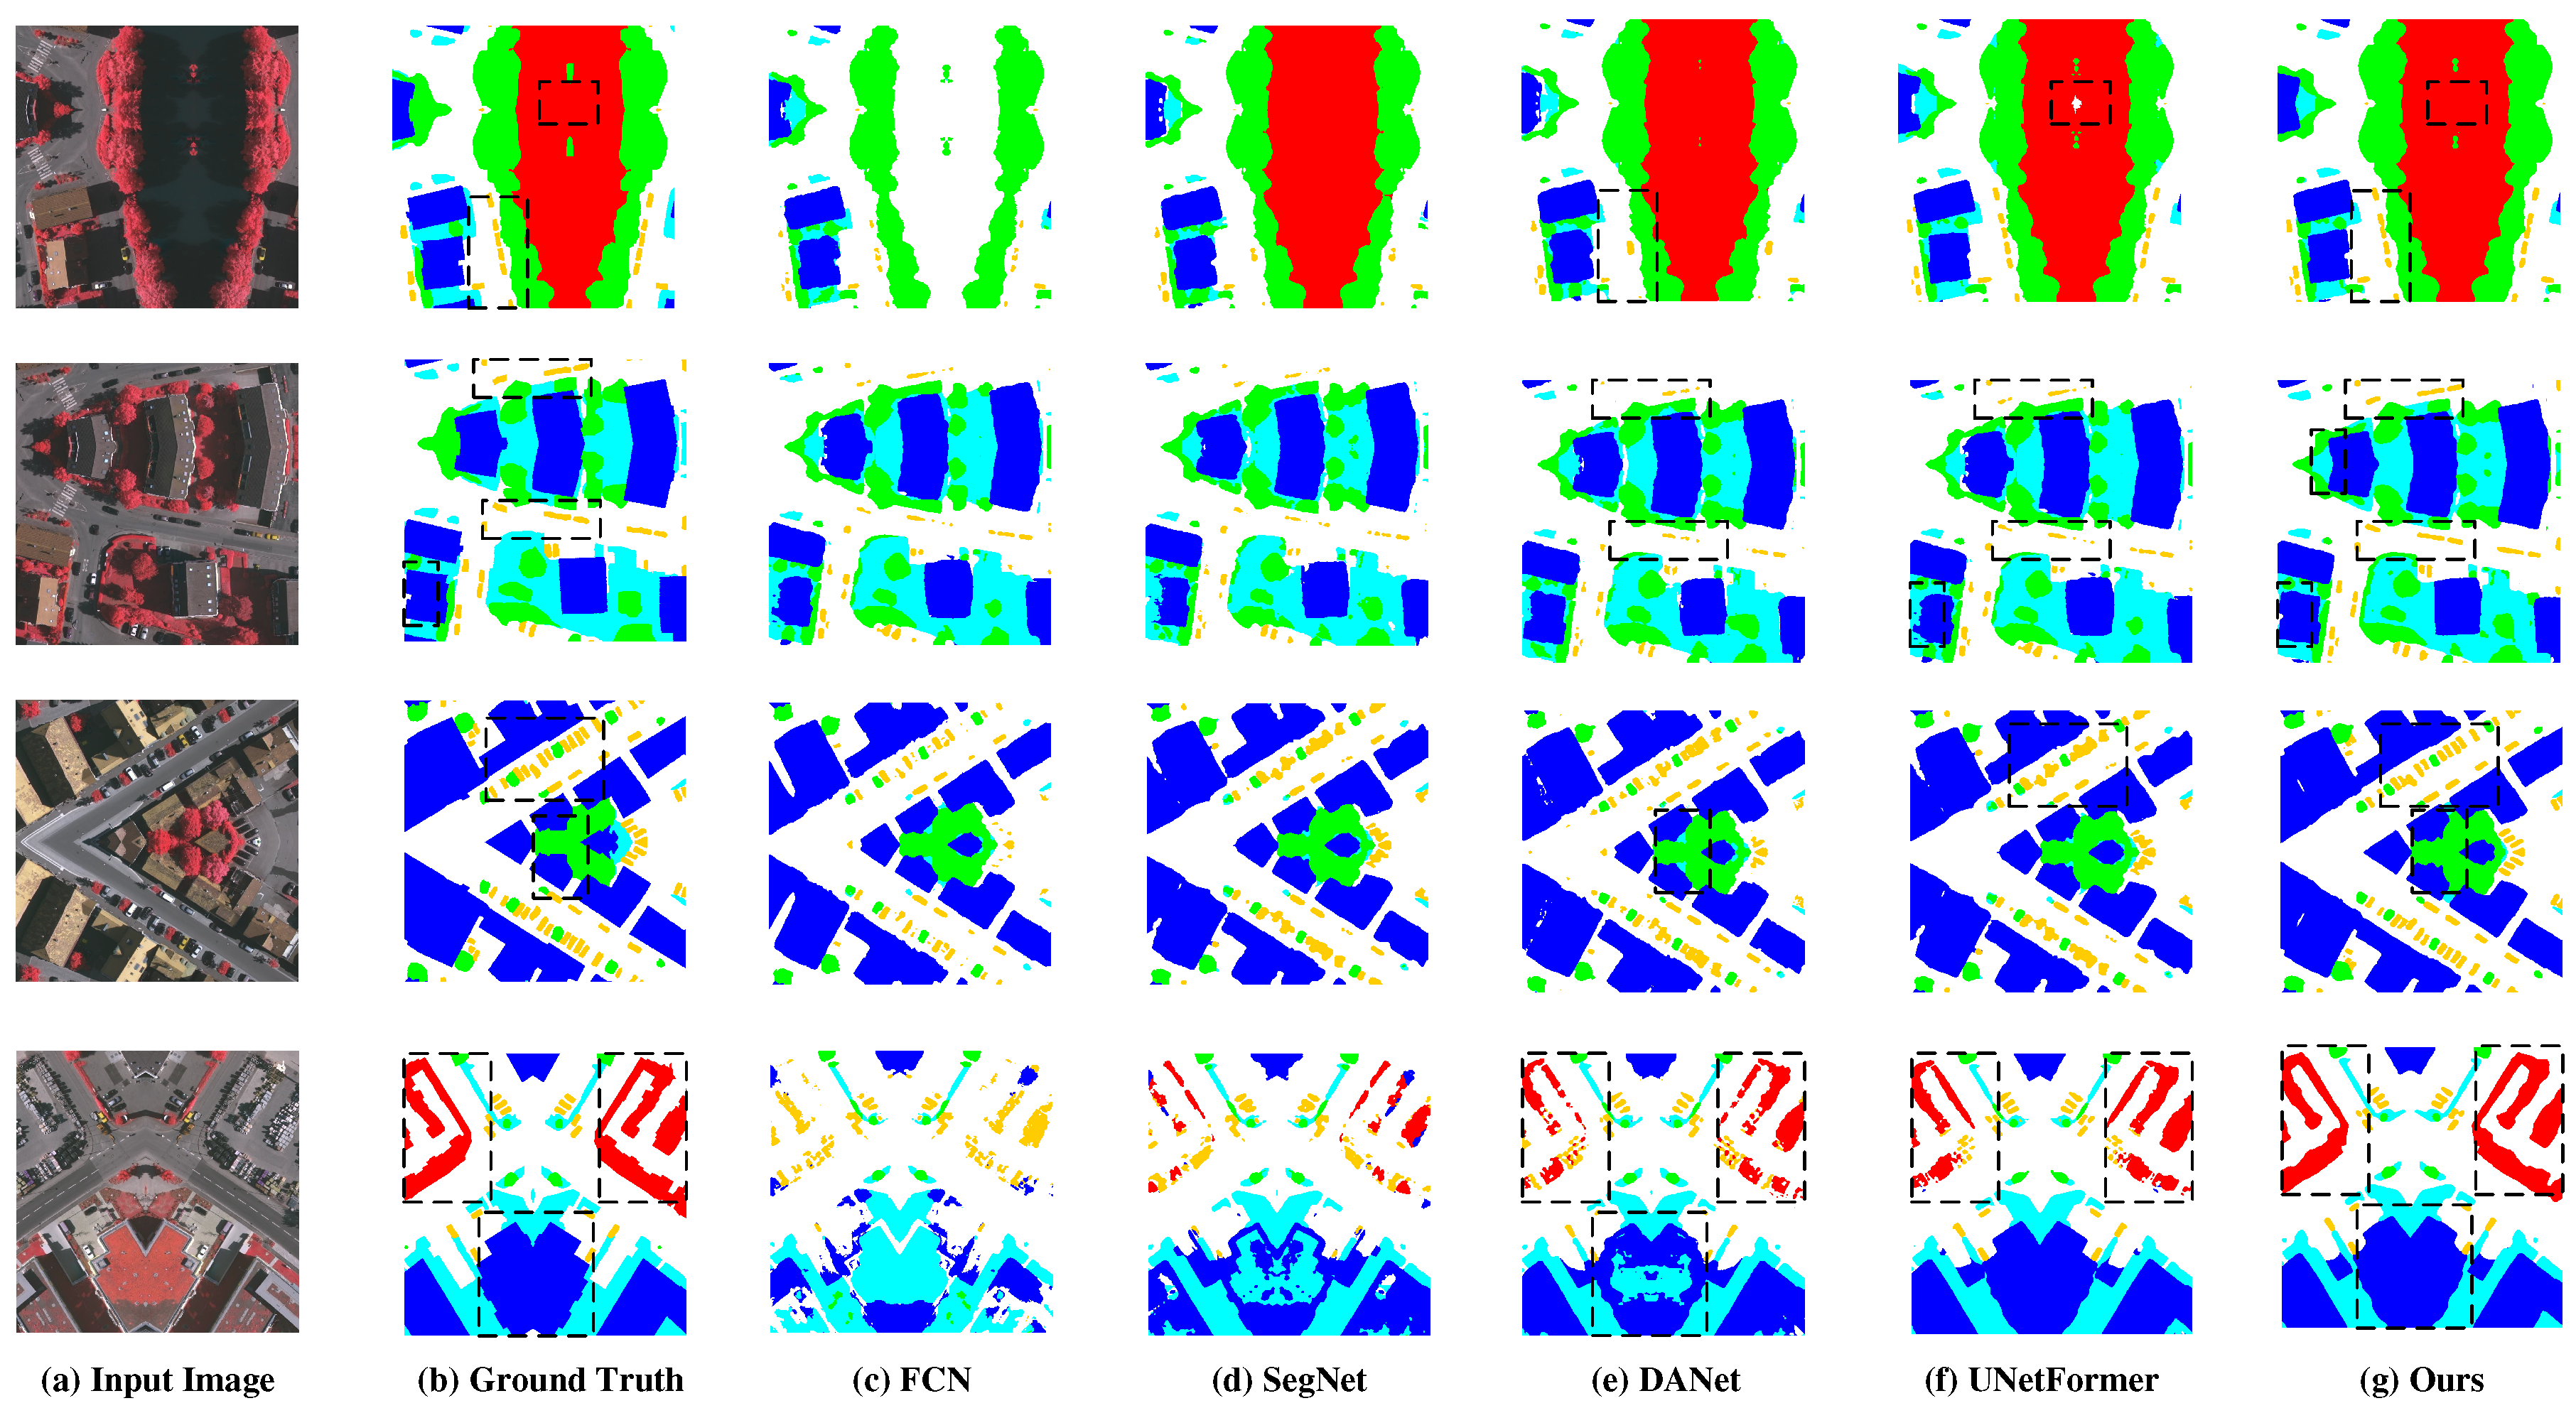
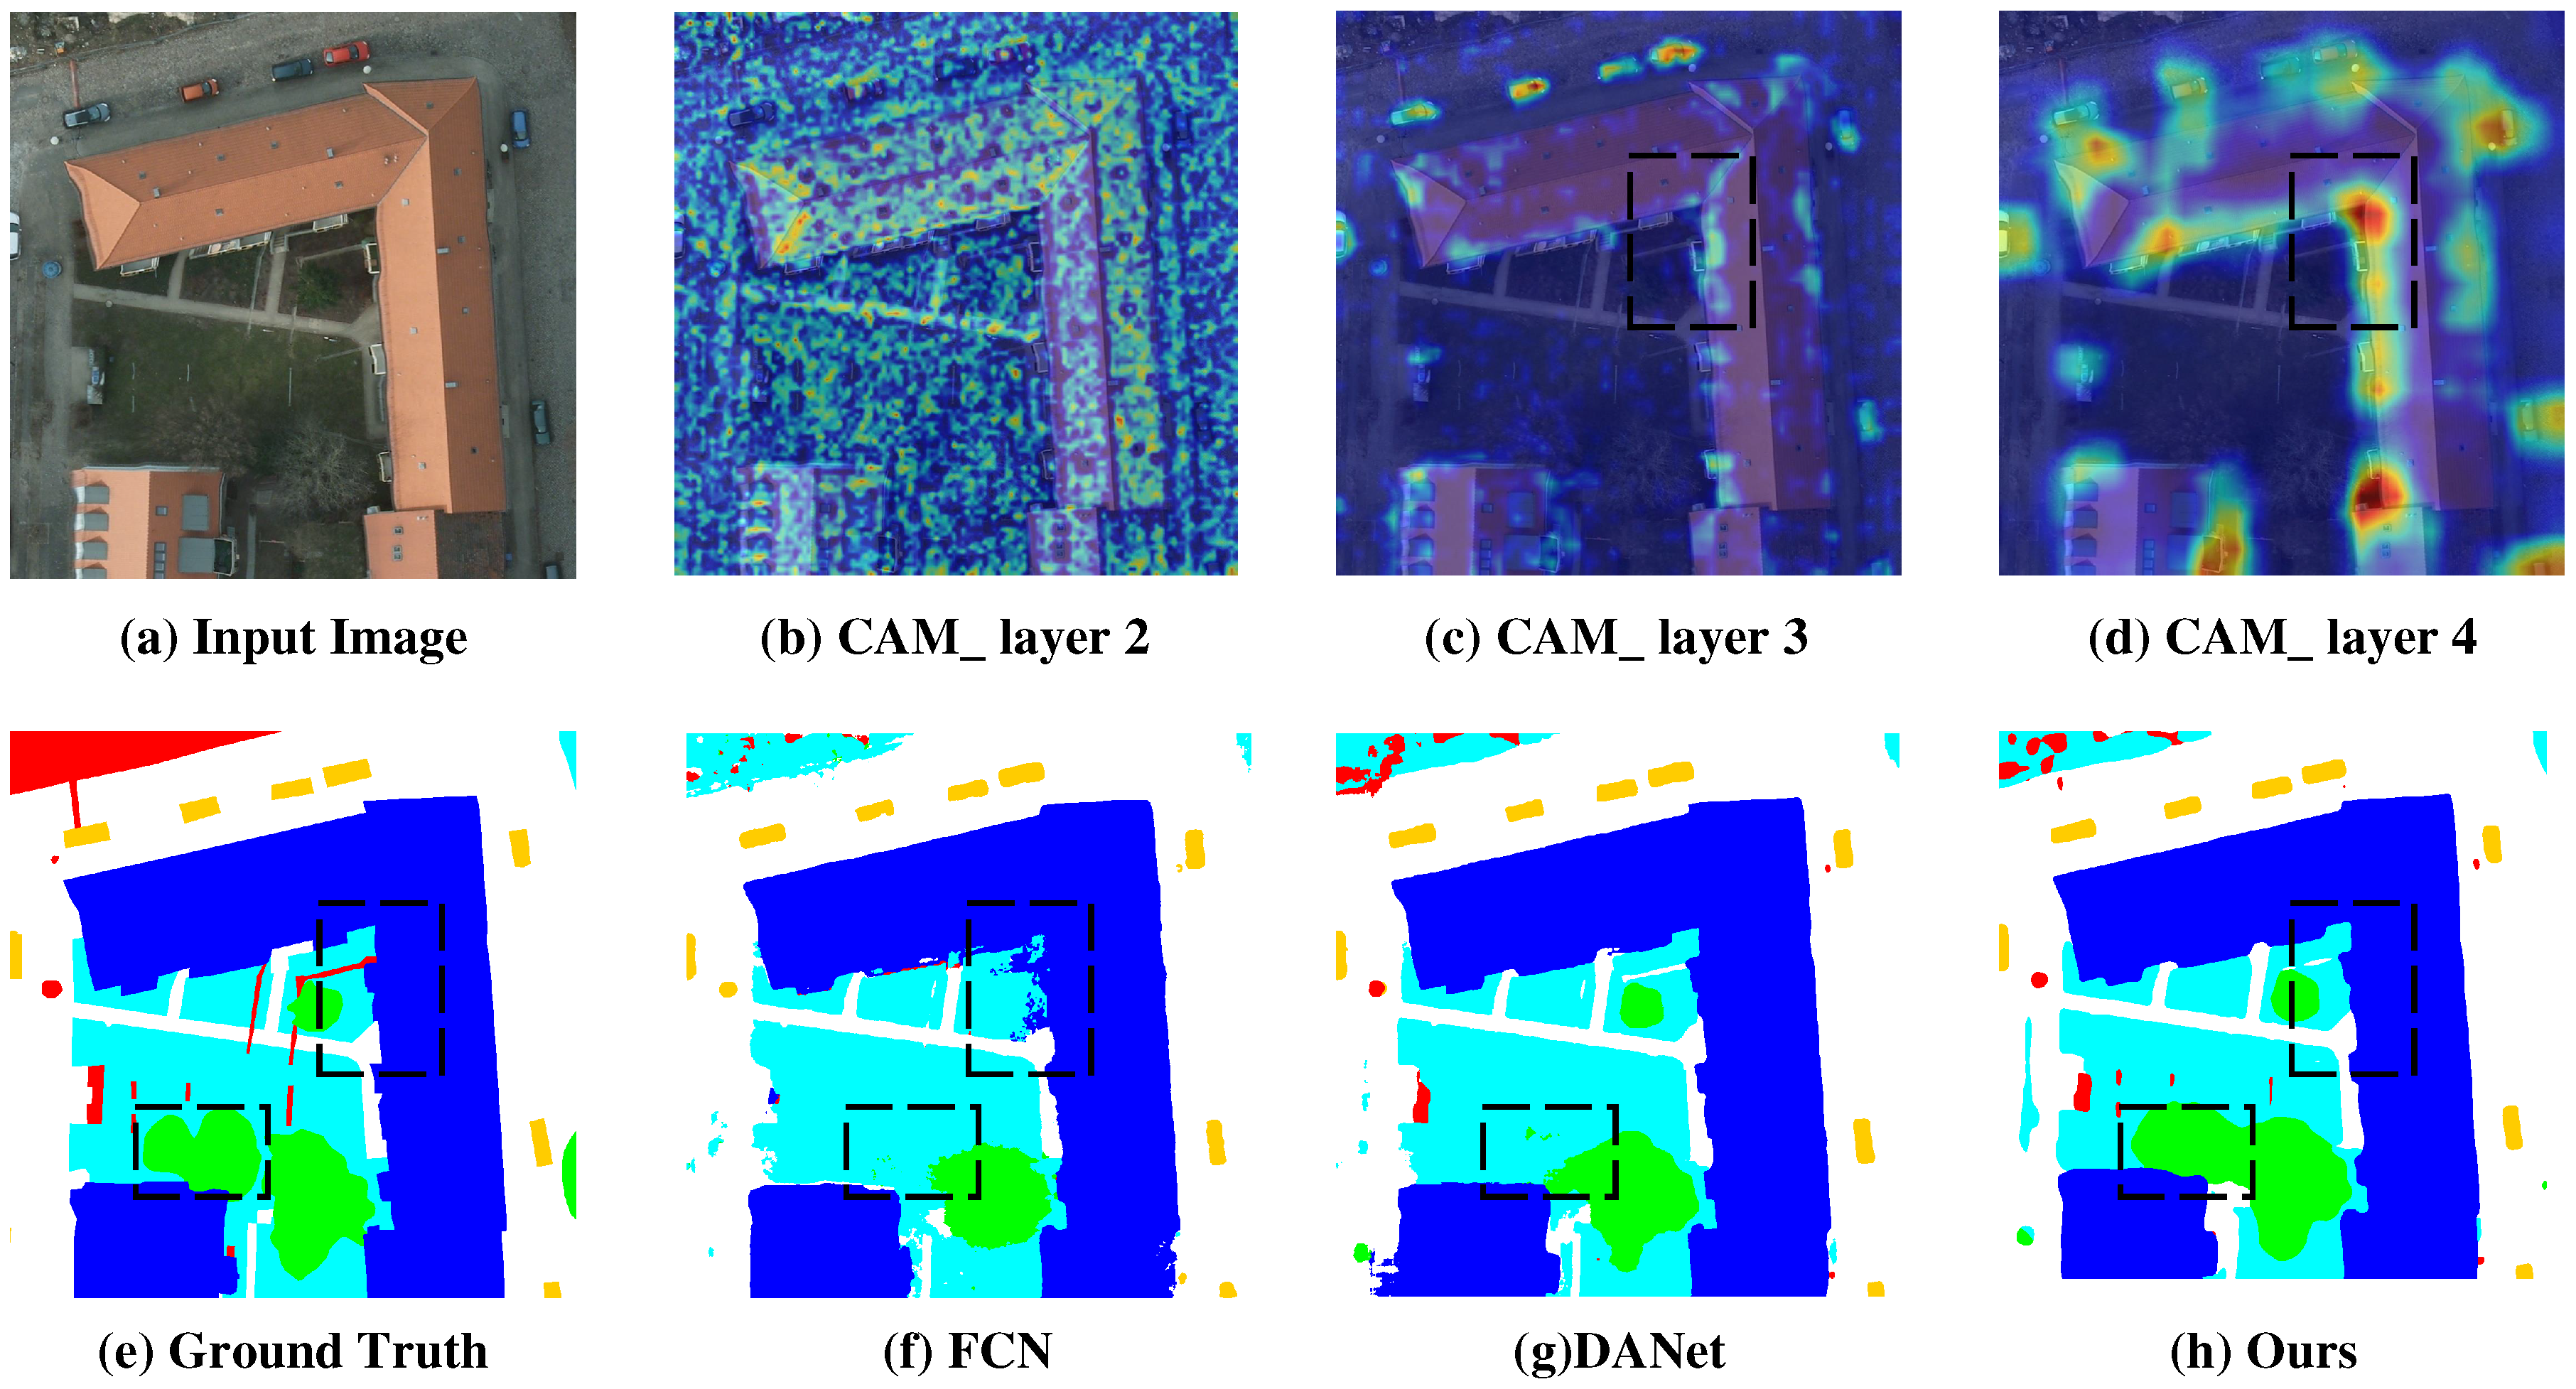
Quantitative analysis shows the performence of the model. In addition, we also perform a visual qualitative analysis of the segmentation effect of the model. The visualization of results in two datasets are shown in as shown in Figure 8 and Figure 9. Where the first column is the input image, the second column is ground truth, the middle four columns are the segmentation results of other methods, and the last column is our segmentation results. It can be seen that the HRFNet proposed in this article and the models designed specifically for remote sensing images, UNetFormer and DANet, have good segmentation results. Especially, HRFNet has excellent segmentation results on low vegetation/grass and car. For low vegetation/grass, HRFNet has clear edges and no obvious defects inside the target. As well as for car with clear edges and leaves little to be missed.
Furthermore, we extracted feature maps at different layers and visualized them, as illustrated in Figure 10. It is evident that for the low vegetation/grass category, it predominantly occupies the significant areas, albeit with less clear edges. In certain locations, misclassification occurred where parts of other objects were mistakenly identified as low vegetation/grass, while in other areas, the object was not entirely encompassed. To address these issues, our method incorporates a fusion of feature maps from multiple layers, thereby maximizing the exploration of discriminative regions while preserving sharper edges.

4.4.2. Ablation Experiments and Analysis

In order to evaluate the performance of our proposed IRM and rich-scale intra-layer feature enhancement methods, taking into account computational resources and experimental efficiency, we conducted ablation experiments on the Vaihingen dataset.
Ablation experiments of IRM. The Intra-Region Mining (IRM) module within our proposed HRFNet quantifies the information content at different locations within the image. Leveraging this information, the subsequent intra-layer rich-scale feature enhancement method extracts features from different locations within each layer to fuse multi-scale context. To demonstrate the effectiveness of IRM, we conducted comprehensive experiments. Firstly, we designed ablation experiments to investigate the impact of the number of Rn (inter-layer feature fusion modules) on the segmentation results. When Rn=1, IRM is not utilized, and the 2-layer feature maps from DeepLab v3+ with Res2Net as the backbone are uniformly employed for the subgraphs. In this case, only Res2Net50 is used for multi-scale feature extraction as the baseline. Additionally, when Rn is 2 and 3, the corresponding layer 2 and 3 feature maps, and layer 2, layer 3, and layer 4 feature maps are utilized, respectively.
The experiments demonstrated that increasing the number of Rn and fused inter-layer feature maps has a significant positive impact on the segmentation results within a certain range. As shown in Table 3, simply replacing the ResNet backbone network with Res2Net resulted in an improvement of nearly 1 percentage point in the segmentation results, highlighting the effectiveness of our HRFNet design. Specifically, by utilizing fine-grained multiple receptive fields for feature extraction from feature maps, IoU showed improvements across all categories. For instance, IoU increased by nearly 1 percentage point for invisible surfaces, Trees, and low vegetation/grass with significant differences in shape and range, and by 0.6 for buildings. Notably, there was a remarkable improvement in the extraction of dense small objects, achieving a 2.3 IoU with finer-grained receptive fields. Consequently, mIoU increased by more than 1 percentage point.
Furthermore, the experiments confirmed that our approach, inspired by Res2Net, effectively extracts multi-scale features from feature maps at a finer granularity. As shown in Table 3, when the fused feature layers are fixed, the segmentation results improve to varying degrees with an increase in Rn. Specifically, when two-layer feature maps are used for feature fusion (Rn=2), differential feature extraction and fusion on two subgraphs with different levels of information lead to improvements compared to ordinary two-layer feature map fusion on the entire image. This approach involves dividing the image into two sub-images for different feature extraction. In comparison to using two-layer feature maps for feature extraction on the entire image using the original network, improvements were observed in buildings, cars, and low vegetation/grass, particularly in cars where IoU increased by nearly 0.6. Similarly, when three-layer feature maps were used and the image was divided into three sub-images for feature extraction, improvements in IoU were observed for impermeable surfaces, buildings, and cars, particularly in cars where IoU increased by nearly 0.7. Moreover, when four-layer feature maps were employed and the image was divided into four fine-grained subgraphs, the mIoU of feature extraction improved by nearly 0.6 and nearly 0.4 compared to the entire image and two subgraphs, respectively. Notably, in the case of cars, IoU increased by nearly 2 percentage points and nearly 2.4, while impermeability also increased by nearly 0.7 and 0.2, respectively. Interestingly, when Rn is 4, simply fusing the four-layer feature maps of the entire image yielded similar mIoU results as when Rn is 3 and different feature extraction and fusion are performed on the feature maps. This fully demonstrates the effectiveness of differential processing on different regions of the image.
Ablation experiments of IRFE. Our IRFE module consists of two main parts: Intra-layer Rich-scale Feature Extraction and Inter- and Intra-layer Feature Fusion. To evaluate the effectiveness of these components, we conducted separate ablation studies on inter-layer feature fusion and intra-layer feature fusion, as shown in Table 4 and Table 5, respectively. These experiments aimed to analyze the impact of each component on the segmentation results and demonstrate their effectiveness in enhancing the performance of our proposed model.
Firstly, in the evaluation of inter-layer feature fusion, we explored the impact of different fused feature maps by varying the values of Rn. The results are presented in Table 4. We observed that feature maps from different layers contribute differently to the segmentation results. Through experimentation, we found that the 3rd and 4th layer feature maps had the most significant contribution, while the 1st and 2nd layer feature maps also showed some improvement. Specifically, when using the first two layers of feature maps, the mIoU on the Vaihingen dataset was 81.84. Replacing the first layer feature maps with the third and fourth layers respectively resulted in an improvement of nearly 1 point in the segmentation results. This improvement was approximately 0.5 for impervious surfaces, trees, and low vegetation/grass, and around 2 percentage points for buildings and cars. When the last two layers of feature maps were used, the mIoU increased by 1.1 compared to using only the first two layers of feature maps. For each of the five categories, the IoU for impervious surfaces increased by approximately 0.7, while buildings, trees, and low vegetation/grass increased by approximately 1 percentage point, and cars increased by nearly 2 percentage points. Finally, when all four layers of feature maps were utilized, the segmentation result achieved the highest mIoU of 83.31. In this case, the IoU for impervious surfaces increased.
In addition, for the evaluation of intra-layer feature fusion, we first utilized the final feature map of the subgraph and directly concatenated the intra-layer feature maps as the baseline. The results are shown in Table 5. It was observed that the direct concatenation of subgraphs yielded the worst segmentation results, with discontinuous edges and even some targets not forming independent bounding boxes. However, after performing simple edge smoothing, the segmentation results improved. Furthermore, our proposed intra-layer feature fusion module significantly improved the results. This demonstrates the effectiveness of our proposed approach in fully preserving detailed information in feature subgraphs during stitching. Specifically, by simply smoothing the edges, the segmentation results for impervious surfaces improved by 0.25, the IoU for trees increased by nearly 0.7, and the results for cars and low vegetation improved by 0.44 and 46,. Ultimately, mIoU increased by 0.33. Surprisingly the results for the building category actually decreased. This may be due to mistakenly sliding a portion of the targets that belong to the building into non-building categories during edge smoothing, and vice versa. However, after incorporating our intra-layer feature fusion module, the mIoU increased by an additional 0.47. Compared to directly concatenating-layer feature maps, our method a total of .8 percentage points in mIoU. Notably, the increase in IoU for cars was the largest, with a surprising 2.23 improvement. Additionally, there was a 0.68 increase for low vegetation, 0.5 increase for trees, and 0.43 increase for impious surfaces Similar to the smoothing approach, the building category have been affected by incorrect feature maps, resulting in a decrease in the results.

5. Conclusion

In this study, we propose a novel Hierarchical Rich-scale Fusion framework (HRFNet) for semantic segmentation of high-resolution remote sensing images. The framework addresses the challenge of varying information content across different positions in the image by incorporating an information quantification and rating module, based on IRM. This module enables the adaptive extraction of multi-layer high-level semantic features and low-level features at different positions in the image. Additionally, our approach utilizes inter-layer and intra-layer multi-scale feature extraction and fusion techniques to capture information in high-resolution remote sensing images. Extensive experiments conducted on the ISPRS Vaihingen and Potsdam datasets demonstrate the effectiveness of our proposed method. The results show that HRFNet achieves superior segmentation performance compared to existing approaches.
In future research, we plan to extend our intra-layer rich-scale feature enhancement to networks that utilize richer contextual information, such as Transformer graph networks. This will enable us to achieve even better segmentation results by leveraging the enhanced feature representation provided by our framework.

Conflicts of Interest

The authors declare no conflict of interest.

References

  1. Xu, H.; Song, J.; Zhu, Y. Evaluation and Comparison of Semantic Segmentation Networks for Rice Identification Based on Sentinel-2 Imagery. Remote Sensing 2023, 15, 1499. [Google Scholar] [CrossRef]
  2. Hao, X.; Yin, L.; Li, X.; Zhang, L.; Yang, R. A Multi-Objective Semantic Segmentation Algorithm Based on Improved U-Net Networks. Remote Sensing 2023, 15, 1838. [Google Scholar] [CrossRef]
  3. Zhang, Y.; Lu, H.; Ma, G.; Zhao, H.; Xie, D.; Geng, S.; Tian, W.; Sian, K.T.C.L.K. MU-Net: Embedding MixFormer into Unet to Extract Water Bodies from Remote Sensing Images. Remote Sens. 2023, 15, 3559. [Google Scholar] [CrossRef]
  4. He, C.; Liu, Y.; Wang, D.; Liu, S.; Yu, L.; Ren, Y. Automatic Extraction of Bare Soil Land from High-Resolution Remote Sensing Images Based on Semantic Segmentation with Deep Learning. Remote Sensing 2023, 15, 1646. [Google Scholar] [CrossRef]
  5. Ju, Y.; Xu, Q.; Jin, S.; Li, W.; Su, Y.; Dong, X.; Guo, Q. Loess Landslide Detection Using Object Detection Algorithms in Northwest China. Remote Sensing 2022, 14, 1182. [Google Scholar] [CrossRef]
  6. Fu, X.; Shen, F.; Du, X.; Li, Z. Bag of Tricks for “Vision Meet Alage” Object Detection Challenge. 2022 6th International Conference on Universal Village (UV). IEEE, 2022, pp. 1–4.
  7. Maulik, U.; Saha, I. Automatic Fuzzy Clustering Using Modified Differential Evolution for Image Classification. IEEE transactions on Geoscience and Remote sensing 2010, 48, 3503–3510. [Google Scholar] [CrossRef]
  8. Yang, M.D.; Huang, K.S.; Kuo, Y.H.; Tsai, H.P.; Lin, L.M. Spatial and Spectral Hybrid Image Classification for Rice Lodging Assessment through UAV Imagery. Remote Sensing 2017, 9, 583. [Google Scholar] [CrossRef]
  9. Guo, Y.; Jia, X.; Paull, D. Effective Sequential Classifier Training for SVM-based Multitemporal Remote Sensing Image Classification. IEEE Transactions on Image Processing 2018, 27, 3036–3048. [Google Scholar] [CrossRef] [PubMed]
  10. Huang, X.; Zhang, L. An SVM Ensemble Approach Combining Spectral, Structural, and Semantic Features for the Classification of High-Resolution Remotely Sensed Imagery. IEEE transactions on geoscience and remote sensing 2012, 51, 257–272. [Google Scholar] [CrossRef]
  11. Long, J.; Shelhamer, E.; Darrell, T. Fully Convolutional Networks for Semantic Segmentation. Proceedings of the IEEE Conference on Computer Vision and Pattern Recognition, 2015, pp. 3431–3440.
  12. Sun, W.; Wang, R. Fully Convolutional Networks for Semantic Segmentation of Very High Resolution Remotely Sensed Images Combined with DSM. IEEE Geoscience and Remote Sensing Letters 2018, 15, 474–478. [Google Scholar] [CrossRef]
  13. Dosovitskiy, A.; Beyer, L.; Kolesnikov, A.; Weissenborn, D.; Zhai, X.; Unterthiner, T.; Dehghani, M.; Minderer, M.; Heigold, G.; Gelly, S. An Image Is Worth 16x16 Words: Transformers for Image Recognition at Scale. arXiv preprint, arXiv:2010.11929 2020, [2010.11929].
  14. Chen, L.C.; Papandreou, G.; Kokkinos, I.; Murphy, K.; Yuille, A.L. Semantic Image Segmentation with Deep Convolutional Nets and Fully Connected Crfs. arXiv preprint, arXiv:1412.7062 2014, [1412.7062].
  15. Yu, F.; Koltun, V. Multi-Scale Context Aggregation by Dilated Convolutions. arXiv preprint, arXiv:1511.07122 2015, [1511.07122].
  16. Peng, C.; Zhang, X.; Yu, G.; Luo, G.; Sun, J. Large Kernel Matters–Improve Semantic Segmentation by Global Convolutional Network. Proceedings of the IEEE Conference on Computer Vision and Pattern Recognition, 2017, pp. 4353–4361.
  17. Kirillov, A.; Girshick, R.; He, K.; Dollár, P. Panoptic Feature Pyramid Networks. Proceedings of the IEEE/CVF Conference on Computer Vision and Pattern Recognition, 2019, pp. 6399–6408.
  18. Wang, X.; Girshick, R.; Gupta, A.; He, K. Non-Local Neural Networks. Proceedings of the IEEE Conference on Computer Vision and Pattern Recognition, 2018, pp. 7794–7803.
  19. Fu, J.; Liu, J.; Tian, H.; Li, Y.; Bao, Y.; Fang, Z.; Lu, H. Dual Attention Network for Scene Segmentation. Proceedings of the IEEE/CVF Conference on Computer Vision and Pattern Recognition, 2019, pp. 3146–3154.
  20. Liu, Z.; Lin, Y.; Cao, Y.; Hu, H.; Wei, Y.; Zhang, Z.; Lin, S.; Guo, B. Swin Transformer: Hierarchical Vision Transformer Using Shifted Windows. Proceedings of the IEEE/CVF International Conference on Computer Vision, 2021, pp. 10012–10022.
  21. Strudel, R.; Garcia, R.; Laptev, I.; Schmid, C. Segmenter: Transformer for Semantic Segmentation. Proceedings of the IEEE/CVF International Conference on Computer Vision, 2021, pp. 7262–7272.
  22. Ronneberger, O.; Fischer, P.; Brox, T. U-Net: Convolutional Networks for Biomedical Image Segmentation. Medical Image Computing and Computer-Assisted Intervention–MICCAI 2015: 18th International Conference, Munich, Germany, 5–9 October 2015, Proceedings, Part III 18. Springer, 2015, pp. 234–241.
  23. Chen, L.C.; Papandreou, G.; Kokkinos, I.; Murphy, K.; Yuille, A.L. Deeplab: Semantic Image Segmentation with Deep Convolutional Nets, Atrous Convolution, and Fully Connected Crfs. IEEE transactions on pattern analysis and machine intelligence 2017, 40, 834–848. [Google Scholar] [CrossRef] [PubMed]
  24. Chen, L.C.; Papandreou, G.; Schroff, F.; Adam, H. Rethinking Atrous Convolution for Semantic Image Segmentation. arXiv preprint, arXiv:1706.05587 2017, [1706.05587].
  25. Chen, L.C.; Zhu, Y.; Papandreou, G.; Schroff, F.; Adam, H. Encoder-Decoder with Atrous Separable Convolution for Semantic Image Segmentation. Proceedings of the European Conference on Computer Vision (ECCV), 2018, pp. 801–818.
  26. Long, J.; Li, M.; Wang, X. Integrating Spatial Details With Long-Range Contexts for Semantic Segmentation of Very High-Resolution Remote-Sensing Images. IEEE Geoscience and Remote Sensing Letters 2023, 20, 1–5. [Google Scholar] [CrossRef]
  27. Shen, F.; Lin, L.; Wei, M.; Liu, J.; Zhu, J.; Zeng, H.; Cai, C.; Zheng, L. A large benchmark for fabric image retrieval. 2019 IEEE 4th International Conference on Image, Vision and Computing (ICIVC). IEEE, 2019, pp. 247–251.
  28. Jin, H.; Bao, Z.; Chang, X.; Zhang, T.; Chen, C. Semantic Segmentation of Remote Sensing Images Based on Dilated Convolution and Spatial-Channel Attention Mechanism. Journal of Applied Remote Sensing 2023, 17, 016518–016518. [Google Scholar] [CrossRef]
  29. Tan, X.; Xiao, Z.; Zhang, Y.; Wang, Z.; Qi, X.; Li, D. Context-Driven Feature-Focusing Network for Semantic Segmentation of High-Resolution Remote Sensing Images. Remote Sensing 2023, 15, 1348. [Google Scholar] [CrossRef]
  30. Wang, L.; Li, R.; Zhang, C.; Fang, S.; Duan, C.; Meng, X.; Atkinson, P.M. UNetFormer: A UNet-like Transformer for Efficient Semantic Segmentation of Remote Sensing Urban Scene Imagery. ISPRS Journal of Photogrammetry and Remote Sensing 2022, 190, 196–214. [Google Scholar] [CrossRef]
  31. Xu, R.; Shen, F.; Wu, H.; Zhu, J.; Zeng, H. Dual modal meta metric learning for attribute-image person re-identification. 2021 IEEE International Conference on Networking, Sensing and Control (ICNSC). IEEE, 2021, Vol. 1, pp. 1–6.
  32. Liu, J.; Shen, F.; Wei, M.; Zhang, Y.; Zeng, H.; Zhu, J.; Cai, C. A Large-Scale Benchmark for Vehicle Logo Recognition. 2019 IEEE 4th International Conference on Image, Vision and Computing (ICIVC). IEEE, 2019, pp. 479–483.
  33. Yang, Y.; Dong, J.; Wang, Y.; Yu, B.; Yang, Z. DMAU-Net: An Attention-Based Multiscale Max-Pooling Dense Network for the Semantic Segmentation in VHR Remote-Sensing Images. Remote Sensing 2023, 15, 1328. [Google Scholar] [CrossRef]
  34. Zhang, Y.; Zhao, H.; Ma, G.; Xie, D.; Geng, S.; Lu, H.; Tian, W.; Lim Kam Sian, K.T.C. MAAFEU-Net: A Novel Land Use Classification Model Based on Mixed Attention Module and Adjustable Feature Enhancement Layer in Remote Sensing Images. ISPRS International Journal of Geo-Information 2023, 12, 206. [Google Scholar] [CrossRef]
  35. Xiao, R.; Zhong, C.; Zeng, W.; Cheng, M.; Wang, C. Novel Convolutions for Semantic Segmentation of Remote Sensing Images. IEEE Transactions on Geoscience and Remote Sensing 2023. [Google Scholar] [CrossRef]
  36. Shen, F.; Zhu, J.; Zhu, X.; Huang, J.; Zeng, H.; Lei, Z.; Cai, C. An Efficient Multiresolution Network for Vehicle Reidentification. IEEE Internet of Things Journal 2021, 9, 9049–9059. [Google Scholar] [CrossRef]
  37. Shen, F.; Peng, X.; Wang, L.; Zhang, X.; Shu, M.; Wang, Y. HSGM: A Hierarchical Similarity Graph Module for Object Re-identification. 2022 IEEE International Conference on Multimedia and Expo (ICME). IEEE, 2022, pp. 1–6.
  38. Shen, F.; Wei, M.; Ren, J. HSGNet: Object Re-identification with Hierarchical Similarity Graph Network. arXiv preprint, arXiv:2211.05486 2022.
  39. Wu, H.; Shen, F.; Zhu, J.; Zeng, H.; Zhu, X.; Lei, Z. A sample-proxy dual triplet loss function for object re-identification. IET Image Processing 2022, 16, 3781–3789. [Google Scholar] [CrossRef]
  40. Li, R.; Duan, C.; Zheng, S.; Zhang, C.; Atkinson, P.M. MACU-Net for Semantic Segmentation of Fine-Resolution Remotely Sensed Images. IEEE Geoscience and Remote Sensing Letters 2022, 19, 1–5. [Google Scholar] [CrossRef]
  41. Xie, Y.; Shen, F.; Zhu, J.; Zeng, H. Viewpoint robust knowledge distillation for accelerating vehicle re-identification. EURASIP Journal on Advances in Signal Processing 2021, 2021, 1–13. [Google Scholar] [CrossRef]
  42. Xu, R.; Wang, C.; Zhang, J.; Xu, S.; Meng, W.; Zhang, X. Rssformer: Foreground Saliency Enhancement for Remote Sensing Land-Cover Segmentation. IEEE Transactions on Image Processing 2023, 32, 1052–1064. [Google Scholar] [CrossRef] [PubMed]
  43. Qiao, C.; Shen, F.; Wang, X.; Wang, R.; Cao, F.; Zhao, S.; Li, C. A Novel Multi-Frequency Coordinated Module for SAR Ship Detection. 2022 IEEE 34th International Conference on Tools with Artificial Intelligence (ICTAI). IEEE, 2022, pp. 804–811.
  44. Shen, F.; Shu, X.; Du, X.; Tang, J. Pedestrian-specific Bipartite-aware Similarity Learning for Text-based Person Retrieval. Proceedings of the 31th ACM International Conference on Multimedia, 2023.
  45. Shen, F.; Xie, Y.; Zhu, J.; Zhu, X.; Zeng, H. Git: Graph interactive transformer for vehicle re-identification. IEEE Transactions on Image Processing 2023. [Google Scholar] [CrossRef] [PubMed]
  46. Li, M.; Wei, M.; He, X.; Shen, F. Enhancing Part Features via Contrastive Attention Module for Vehicle Re-identification. 2022 IEEE International Conference on Image Processing (ICIP). IEEE, 2022, pp. 1816–1820.
  47. Shen, F.; Zhu, J.; Zhu, X.; Xie, Y.; Huang, J. Exploring spatial significance via hybrid pyramidal graph network for vehicle re-identification. IEEE Transactions on Intelligent Transportation Systems 2021, 23, 8793–8804. [Google Scholar] [CrossRef]
  48. He, X.; Zhou, Y.; Zhao, J.; Zhang, D.; Yao, R.; Xue, Y. Swin Transformer Embedding UNet for Remote Sensing Image Semantic Segmentation. IEEE Transactions on Geoscience and Remote Sensing 2022, 60, 1–15. [Google Scholar] [CrossRef]
  49. Gao, S.H.; Cheng, M.M.; Zhao, K.; Zhang, X.Y.; Yang, M.H.; Torr, P. Res2net: A New Multi-Scale Backbone Architecture. IEEE transactions on pattern analysis and machine intelligence 2019, 43, 652–662. [Google Scholar] [CrossRef] [PubMed]
  50. Shen, F.; He, X.; Wei, M.; Xie, Y. A competitive method to vipriors object detection challenge. arXiv preprint, arXiv:2104.09059 2021.
  51. Shen, F.; Wang, Z.; Wang, Z.; Fu, X.; Chen, J.; Du, X.; Tang, J. A Competitive Method for Dog Nose-print Re-identification. arXiv preprint, arXiv:2205.15934 2022.
  52. Badrinarayanan, V.; Kendall, A.; Cipolla, R. Segnet: A Deep Convolutional Encoder-Decoder Architecture for Image Segmentation. IEEE transactions on pattern analysis and machine intelligence 2017, 39, 2481–2495. [Google Scholar] [CrossRef]
  53. Zhao, H.; Shi, J.; Qi, X.; Wang, X.; Jia, J. Pyramid Scene Parsing Network. Proceedings of the IEEE Conference on Computer Vision and Pattern Recognition, 2017, pp. 2881–2890.
  54. Zhou, Z.; Rahman Siddiquee, M.M.; Tajbakhsh, N.; Liang, J. Unet++: A Nested u-Net Architecture for Medical Image Segmentation. Deep Learning in Medical Image Analysis and Multimodal Learning for Clinical Decision Support: 4th International Workshop, DLMIA 2018, and 8th International Workshop, ML-CDS 2018, Held in Conjunction with MICCAI 2018, Granada, Spain, 20 September 2018, Proceedings 4. Springer, 2018, pp. 3–11.
  55. Yuan, Y.; Chen, X.; Wang, J. Object-Contextual Representations for Semantic Segmentation. Computer Vision–ECCV 2020: 16th European Conference, Glasgow, UK, 23–28 August 2020, Proceedings, Part VI 16. Springer, 2020, pp. 173–190.
  56. Li, S.; Han, K.; Costain, T.W.; Howard-Jenkins, H.; Prisacariu, V. Correspondence Networks with Adaptive Neighbourhood Consensus. Proceedings of the IEEE/CVF Conference on Computer Vision and Pattern Recognition, 2020, pp. 10196–10205.
  57. Li, R.; Zheng, S.; Duan, C.; Su, J.; Zhang, C. Multistage Attention ResU-Net for Semantic Segmentation of Fine-Resolution Remote Sensing Images. IEEE Geoscience and Remote Sensing Letters 2021, 19, 1–5. [Google Scholar] [CrossRef]
  58. Zheng, Z.; Zhong, Y.; Wang, J.; Ma, A. Foreground-Aware Relation Network for Geospatial Object Segmentation in High Spatial Resolution Remote Sensing Imagery. Proceedings of the IEEE/CVF Conference on Computer Vision and Pattern Recognition, 2020, pp. 4096–4105.
  59. Ding, L.; Tang, H.; Bruzzone, L. LANet: Local Attention Embedding to Improve the Semantic Segmentation of Remote Sensing Images. IEEE Transactions on Geoscience and Remote Sensing 2020, 59, 426–435. [Google Scholar] [CrossRef]
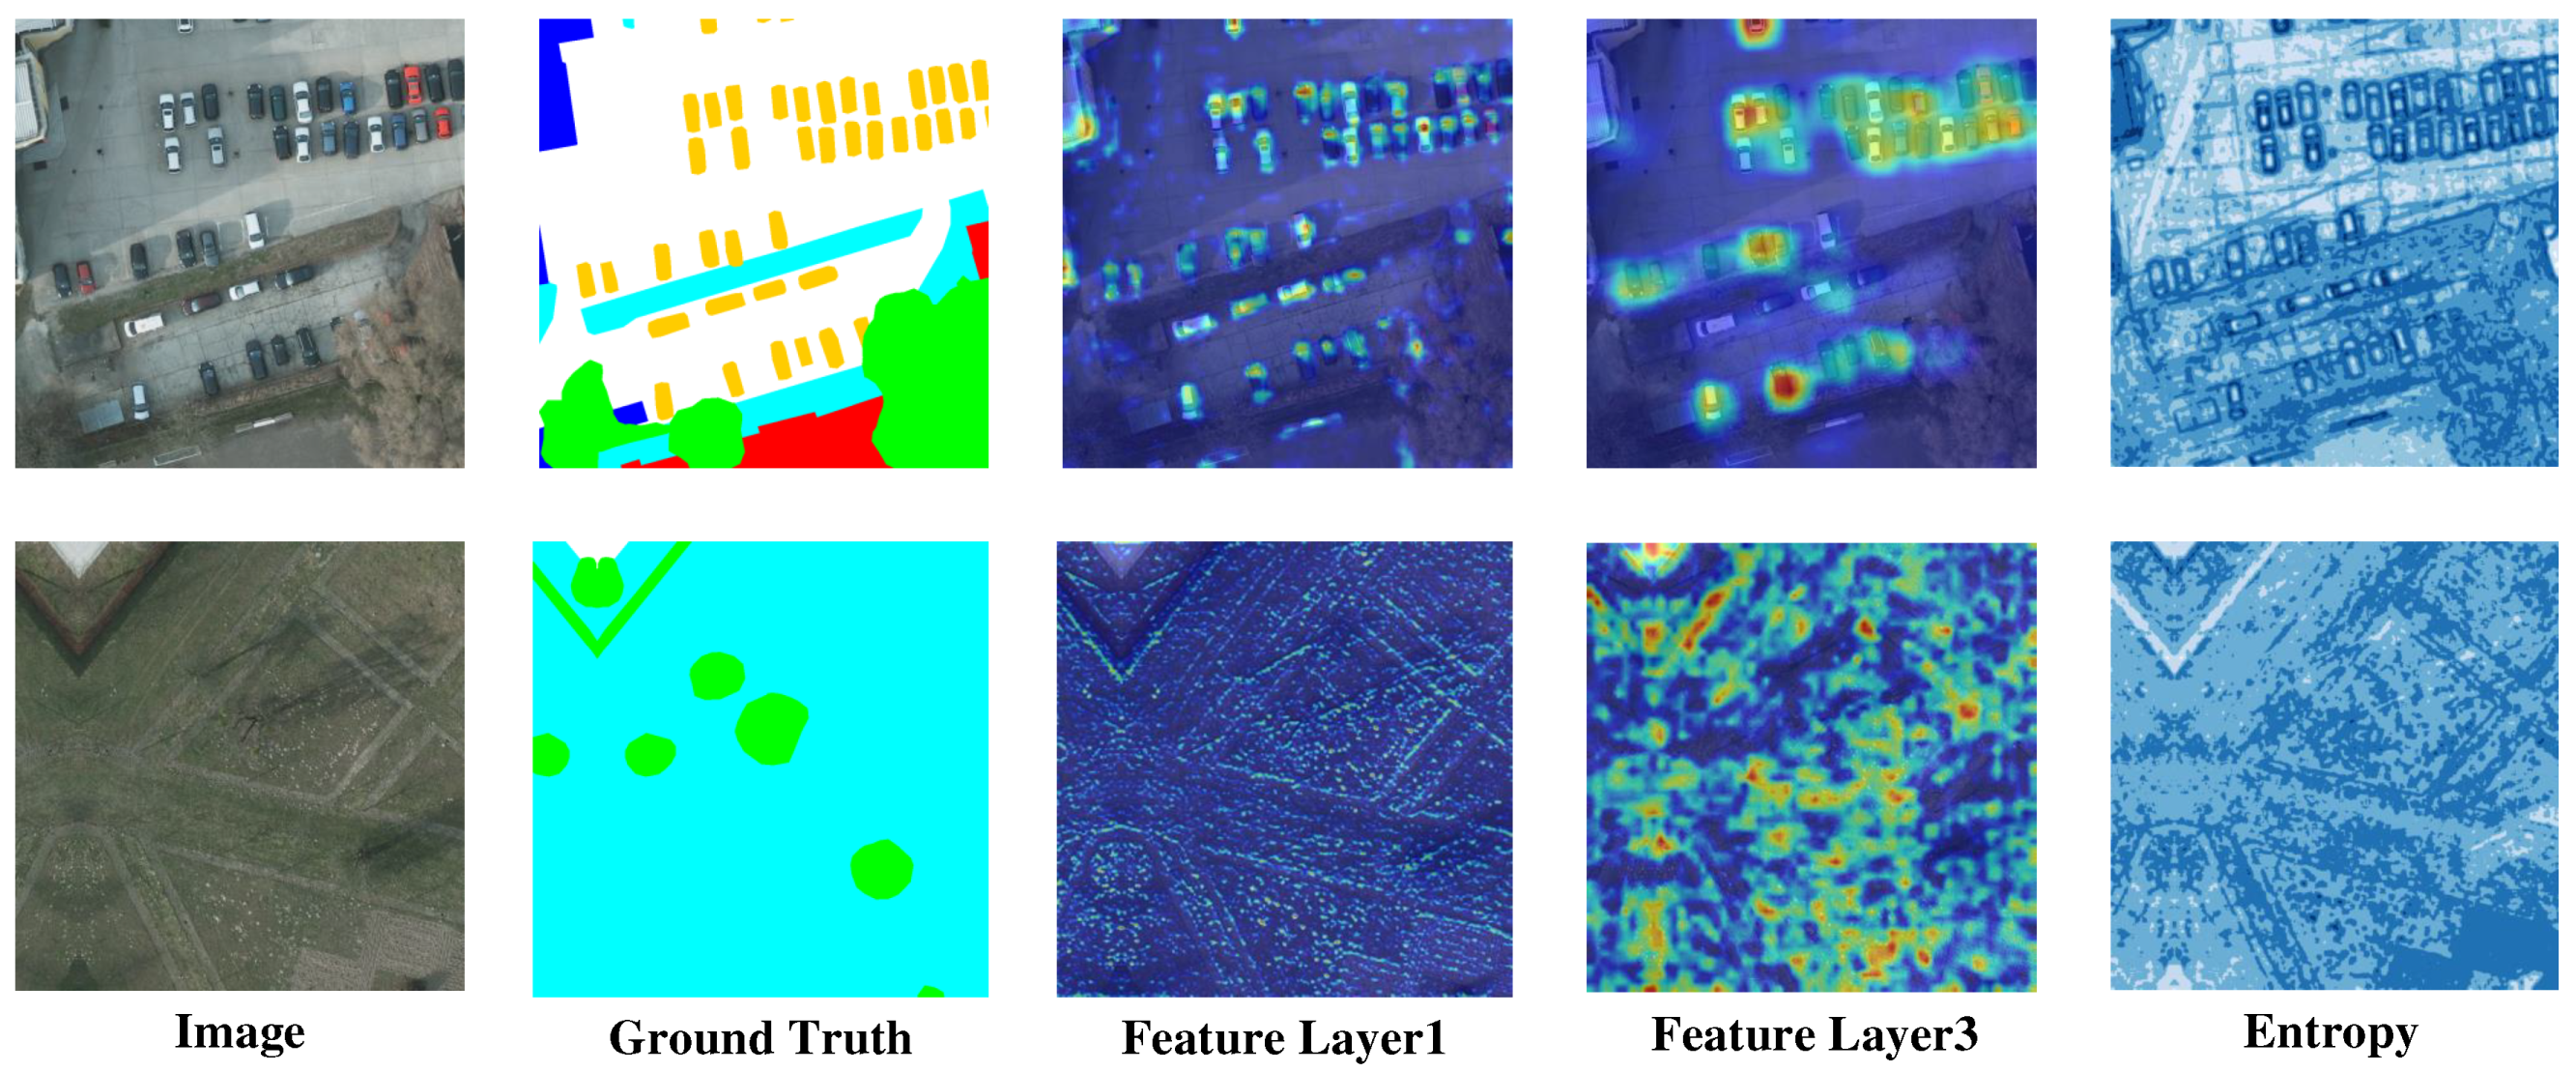
Figure 1. Activation map of different feature layers and image entropy. We found that feature maps from different layers have different response preferences. For example, some feature maps correspond better to edges, while others prefer to respond diffusely to regions. Meanwhile, the entropy of the image can simultaneously indicate edges and regions. Therefore, for different positions in the image, we choose to first use image entropy for subgraph partitioning and then fuse different layers of features for different subgraphs to balance the overall and local aspects of the target.
Preprints 88014 g001
Figure 2. Schematic diagram of different pyramid structures. The image pyramid and feature pyramid, as shown in Figures (a) and (b), perform the same processing, e.i., feature extraction, on all locations of the same layer of the image or feature map. While (c) shows a simple schematic of performing rich-scale feature extraction within a layer in our HRFNet.
Preprints 88014 g002
Figure 3. Quantization of image information entropy. The first and third pictures are the input images, and the other two pictures are their information quantization maps, i.e., entropy maps. The darker the color, the greater the entropy value at that point, that is, the greater the difference between the pixel value here and the neighboring point. This point may be the junction of different target categories.
Preprints 88014 g003
Figure 4. Results of Ground Truth and direct concatenation of feature maps. We zoomed in on the area within the red box in the image and pointed to the zoomed-in result with an arrow. It can be seen that the segmentation result after directly splicing the feature maps has the problem of uneven edges, and some features are roughly truncated from the middle, causing loopholes in certain types of targets.
Preprints 88014 g004
Figure 5. Intra-layer feature fusion. After restoring the position according to the index, the attention mechanism is used to fuse the features of the stitched image in the layer, and the incoherence in local details when directly stitching images is bridged by long-distance modeling.
Preprints 88014 g005
Figure 6. Architecture of Res2Net backbone and our HRFNet sketch inspired by it. Figure (a) shows the bottleneck structure diagram of the Res2Net network. Figure (b) is a sketch of the intra-layer rich-scale fusion structure we designed inspired by this. Similar to intra-layer interaction in Res2Net, our HRFNet also performs differential feature extraction operations on images within the same layer. Figure (c) is a schematic diagram of the feature extraction process of our method.
Preprints 88014 g006
Figure 7. Overall of HRFNet Architecture. Given an image I, our Information rating module (IRM) splits it into n sub-regions with image entropy. For different sub-regions, we extract feature maps of different layers for feature fusion. Finally, Finally, the resolution is restored between layers and within layers to obtain the final segmentation results.
Preprints 88014 g007
Figure 8. Visual comparisons of models in Potsdam dataset. Where the first column is the input image, the second column is ground truth, the middle four columns are the segmentation results of other methods, and the last column is our segmentation results. We use a black dotted line to mark the most distinct regions between the HRFNET proposed in this paper and other methods.
Preprints 88014 g008
Figure 9. Visual comparisons of models in Vaihingen dataset. Where the first column is the input image, the second column is ground truth, the middle four columns are the segmentation results of other methods, and the last column is our segmentation results. We use a black dotted line to mark the most distinct regions between the HRFNET proposed in this paper and other methods.
Preprints 88014 g009
Figure 10. Visual comparisons of Segmentation results from different layers of feature maps and visualization of certain layers of feature maps. The feature maps of different layers have different characteristics, such as some feature maps diffuse to the entire target, while others mainly indicating edges. The most obvious difference is within the black dotted box.
Preprints 88014 g010
Table 1. Comparison with State-of-the-art Methods on Potsdam Dataset. The bold indicates the best data. Since some methods did not publish the IoU of the Clutter , for the convenience of comparison, we do not include this category when calculating mIoU.
Method IoU mIoU F1-Score OA
Imp.surf. Building Lowveg. Tree Car
SegNet [52] 71.69 75.64 61.71 55.40 76.51 68.19 80.79 88.94
FCN [11] 81.64 89.11 71.36 73.34 79.32 71.44 81.85 87.17
PSPNet [53] 82.68 90.17 72.72 74.00 80.56 72.67 82.75 87.90
DeepLab v3+ [25] 79.80 86.86 69.73 68.10 83.08 77.51 87.14 85.67
UNet++ [54] 83.25 83.87 74.38 78.33 73.27 80.56 - -
OCRNet [55] 85.17 90.22 75.31 76.96 89.83 83.50 - -
MACUNet [40] 86.64 90.36 73.37 76.58 80.69 84.76 - -
ANCNet [56] 86.25 92.17 76.26 74.83 83.16 85.17 - -
DMAUNet [33] 87.72 92.03 75.46 78.52 87.91 85.68 - -
HRFNet (Ours) 87.21 94.09 77.92 80.38 92.75 86.47 92.62 91.14
Table 2. Comparison with State-of-the-art Methods on Vaihingen Dataset. The bold indicates the best data. Since some methods did not publish the IoU of the Clutter , for the convenience of comparison, we do not include this category when calculating mIoU.
Method IoU mIoU F1-Score OA
Imp.surf. Building Lowveg. Tree Car
FCN [11] 78.11 84.82 63.78 75.08 53.38 70.95 77.98 85.86
SegNet [52] 81.76 83.79 79.98 48.19 68.73 72.49 83.31 87.72
DeepLab v3+ [52] 78.62 86.07 64.47 75.43 58.69 72.66 79.41 86.27
PSPNet [53] 79.16 85.90 64.36 74.94 60.93 73.06 79.75 86.26
MAResU-Net [57] 79.58 86.05 64.31 75.69 59.68 73.06 79.51 86.52
FarSeg [58] 78.94 86.14 64.48 75.51 61.72 73.36 79.68 86.46
LANet [59] 79.41 86.17 64.47 75.87 64.29 74.04 79.84 86.59
UNet [22] 82.02 86.63 80.72 52.51 70.34 74.44 84.75 88.43
DANet [19] 82.27 89.15 71.77 73.70 81.72 79.72 - -
Unetformer [30] 86.45 90.91 73.83 82.61 79.44 82.64 90.18 90.76
HRFNet (Ours) 87.30 91.69 82.72 81.13 73.70 83.31 90.77 91.21
Table 3. Ablation experiments of IRM. The bold indicates the best data.
Rn[1] Layers of Feature map IoU mIoU
Imp.surf. Building Tree Car Lowveg. Clutter
1 2 85.87 90.98 81.45 76.60 71.90 39.83 81.36[2]
1 2 86.76 91.59 82.33 78.92 72.81 43.60 82.48
2 2 86.56 91.61 82.27 79.55 73.04 43.74 82.61
1 3 86.75 91.36 82.83 78.73 73.80 46.41 82.69
3 3 86.89 91.63 82.35 79.47 73.22 46.67 82.71
1 4 86.64 91.72 82.45 79.19 73.62 46.26 82.72
2 4 87.18 92.16 82.84 78.72 74.00 45.74 82.98
4 4 87.30 91.69 82.72 81.13 73.70 49.49 83.31
1 Rn represents the rating of the image information after quantification and rating, that is, when Rn=1, it means that IRM is not used, and when Rn=2, it means that the entire image is divided into two levels according to the information quantification level, and so on. 2 Gray refers to ResNet and no color refers to Res2Net.
Table 4. Ablation experiments of IRM and Inter-layer Feature Fusion. The bold indicates the best data. Rn represents the rating of image information after quantification and rating.
Rn Feature map IoU mIoU
Imp.surf. Building Tree Car Lowveg. Clutter
2 1,2 86.49 91.05 81.88 76.78 73.00 45.54 81.84
2 2,3 87.05 91.94 82.22 78.99 73.59 45.23 82.76
2 2,4 87.05 91.80 82.61 79.26 73.48 47.68 82.84
2 3,4 87.18 92.16 82.84 78.72 74.00 45.74 82.98
4 1,2,3,4 87.30 91.69 82.72 81.13 73.70 49.49 83.31
Table 5. Ablation experiments of Intra-layer Feature Fusion. The bold indicates the best data.
0]*Inter-layer Feature Fusion IoU 0]*mIoU
Imp.surf. Building Tree Car Lowveg Clutter
w/o 86.77 92.01 81.92 78.81 73.02 54.11 82.51
Edge smoothing 87.05 91.80 82.61 79.25 73.48 47.68 82.84
w/ 87.30 91.69 82.72 81.13 73.70 49.49 83.31
Disclaimer/Publisher’s Note: The statements, opinions and data contained in all publications are solely those of the individual author(s) and contributor(s) and not of MDPI and/or the editor(s). MDPI and/or the editor(s) disclaim responsibility for any injury to people or property resulting from any ideas, methods, instructions or products referred to in the content.
Copyright: This open access article is published under a Creative Commons CC BY 4.0 license, which permit the free download, distribution, and reuse, provided that the author and preprint are cited in any reuse.
Prerpints.org logo

Preprints.org is a free preprint server supported by MDPI in Basel, Switzerland.

Subscribe

© 2024 MDPI (Basel, Switzerland) unless otherwise stated