3.1. Energy Results
Within this current section, the findings regarding the energy effectiveness of the roof retrofit proposal are presented for the case study mentioned above. The heating, cooling, and total loads generated by the heat flux through the reference and the retrofitted roofs are computed for each year of the LCCA whole time period. Then the loads are compared, and energy savings estimates are obtained for each year and for the entire LCCA span time.
To perform analysis, the heat flux per unit area of the roof surface for the complete year is calculated, taking into consideration the hourly climatic data available in the weather files specific to Seville, as previously described. Then, when this flux is incoming, as happens in the cooling season, the flux is computed as cooling load, and when the heat flux goes out, as happens in the heating season, the flux is computed as heating load. The addition of the cooling and heating loads provides the total flux.
In these computations, as mentioned above, two protocols for cool roof maintenance have been considered: no washing and quinquennial power washing of the outer elastomeric paint.
In
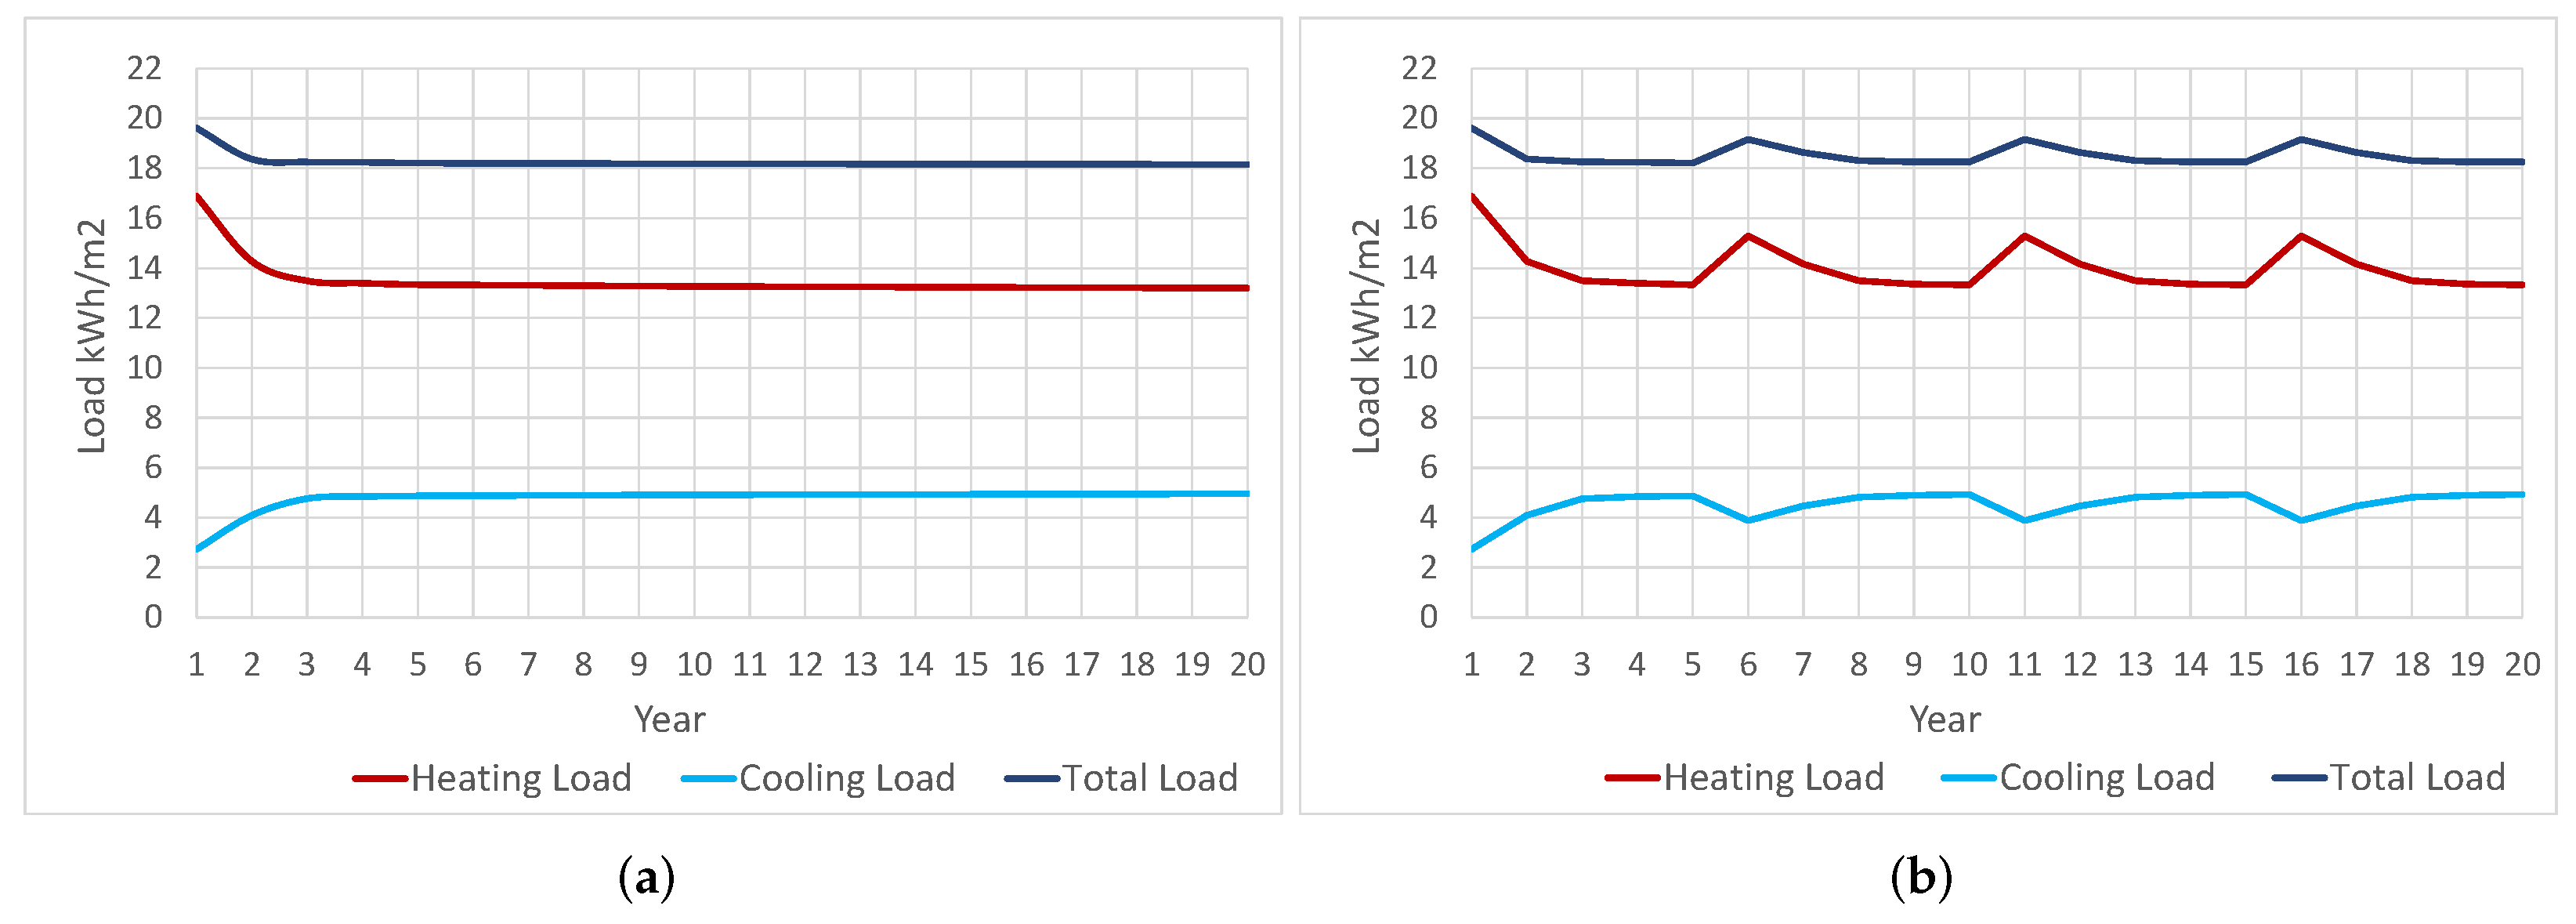
Figure 6a the yearly heating, cooling and total loads by m
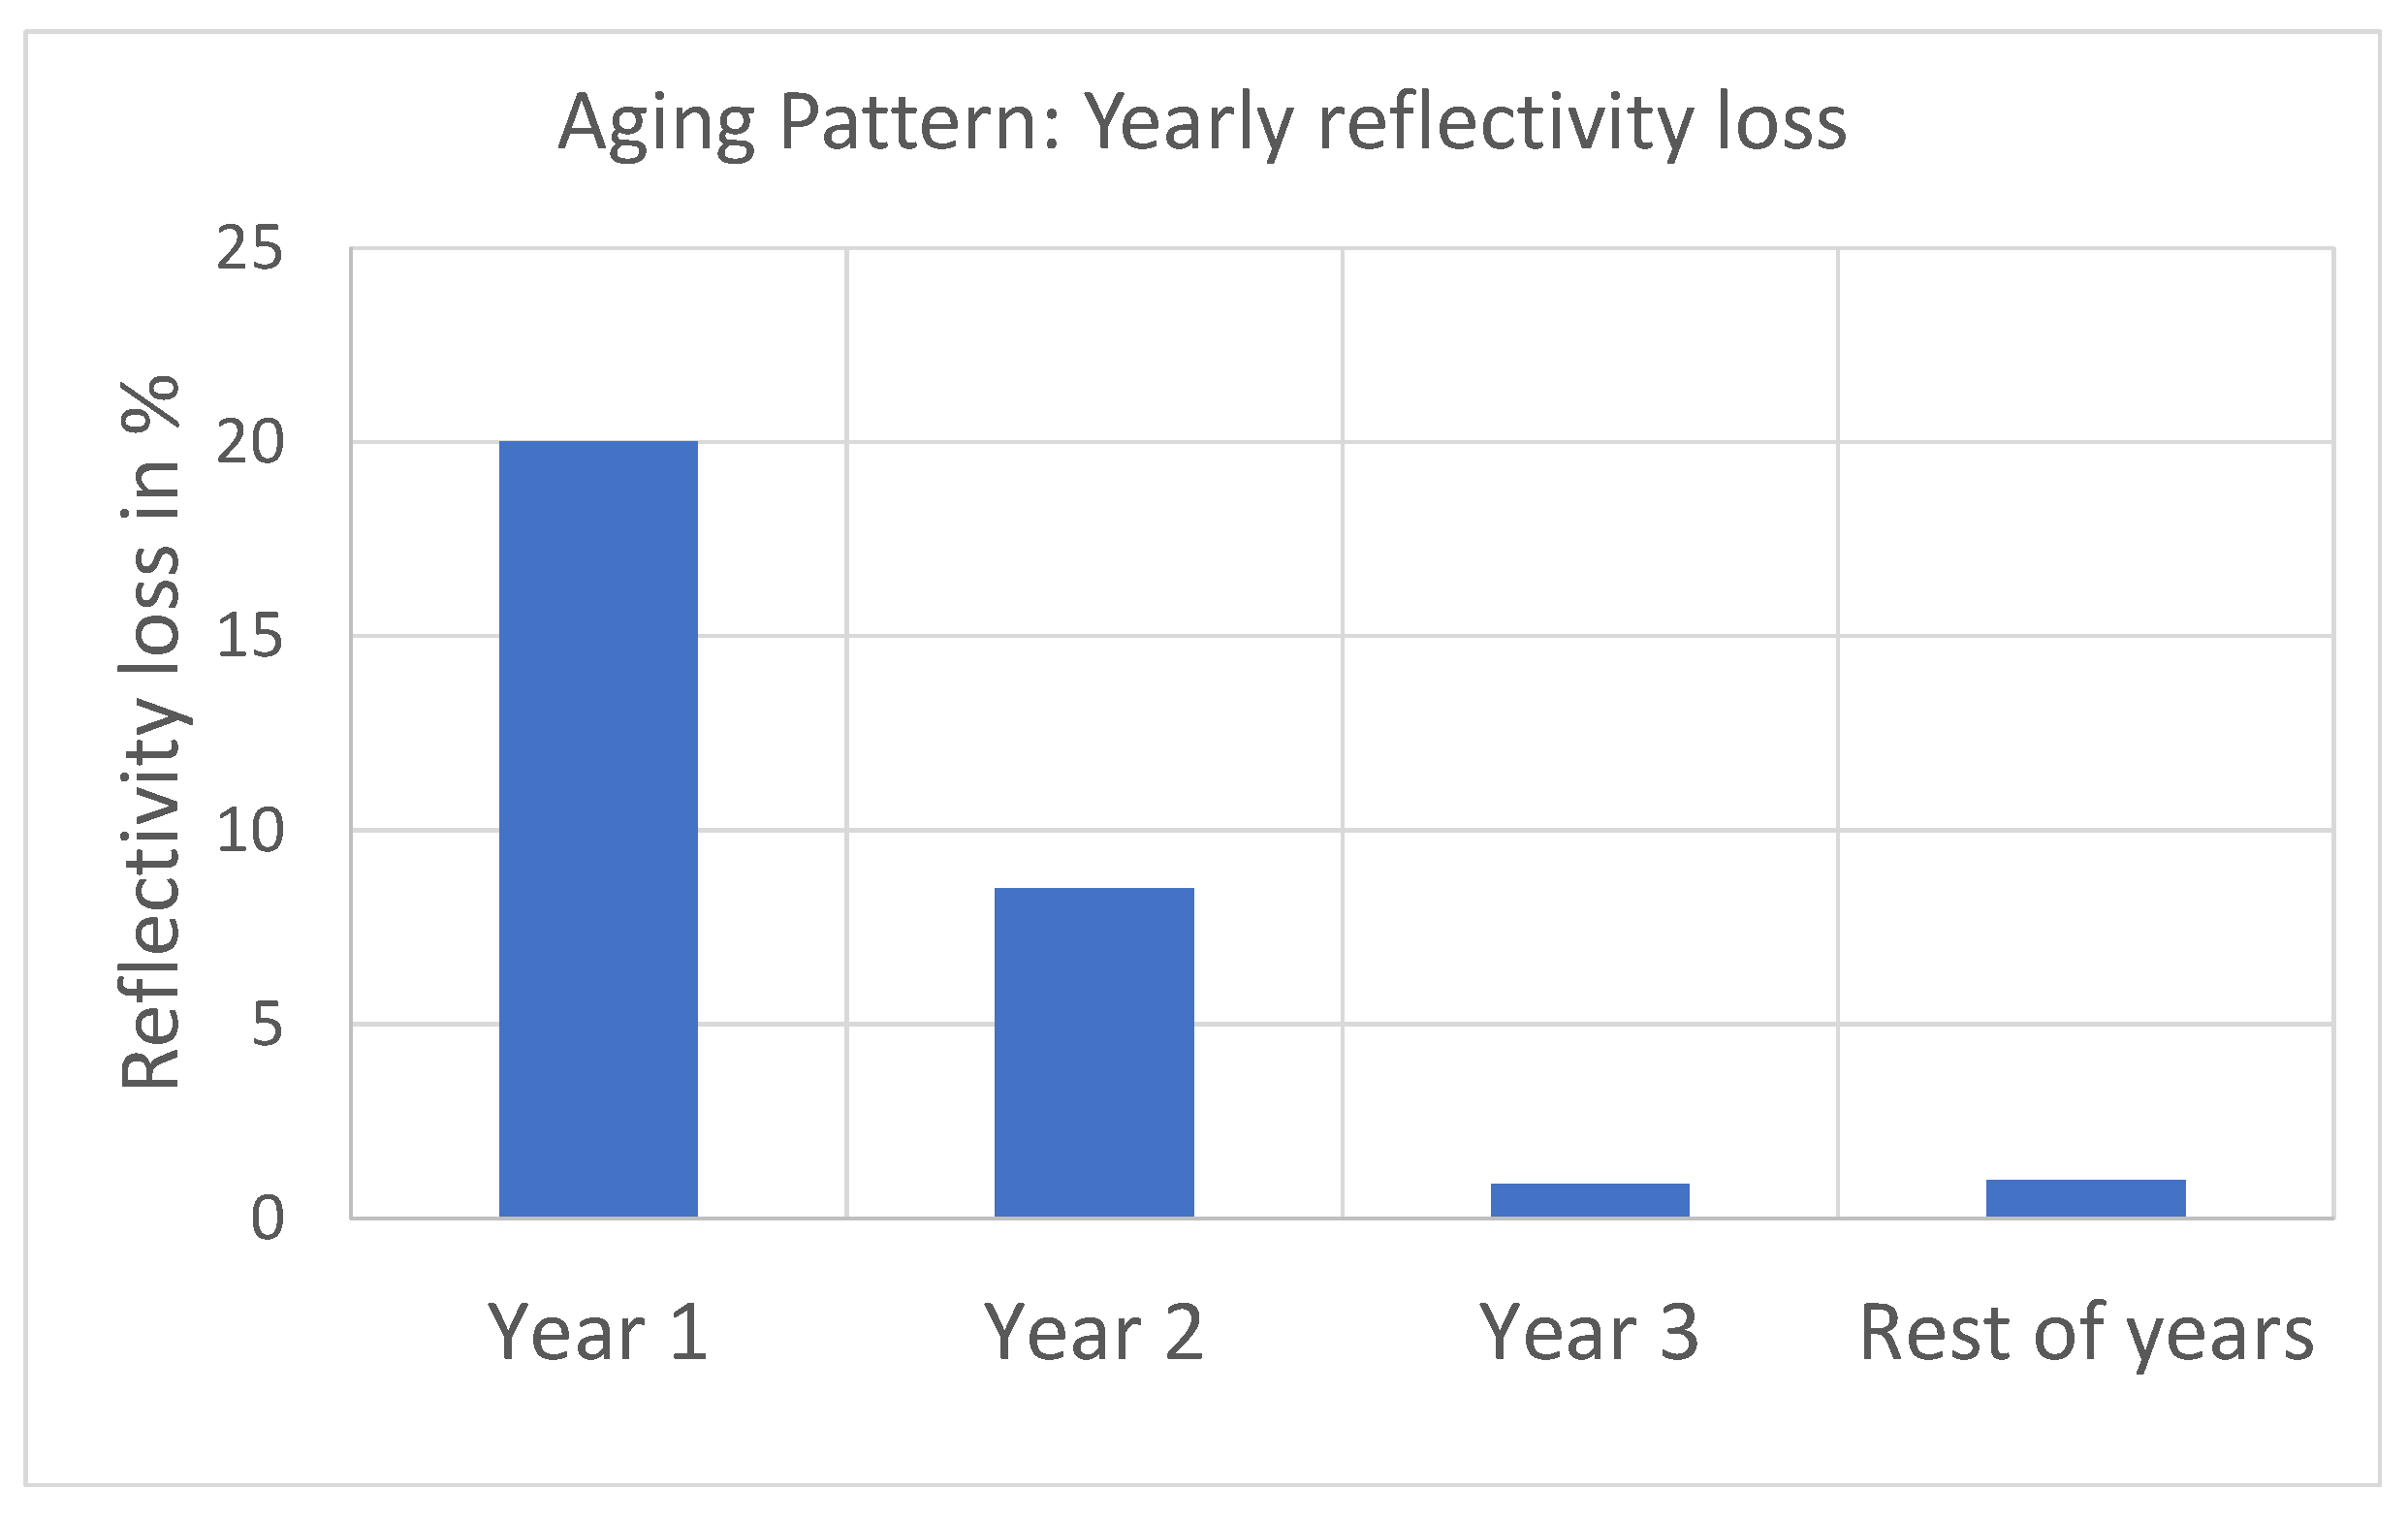
2 of retrofitted roof are shown for the case of no washing of the cool coating. It can be observed that as a result of the high initial values of the cool-coating solar reflectivity, the values of the heating loads are higher in the first two years than for the remaining years due to the solar gain penalty; on the contrary, for the first two years, the cooling loads are lower than for the remaining years for the same reason. Regarding the total loads, this opposing behavior of the cooling and heating loads produces a final result that must be estimated considering the effect on the loads of the aging pattern. For the case study considered, the results depict a trend where total loads are notably higher in the first two years and then maintain a stable course in the remaining years.
It should be noted that the heating loads in the present case study are higher than the cooling loads for the whole LCCA time span, in line with the effect that the high solar reflectivity produces in the thermal flux through the roof. In
Figure 6b, the yearly heating, cooling and total loads by m
2 of retrofitted roof are shown for the case of a periodic quinquennial wash of the cool coating. The first observation that can be made from this figure is how the quinquennial washing of the roof produces a cyclic behavior of the loads, which is very similar for each 5-year period between two consecutive washes. As can be seen, the effect of the cool paint on decreasing solar gain produces lower values for the cooling loads than for the heating loads throughout the 20 years of the considered life cycle time span.
It is worth noting that when the solar reflectivity of the cool paint reaches its highest values, that is, in the initial year, and then, after the quinquennial washing, years 6, 11 and 16, the cooling load reaches its minimum values; after each of these years, cooling loads are gradually increasing in each time interval between two consecutive washings, in line with the increasing loss of solar reflectivity produced by the aging effect of the cool paint. For the heating load, the pattern is just the opposite: when the solar reflectivity is maximum in years 1, 6, 11 and 16, the heating loads are maximum in accordance with the lowest values of solar gain; then in the following years the heating load follows a decreasing pattern produced by the aging effect that causes a loss of reflectivity and an increase of solar gain.
This opposing behavior in the cooling and heating loads produces a certain balance in all the years except for the initial year of each inter-washing time period. In these initial years, the predominant effect is the reduction of solar gain, so that the rise in heating load is not balanced by the reduction in cooling load, resulting in an increase in the total load for those years. For the remaining years of each period between washings, it is observed that the variations in cooling and heating loads caused by the effect of the aging of the cold layer are approximately compensated for by each other, producing a very small variation of the loads over the different years of each period.
On the other hand, the calculation of the heat flux for the reference roof gives a heating load equal to 28.72 kWh/m
2 and a cooling load equal to 38.32 kWh/m
2 that implies a total load equal to 67.04 kWh/m
2 for every year of the LCCA span time. By comparing these values with the loads for the retrofitted roof shown in
Figure 6, it can be stated that the heating, cooling, and total loads for the retrofitted roof have lower values than the same loads for the reference roof and this for all the years of the LCCA time span and for the two washing protocols considered; consequently, it can be stated that the retrofitted roof yields positive energy savings for all the years of the considered LCCA time span, as can be seen in
Figure 7.
In
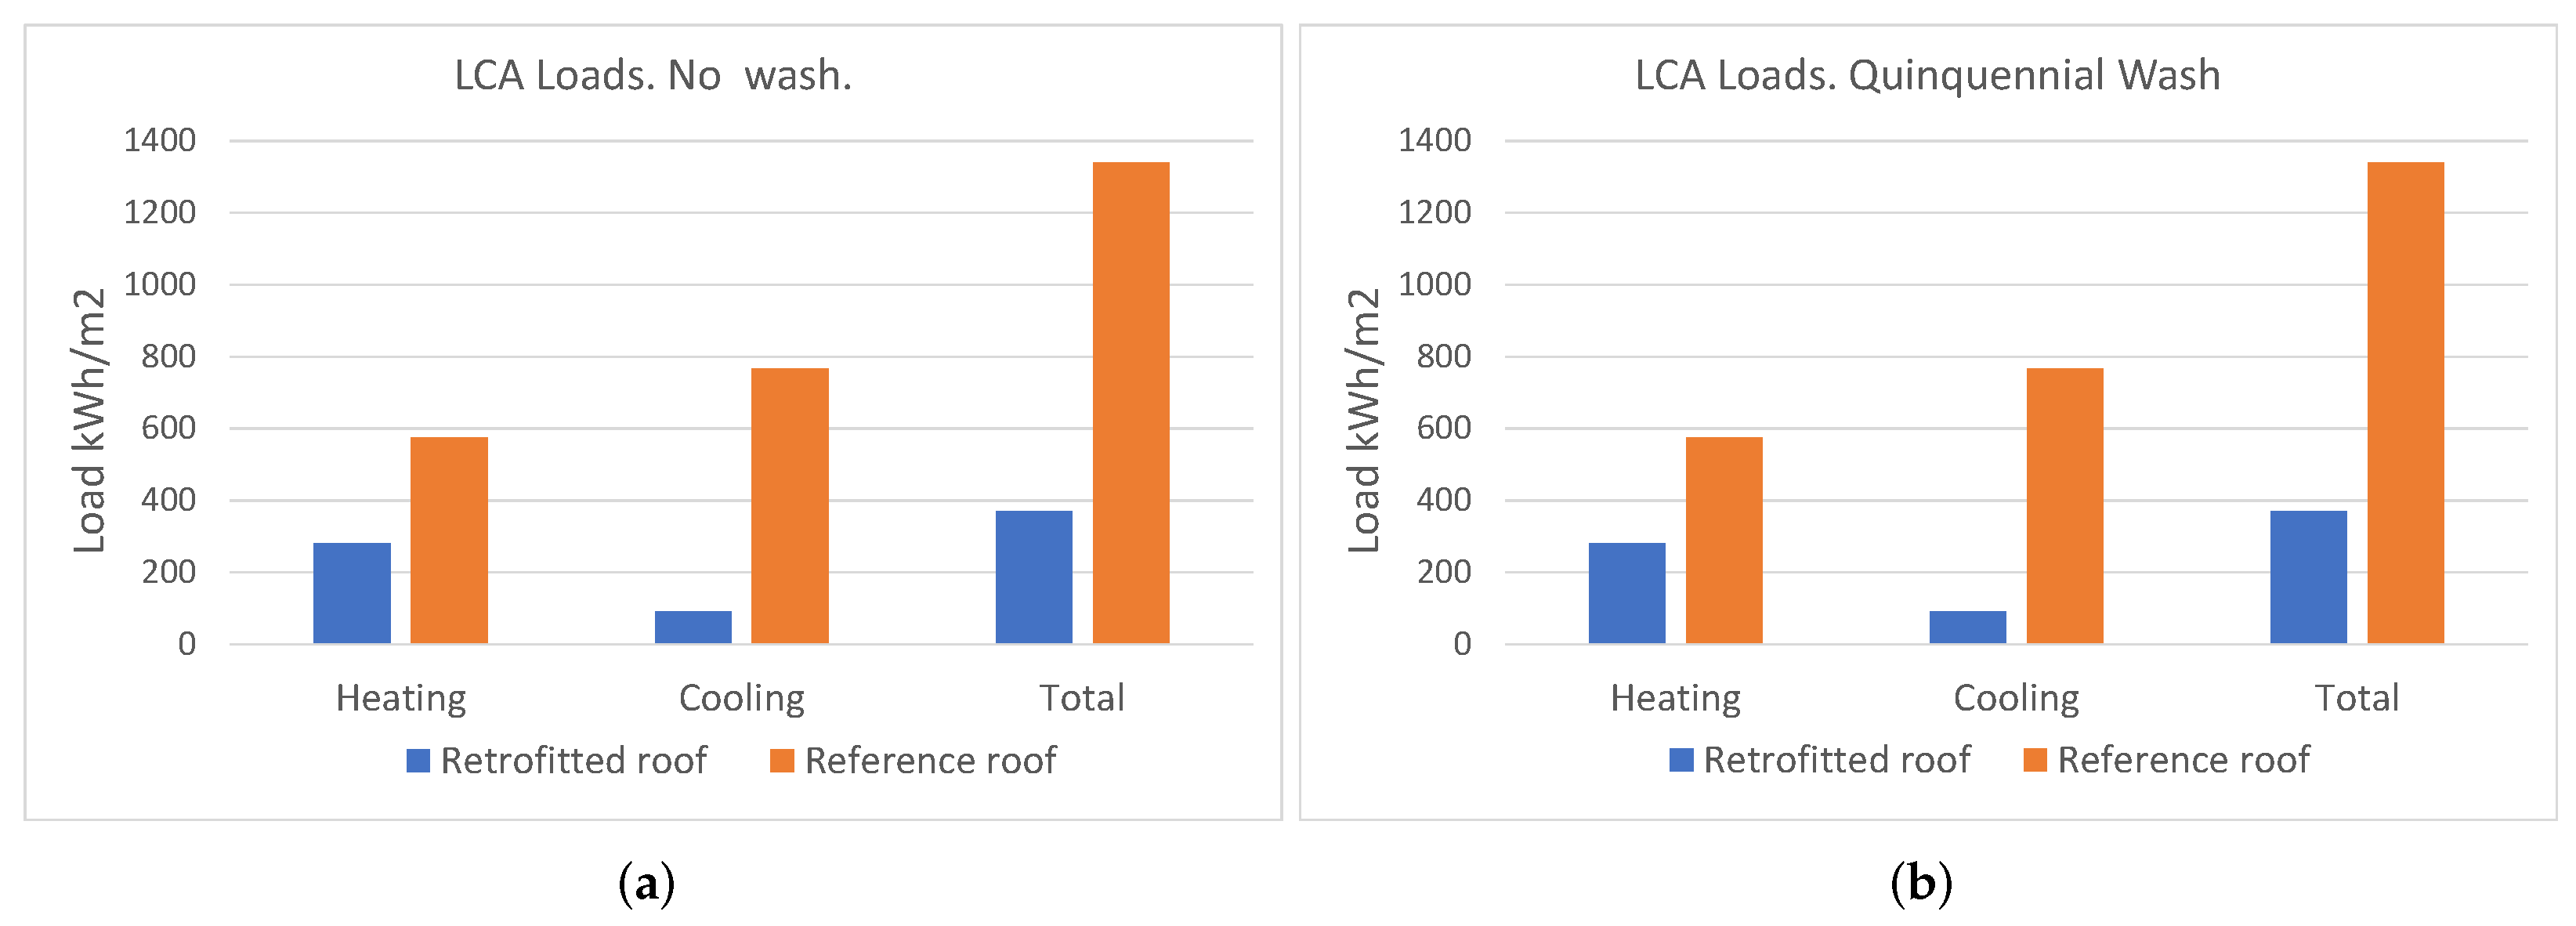
Figure 8, the loads for the entire LCCA time span are shown for the reference and retrofitted roofs. According to
Figure 6 and the subsequent discussion for heating and cooling loads and thus for the total load, the retrofitted roof exhibits lower values than the reference roof and, as can be appreciated in the figure, the highest reduction is achieved for the cooling loads. In
Table 4, the values of the different loads for the LCCA span are shown for the retrofitted and reference roofs.
The energy savings for each specific load are defined as the difference between the load for the reference roof and the load for the retrofitted roof. Thus, positive energy savings mean that the load on the reference roof is higher than the same load on the retrofitted roof. As can be observed in
Table 4, the retrofitted roof has positive or true total energy savings when compared to the reference case. In
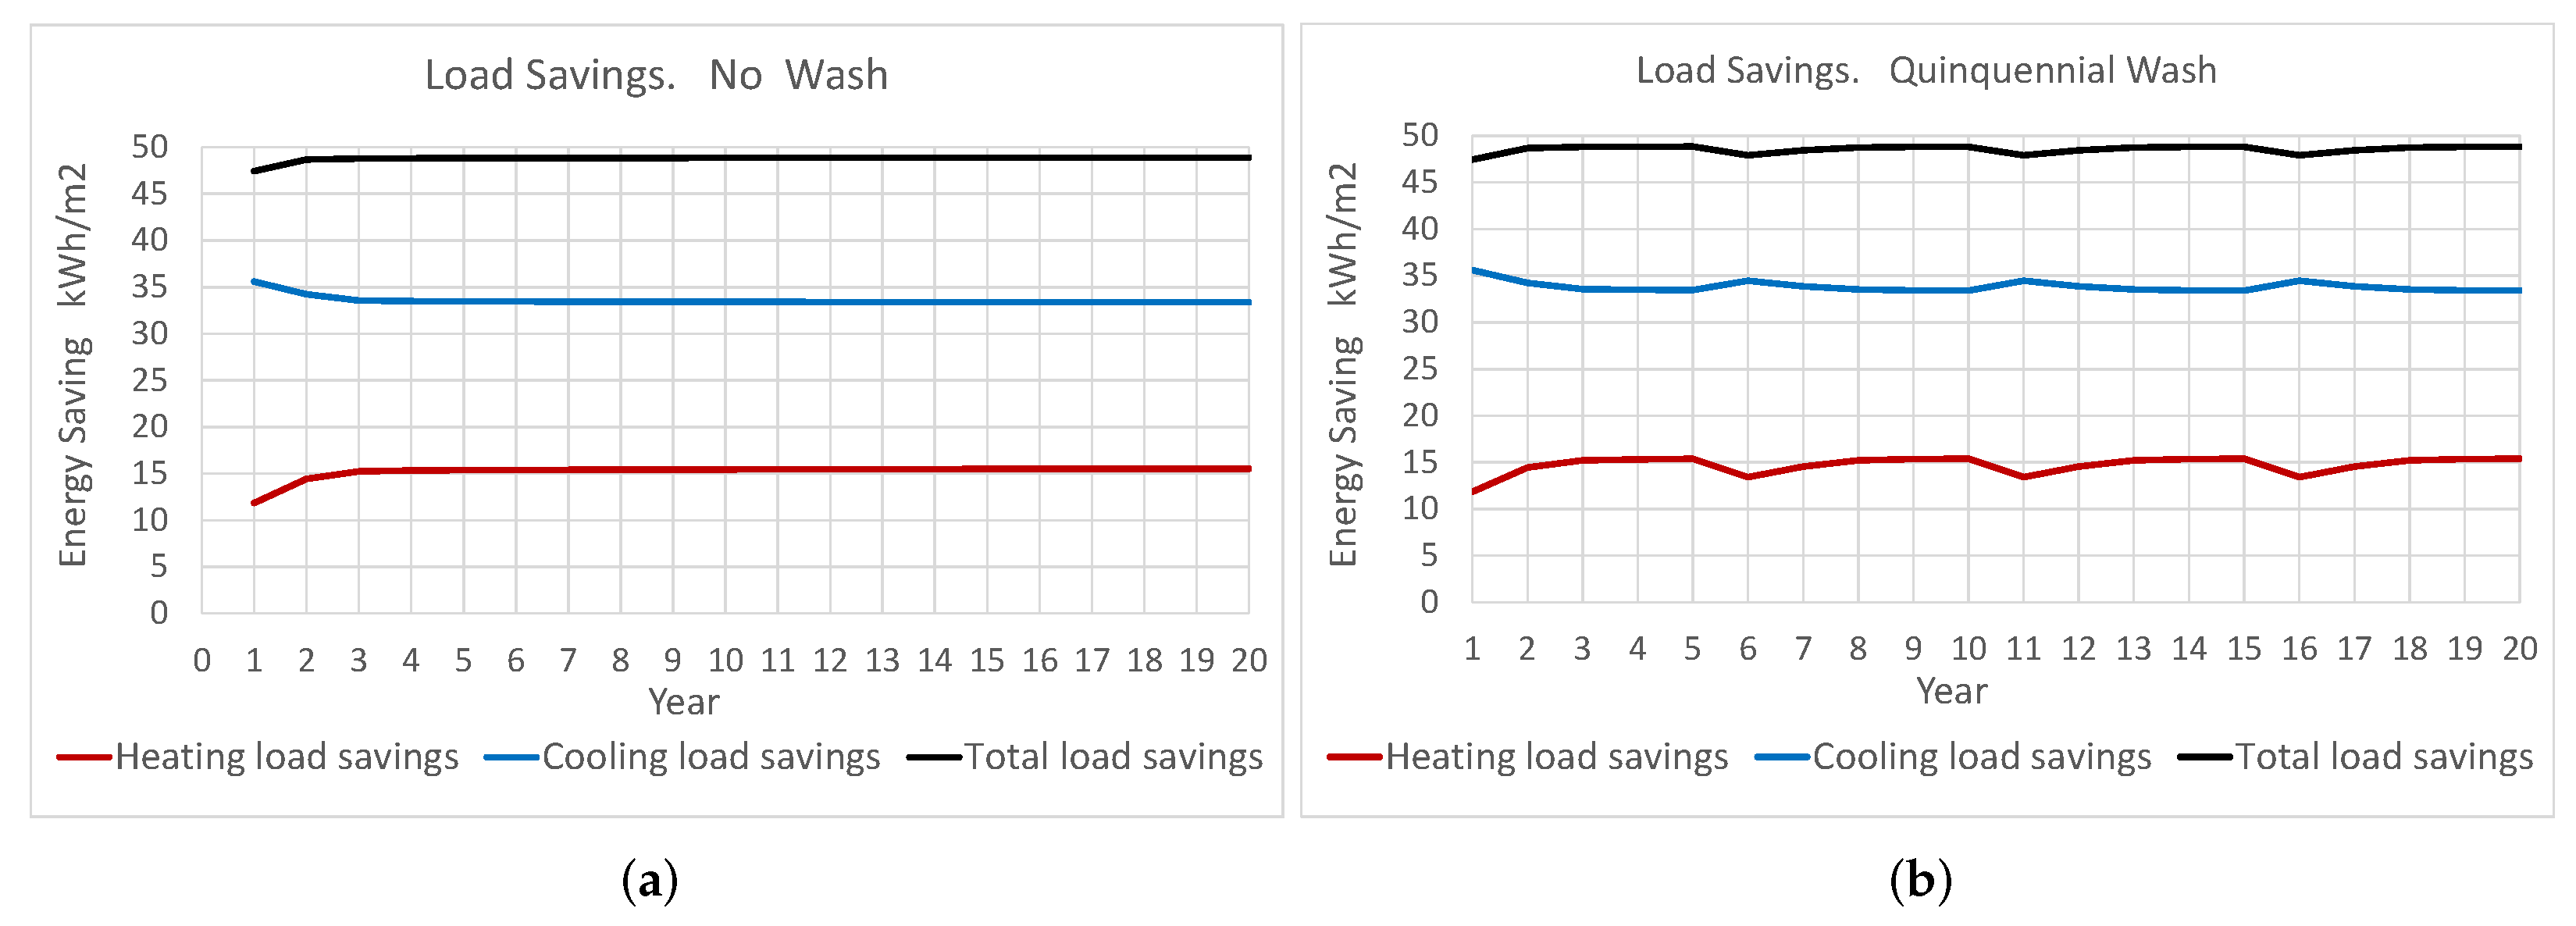
Figure 7 the heating, cooling, and total savings are displayed for each year of the LCCA span time.
It can be noted that the case of periodic quinquennial wash of the cool coating provides slightly better results with respect to the total load and energy savings compared to the case of no wash.
According to the above discussion, for the case of no wash of the cool coating,
Figure 7a, the lowest values for the energy savings are obtained in the two initial years and then tend to stabilize for the remaining years. It should be noted that the savings for cooling load are much higher than the savings for heating load.
In
Figure 7b, the load savings for the case of a quinquennial wash of the cool coating are shown. It can be observed that the lowest values for the energy savings are obtained in the two initial years and then in the years in which the washing is carried out due to the penalty in the solar gain produced by the high values of solar reflectivity. For the remaining years of each period, the decrease in the solar reflectivity produced by the aging lowers the solar reflectivity and, as can be seen in the figure, this makes the total load go down.
Likewise, in
Figure 7 the greatest effect in producing savings is observed for the cooling load when compared to the heating load, as a result of the decision to install a cool paint with very reduced solar reflectivity.
Finally, in
Table 5, the LCCA energy savings are shown for all housing in every district of the neighborhood and the neighborhood as a whole.
Taking into account the assumed SEER and SCOP coefficients, the savings in thermal loads shown in
Table 5 are equivalent to a total reduction in energy consumption of 32,500 mWh for the entire neighborhood and the entire life cycle, which is equivalent to a 72% of reduction in energy consumption to achieve indoor thermal comfort. This value of energy consumption decrease implies a total reduction in CO2 emissions of 4,488.31 tons.
3.2. LCCA Results
In this section, the net savings and payback periods are used as performance indicators to perform the LCCA. Due to the investment in refurbishment made compared to the reference case, the NCS and PB are assessed under the economic framework described previously and considering the impact on energy loads of the effect of aging as described previously.
In
Table 6 the monetary net savings per unit of roof surface area, NCS, and the payback period, PB, are shown for the two maintenance protocols considered: no powerful wash during the entire LCCA time period and a periodic quinquennial wash. Additionally, net savings are presented for the roof with three standard surface areas in the framework of social housing, that is, roof areas equal to 60, 70 and 80 m
2: the usual range of roof surfaces for this kind of dwelling.
As can be seen in
Table 6 the proposed retrofitting measures are cost-efficient for all the cases analyzed. However, it can be stated that the results obtained for the no-wash maintenance protocols are better than those obtained for the quinquennial washing, with higher values of monetary savings and thus shorter PB periods for the no wash case. It should be highlighted that the payback periods for all the cases are not long and range between 6.84 and 8.12 years. These can be considered reasonable time intervals to recover the investment made in the retrofitting.
Regarding the economic indicators, it can be observed that the proposed combined retrofit measure yields the highest monetary savings for high values of the energy inflation index and the monetary discount rate represented here by i = 6 % and dr = 3%. Taking into consideration the present economic situation characterized by very high energy price growth and very high inflation rates, it can be concluded that, financially speaking, the proposed retrofitting measure is highly effective.
In the same table, net monetary savings are presented for three typical roof areas of social dwellings. As can be observed, the value of these savings is relevant, and their impact on the household economy of regular residents of social housing, usually characterized by low incomes, can be described as of great significance and with a high potential to achieve indoor comfort and health conditions and reduce the high rates of energy poverty found among the inhabitants of this type of housing.
Finally, in the
Table 7 the monetary savings for the whole LCCA time span for all the retrofitted dwellings in each district and for the entire neighborhood are shown for all the different economic scenarios of energy inflation and discount rate considered.
As can be observed, the quantities saved during the analysis period, the life cycle time span, are significant for all the analyzed scenarios in terms of both economy and maintenance protocols. It is observed that for the entire neighborhood quantities saved range from million to over million in the No Wash case, depending on the economic scenario.
