Submitted:
23 October 2023
Posted:
25 October 2023
You are already at the latest version
Preprints on COVID-19 and SARS-CoV-2
Abstract
Air pollution is one of the biggest problems of this age, not only it contributes to climate change but also it has a negative effect on public and individual health due to rising morbidity and mortality. There are various contaminants that play a significant role in human disease. Numerous toxins are released into the environment as a result of anthropogenic activities including burning fossil fuels for transportation and electricity generation. In order to assist decision-makers in finding a long-term solution for improving environmental quality and population health status, NO2 pollution monitoring and regulation is an essential task. Based on data acquired from Sentinel-5P, the study presented a comparison of NO2 measurements in Sentinel-5P and ground-based stations over the urban area of Fujairah during 2021 and comparison analysis of the tropospheric NO2 column spatial configuration over urban area of Fujairah during comparable periods of pre, mid and post Covid-19 pandemic era as 2019, 2020 and 2021, respectively. These findings demonstrate remarkable tropospheric NO2 column number density decreases even of 85% in the busier areas of emirate of Fujairah during the pandemic era. Sentinel-5P measurements draw attention to the significant reduction in NO2 pollution over Fujairah during the COVID-19 lockdown where we had less traffic, which is supported by ground stations-based calculations.
Keywords:
atmospheric pollution
; NO2
; air quality
; Sentinel-5p
; TROPOMI
; remote sensing data
; covid-19
; pandemic
; outbreak
Introduction
Urban air pollution is made of extremely complex mixture of gaseous and particulate substances [1]. Anthropogenic activities such as combustion of fossil fuels for energy production and transportation entails as the major cause of releasing various pollutants in the environment. These pollutants cause atmospheric composition change which negatively impact human health and its ecosystem [2]. Vehicle emissions are anticipated to worsen from what they are now by 2030. Numerous studies have reported the negative influence of vehicle emissions like hydrocarbons, nitrogen oxide, carbon monoxide, and particulates which are anticipated to worsen by 2030 [3]. Nitrogen dioxide (NO2) is the air pollutant species that is most critical to human health of its direct respiratory irritation, exacerbation of existing health conditions, long-term negative health impacts, and contribution to other harmful pollutants. Air quality guideline by World Health Organization (WHO) suggests NO2 level shouldn’t exceed 10 μg/m3 annual mean and 25 μg/m3 24-hour mean. In 2019, 99% of the world population was living in places where these criteria were not meet [4]. According to WHO, 91 percent of the world population breathe air with high levels of pollutants which results in death of 7 million people/year [5]. According to epidemiological studies, bronchitis symptoms increased in asthmatic children due to long-term exposure of NO2 [5]. NO2 has capacity to create secondary pollutants like nitric acid and ozone (O3), which help to create smog, acid rain, and the greenhouse effect [6]. Therefore, global warming increases when greenhouse gas concentrations rise in the atmosphere. The cumulative warming effect to the earth’s atmosphere from greenhouse gases increased by 45 percent from 1990 to 2019 [7]. Lowering anthropogenic emissions of air pollutants and atmospheric particles from sources like vehicle traffic may help to enhance the world's air quality [8].
Monitoring air quality has become a crucial public health and environmental protection activity. In addition to ground-based monitoring stations, satellites are increasingly utilised for tracing air pollution sources and monitoring air quality. Satellite-based data are incredibly useful for monitoring air pollutants and the physical conditions of the Earth's surface due to the increasing availability of remotely sensed data derived from sophisticated sensors with high resolutions. In addition, metrological and satellite-based derivatives are incorporated into a variety of studies to elucidate the spatiotemporal patterns of air pollutants, biophysical parameters, and respiratory disease [9].
The COVID-19 outbreak, which was first reported in late December 2019 in Wuhan, China, has become one of the most grievous health crises of the 21st century, posing grave risks to all nations. Diverse drastic measures were taken on a global scale to control and mitigate the virus's rapid spread and to reduce its mortality rate. Particularly, the transport sector was severely impacted by curfews imposed as a result of the adoption of remote work systems by educational institutions, public and private sectors [10]. As a consequence, during the first few months of the pandemic, people's mobility changed drastically as the majority stayed at home during working hours. In addition, researchers began to report improvements in air quality based on information acquired from satellite images and monitoring stations on the ground. Using Sentinel-5 satellite data, numerous studies evaluated the changes in various air pollutants during the 2020 COVID-19 lockdown (March to June 2020) in 21 metropolitan cities spanning 14 Middle Eastern nations. Significant decreases in various air pollutants including NO2 levels were observed primarily in minor cities and, to a lesser extent, in metropolitan cities. Other researchers analysed the effect of the COVID-19 lockdown on air quality in the Middle East, including Saudi Arabia, Kuwait, Iraq, Iran, and the United Arab Emirates [11,12,13].
However, the available regional studies primarily concentrated on the early phases of the pandemic and did not adequately represent the recovery phase or provide comprehensive and quantitative analyses of the changes in various air pollutants and mobility patterns. The Fujairah emirate is not investigated extensively in the United Arab Emirates, and very little effort has been made to monitor environmental pollution here. This study documents the impact of the COVID-19 lockdown and subsequent resuming on mobility and air quality in the Fujairah region of the United Arab Emirates, compares the impact of the lockdown on air quality as reflected by satellite data and ground-based observations, and correlates the mobility patterns of people with the observed changes in air quality during the lockdown and subsequent recovery.
The data mining process will be applied to collect data from satellite and four different ground-based station located in the Fujairah. The point-based ground measurements will be taken and applied in spatial modelling to accurately quantify the amount of air pollution. The distribution modelling of NO2 is useful for epidemiological studies, management of the urban air which further helps in government planning and regulations [14]. These efforts will assist the government in finding a long-term solution for improving environmental quality and the health of the population.
Materials and Methods
Study area
Fujairah is one of the seventh Emirates in the United Arab Emirates. It is the only Emirate to be located on the eastern side of the UAE, near to Gulf of Oman. The total area of Fujairah is 1450 Km2 which covers 1.8% of the whole area of UAE (About Fujairah, 2022). The population of the Emirate of Fujairah is reported as 292,358 in 2020, according to the Fujairah Statistics Centre (Fujairah’s Population, 2021). Our analysis focuses on the urban area of Fujairah in 2021 which covers 450.05 Km2 as shown in Figure 1.
Data Mining:
The data has been collected from ground-based stations in urban Fujairah provided by Fujairah Environment Authority (FEA) and satellite Sentinel-5 Precursor (Table 1). These ground-based weather stations are equipped with Analyzer sensors capable of capturing a diverse array of atmospheric constituents, including NO2. These sensors are strategically positioned at heights ranging between 5 to 10 meters above ground level, facilitating the collection of accurate and representative air quality measurements.
Nitrogen dioxide (NO2) data from ground-based stations
These data include NO2 concentrations in microgram per cubic meter (µg/m3) measured hourly through day and night and average temperature in Celsius (°C) during each month at four different stations in the selected Fujairah urban area in 2021 (Table 1, Figure 2). An algorithm written in python has been applied to measure the mean of the concentration in each day. These data were used as reference to identify the differences in NO2 levels in various stations and compare it to the Sentinel-5P data.
Sentinel-5 Precursor satellite
The data of Sentinel-5P has been collected via Sentinel Hub using EO Browser in near real time (NRTI). Sentinel-5P is an atmospheric monitoring satellite and has only one sensor called TROPOspheric Monitoring Instrument (TROPOMI), which is the most developed multispectral imaging spectrometer. It monitors the sunlight that is reflected to space from the earth’s surface and atmosphere and finds the special fingerprints of different gases in various regions of the electromagnetic spectrum. The gases accounted for special fingerprints include nitrogen dioxide, ozone, formaldehyde, methane, carbon monoxide, etc, and aerosols [17]. The Sentinel-5 Precursor satellite contributes valuable information for a wide range of applications related to environmental protection, public health, climate change mitigation, and scientific research. The data of NO2 tropospheric column in the unit of mol per square meter (mol/m2) has been collected for 2021. The images of spatial distribution of NO2 concentration over the study area has been downloaded for the following dates: 26/11/2019, 29/12/2019, 21/1/2020, 9/2/2020, 17/3/2020, 27/3/2020, 12/1/2021 and 27/3/2021 based on Mohammed bin Rashid space centre survey on NO2 concentration before and during the lockdown [18] (Figure 3).
Results
Comparison of NO2 measurements in Sentinel-5P and ground-based stations
Based on the column number density and concentrations of NO2, the underlying results highlight that the NO2 pollution is recorded higher in the colder months (January-May) and (October-December) than the hotter months (June–September) (Figure 4, Figure 5, Figure 6 and Figure 7). In-line with that average lowest temperature has been recorded as 21.6°C in January and highest as 36.5°C in July as shown on (Figure 8). The highest value of Sentinel-5P column number density of NO2 is recorded as 2.19E-04 mol/m2 on 13/01/2021 and the lowest value equals to 1.25E-05 mol/m2 on 06/06/2021. Similarly, the average column number density of NO2 is 6.06E-05 mol/m2. The highest NO2 concentration extend to 75.91 µg/m3 on 31/10/2021 while the lowest values remain at 5.26 µg/m3 on 07/06/2021 from Point 3 station (Figure 4). Moreover, the NO2 concentration values get as far as 71.47 µg/m3 on 5/03/2021 and as low as 13.4 µg/m3 on 13/07/2021 for Point 4 station (Figure 5). Similar calculation has been done for Point 2 station where highest value of NO2 concentration reached to 76.71 µg/m3 on 8/04/2021 and lowest stayed on 9.85 µg/m3 on 24/09/2021 (Figure 6). The results demonstrate higher values of NO2 concentration in Point 1 station which reaches up to 107.12 µg/m3 on 23/10/2021 and lowest recorded levels as 5.7 µg/m3 on 4/06/2021 (Figure 7). The average recorded values of NO2 concentration for all four stations including Point 1, Point 2, Point 3 and Point 4 appeared as 33.24 µg/m3, 32.33 µg/m3, 30.32 µg/m3 and 23.12 µg/m3, respectively. These results significantly indicate highest recorded values of NO2 concentration in Point 1 station while comparatively lower NO2 concentration has been recorded in Point 4 station among all.
Comparison of NO2 pollution and covid-19 pandemic lockdown
The COVID-19 pandemic led to significant and temporary reductions in NO2 emissions and concentrations due to lockdowns, reduced economic activity, and changes in transportation patterns. The episode provided valuable insights into the relationship between human activities and air quality and prompted discussions on future strategies for achieving cleaner and healthier urban environments. The spatial distribution of NO2 concentrations from Sentinel-5P is presented here for different dates to compare average tropospheric NO2 column number density (Figure 9). Each colour represents various levels of concentration. The dark red colour indicates the highest values of NO2 concentrations which equals to 1.0E-4 mol/m2 and the dark blue represents the least concentration of NO2 which equals to 0 mol/m2 (Figure 10). NO2 concentration is highest in the east, then the north and west shows less concentration of NO2, and the south has the least concentration in the pre Covid-19 era presented here as the date of 26/11/2019. In contrast to that, on 29/12/2019 the north, northeast and northwest have higher NO2 concentration and the south and southwest shows less NO2 concentration. During 2020 pandemic, the level of NO2 decreased dramatically although the north, northwest and northeast yet had higher NO2 concentration compared to other locations on the map as seen on 27/3/2020 had the lowest level of NO2. The dark red colour for the southeast, the centre and east displayed for the day 27/3/2021 depicts the highest NO2 concentration.
Discussion
The comparison of NO2 concentration measurements acquired from Sentinel-5P as well as from ground-based stations reveals the significant impact weather has on NO2 levels. The results exhibit pattern of NO2 concentration which falls lower in the hotter months and higher in the colder months. Explanation may encompass on the increased traffic in colder months, as for UAE, the weather is much pleasant with average temperature in winters falling up to 19 °C as opposed to summer where average temperature may increase up to 41.3 °C. Point 3 station exhibit the highest average concentration level of NO2 which equals to 33.24 µg/m3. The area is known to have dense zone with schools, offices, and industries. Consequently, pulling more traffic of motor vehicle including loader trucks towards this area during the daytime. Point 1 station had the least average concentration level of NO2 which equals to 23.12 µg/m3. Point 1 area has less traffic compared to the other areas. The results highlighted that the traffic has huge impact on the NO2 levels which bring above the speculation of motor vehicles as being the principal urban anthropogenic source of primary NO2. A greater percentage of primary NO2 is present in the exhaust from diesel-fuelled vehicles compared to petrol-fuelled vehicles. Primary NO2 is created through high combustion, from ground-level emissions connected to the burning of fossil fuels in automobiles [19]. While comparing results of NO2 pollution with pre, mid and post pandemic era, we must point out that at the time of COVID-19 pandemic lockdown in 2020, significantly lower levels of NO2 concentrations has been recorded where we have less traffic compared to 2019 and 2021.The result shows that the COVID-19 pandemic indeed had a positive effect on air governance which was beneficial for human health.
The distribution of the NO2 pollution can be affected by the local climatic conditions. For example, pollutants can be spread and moved away from their source by strong winds and temperature is another climatic parameter to consider [20]. Which can tell that the emissions of NO2 can be distributed to near areas of the original source.
To our knowledge, this is the first report of this kind of analysis from the region of Fujairah, UAE which instigate, the positive environmental impact of reduced level of NO2 during the pandemic show that it is still possible to make great and rapid positive change. The conclusion follows from the fact that the highest levels of NO2 to appear are in crowded areas where we have more traffic and near to industrial area which are the north and the northeast areas of the Fujairah urban area.
Acknowledgments
The authors thank the Fujairah Research Centre (FRC) for their financial and technical support and Fujairah Environment Authority (FEA) for technical support. Authors also extends their gratitude to Muhammed Sirajul Huda Kalathingal for technical support in experimental work. Authors appreciate the continuous support of Ms. Aseela Al Moalla throughout the project and initiating this project.
Conflicts of interest
The authors declare that they have no conflict of interests.
References
- Seinfeld, J. Urban Air Pollution: State of the Science. 1989. Available online: www.sciencemag.org.
- Kampa, M.; Castanas, E. Human health effects of air pollution. Environmental Pollution 2008, 151, 362–367. [Google Scholar] [CrossRef] [PubMed]
- Olmo, N.R.S.; Saldiva, P.H.D.N.; Braga, A.L.F.; Lin, C.A.; de P, U.; Pereirai, L.A.A. A review of low-level air pollution and adverse effects on human health: Implications for epidemiological studies and public policy. Clinics 2011, 66, 681–690. [Google Scholar] [CrossRef] [PubMed]
- WHO. WHO global air quality guidelines. 2021.
- Ambient (outdoor) air pollution. 22 Sep. 2021. Available online: https://www.who.int/news-room/fact-sheets/detail/ambient-(outdoor)-air-quality-and-health (accessed Sep. 25, 2022).
- WHO. Health Aspects of Air Pollution with Particulate Matter, Ozone and Nitrogen Dioxide Report on a WHO Working Group OZONE-adverse effects NITROGEN DIOXIDE-adverse effects AIR POLLUTANTS, ENVIRONMENTAL-adverse effects META-ANALYSIS AIR-standards GUIDELINES. 2003. [Google Scholar]
- EPA. climate change. 2022. Available online: https://www.epa.gov/climate-indicators/greenhouse-gases (accessed Sep. 25, 2022).
- Loh, H.C.; Looi, I.; Ch’ng, A.S.H.; Goh, K.W.; Ming, L.C.; Ang, K.H. Positive global environmental impacts of the COVID-19 pandemic lockdown: a review. GeoJournal 2021. [Google Scholar] [CrossRef] [PubMed]
- Shanableh, A.; et al. Effects of the COVID-19 lockdown and recovery on People’s mobility and air quality in the United Arab Emirates using satellite and ground observations. Remote Sens Appl 2022, 26, 100757. [Google Scholar] [CrossRef] [PubMed]
- Zheng, H.; et al. Significant changes in the chemical compositions and sources of PM2. 5 in Wuhan since the city lockdown as COVID-19. Science of the Total Environment 2020, 739, 140000. [Google Scholar] [CrossRef] [PubMed]
- Bherwani, H.; et al. Valuation of air pollution externalities: comparative assessment of economic damage and emission reduction under COVID-19 lockdown. Air Qual Atmos Health 2020, 13, 683–694. [Google Scholar] [CrossRef] [PubMed]
- Del Buono, M.G.; Iannaccone, G.; Camilli, M.; Del Buono, R.; Aspromonte, N. The Italian outbreak of COVID-19: conditions, contributors, and concerns. In Mayo Clinic Proceedings; Elsevier, 2020; pp. 1116–1118. [Google Scholar]
- Teixidó, O.; et al. The influence of COVID-19 preventive measures on the air quality in Abu Dhabi (United Arab Emirates). Air Qual Atmos Health 2021, 14, 1071–1079. [Google Scholar] [CrossRef] [PubMed]
- Suryati, I.; Khair, H.; Gusrianti, D. Distribution analysis of nitrogen dioxide (NO 2 ) and ozone (O 3 ) in Medan city with Geographic Information System (GIS). [CrossRef]
- About Fujairah. 20 Sep. 2022. Available online: http://fujegovt.ae/aboutfujairah.html (accessed Sep. 20, 2022).
- Fujairah’s population. 02 May 2021. Available online: https://www.wam.ae/en/details/1395302931971 (accessed Sep. 20, 2022).
- Gómez, A.C. ESA UNCLASSIFIED-For Official Use Exercise with EO Browser: Air Pollution (Sentinel-2, Sentinel-5P). 2019. [Google Scholar]
- Mohammed Bin Rashid Space Centre. NO2 Concentration in the Gulf Region & the UAE. 29 Sep 2021. Available online: https://storymaps.arcgis.com/stories/246700bd610b4cf682f31fd5118b659c (accessed Sep. 24, 2022).
- Hallquist, E.; Mc Queen, E. DEPARTMENT OF BIOLOGICAL AND ENVIRONMENTAL SCIENCES INVESTIGATION OF THE NOX-NO2-WIND SPEED-RELATIONSHIP AND PRIMARY NO2 AT TWO MONITORING STATIONS IN GOTHENBURG, 2010 AND 2019. 2020. [Google Scholar]
- Ochando, L.C.; Julián, C.I.F.; Ochando, F.C. Airvlc: An application for real-time forecasting urban air pollution C` esar Ferri. 2015. Available online: http://www.aemet.
Figure 1.
The selected study area in Fujairah.
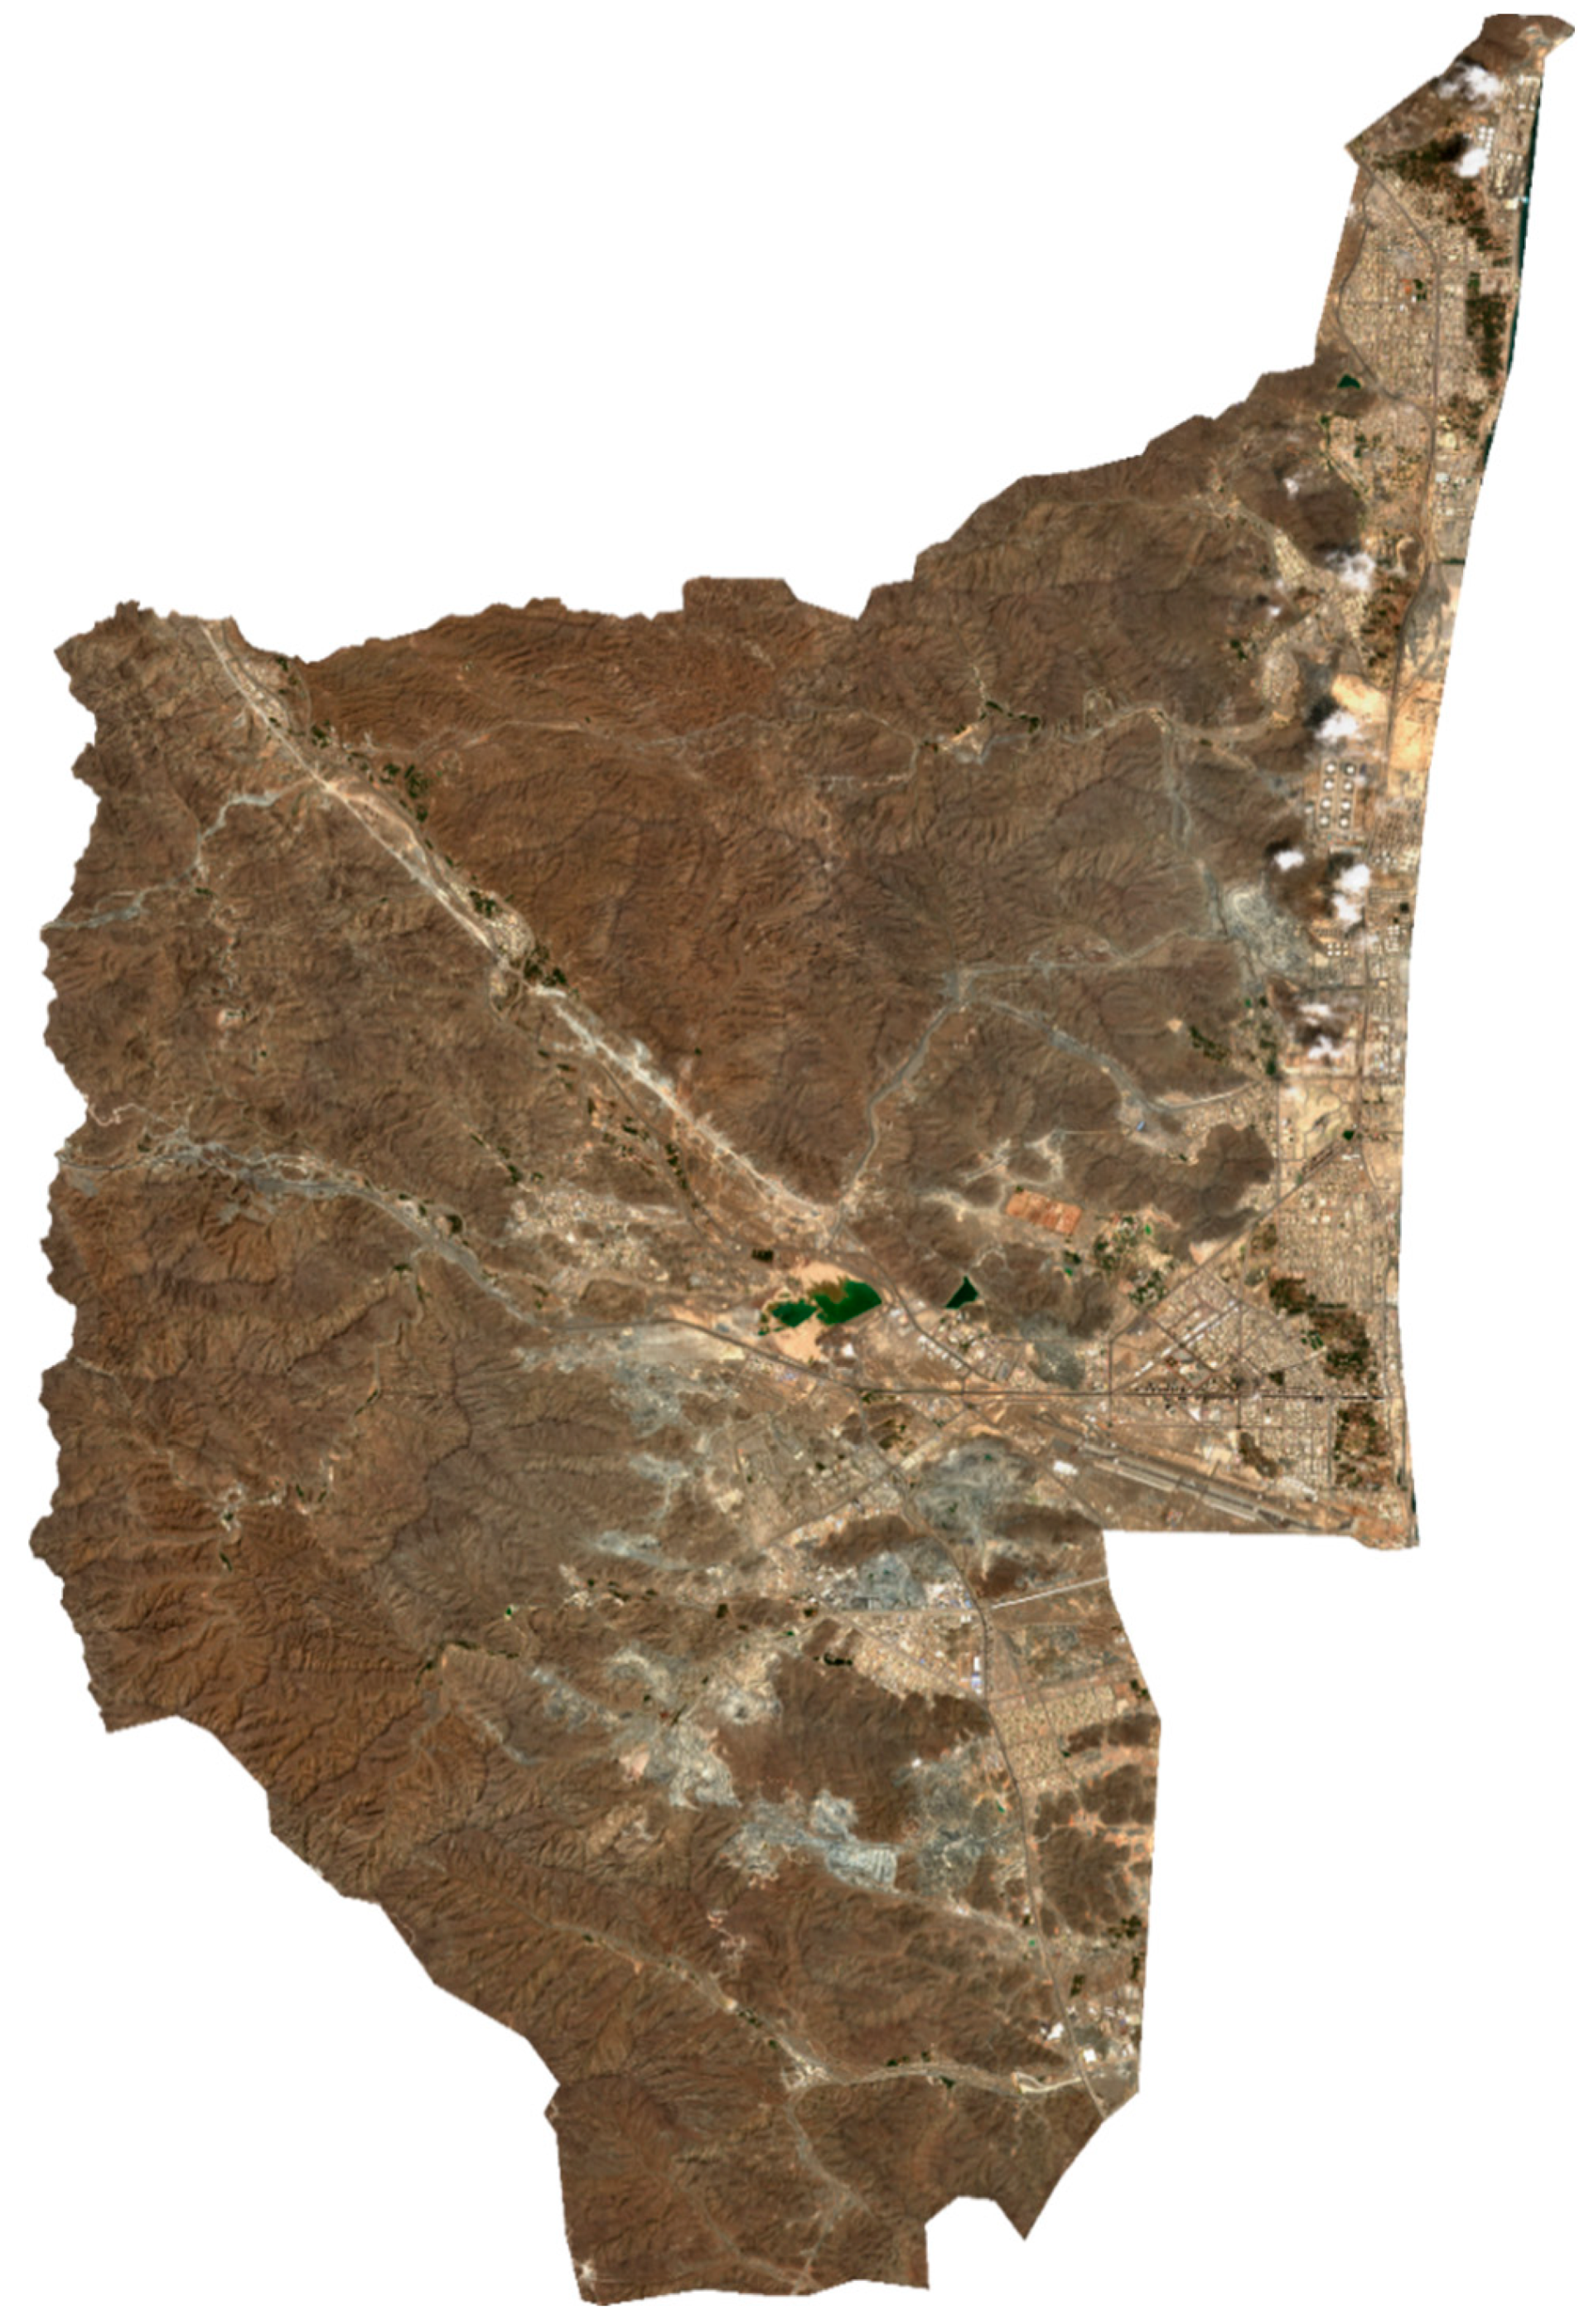
Figure 2.
The stations under study are marked on the map using GPS coordinates in the Google Earth Pro.
Figure 2.
The stations under study are marked on the map using GPS coordinates in the Google Earth Pro.
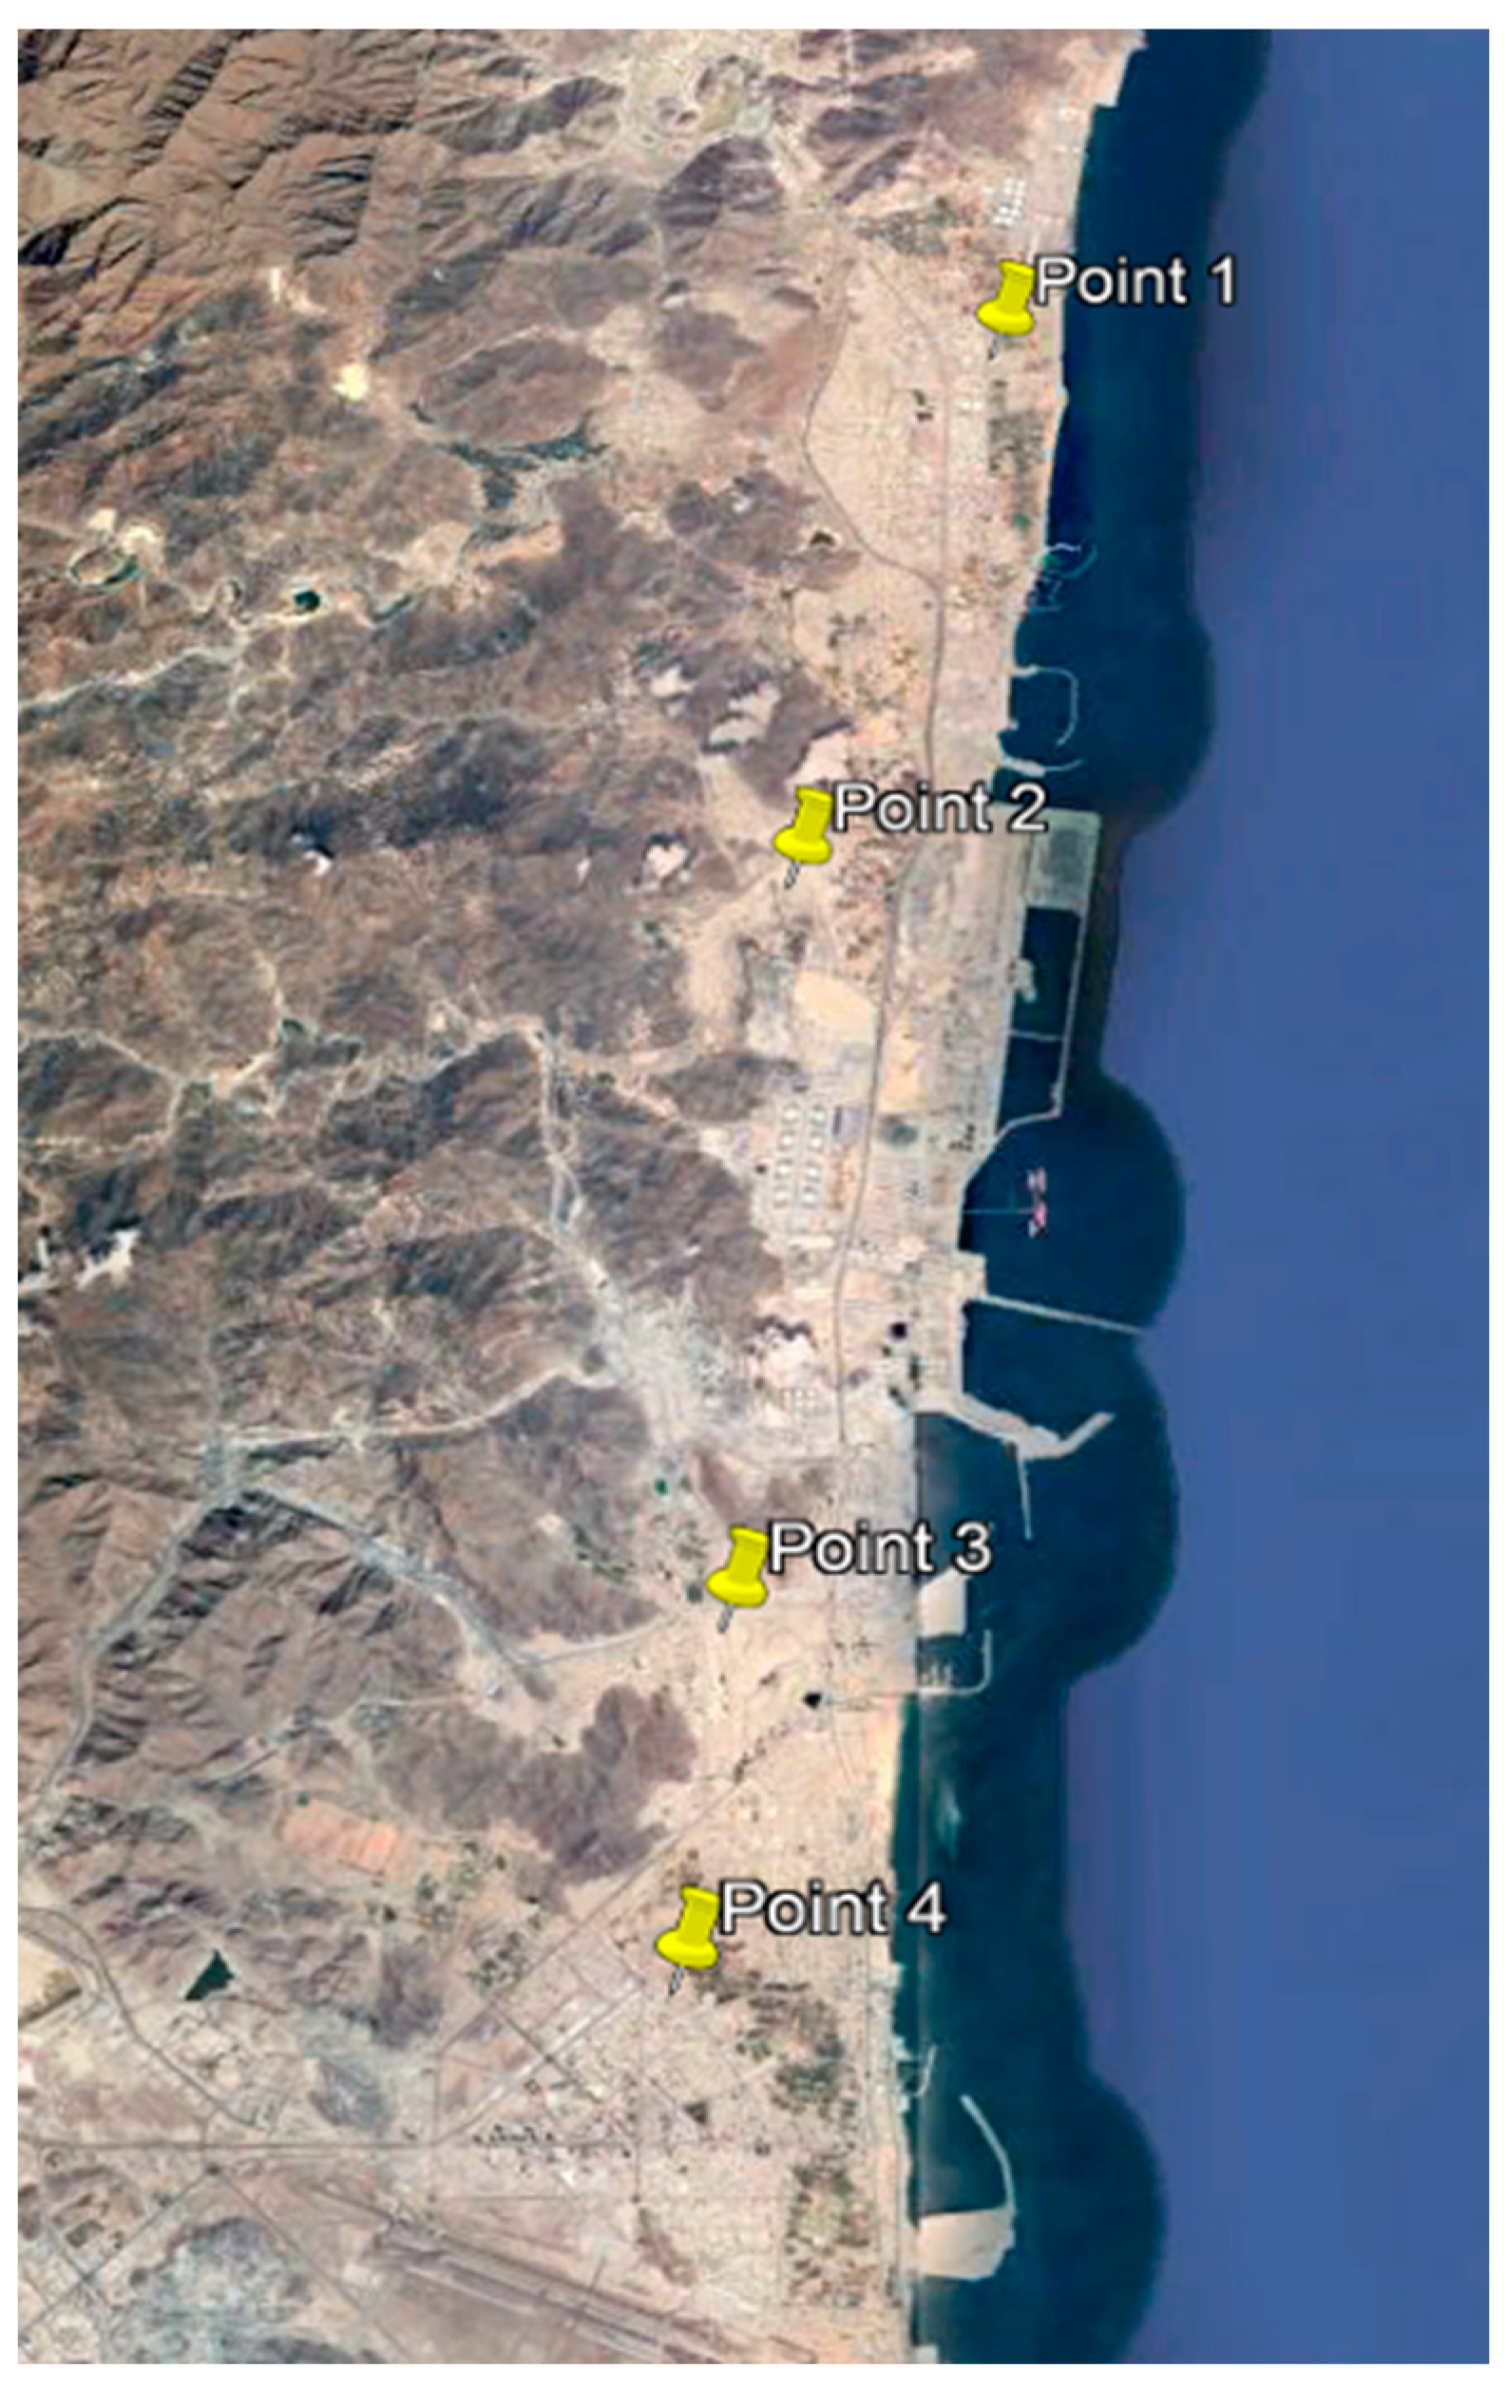
Figure 3.
The NO2 tropospheric column along with study area using Sentinel-5P.
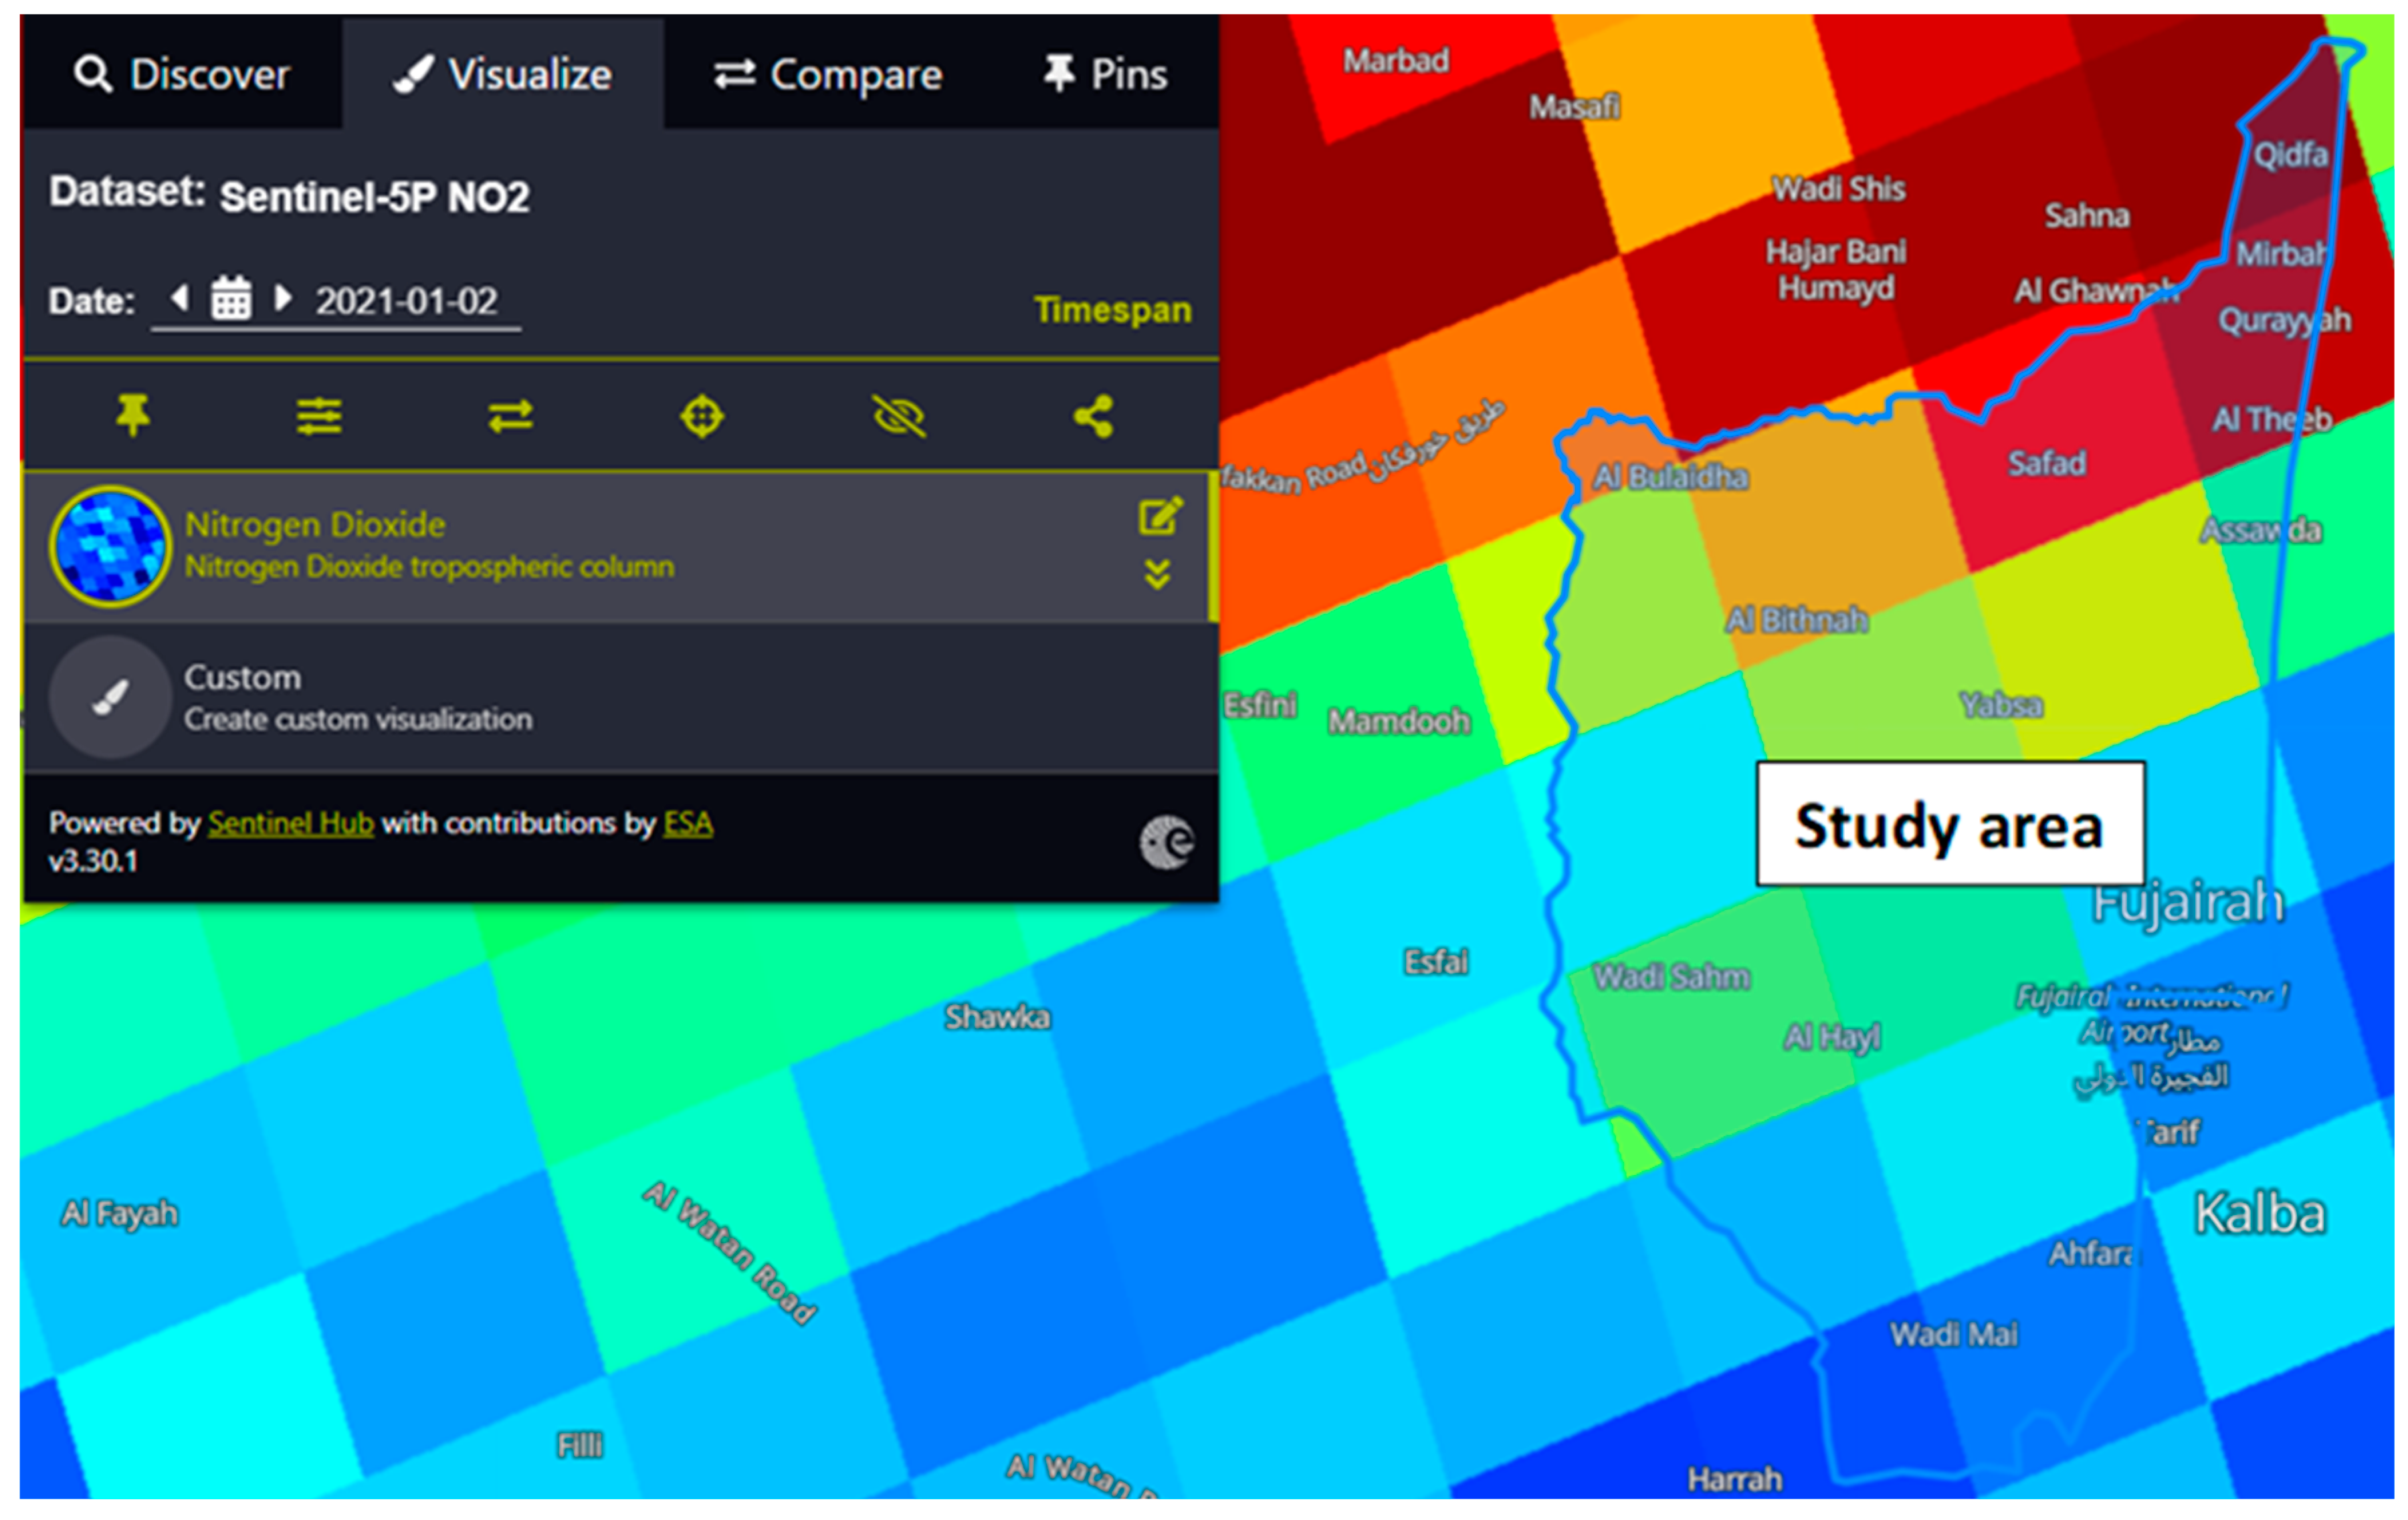
Figure 4.
Comparative dynamics of NO2 daily values for the year 2021 in Fujairah urban area, Point 3 ground-based station measurements are mentioned as orange line in µg/m³, Satellite data (Sentinel-5P) mentioned as blue line in mol/m against the dates on horizontal axis.
Figure 4.
Comparative dynamics of NO2 daily values for the year 2021 in Fujairah urban area, Point 3 ground-based station measurements are mentioned as orange line in µg/m³, Satellite data (Sentinel-5P) mentioned as blue line in mol/m against the dates on horizontal axis.
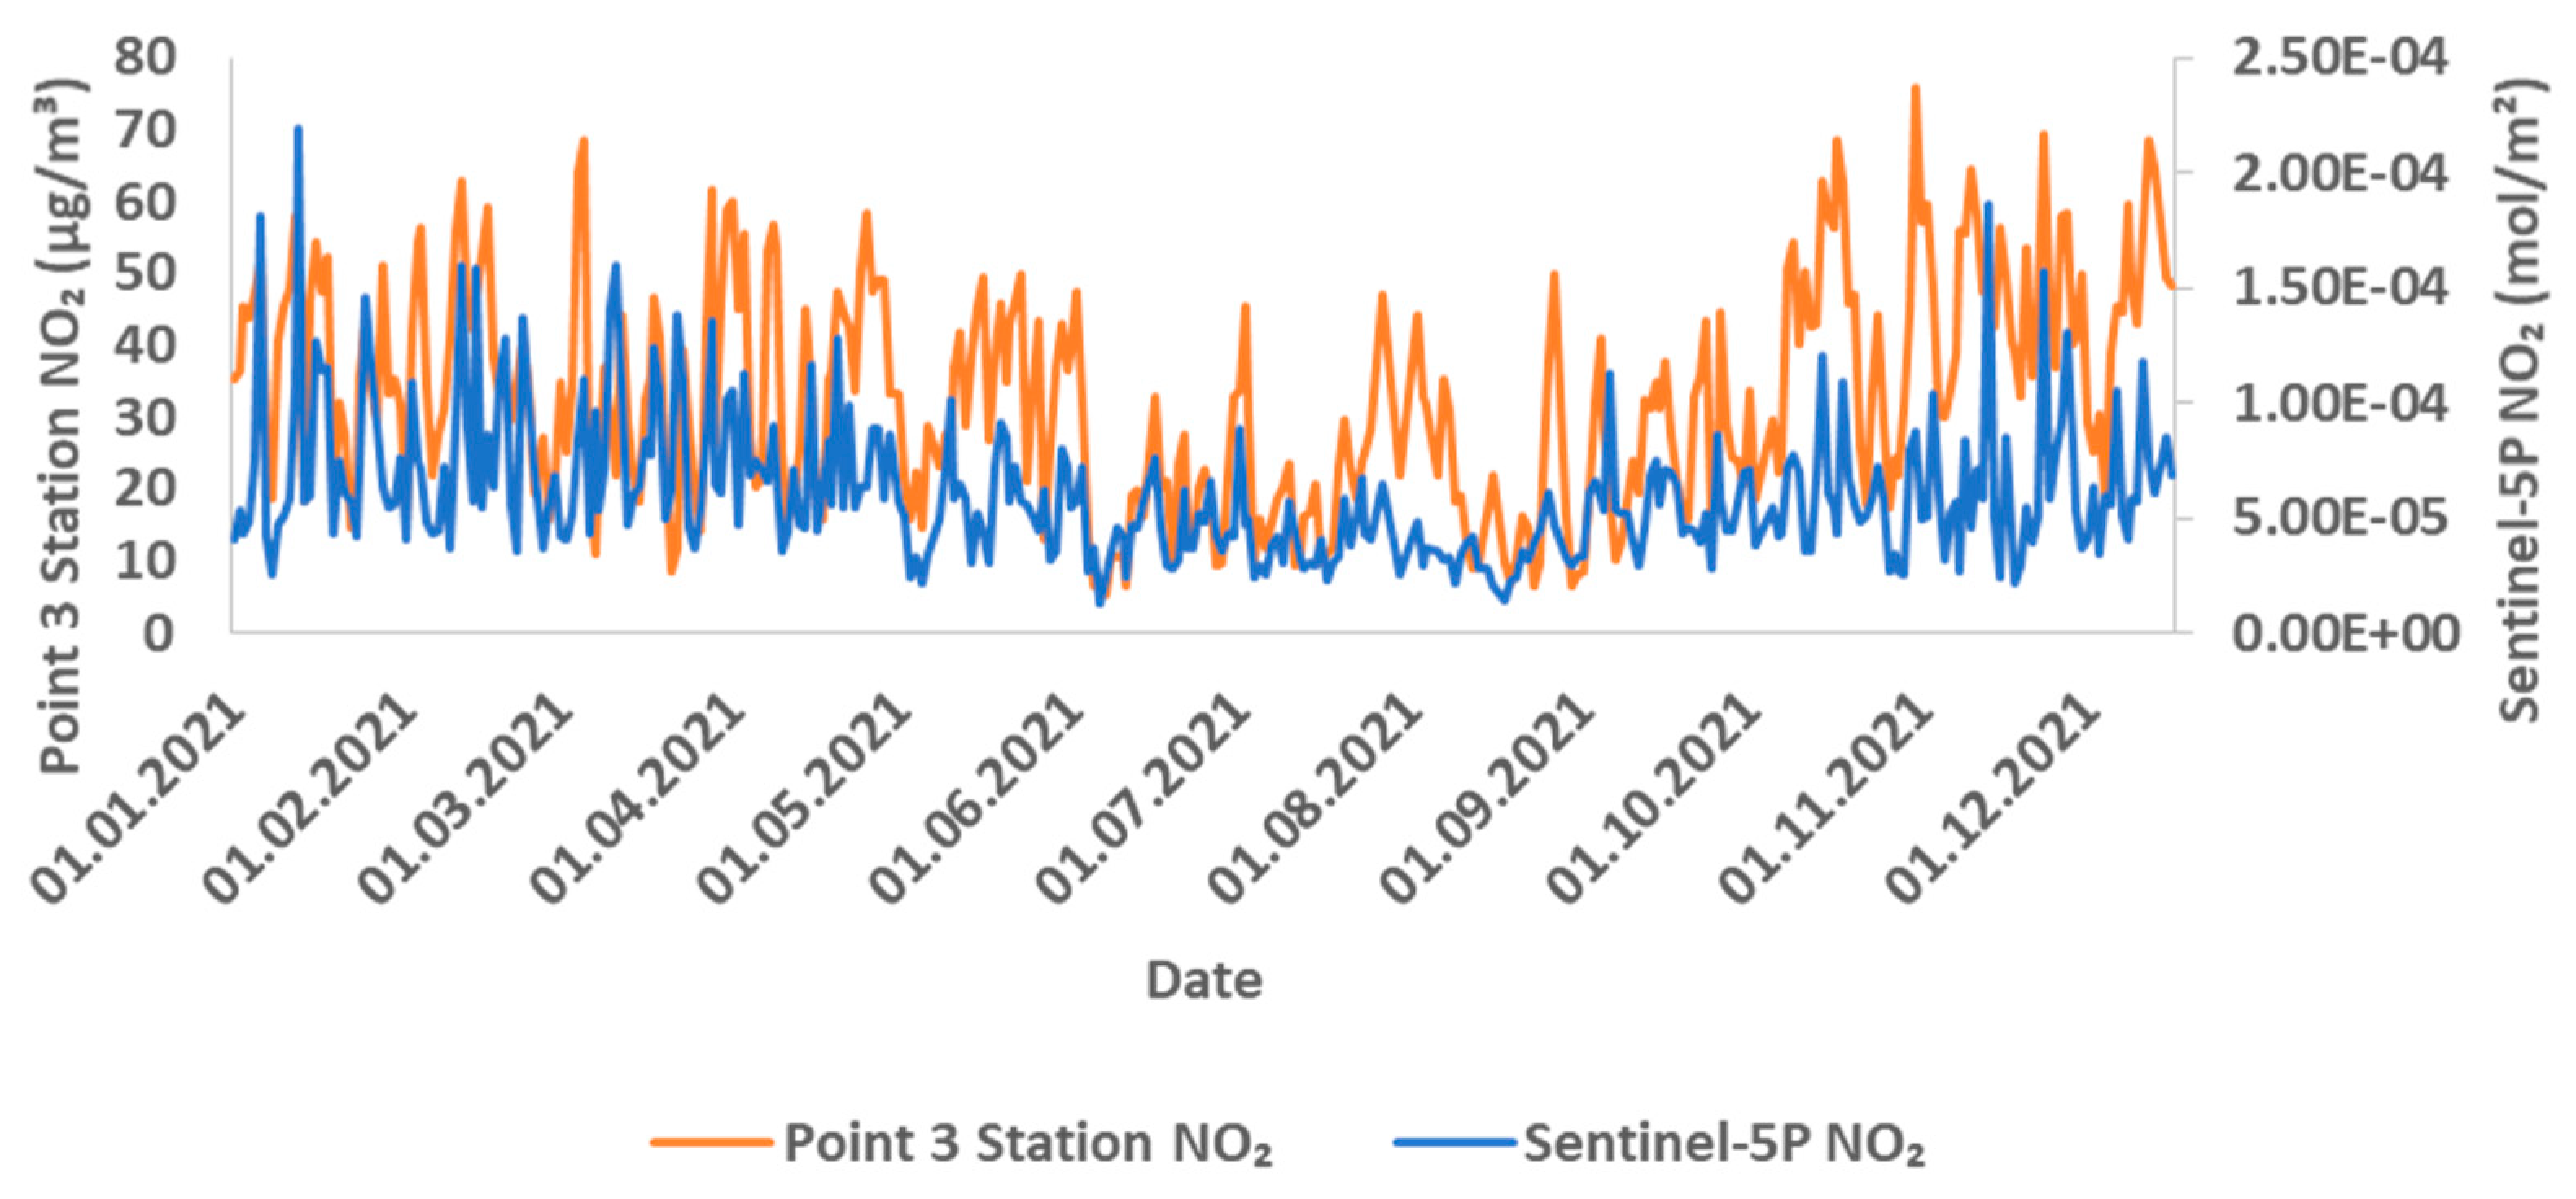
Figure 5.
Comparative dynamics of NO2 daily values for the year 2021 in Fujairah urban area, Point 4 ground-based station measurements are mentioned as orange line in µg/m³, Satellite data (Sentinel-5P) mentioned as blue line in mol/m against the dates on horizontal axis.
Figure 5.
Comparative dynamics of NO2 daily values for the year 2021 in Fujairah urban area, Point 4 ground-based station measurements are mentioned as orange line in µg/m³, Satellite data (Sentinel-5P) mentioned as blue line in mol/m against the dates on horizontal axis.
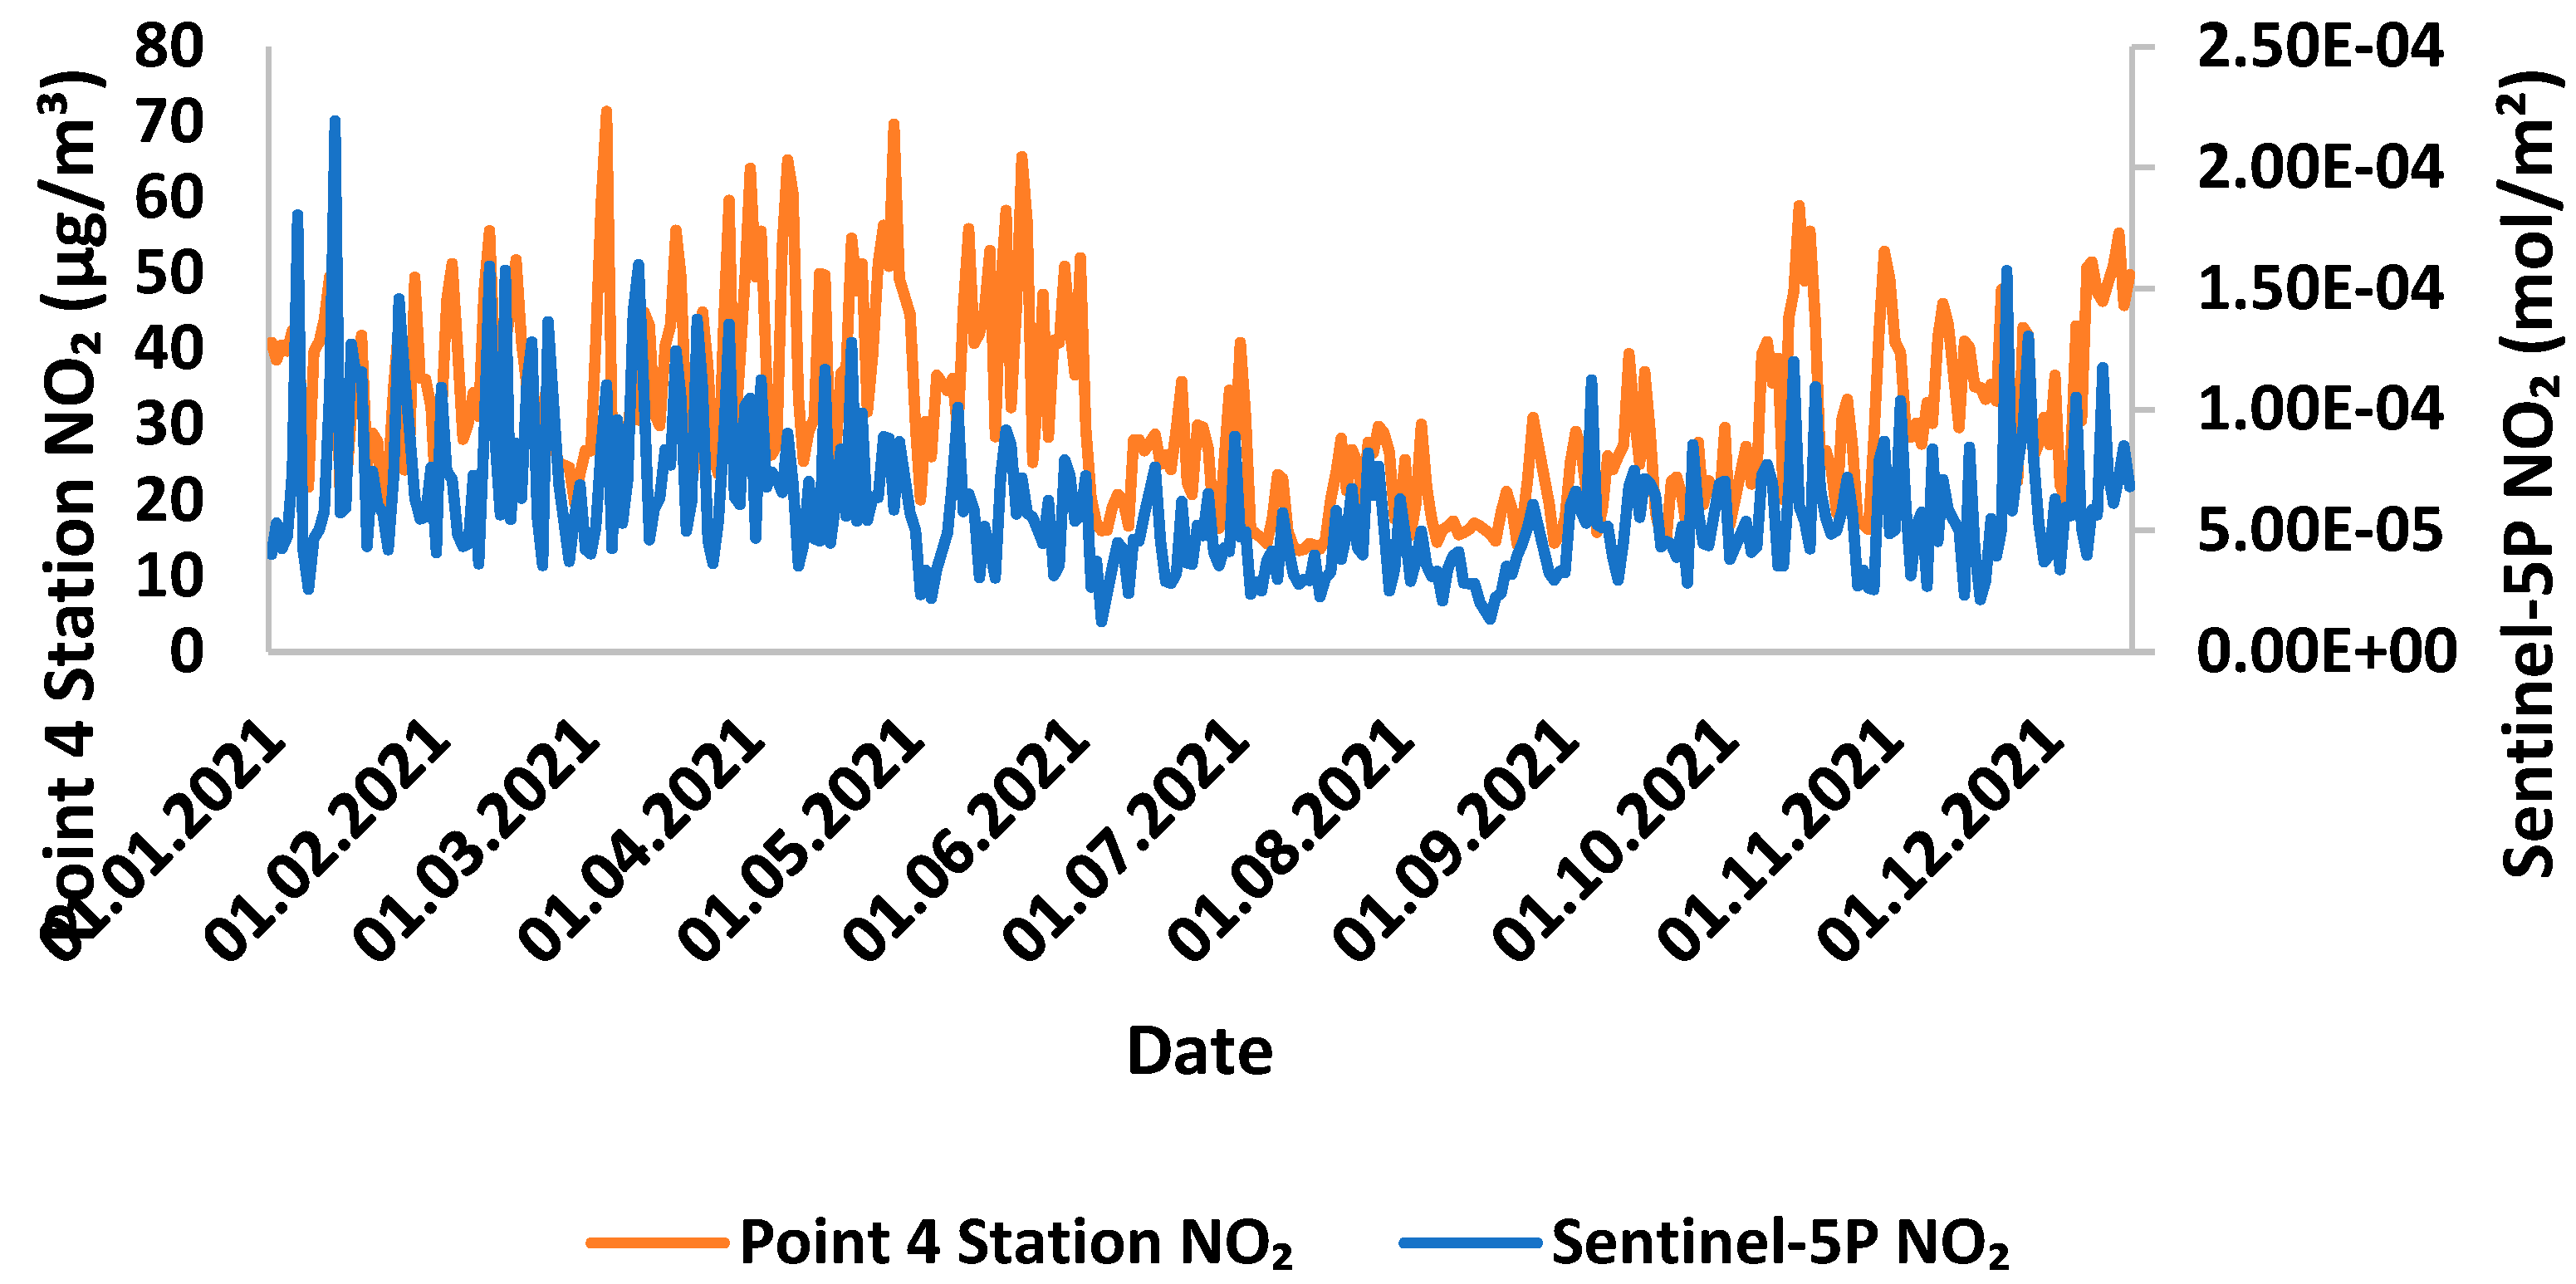
Figure 6.
Comparative dynamics of NO2 daily values for the year 2021 in Fujairah urban area, Point 2 ground-based station measurements are mentioned as orange line in µg/m³, Satellite data (Sentinel-5P) mentioned as blue line in mol/m against the dates on horizontal axis. .
Figure 6.
Comparative dynamics of NO2 daily values for the year 2021 in Fujairah urban area, Point 2 ground-based station measurements are mentioned as orange line in µg/m³, Satellite data (Sentinel-5P) mentioned as blue line in mol/m against the dates on horizontal axis. .
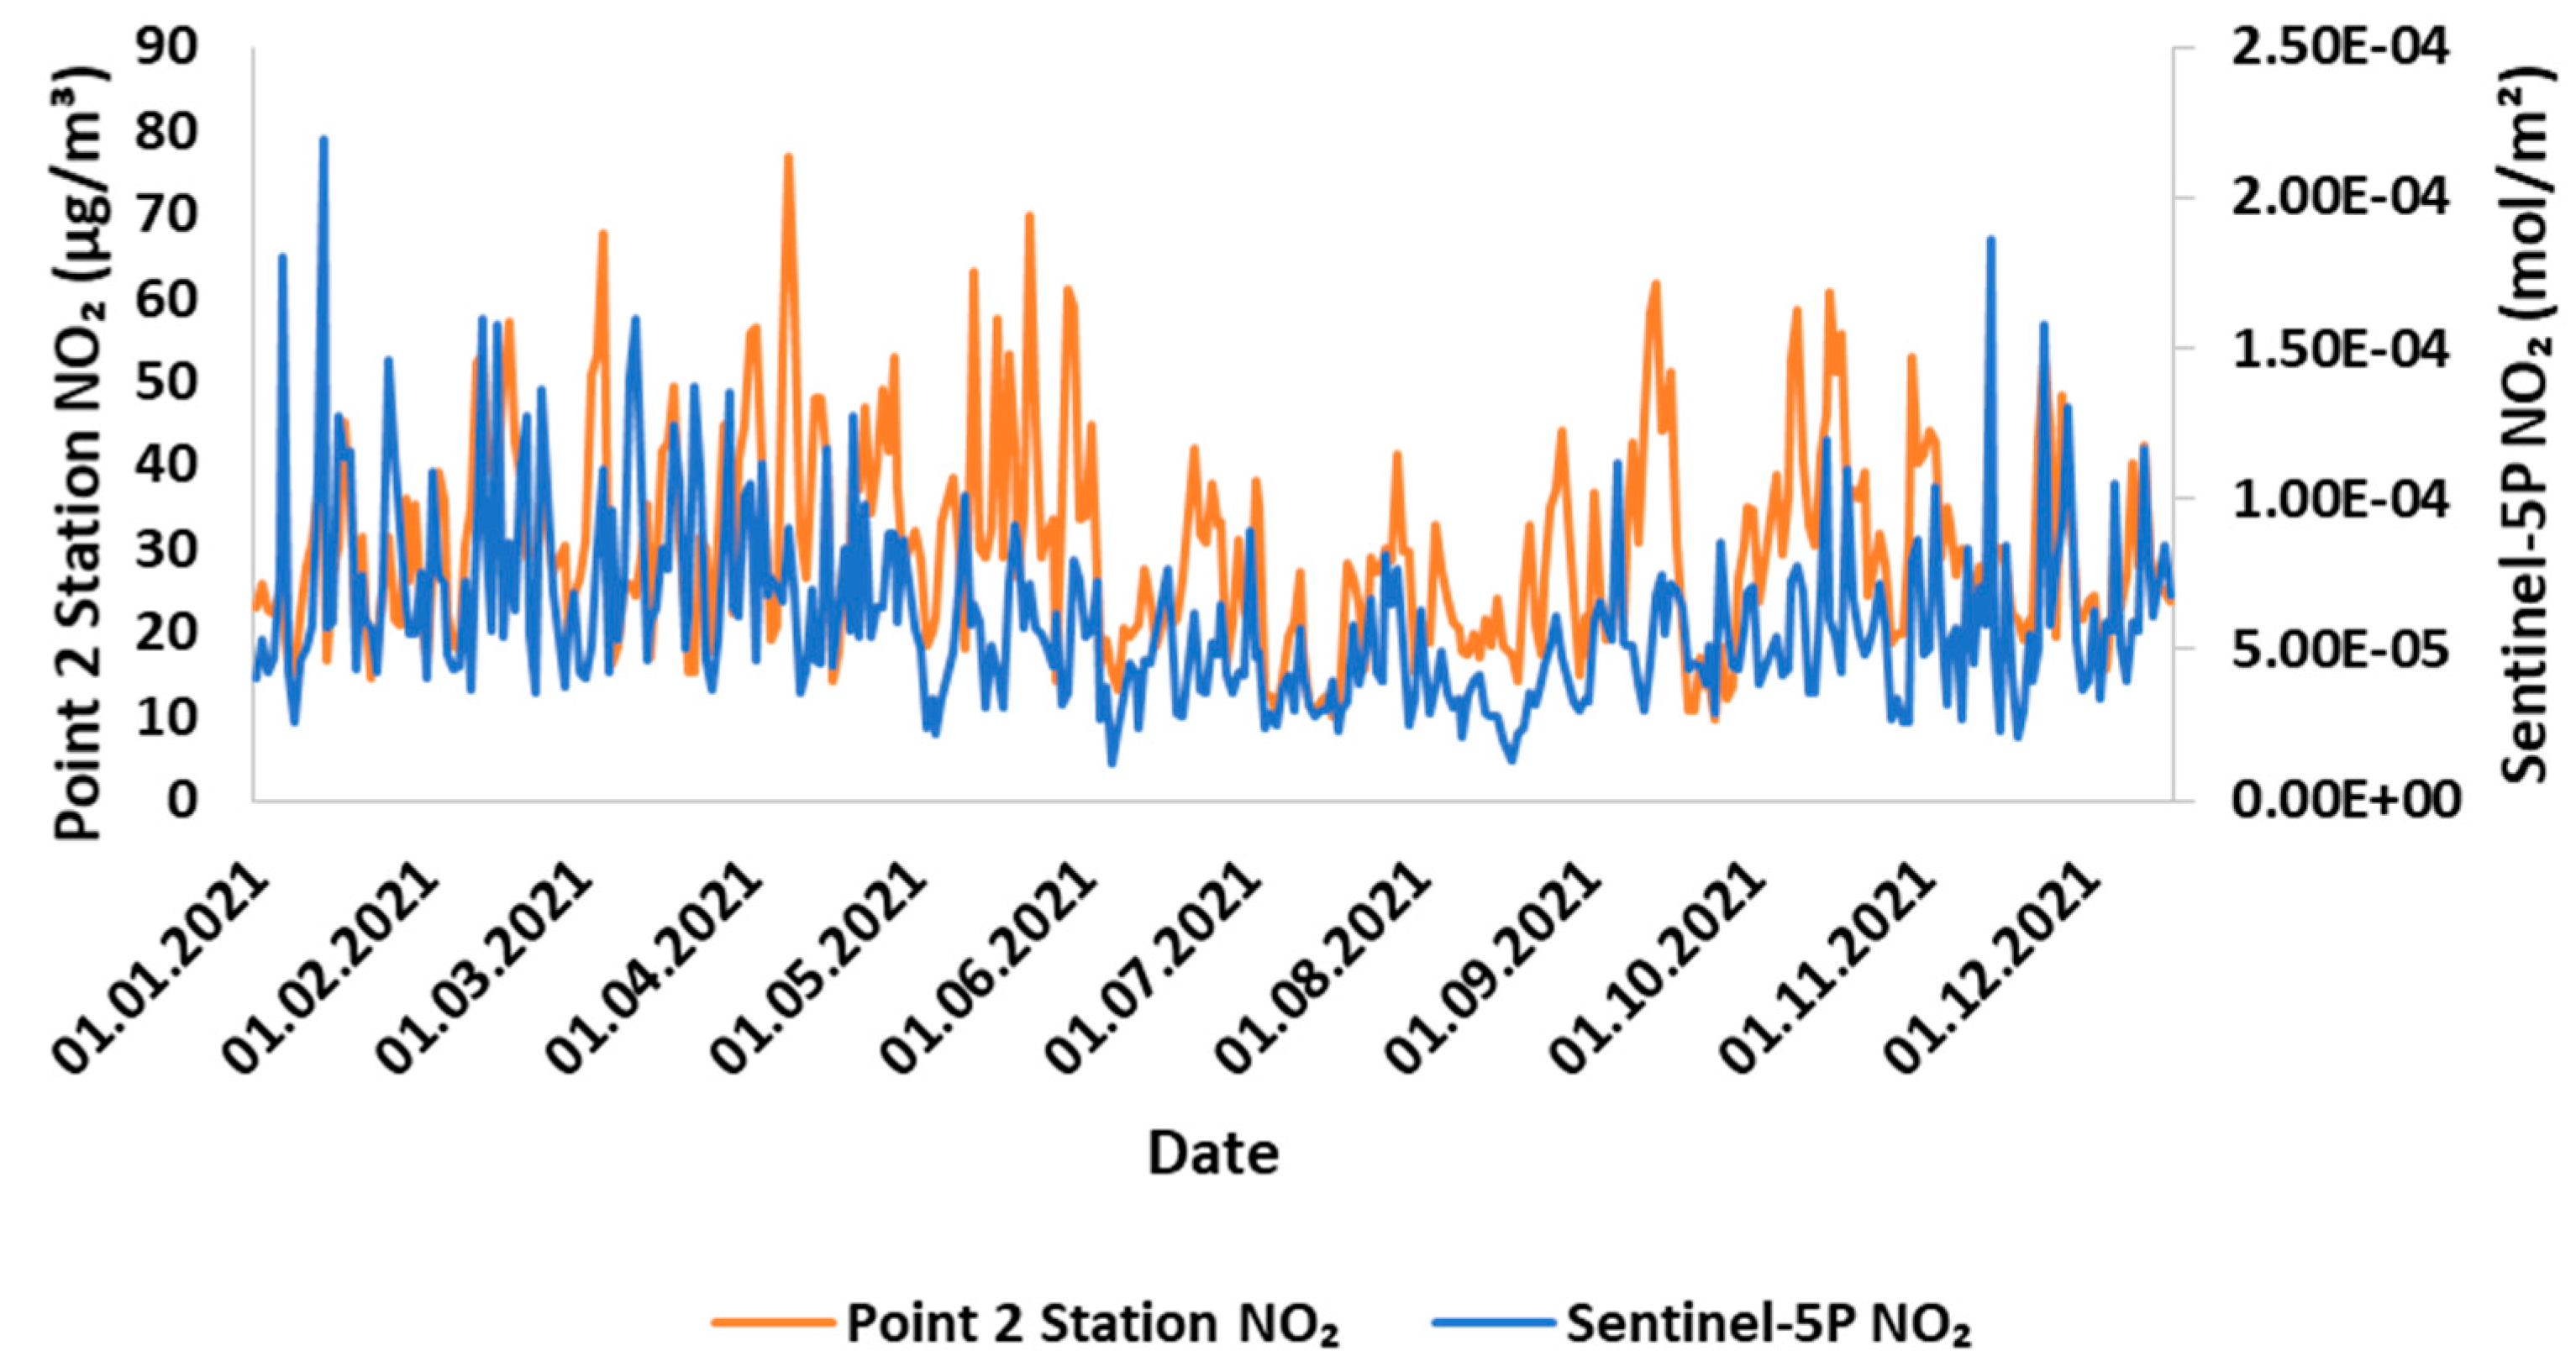
Figure 7.
Comparative dynamics of NO2 daily values for the year 2021 in Fujairah urban area, Point 1 ground-based station measurements are mentioned as orange line in µg/m³, Satellite data (Sentinel-5P) mentioned as blue line in mol/m against the dates on horizontal axis.
Figure 7.
Comparative dynamics of NO2 daily values for the year 2021 in Fujairah urban area, Point 1 ground-based station measurements are mentioned as orange line in µg/m³, Satellite data (Sentinel-5P) mentioned as blue line in mol/m against the dates on horizontal axis.
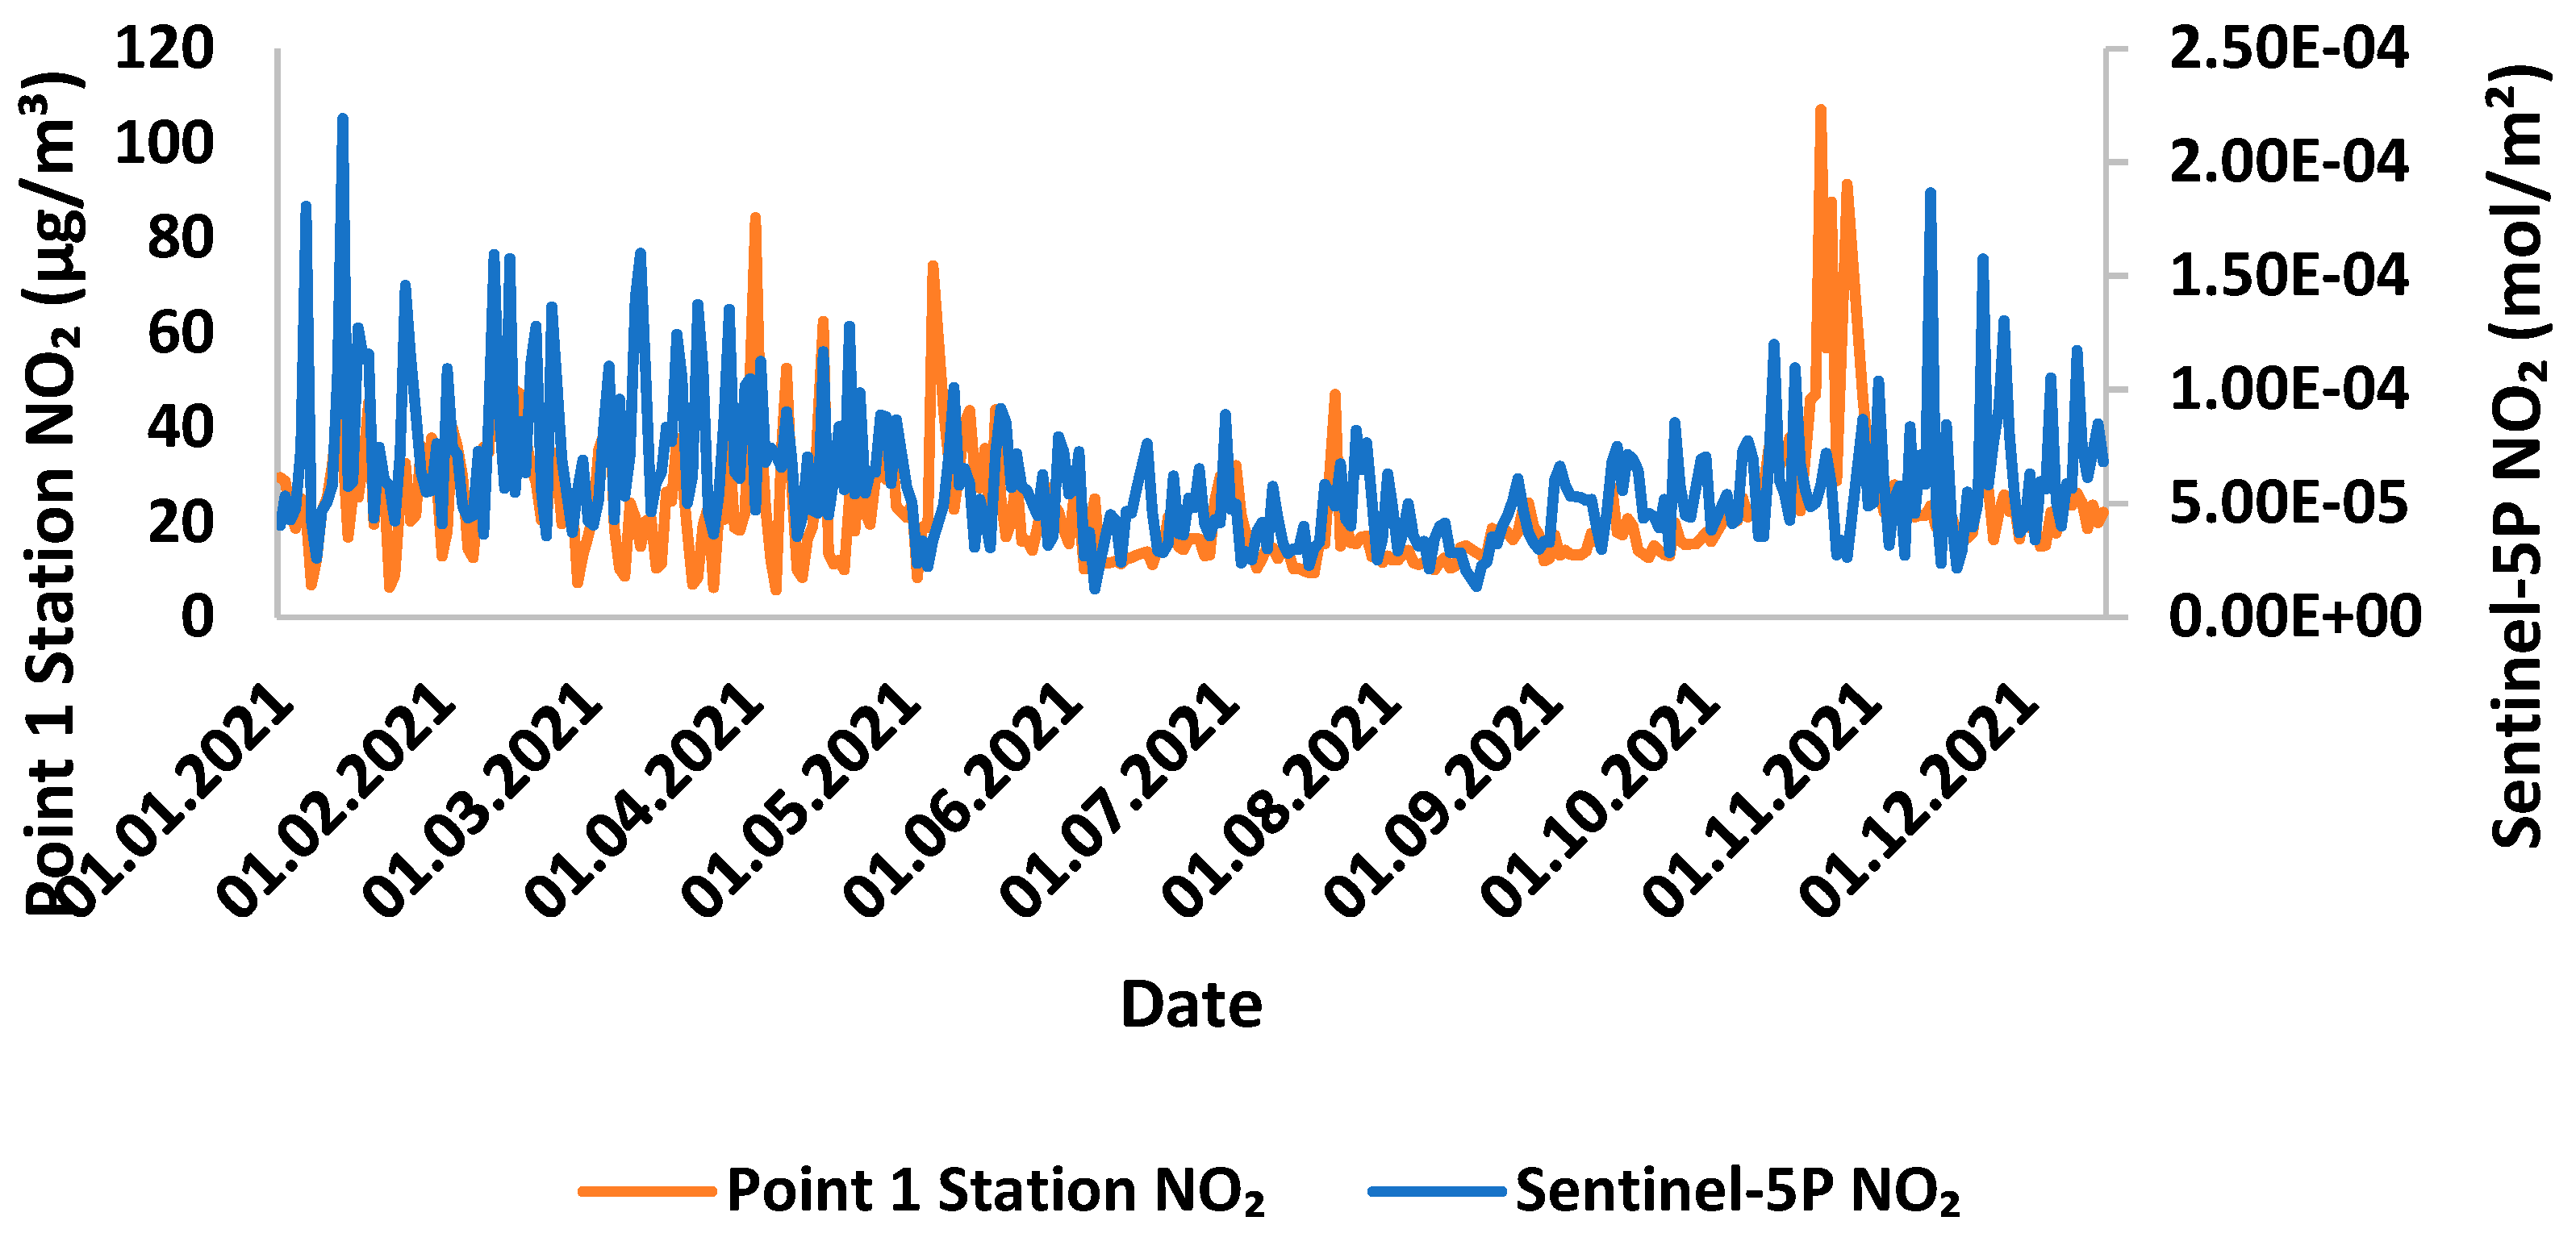
Figure 8.
Average temperature in Celsius for each month of 2021 retrieved from Skamkam station data, Average temperatures in Celsius (°C) are shown in vertical axis and the months of 2021 on horizontal axis.
Figure 8.
Average temperature in Celsius for each month of 2021 retrieved from Skamkam station data, Average temperatures in Celsius (°C) are shown in vertical axis and the months of 2021 on horizontal axis.
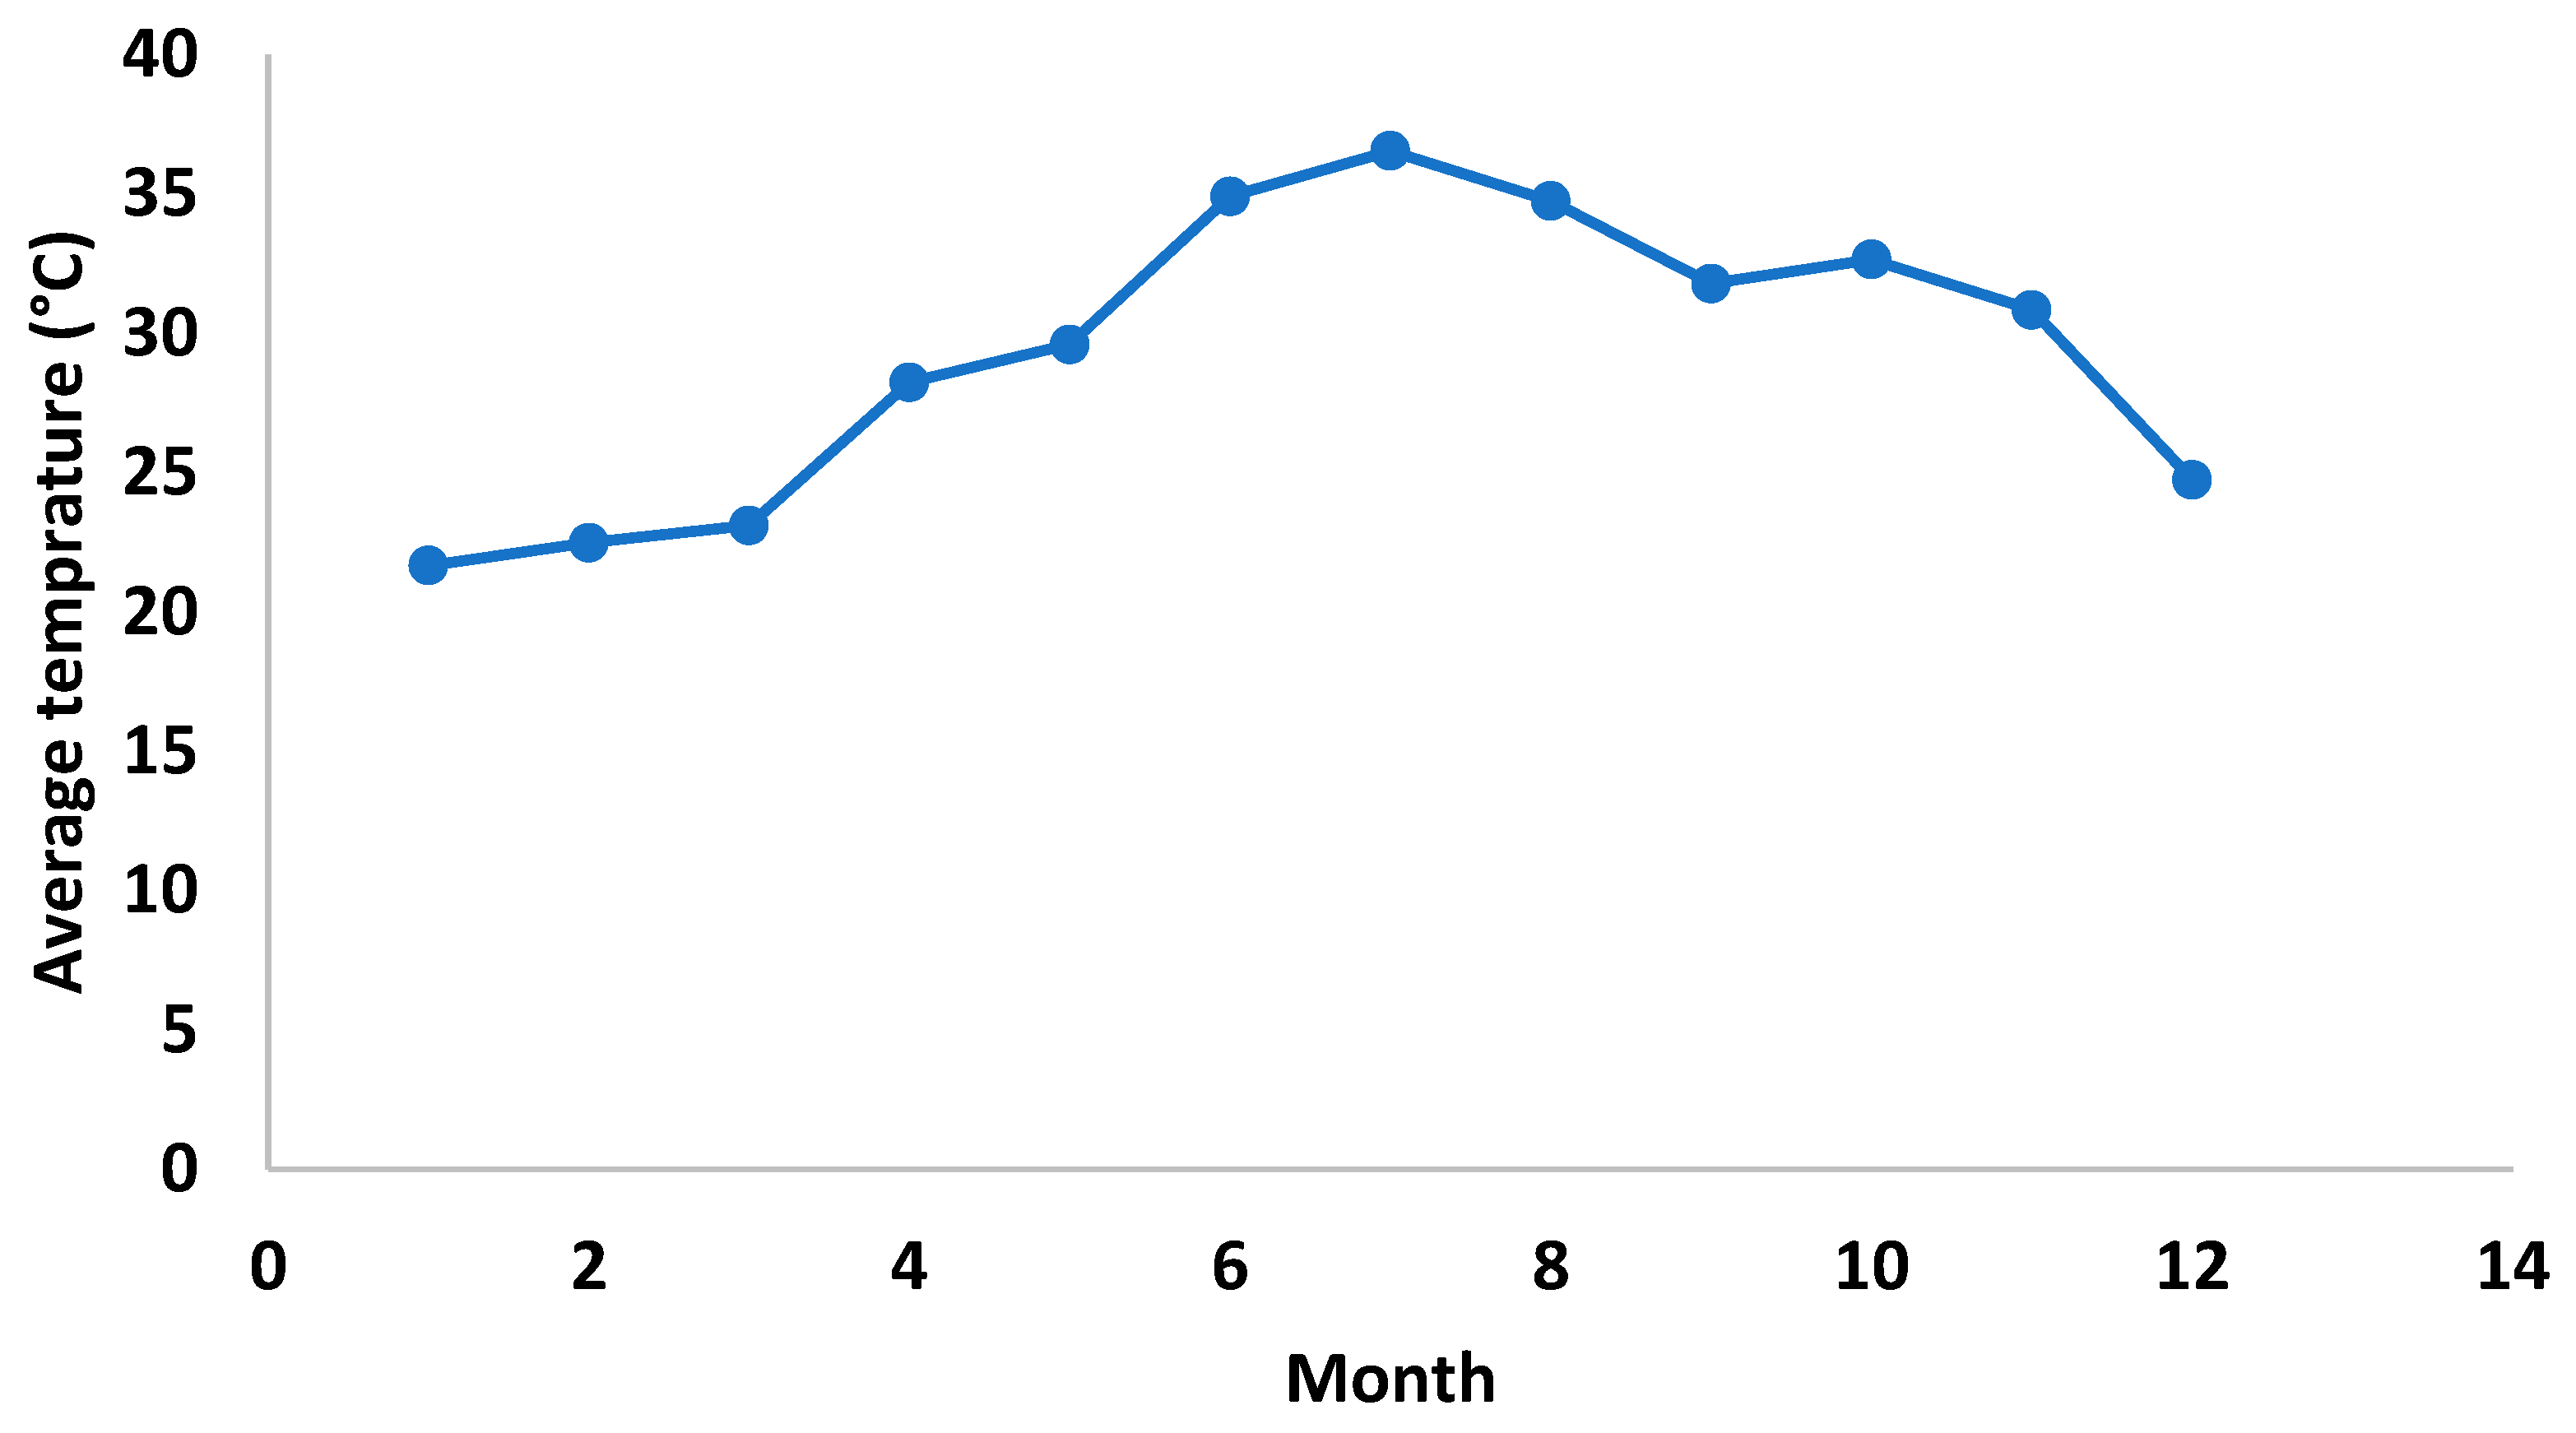
Figure 9.
spatial distribution of NO2 concentrations from Sentinel-5P. comparative maps on selected dates of average tropospheric NO2 column number density over Fujairah urban area. On the right it shows the average tropospheric NO2 column number density index.
Figure 9.
spatial distribution of NO2 concentrations from Sentinel-5P. comparative maps on selected dates of average tropospheric NO2 column number density over Fujairah urban area. On the right it shows the average tropospheric NO2 column number density index.
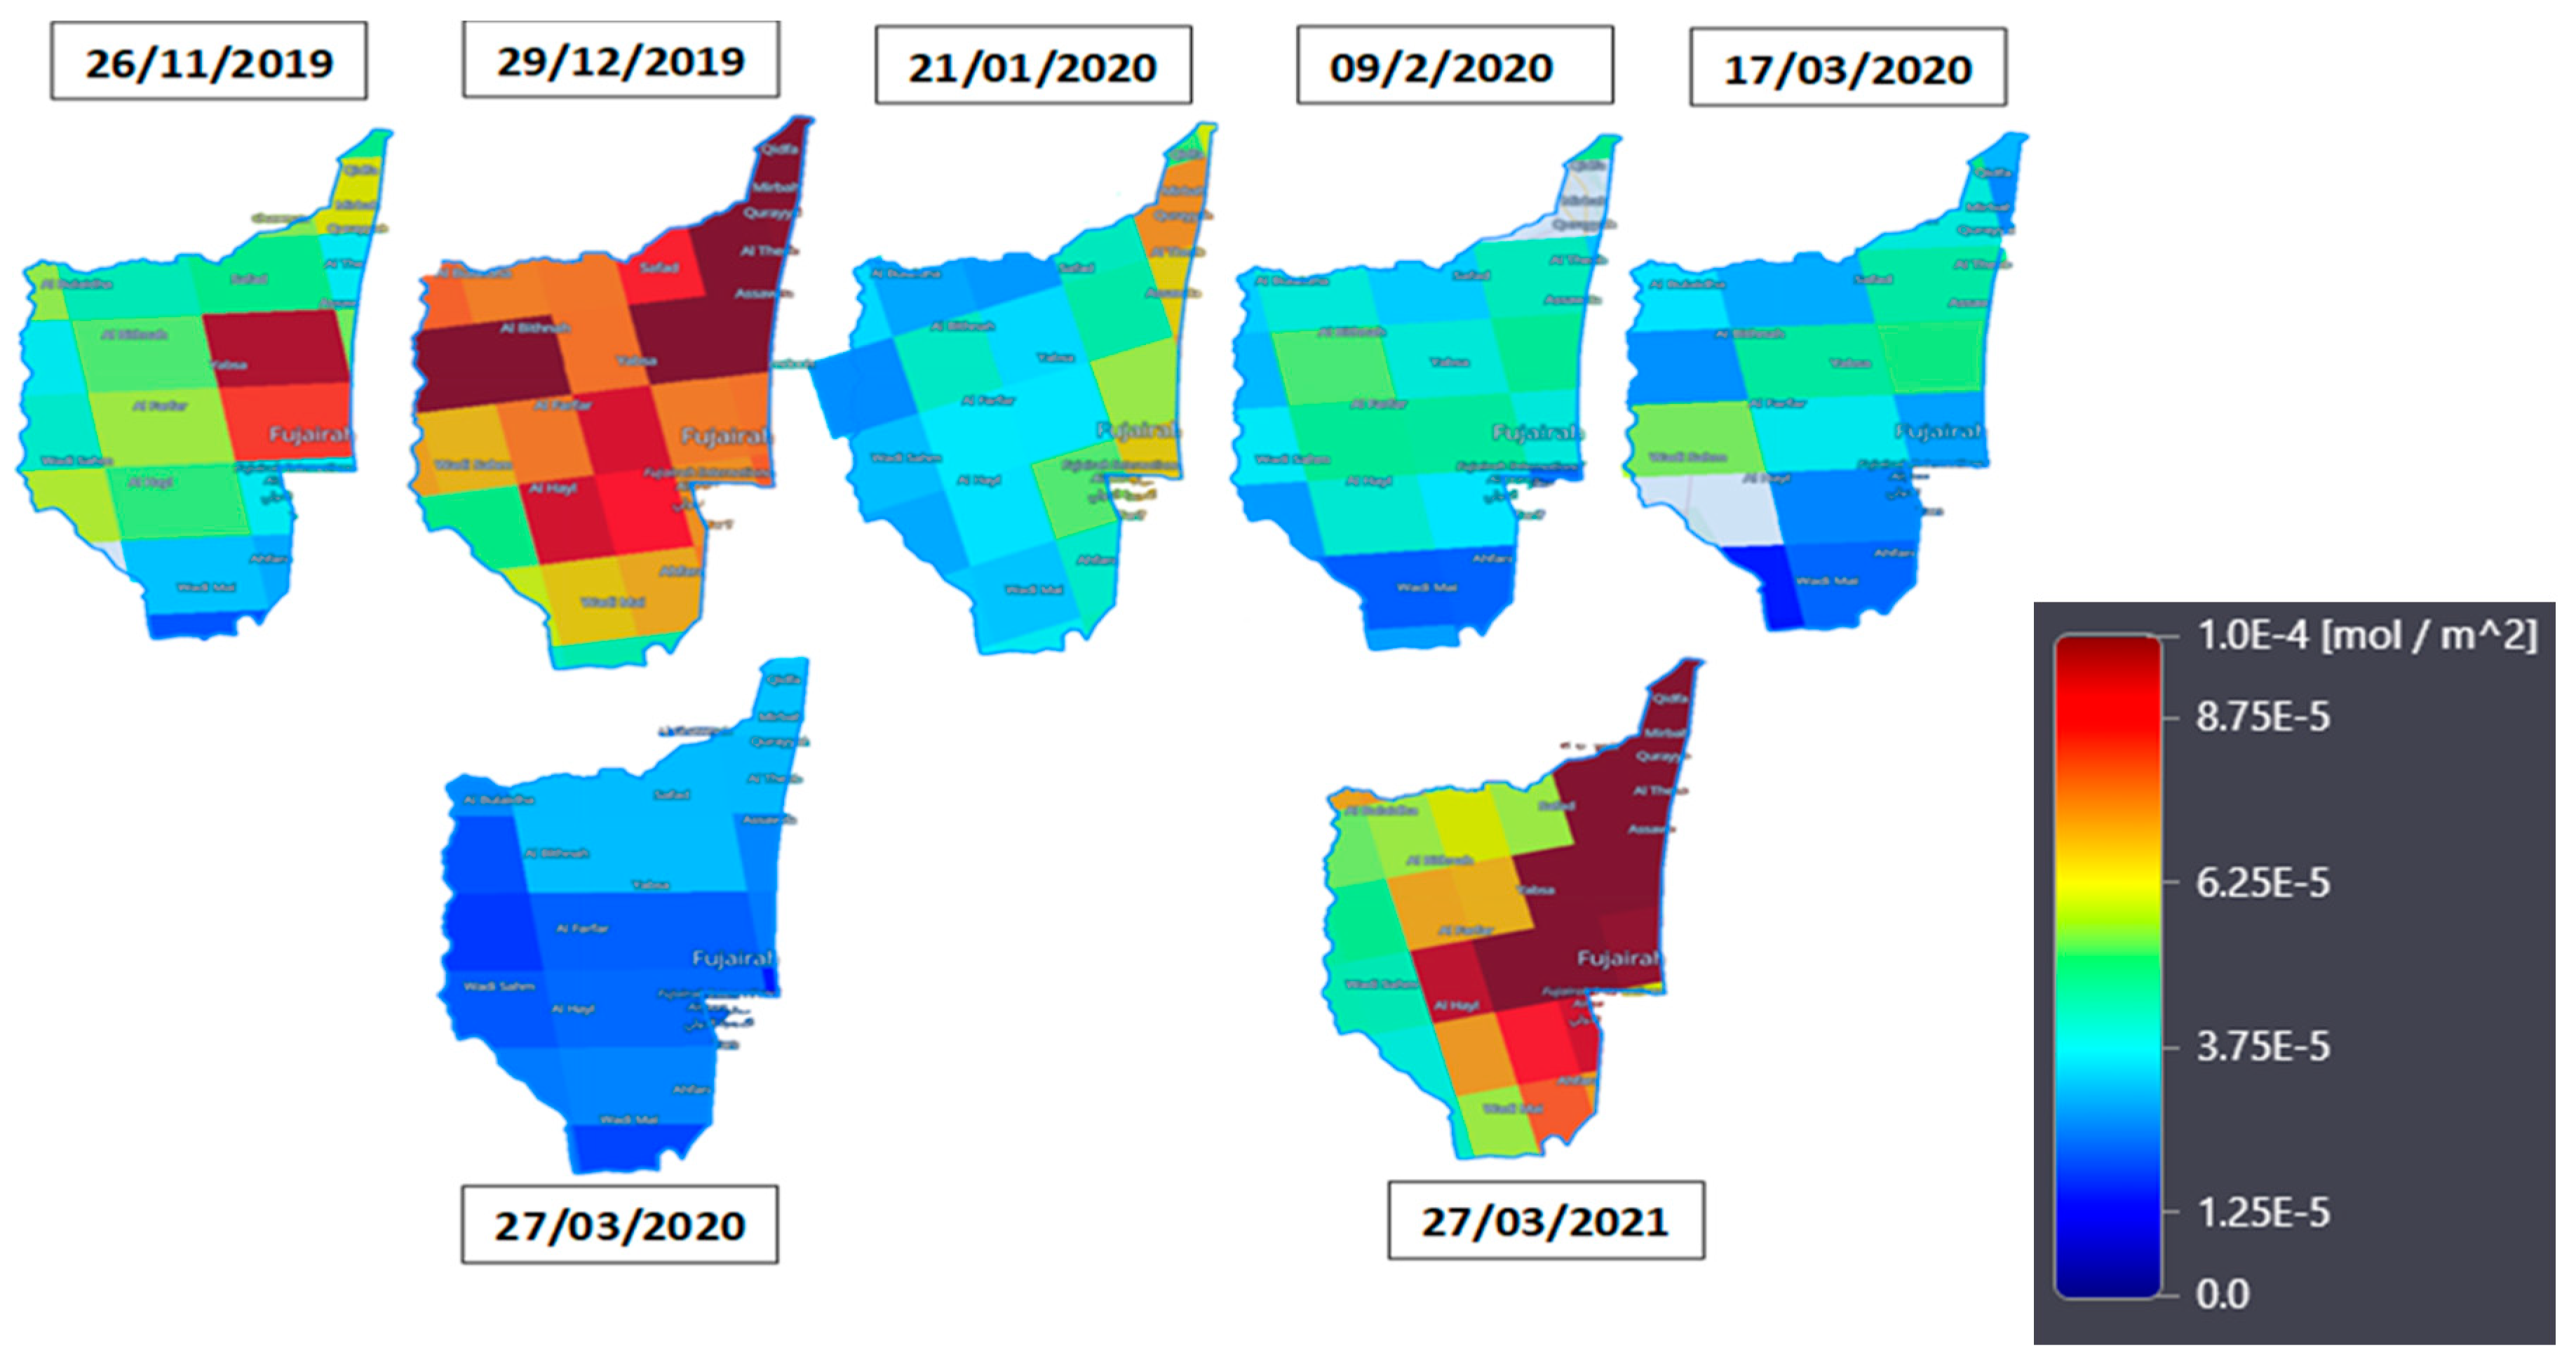

Table 1.
Location and classification of spatial nature of the Areas where ground based stations are installed.
Table 1.
Location and classification of spatial nature of the Areas where ground based stations are installed.
| Station Name | Classification Of Spatial Nature |
| Point 1 | Residential – Industrial |
| Point 2 | Residential – Industrial |
| Point 3 | Residential – Industrial |
| Point 4 | Residential – Urban |
Disclaimer/Publisher’s Note: The statements, opinions and data contained in all publications are solely those of the individual author(s) and contributor(s) and not of MDPI and/or the editor(s). MDPI and/or the editor(s) disclaim responsibility for any injury to people or property resulting from any ideas, methods, instructions or products referred to in the content. |
© 2023 by the authors. Licensee MDPI, Basel, Switzerland. This article is an open access article distributed under the terms and conditions of the Creative Commons Attribution (CC BY) license (http://creativecommons.org/licenses/by/4.0/).
Copyright: This open access article is published under a Creative Commons CC BY 4.0 license, which permit the free download, distribution, and reuse, provided that the author and preprint are cited in any reuse.


