
Submitted:
17 October 2023
Posted:
18 October 2023
You are already at the latest version
Abstract
Green synthesis offers a superior alternative to traditional methods for producing metal and metal oxide nanoparticles. This approach is not only benign and safe but also cost-effective, scalable, and straightforward, operating under ambient conditions. Notable metals and metal oxide nanoparticles, such as manganese oxides, iron oxides, silver, and gold, have been produced using various bio-reductants derived from plant extracts. These biological agents not only expedite the reduction process but also stabilize the nanoparticles, serving dual roles as reducing and capping agents. This review presents the green synthesis of nanoparticles (NPs) obtained from biogenic wastes and plant extracts. The green-synthesized nanostructured MnO2 are evaluated as a potential photocatalyst for water treatment and as an electrode material in lithium-ion batteries and supercapacitors. The green-derived iron oxide nanoparticles are examined as promising antioxidant, anti-inflammatory, and anti-diabetic agents. Additionally, this review discusses the green synthesis of precious metal nanoparticles, specifically silver (Ag NPs) and gold (Au NPs), highlighting their potential medical applications in areas like antiviral treatments and cancer therapy.
Keywords:
Nanotechnology
; Green synthesis
; Metals
; Bio-reductants
; Lithium-ion batteries
; Supercapacitors
; Photocatalysts
; Cancer therapy.
1. Introduction
Modern nanotechnology research is gaining prominence due to its groundbreaking and encouraging outcomes in numerous sectors [7]. This rapidly evolving field has a profound influence on life science, especially in biotechnology and biomedical science areas [8,9,10]. Nanotechnology is pioneering the development of multifunctional nanomaterials for various applications such as energy storage, optical devices, medical devices, solar cells, biomedical and drug delivery, foods, cosmetic and paints, textile industry, etc. [11]. These span areas such as biomedical science, catalytic activity, beauty products, electric chemistry, electronic devices, energy technology, food processing, medical treatment, mechanical work, membrane modification, transparent products, drugs, sensors, aerospace sector, textiles, and water purification, highlighting their unparalleled versatility, efficacy, and adaptability [12,13,14,15,16]. Various nanoparticle morphologies are currently developed such as nanoshells, nanorods, nanoneedles, nanospheres, nanocubes, nanoplates, etc. Nanotechnology, as defined by the National Science Foundation of the United States encompasses the study of systems and materials with dimensions from 1 to 100 nm. This field delves into the control of physical and chemical properties and the integration of these nanoscale components into larger structures [17,18]. Nanoparticles (NPs) have garnered significant interest owing to their distinct chemical and physical attributes when compared to their bulk counterparts and their expansive surface area [19,20]. In the past decade, the National Nanotechnology Initiative in the US has allocated over $27 billion to this domain. Concurrently, the European Commission has channeled approximately €1.1 billion into nanotechnology ventures under the Horizon 2020 initiative [21,22].
A search on Web of Science revealed numerous articles on nanoparticles produced through green methods, reflecting global initiatives in the nanoparticle domain [23]. As population growth drives urbanization and industrial expansion, there's an increase in chemical waste, contributing to environmental degradation. Exploring nature and its inherent molecules for nanoparticle biosynthesis is favorable as it is cost-effective, environmentally benign, and energy-efficient [24]. NPs are typically produced using two primary methods: bottom-up and top-down. The top-down approach often involves the breakdown of bulk substances into NPs, while the bottom-up approach includes the assembly of atoms into NPs [25]. As illustrated in Figure 1, the top-down strategy employs various preparation techniques such as lithography, ball milling, etching, and sputtering to produce nanomaterials and nanoparticles. In contrast, the bottom-up approach utilizes several methods, including chemical vapor deposition, sol-gel processes, spray pyrolysis, laser pyrolysis, and atomic/molecular condensation [26].
Green synthesis of nanoparticles, rooted in nanobiotechnology [27], has become a central area of focus in nanotechnology research [28,29,30,31,32]. The biosynthesis of nanoparticles stands out due to its environmentally friendly, pure, cost-effective, and versatile nature, often carried out at room temperature [33,34,35,36,37,38]. The adoption of biosynthesis is crucial in avoiding the generation of toxic or hazardous byproducts, emphasizing the need for straightforward and benign production techniques [26]. Practically, green synthesis of nanoparticles is not only cost-effective but can also be efficiently conducted under ambient conditions. During a one-step synthesis process, a natural bio-reductant extract is mixed with a metallic salt solution. The ensuing redox reaction rapidly produces nanomaterials. This reaction has been observed to demand comparatively low initiation energy [39,40].
Despite extensive physicochemical research in the nanotechnology field, the production of silver and gold NPs is highly performed using biosynthesis. However, there have been limited studies delving into the green synthesis and potential applications of other metallic NPs [41,42]. Given the vast potential of plants as sources of bio-reductants, the evolution of green methodologies for nanoparticle preparation is regarded as a pivotal advancement in nanotechnology [43].
Green synthesis aims to safeguard the environment by substituting harmful chemicals. As such, yeast, fungi, bacteria, algae, and plant extracts are favored as reducing agents over toxic chemicals for the preparation of metal and metal oxide nanoparticles [44]. Biosynthesis not only refines the size and morphology of nanoparticles but is also more eco-friendly compared to other physicochemical methods [45]. Biological sources, particularly plant extracts, impart stabilizing and capping effects to the synthesized nanoparticles. This makes them both more stable and less hazardous than conventionally produced counterparts [46].
While numerous articles delve into the green synthesis of metal oxides, only a handful explores the use of plant extracts in this context [47]. Given its advantages over conventional synthesis methods, there's a recent surge in research focused on plant-mediated green synthesis of nanoparticles [48]. Plants are preferred in green synthesis due to their inherent reducing agents like citric acid, ascorbic acid, flavonoids, reductases, dehydrogenases, and extracellular electron shuttlers, which facilitate the biosynthesis of metal nanoparticles [49]. Factors such as plant extract concentration, metal salt concentration, reaction duration, solution pH, and temperature play crucial roles in determining the quality, morphology, and crystallite size of the resultant nanoparticles [50].
This review focuses on the recent advancements in the biosynthesis of select metal and metal oxide NPs. We also explore the advantages of biosynthesis over traditional synthesis methods, highlighting its simplicity, cost-effectiveness, and eco-friendliness. Moreover, we delve into the natural compounds present in plant extracts that drive the reduction reactions. Our aim is to outline the green synthesis procedure, detail various characterization tools employed to study green-synthesized metal and metal oxide-based nanoparticles, and shed light on their current applications. Ultimately, we hope to enrich the existing literature in this domain, offering insights that might guide researchers in their future work. Numerous nanoparticles, including gold [51], platinum [52], iron oxide [53,54], copper [55,56], palladium [57,58], zinc oxide [59], and silver [60,61,62] have been prepared from the extracts of natural sources. While the utilization of plant extracts in nanoparticle production is well-documented in scientific literature, there are limited studies on the green synthesis of MnO2 NPs [63,64]. Even fewer investigations delve into the harnessing of extracts from natural resources for the fabrication of α-MnO2 nanomaterials. This review will provide an in-depth exploration of this niche topic.
2. Green Synthesis
While numerous procedures exist for preparing nanostructures, it's imperative to avoid harmful chemicals and foster green synthesis techniques that produce nanoparticles with equivalent characteristics to those prepared using conventional methods [65,66]. Singh et al. [67] outline the primary advantages of green synthesis, i.e., use at large scale production, eco-friendly approach, biological component acting as reducing and capting agent, and saving energy due to no requirements high energy and high pressure. Leveraging green nanotechnology helps circumvent detrimental consequences. Moreover, bio-nanotechnology profoundly influences the development of nanostructures by diminishing or eradicating pollutants, thereby addressing current environmental dilemmas, as depicted in Figure 2.
2.1. Green Synthesis of NPs from Biogenic Wastes
Effective solid waste management is essential to prevent potential health hazards and mitigate environmental impacts. Both industrial and domestic waste streams, if mismanaged, can pose significant risks to the environment and public health by facilitating the spread of infections. However, when properly processed and repurposed, biowaste can offer sustainable solutions and reduce its adverse effects [68]. Waste management has profound implications for humans, animals, and the environment, both locally and globally. In developing nations, the surge in waste production parallels population growth and economic development. Both biodegradable and non-biodegradable wastes pose challenges and potential risks, which, if mismanaged or improperly disposed of, can negatively impact communities. Notably, wastes from plants and animals are biodegradable [69]. The 4 “R's” of waste management strategies consist of reduce, reuse, recycle and recovery that can mitigate the risks associated with waste mismanagement [69].
Approximately 80% of total biomass stems from post-harvest agricultural waste. Often, this waste is incinerated, leading to significant emissions of greenhouse gases, smog, and other pollutants. Such emissions contribute to climate change, air contamination, and adverse human health effects. Common kitchen waste, such as peels from fruits and vegetables, is biodegradable and can be broken down by bacteria and other decomposers. However, when biodegradable waste accumulates in vast quantities, it poses environmental risks. Such waste can foster microbial growth, with certain bacteria potentially spreading infectious diseases to humans, flora, and fauna. Additionally, incinerating these wastes releases greenhouse gases like methane and CO2. Waste dumps, meanwhile, provide breeding grounds for disease-carrying rodents and mosquitoes. As evidence of climate change's impact mounts, researchers are continuously seeking methods to mitigate the harm caused by unsustainable disposal practices [70].
Moreover, waste from the food industry, particularly fruit waste, and agricultural crop residues are abundant and typically require no pre-treatment. This accessibility positions biodegradable wastes as potential raw materials for green synthesis of metal and metal oxide nanoparticles. Leveraging these wastes for nanoparticle synthesis not only mitigates environmental pollution but also supports waste reduction, reuse, and economic enhancement by decreasing high-energy waste accumulation. In green synthesis methodologies, nanomaterials are derived utilizing natural biological processes [70].
Nearly all agro-industrial byproducts and food residues contain phenolic compounds with functional groups that facilitate reduction and ensure stability. Flavonoids, present in fruit-derived biomass waste, can chelate and transform metal ions into NPs. This property underlines their application in NP synthesis [69]. For the bio-fabrication of metal oxide nanostructures, fruit peels from sources like banana, Citrus sinensis, jackfruit, lemon, mango, Musa paradisiaca, pomegranate, tangerine, Punica granatum, Garcinia mangostana, Citrus aurantifolia, and Nephelium lappaceum have been documented [71]. Recent studies have leveraged fruit waste, specifically lemon and orange peels, in the synthesis of α-MnO2 NPs [72,73].
2.2. Green Synthesis of NPs from Plant Extracts
The term "green synthesis" refers to the utilization of natural resources, such as plant extracts [74]. Plants function as primary producers for crafting metals and metal oxide nanostructures [75]. Relative to microorganisms, plant extracts emerge as superior biological agents for nanoparticle synthesis. They are abundant, stable, environmentally benign, cost-effective, and safe to use, boasting a broad spectrum of metabolic functionalities [76,77,78]. Furthermore, plant extracts offer rapid metal ion reduction and are more scalable. Consequently, research on nanoparticle production predominantly centers on plants, which have consistently demonstrated higher success rates in comparison to other "green" methods [79].
Over the past three decades, the harnessing of plant extracts for the eco-friendly synthesis of NPs has garnered significant attention. Numerous plant species have been explored for nanoparticle production, each offering a unique composition of organic reducing agents [80]. Advantages of this green synthesis approach, leveraging plant extracts, encompass biocompatibility, medical relevance, and scalability [81]. These eco-friendly synthesized nanoparticles find diverse applications in pharmaceuticals, encompassing novel drug formulations, targeted drug delivery, diagnostic procedures, and the creation of functional nanodevices [82]. Consequently, this approach is vital in pioneering new treatments to tackle various global health threats [83]. The burgeoning commercial demand for nanomaterials has accelerated the quest for sustainable nanoparticle synthesis methods [84]. Research indicates that various plant components, including leaves [85,86], seeds [87], flowers [88], fruits [89], latex [90], tubers [91], bark [59], and even cultured tissues [92], are potential sources for nanoparticles production.
Commonly available fruits, vegetables, and herbs with rich polyphenol content can serve as reducing or antioxidant agents in nanoparticle synthesis. The primary advantages of using plant extracts in green nanoparticle synthesis include energy efficiency, ready availability, and the capability for production under ambient conditions at room temperature [93,94,95]. The formation of metallic nanoparticles is driven by the antioxidant properties inherent in the plant extracts [96,97]. These plants are rich in bioactive compounds, including sugars, vitamins, and polyphenols, which facilitate the reduction of ions to atoms [98,99]. Notably, the primary phytochemicals contributing to nanoparticle formation encompass terpenoids, flavones, ketones, amides, aldehydes, and carboxylic acids [100].
Polyphenolic compounds feature an aromatic ring bonded to hydroxyl groups and carbon atoms. Notably, the antioxidant activity tends to increase with a higher count of hydroxyl groups [101,102,103,104]. Plant leaf extracts are rich in biomolecules, including carbohydrates and proteins, which serve as reducing agents in the synthesis of metal and metal oxide nanoparticles. Additionally, proteins in these extracts, endowed with functional amino groups (-NH2), play an active role in reducing metal ions. Functional groups found in phytochemicals, such as C-O-C, -C-O-, and -C=C, can further facilitate the formation of metal and metal oxide nanoparticles [26].
Utilizing aqueous plant extracts for nanoparticle synthesis is a straightforward method, necessitating only the plant extract as a reducing agent and a metal ion solution, as depicted in Figure 3. In general, the green synthesis process of nanoscale metals includes: obtention of plant extract using specific solvent, mixture with metal salt solution and subsequent step to obtain the target nanoscale metal. The mechanism through which the plant leaf extract facilitates the green synthesis of nanoparticles is illustrated in Figure 4 [104]. The metal ions (I) bind to the reducing metabolites (phytochemicals) and stabilizing agents and are reduced to metal atoms (II). The resulting complex of the metal ion and metabolite interacts with similar complexes forming a small metal nanoparticle (III).
3. Metal and Metal Oxide-Based Nanoparticles
Researchers have increasingly turned their attention to transition-metal nanoparticles due to their vast array of applications. Oxide nanoparticles derived from transition metals find uses across a multitude of human-centric industries [105]. Transition metals, characterized as d-block elements, have electron configurations with incomplete d-orbitals. Their properties are notably different from those of main group elements [106]. The ability of these metals to exhibit multiple oxidation states renders them particularly intriguing to researchers, leading to diverse oxide configurations and further expanding their potential applications [103].
Traditional methods have been employed to produce transition metal nanoparticles and their oxides, with these techniques meticulously honed through rigorous research and experimentation to optimize the physicochemical attributes of the resulting nanostructures. However, these methods present challenges when it comes to large-scale production. Thus, there's a pressing need to identify scalable approaches for manufacturing metals and metal oxide NPs [107].
Green-synthesized nanosized metals and metal oxides exhibit enhanced reactivity owing to their organic capping molecules and crystalline imperfections, setting them apart from those produced chemically. Furthermore, green synthesis facilitates production at an industrial scale [108,109].
Previous studies demonstrate that a diverse range of natural biological materials can be employed in nanoparticle fabrication. This includes plants [110,111,112,113,114], bacteria [115,116], fungi [117,118,119,120], algae [121,122,123,124], viruses [125], and yeast [126,127,128], as illustrated in Figure 5. These biological entities possess metabolites capable of reducing metallic salts to produce nanoparticles. Moreover, these substances not only serve as reducing agents but also play a role in stabilizing the nanoparticles [129]. Recent studies have effectively highlighted the applications of metals and metal oxides produced through green synthesis methods. These applications include cancer treatment [130], drug delivery systems [131], antioxidant therapy [132], virus prevention [133], photocatalytic actions [134], water purification [135], and energy storage [72,73].
Green synthesis offers an environmentally friendly and cost-effective approach to produce metals and metal oxide nanoparticles on an industrial scale. Significant bioactive substances found in vegetable and fruit wastes, such as alkaloids, amino acids, enzymes, phenolics, proteins, polysaccharides, tannins, saponins, vitamins, and terpenoids, serve as reducing agents in this process [136,137]. Agro-wastes can be harnessed for nanoparticle production. In agriculture, even weeds can be repurposed as bioreactors for producing metals and metal oxide nanoparticles [138].
Plants serve as nature's cost-effective and environmentally friendly chemical factories [73]. The crucial role is played by phytochemicals present in various parts of plants, including roots, leaves, stems, and fruits [139,140,141]. Figure 6 showcases the biologically active phytochemicals found in plants [110]. Notable phytochemicals in plant extracts include amides, carboxylic acids, aldehydes, ketones, sugars, terpenoids, and flavones. Due to their functional groups, these phytochemicals can reduce metal ions more rapidly than bacteria or fungi, making them efficient for nanoparticle synthesis [142,143].
Subsequent sections of this study will delve into the recent applications of nanoparticles, including those of metals and their oxides, produced through green synthesis using plant extracts. Specifically, we will spotlight manganese oxides, iron oxides, silver, and gold nanoparticles. A significant portion of this exploration emphasizes the green synthesis and applications of α-MnO2 NPs, which are crafted from redox reactions involving KMnO4 and natural reducers, including plant and waste extracts.
4. Mn-Oxides NPs
Manganese has distinguished itself among the diverse nanomaterials available today [144]. Representing the twelfth most abundant element on Earth and the third most prevalent transition metal following Fe and Ti [145], Mn nanoparticles are mainly found as oxides or as composites with other metals (bimetallic or polymetallic) [144]. Owing to their expansive surface area, structural adaptability, and distinctive physicochemical properties, Mn and its oxides are gaining prominence in nanomaterial development [146]. Consequently, nanostructured Mn and Mn oxide materials hold a significant advantage in a variety of applications, including catalysis, energy storage, gas sensors, magnetic materials, electrochromic devices, and high-temperature solar selective absorbers [147].
Manganese oxides, including MnO, MnO2, Mn2O3, Mn3O4, and Mn5O8, stand out among the 3d transition metal oxides due to their diverse structural transformations. These Mn oxide nanoparticles present significant promise for advanced nanotechnology applications [148]. With their advantageous chemical properties, Mn oxides find potential applications in batteries, catalysts, drug delivery, magnetic materials, molecular sieves, optoelectronics, and solar cells [149]. Additionally, manganese oxides are cost-effective, possess high capacitance, and are environmentally benign, making them a safer alternative to certain other compounds, such as various chalcogenides [150,151].
The structural diversity of Mn-oxide nanoparticles encompasses a broad spectrum of chemical and physical attributes. Various Mn-oxide nanostructures, including nanobelts, nanorods, nanosheets, nanotubes, nanowires, and nanofibers, have been fabricated using diverse techniques. Among these, MnO2 is particularly notable. As the most stable Mn-oxide under ambient conditions, it boasts appealing physicochemical properties. Consequently, many researchers have focused on evaluating the efficacy of MnO2 and its significance in a range of applications [152].
4.1. MnO2 NPs
Nanostructured manganese dioxide (MnO2) holds promise as a sustainable material suitable for a host of crucial and globally beneficial applications [153]. This potential stems not only from their unique structures and favorable properties [72,154], such as cost-effectiveness, accessibility [155], non-toxicity, and versatile oxidation states [156,157], but also from their outstanding physicochemical characteristics and structural adaptability. This versatility makes them ideal for use across multiple sectors, including as catalysts [158], absorbents for toxic metals [159], and ion and molecular sieves [160]. Additionally, MnO2 serves roles as an artificial oxidase [161], a depolarizer in the Leclanché dry cell [162], an inorganic pigment in ceramics, an electrode material for solar cells, and in applications like photocatalysis [163], supercapacitors [164,165,166], and Li-ion and Li-air batteries [167,168,169,170].
4.2. Crystal Structure of MnO2 NPs
MnO2 exists in various crystalline forms, including α-, β-, γ-, δ-, and λ-MnO2. The diverse crystallographic forms arise from the unique configurations in which MnO6 octahedra are arranged within the MnO2 nanoparticles. Each form has a distinctive tunnel or interlayer structure. The multifaceted connections – either vertex or edge sharing – between MnO6 octahedral structures give rise to these tunnel structures of varying dimensions [171].
Specifically, α-, β-, and γ-MnO2 exhibit a 1D tunnel structure. In contrast, δ-MnO2 showcases a 2D layered structure, and λ-MnO2 presents a 3D spinel structure [172]. These structures can be differentiated by the tunnel size and the count of octahedral subunits, represented as (n × m). Table 1 lists their fundamental crystallographic data, while their structural schematic diagrams are provided in Figure 7 [173]. For instance, the α-MnO2 structure, depicted in Figure 7a, consists of double chains of edge-sharing MnO6 octahedra. Within α-MnO2, octahedral MnO6 form 1D (2×2) tunnels by connecting at their vertices [173,174]. The β-MnO2 structure, represented in Figure 7b, demonstrates a 1D (1×1) tunnel created by a singular chain of edge-sharing MnO6 octahedra. Figure 7c reveals γ-MnO2 to be a composite of a disorganized mix of ramsdellite (1×2) and pyrolusite (1×1) domains. The 2D layered structure of δ-MnO2, seen in Figure 7d, possesses an interlayer spacing of approximately 7 Å. Lastly, λ-MnO2, illustrated in Figure 7e, displays a 3D spinel configuration.
The physicochemical properties of MnO2 nanostructures are intricately influenced by their crystallographic attributes, encompassing geometry, lattice parameters, and tunnel dimensions [175]. Figure 8 depicts MnO2 nanostructures of diverse morphologies such as nanosheets, nanotubes, nanorods, nanowires, nanoflakes, nanoneedles, nanoflowers, nanourchins, and nanospheres [176]. The varied morphological forms of the MnO2 structure emerge based on the synthesis techniques employed [177].
5. Synthesis of Nanostructured MnO2
Numerous conventional methods have been successfully employed to produce MnO2 nanomaterials (MDOs) through MnO-4 and Mn+2 redox reactions. These methods include wet chemical, solvothermal, precipitation, co-precipitation, controlled synthesis, sol-gel, hydrothermal, reflux, pyrolysis, sonochemical, low-temperature solution combustion, self-reacting, microemulsion, photochemical, and forced hydrolysis techniques [178,179]. Common synthesis approaches involve the oxidation of Mn(II) in a basic solution, oxidation by agents such as oxygen, potassium persulfate, and hydrogen peroxide, or the reduction of permanganate through various means [180,181]. Frequently used reducing agents include nitric acid (HNO3) [182], sodium hydroxide (NaOH) [183], hydrochloric acid (HCl) [184], and ammonium fluoride (NH4F) [185].
Furthermore, given the connection between the morphology and size of NPs, it's imperative to devise fabrication techniques that allow optimization of attributes like monodispersity, crystallite size, surface area, crystallinity level, and morphology [180].
5.1. Traditional Synthesis of MnO2 NPs
KMnO4 is a primary starting material for synthesizing α-MnO2. Its viability as an Mn source and its inherent capacity to stabilize MnO2's crystallographic structure stem from the presence of K+ within the 2 × 2 tunnel of α-MnO2. Factors like pH, synthesis temperature, and reactant concentration have been noted to influence the morphology of α-MnO2 [186].
In a hydrothermal method, Subramanian [187] employed MnSO4.H2O and KMnO4 as initial materials to produce MnO2 nanorods across varying reaction durations (1–18 h) using KMnO4, sulfuric acid, and Cu scrap. Xu et al. [188] developed α-MnO2 hollow spheres characterized by a loosely connected, mesoporous cluster structure. In another approach, KMnO4 and HNO3 were subjected to a hydrothermal procedure, yielding MnO2 nanowhiskers and nanorods at 120 °C [189]. Using KMnO4, ethanol, sulfuric acid, and maintaining a pH of 2 at 60 °C, Liu et al. [190] crafted nearly spherical MnO2 particles, each around 100 nm in diameter. Additionally, with the same components, α-MnO2 nanowires with tailored sizes were produced, exhibiting intriguing electrochemical traits [191]. Feng et al. [192] leveraged a one-pot hydrothermal synthesis to produce α-MnO2 nanorods with lengths reaching 1.2 mm and a crystallite size of 300 nm. Ji et al. [193] utilized a similar technique to yield longer α-MnO2 nanorods, while Hashem et al. [167] harnessed a redox reaction of ammonium persulfate with manganese sulfate to derive a pure α-MnO2 phase.
However, these conventional methods for MnO2 NP synthesis present scalability challenges and are typically intricate, time-intensive, energy-consuming, and expensive. Many require the use of high-cost and hazardous chemicals for reduction and capping, along with intense mixing, prolonged durations, high temperatures, and substantial energy, leading to significant energy losses [194,195]. A critical concern is the residual harmful substances left on the NPs even after multiple washes, potentially harming the environment [196].
Therefore, the pursuit is on for an efficient, eco-friendly production method for MnO2 materials. Recently, efforts have been geared towards mitigating environmental impact. Innovations aim for the creation of harmless, biocompatible, benign, scalable, cost-efficient, and safe MnO2 materials [197]. Ideally, a straightforward, affordable, and safe method would control MnO2 nanoparticle size, utilizing eco-friendly reducing agents [75,198]. Plant extracts have shown more promise for green synthesis of MnO2 NPs compared to microorganisms, thanks to their diverse biomolecules that serve as both capping and reducing agents [75].
5.2. Green Synthesis of MnO2 NPs
Traditional methods often rely on costly, outdated, and complex techniques [198]. Given the growing emphasis on ensuring that produced NPs are non-toxic and environmentally friendly, there's been a shift towards using green chemistry principles for their synthesis. This sustainable approach is termed "biosynthesis" or "green synthesis" [199]. Distinct from conventional methods, the biosynthesis approach for preparing MnO2 NPs emerges as a superior alternative. It not only proves less expensive and less harmful but also boasts several advantages, such as adaptability, simplicity, rapidity, affordability, eco-friendliness, safety, and scalability for nanomaterials production [200].
In green synthesis, traditional pricey chemical reducers like hydrazine hydrate, sodium borohydrate, formaldehyde, and ethylene glycol are supplanted by natural compounds. These compounds, rich in antioxidative elements like flavonoids, tannins, and vitamin C, can address the concerns of cost and contamination [201]. Hence, biosynthesis for MnO2 NPs is examined through an environmental lens, leveraging waste by-products and allowing production at room temperature [202].
For the synthesis, agents like bacteria, fungi, biopolymers, raw biomaterials, and plant extracts are utilized to create MnO2 NPs [199,202]. However, refining the size, morphology, and application range of these green-synthesized MnO2 NPs stands as a central challenge in contemporary green nanotechnology [203]. Recent findings have highlighted the successful production of MnO2 NPs through biosynthesis in a single step at room temperature, cutting energy costs, overall expenses, and the need for harmful solvents and organic materials [204,205]. In this method, plant extract, serving as a natural reducing agent, is combined with a KMnO4 solution. The KMnO4's full reduction by the plant extract shifts the mixture's color from purple to black within an hour at room temperature. Afterward, to remove potassium ions, the resulting precipitate is repeatedly rinsed with distilled water and separated via filtration. This precipitate is dried for a day at 90 °C and subsequently baked for five hours at 300 °C in a standard atmosphere [73]. The resulting α-MnO2 NPs have exhibited promising outcomes in contemporary applications, including lithium batteries, supercapacitors, and photocatalysis [72,73,177].
6. Plant Extracts for Green Synthesized MnO2 NPs and Recent Applications
The properties of green-synthesized MnO2 NPs are influenced by the type and concentration of natural reducing agents found in plant extracts. These extracts predominantly contain antioxidants, notably polyphenols that play a crucial role in the green fabrication of MnO2 NPs [206,207]. When employing plant extracts for nanoparticle synthesis, the chosen extract is simply mixed with an aqueous Mn solution and stirred at room temperature for a short period. Compounds within the plant extract, such as flavonoids, polysaccharides, polyphenols, terpenoids, and tannins, facilitate the reduction of manganese ions [208,209,210,211].
Numerous plant extracts have been found capable of reducing metal salts to their corresponding metal oxides. Ullah et al. [212] harnessed Bryophyllum pinnatum leaf extract to produce MnO2 NPs ranging from 4–18 nm in diameter. Meanwhile, Dewi and Yulizar [213] utilized Euphorbia heterophylla leaf extract to generate MnO2 NPs with a crystallite dimension of 56 nm. Their reaction mixture was stirred for an hour at 80°C and subsequently heated for two hours at 500°C. Other studies have reported the synthesis of MnO2 nanomaterials using extracts from Gardenia resinifera, Phyllanthus amarus, Kalopanax pictus, Origanum vulgare, Artemisia dracunculus, Sapindus mukorossi, Rosmarinus officinalis, and Vernonia amygdalina [73,180,214,215,216,217]. Additionally, Souri et al. [180] highlighted the biosynthesis of MnO2 nanoparticles utilizing Yucca gloriosa leaf extract. This synthesis was confirmed via XRD, revealing an average particle size of 80 nm as calculated by the Debye-Scherer equation. Another notable precursor is the fruit extract of Acacia concinna, employed in the sol-gel method for green synthesis of manganese oxide nanomaterials. This natural reducing agent was observed to adjust the nanoparticle size and eradicate detrimental byproducts [73].
The subsequent section delves into the green synthesis of various MnO2-based NPs using diverse plant and fruit extracts as natural reducers (Figure 9). The discussion extends to cover their recent applications, notably as photocatalysts in water purification and as electrode materials in energy storage devices like lithium-ion batteries and supercapacitors
6.1. Lemon Juice and Lemon Peel Extracts
Lemon juice is primarily composed of water. The acidity of lemon juice predominantly stems from citric acid, which accounts for about 5% by volume (or 48 g L-1). Other contributors to its acidity include malic acid and smaller quantities of ascorbic acid (which provides 40 mg of vitamin C per 100 g of lemon) and tartaric acid [203]. Citrus fruit peels, like those of lemons, serve as potent antioxidants [218,219]. They are abundant in several reducing agents, notably p-coumaric acid, flavonoid glycoside, and β-sitosterol [220,221]. Figure 10 showcases the molecular structures of the antioxidative compounds present in both lemon juice and lemon peel [72].
ZnO nanoparticles were synthesized using Citrus aurantifolia extract, which is abundant in citric acid and ascorbic acid (vitamin C) [222]. Polyphenols and ascorbic acid present in citrus fruit fibers have been found to enhance the crystallization of metal oxides, as reported by Ahmad et al. [223].
The tetragonal α-phase of MnO2 polymorph has garnered significant attention compared to other polymorphs due to its expansive 2×2 tunnels. These tunnels are conducive for the movement and accommodation of foreign ions [224], such as K+ found in cryptomelane-type KxMn8O16 compounds [225]. Zhang et al. highlighted that K0.25Mn2O4 nanofibers possess remarkable lithium insertion abilities, exhibiting superior charge capacities and a high-rate capability [226]. Hashem et al. [72] reported the successful production of MnO2 NPs using lemon juice and lemon peel (designated as J-MnO2 and P-MnO2, respectively) at room temperature without producing harmful waste. This was achieved through a green synthesis approach, using a redox reaction between KMnO4 and natural reducing agents: specifically, lemon juice for J-MnO2 and lemon peel extracts for P-MnO2.
All XRD peaks corresponded accurately to α-MnO2 (JCPDS card No. 44-0141). The reflection (121) associated with the cryptomelane structure had the most pronounced intensity. The P-MnO2 NPs exhibited superior crystallinity in comparison to J-MnO2 NPs. The observed differences in crystallinity between the two compounds can be attributed to the specific type of reducing agent employed. This distinction is evident in the varying patterns depicted in the XRD of J-MnO2 and P-MnO2, as shown in Figure 11 [72]. It is well-recognized that employing diverse carboxylic acids combined with the chelate-assisted sol-gel technique can yield products with markedly different morphologies and structural defects [227].
The surface morphology of the two green-synthesized compounds was examined using SEM and TEM, as displayed in Figure 11c [72]. Distinct morphologies are evident in the figure. For J-MnO2, a cluster of extremely small particles with sizes less than 10 nm can be seen in image (iii). The diminished size of J-MnO2's primary particles can be attributed to its limited crystallinity. Conversely, P-MnO2 exhibits a different morphology. It consists of uniform nanorods with a crystallite size of 17 nm, as illustrated in image (iv). It is evident that the morphology of α-MnO2 nanoparticles is profoundly affected by the choice of reducing agent. The lemon juice extract, rich in citric and ascorbic acids, yields the tiniest nanoparticles, whereas the more complex reducing agents in lemon peel foster the formation of nanorod structures with a more pronounced crystallite size.
To evaluate the electrochemical properties and discharge performance of J-MnO2 and P-MnO2 NPs for potential use as cathodes in lithium-ion batteries, galvanostatic charge-discharge studies were conducted. Cycle tests in the voltage range of 1.5-3.5 V vs. Li+/Li0 were carried out at various current densities ranging from 10 to 400 mA g-1 (with 1C = 260 mA g-1). As depicted in Figure 11d and 11e, the superior performance of P-MnO2 cells is evident across discharge current densities from 10 to 400 mA g-1 [72]. The P-MnO2 cell exhibits a reversible specific capacity of 50 mA h g-1 at 400 mA g-1, whereas the specific capacity of the J-MnO2 cell diminishes, indicating lattice disarray. Both compounds exhibited reduced coulombic efficiency during the first cycle. However, by the second cycle, the cells showcased high rechargeability, achieving efficiency close to 98%. The cycling stability of J-MnO2 and P-MnO2 electrodes is highlighted in Figure 11f. After 50 cycles, the capacity retention of P-MnO2 was 73%, while J-MnO2 managed 55%. Reports suggest that the enhanced electrochemical performance of P-MnO2 stems from its superior crystallinity.
6.2. Black and Green Tea Extracts
Both black and green tea extracts, though structurally distinct, contain flavonoids. These are powerful antioxidants that have been employed to convert KMnO4 to MnO2 through redox reactions. The high phenolic content of these teas imparts them with potent antioxidant capabilities [228].
Green tea is especially rich in Epigallocatechin gallate (EGCG), a renowned antioxidant. Unlike black tea, green tea avoids fermentation and the subsequent oxidation process. This oxidation in black tea transforms catechins into the more complex aflavins and arubigins. Consequently, green tea exhibits enhanced antioxidant activity in comparison to black tea. However, it is important to note that while oxidation alters the type of flavonoids present, it doesn’t affect their quantity or antioxidant potency [229,230,231]. Figure 12 highlights the key flavonoid concentrations in both black and green teas [75].
In 2018, Abuzeid et al. [75] developed nanosized MnO2 NPs using both green and black tea extracts, termed as GT-MnO2 and BT-MnO2, respectively. Figure 13a illustrates their crystal structures, as determined by XRD analysis. Reflections in α-MnO2 (JCPDS card No. 44-0141) are indexed across both. GT-MnO2 displays a crystalline nature with a Scherrer crystallite size of roughly 8.0 nm, in contrast to the amorphous or highly disordered BT-MnO2 which has a crystallite size of about 4.4 nm. This XRD pattern discrepancy between GT-MnO2 and BT-MnO2 is attributable to their differing crystallinity. Experimental data suggest that the redox reaction facilitated by black tea is slower compared to that by green tea. This difference, stemming from variances in flavonoid structures and antioxidant power, impacts the MnO2 structure's crystallinity. The potency of the reducing agent, governing ion extraction from the 2×2 tunnels and K+ ion movement, also affects the synthesis methods. Raman spectra depicted in Figure 13b, was used to further explore the MnO2 NPs' crystal structures, focusing on the influence of the reducing agents [75]. The Raman spectrum for GT-MnO2 displays distinct bands at 181, 380, 510, 577, 630, and 754 cm-1. In contrast, BT-MnO2's Raman bands are broad and less defined, suggesting a highly disordered structure in the material. Key insights can be drawn from the band positions: the tetragonal 2 × 2 tunnel structure is revealed by the high-frequency signals at 577 and 630 cm-1 (Ag modes). The low-frequency band at 181 cm-1 arises from the translational motion of [MnO6], and the band at 380 cm-1 is attributed to O-Mn-O bending vibrations. Furthermore, the band situated at 754 cm-1 is linked to antisymmetric Mn-O stretching vibrations. These distinctive Raman characteristics align with findings for α-MnO2 documented in prior research [232,233]. Notably, the crystallization process of MnO2 NPs notably affects the intensity of the ν577 and ν630 bands. This consistency between Raman and XRD results underscores GT-MnO2's superior crystallinity over BT-MnO2 [75].
Figure 13c-d present the galvanostatic discharge-charge profiles of MnO2//Li cells using GT-MnO2 and BT-MnO2 as the positive electrode materials. The profiles of these half-cells were obtained at a consistent current density of 10 mA g-1 (C/26) and within the potential window of 1.5-3.5 V vs. Li+/Li0 [75]. The discharge cell potential steadily decreases throughout the entire discharge span, revealing two pseudo-plateaus. Each plateau is characterized by an "S-shaped" curve, indicative of a topotactic reaction during lithium insertion into the electrodes. However, in the case of BT-MnO2, the voltage drop is markedly steeper, a characteristic typically observed in disordered electrode materials [234]. This electrochemical behavior aligns with the structural observations made earlier. The highly disordered BT-MnO2 exhibits an initial specific capacity of approximately 236 mA h g-1, while the well-crystallized GT-MnO2 sits at around 198 mA h g-1. The expansive tunnel (4.6 Å) accommodates a significant quantity of electrochemically inactive K+ ions, which remain lodged at the 4e sites, leading to the reduced starting capacity. For GT-MnO2, potassium occupies more than half of these 4e sites, whereas for BT-MnO2, it's just above a quarter. This inert cation might hinder the ingress of Li ions into the tunnel and also obstruct the ion movement during the discharge phase [235]. GT-MnO2's Coulombic efficiency showcases impressive rechargeability, approaching 99%, even at a steady current density of 200 mA g-1 (= 0.75 C). This remains consistent except for the initial two cycles. The cycling behavior over 54 cycles for MnO2//Li cells in lithium-ion batteries is depicted in Figure 13e [75].
GT-MnO2 demonstrates superior capacity retention compared to BT-MnO2. After the third cycle, GT-KyMnO2 exhibits a discharging capacity of 161 mA h g-1, which gently reduces to 141 mA h g-1 by the 54th cycle at a C/10 rate. The capacity degradation for GT-KyMnO2 averages 0.25% per cycle, while it is 0.58% for BT-KyMnO2. Both materials experience some capacity loss post the initial cycle. GT-MnO2's irreversible capacity caps at 30 mA h g-1, retaining 70% of its inaugural capacity after 20 cycles. In contrast, BT-MnO2 holds onto roughly 62% of its capacity. This diminished initial capacity suggests that certain lithium ions became ensnared within the cell's internal voids during the cell fabrication [236].
6.3. Broccoli Vegetable Extract
Broccoli, akin to cabbage and cauliflower, boasts antioxidant, antibacterial, and anticancer attributes [237,238,239,240]. It is rich in polyphenols, particularly flavonoids [238]. Various parts of broccoli, including its leaves, flowers, and other tissues, house these flavonoids and phenolic acids [237]. Figure 14 depicts the antioxidant constituents in broccoli extract, namely α-lipoic acid, sulforaphane, and coenzyme Q10 [240].
Figure 15a presents the XRD pattern of KyMnO2 nanoparticles (NPs) synthesized using broccoli extract [240]. The most prominent peak at 2θ = 37° corresponds to the (211) plane of the tetragonal α-MnO2 phase, with no detectable defects. The subdued intensity indicates low crystallinity, while the peak broadening implies that the α-KyMnO2 NPs are of nanoscale dimensions. Using the half-width at half-maximum of the (211) diffraction line, observed at 2θ ≈ 37.6, the calculated particle size is approximately 4.4 nm. This highlights the polycrystalline character of the α-KyMnO2 NPs.
Nitrogen adsorption/desorption at 77 K was conducted over a relative pressure range of P/P0 = 0.0 - 1.0, where P and P0 denote equilibrium and saturation pressures, respectively, to determine the Brunauer–Emmett–Teller (BET) specific surface area. As the P/P0 value increases, the volume of N2 adsorbed on the isotherm curve also grows. The emergence of a hysteresis loop signifies the hierarchical mesoporous structure of α-KyMnO2. At P/P0 = 0.97, the volume of N2 adsorbed is estimated to be 450 cm3 g-1. The inset in Figure 15b [240] showcases the mesoporous nature of the green-synthesized α-KyMnO2, determined via the Barrett-Joyner-Halenda (BJH) method [241].
Suib et al. [242] suggested that mesoporosity arises from the aggregation of MnO2 nanomaterials, either in the form of nanorods or nanoneedles, along their lateral facets. The mesopore size distribution, spanning 1-20 nm, primarily displays a single peak at 10.4 nm, accompanied by a cumulative pore volume of 0.950 cm3 g-1. Notably, the BET surface area of MnO2 NPs biosynthesized using broccoli extract registers at 161 m2g-1. This is superior to MnO2 structures derived from alternative methods such as the microemulsion technique (123 m2 g-1), hydrothermal synthesis (150 m2 g-1), silica templating coupled with the ion-exchange approach (142 m2 g-1), mild reactions [243], and exfoliation [244]. Thus, green synthesis emerges as a potent strategy for fabricating mesoporous, pure α-phase KyMnO2 characterized by minute particle dimensions and an expansive surface area.
The potassium concentration inside the 2 × 2 tunnels, which is considered to be positive to stabilize the tetragonal structure, was determined by thermogravimetry (TG). Figure 15c presents the differential weight dw/dT corresponding to the rapid weight loss in the region 400-600 °C, which depends on the concentration of tunneled foreign ions (potassium or ammonium) in the cryptomelane KyMn8O16 structure. According to decomposition temperature of 504 °C shown in Figure 15c, a concentration of potassium is estimated to be y = 0.035, which is close to the value obtained from ICP measurements.
Hashem et al. [240] investigate the galvanostatic discharge-charge curves of α-K0.03MnO2//Li cells over 50 cycles at a consistent current density of 30 mA g-1. The MnO2 structure, which possesses two distinct coordination sites for Li+, exhibits a topotactic behavior for Li+ insertion, characterized by a gradual voltage decline marked by two pseudo-plateaus and an S-shaped profile. As subsequent cycles commence, these plateaus shift to higher potentials. Over four consecutive cycles, the material's capacity diminishes from 211 to 198 mAhg−1. The pronounced alterations in the electrochemical profile during the second cycle have been highlighted in various studies [245,246,247]. Figure 15 (d-f) underscores the commendable rate capability and cycle stability of α-K0.03MnO2 when employed as a cathode in lithium-ion batteries, operating within voltages of 1.5 to 4.0 V and current densities spanning 0.1C to 10C [240]. As the current density increases, there is a decline in specific capacity; however, the charge and discharge profiles remain largely unaltered, as depicted in Figure 15d. Throughout the assessed C-rate spectrum, the characteristic S-shaped profile persists. The modified Peukert plot, which plots discharge capacity against C-rate, exhibits a near semi-logarithmic trend, as illustrated in Figure 15e. At 10C, the α-K0.03MnO2 electrode delivers a specific capacity of 32 mAh g-1. The α-K0.03MnO2 electrode showcases commendable reversibility, as seen in Figure 15f. This is highlighted by its efficiency, which remains an impressive 98.8% at 0.1C rate over 100 cycles. Given this robust electrochemical stability, it suggests that the cationic exchange (Li+ vs. K+) during Li+ integration into the α-K0.03MnO2 structure is minimal.
6.4. Orange Juice and Orange Peel Extracts
Millions of tons of oranges are produced globally, with a significant portion dedicated to industrial orange juice extraction. This industry generates large amounts of byproducts, including orange peels and segments. The orange peel, accounting for 50%–65% of the fruit's weight, is rich in 7.1% protein, 12.79% crude fiber, and bioflavonoids. These bioflavonoids possess antioxidant properties, making them suitable for NP production [73]. Addressing the vast amounts of orange peel waste is essential to avert potential environmental harm and other adverse effects [248,249].
Orange juices and peels are rich in ascorbic acid, flavonoids, phenolic compounds, and pectin. The primary components of orange juice are organic acids, sugars, and phenolic compounds, including sucrose, glucose, fructose, and citric, malic, and ascorbic acids. Additionally, orange juice contains phenolic substances such as flavanones, hydroxybenzoic acids, hydroxycinnamic acids, ferulic acid, hesperidin, and narirutin [250].
Orange peels are primarily composed of polyphenolic and flavonoid compounds. Prominent among these flavonoids are hesperidin, narirutin, naringin, and eriocitrin [251]. The glycosides hesperidin and naringin endow orange peel extracts with their antioxidant activity. Furthermore, orange peel molasses contains coniferin and phlorin, which aid in radical scavenging and support the sustainable recycling of orange peels [252]. Skiba et al. [253] reported the use of orange peel extract in the fabrication of silver NPs using a plasma chemical extraction process, along with the degradation of methylene blue in sunlight. Abuzeid et al. [73] employed orange peel extract for the green synthesis of MnO2 nanomaterials. These were then utilized as electrodes for supercapacitors, representing an innovative approach to repurpose the vast residue from orange production. Notably, MnO2 is widely used as an electrode in both electrochemical supercapacitors and batteries [254].
Supercapacitors, offer high power in short time spans. These devices are vital for high-power applications due to their cost-effectiveness, low maintenance, safety, rapid charging, and extended cycle life [255,256,257]. While supercapacitors may have a lower energy density than lithium-ion batteries, they bridge the gap, providing a balance between the high energy density of batteries and the power density of electrochemical capacitors [258,259,260].
X-ray powder diffraction patterns of synthesized OP-MnO2 ad OJ-MnO2 using orange peel and orange juice, respectively are presented in Figure 16a and 16b. The prominent peaks characteristic of α-MnO2 were identified in alignment with the reference (JCPDS No. 44-0141) as documented in a previous study [261]. It has been highlighted that the potency of the reducing agent can influence the amount of K+ integrated within the 2×2 tunnels of α-MnO2. The presence of potassium plays a pivotal role in fortifying the α-MnO2 structure. Materials with a lesser degree of crystallization tend to have reduced K+ concentrations within the α-MnO2 framework, which can be attributed to the utilization of a less potent reducing agent [72,75,261].
The mesoporous nature of the prepared OJ-MnO2 and OP-MnO2 samples was confirmed from BET experiments. The pore size was estimated to be 7.25 and 6.75 nm for OJ-MnO2 and OP-MnO2, respectively. Calculated BET surface area according to Barrett-Joyner-Halenda method are 5.63 and 8.40 m2 g−1 for OJ-MnO2 and OP-MnO2, respectively
Figure 16d and 16f present the charge and discharge data (CD) utilized to compute the specific capacitance (SC) of both OJ-MnO2 and OP-MnO2 NPs based on the following equation [73]:
where m is the total mass of materials coated on the glassy carbon electrode, I is the discharging current (A), Δt is the discharging time (s), and ΔV is the voltage range.
Csp = I Δt / m ΔV,
At current densities of 15, 5, 2, and 0.5 A g-1, the specific capacitances for OJ-MnO2 NPs are 18.5, 25, 33, and 50 F g-1, respectively. In contrast, at the same current densities, the specific capacitance values for OP-MnO2 are 61, 85, 107, and 139 F g-1. Notably, the specific capacitances for OP-MnO2 are approximately two and a half times those of OJ-MnO2. This significant difference can be explained by two primary factors. Firstly, OP-MnO2 possesses a larger surface area and smaller particle size, as evident from the BET surface area data [73]. Secondly, OJ-MnO2 has a substantial concentration of K+ ions lodged within its 2×2 tunnel. This increased presence of K+ ions in the 2×2 tunnel restricts the easy insertion and extraction of H+ ions. Moreover, it is important to note that these K+ ions act as inert components, thereby reducing the overall capacitance value, as detailed in the study [73].
The cycle stability is a pivotal aspect for electrochemical supercapacitors [262]. An investigation was conducted on the cycle stability of OP-MnO2 electrodes over 500 cycles, using a current density of 3 A g-1 and employing the charge/discharge method within voltage parameters spanning from -0.2 to 1.2 V. As depicted in Figure 16g [73], there's a noticeable uptrend in capacitance retention for the first 450 cycles relative to the inaugural cycle. Interestingly, by the 500th cycle, the electrode's capacitance had reverted to its initial value. Specifically, the electrode began with 119 F g-1 during the 1st cycle, peaked to 137 F g-1 by the 350th cycle (indicating a capacitance retention of 115%), and then circled back to 119 F g-1 on the 500th cycle, showcasing a complete 100% capacitance recovery.
6.5. Moringa and Cinnamon Herbs Extracts
Moringa oleifera is renowned for its myriad benefits, encompassing health, nutrition, commercial, and clinical attributes, primarily due to its potent antioxidant properties. This plant is a rich source of various vitamins, minerals, amino acids, fatty acids, glucosinolates, and phenolic compounds. Specifically, Moringa oleifera leaves are enriched with vitamin C, amino acids, and beta-carotene. Delving deeper, compounds present in this plant include flavonoids, L-ascorbic acid, retinol, niacin, thiamine, chlorogenic acid, tocopherol, caffeic acid, O-coumaric acid, gallic acid, and riboflavin, all of which possess remarkable reducing properties.
Cinnamon, a potent spice, has held medicinal significance for millennia. In modern medicine, cinnamon is recognized for its ability to reduce blood glucose, cholesterol, and blood pressure levels. This spice boasts antiparasitic, antibacterial, antioxidant, and free-radical scavenging properties. Key natural antioxidants found in cinnamon, such as cinnamaldehyde, eugenol, borneol, cinnamyl acetate, cinnamic acid, and coumarin, are responsible for its therapeutic benefits [263,264].
Moringa and cinnamon extracts are recognized for their potent antioxidant properties and their excellent capacity to reduce KMnO4 to α-MnO2, as recently explored by Abuzeid et al. [177]. Figure 17a presents the XRD characteristics of the biosynthesized MnO2 nanoparticles M-MnO2 and C-MnO2 using moringa and cinnamon extracts, respectively. Based on the JCPDS data (card no. 44 0141), the characteristic peaks for both compounds can be attributed to the tetragonal α-MnO2, with no additional defects observed. Both compounds exhibit low crystallinity, suggesting a nanosized structure. This is evident from the reduced intensity and broadening of these peaks. Electronic properties of C-MnO2 and M-MnO2 have been investigated by UV-Vis diffuse reflectance spectroscopy.
C-MnO2 exhibits a higher reflectance intensity compared to M-MnO2. This difference can be attributed to the formation of defect-induced energy levels in the nanoparticles during the synthesis process. The intermediate optical response to visible light results in the absorption band at 282 nm [265]. The band gap (Eg) value of the green-synthesized C-MnO2 and M-MnO2 compounds was determined using the Kubelka-Munk equation, as shown in Figure 17b [177]. C-MnO2 and M-MnO2 possess band gap values of 1.42 and 1.39 eV, respectively. The variation in the band gap energy between these compounds can be attributed to disparities in their internal electronic structures and particle sizes [266,267]. Owing to their narrow band gap (1-2 eV), manganese oxides can act as photocatalysts in the visible light spectrum [268,269]. MnO2 is considered a potent catalyst because of its porous nature, available lattice oxygen, and the presence of multiple valence states of manganese ions, such as Mn4+/Mn3+ and Mn3+/Mn2+. In addition to its notable catalytic properties, the widespread availability and affordability of MnO2 make it a preferred choice for organic dye removal. Moreover, MnO2 displays a diverse range of crystal structures and morphologies, enhancing its suitability for photocatalytic applications [270].
The photocatalytic efficiency of green-synthesized MnO2 nanoparticles using Y. gloriosa leaf and curcumin extracts for degrading acid orange as an organic contaminant was previously studied, with decomposition results reported [145]. Green-synthesized M-MnO2 and C-MnO2 nanoparticles have been examined for their potential in photocatalytically degrading methylene blue and Congo red under visible sunlight. For the tests, 100 ml of each of the Congo red and methylene blue dye solutions (10 ppm) was combined with 0.05 g of the respective nanoparticles. The mixtures of M-MnO2 or C-MnO2 with the dyes were stirred in the dark for 30 minutes before being exposed to visible sunlight [177]. The absorbance of Congo red and methylene blue at 464 nm was determined using a JASCO V630 UV-Vis spectrophotometer to gauge the degradation efficiency. The following equation was employed to calculate the photodegradation efficiency (Ph in %):
in which Co and Ao represent the initial concentration and absorbance of MB and Congo red prior to radiation and Ci and Ai represent the concentration and absorbance of MB and Congo red, respectively, after a specific period of time of exposure. Figure 17c illustrate the alteration of the methylene blue (MB) highest absorbance peak (664 nm) of C-MnO2 and M-MnO2 after 140 min of exposure to sunlight [177]. After 140 min of exposure to visible light, there was a notable reduction in the absorbance intensity of MB. The photodegradation efficiency for MB dye using M-MnO2 reached 96%. Meanwhile, C-MnO2 displayed a slightly reduced photodegradation efficiency of 89% over the same exposure duration. Figure 17d and 17e display the photodegradation percentages of MB and CR dyes over time under visible light exposure. Both C-MnO2 and M-MnO2 exhibit commendable photocatalytic activity in degrading MB and CR. Among the two, M-MnO2 consistently outperforms C-MnO2 across all time intervals. Specifically, M-MnO2 achieves a photocatalytic activity of 96% for MB and 93% for CR, while C-MnO2 registers 89% for MB and 91% for CR. The superior photocatalytic performance of M-MnO2 can be attributed to its narrower band gap. Studies have noted that both C-MnO2 and M-MnO2 nanoparticles exhibit urchin-like morphologies, composed of interconnected nanowires with particle sizes ranging from 4–10 nm. This structure significantly amplifies their photocatalytic activity [177]. Figure 17f elucidates the mechanism of the photodegradation process, showing how sunlight activates M-MnO2 and C-MnO2 to produce highly reactive radicals such as OH-, O2–, and H2O molecules.
Ph (%) = [(Co - Ci) / Co ] ×100,
Ph (%) = [(Ao - Ai) / Ao ] ×100,
The bandgap values for M-MnO2 and C-MnO2 nanoparticles suggest that both compounds can be effectively activated by sunlight's visible spectrum. Upon activation, electrons (e-) are excited from the valence band to the conduction band in both M-MnO2 and C-MnO2, creating electron-hole pairs. These photo-excited electrons in the conduction band can subsequently interact with the dissolved oxygen (O2) adsorbed on the surfaces of M-MnO2 or C-MnO2, yielding superoxide anion radicals (O2-). Simultaneously, the holes in the valence band can react with hydroxide ions (OH-) and water molecules (H2O) to produce hydroxyl radicals (OH-). These radicals, O2- and OH-, being highly reactive, are instrumental in breaking down organic molecular pollutants. The described mechanism provides insights into the photodegradation process of dyes, specifically methylene blue (MB) and Congo red (CR) [271].
MnO2 NPs → photons energy (hʋ) → α-MnO2 (h+ VB + e- CB),
e- + O2 → O2-,
3O2- + 2H2O+ 2H+→3H2O2 +O2,
h + VB + OH-→OH-,
h + VB + H2O → OH- + H+,
OH-/O2- + MB dye → non-toxic compounds (CO2 + H2O).
The superior photocatalytic activity of M-MnO2 over C-MnO2 can be attributed to its narrower band gap and reduced light scattering, enhancing its ability to absorb more light, as evident from the diffuse reflectance measurements. These findings suggest the potential for creating high-performing, cost-effective photocatalysts tailored for environmental and water treatment applications. While prior studies on MnO2 have demonstrated rapid degradation, they often relied on UV radiation as the light source, which comes with higher operational costs [177]. In this study, the photocatalytic experiment was conducted using direct visible sunlight on an immediately prepared dye solution, presenting a practical and cost-effective approach. Given the escalating production of industrial wastewater, particularly from the textile industry, there is an urgent need to commercialize this environmentally-friendly method. Further market research and exploration are crucial for scaling up this innovative approach to address the increasing environmental challenges.
7. Iron Oxide Nanoparticles
Iron and iron oxide nanoparticles are distinguished by their unique chemical, optical, and magnetic properties. Among the sixteen identified iron oxides, hematite (α-Fe2O3), maghemite (γ-Fe2O3), and magnetite (Fe3O4) are the most prevalent. Due to health, environmental, and economic considerations, biogenic production is often preferred [272]. The green synthesis of iron oxide NPs represents a burgeoning area in nanotechnology [273]. The efficiency in producing iron and iron oxide NPs is largely influenced by the quantity and concentration of antioxidants in plant extracts. Notably, plants with a high phenolic content exhibit potential reductive capability [274,275].
The green synthesis process of iron and iron oxide NPs typically involves combining plant extracts with iron precursors. A change in the solution's color signifies the reduction of iron salts to iron ions [276]. V. Ramalingam et al. [277] successfully synthesized hematite nanoparticles using guava and drumstick leaf extracts as natural solvents. The extract solution was stirred at 80°C for an hour. Subsequently, a ferrous salt solution was mixed with the extract, stirred for another hour, and then filtered.
In the medical field, the technique of utilizing grain extracts to synthesize iron oxide nanoparticles is gaining traction. The UV-visible spectra of iron oxide NPs produced using Echinochloa frumentacea grain extract is presented in Figure 18a, showcasing a prominent absorbance band at 289 nm [272]. Figure 18b depicts the XRD of the iron oxide NPs, confirming their significant crystallinity. Using Scherrer's formula, the average particle size was determined to be 26 nm. EDX analysis of iron oxide nanoparticles reveals the following composition: 30.80 at.% of iron, 64.11 at.% of oxygen, and 5.09 at.% of carbon as the predominant elements within the nanoparticles.
Magnetite (Fe3O4) NPs were bio-synthesized using an aqueous extract of Carica papaya leaves extract at room temperature. Figure 19 displays the XRD pattern and SEM image of the produced magnetite (Fe3O4) NPs, revealing a plate-like morphology characterized by coarse grains and encapsulated structures. Using the Scherrer's formula, the crystallite size of the magnetite was determined to be approximately 33 nm [278].
7.1. Iron Oxide NPs Applications
Diverse medical applications of iron oxide nanomaterials synthesized using Echinochloa frumentacea grain extract have been reported by Velsankar et al. [272]. These applications include antioxidant, anti-inflammatory, and anti-diabetic activities.
7.1.1. Antioxidant Activity
The antioxidant activity of iron oxide NPs was evaluated to assess their potential bioactivity. Using the DPPH method, various concentrations of nanoparticles were tested, with ascorbic acid serving as the reference standard. The results, presented in Figure 20a [272], detail the determined percentage activities. Specifically, iron oxide NPs exhibited antioxidant activities of 36.08% at 20 μg mL-1, 55.24% at 40 μg mL-1, 72.05% at 60 μg mL-1, and 95.10% at 80 μg mL-1. In comparison, ascorbic acid demonstrated antioxidant activities of 29.50%, 44.26%, 62.10%, and 84.20% at the same respective concentrations. The efficacy of the antioxidant activity was gauged by determining the IC50 value, which indicates the concentration of a substance needed to achieve 50% activity. A lower IC50 value signifies greater effectiveness. Remarkably, the IC50 value for iron oxide NPs (34.5 μg mL-1) was found to be lower than that of the standard ascorbic acid (46.45 μg mL-1).
7.1.2. Anti-Inflammatory Activity
To assess the protective potential of the nanoparticles, an anti-inflammatory study was conducted using egg albumin. Different concentrations of iron oxide nanoparticles were tested, with diclofenac sodium serving as the benchmark. The observed results are presented in Figure 20b [272]. The iron oxide nanoparticles exhibited anti-inflammatory activities of 34.81% at 20 μg mL-1, 53.95% at 40 μg mL-1, 75.18% at 60 μg mL-1, and 92.10% at 80 μg/mL. In comparison, diclofenac sodium showed anti-inflammatory activities of 28.50%, 45.80%, 67.25%, and 83.76% at those same respective concentrations. Notably, the iron oxide nanoparticles demonstrated superior effectiveness, as indicated by their lower IC50 value (35.88 μg mL-1) compared to the standard diclofenac sodium (43.92 μg mL-1).
7.1.3. Anti-Diabetic Activity
To assess their potential in biomedicine, the anti-diabetic properties of iron oxide NPs were investigated. The study utilized varying concentrations of iron oxide nanoparticles, with acarbose serving as the reference standard. The outcomes of this analysis, expressed in percentages, are illustrated in Figure 20c [272]. The iron oxide nanoparticles exhibited anti-diabetic activities of 38.10% at 20 μg mL-1, 54.89% at 40 μg mL-1, 78.25% at 60 μg mL-1, and 91.68% at 80 μg/mL. In comparison, acarbose demonstrated anti-diabetic effects of 30.43%, 45.98%, 63.90%, and 80.96% at the respective concentrations. Significantly, the iron oxide nanoparticles showcased a superior efficacy, reflected by their lower IC50 value (34.18 μg mL-1) as opposed to the standard acarbose (44.49 μg mL-1).
8. Silver Nanoparticles
Noble metals like gold and silver nanoparticles (Ag NPs) have garnered attention due to their unique ability to interact with electromagnetic radiation, resulting in a myriad of features, including surface plasmon resonance (SPR). This interaction imparts these nanoparticles with remarkable optical properties, electrical conductivity, and chemical stability [279,280]. Such attributes have paved the way for their utilization in diverse sectors such as medical science, gene therapy, thermotherapy, and environmental enhancements [281,282]. Among the various methods to produce these nanoparticles, green synthesis, especially for silver and gold NPs, stands out. It has been gaining traction due to its eco-friendliness, distinctive properties, and adaptability [283,284]. This section delves into the various plant extracts utilized for the eco-friendly synthesis of these precious metal nanoparticles. The biosynthesis process involving plant extracts combined with AgNO3 or HAuCl4 solutions is straightforward, eliminating the need for elevated temperature or pressure conditions. Additionally, this section further elaborates on the applications of green-synthesized Ag and Au NPs. An overview of the uses for both silver and gold nanoparticles include antimicrobial agents, antioxidants, medical devices, cancer treatments, electronic devices, etc. [285].
Alghoraibia et al. [286,287] determined that the total phenolic content in the plant extract was directly correlated with its antioxidant capacity. Thus, a richer content of phenolic compounds led to a more significant reduction of metallic ions. Gopinath et al. [288] employed the extract of Tribulus terrestris to synthesize silver NPs. Analytical techniques, including TEM and AFM, revealed that these nanoparticles possess a spherical morphology with an average diameter of 22 nm. Additionally, an aqueous leaf extract from Ocimum gratissimum was utilized to produce Ag NPs. Mehata [289] reported the green route synthesis of silver nanoparticles using plants/ginger extracts with enhanced surface plasmon resonance and degradation of textile dye. The impact of ginger extract on the fabrication of Ag NPs was observed by varying the amount of ginger extract from 0.5 mL to 2.0 mL in silver salt, and the absorption spectra were measured at each concentration (Figure 21a). The effect of pH on ginger-capped Ag NPs was analyzed by maintaining the pH of the solution in the range of 7 to 12 by using NaOH. Figure 21b showcases the XRD analysis, highlighting distinct peaks characteristic of Ag NPs. This pattern includes the (111), (200), (220), (311), (331), and (222) crystallographic planes. The sharp diffraction peaks observed at (111), (200), and (220) indicate the formation of nanosized particles with a face-centered cubic structure of silver [290]. SEM analysis of Ag NPs synthesized using Areca catechu showed spherical nanoparticles. Conversely, Ag NPs derived from the bulb of Allium cepa L. exhibited a cubical shape [291].
8.1. Ag NPs Applications
Green synthesis, using Tamarindus indica fruit shells, has been employed to produce silver nanoparticles. The extract from these fruit shells has been used to synthesize silver nanoparticles, which are applied in the treatment of human breast cancer [292]. Silver nanoparticles derived from plant extracts have been employed in drug delivery and, in some instances, direct disease treatment. When loaded with anti-infective agents, these synthesized nanoparticles could serve as even more potent nanocarriers [293]. Moreover, silver nanoparticles have been effectively synthesized from medicinal plant extracts, such as bamboo leaves. These plants are rich in phytochemicals, including flavonoids, phenolic acids, and lactones, endowing them with antiviral and antibacterial properties [294].
Silver possesses both antibacterial and anti-inflammatory properties, making Ag-based nanoparticles ideal for applications such as wound dressings, various detergents, shampoos, clothing, and toothpaste. Compared to other chemical agents and drugs, Ag nanoparticles have shown exceptional efficacy against antibiotic-resistant bacteria, multidrug-resistant tumors, parasitic diseases, and have also acted as antioxidants and antifungals. Therefore, the synthesis of eco-friendly and biocompatible Ag nanoparticles is of paramount importance [295]. Numerous studies have indicated the efficacy of Ag nanoparticles against a variety of cancer cell lines and viruses. Smaller Ag nanoparticles can readily enter cells either by simple diffusion or through membrane transporters, ion channels, or receptors.
8.2. Antiviral Activity
Silver nanoparticles possess potent virucidal properties and have demonstrated efficacy against an array of viruses, including the human immunodeficiency virus (HIV), various hepatitis strains (A, B, C, and E), and the herpes simplex virus (HSV-1 and 2). Upon contact with viral membranes, silver nanoparticles can permeate the cell, subsequently damaging the viral genome (be it DNA or RNA) and interacting with viral membrane glycoproteins. These interactions with the cell's genetic material curtail its ability to replicate, thereby limiting the spread of infections [296].
The significance of silver nanoparticles has been underscored during the COVID pandemic due to their proven antiviral properties. Specifically, they have demonstrated potential in inhibiting the proliferation of the SARS-CoV-2 virus by obstructing viral nucleotide replication. They engage with electron-donor groups found in bacterial enzymes, such as sulfur, oxygen, and nitrogen. This interaction deactivates the enzymes, depriving the cell of energy and quickly leading to its demise [297].
The exact mechanism by which silver nanoparticles neutralize viruses remains elusive. However, it is established that they bind to the outer structural proteins of viruses, hindering early infection stages by either blocking the virus's attachment, penetration, or destabilizing surface proteins that compromise the virions' structural integrity [298]. Typically, silver nanoparticles latch onto viral surface proteins with sulfhydryl groups, disintegrating disulfide bonds, which influence viral infections [299]. Furthermore, these nanoparticles also engage with viral nucleic acids, obstructing intracellular viruses [300].
The antiviral efficacy of silver nanoparticles is size-dependent. Research indicates that particles around 10 nm in size are especially potent, as their interactions with viral proteins are notably more stable compared to larger-sized particles [301]. Concentration also plays a role in the antiviral activity of silver nanoparticles. Studies suggest that they are most effective against viruses when used in concentrations ranging between 10 and 100 ppm [302]. Figure 22 provides a schematic depiction of the viral pre-treatment processes (top panel), subsequent cell treatments (middle panel), and preliminary cell treatments (bottom panel), illustrating the efficacy of silver nanoparticles against extracellular SARS-CoV-2.3A [302].
9. Gold Nanoparticles
Gold nanoparticles (Au NPs) are garnering significant attention from scientists due to their unique physicochemical properties. These include impressive thermal stability, robust chemical resilience, biocompatibility, non-toxicity, ease of synthesis, excellent dispersibility, high electrical and optical conductivity, a substantial surface area to volume ratio, and multifunctionality. Their stability under physiological conditions further bolsters their appeal across diverse disciplines such as biology, medicine, and materials science. Historically, gold has held a revered place in traditional medical practices, especially in ancient China and India, where it was believed to promote fertility and longevity [303,304,305].
9.1. Au NPs synthesis
In contemporary applications, Au NPs serve as antibacterial agents, tools for tumor detection and diagnosis, treatments for inflammatory conditions, and as diagnostic instruments in fluorescence tomography [306,307]. Their distinct optical properties have spurred investigations for a wide array of applications, spanning from medicine, catalysis, drug delivery, crystal growth, biolabeling, phase transfer, DNA melting assays, to therapeutic uses [308]. Owing to their versatility, Au NPs can be fashioned into various morphologies and sizes, encompassing spheres, rods, cages, belts, wires, octahedrons, prisms, and stars [309,310,311,312,313].
Given the significant role of Au NPs in medical treatments, this study focuses on the green synthesis of AuNPs and their emerging applications in cancer therapy and medical diagnostics. The push towards green synthesis arises from the need for a non-toxic, environmentally friendly, and biocompatible approach, as opposed to traditional methods that often involve harmful chemicals.
Various biological entities, such as plant tissues, bacteria, microorganisms, and other organisms, have been leveraged for the biosynthesis of Au NPs. Of these, plant-based biosynthesis stands out as an appealing method for the mass production of Au NPs, primarily due to its cost-effectiveness and the ability to produce nanoparticles with precise size and morphology [314]. Thus, utilizing plant extracts in the production of Au NPs may pave the way for innovative applications in the near future [315]. The green synthesis approach using plants, typically involves various plant parts, including leaves, bark, stems, and roots. These are finely chopped and boiled in distilled water to produce an extract. Subsequent purification processes, such as centrifugation and filtration, ensure the quality of the extract [316,317].
Proteins containing functional amino groups (-NH2) in plant-based extracts can actively participate in the reduction process of Au NPs [318]. Phytochemicals, such as flavones, alkaloids, and phenolic compounds, contain functional groups (e.g., -C-O-C-, -C-O-, -C=C-, and -C=O-) that facilitate the formation of Au NPs. In such a green synthesis approach, harmful chemicals like sodium borohydride (NaBH4) are substituted with non-toxic phytochemicals. These phytochemicals not only act as reducing agents but also serve as stabilizers or capping agents during the biosynthesis of Au NPs [319]. Jannathul and Lalitha proposed a mechanism of the biosynthesis of Au NPs using different plant sources [306]. Organometallic Au NPs have been prepared from diazonium tetrachloro aurate(III) complexes using a mild reducing agent, borohydride, by a simple method. This synthesis approach requires a revaluation process of isolated compounds from medicinal herbs with computational studies which will be helpful in producing Au NPs at a large scale for pharmaceutical applications. The green synthesis process begins by reducing metal ions from their monovalent or divalent oxidation states to the zero-valent state. The growth of the reduced metal atoms follows. Ultimately, the gold metallic salt solution undergoes reduction from Au3+ to Au0 due to the extract, culminating in the one-step synthesis of Au NPs in just a matter of minutes [320]. The diversity in sizes and shapes of the resulting nanoparticles can be attributed to variations in the composition and concentration of reducing agents present in the plant extracts [321].
For the biosynthesis of Au NPs, various fruit peel extract solutions have been utilized [322]. Pomegranate peel extracts, for instance, are used in the green synthesis of Au NPs, serving both as reducing agents and stabilizers or capping agents. The production of Au nanoparticles is evidenced by the color transition from gold to pink in the reaction mixture at room temperature [323].
In one study, Au NPs with diameters between 80 to 150 nm were produced using Plumeria alba flower extracts, which functioned as both reducing and encapsulating agents for the Au NPs. Mishra et al. demonstrated that the zero-calorie sweetener, Stevia rebaudiana leaves, can produce octahedral Au nanoparticles with sizes ranging from 8 to 20 nm [324]. Under ambient conditions (28 °C) and a pH range of 3.4-10.2, an aqueous leaf extract of Cassiem auriculata facilitated the conversion of gold ions into 15–25 nm nanoparticles [325]. There are also reports on the use of phytochemicals from cinnamon as reducing and stabilizing agents in the biosynthesis of gold nanoparticles [326]. Rapid reduction of Au ions using geranium leaf extract yielded gold NPs with rod and prismatic morphologies [327]. Moreover, the green synthesis of gold nanoparticles using extracts from green and red residual parts of watermelon has been documented [328]. These synthesized gold NPs were analyzed using UV-Vis spectra, XRD, energy-dispersive spectra (EDS), and SEM. The UV-Vis spectrum of Au NPs synthesized from red and green watermelon extracts (3:1 ratio: watermelon: AuCl4-) display a strong absorption peak at 560 nm. XRD pattern shows the presence of crystalline Au, with reflections at 2θ of 38.4°, 44.6°, 64.5°, and 77.8° corresponding to the (111), (200), (220), and (311) planes. SEM studies show the growth of various Au nanoparticle shapes produced by the red watermelon extract, and Au triangular nanoparticles generated by the green watermelon extract [328].
9.2. Green Au NPs Applications in Cancer Therapy and Diagnosis
Cancers are characterized by the uncontrolled division of cells [321]. Despite advances in medical science, cancer continues to claim millions of lives annually [329]. Traditional treatments for cancer encompass a range of methods, including surgery, immunotherapy, radiotherapy, chemotherapy, targeted therapies, hormone therapies, and bone marrow transplantation [330]. Typically, cancer patients initiate their treatment regimen with surgery or chemotherapy [331]. However, these conventional treatments often present challenges. They can lead to the emergence of drug-resistant cells, have detrimental effects on healthy cells, promote rapid drug metabolism, and consequently diminish the effective treatment duration [332]. Targeted therapy, which focuses on cancer cells directly, mitigates these adverse effects and enhances therapeutic efficiency. As a result, innovative targeted therapeutic drugs have been increasingly sought after in recent times [333].
Nanotechnology, an evolving domain, employs nanoscale particles for both therapeutic and diagnostic applications [334,335,336,337,338,339,340,341,342,343,344,345,346,347]. Notably, cancer treatment stands out as one medical arena where nanoparticles hold immense potential [334]. Thanks to their diverse surface chemistries, nanomaterials can be paired with molecularly targeted drug delivery components, such as antibodies, facilitating the selective elimination of tumor cells. Au NPs synthesized through green methods have recently garnered significant attention in the field. Au NPs exhibit cytotoxic effects on cancer cells while sparing healthy ones, positioning them as promising anticancer agents [336]. These nanoparticles have been employed for targeted drug delivery in cancer treatments [337]. It's notable that the anticancer efficacy of biosynthesized Au NPs varies, with their potency and cellular interactions hinging on the specific natural extracts used during their formation [338].
Gold nanoparticles derived from Corchorus olitorius extract have shown significant inhibitory effects on three types of cancer cells: hepatocellular cancer HepG-2, breast adenocarcinoma MCF-7, and colon cancer HCT-116 [339]. Fazel et al. further explored the anticancer potential of gold nanoparticles green-synthesized using cocoa extract [340]. Au NPs are versatile carriers capable of delivering hydrophobic and hydrophilic drugs, herbal medicines, peptides, antibodies, short interfering ribonucleic acids, antibiotics, chemotherapy agents, and small molecules directly to tumor sites without affecting healthy or surrounding tissues. Additionally, the protective layer of Au NPs shields the drug from enzymatic degradation in the bloodstream [342,343].
Utilizing biosynthesized Au NPs as nanocarriers for herbal medicinal compounds has the potential to revolutionize cancer treatment by minimizing adverse effects. Owing to their ability to house multiple drug molecules, these nanoparticles can also target and penetrate specific cells more efficiently [336]. Figure 23 depicts the anticancer mechanisms of Au NPs [336]. These mechanisms include alterations in cell permeability, mitochondrial dysfunction, the release of reactive oxygen species (ROS) leading to oxidative stress and DNA damage, modifications in the chemical composition of proteins and DNA, and cell cycle arrest [344,345,346].
This section highlights recent studies examining the antitumor effects of various green-synthesized Au NPs on different cancer cell types. Hoshyar et al. [348] employed crocin, a compound abundant in phytochemicals, to eco-friendly produce Au NPs in a single step. Crocin acts to neutralize harmful free radicals, thereby shielding cells from oxidative harm. The anti-proliferative effects of Crocin-Au NPs on human breast cancer cells were evaluated using the neutral red assay. An LDH (lactate dehydrogenase) analysis was conducted to ascertain the release rate of LDH enzymes from the cytoplasm. After 24 and 48 h of incubation, the IC50 (half-maximal inhibitory concentration) values of crocin-Au NPs stood at 1.8 mg mL-1 ± 0.08 and 1.2 mg mL-1 ± 0.04, respectively. These findings indicate a dose- and time-dependent decline in cancer cell viability. The observed results are attributed to the rapid internalization of the synthesized crocin-Au NPs by the cancer cells and the subsequent release of conjugated crocin from the Au NPs. Vinayagam et al. [349] green-synthesized Au NPs using Cynodon dactylon (Bermuda grass). The cytotoxic effects of these Au NPs were examined on the MCF-7 breast cancer cell line and the NIH 3T3 noncancerous cell line. Remarkably, even at elevated concentrations, the NIH 3T3 cell line exhibited negligible cytotoxicity. Furthermore, Au NPs derived from dragon fruit extract demonstrated notable anticancer activity against MCF-7 cells. Due to their diminutive size and expansive surface area, the Au NPs effectively targeted tumor sites. A remarkable inhibition of approximately 80% was achieved against MCF-7 cells at a concentration of 500 g mL-1 after 48 hours of treatment [350].
10. Concluding Remarks
The demand for safe and cost-efficient materials suitable for a diverse range of applications—from energy storage devices, biomedicine, and drug delivery, to cancer therapies, the medical industry, biosensors, textiles, water treatment, cosmetics, and dye degradation—has witnessed a surge in recent years. This escalating interest has prompted researchers to delve deeper into these issues. The quest is on for the evolution of eco-friendly and economical methods, with the anticipation that the future would necessitate novel, stable, non-toxic, and cost-effective materials. In this context, expanded research into the biosynthesis of NPs could prove immensely advantageous.
This paper provides an overview of the green synthesis of metal and metal oxide NPs and contrasts these methods with conventional approaches. The review highlights the potential of various natural extracts as replacements for traditional components or solvents, eliminating the need for additional capping agents or typical industrial surfactants that are challenging to remove post NP synthesis. Green synthesis emerges as an uncomplicated, eco-friendly, cost-effective, energy-efficient, and scalable method for crafting nanomaterials.
Among the nanoparticles with myriad applications are those made of manganese oxides, iron oxides, silver, and gold. This review delves into the green synthesis of MnO2-based NPs using an array of plant extracts known for their reductive capacities, attributed to biomolecules like flavonoids, terpenoids, polyphenols, alkaloids, saponins, proteins, and amino acids. Interestingly, NPs produced with plant extracts often exhibit superior properties than those crafted through conventional techniques. The composition and concentration of reducing agents in plant extracts play pivotal roles in determining the size, shape, and morphology of the resultant nanoparticles. Furthermore, the review offers insights into the large-scale fabrication of α-MnO2 nanomaterials and their subsequent deployment as photocatalysts in water purification, as well as electrode materials in energy storage mediums such as lithium-ion batteries and supercapacitors.
This paper also covers the biosynthesis and versatile applications of iron oxide, silver, and gold NPs. For instance, iron oxide NPs synthesized from Echinochloa frumentacea grain extracts emerge as potential candidates for applications in the medical realm, given their antioxidant, anti-inflammatory, and anti-diabetic properties. Additionally, the utilization of diverse plant extracts in the green synthesis of precious metal NPs, like silver and gold, and their myriad applications, form a crucial part of this comprehensive review.
Author Contributions
Writing—original draft preparation, H.M.A. and A.M.H.; writing—review and editing, L.Z. and C.M.J; supervision, A.M.H. All authors have read and agreed to the published version of the manuscript.
Funding
This research received no external funding.
Data Availability Statement
No new data were created.
Conflicts of Interest
The authors declare no conflict of interest.
Abbreviations
| 1D | one-dimensional |
| 2D | two-dimensional |
| 3D | three-dimensional |
| AFM | atomic force microscopy |
| BET | Brunauer, Emmett and Teller |
| BJH | Barrett-Joyner-Halenda |
| GCD | galvanostatic charge and discharge |
| CR dye | congo red dye |
| EDX | energy dispersive X-ray |
| Eg | energy bandgap |
| HAuCl4 | chloroauric acid |
| HCT-116 | colon cancer cell line |
| HepG-2 | human liver cancer cell line |
| HIV | human immunodeficiency virus |
| hʋ | photon energy |
| HSV-1 and 2 | herpes simplex virus |
| KMnO4 | potassium permanganate |
| LDHA | lactate dehydrogenase analysis |
| LIBs | lithium-ion batteries |
| MB dye | methylene blue dye |
| MCF-7 | breast cancer cell line |
| MDO | manganese dioxide |
| NIH 3T3 | non-cancerous cell |
| NPs | nanoparticles |
| SC | specific capacitance |
| SEM | scanning electron microscopy |
| SPR | surface plasmon resonance |
| TEM | transmission electron microscopy |
| UV-Vis | ultraviolet-visible |
| XRD | X-ray diffraction |
| ZnO | zinc oxide |
References
- Mattos, B.D.; Rojas, O.J.; Magalhães, W.L. Biogenic silica nanoparticles loaded with neem bark extract as green, slow-release biocide. J. Clean. Prod. 2017, 142, 4206–4213. [Google Scholar] [CrossRef]
- Hoseinpour, V.; Souri, M.; Ghaemi, N. Green synthesis, characterisation, and photocatalytic activity of manganese dioxide nanoparticles. Micro Nano Lett. 2018, 13, 1560–1563. [Google Scholar] [CrossRef]
- Alegbeleye, O.O. How functional is Moringa oleifera? A review of its nutritive, medicinal, and socioeconomic potential. Food Nutr. Bull. 2018, 39, 149. [Google Scholar]
- Ezhilarasi, A.A.; Vijaya, J.J.; Kaviyarasu, K.; Maaza, M.; Ayeshamariam, A.; Kennedy, L.J. Green synthesis of NiO nanoparticles using Moringa oleifera extract and their biomedical applications: Cytotoxicity effect of nanoparticles against HT-29 cancer cells. J. Photochem. Photobiol. B: Biol. 2016, 164, 352–360. [Google Scholar] [CrossRef]
- Elechiguerra, J.L.; Burt, J.L.; Morones, J.R.; Camacho-Bragado, A.; Gao, X.; Lara, H.H.; Yacaman, M.J. Interaction of silver nanoparticles with HIV-1. J. Nanobiotechnology 2005, 3, 6–6. [Google Scholar] [CrossRef] [PubMed]
- Shah, M.; Fawcett, D.; Sharma, S.; Tripathy, S.K.; Poinern, G.E.J. Green Synthesis of Metallic Nanoparticles via Biological Entities. Materials 2015, 8, 7278–7308. [Google Scholar] [CrossRef] [PubMed]
- Vu, C.M.; Ghotekar, S.; Viet, N.M.; Dabhane, H.; Oza, R.; Roy, A. Green synthesis of plant-assisted manganese-based nanoparticles and their various applications. In Plant and Nanoparticles; Chen, J.-T., Ed.; Springer: Singapore, 2022; pp. 339–354. [Google Scholar]
- Vanlalveni, C.; Lallianrawna, S.; Biswas, A.; Selvaraj, M.; Changmai, B.; Rokhum, S.L. Green synthesis of silver nanoparticles using plant extracts and their antimicrobial activities: a review of recent literature. RSC Adv. 2021, 11, 2804–2837. [Google Scholar] [CrossRef]
- Javed, B.; Ikram, M.; Farooq, F.; Sultana, T.; Raja, N.I. Biogenesis of silver nanoparticles to treat cancer, diabetes and microbial infections: A mechanistic overview. Appl. Microbiol. Biotechnol. 2021, 105, 6, 2261–2275. [Google Scholar] [CrossRef]
- Dabhane, H.; Ghotekar, S.K.; Tambade, P.J.; Pansambal, S.; Ananda-Murthy, H.C.; Oza, R.; Medhane, V. Cow urine mediated green synthesis of nanomaterial and their applications: A state-of-the-art review. J. Water Environ. Nanotechnol. 2021, 6, 81–91. [Google Scholar]
- Chouke, P.B.; Shrirame, T.; Potbhare, A.K.; Mondal, A.; Chaudhary, A.R.; Mondal, S.; Thakare, S.R.; Nepovimova, E.; Valis, M.; Kuca, K.; et al. Bioinspired metal/metal oxide nanoparticles: A road map to potential applications. Mater. Today Adv. 2022, 16. [Google Scholar] [CrossRef]
- Dabhane, H.; Ghotekar, S.; Tambade, P.; Pansambal, S.; Murthy, H.A.; Oza, R.; Medhane, V. A review on environmentally benevolent synthesis of CdS nanoparticle and their applications. Environ. Chem. Ecotoxicol. 2021, 3, 209–219. [Google Scholar] [CrossRef]
- Khan, I.; Saeed, K.; Khan, I. Nanoparticles: Properties, applications and toxicities. Arabian J. Chem. 2019, 12, 908–931. [Google Scholar] [CrossRef]
- Ghotekar, S.; Pagar, K.; Pansambal, S.; Murthy, H.A.; Oza, R. A review on eco-friendly synthesis of BiVO4 nanoparticle and its eclectic applications. Adv. J. Sci. Eng. 2020, 1, 106–112. [Google Scholar]
- Sekoai, P.T.; Ouma, C.N.M.; du Preez, S.P.; Modisha, P.; Engelbrecht, N.; Bessarabov, D.G.; Ghimire, A. Application of nanoparticles in biofuels: An overview. Fuel 2018, 237, 380–397. [Google Scholar] [CrossRef]
- Korde, P.; Ghotekar, S.; Pagar, T.; Pansambal, S.; Oza, R.; Mane, D. Plant extract assisted eco-benevolent synthesis of selenium nanoparticles - A review on plant parts involved, characterization and their recent applications. J. Chem. Rev. 2020, 2, 157–168. [Google Scholar]
- Alinezhad, H.; Pakzad, K.; Nasrollahzadeh, M. Efficient Sonogashira and A3 coupling reactions catalyzed by biosynthesized magnetic Fe3O4@Ni nanoparticles from Euphorbia maculata extract. Appl. Organomet. Chem. 2020, 34, e5473. [Google Scholar] [CrossRef]
- Pakzad, K.; Alinezhad, H.; Nasrollahzadeh, M. Green synthesis of Ni@Fe3O4 and CuO nanoparticles using Euphorbia maculata extract as photocatalysts for the degradation of organic pollutants under UV-irradiation. Ceram. Int. 2019, 45, 17173–17182. [Google Scholar] [CrossRef]
- Lu, H.; Zhang, X.; Khan, S.A.; Li, W.; Wan, L. Biogenic Synthesis of MnO2 Nanoparticles With Leaf Extract of Viola betonicifolia for Enhanced Antioxidant, Antimicrobial, Cytotoxic, and Biocompatible Applications. Front. Microbiol. 2021, 12. [Google Scholar] [CrossRef] [PubMed]
- Virkutyte, J.; Varma, R.S. Green synthesis of metal nanoparticles: Biodegradable polymers and enzymes in stabilization and surface functionalization. Chem. Sci. 2010, 2, 837–846. [Google Scholar] [CrossRef]
- Ciorîță, A.; Suciu, M.; Macavei, S.; Kacso, I.; Lung, I.; Soran, M.L.; Pârvu, M. Green synthesis of Ag-MnO2 nanoparticles using chelidonium majus and vinca minor extracts and their in vitro cytotoxicity. Molecules 2020, 25, 819. [Google Scholar] [CrossRef]
- Graziani, C.; Duranti, A.; Morelli, A.; Busani, L.; Pezzotti, P. Zoonosi in Italia nel periodo 2009-Rapporti ISTISAN. 2016. Available online: http://www. epicentro. iss. it/ben/2010/gennaio/1. asp (accessed on 14 September 2023).
- Alqarni, L.S.; Alghamdi, M.D.; Alshahrani, A.A.; Nassar, A.M. Green Nanotechnology: Recent Research on Bioresource-Based Nanoparticle Synthesis and Applications. J. Chem. 2022, 2022, 1–31. [Google Scholar] [CrossRef]
- Bar, H.; Bhui, D.K.; Sahoo, G.P.; Sarkar, P.; Pyne, S.; Misra, A. Green synthesis of silver nanoparticles using seed extract of Jatropha curcas. Colloids Surfaces A: Physicochem. Eng. Asp. 2009, 348, 212–216. [Google Scholar] [CrossRef]
- Singh, K.R.; Nayak, V.; Sarkar, T.; Singh, R.P. Cerium oxide nanoparticles: properties, biosynthesis and biomedical application. RSC Adv. 2020, 10, 27194–27214. [Google Scholar] [CrossRef]
- Singh, J.; Dutta, T.; Kim, K.-H.; Rawat, M.; Samddar, P.; Kumar, P. ‘Green’ synthesis of metals and their oxide nanoparticles: applications for environmental remediation. J. Nanobiotechnol. 2018, 16, 84. [Google Scholar] [CrossRef]
- Khan, F.; Shariq, M.; Asif, M.; Siddiqui, M.A.; Malan, P.; Ahmad, F. Green Nanotechnology: Plant-Mediated Nanoparticle Synthesis and Application. Nanomaterials 2022, 12, 673. [Google Scholar] [CrossRef]
- Pagar, T.; Ghotekar, S.; Pagar, K.; Pansambal, S.; Oza, R. A review on bio-synthesized Co3O4 nanoparticles using plant extracts and their diverse applications. J. Chem. Rev. 2019, 1, 260–270. [Google Scholar] [CrossRef]
- Bandeira, M.; Giovanela, M.; Roesch-Ely, M.; Devine, D.M.; da Silva Crespo, J. Green synthesis of zinc oxide nanoparticles: A review of the synthesis methodology and mechanism of formation. Sustain. Chem. Pharm. 2020, 15, 100223. [Google Scholar] [CrossRef]
- Nikam, A.; Pagar, T.; Ghotekar, S.; Pagar, K.; Pansambal, S. A Review on Plant Extract Mediated Green Synthesis of Zirconia Nanoparticles and Their Miscellaneous Applications. J. Chem. Rev. 2019, 1, 154–163. [Google Scholar] [CrossRef]
- Pagar, T.; Ghotekar, S.; Pansambal, S.; Oza, R.; Marasini, B.P. Facile plant extract mediated eco-benevolent synthesis and recent applications of CaO-NPs: A state-of-the-art review. J. Chem. Rev. 2020, 2, 201–210. [Google Scholar]
- Matussin, S.; Harunsani, M.H.; Tan, A.L.; Khan, M.M. Plant-Extract-Mediated SnO2 Nanoparticles: Synthesis and Applications. ACS Sustain. Chem. Eng. 2020, 8, 3040–3054. [Google Scholar] [CrossRef]
- Dabhane, H.; Ghotekar, S.; Tambade, P.; Medhane, V. Plant mediated green synthesis of lanthanum oxide (La2O3) nanoparticles: A review. Asian J. of Nanosci. Mater. 2020, 3, 291–299. [Google Scholar]
- Revathi, N.; Sankarganesh, M.; Raja, J.D.; Rajakanna, J.; Senthilkumar, O. Green synthesis of Plectranthus amboinicus leaf extract incorporated fine-tuned manganese dioxide nanoparticles: Antimicrobial and antioxidant activity. Inorg. Chem. Commun. 2023, 154. [Google Scholar] [CrossRef]
- Ameta, R.; Kumar Rai, A.; Vyas, S.; Bhatt, J.P.; Ameta, S.C. Green synthesis of nanocomposites using plant extracts and their applications. In Handbook of Greener Synthesis of Nanomaterials and Compounds, Elsevier, Amsterdam, The Netherlands, 2021, vol. 1, chapter 20, pp. 663–682.
- Chopra, H.; Bibi, S.; Singh, I.; Hasan, M.M.; Khan, M.S.; Yousafi, Q.; Baig, A.A.; Rahman, M.; Islam, F.; Bin Emran, T.; et al. Green Metallic Nanoparticles: Biosynthesis to Applications. Front. Bioeng. Biotechnol. 2022, 10, 874742. [Google Scholar] [CrossRef] [PubMed]
- Puente, C.; López, I. Plant extracts: a key ingredient for a greener synthesis of plasmonic nanoparticles. In Handbook of Greener Synthesis of Nanomaterials and Compounds, Elsevier, Amsterdam, The Netherlands, 2021, vol. 1, chapter 24, pp. 753–784.
- Papolu, P.; Bhogi, A. Green synthesis of various metal oxide nanoparticles for the environmental remediation-An overview. Mater. Today: Proc. 2023, 92, 924–927. [Google Scholar] [CrossRef]
- Gour, A.; Jain, N.K. , Advances in green synthesis of nanoparticles, Artif. Cells Nanomed. Biotechnol., 47 (2019) 844–851.
- Gupta, D.; Boora, A.; Thakur, A.; Gupta, T.K. Green and sustainable synthesis of nanomaterials: Recent advancements and limitations. Environ. Res. 2023, 231, 116316. [Google Scholar] [CrossRef]
- Jadoun, S.; Arif, R.; Jangid, N.K.; Meena, R.K. Green synthesis of nanoparticles using plant extracts: a review. Environ. Chem. Lett. 2020, 19, 355–374. [Google Scholar] [CrossRef]
- Jahan, I. Phyto-nanofabrication: Plant-mediated synthesis of metal and metal oxide nanoparticles. In Handbook of Research on Green Synthesis and Applications of Nanomaterials; IGI Global: Hershey, PA, USA, 2022. [Google Scholar]
- Begum, S.J.P.; Pratibha, S.; Rawat, J.M.; Venugopal, D.; Sahu, P.; Gowda, A.; Qureshi, K.A.; Jaremko, M. Recent Advances in Green Synthesis, Characterization, and Applications of Bioactive Metallic Nanoparticles. Pharmaceuticals 2022, 15, 455. [Google Scholar] [CrossRef]
- Chiong, M.C.; Chong, C.T.; Ng, J.-H.; Lam, S.S.; Tran, M.-V.; Chong, W.W.F.; Jaafar, M.N.M.; Valera-Medina, A. Liquid biofuels production and emissions performance in gas turbines: A review. Energy Convers. Manag. 2018, 173, 640–658. [Google Scholar] [CrossRef]
- David, A.; Kumar, R. Biogenesis of MnO2 Nanoparticles Using Momordica Charantia Leaf Extract. ECS Trans. 2022, 107, 747–759. [Google Scholar] [CrossRef]
- Nadimicherla, R.; Zha, R.; Wei, L.; Guo, X. Single crystalline flowerlike α-MoO3 nanorods and their application as anode material for lithium-ion batteries. J. Alloys Compd. 2016, 687, 79–86. [Google Scholar] [CrossRef]
- Soni, V.; Raizada, P.; Singh, P.; Cuong, H.N.; S, R.; Saini, A.; Saini, R.V.; Van Le, Q.; Nadda, A.K.; Le, T.-T.; et al. Sustainable and green trends in using plant extracts for the synthesis of biogenic metal nanoparticles toward environmental and pharmaceutical advances: A review. Environ. Res. 2021, 202, 111622. [Google Scholar] [CrossRef]
- Bukhari, A.; Ijaz, I.; Gilani, E.; Nazir, A.; Zain, H.; Saeed, R.; Alarfaji, S.S.; Hussain, S.; Aftab, R.; Naseer, Y. Green Synthesis of Metal and Metal Oxide Nanoparticles Using Different Plants’ Parts for Antimicrobial Activity and Anticancer Activity: A Review Article. Coatings 2021, 11, 1374. [Google Scholar] [CrossRef]
- Roy, S.; Kumar Das, T. Plant mediated green synthesis of silver nanoparticles-A review. Int. J. Plant Biol. Res. 2015, 3, 1044. [Google Scholar]
- Kumari, S.; Verma, R.; Chauhan, A.; Raja, V.; Kumari, S.; Kulshrestha, S. Biogenic approach for synthesis of nanoparticles via plants for biomedical applications: A review. Mater. Today: Proc. [CrossRef]
- Bhau, B.; Ghosh, S.; Puri, S.; Borah, B.; Sarmah, D.K.; Raju, K. Green Synthesis Of Gold Nanoparticles From The Leaf Extract Of Nepenthes Khasiana And Antimicrobial Assay. Adv. Mater. Lett. 2015, 6, 55–58. [Google Scholar] [CrossRef]
- Vinod, V.; Saravanan, P.; Sreedhar, B.; Devi, D.K.; Sashidhar, R. A facile synthesis and characterization of Ag, Au and Pt nanoparticles using a natural hydrocolloid gum kondagogu (Cochlospermum gossypium). Colloids Surfaces B: Biointerfaces 2011, 83, 291–298. [Google Scholar] [CrossRef] [PubMed]
- Venkateswarlu, S.; Kumar, B.N.; Prathima, B.; Anitha, K.; Jyothi, N. A novel green synthesis of Fe3O4-Ag core shell recyclable nanoparticles using Vitis vinifera stem extract and its enhanced antibacterial performance. Phys. B: Condens. Matter 2015, 457, 30–35. [Google Scholar] [CrossRef]
- Saif, S.; Tahir, A.; Chen, Y. Green Synthesis of Iron Nanoparticles and Their Environmental Applications and Implications. Nanomaterials 2016, 6, 209. [Google Scholar] [CrossRef] [PubMed]
- Keihan, A.H.; Veisi, H.; Veasi, H. Green synthesis and characterization of spherical copper nanoparticles as organometallic antibacterial agent. Appl. Organomet. Chem. 2016, 31. [Google Scholar] [CrossRef]
- Saif, S.; Tahir, A.; Asim, T.; Chen, Y. Plant Mediated Green Synthesis of CuO Nanoparticles: Comparison of Toxicity of Engineered and Plant Mediated CuO Nanoparticles towards Daphnia magna. Nanomaterials 2016, 6, 205. [Google Scholar] [CrossRef]
- Veisi, H.; Rostami, A.; Shirinbayan, M. Greener approach for synthesis of monodispersed palladium nanoparticles using aqueous extract of green tea and their catalytic activity for the Suzuki–Miyaura coupling reaction and the reduction of nitroarenes. Appl. Organomet. Chem. 2016, 31. [Google Scholar] [CrossRef]
- Rajakumar, G.; Rahuman, A.A.; Chung, I.M.; Kirthi, A.V.; Marimuthu, S.; Anbarasan, K. Antiplasmodial, activity of eco-friendly synthesized palladium nanoparticles using Eclipta prostrate extract against Plasmodium berghei in Swiss albino mice. Parasitol. Res. 2015, 114, 1397–1406. [Google Scholar] [CrossRef]
- Chung, I.-M.; Rahuman, A.A.; Marimuthu, S.; Kirthi, A.V.; Anbarasan, K.; Rajakumar, G. An Investigation of the Cytotoxicity and Caspase-Mediated Apoptotic Effect of Green Synthesized Zinc Oxide Nanoparticles Using Eclipta prostrata on Human Liver Carcinoma Cells. Nanomaterials 2015, 5, 1317–1330. [Google Scholar] [CrossRef]
- Ahmed, S.; Ahmad, M.; Swami, B.L.; Ikram, S. A review on plants extract mediated synthesis of silver nanoparticles for antimicrobial applications: A green expertise. J. Adv. Res. 2015, 7, 17–28. [Google Scholar] [CrossRef] [PubMed]
- Venkatesan, J.; Kim, S.-K.; Shim, M. Antimicrobial, antioxidant, and anticancer activities of biosynthesized silver nanoparticles using marine algae Ecklonia cava. Nanomaterials 2016, 6, 235. [Google Scholar] [CrossRef]
- Xia, Q.H.; Ma, Y.J.; Wang, J.W. Biosynthesis of Silver Nanoparticles Using Taxus yunnanensis Callus and Their Antibacterial Activity and Cytotoxicity in Human Cancer Cells. Nanomaterials 2016, 6, 160. [Google Scholar] [CrossRef]
- Yan, D.; Zhang, H.; Chen, L.; Zhu, G.; Wang, Z.; Xu, H.; Yu, A. Supercapacitive properties of Mn3O4 nanoparticles bio-synthesized from banana peel extract. RSC Adv. 2014, 4, 23649–23652. [Google Scholar] [CrossRef]
- Sharma, J.K.; Srivastava, P.; Ameen, S.; Akhtar, M.S.; Singh, G.; Yadava, S. Azadirachta indica plant-assisted green synthesis of Mn3O4 nanoparticles: Excellent thermal catalytic performance and chemical sensing behavior. J. Colloid Interface Sci. 2016, 472, 220–228. [Google Scholar] [CrossRef] [PubMed]
- Sanchez-Botero, L.; Herrera, A.P.; Hinestroza, J.P. Oriented growth of α-MnO2 nanorods using natural extracts from grape stems and apple peels. Nanomaterials 2017, 7, 117. [Google Scholar] [CrossRef] [PubMed]
- Anastas, P.T.; Warner, J.C. Green Chemistry: Theory and Practice; Oxford University Press: New York, NY, USA; 1998. [Google Scholar]
- Singh, J.; Dutta, T.; Kim, K.-H.; Rawat, M.; Samddar, P.; Kumar, P. ‘Green’ synthesis of metals and their oxide nanoparticles: applications for environmental remediation. J. Nanobiotechnol. 2018, 16, 84. [Google Scholar] [CrossRef]
- Tun, M.M.; Juchelková, D.; Raclavská, H.; Sassmanová, V. Utilization of Biodegradable Wastes as a Clean Energy Source in the Developing Countries: A Case Study in Myanmar. Energies 2018, 11, 3183. [Google Scholar] [CrossRef]
- Aswathi, V.P.; Meera, S.; Maria, C.G.A.; Nidhin, M. Green synthesis of nanoparticles from biodegradable waste extracts and their applications: a critical review. Nanotechnol. Environ. Eng. 2022, 8, 377–397. [Google Scholar] [CrossRef]
- Huston, M.; De Bella, M.; Di Bella, M.; Gupta, A. Green synthesis of nanomaterials. Nanomaterials 2021, 8, 2130. [Google Scholar] [CrossRef] [PubMed]
- Jain, D.; Kumar Daima, H.; Kachhwaha, S.; Kothari, S.L. Synthesis of plant-mediated silver nanoparticles using papaya fruit extract and evaluation of their antimicrobial activities. Dig. J. Nanomater. Biostruct. 2009, 4, 557–563. [Google Scholar]
- Hashem, A.; Abuzeid, H.; Kaus, M.; Indris, S.; Ehrenberg, H.; Mauger, A.; Julien, C. Green synthesis of nanosized manganese dioxide as positive electrode for lithium-ion batteries using lemon juice and citrus peel. Electrochimica Acta 2018, 262, 74–81. [Google Scholar] [CrossRef]
- Abuzeid, H.M.; Elsherif, S.A.; Ghany, N.A.A.; Hashem, A.M. Facile, cost-effective and eco-friendly green synthesis method of MnO2 as storage electrode materials for supercapacitors. J. Energy Storage 2018, 21, 156–162. [Google Scholar] [CrossRef]
- Milne, J.; Zhitomirsky, I. Application of octanohydroxamic acid for liquid-liquid extraction of manganese oxides and fabrication of supercapacitor electrodes. J. Colloid Interface Sci. 2018, 515, 50–57. [Google Scholar] [CrossRef] [PubMed]
- Abuzeid, H.M.; Hashem, A.M.; Kaus, M.; Knapp, M.; Indris, S.; Ehrenberg, H.; Mauger, A.; Julien, C.M. Electrochemical performance of nanosized MnO2 synthesized by redox route using biological reducing agents. J. Alloy. Compd. 2018, 746, 227–237. [Google Scholar] [CrossRef]
- Katata-Seru, L.; Moremedi, T.; Aremu, O.S.; Bahadur, I. Green synthesis of iron nanoparticles using Moringa oleifera extracts and their applications: Removal of nitrate from water and antibacterial activity against Escherichia coli. J. Mol. Liq. 2018, 256, 296–304. [Google Scholar] [CrossRef]
- Singh, P.; Kim, Y.-J.; Zhang, D.; Yang, D.-C. Biological Synthesis of Nanoparticles from Plants and Microorganisms. Trends Biotechnol. 2016, 34, 588–599. [Google Scholar] [CrossRef]
- Hussain, I.; Singh, N.B.; Singh, A.; Singh, H.; Singh, S.C. Green synthesis of nanoparticles and its potential application. Biotechnol. Lett. 2016, 38, 545–560. [Google Scholar] [CrossRef]
- Das, R.K.; Pachapur, V.L.; Lonappan, L.; Naghdi, M.; Pulicharla, R.; Maiti, S.; Cledon, M.; Dalila, L.M.A.; Sarma, S.J.; Brar, S.K. Biological synthesis of metallic nanoparticles: plants, animals and microbial aspects. Nanotechnol. Environ. Eng. 2017, 2, 18. [Google Scholar] [CrossRef]
- Samuel, M.S.; Ravikumar, M.; J. , A.J.; Selvarajan, E.; Patel, H.; Chander, P.S.; Soundarya, J.; Vuppala, S.; Balaji, R.; Chandrasekar, N. A Review on Green Synthesis of Nanoparticles and Their Diverse Biomedical and Environmental Applications. Catalysts 2022, 12, 459. [Google Scholar] [CrossRef]
- Ahmad, W.; Bhatt, S.C.; Verma, M.; Kumar, V.; Kim, H. A review on current trends in the green synthesis of nickel oxide nanoparticles, characterizations, and their applications. Environ. Nanotechnology, Monit. Manag. 2022, 18, 100674. [Google Scholar] [CrossRef]
- Bar, H.; Bhui, D.K.; Sahoo, G.P.; Sarkar, P.; De, S.P.; Misra, A. Green synthesis of silver nanoparticles using latex of Jatropha curcas. Colloids Surfaces A: Physicochem. Eng. Asp. 2009, 339, 134–139. [Google Scholar] [CrossRef]
- Cruz, D.; Falé, P.L.; Mourato, A.; Vaz, P.D.; Serralheiro, M.L.; Lino, A.R.L. Preparation and physicochemical characterization of Ag nanoparticles biosynthesised by Lippia citriodora (Lemon Verbena). Colloids Surf. B 2010, 81, 67–73. [Google Scholar] [CrossRef] [PubMed]
- Iravani, S.; Korbekandi, H.; Mirmohammadi, S.V.; Zolfaghari, B. Synthesis of silver nanoparticles: Chemical, physical and biological methods. Res. Pharm. Sci. 2014, 9, 385–406. [Google Scholar] [PubMed]
- Vijayakumar, S.; Vaseeharan, B.; Malaikozhundan, B.; Gopi, N.; Ekambaram, P.; Pachaiappan, R.; Velusamy, P.; Murugan, K.; Benelli, G.; Kumar, R.S.; et al. Therapeutic effects of gold nanoparticles synthesized using Musa paradisiaca peel extract against multiple antibiotic resistant Enterococcus faecalis biofilms and human lung cancer cells (A549). Microb. Pathog. 2017, 102, 173–183. [Google Scholar] [CrossRef] [PubMed]
- Netala, VR, Bukke, S. ; Domdi, L.; Soneya, S.; Reddy, G.S.; Bethu, M.S.; Kotakdi, V.S.; Saritha, K.V.; Tartte, V. Biogenesis of silver nanoparticles using leaf extract of Indigofera hirsuta L. and their potential biomedical applications (3-in-1 system). Artif. Cells Nanomed. Biotechnol. 2018, 46, 1138–1148.
- Khatami, M.; Pourseyedi, S.; Khatami, M.; Hamidi, H.; Zaeifi, M.; Soltani, L. Synthesis of silver nanoparticles using seed exudates of Sinapis arvensis as a novel bioresource, and evaluation of their antifungal activity. Bioresour. Bioprocess. 2015, 2, 19. [Google Scholar] [CrossRef]
- Sharma, D.; Sabela, M.I.; Kanchi, S.; Mdluli, P.S.; Singh, G.; Stenström, T.A.; Bisetty, K. Biosynthesis of ZnO nanoparticles using Jacaranda mimosifolia flowers extract: Synergistic antibacterial activity and molecular simulated facet specific adsorption studies. J. Photochem. Photobiol. B: Biol. 2016, 162, 199–207. [Google Scholar] [CrossRef]
- Manikandan, R.; Beulaja, M.; Thiagarajan, R.; Palanisam, S.; Goutham, G.; Koodalingam, A.; Prabhu, N.M.; Kannapiran, E.; Jothi Basu, M.; Arulvasu, C.; Arumugam, M. Biosynthesis of silver nanoparticles using aqueous extract of Phyllanthus acidus L. fruits and characterization of its anti-inflammatory effect against H2O2 exposed rat peritoneal macrophages. Process Biochem. 2017, 55, 172–181. [Google Scholar]
- Kumar, S.; Bhattacharya, W.; Singh, M.; Halder, D.; Mitra, A. Plant latex capped colloidal silver nanoparticles: a potent anti-biofilm and fungicidal formulatio. J. Mol. Liq. 2017, 230, 705–713. [Google Scholar] [CrossRef]
- Kumar, P.N.; Sakthivel, K.; Balasubramanian, V. Microwave assisted biosynthesis of rice shaped ZnO nanoparticles using Amorphophallus konjac tuber extract and its application in dye sensitized solar cells. Mater. Sci. Pol. 2017, 35, 111–119. [Google Scholar] [CrossRef]
- Hegazy, H.; Shabaan, L.D.; Rabie, G.; Raie, D.S. Biosynthesis of silver nanoparticles using cell free callus exudates of Medicago sativa L. Pak. J. Bot. 2015, 47, 1825–1929. [Google Scholar]
- Yallappa, S.; Manjanna, J.; Dhananjaya, B. Phytosynthesis of stable Au, Ag and Au–Ag alloy nanoparticles using J. Sambac leaves extract, and their enhanced antimicrobial activity in presence of organic antimicrobials. Spectrochim. Acta Part A: Mol. Biomol. Spectrosc. 2015, 137, 236–243. [Google Scholar] [CrossRef]
- Kumari, M.M.; Jacob, J.; Philip, D. Green synthesis and applications of Au–Ag bimetallic nanoparticles. Spectrochim. Acta Part A: Mol. Biomol. Spectrosc. 2015, 137, 185–192. [Google Scholar] [CrossRef]
- Kumar, H.; Bhardwaj, K.; Dhanjal, D.S.; Nepovimova, E.; Șen, F.; Regassa, H.; Singh, R.; Verma, R.; Kumar, V.; Kumar, D.; et al. Fruit Extract Mediated Green Synthesis of Metallic Nanoparticles: A New Avenue in Pomology Applications. Int. J. Mol. Sci. 2020, 21, 8458. [Google Scholar] [CrossRef] [PubMed]
- Vidya, C.; Manjunatha, C.; Chandraprabha, M.N.; Rajshekar, M.; Mal, A.R. Hazard free green synthesis of ZnO nano-photocatalyst using Artocarpus heterophyllus leaf extract for the degradation of Congo red dye in water treatment applications. J. Environ. Chem. Eng. 2017, 5, 3172–3180. [Google Scholar] [CrossRef]
- Souri, M.; Shakeri, A. Comparison of microwave and ultrasound assisted extraction methods on total phenol and tannin content and biological activity of Dittrichia graveolens (L. ) Greuter and its optimization by response surface methodology. Curr. Bioact. Compd. 2018, 14, 23. [Google Scholar]
- Rahmat, M.; Bhatti, H.; Rehman, A.; Chaudhry, H.; Yameen, M.; Iqbal, M.; Al-Mijalli, S.; Alwadai, N.; Fatima, M.; Abbas, M. Bionanocomposite of Au decorated MnO2 via in situ green synthesis route and antimicrobial activity evaluation. Arab. J. Chem. 2021, 14, 103415. [Google Scholar] [CrossRef]
- Sari, K.R.P.; Ikawati, Z.; Danarti, R.; Hertiani, T. Micro-titer plate assay for measurement of total phenolic and total flavonoid contents in medicinal plant extracts. Arab. J. Chem. 2023, 16. [Google Scholar] [CrossRef]
- Prathna, T.; Mathew, L.; Chandrasekaran, N.; Raichur, A.M.; Mukherjee, A. Biomimetic Synthesis of Nanoparticles: Science, Technology & Applicability. In Biomimetics Learning from Nature; Intechopen: London, UK, 2010. [Google Scholar] [CrossRef]
- Porrawatkul, P.; Nuthong, W.; Pimsen, R.; Thongsom, M. , Green synthesis of silver nanoparticles using Barringtoniaacutangula (L. ) Gaertn leaf extract as reducing agent and their antibacterial and antioxidantactivity. J. Appl. Sci. 2017, 16, 75–81. [Google Scholar]
- Fatimah, I. Green synthesis of silver nanoparticles using extract of Parkia speciose Hassk pods assisted by microwave irradiation. J. Adv. Res. 2016, 7, 961–969. [Google Scholar] [CrossRef]
- Drummer, S.; Madzimbamuto, T.; Chowdhury, M. Green Synthesis of Transition-Metal Nanoparticles and Their Oxides: A Review. Materials 2021, 14, 2700. [Google Scholar] [CrossRef] [PubMed]
- Makarov, V.V.; Love, A.J.; Sinitsyna, O.V.; Makarova, S.S.; Yaminsky, I.V.; Taliansky, M.E.; Kalinina, N.O. “Green” nanotechnologies: synthesis of metal nanoparticles using plants. Acta Naturae 2014, 6, 35–44. [Google Scholar] [CrossRef] [PubMed]
- Nwachukwu, I.M.; Nwanya, A.C.; Alshoaibi, A.; Awada, C.; Ekwealor, A.B.C.; Ezema, F.I. Recent Progress in green synthesized transition metal-based oxides in LIBs as energy storage devices. Current Opinion Electrochem. 2023, 39, 101250. [Google Scholar] [CrossRef]
- Feltham, R.D.; Brant, P. XPS studies of core binding energies in transition metal complexes. 2. Ligand group shifts. J. Am. Chem. Soc. 1982, 104, 641–645. [Google Scholar] [CrossRef]
- Manchon, A.; Belabbes, A. , Spin-orbitronics at transition metal interfaces. Solid State Phys. 2017, 68, 1–89. [Google Scholar]
- Hariharan, D.; Srinivasan, K.; Nehru, L.C. Synthesis and characterization of TiO2 nanoparticles using Cynodon dactylon leaf extract for antibacterial and anticancer (A549 cell lines) activity. J. Nanomed. Res. 2017, 5, 4–8. [Google Scholar]
- Silva, L.P.; Reis, I.; Bonatto, C.C. Green synthesis of metal nanoparticles by plants: current trends and challenges. Green Process Nanotechnol. 2015, 9, 327–52. [Google Scholar]
- Soltys, L.; Olkhovyy, O.; Tatarchuk, T.; Naushad, M. Green Synthesis of Metal and Metal Oxide Nanoparticles: Principles of Green Chemistry and Raw Materials. Magnetochemistry 2021, 7, 145. [Google Scholar] [CrossRef]
- Ghojavand, S.; Madani, M.; Karimi, J. Green Synthesis, Characterization and Antifungal Activity of Silver Nanoparticles Using Stems and Flowers of Felty Germander. J. Inorg. Organomet. Polym. Mater. 2020, 30, 2987–2997. [Google Scholar] [CrossRef]
- Chandrababu, P.; Cheriyan, S.; Raghavan, R. Aloe vera leaf extract-assisted facile green synthesis of amorphous Fe2O3 for catalytic thermal decomposition of ammonium perchlorate. J. Therm. Anal. Calorim. 2020, 139, 89–99. [Google Scholar] [CrossRef]
- Dutta, T.; Ghosh, N.N.; Das, M.; Adhikary, R.; Mandal, V.; Chattopadhyay, A.P. Green synthesis of antibacterial and antifungal silver nanoparticles using Citrus limetta peel extract: Experimental and theoretical studies. J. Environ. Chem. Eng. 2020, 8, 104019. [Google Scholar] [CrossRef]
- Luque, P.A.; Nava, O.; Soto-Robles, C.A.; Chinchillas-Chinchillas, M.J.; Garrafa-Galvez, H.E.; Baez-Lopez, Y.A.; Valdez-Núñez, K.P.; Vilchis-Nestor, A.R.; Castro-Beltrán, A. Improved photocatalytic efficiency of SnO2 nanoparticles through green synthesis. Optik 2020, 206, 164299. [Google Scholar] [CrossRef]
- Ahmed, T.; Shahid, M.; Noman, M.; Niazi, M.B.K.; Zubair, M.; Almatroudi, A.; Khurshid, M.; Tariq, F.; Mumtaz, R.; Li, B. Bioprospecting a native silver-resistant Bacillus safensis strain for green synthesis and subsequent antibacterial and anticancer activities of silver nanoparticles. J. Adv. Res. 2020, 24, 475–483. [Google Scholar] [CrossRef] [PubMed]
- Ibrahim, E.; Zhang, M.; Zhang, Y.; Hossain, A.; Qiu, W.; Chen, Y.; Wang, Y.; Wu, W.; Sun, G.; Li, B. , Green-synthetization of silver nanoparticles using endophytic bacteria isolated from garlic and its antifungal activity against wheat Fusarium head blight pathogen Fusarium graminearum. Nanomaterials 2020, 10, 219. [Google Scholar] [CrossRef]
- Clarance, P.; Luvankar, B.; Sales, J.; Khusro, A.; Agastian, P.; Tack, J.-C.; Al Khulaifi, M.M.; Al-Shwaiman, H.A.; Elgorban, A.M.; Syed, A.; et al. Green synthesis and characterization of gold nanoparticles using endophytic fungi Fusarium solani and its in-vitro anticancer and biomedical applications. Saudi J. Biol. Sci. 2019, 27, 706–712. [Google Scholar] [CrossRef]
- Mahanty, S.; Bakshi, M.; Ghosh, S.; Chatterjee, S.; Bhattacharyya, S.; Das, P.; Das, S.; Chaudhuri, P. Green Synthesis of Iron Oxide Nanoparticles Mediated by Filamentous Fungi Isolated from Sundarban Mangrove Ecosystem, India. BioNanoScience 2019, 9, 637–651. [Google Scholar] [CrossRef]
- Chhipa, H. Mycosynthesis of nanoparticles for smart agricultural practice: A green and eco-friendly approach. In Micro and Nano Technologies; Shukla, A.K., Iravani, S., Eds.; Elsevier: Amsterdam, The Netherlands, 2019. [Google Scholar]
- Molnár, Z.; Bódai, V.; Szakacs, G.; Erdélyi, B.; Fogarassy, Z.; Sáfrán, G.; Varga, T.; Kónya, Z.; Tóth-Szeles, E.; Szűcs, R.; et al. Green synthesis of gold nanoparticles by thermophilic filamentous fungi. Sci. Rep. 2018, 8, 1–12. [Google Scholar] [CrossRef]
- Chellapandian, C.; Ramkumar, B.; Puja, P.; Shanmuganathan, R.; Pugazhendhi, A.; Kumar, P. Gold nanoparticles using red seaweed Gracilaria verrucosa: Green synthesis, characterization and biocompatibility studies. Process. Biochem. 2019, 80, 58–63. [Google Scholar] [CrossRef]
- Sathishkumar, R.; Sundaramanickam, A.; Srinath, R.; Ramesh, T.; Saranya, K.; Meena, M.; Surya, P. Green synthesis of silver nanoparticles by bloom forming marine microalgae Trichodesmium erythraeum and its applications in antioxidant, drug-resistant bacteria, and cytotoxicity activity. J. Saudi Chem. Soc. 2019, 23, 1180–1191. [Google Scholar] [CrossRef]
- Borah, D.; Das, N.; Das, N.; Bhattacharjee, A.; Sarmah, P.; Ghosh, K.; Chandel, M.; Rout, J.; Pandey, P.; Ghosh, N.N.; Bhattacharjee, C.R. Alga-mediated facile green synthesis of silver nanoparticles: Photophysical, catalytic and antibacterial activity. Appl. Organomet. Chem. 2020, 34, e5597. [Google Scholar] [CrossRef]
- Kathiraven, T.; Sundaramanickam, A.; Shanmugam, N.; Balasubramanian, T. Green synthesis of silver nanoparticles using marine algae Caulerpa racemosa and their antibacterial activity against some human pathogens. Appl. Nanosci. 2014, 5, 499–504. [Google Scholar] [CrossRef]
- Sajjad, S.; Leghari, S.A.K.; Ryma, N.U.A.; Farooqi, S.A. Green synthesis of metal-based nanoparticles and their applications. In Green Metal Nanoparticles: Synthesis, Characterization and their Applications, Kanchi, S.; Ahmed Shakeel, Ed.; Scrivener Publishing LLC: Beverly, MA, USA, 2018. [Google Scholar]
- Akçay, F.A.; Avcı, A. Effects of process conditions and yeast extract on the synthesis of selenium nanoparticles by a novel indigenous isolate Bacillus sp. EKT1 and characterization of nanoparticles. Arch. Microbiol. 2020, 202, 2233–2243. [Google Scholar] [CrossRef] [PubMed]
- Sivaraj, A.; Kumar, V.; Sunder, R.; Parthasarathy, K.; Kasivelu, G. Commercial Yeast Extracts Mediated Green Synthesis of Silver Chloride Nanoparticles and their Anti-mycobacterial Activity. J. Clust. Sci. 2020, 31, 287–291. [Google Scholar] [CrossRef]
- Shu, M.; He, F.; Li, Z.; Zhu, X.; Ma, Y.; Zhou, Z.; Yang, Z.; Gao, F.; Zeng, M. Biosynthesis and Antibacterial Activity of Silver Nanoparticles Using Yeast Extract as Reducing and Capping Agents. Nanoscale Res. Lett. 2020, 15, 1–9. [Google Scholar] [CrossRef]
- Kaur, M.; Gautam, A.; Guleria, P.; Singh, K.; Kumar, V. Green synthesis of metal nanoparticles and their environmental applications. Curr. Opin. Environ. Sci. Heal. 2022, 29. [Google Scholar] [CrossRef]
- Chen, J.; Li, Y.; Fang, G.; Cao, Z.; Shang, Y.; Alfarraj, S.; Alharbi, S.A.; Li, J.; Yang, S.; Duan, X. Green synthesis, characterization, cytotoxicity, antioxidant, and anti-human ovarian cancer activities of Curcumae kwangsiensis leaf aqueous extract green synthesized gold nanoparticles. Arab. J. Chem. 2021, 14, 103000. [Google Scholar] [CrossRef]
- Yew, Y.P.; Shameli, K.; Miyake, M.; Ahmad Khairudin, N.B.B.; Mohamad, S.E.B.; Naiki, T.; Lee, K.X. Green biosynthesis of superparamagnetic magnetite Fe3O4 nanoparticles and biomedical applications in targeted anticancer drug delivery system: A review. Arab. J. Chem. 2020, 13, 2287–2308. [Google Scholar] [CrossRef]
- Khalil, A.T.; Ovais, M.; Ullah, I.; Ali, M.; Shinwari, Z.K.; Maaza, M. Physical properties, biological applications and biocompatibility studies on biosynthesized single phase cobalt oxide (Co3O4) nanoparticles via Sageretia thea (Osbeck.). Arab. J. Chem. 2020, 13, 606–619. [Google Scholar] [CrossRef]
- Ramesh, P.; Saravanan, K.; Manogar, P.; Johnson, J.; Vinoth, E.; Mayakannan, M. Green synthesis and characterization of biocompatible zinc oxide nanoparticles and evaluation of its antibacterial potential. Sens. Bio-Sensing Res. 2021, 31, 100399. [Google Scholar] [CrossRef]
- Boudiaf, M.; Messai, Y.; Bentouhami, E.; Schmutz, M.; Blanck, C.; Ruhlmann, L.; Bezzi, H.; Tairi, L.; Mekki, D.E. Green synthesis of NiO nanoparticles using Nigella sativa extract and their enhanced electro-catalytic activity for the 4-nitrophenol degradation. J. Phys. Chem. Solids 2021, 153, 110020. [Google Scholar] [CrossRef]
- Sarwar, N.; Bin Humayoun, U.; Kumar, M.; Alam Zaidi, S.F.; Yoo, J.H.; Ali, N.; Jeong, D.I.; Lee, J.H.; Yoon, D.H. Citric acid mediated green synthesis of copper nanoparticles using cinnamon bark extract and its multifaceted applications. J. Clean. Prod. 2021, 292, 125974. [Google Scholar] [CrossRef]
- Phang, Y.-K.; Aminuzzaman, M.; Akhtaruzzaman; Muhammad, G. ; Ogawa, S.; Watanabe, A.; Tey, L.-H. Green Synthesis and Characterization of CuO Nanoparticles Derived from Papaya Peel Extract for the Photocatalytic Degradation of Palm Oil Mill Effluent (POME). Sustainability 2021, 13, 796. [Google Scholar] [CrossRef]
- Patil, S.P.; Chaudhari, R.Y.; Nemade, M.S. Azadirachta indica leaves mediated green synthesis of metal oxide nanoparticles: A review. Talanta Open 2022, 5, 100083. [Google Scholar] [CrossRef]
- Deveeka Zamare, Vutukuru S. S., Ravindra Babu, Biosynthesis of nanoparticles from agro-waste: A sustainable approach. Int. J. Eng. Appl. Sci. Technol. 2016, 1, 85–92.
- Jayappa, M.D.; Ramaiah, C.K.; Kumar, M.A.P.; Suresh, D.; Prabhu, A.; Devasya, R.P.; Sheikh, S. Green synthesis of zinc oxide nanoparticles from the leaf, stem and in vitro grown callus of Mussaenda frondosa L.: characterization and their applications. Appl. Nanosci. 2020, 10, 3057–3074. [Google Scholar] [CrossRef] [PubMed]
- Pillai, A.M.; Sivasankarapillai, V.S.; Rahdar, A.; Joseph, J.; Sadeghfar, F.; Anuf, A.R.; Rajesh, K.; Kyzas, G.Z. Green synthesis and characterization of zinc oxide nanoparticles with antibacterial and antifungal activity. J. Mol. Struct. 2020, 1211, 128107. [Google Scholar] [CrossRef]
- Shabaani, M.; Rahaiee, S.; Zare, M.; Jafari, S.M. Green synthesis of ZnO nanoparticles using loquat seed extract; Biological functions and photocatalytic degradation properties. LWT 2020, 134, 110133. [Google Scholar] [CrossRef]
- Nasrollahzadeh, M.; Atarod, M.; Sajjadi, M.; Sajadi, S.M.; Issaabadi, Z. Plant-Mediated Green Synthesis of Nanostructures: Mechanisms, Characterization, and Applications. In Electrokinetics in Microfluidics; Elsevier: 2019; Vol. 28, pp. 199–322.
- Hussain, M.; Raja, N.I.; Iqbal, M.; Aslam, S. Applications of Plant Flavonoids in the Green Synthesis of Colloidal Silver Nanoparticles and Impacts on Human Health. Iran. J. Sci. Technol. Trans. A: Sci. 2019, 43, 1381–1392. [Google Scholar] [CrossRef]
- Panda, B.; Lenka, A.; Dixit, P.K.; Dash, S.K. Biosynthesis, Biofunctionalizatio, and bioapplications of manganese nanomaterials: An overview. In Biomaterials-Based Sensors; Kumar, P., Dash, S.K., Ray, S., Parween, S., Eds.; Springer: Singapore, 2023; pp. 73–100. [Google Scholar]
- Peres, T.V.; Schettinger, M.R.C.; Chen, P.; Carvalho, F.; Avila, D.S.; Bowman, A.B.; Aschner, M. “Manganese-induced neurotoxicity: a review of its behavioral consequences and neuroprotective strategies”. BMC Pharmacol. Toxicol. 2016, 17, 1–20. [Google Scholar] [CrossRef]
- Prasad, K.S.; Patra, A. Green synthesis of MnO2 nanorods using Phyllanthus amarusplant extract and their fluorescence studies. Green Process Synth. 2017, 6, 549–554. [Google Scholar]
- Zhang, Y.; Chen, Y.; Wang, T.; Zhou, J.; Zhao, Y. Synthesis and magnetic properties of nanoporous Co3O4 nanoflowers. Microporous Mesoporous Mater. 2008, 114, 257–261. [Google Scholar] [CrossRef]
- Prasad, A.S. Green synthesis of nanocrystalline manganese (II, III) oxide. Mater. Sci. Semicond. Process. 2017, 71, 342–347. [Google Scholar] [CrossRef]
- Hu, H.; Cheng, H.; Liu, Z.; Yu, Y. Facile Synthesis of Carbon Spheres with Uniformly Dispersed MnO Nanoparticles for Lithium Ion Battery Anode. Electrochimica Acta 2014, 152, 44–52. [Google Scholar] [CrossRef]
- Ghosh, D.; Bhandari, S.; Khastgir, D. Synthesis of MnO2 nanoparticles and their effective utilization as UV protectors for outdoor high voltage polymeric insulators used in power transmission lines. Phys. Chem. Chem. Phys. 2016, 18, 32876–32890. [Google Scholar] [CrossRef]
- Wang, S.; Xing, Y.; Xu, H.; Zhang, S. MnO Nanoparticles Interdispersed in 3D Porous Carbon Framework for High Performance Lithium-Ion Batteries. ACS Appl. Mater. Interfaces 2014, 6, 12713–12718. [Google Scholar] [CrossRef] [PubMed]
- Jankovský, O.; Sedmidubský, D.; Šimek, P.; Sofer, Z.; Ulbrich, P.; Bartůněk, V. Synthesis of MnO, Mn2O3 and Mn3O4 nanocrystal clusters by thermal decomposition of manganese glycerolate. Ceram. Int. 2015, 41, 595–601. [Google Scholar] [CrossRef]
- Kim, H.-M.; Saito, N.; Kim, D.-W. Solution Plasma-Assisted Green Synthesis of MnO2Adsorbent and Removal of Cationic Pollutant. J. Chem. 2019, 2019, 1–7. [Google Scholar] [CrossRef]
- Vanitha, P.; Karthikeyan, K.; Thirumoorthi, A. Green Synthesis of Bi3+- Mg2+ layered doubled hydroxides MnO2 nanocomposites supercapacitors. Int. J. Res. Publ. Rev. 2022, 3, 44–50. [Google Scholar]
- Wei, W.; Cui, X.; Chen, W.; Ivey, D.G. Manganese oxide-based materials as electrochemical supercapacitor electrodes. Chem. Soc. Rev. 2010, 40, 1697–1721. [Google Scholar] [CrossRef] [PubMed]
- Nguyen, N.T.H.; Tran, G.T.; Nguyen, N.T.T.; Nguyen, T.T.T.; Nguyen, D.T.C.; Tran, T.V. A critical review on the biosynthesis, properties, applications and future outlook of green MnO2 nanoparticles. Environ. Res. 2023, 231, 116262. [Google Scholar] [CrossRef] [PubMed]
- Wang, Y.; Ding, P.; Wang, C. Fabrication and lithium storage properties of MnO2 hierarchical hollow cubes. J. Alloy. Compd. 2016, 654, 273–279. [Google Scholar] [CrossRef]
- Zhu, Y.; Shen, M.; Xia, Y.; Lu, M. Au/MnO2 nanostructured catalysts and their catalytic performance for the oxidation of 5-(hydroxymethyl)furfural. Catal. Commun. 2015, 64, 37–43. [Google Scholar] [CrossRef]
- Zhang, Q.-X.; Peng, D.; Huang, X.-J. Effect of morphology of α-MnO2 nanocrystals on electrochemical detection of toxic metal ions. Electrochem. Commun. 2013, 34, 270–273. [Google Scholar] [CrossRef]
- Suib, S.L. Porous Manganese Oxide Octahedral Molecular Sieves and Octahedral Layered Materials. Acc. Chem. Res. 2008, 41, 479–487. [Google Scholar] [CrossRef]
- Liu, J.; Meng, L.; Fei, Z.; Dyson, P.J.; Jing, X.; Liu, X. MnO 2 nanosheets as an artificial enzyme to mimic oxidase for rapid and sensitive detection of glutathione. Biosens. Bioelectron. 2017, 90, 69–74. [Google Scholar] [CrossRef]
- Chabre, Y.; Pannetier, J. Structural and electrochemical properties of the proton / γ-MnO2 system. Prog. Solid State Chem. 1995, 23, 1–130. [Google Scholar] [CrossRef]
- Zhang, X.-Y.; Han, L.-Q.; Sun, S.; Wang, C.-Y.; Chen, M.-M. MnO2/C composite electrodes free of conductive enhancer for supercapacitors. J. Alloys Compd. 2015, 653, 539–545. [Google Scholar] [CrossRef]
- Peng, H.; Fan, H.; Sui, J.; Wang, C.; Zhang, W. Sodium in-situ intercalated ultrathin δ-MnO2 flakes electrode with enhanced intercalation capacitive performance for asymmetric supercapacitors. Chem. Select 2020, 5, 869–874. [Google Scholar] [CrossRef]
- Zhao, N.; Fan, H.; Zhang, M.; Wang, C.; Ren, X.; Peng, H.; Li, H.; Jiang, X.; Cao, X. Preparation of partially-cladding NiCo-LDH/Mn3O4 composite by electrodeposition route and its excellent supercapacitor performance. J. Alloys Compd. 2019, 796, 111–119. [Google Scholar] [CrossRef]
- Peng, H.; Fan, H.; Ning, L.; Wang, W.; Sui, J. Templated manganese oxide by pyrolysis route as a promising candidate cathode for asymmetric supercapacitors. J. Electroanal. Chem. 2019, 843, 54–60. [Google Scholar] [CrossRef]
- Hashem, A.M.; Abuzeid, H.M.; Abdel-Latif, A.; Abbas, H.; Ehrenberg, H.; Indris, S.; Mauger, A.; Julien, C.M. MnO2 Nano-Rods Prepared by Redox Reaction as Cathodes in Lithium Batteries. ECS Meet. Abstr. 2012. [Google Scholar] [CrossRef]
- Hashem, A.M.; Abdel-Latif, A.M.; Abuzeid, H.M.; Abbas, H.M.; Ehrenberg, H.; Farag, R.S.; Mauger, A.; Julien, C.M. Improvement of the electrochemical performance of nanosized α-MnO2 used as cathode material for Li-batteries by Sn-doping. J. Alloys Compd. 2011, 509, 9669–9674. [Google Scholar] [CrossRef]
- Peng, H.; Fan, H.; Yang, C.; Tian, Y.; Wang, C.; Sui, J. Ultrathin δ-MnO2 nanoflakes with Na+ intercalation as a high-capacity cathode for aqueous zinc-ion batteries. RSC Adv. 2020, 10, 17702–17712. [Google Scholar] [CrossRef] [PubMed]
- Ida, S.; Thapa, A.K.; Hidaka, Y.; Okamoto, Y.; Matsuka, M.; Hagiwara, H.; Ishihara, T. Manganese oxide with a card-house-like structure reassembled from nanosheets for rechargeable Li-air battery. J. Power Sources 2012, 203, 159–164. [Google Scholar] [CrossRef]
- Thackeray, M.M. Manganese oxides for lithium batteries. Prog. Solid State Chem. 1997, 25, 1–71. [Google Scholar] [CrossRef]
- Feng, Q.; Yanagisawa, K.; Yamasaki, N. Hydrothermal Soft Chemical Process for Synthesis of Manganese Oxides with Tunnel Structures. J. Porous Mater. 1998, 5, 153–162. [Google Scholar] [CrossRef]
- Devaraj, S.; Munichandraiah, N. Effect of Crystallographic Structure of MnO2 on Its Electrochemical Capacitance Properties. J. Phys. Chem. C 2008, 112, 4406–4417. [Google Scholar] [CrossRef]
- Han, R.; Xing, S.; Ma, Z.; Wu, Y.; Gao, Y. Effect of the KMnO4 concentration on the structure and electrochemical behavior of MnO2. J. Mater. Sci. 2012, 47, 3822–3827. [Google Scholar] [CrossRef]
- Lin, H.; Chen, D.; Liu, H.; Zou, X.; Chen, T. Effect of MnO2 Crystalline Structure on the Catalytic Oxidation of Formaldehyde. Aerosol Air Qual. Res. 2017, 17, 1011–1020. [Google Scholar] [CrossRef]
- Julien, C.M.; Mauger, A. Nanostructured MnO2 as Electrode Materials for Energy Storage. Nanomaterials 2017, 7, 396. [Google Scholar] [CrossRef]
- Abuzeid, H.M.; Youddef, A.M.; Yakout, S.M.; Elnahrawy, A.M; Hashem, A.M. Green synthesized α-MnO2 as a photocatalytic reagent for methylene blue and congo red degradation. J. Electron. Mater. 2021, 50, 2171–2181. [Google Scholar] [CrossRef]
- Sukhdev, A.; Challa, M.; Narayani, L.; Manjunatha, A.S.; Deepthi, P.; Angadi, J.V.; Kumar, P.M.; Pasha, M. Synthesis, phase transformation, and morphology of hausmannite Mn3O4 nanoparticles: photocatalytic and antibacterial investigations. Heliyon 2020, 6, e03245. [Google Scholar] [CrossRef] [PubMed]
- Yang, S.; Yang, H.; Ma, H.; Guo, S.; Cao, F.; Gong, J.; Deng, Y. Manganese oxide nanocomposite fabricated by a simple solid-state reaction and its ultraviolet photoresponse property. Chem. Commun. 2011, 47, 2619–2621. [Google Scholar] [CrossRef] [PubMed]
- Souri, M.; Hoseinpour, V.; Ghaemi, N.; Shakeri, A. Procedure optimization for green synthesis of manganese dioxide nanoparticles by Yucca gloriosa leaf extract. Int. Nano Lett. 2018, 9, 73–81. [Google Scholar] [CrossRef]
- Chen, H.-J.; Tian, W.; Ding, W. Effect of preparation methods on morphology of active manganese dioxide and 2,4-dinitrophenol adsorption performance. Adsorpt. Sci. Technol. 2018, 36, 1100–1111. [Google Scholar] [CrossRef]
- Tang, N.; Tian, X.; Yang, C.; Pi, Z.; Han, Q. , Facile synthesis of α-MnO2 nanorods for high-performance alkaline batteries. J. Phys. Chem. Solids 2010, 71, 258–262. [Google Scholar] [CrossRef]
- Qu, Q.; Zhang, P.; Wang, B.; Chen, Y.; Tian, S.; Wu, Y.; Holze, R. Electrochemical Performance of MnO2 Nanorods in Neutral Aqueous Electrolytes as a Cathode for Asymmetric Supercapacitors. J. Phys. Chem. C 2009, 113, 14020–14027. [Google Scholar] [CrossRef]
- Duan, L.; Sun, B.; Wei, M.; Luo, S.; Pan, F.; Xu, A.; Li, X. Catalytic degradation of Acid Orange 7 by manganese oxide octahedral molecular sieves with peroxymonosulfate under visible light irradiation. J. Hazard. Mater. 2015, 285, 356–365. [Google Scholar] [CrossRef] [PubMed]
- Li, W.; Cui, X.; Zeng, R.; Du, G.; Sun, Z.; Zheng, R.; Ringer, S.P.; Dou, S.X. Performance modulation of α-MnO2 nanowires by crystal facet engineering. Sci. Rep. 2015, 5, 8987. [Google Scholar] [CrossRef] [PubMed]
- Yuan, H.; Deng, L.; Qi, Y.; Kobayashi, N.; Hasatani, M. Morphology-dependent Performance of Nanostructured MnO2 as an Oxygen Reduction Catalyst in Microbial Fuel Cells. Int. J. Electrochem. Sci. 2015, 10, 3693–3706. [Google Scholar] [CrossRef]
- Subramanian, V.; Zhu, H.; Vajtai, R.; Ajayan, P.M.; Wei, B. Hydrothermal Synthesis and Pseudocapacitance Properties of MnO2 Nanostructures. J. Phys. Chem. B 2005, 109, 20207–20214. [Google Scholar] [CrossRef] [PubMed]
- Xu, C.; Li, B.; Du, H.; Kang, F.; Zeng, Y. Electrochemical properties of nanosized hydrous manganese dioxide synthesized by a self-reacting microemulsion method. J. Power Sources 2008, 180, 664–670. [Google Scholar] [CrossRef]
- Tang, N.; Tian, X.; Yang, C.; Pi, Z. Facile synthesis of α-MnO2 nanostructures for supercapacitors. Mater. Res. Bull. 2009, 44, 2062–2067. [Google Scholar] [CrossRef]
- Liu, J.-L.; Fan, L.-Z.; Qu, X. Low temperature hydrothermal synthesis of nano-sized manganese oxide for supercapacitors. Electrochimica Acta 2012, 66, 302–305. [Google Scholar] [CrossRef]
- Hu, Z.; Zhu, S.; Huang, H.; Zhang, J.; Xu, Y. Controllable synthesis and characterization of α-MnO2 nanowires. J. Cryst. Growth 2016, 434, 7–12. [Google Scholar] [CrossRef]
- Feng, J.; Zhang, P.; Wang, A.; Zhang, Y.; Dong, W.; Chen, J. One-pot hydrothermal synthesis of uniform β-MnO2 nanorods for nitrite sensing. J. Colloid Interface Sci. 2011, 359, 1–8. [Google Scholar] [CrossRef]
- Ji, Z.H.; Dong, B.; Guo, H.L.; Chai, Y.M.; Li, Y.-P.; Liu, Y.-Q.; Liu, C.-G. A facile hydrothermal synthesis and growth mechanism of novel hollow β-MnO2 polyhedral nanorods. Mater. Chem. Phys. 2012, 136, 831–836. [Google Scholar] [CrossRef]
- Wang, H.; Li, T.; Hashem, A.M.; Abdel-Ghany, A.E.; El-Tawil, R.S.; Abuzeid, H.M.; Coughlin, A.; Chang, K.; Zhang, S.; El-Mounayri, H.; et al. Nanostructured Molybdenum-Oxide Anodes for Lithium-Ion Batteries: An Outstanding Increase in Capacity. Nanomaterials 2021, 12, 13. [Google Scholar] [CrossRef]
- Kanha, P.; Saengkwamsawang, P. Effect of stirring time on morphology and crystalline features of MnO2nanoparticles synthesized by co-precipitation method. Inorg. Nano-Metal Chem. 2017, 47, 1129–1133. [Google Scholar] [CrossRef]
- Cao, M.; Zhuang, Z.; Liu, Y.; Zhang, Z.; Xuan, J.; Zhang, Q.; Wang, W. Peptide-mediated green synthesis of the MnO2@ZIF-8 core–shell nanoparticles for efficient removal of pollutant dyes from wastewater via a synergistic process. J. Colloid Interface Sci. 2021, 608, 2779–2790. [Google Scholar] [CrossRef] [PubMed]
- Jain, N.; Bhargava, A.; Majumdar, S.; Tarafdar, J.C.; Panwar, J. Extracellular biosynthesis and characterization of silver nanoparticles using Aspergillus flavusNJP08: A mechanism perspective. Nanoscale 2010, 3, 635–641. [Google Scholar] [CrossRef] [PubMed]
- Khezeli, T.; Daneshfar, A.; Kardani, F. In-situ functionalization of MnO2 nanoparticles by natural tea polyphenols: A greener sorbent for dispersive solid-phase extraction of parabens from wastewater and cosmetics. Microchem. J. 2023, 190. [Google Scholar] [CrossRef]
- Hoseinpour, V.; Ghaemi, N. Green synthesis of manganese nanoparticles: Applications and future perspective–A review. J. Photochem. Photobiol. B: Biol. 2018, 189, 234–243. [Google Scholar] [CrossRef] [PubMed]
- Nabi, G.; Aain, Q.U.; Khalid, N.R.; Tahir, M.B.; Rafique, M.; Rizwan, M.; Hussain, S.; Iqbal, T.; Majid, A. A Review on Novel Eco-Friendly Green Approach to Synthesis TiO2 Nanoparticles Using Different Extracts. J. Inorg. Organomet. Polym. Mater. 2018, 28, 1552–1564. [Google Scholar] [CrossRef]
- Momeni, S.; Sedaghati, F. CuO/Cu2O nanoparticles: A simple and green synthesis, characterization and their electrocatalytic performance toward formaldehyde oxidation. Microchem. J. 2018, 143, 64–71. [Google Scholar] [CrossRef]
- Khan, A.; Wang, H.; Liu, Y.; Awad, A.; Ifthikar, J.; Liao, Z.; Wang, T.; Chen, Z. Highly efficient α-Mn2O3@α-MnO2-500 nanocomposite for peroxymonosulfate activation: comprehensive investigation of manganese oxides. J. Mater. Chem. A 2018, 6, 1590–1600. [Google Scholar] [CrossRef]
- Patra, T.; Mohanty, A.; Singh, L.; Muduli, S.; Parhi, P.K.; Sahoo, T.R. Effect of calcination temperature on morphology and phase transformation of MnO2 nanoparticles: A step towards green synthesis for reactive dye adsorption. Chemosphere 2021, 288, 132472. [Google Scholar] [CrossRef]
- El Shafey, A.M. Green synthesis of metal and metal oxide nanoparticles from plant leaf extracts and their applications: A review. Green Process. Synth. 2020, 9, 304–339. [Google Scholar] [CrossRef]
- Yardımcı, B.; Kanmaz, N. An effective-green strategy of methylene blue adsorption: Sustainable and low-cost waste cinnamon bark biomass enhanced via MnO2. J. Environ. Chem. Eng. 2023, 11. [Google Scholar] [CrossRef]
- Moodley, J.S.; Krishna, S.B.N.; Pillay, K.; Sershen; Govender, P. Green synthesis of silver nanoparticles from Moringa oleifera leaf extracts and its antimicrobial potential. Adv. Nat. Sci. Nanosci. Nanotechnol. 2018, 9, 015011. [Google Scholar] [CrossRef]
- Teimuri-Mofrad, R.; Hadi, R.; Tahmasebi, B.; Farhoudian, S.; Mehravar, M.; Nasiri, R. Green synthesis of gold nanoparticles using plant extract: Mini-review. Nanochem. Res. 2017, 2, 8–19. [Google Scholar]
- Majani, S.S.; Sathyan, S.; Manoj, M.V.; Vinod, N.; Pradeep, S.; Shivamallu, C.; K. N, V.; Kollur, S.P. Eco-friendly synthesis of MnO2 nanoparticles using Saraca asoca leaf extract and evaluation of in vitro anticancer activity. Curr. Res. Green Sustain. Chem. 2023, 6. [Google Scholar] [CrossRef]
- Khan, T.; Rahman, Q.; Raza, S.; Zehra, S.; Ahmad, N.; Husen, A. Chapter 23, Nanodimensional materials: An approach toward the biogenic synthesis. In Advances in Smart Nanomaterials and their Applications, Micro and Nano Technologies; Elsevier: Amsterdam, The Netherlands, 2023. [Google Scholar]
- Pagar, T.; Ghotekar, S.; Pagar, K.; Pansambal, S.; Oza, R. Phytogenic synthesis of manganese dioxide nanoparticles using plant extracts and their biological application. In Handbook of Greener Synthesis of Nanomaterials and Compounds. Elsevier: Amsterdam, The Netherlands, 2021; chapter 10, pp. 209–218.
- Terefe, A.; Balakrishnan, S. Manganese dioxide nanoparticles green synthesis using lemon and curcumin extracts and evaluation of photocatalytic activity. Mater. Today: Proc. 2022, 62, 434–441. [Google Scholar] [CrossRef]
- Ullah, A.A.; Haque, M.M.; Akter, M.; Hossain, A.; Tamanna, A.N.; Hosen, M.M.; Kibria, A.F.; Khan, M.; Khan, M.A. Green synthesis of Bryophyllum pinnatum aqueous leaf extract mediated bio-molecule capped dilute ferromagnetic α-MnO2 nanoparticles. Mater. Res. Express 2020, 7, 01508208. [Google Scholar] [CrossRef]
- Dewi, N.O.M.; Yulizar, Y. Euphorbia heterophylla L. Leaf Extract-Mediated Synthesis of MnO2 Nanoparticles and Its Characterization. Mater. Today: Proc. 2020, 22, 199–204. [Google Scholar] [CrossRef]
- Manjula, R.; Thenmozhi, M.; Thilagavathi, S.; Srinivasan, R.; Kathirvel, A. Green synthesis and characterization of manganese oxide nanoparticles from Gardenia resinifera leaves. Mater. Today: Proc. 2020, 26, 3559–3563. [Google Scholar] [CrossRef]
- Krishnaraj, C.; Ji, B.-J.; Harper, S.L.; Yun, S.-I. Plant extract-mediated biogenic synthesis of silver, manganese dioxide, silver-doped manganese dioxide nanoparticles and their antibacterial activity against food- and water-borne pathogens. Bioprocess Biosyst. Eng. 2016, 39, 759–772. [Google Scholar] [CrossRef]
- Stegarescu, A.; Lung, I.; Leoștean, C.; Kacso, I.; Opriș, O.; Lazăr, M.D.; Copolovici, L.; Guțoiu, S.; Stan, M.; Popa, A.; et al. Green Synthesis, Characterization and Test of MnO2 Nanoparticles as Catalyst in Biofuel Production from Grape Residue and Seeds Oil. Waste Biomass- Valorization 2019, 11, 5003–5013. [Google Scholar] [CrossRef]
- Dessie, Y.; Tadesse, S.; Eswaramoorthy, R. Physicochemical parameter influences and their optimization on the biosynthesis of MnO2 nanoparticles using Vernonia amygdalina leaf extract. Arab. J. Chem. 2020, 13, 6472–6492. [Google Scholar] [CrossRef]
- Kumar, B.; Smita, K.; Galeas, S.; Sharma, V.; Guerrero, V.H.; Debut, A.; Cumbal, L. Characterization and application of biosynthesized iron oxide nanoparticles using Citrus paradisi peel: A sustainable approach. Inorg. Chem. Commun. 2020, 119. [Google Scholar] [CrossRef]
- Dhanavade; M. J.; Jalkute, C.B.; Jai, S.; Kailash, G.; Sonawane, D. Study antimicrobial activity of lemon (Citrus lemon L.) peel extract. British J. Pharmacol. Toxicol. 2011, 2, 119–122.
- Munakata, R.; Inoue, T.; Koeduka, T.; Sasaki, K.; Tsurumaru, Y.; Sugiyama, A.; Uto, Y.; Hori, H.; Azuma, J.-I.; Yazaki, K. Characterization of Coumarin-Specific Prenyltransferase Activities inCitrus limonPeel. Biosci. Biotechnol. Biochem. 2012, 76, 1389–1393. [Google Scholar] [CrossRef] [PubMed]
- Kamaliroosta, L.; Zolfaghari, M.; Shafiee, S.; Larijani, K.; Zojaji, M. Chemical identifications of citrus peels essential oils. J. Food Biosci. Technol. 2016, 6, 69–76. [Google Scholar]
- Samat, N.A.; Nor, R.M. Sol–gel synthesis of zinc oxide nanoparticles using Citrus aurantifolia extracts. Ceram. Int. 2013, 39, S545–S548. [Google Scholar] [CrossRef]
- Ahmad, M.M.; Salim-ur-Rehman, Z.; Iqbal-Anjum, F.M.; Sultan, J. I. Generic variability to essential oil composition in four citrus fruit species. Pakistan J. Bot. 2006, 38, 319–324. [Google Scholar]
- Housel, L.M.; Wang, L.; Abraham, A.; Huang, J.; Renderos, G.D.; Quilty, C.D.; Brady, A.B.; Marschilok, A.C.; Takeuchi, K.J.; Takeuchi, E.S. Investigation of α-MnO2 tunneled structures as model cation hosts for energy storage. Acc. Chem. Res. 2018, 16, 575–582. [Google Scholar] [CrossRef]
- Vicat, J.; Fanchon, E.; Strobel, P.; Tran-Qui, D. The structure of K1. 33Mn8O16 and cation ordering in hollandite-type structures. Acta Crystallogr. B 1986, 42, 162–167. [Google Scholar]
- Zhang, C.; Feng, C.; Zhang, P.; Guo, Z.; Chen, Z.; Lid, S.; Liu, H. K0. 25Mn2O4 nanofiber microclusters as high power cathode materials for rechargeable lithium batteries. RSC Adv. 2012, 2, 1643–1649. [Google Scholar]
- Tao, G. , Helmer, F. , Poul, N. A comparison study on Raman scattering properties of α- and β-MnO2. Anal. Chim. Acta 2009, 648, 235–239. [Google Scholar]
- Roy, K.; Sarkar, C.K.; Ghosh, C.K. Green synthesis of silver nanoparticles usingfruit extract of malus domistica and study of its antimicrobial activity and biostructures. Digest J. Nanomater. 2014, 9, 1137–1147. [Google Scholar]
- Garcia, M.L.; Pontes, B.; Nishi, E.E.; Ibuki, F.K.; Oliveira, V.; Sawaya, A.C.; Cravalho, P.O.; Nogueira, F.N.; Franco, M.D.; Campos, R.R.; Oyama, L.M.; Bergamaschi, C.T. The antioxidant effects of green tea reduce blood pressure and sympatho excitation in an experimental model of hypertension. J. Hypertens. 2017, 35, 348–354. [Google Scholar] [CrossRef] [PubMed]
- Huyut, Z.; Beydemir, Ş.; Gülçin, I. Antioxidant and Antiradical Properties of Selected Flavonoids and Phenolic Compounds. Biochem. Res. Int. 2017, 2017, 1–10. [Google Scholar] [CrossRef] [PubMed]
- Khan, A.; Wang, H.; Liu, Y.; Jawad, A.; Ifthikar, J.; Liao, Z.; Wang, T.; Chen, Z. Highly efficient α-Mn2O3@α-MnO2-500 nanocomposite for peroxymonosulfate activation: comprehensive investigation of manganese oxides. J. Mater. Chem. A 2018, 6, 1590–1600. [Google Scholar] [CrossRef]
- Gao, T.; Glerup, M.; Krumeich, F.; Nesper, R.; Fjellvåg, H.; Norby, P. Microstructures and Spectroscopic Properties of Cryptomelane-type Manganese Dioxide Nanofibers. J. Phys. Chem. C 2008, 112, 13134–13140. [Google Scholar] [CrossRef]
- Julien, C.; Massot, M.; Poinsignon, C. Lattice vibrations of manganese oxides. Spectrochim. Acta Part A: Mol. Biomol. Spectrosc. 2004, 60, 689–700. [Google Scholar] [CrossRef]
- Julien, C.M.; Mauger, A. , Vijh A., Zaghib K., Lithium Batteries: Science and Technology; Springer: Heidelberg, Germany, 2016; pp. 1–27. [Google Scholar]
- Zhang, N.; Li, L.; Zhao, J.; Yang, T.; Zhang, G.; He, H.; Sun, S. Precisely controlled synthesis of α-/β-MnO2 materials by adding Zn(acac)2 as a phase transformation-inducing agent. Chem. Commun. 2018, 54, 1477–1480. [Google Scholar] [CrossRef]
- Mohan, R.; Paulose, R.; Parihar, V. Hybrid MnO2/CNT nanocomposite sheet with enhanced electrochemical performance via surfactant-free wet chemical route. Ionics 2017, 23, 3245–3248. [Google Scholar] [CrossRef]
- Kochhar, M.; Kochhar, A. Proximate composition, available carbohydrates, dietary fibre and anti-nutritional factors of broccoli (Brassica oleracea L. Var. ItalicaPlenck) leaf and floret powder. Biosci. Discov. 2014, 5, 45–49. [Google Scholar]
- Campas-Baypoli, O.N.; Sánchez-Machado, D.I.; Bueno-Solano, C.; Núñez-Gastélum, J.A.; Reyes-Moreno, C.; López-Cervantes, J. Biochemical composition and physicochemical properties of broccoli flours. Int. J. Food Sci. Nutr. 2009, 60, 163–173. [Google Scholar] [CrossRef]
- Vallejo, F.; Tomás-Barberán, F.; García-Viguera, C. Health-Promoting Compounds in Broccoli as Influenced by Refrigerated Transport and Retail Sale Period. J. Agric. Food Chem. 2003, 51, 3029–3034. [Google Scholar] [CrossRef] [PubMed]
- Hashem, A.M.; Abuzeid, H.M.; Winter, M.; Li, J.; Julien, C.M. Synthesis of high surface area α-KyMnO2 nanoneedles using extract of broccoli as bioactive reducing agent and application in lithium battery. Materials 2020, 13, 1269. [Google Scholar] [CrossRef]
- Barrett, E.P.; Joyner, L.G.; Halenda, P.P. The Determination of Pore Volume and Area Distributions in Porous Substances. I. Computations from Nitrogen Isotherms. J. Am. Chem. Soc. 1951, 73, 373–380. [Google Scholar] [CrossRef]
- Poyraz, A.S.; Kuo, C.-H.; Biswas, S.; King’ondu, C.K.; Suib, S.L. A general approach to crystalline and monomodal pore size mesoporous materials. Nat. Commun. 2013, 4, 2952. [Google Scholar] [CrossRef]
- Li, B.; Rong, G.; Xie, Y.; Huang, L.; Feng, C. Low-temperature synthesis of alpha-MnO2 hollow urchins and their application in rechargeable Li+ batteries. Inorg. Chem. 2006, 45, 6404–6410. [Google Scholar] [CrossRef]
- Li, L.; Nan, C.; Lu, J.; Peng, Q.; Li, Y. α-MnO2 nanotubes: High surface area and enhanced lithium battery properties. Chem. Commun. 2012, 48, 6945–6947. [Google Scholar] [CrossRef]
- Guo, X.; Yang, S.; Wang, D.; Chen, A.; Wang, Y.; Li, P.; Liang, G.; Zhi, C. The energy storage mechanisms of MnO2 in batteries. Curr. Opin. Electrochem. 2021, 30, 100769. [Google Scholar] [CrossRef]
- Yuan, Y.; Nie, A.; Odegard, G.M.; Xu, R.; Zhou, D.; Santhanagopalan, S.; He, K.; Asayesh-Ardakani, H.; Meng, D.D.; Klie, R.F.; Johnson, C.; Lu, J.; Shahbazian-Yassar, R. Asynchronous crystal cell expansion during lithiation of K+ stabilized α-MnO2. Nano Lett. 2015, 15, 2998–3007. [Google Scholar] [CrossRef]
- Yang, Y.; Xiao, L.; Zhao, Y.; Wang, F. Hydrothermal synthesis and electrochemical characterization of α-MnO2 nanorods as cathode material for lithium batteries. Int. J. Electrochem. Sci. 2008, 3, 67–74. [Google Scholar] [CrossRef]
- Guan, H.; Xie, J.; Chen, G.; Wang, Y. Facile synthesis of α-MnO2 nanorods at low temperature and their microwave absorption properties. Mater. Chem. Phys. 2014, 143, 1061–1068. [Google Scholar] [CrossRef]
- Hegazy, A.E.; Ibrahium, M.I. Antioxidant activities of orange peel extracts. World Appl. Sci. J. 2012, 18, 684–688. [Google Scholar]
- Mandalari, G.; Bennett, R.N.; Bisignano, G.; Saija, A.; Dugo, G.; Faulds, C.B.; Waldron, K.W. Characterization of flavonoids and pectin from bergamot (Citrus bergamia Risso) peel, a major byproduct of essential oil extraction. J. Agric. Food Chem. 2006, 54, 197–203. [Google Scholar] [CrossRef] [PubMed]
- Bampidis, V.; Robinson, P. Citrus by-products as ruminant feeds: A review. Anim. Feed. Sci. Technol. 2006, 128, 175–217. [Google Scholar] [CrossRef]
- Olabinjo, O.O.; Ogunlowo, A.S.; Ajayi, O.O.; Olalusi, A.P. Analysis of Physical and Chemical Composition of Sweet Orange (Citrus sinensis) Peels. Int. J. Environ. Agric. Biotechnol. 2017, 2, 2201–2206. [Google Scholar] [CrossRef]
- Skiba, M.I.; Vorobyova, V.I. Synthesis of Silver Nanoparticles Using Orange Peel Extract Prepared by Plasmochemical Extraction Method and Degradation of Methylene Blue under Solar Irradiation. Adv. Mater. Sci. Eng. 2019, 2019, 1–8. [Google Scholar] [CrossRef]
- Toupin, M.; Brousse, T.; Bélanger, D. Charge Storage Mechanism of MnO2 Electrode Used in Aqueous Electrochemical Capacitor. Chem. Mater. 2004, 16, 3184–3190. [Google Scholar] [CrossRef]
- Zhang, F.; Zhang, T.; Yang, X.; Zhang, L.; Leng, K. ; Huang, Y; Chen, Y. A high-performance supercapacitor-battery hybrid energy storage device based on graphene enhanced electrode materials with ultrahigh energy density. Energy Environ. Sci. 2013, 6, 1623. [Google Scholar]
- Xu, J.; Dou, S.; Liu, H.; Dai, L. Cathode materials for next generation lithium ion batteries. Nano Energy 2013, 2, 439–442. [Google Scholar] [CrossRef]
- Lokhande, P.E. Synthesis and characterization of Ni. Co (OH)2 material for supercapacitor application. Int. Adv. Res. J. Sci Eng. Technol. 2015, 2, 10–13. [Google Scholar]
- Wang, X.; Fan, X.; Li, G.; Li, M.; Xiao, X.; Yu, A.; Chen, Z. Composites of MnO2 nanocrystals and partially graphitized hierarchically porous carbon spheres with improved rate capability for high-performance supercapacitors. Carbon 2015, 93, 258–265. [Google Scholar] [CrossRef]
- Tran, T.S.; Tripathi, K.M.; Kim, B.N.; You, I.-K.; Park, B.J.; Han, Y.H.; Kim, T. Y, Three-dimensionally assembled Graphene/α-MnO2 nanowire hybrid hydro gels for high performance supercapacitors. Mater. Res. Bull. 2017, 96, 395–404. [Google Scholar] [CrossRef]
- Hu, Z.; Zu, L.; Jiang, Y.; Lian, H.; Liu, Y.; Li, Z.; Chen, F.; Wang, X.; Cui, X. High specific capacitance of polyaniline/mesoporous manganese dioxide composite using KIH2SO4 electrolyte. Polymers 2015, 7, 1939–1953. [Google Scholar] [CrossRef]
- Hashem, A.; Abuzeid, H.; Abdel-Ghany, A.; Mauger, A.; Zaghib, K.; Julien, C. SnO2–MnO2 composite powders and their electrochemical properties. J. Power Sources 2011, 202, 291–298. [Google Scholar] [CrossRef]
- El-Gendy, D.M.; Ghany, N.A.A.; El Sherbini, E.E.F.; Allam, N.K. Adenine-functionalized Spongy Graphene for Green and High-Performance Supercapacitors. Sci. Rep. 2017, 7, srep43104. [Google Scholar] [CrossRef] [PubMed]
- Premkumar, J.; Sudhakar, T.; Dhakal, A.; Shrestha, J.B.; Krishnakumar, S.; Balashanmugam, P. Synthesis of silver nanoparticles (AgNPs) from cinnamon against bacterial pathogens. Biocatal. Agric. Biotechnol. 2018, 15, 311–316. [Google Scholar] [CrossRef]
- Suresh, D.; Udayabhanu; Kumar, M. P.; Nagabhushana, H.; Sharma, S. Cinnamon supported facile green reduction of graphene oxide, its dye elimination and antioxidant activities. Mater. Lett. 2015, 151, 93–95. [Google Scholar] [CrossRef]
- Jiang, Y.; Yang, Y.; Qiang, L.; Fan, R.; Ning, H.; Li, L.; Ye, T.; Yang, B.; Cao, W. Based on Cu(II) silicotungstate modified photoanode with long electron lifetime and enhanced performance in dye sensitized solar cells. J. Power Sources 2015, 278, 527–533. [Google Scholar] [CrossRef]
- El Nahrawy, A.M.; Moez, A.A.; Saad, A.M. Sol-Gel Preparation and Spectroscopic Properties of Modified Sodium Silicate /Tartrazine Dye Nanocomposite. Silicon 2018, 10, 2117–2122. [Google Scholar] [CrossRef]
- El Nahrawy, A.M.; Mansour, A.-F.M.; Hammad, A.B.A.; Wassel, A.R. Effect of Cu incorporation on morphology and optical band gap properties of nano-porous lithium magneso-silicate (LMS) thin films. Mater. Res. Express 2018, 6, 016404. [Google Scholar] [CrossRef]
- Cestaro, R.; Philippe, L.; Serrà, A.; Gómez, E.; Schmutz, P. Electrodeposited manganese oxides as efficient photocatalyst for the degradation of tetracycline antibiotics pollutant. Chem. Eng. J. 2023, 462. [Google Scholar] [CrossRef]
- Das, M.; Bhattacharyya, K.G. Oxidation of Rhodamine B in aqueous medium in ambient conditions with raw and acid-activated MnO2, NiO, ZnO as catalysts. J. Mol. Catal. A: Chem. 2014, 391, 121–129. [Google Scholar] [CrossRef]
- Fan, K.; Chen, Q.; Zhao, J.; Liu, Y. Preparation of MnO2-Carbon Materials and Their Applications in Photocatalytic Water Treatment. Nanomaterials 2023, 13, 541. [Google Scholar] [CrossRef] [PubMed]
- Moon, S.A.; Salunke, B.K.; Alkotaini, B.; Sathiyamoorthi, E.; Kim, B.S. Biological synthesis of manganese dioxide nanoparticles by Kalopanax pictus plant extract. IET Nanobiotechnology 2015, 9, 220–225. [Google Scholar] [CrossRef]
- K, V.; G, P.; S, M.; G, R.; S, S. Echinochloa frumentacea grains extract mediated synthesis and characterization of iron oxide nanoparticles: A greener nano drug for potential biomedical applications. J. Drug Deliv. Sci. Technol. 2022, 76. [Google Scholar] [CrossRef]
- Mirza, A.U.; Kareem, A.; Nami, S.A.; Khan, M.S.; Rehman, S.; Bhat, S.A.; Mohammad, A.; Nishat, N. Biogenic synthesis of iron oxide nanoparticles using Agrewia optiva and Prunus persica phyto species: Characterization, antibacterial and antioxidant activity. J. Photochem. Photobiol. B: Biol. 2018, 185, 262–274. [Google Scholar] [CrossRef]
- Salgado, P.; Márquez, K.; Rubilar, O.; Contreras, D.; Vidal, G. The effect of phenolic compounds on the green synthesis of iron nanoparticles (FexOy-NPs) with photocatalytic activity. Appl. Nanosci. 2019, 9, 371–385. [Google Scholar] [CrossRef]
- Murgueitio, E.; Debut, A.; Landivar, J.; Cumbal, L. Synthesis of iron nanoparticles through extracts of native fruits of Ecuador, as capuli (Prunus serotina) and mortiño (Vaccinium floribundum). Biol. Med. 2016, 8, 8–10. [Google Scholar] [CrossRef]
- Selvaraj, R.; Pai, S.; Vinayagam, R.; Varadavenkatesan, T.; Kumar, P.S.; Duc, P.A.; Rangasamy, G. A recent update on green synthesized iron and iron oxide nanoparticles for environmental applications. Chemosphere 2022, 308, 136331. [Google Scholar] [CrossRef] [PubMed]
- Ramalingam, V.; Dhinesh, P.; Sundaramahalingam, S.; Rajaram, R. Green fabrication of iron oxide nanoparticles using grey mangrove Avicennia marina for antibiofilm activity and in vitro toxicity. Surfaces Interfaces 2019, 15, 70–77. [Google Scholar] [CrossRef]
- Latha, N.; Gowri, M. Bio synthesis and characterization of Fe3O4 nanoparticles using Caricaya papaya leaves extract. Int. J. Sci. Res. 2014, 3, 1551–1556. [Google Scholar]
- Ahmed, M.B.; Zhou, J.L.; Ngo, H.H.; Guo, W.; Chen, M. Progress in the preparation and application of modified biochar for improved contaminant removal from water and wastewater. Bioresour. Technol. 2016, 214, 836–851. [Google Scholar] [CrossRef]
- Panahi, A.; Levendis, Y.A.; Vorobiev, N.; Schiemann, M. Direct observations on the combustion characteristics of Miscanthus and Beechwood biomass including fusion and spherodization. Fuel Process. Technol. 2017, 166, 41–49. [Google Scholar] [CrossRef]
- Her, S.; Jaffray, D.A.; Allen, C. Gold nanoparticles for applications in cancer radiotherapy: Mechanisms and recent advancements. Adv. Drug Deliv. Rev. 2017, 109, 84–101. [Google Scholar] [CrossRef]
- Khan, I.U.; Sajid, S.; Javed, A.; Sajid, S.; Shah, S.U.; Khan, S.N.; Ullah, K. COMPARATIVE DIAGNOSIS OF TYPHOID FEVER BY POLYMERASE CHAIN REACTION AND WIDAL TEST IN SOUTHERN DISTRICTS (BANNU, LAKKI MARWAT AND D.I.KHAN) OF KHYBER PAKHTUNKHWA, PAKISTAN. Acta Sci. Malays. 2017, 1, 12–15. [Google Scholar] [CrossRef]
- Ashique, S.; Upadhyay, A.; Hussain, A.; Bag, S.; Chaterjee, D.; Rihan, M.; Mishra, N.; Bhatt, S.; Puri, V.; Sharma, A.; et al. Green biogenic silver nanoparticles, therapeutic uses, recent advances, risk assessment, challenges, and future perspectives. J. Drug Deliv. Sci. Technol. 2022, 77. [Google Scholar] [CrossRef]
- Vadlapudi, V.; Kaladhar, D. Review: green synthesis of silver and gold nanoparticles. Middle East J. Sci. Res. 2014, 19, 834–842. [Google Scholar]
- Rizki, I.N.; Klaypradit, W. ; Patmawati Utilization of marine organisms for the green synthesis of silver and gold nanoparticles and their applications: A review. Sustain. Chem. Pharm. 2023, 31. [Google Scholar] [CrossRef]
- Alghoraibia, I.; Soukkarieh, C.; Zein, R.; Alahmad, A.; Walter, J.-G.; Daghestani, M. Withdrawn: Aqueous Extract of Eucalyptus Camaldulensis Leaves as a Reducing and Capping Agent in Green Synthesis of Silver Nanoparticles. Curr. Nanomater. 2019, 04, 1–1. [Google Scholar] [CrossRef]
- Goodarzi, V.; Zamani, H.; Bajuli, L.; Moradshahi, A. Evaluation of antioxidant potential and reduction capacity of some plant extracts in silver nanoparticles' synthesis. . 2014, 3, 165–174. [Google Scholar] [PubMed]
- Gopinath, V.; MubarakAli, D.; Priyadarshini, S.; Priyadharsshini, N.M.; Thajuddin, N.; Velusamy, P. Biosynthesis of silver nanoparticles from Tribulus terrestris and its antimicrobial activity: A novel biological approach. Colloids Surfaces B: Biointerfaces 2012, 96, 69–74. [Google Scholar] [CrossRef] [PubMed]
- Mehata, M.S. Green route synthesis of silver nanoparticles using plants/ginger extracts with enhanced surface plasmon resonance and degradation of textile dye. Mater. Sci. Eng. B 2021, 273, 115418. [Google Scholar] [CrossRef]
- Alaqad, K.; A Saleh, T. Gold and Silver Nanoparticles: Synthesis Methods, Characterization Routes and Applications towards Drugs. J. Environ. Anal. Toxicol. 2016, 6. [Google Scholar] [CrossRef]
- Abdellatif, A.A.H.; Mahmood, A.; Alsharidah, M.; Mohammed, H.A.; Alenize, S.K.; Bouazzaoui, A.; Al Rugaie, O.; Alnuqaydan, A.M.; Ahmad, R.; Vaali-Mohammad, M.-A.; et al. Bioactivities of the Green Synthesized Silver Nanoparticles Reduced Using Allium cepa L Aqueous Extracts Induced Apoptosis in Colorectal Cancer Cell Lines. J. Nanomater. 2022, 2022, 1–13. [Google Scholar] [CrossRef]
- Gomathi, A.; Rajarathinam, S.X.; Sadiq, A.M.; Rajeshkumar, S. Anticancer activity of silver nanoparticles synthesized using aqueous fruit shell extract of Tamarindus indica on MCF-7 human breast cancer cell line. J. Drug Deliv. Sci. Technol. 2019, 55, 101376. [Google Scholar] [CrossRef]
- Alharbi, N.S.; Alsubhi, N.S. Green synthesis and anticancer activity of silver nanoparticles prepared using fruit extract of Azadirachta indica. J. Radiat. Res. Appl. Sci. 2022, 15, 335–345. [Google Scholar] [CrossRef]
- Yao, J.; Yasin, S. Biosynthesis of Silver Nanoparticles by Bamboo Leaves Extract and Their Antimicrobial Activity. J. Fiber Bioeng. Informatics 2013, 6, 77–84. [Google Scholar] [CrossRef]
- Mousavi, S.M.; Hashemi, S.A.; Ghasemi, Y.; Atapour, A.; Amani, A.M.; Savar Dashtaki, A.; Babapoor, A.; Arjmand, O. Green synthesis of silver nanoparticles toward bio and medical applications: review study. Artif. Cells Nanomed. Biotechnol. 2018, 46, S855–S872. [Google Scholar] [CrossRef]
- Luceri, A.; Francese, R.; Lembo, D.; Ferraris, M.; Balagna, C. Silver Nanoparticles: Review of Antiviral Properties, Mechanism of Action and Applications. Microorganisms 2023, 11, 629. [Google Scholar] [CrossRef]
- Gadhave, R.V.; Vineeth, S.K.; Gadekar, P.T. Polymers and Polymeric Materials in COVID-19 Pandemic: A Review. Open J. Polym. Chem. 2020, 10, 66–75. [Google Scholar] [CrossRef]
- Swathy, J.R.; Sankar, M.U.; Chaudhary, A.; Aigal, S.; Anshup; Pradeep, T. Antimicrobial silver: An unprecedented anion effect. Sci. Rep. 2014, 4, 7161. [Google Scholar] [CrossRef] [PubMed]
- Kim, J.; Yeom, M.; Lee, T.; Kim, H.-O.; Na, W.; Kang, A.; Lim, J.-W.; Park, G.; Park, C.; Song, D.; et al. Porous gold nanoparticles for attenuating infectivity of influenza A virus. J. Nanobiotechnology 2020, 18, 1–11. [Google Scholar] [CrossRef]
- Lu, L.; Sun, R.W.-Y.; Chen, R.; Hui, C.-K.; Ho, C.-M.; Luk, J.M.; Lau, G.K.K.; Che, C.-M. Silver nanoparticles inhibit hepatitis B virus replication. Antivir. Ther. 2008, 13, 253–262. [Google Scholar] [CrossRef]
- Galdiero, S.; Falanga, A.; Vitiello, M.; Cantisani, M.; Marra, V.; Galdiero, M. Silver Nanoparticles as Potential Antiviral Agents. Molecules 2011, 16, 8894–8918. [Google Scholar] [CrossRef]
- Jeremiah, S.S.; Miyakawa, K.; Morita, T.; Yamaoka, Y.; Ryo, A. Potent antiviral effect of silver nanoparticles on SARS-CoV-2. Biochem. Biophys. Res. Commun. 2020, 533, 195–200. [Google Scholar] [CrossRef]
- Nadaf, S.J.; Jadhav, N.R.; Naikwadi, H.S.; Savekar, P.L.; Sapkal, I.D.; Kambli, M.M.; Desai, I.A. Green synthesis of gold and silver nanoparticles: Updates on research, patents, and future prospects. OpenNano 2022, 8. [Google Scholar] [CrossRef]
- Yafout, M.; Ousaid, A.; Khayati, Y.; El Otmani, I.S. Gold nanoparticles as a drug delivery system for standard chemotherapeutics: A new lead for targeted pharmacological cancer treatments. Sci. Afr. 2021, 11, e00685. [Google Scholar] [CrossRef]
- Amina, S.J.; Guo, B. A Review on the Synthesis and Functionalization of Gold Nanoparticles as a Drug Delivery Vehicle. Int. J. Nanomed. 2020, ume 15, 9823–9857. [Google Scholar] [CrossRef]
- Jannathul, F.M.; Lalitha, P. , Biogenic green synthesis of gold nanoparticles and their applications – A review of promising properties. Inorg. Chem. Commun. 2022, 143, 109800. [Google Scholar] [CrossRef]
- Wei, M.-Y.; Famouri, L.; Carroll, L.; Lee, Y.; Famouri, P. Rapid and efficient sonochemical formation of gold nanoparticles under ambient conditions using functional alkoxysilane. Ultrason. Sonochemistry 2013, 20, 610–617. [Google Scholar] [CrossRef]
- Yun, G.; Hassan, Z.; Lee, J.; Kim, J.; Lee, N.-S.; Kim, N.H.; Baek, K.; Hwang, I.; Park, C.G.; Kim, K. ; Highly stable, water-dispersible metal-nanoparticle-decorated polymer nanocapsules and their catalytic applications. Angew. Chem. Int. Ed. 2014, 53, 6414–6418. [Google Scholar] [CrossRef]
- Vala, A.K. Exploration on green synthesis of gold nanoparticles by a marine-derived fungus Aspergillus sydowii. Environ. Prog. Sustain. Energy 2014, 34, 194–197. [Google Scholar] [CrossRef]
- Yue, H.-L.; Hu, Y.-J.; Chen, J.; Bai, A.-M.; Ouyang, Y. Green synthesis and physical characterization of Au nanoparticles and their interaction with bovine serum albumin. Colloids Surfaces B: Biointerfaces 2014, 122, 107–114. [Google Scholar] [CrossRef]
- Lee, K.X.; Shameli, K.; Yew, Y.P.; Teow, S.-Y.; Jahangirian, H.; Rafiee-Moghaddam, R.; Webster, T.J. Recent Developments in the Facile Bio-Synthesis of Gold Nanoparticles (AuNPs) and Their Biomedical Applications. Int. J. Nanomed. 2020, 15, 275–300. [Google Scholar] [CrossRef]
- Al Saqr, A.; Khafagy, E.-S.; Alalaiwe, A.; Aldawsari, M.F.; Alshahrani, S.M.; Anwer, K.; Khan, S.; Abu Lila, A.S.; Arab, H.H.; Hegazy, W.A.H. Synthesis of Gold Nanoparticles by Using Green Machinery: Characterization and In Vitro Toxicity. Nanomaterials 2021, 11, 808. [Google Scholar] [CrossRef]
- Arshad, R.; Barani, M.; Rahdar, A.; Sargazi, S.; Cucchiarini, M.; Pandey, S.; Kang, M. Multi-Functionalized Nanomaterials and Nanoparticles for Diagnosis and Treatment of Retinoblastoma. Biosensors 2021, 11, 97. [Google Scholar] [CrossRef]
- Kajani, A.A.; Bordbar, A.-K.; Esfahani, S.H.Z.; Razmjou, A. Gold nanoparticles as potent anticancer agent: green synthesis, characterization, and in vitro study. RSC Adv. 2016, 6, 63973–63983. [Google Scholar] [CrossRef]
- Sharma, N.; Bhatt, G.; Kothiyal, P. Gold Nanoparticles synthesis, properties, and forthcoming applications: A review. Indian J. Pharm. Biol. Res. 2015, 3, 13–27. [Google Scholar] [CrossRef]
- Bharadwaj, K.K.; Rabha, B.; Pati, S.; Sarkar, T.; Choudhury, B.K.; Barman, A.; Bhattacharjya, D.; Srivastava, A.; Baishya, D.; Edinur, H.A.; et al. Green Synthesis of Gold Nanoparticles Using Plant Extracts as Beneficial Prospect for Cancer Theranostics. Molecules 2021, 26, 6389. [Google Scholar] [CrossRef]
- Hassanisaadi, M.; Bonjar, G.H.S.; Rahdar, A.; Pandey, S.; Hosseinipour, A.; Abdolshahi, R. Environmentally Safe Biosynthesis of Gold Nanoparticles Using Plant Water Extracts. Nanomaterials 2021, 11, 2033. [Google Scholar] [CrossRef]
- Li, S.; Shen, Y.; Xie, A.; Yu, X.; Qiu, L.; Zhang, L.; Zhang, Q. Green synthesis of silver nanoparticles using Capsicum annuum L. extract. Green Chem. 2007, 9, 852–858. [Google Scholar] [CrossRef]
- Dauthal, P.; Mukhopadhyay, M. Noble Metal Nanoparticles: Plant-Mediated Synthesis, Mechanistic Aspects of Synthesis, and Applications. Ind. Eng. Chem. Res. 2016, 55, 9557–9577. [Google Scholar] [CrossRef]
- Mittal, A.K.; Chisti, Y.; Banerjee, U.C. Synthesis of metallic nanoparticles using plant extracts. Biotechnol. Adv. 2013, 31, 346–356. [Google Scholar] [CrossRef]
- Kim, H.-S.; Seo, Y.S.; Kim, K.; Han, J.W.; Park, Y.; Cho, S. Concentration Effect of Reducing Agents on Green Synthesis of Gold Nanoparticles: Size, Morphology, and Growth Mechanism. Nanoscale Res. Lett. 2016, 11, 1–9. [Google Scholar] [CrossRef]
- Suhag, R.; Kumar, R.; Dhiman, A.; Sharma, A.; Prabhakar, P.K.; Gopalakrishnan, K. Fruit peel bioactives, valorization into nanoparticles and potential applications: A review. Crit. Rev. Food Sci. Nutr. 2022, 63, 6757–6776. [Google Scholar] [CrossRef]
- Patel, M.; Siddiqi, N.J.; Sharma, P.; Alhomida, A.S.; Khan, H.A. Reproductive Toxicity of Pomegranate Peel Extract Synthesized Gold Nanoparticles: A Multigeneration Study in C. elegans. J. Nanomater. 2019, 2019, 1–7. [Google Scholar] [CrossRef]
- Mishra, A.N.; Bhadauria, S.; Gaur, M.S.; Pasricha, R.; Kushwah, B.S. Synthesis of Gold Nanoparticles by Leaves of Zero-Calorie Sweetener Herb (Stevia rebaudiana) and Their Nanoscopic Characterization by Spectroscopy and Microscopy. Int. J. Green Nanotechnology: Phys. Chem. 2010, 1, P118–P124. [Google Scholar] [CrossRef]
- Kumar, V.G.; Gokavarapu, S.D.; Rajeswari, A.; Dhas, T.S.; Karthick, V.; Kapadia, Z.; Shrestha, T.; Barathy, I.A.; Roy, A.; Sinha, S. Facile green synthesis of gold nanoparticles using leaf extract of antidiabetic potent Cassia auriculata. Colloids Surf. B Biointerfaces 2011, 87, 159–163. [Google Scholar] [CrossRef]
- Chanda, N.; Shukla, R.; Zambre, A.; Mekapothula, S.; Kulkarni, R.R.; Katti, K.; Bhattacharyya, K.; Fent, G.M.; Casteel, S.W.; Boote, E.J.; et al. An Effective Strategy for the Synthesis of Biocompatible Gold Nanoparticles Using Cinnamon Phytochemicals for Phantom CT Imaging and Photoacoustic Detection of Cancerous Cells. Pharm. Res. 2010, 28, 279–291. [Google Scholar] [CrossRef]
- Shankar, S.S.; Ahmad, A.; Pasricha, R.; Sastry, M. Bioreduction of chloroaurate ions by geranium leaves and its endophytic fungus yields gold nanoparticles of different shapes. J. Mater. Chem. 2003, 13, 1822–1826. [Google Scholar] [CrossRef]
- Chums-Ard, W.; Fawcett, D.; Fung, C.C.; Poinern, G.E.J. Biogenic synthesis of gold nanoparticles from waste watermelon and their antibacterial activity against Escherichia coli and Staphylococcus epidermidis. Int. J. Res. Med Sci. 2019, 7, 2499–2505. [Google Scholar] [CrossRef]
- Barabadi, H.; Ovais, M.; Shinwari, Z.K.; Saravanan, M. Anti-cancer green bionanomaterials: present status and future prospects. Green Chem. Lett. Rev. 2017, 10, 285–314. [Google Scholar] [CrossRef]
- Zeh, G. Oligo-aminoferrocenes for cancer treatment, PhD dissertation, Friedrich-Alexander-Universität Erlangen-Nürnberg (FAU): Erlangen, Germany, 2020; pp. 1–292.
- Xie, Y.-H.; Chen, Y.-X.; Fang, J.-Y. , Comprehensive review of targeted therapy for colorectal cancer. Signal Transduct. Target. Ther. 2020, 5, 22. [Google Scholar] [CrossRef]
- Chugh, H.; Sood, D.; Chandra, I.; Tomar, V.; Dhawan, G.; Chandra, R. Role of gold and silver nanoparticles in cancer nano-medicine. Artif. Cells Nanomed. Biotechnol. 2018, 46, 1210–1220. [Google Scholar] [CrossRef]
- Mauro, N.; Scialabba, C.; Agnello, S.; Cavallaro, G.; Giammona, G. Folic acid-futionalized graphene oxide nanosheets via plasma etching as a platform to combine NIR anticancer phototherapy and targeted drug delivery. Mater. Sci. Eng. C 2020, 107, 110201. [Google Scholar] [CrossRef]
- Shi, W. Application of Multifunctional Nanomaterials Combined with Sports Rehabilitation Training in the Diagnosis and Treatment of Cardiovascular Diseases. Integr. Ferroelectr. 2021, 216, 81–93. [Google Scholar] [CrossRef]
- Zhao, Q.; Lin, Y.; Han, N.; Li, X.; Geng, H.; Wang, X.; Cui, Y.; Wang, S. Mesoporous carbon nanomaterials in drug delivery and biomedical application. Drug Deliv. 2017, 24, 94–107. [Google Scholar] [CrossRef]
- Vinay, S.P. ; Udayabhanu; Sumedha, H. N.; Shashank, M.; Nagaraju, G.; Chandrasekhar, N. In-vitro antibacterial, antioxidant and cytotoxic potential of gold nanoparticles synthesized using novel Elaeocarpus ganitrus seeds extract. J. Sci.: Adv. Mater. Devices 2021, 6, 127–133. [Google Scholar]
- Thambiraj, S.; Hema, S.; Shankaran, D.R. Functionalized gold nanoparticles for drug delivery applications. Mater. Today: Proc. 2018, 5, 16763–16773. [Google Scholar] [CrossRef]
- Rónavári, A.; Igaz, N.; Adamecz, D.I.; Szerencsés, B.; Molnar, C.; Kónya, Z.; Pfeiffer, I.; Kiricsi, M. Green Silver and Gold Nanoparticles: Biological Synthesis Approaches and Potentials for Biomedical Applications. Molecules 2021, 26, 844. [Google Scholar] [CrossRef]
- Ismail, E.H.; Saqer, A.M.A.; Assirey, E.; Naqvi, A.; Okasha, R.M. Successful Green Synthesis of Gold Nanoparticles using a Corchorus olitorius Extract and Their Antiproliferative Effect in Cancer Cells. Int. J. Mol. Sci. 2018, 19, 2612. [Google Scholar] [CrossRef]
- Fazal, S.; Jayasree, A.; Sasidharan, S.; Koyakutty, M.; Nair, S.V.; Menon, D. Green Synthesis of Anisotropic Gold Nanoparticles for Photothermal Therapy of Cancer. ACS Appl. Mater. Interfaces 2014, 6, 8080–8089. [Google Scholar] [CrossRef]
- Patra, N.; Dehury, N.; Pal, A.; Behera, A.; Patra, S. Preparation and mechanistic aspect of natural xanthone functionalized gold nanoparticle. Mater. Sci. Eng. C 2018, 90, 439–445. [Google Scholar] [CrossRef]
- Siddique, S.; Chow, J.C.L. Gold Nanoparticles for Drug Delivery and Cancer Therapy. Appl. Sci. 2020, 10, 3824. [Google Scholar] [CrossRef]
- Yap, K.M.; Sekar, M.; Fuloria, S.; Wu, Y.S.; Gan, S.H.; Rani, N.N.I.M.; Subramaniyan, V.; Kokare, C.; Lum, P.T.; Begum, M.Y.; et al. Drug Delivery of Natural Products Through Nanocarriers for Effective Breast Cancer Therapy: A Comprehensive Review of Literature. Int. J. Nanomed. 2021, ume 16, 7891–7941. [Google Scholar] [CrossRef]
- Jain, N.; Jain, P.; Rajput, D.; Patil, U.K. Green synthesized plant-based silver nanoparticles: therapeutic prospective for anticancer and antiviral activity. Micro Nano Syst. Lett. 2021, 9, 1–24. [Google Scholar] [CrossRef]
- Bloise, N.; Strada, S.; Dacarro, G.; Visai, L. Gold Nanoparticles Contact with Cancer Cell: A Brief Update. Int. J. Mol. Sci. 2022, 23, 7683. [Google Scholar] [CrossRef]
- Vinay, S.; Udayabhanu; Sumedha, H. ; Shashank, M.; Nagaraju, G.; Chandrasekhar, N. In-vitro antibacterial, antioxidant and cytotoxic potential of gold nanoparticles synthesized using novel Elaeocarpus ganitrus seeds extract. J. Sci. Adv. Mater. Devices 2020, 6, 127–133. [Google Scholar] [CrossRef]
- Sargazi, S.; Laraib, U.; Er, S.; Rahdar, A.; Hassanisaadi, M.; Zafar, M.N.; Díez-Pascual, A.M.; Bilal, M. Application of Green Gold Nanoparticles in Cancer Therapy and Diagnosis. Nanomaterials 2022, 12, 1102. [Google Scholar] [CrossRef]
- Hoshyar, R.; Khayati, G.R.; Poorgholami, M.; Kaykhaii, M. A novel green one-step synthesis of gold nanoparticles using crocin and their anti-cancer activities. J. Photochem. Photobiol. B: Biol. 2016, 159, 237–242. [Google Scholar] [CrossRef] [PubMed]
- Vinayagam, R.; Santhoshkumar, M.; Lee, K.E.; David, E.; Kang, S.G. Bioengineered gold nanoparticles using Cynodon dactylon extract and its cytotoxicity and antibacterial activities. Bioprocess Biosyst. Eng. 2021, 44, 1253–1262. [Google Scholar] [CrossRef] [PubMed]
- Divakaran, D.; Lakkakula, J.R.; Thakur, M.; Kumawat, M.K.; Srivastava, R. Dragon fruit extract capped gold nanoparticles: Synthesis and their differential cytotoxicity effect on breast cancer cells. Mater. Lett. 2019, 236, 498–502. [Google Scholar] [CrossRef]
Figure 1.
Different synthesis approaches available for the preparation of metal nanoparticles. Reproduced with permission from [26]. Copyright under the Creative Commons Attribution License.
Figure 1.
Different synthesis approaches available for the preparation of metal nanoparticles. Reproduced with permission from [26]. Copyright under the Creative Commons Attribution License.
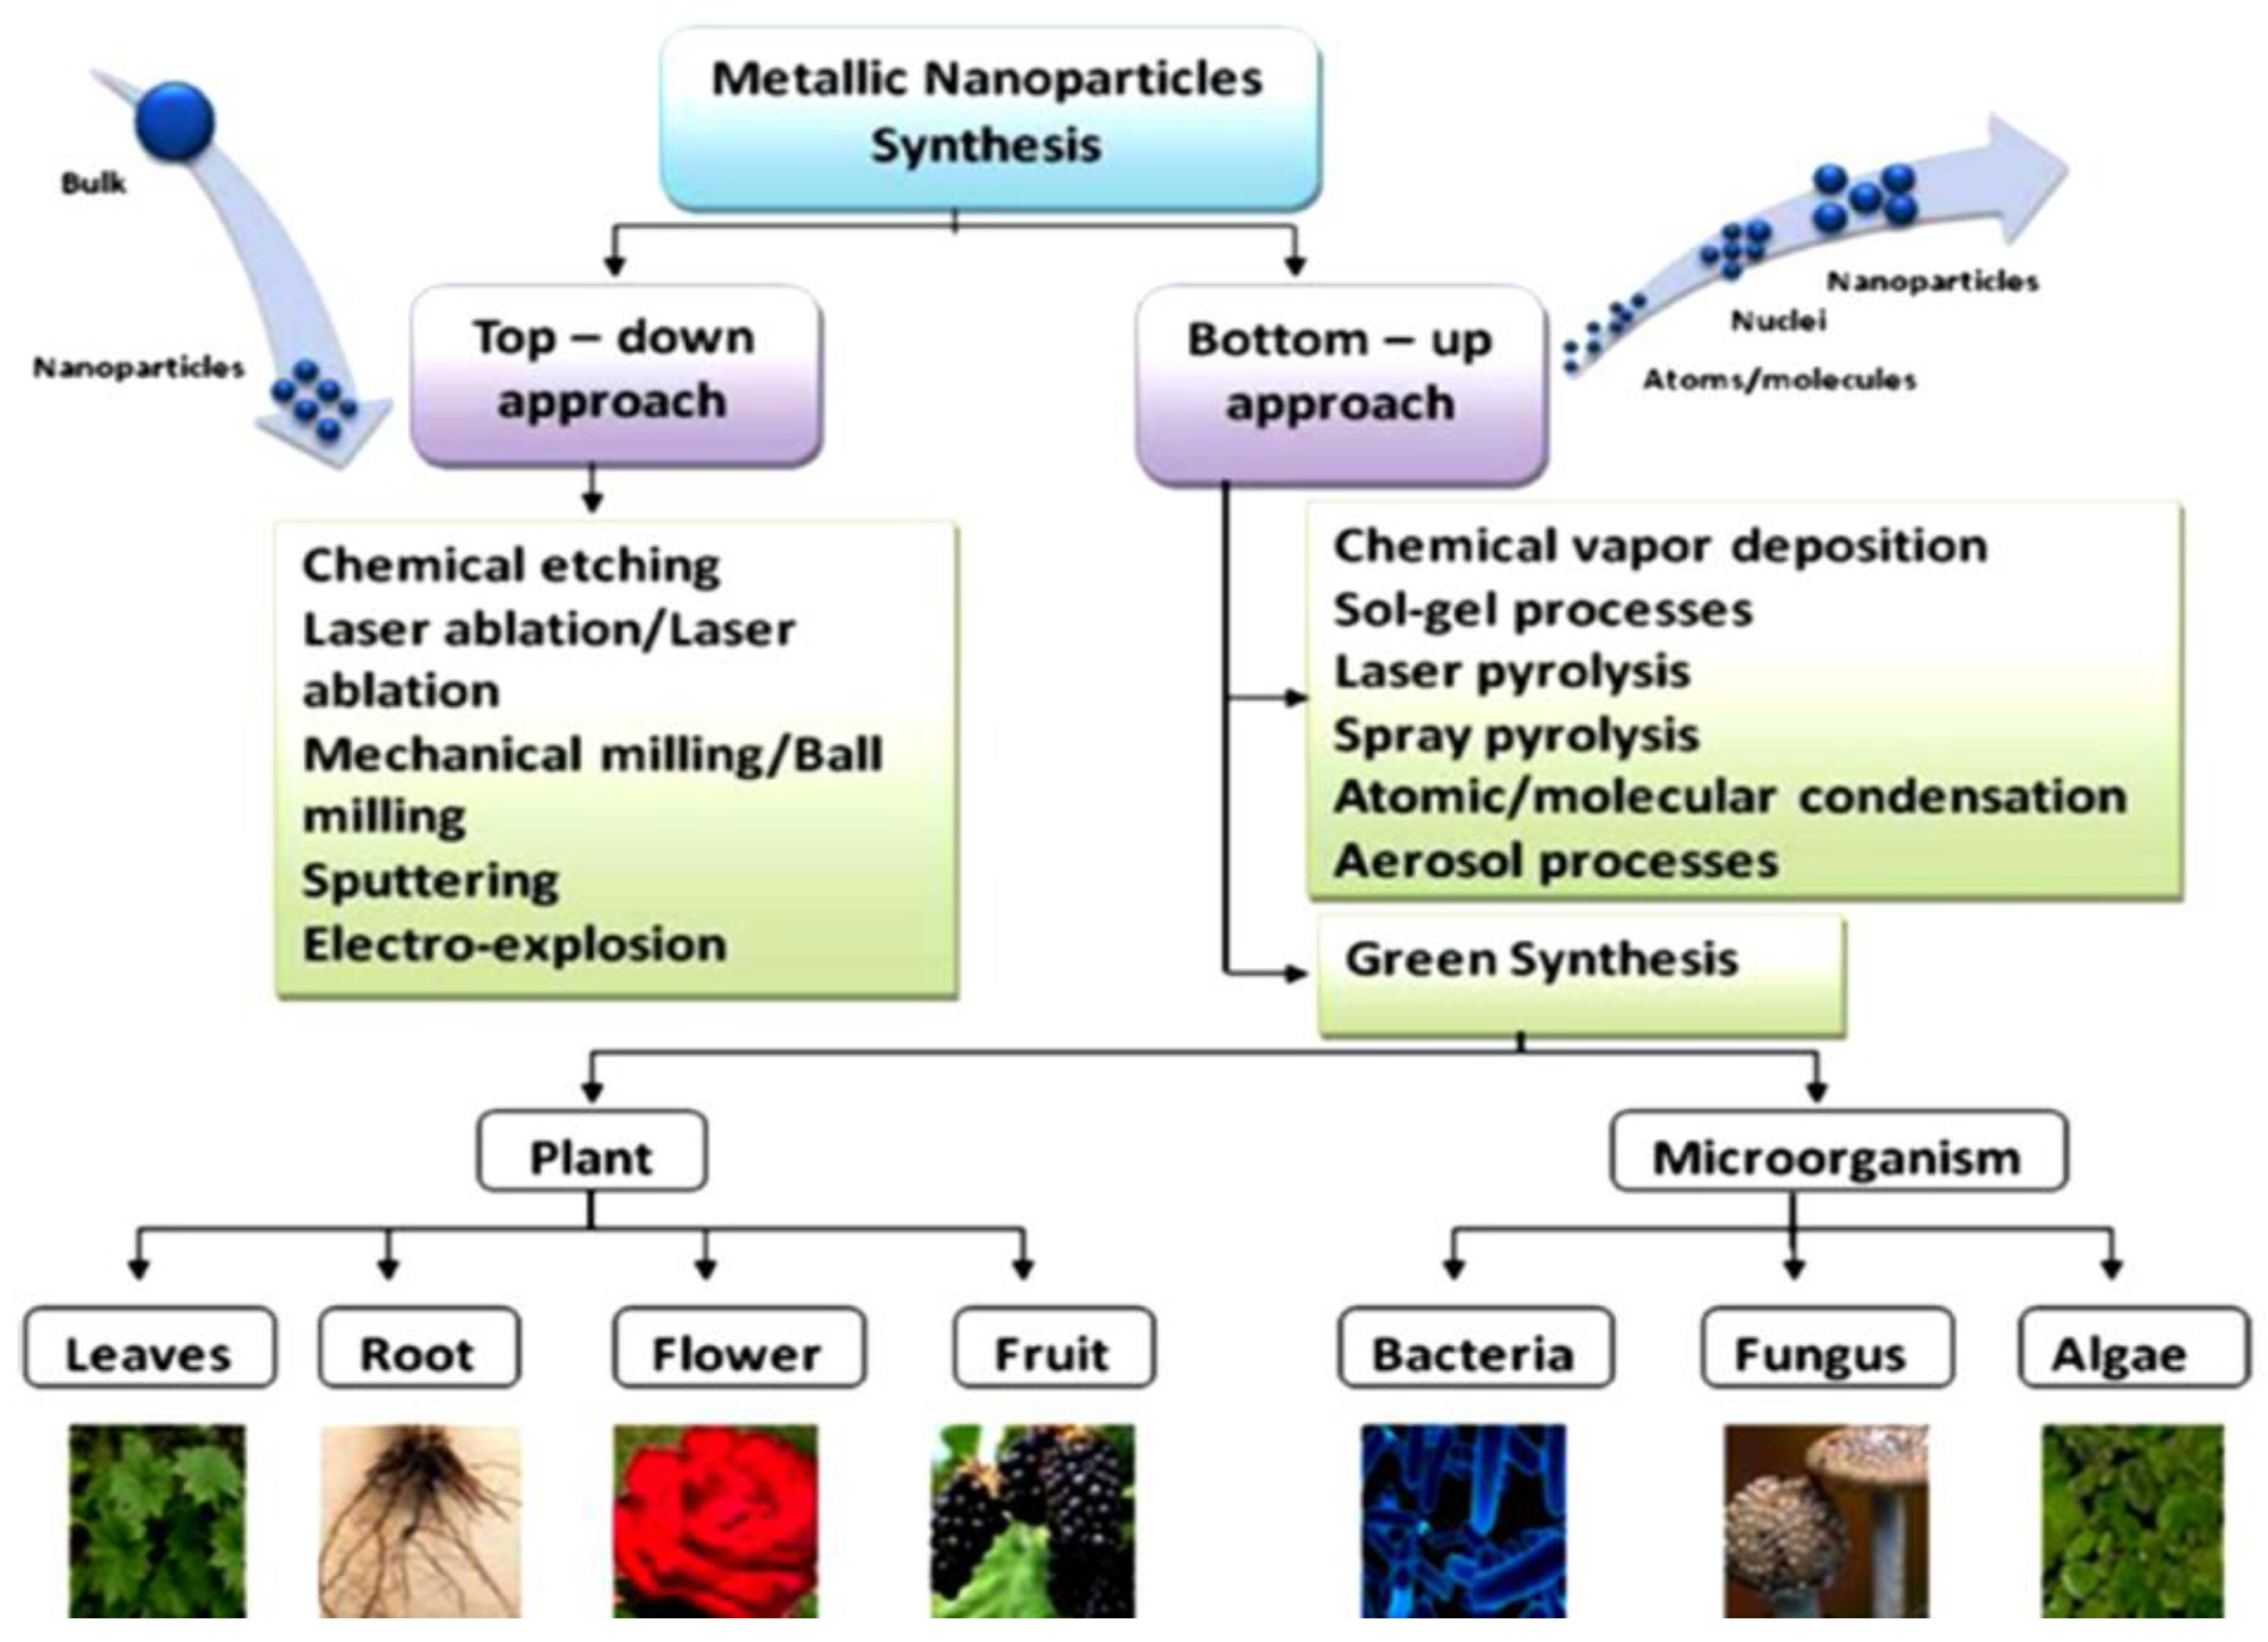
Figure 2.
Exemplification of green chemistry combination in metal nanomaterials preparation.
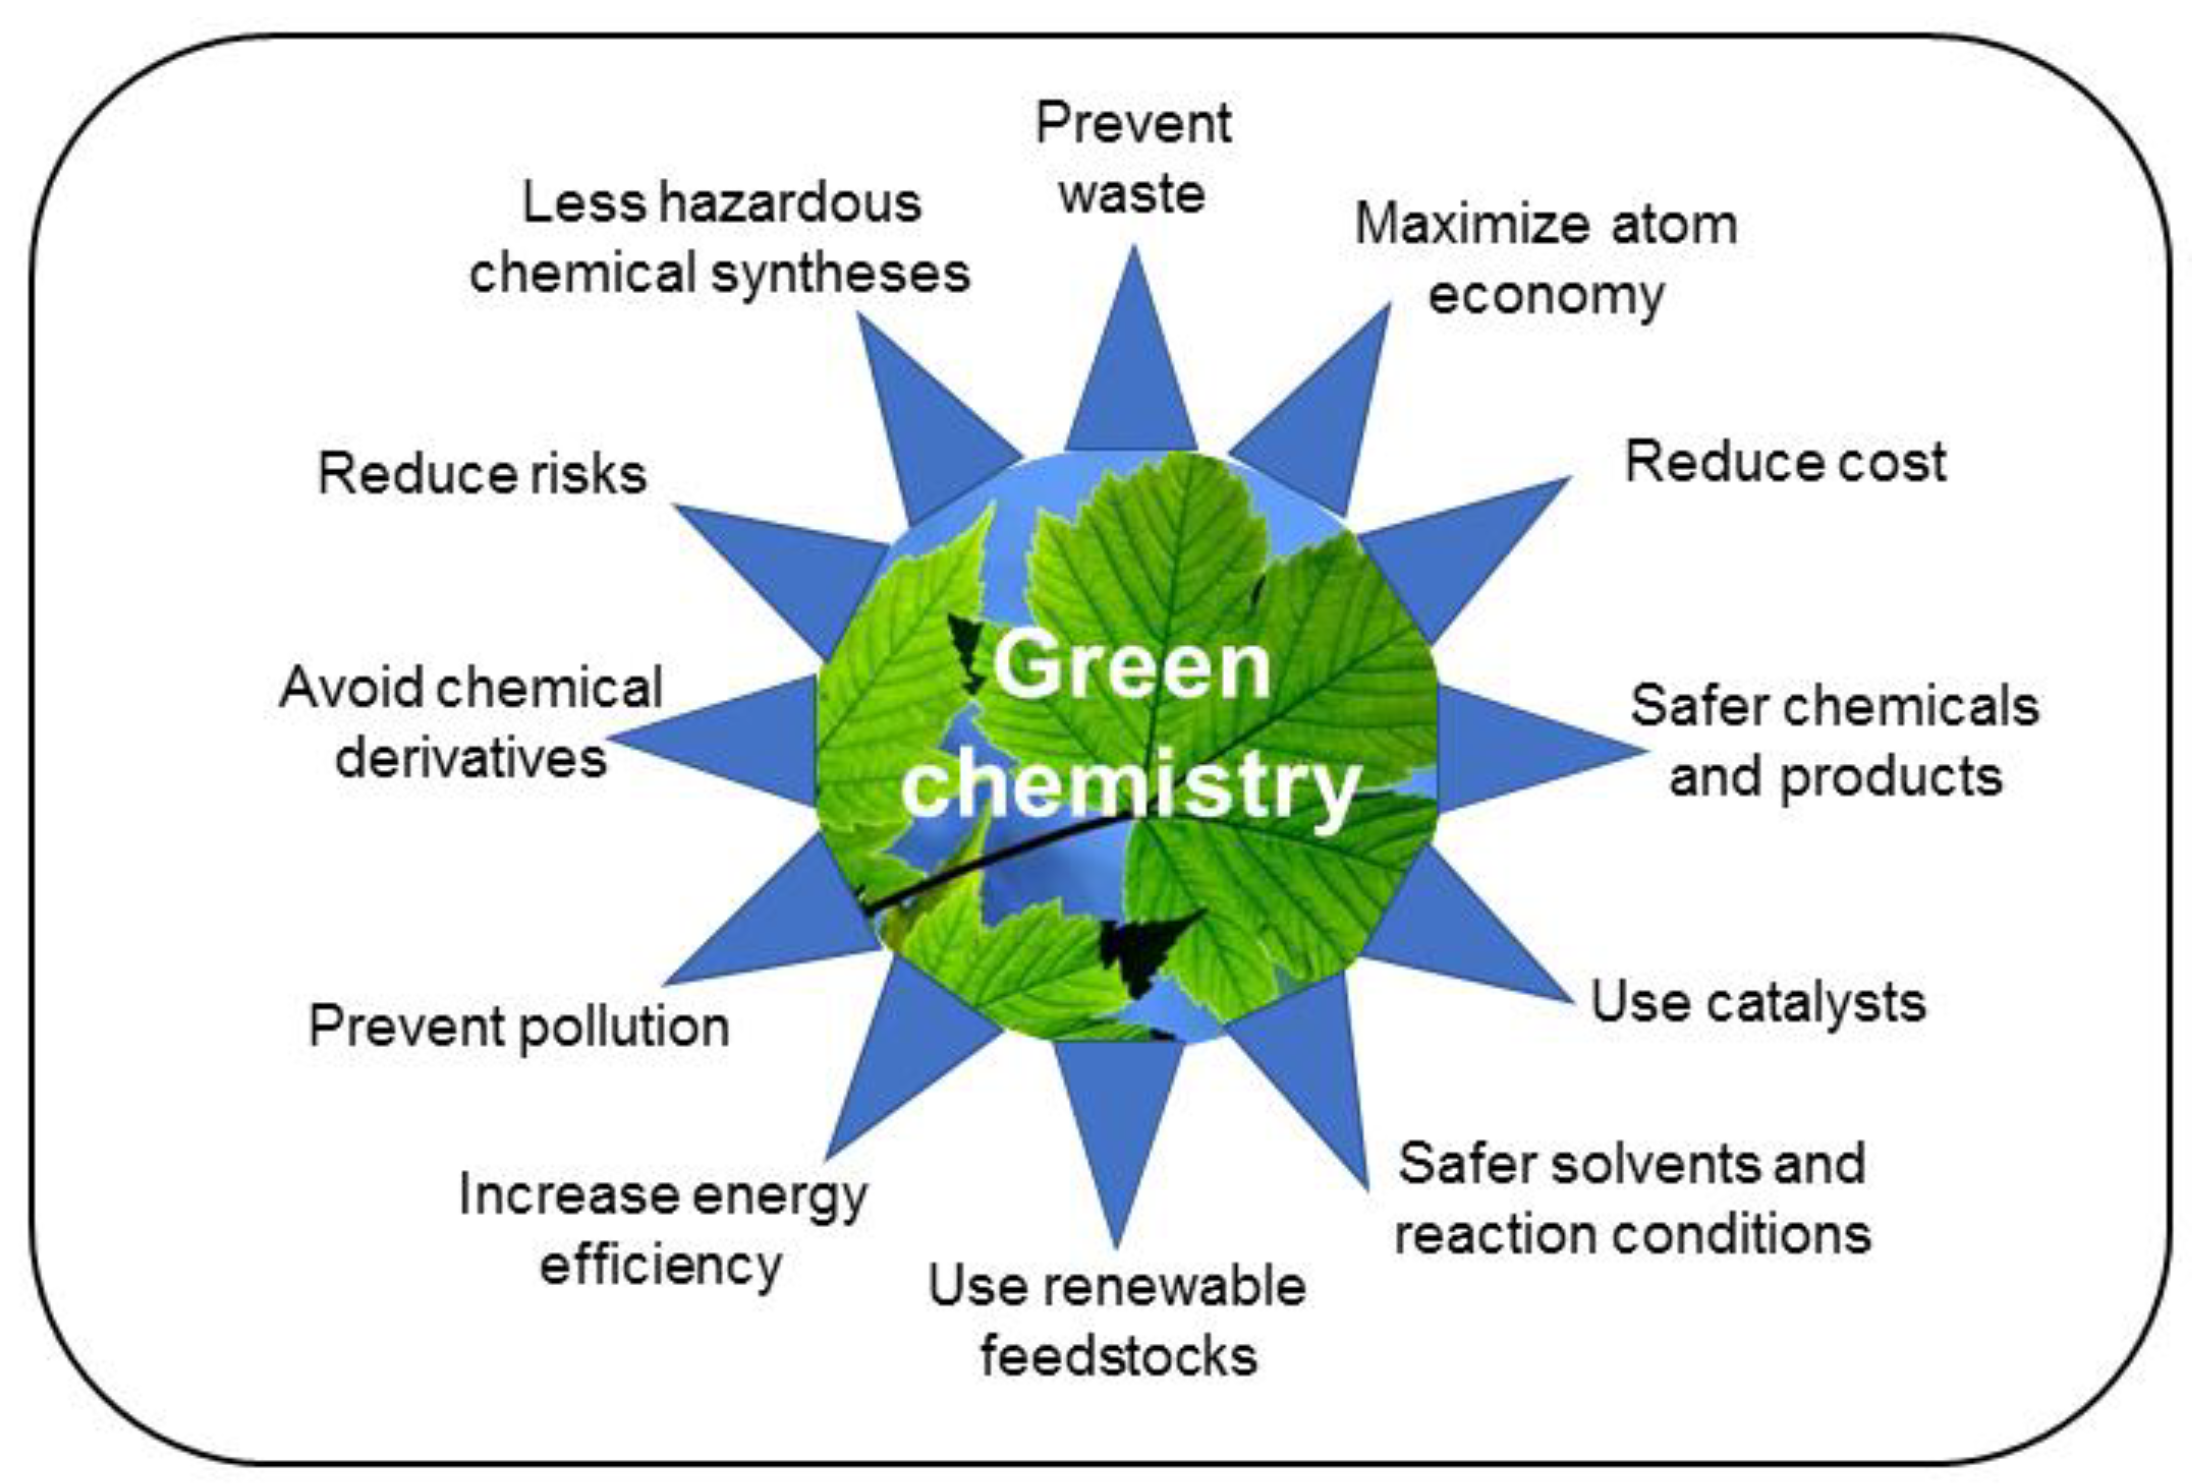
Figure 3.
The plant-mediated synthesis of nanoparticles.
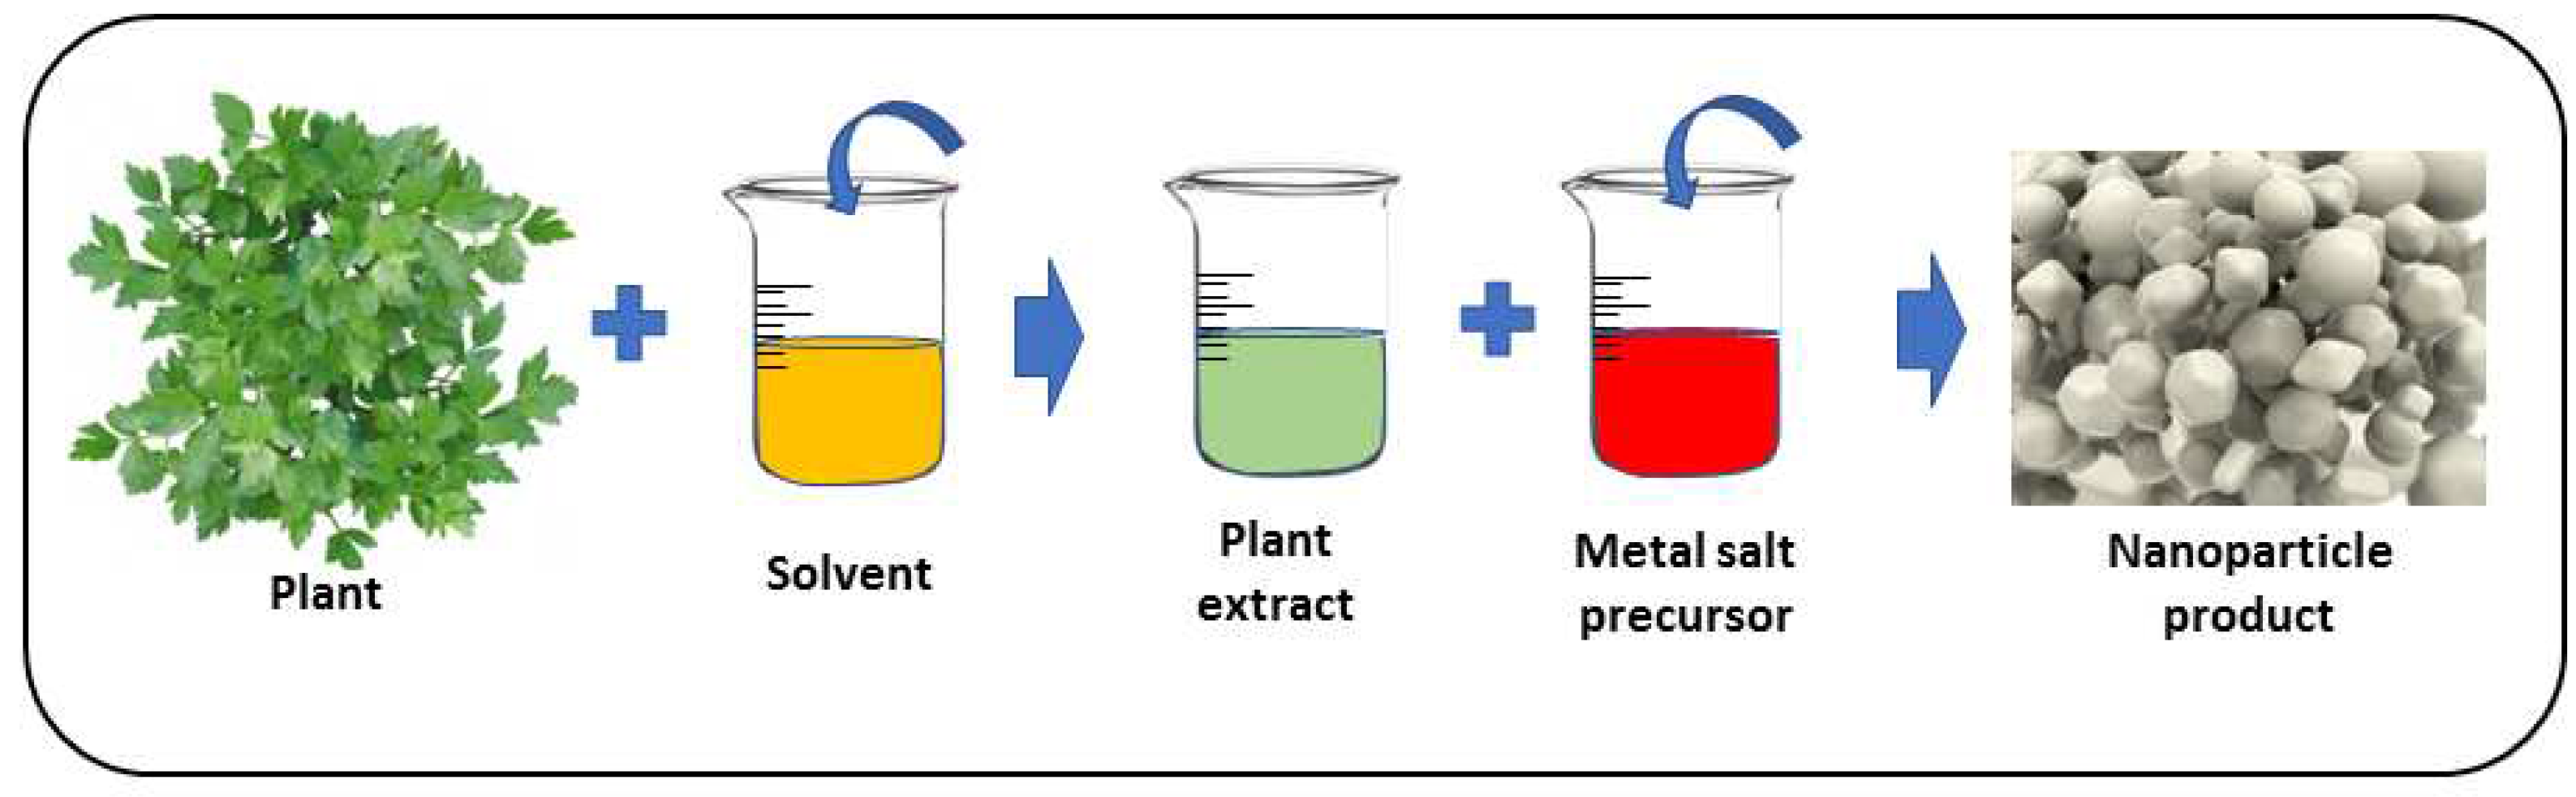
Figure 4.
The mechanism by which plant leaf extract produces green synthesized nanoparticles. Adapted from [104]. Copyright 2014 under the Creative Commons Attribution License.
Figure 4.
The mechanism by which plant leaf extract produces green synthesized nanoparticles. Adapted from [104]. Copyright 2014 under the Creative Commons Attribution License.
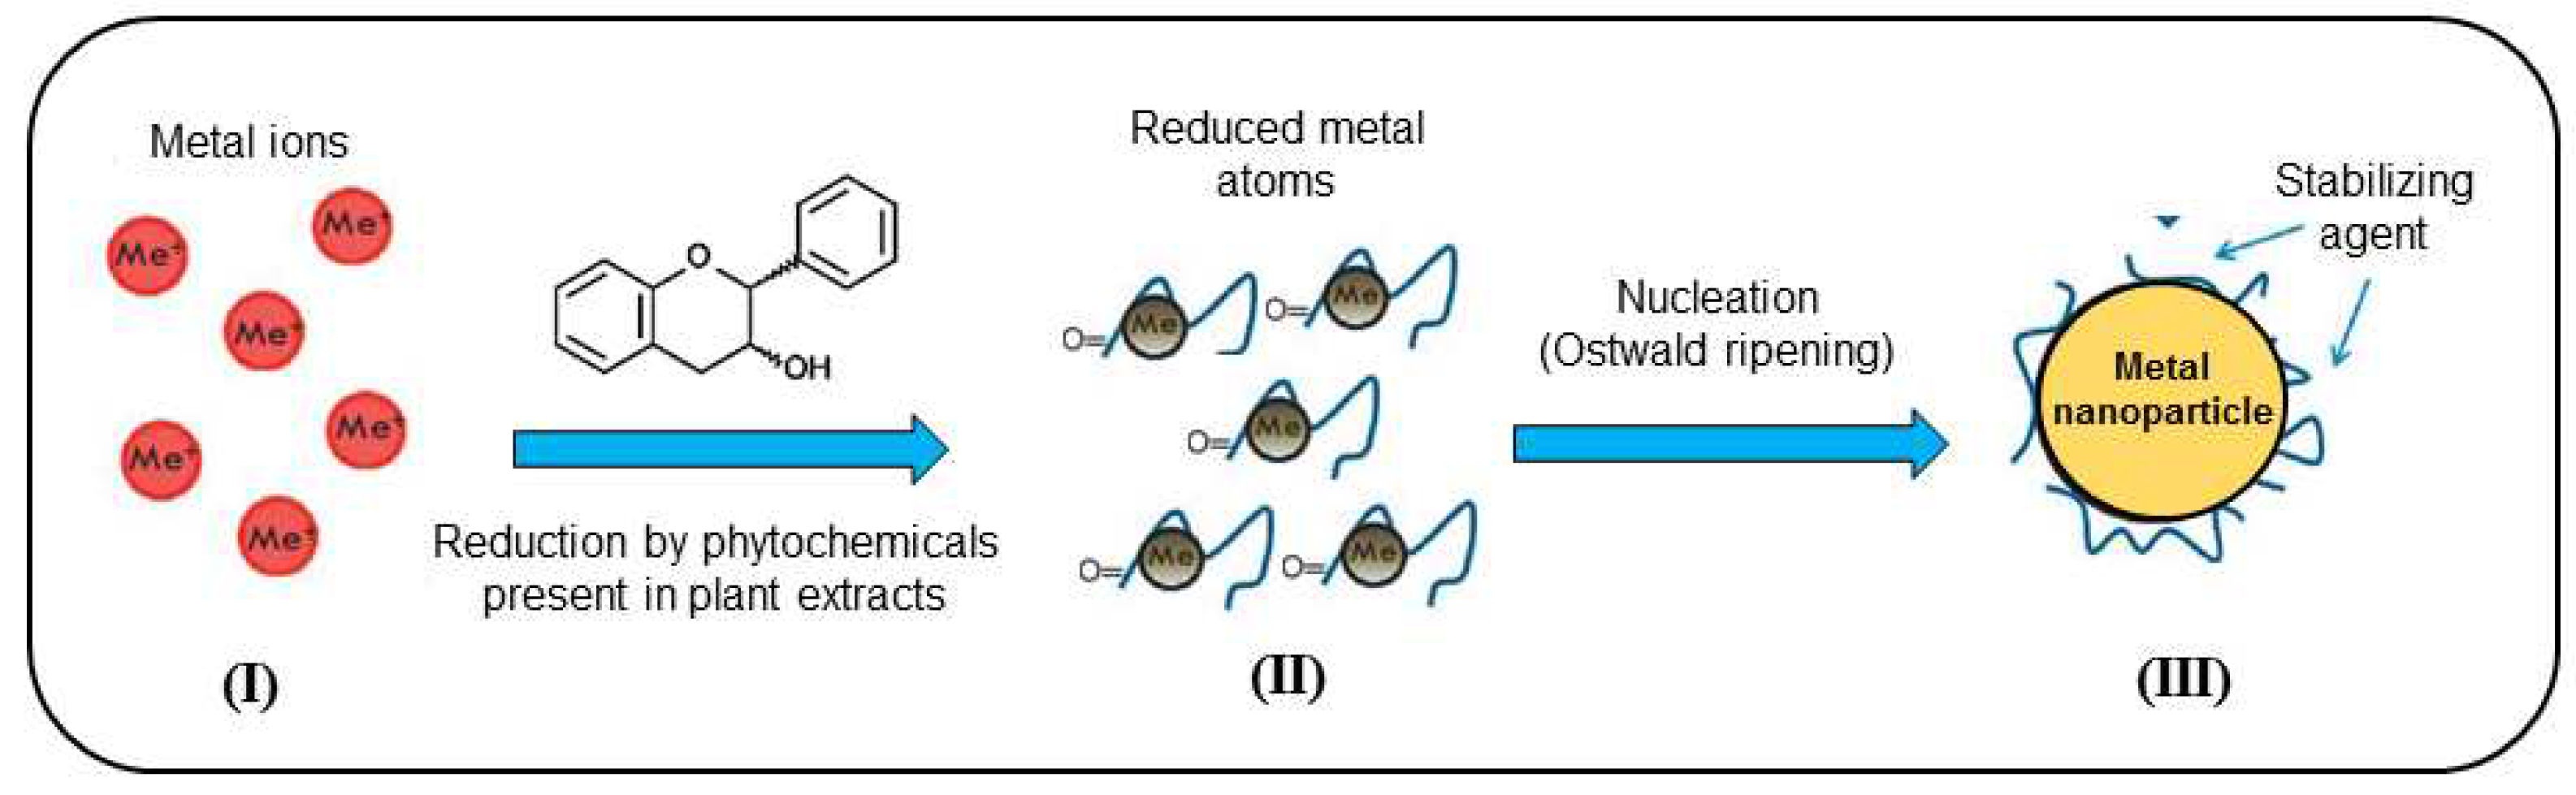
Figure 5.
Variety of natural biological materials used for the synthesis of “green” nanoparticles. Reproduced from [110]. Copyright 2021 under Creative Commons Attribution (CC BY) license.
Figure 5.
Variety of natural biological materials used for the synthesis of “green” nanoparticles. Reproduced from [110]. Copyright 2021 under Creative Commons Attribution (CC BY) license.
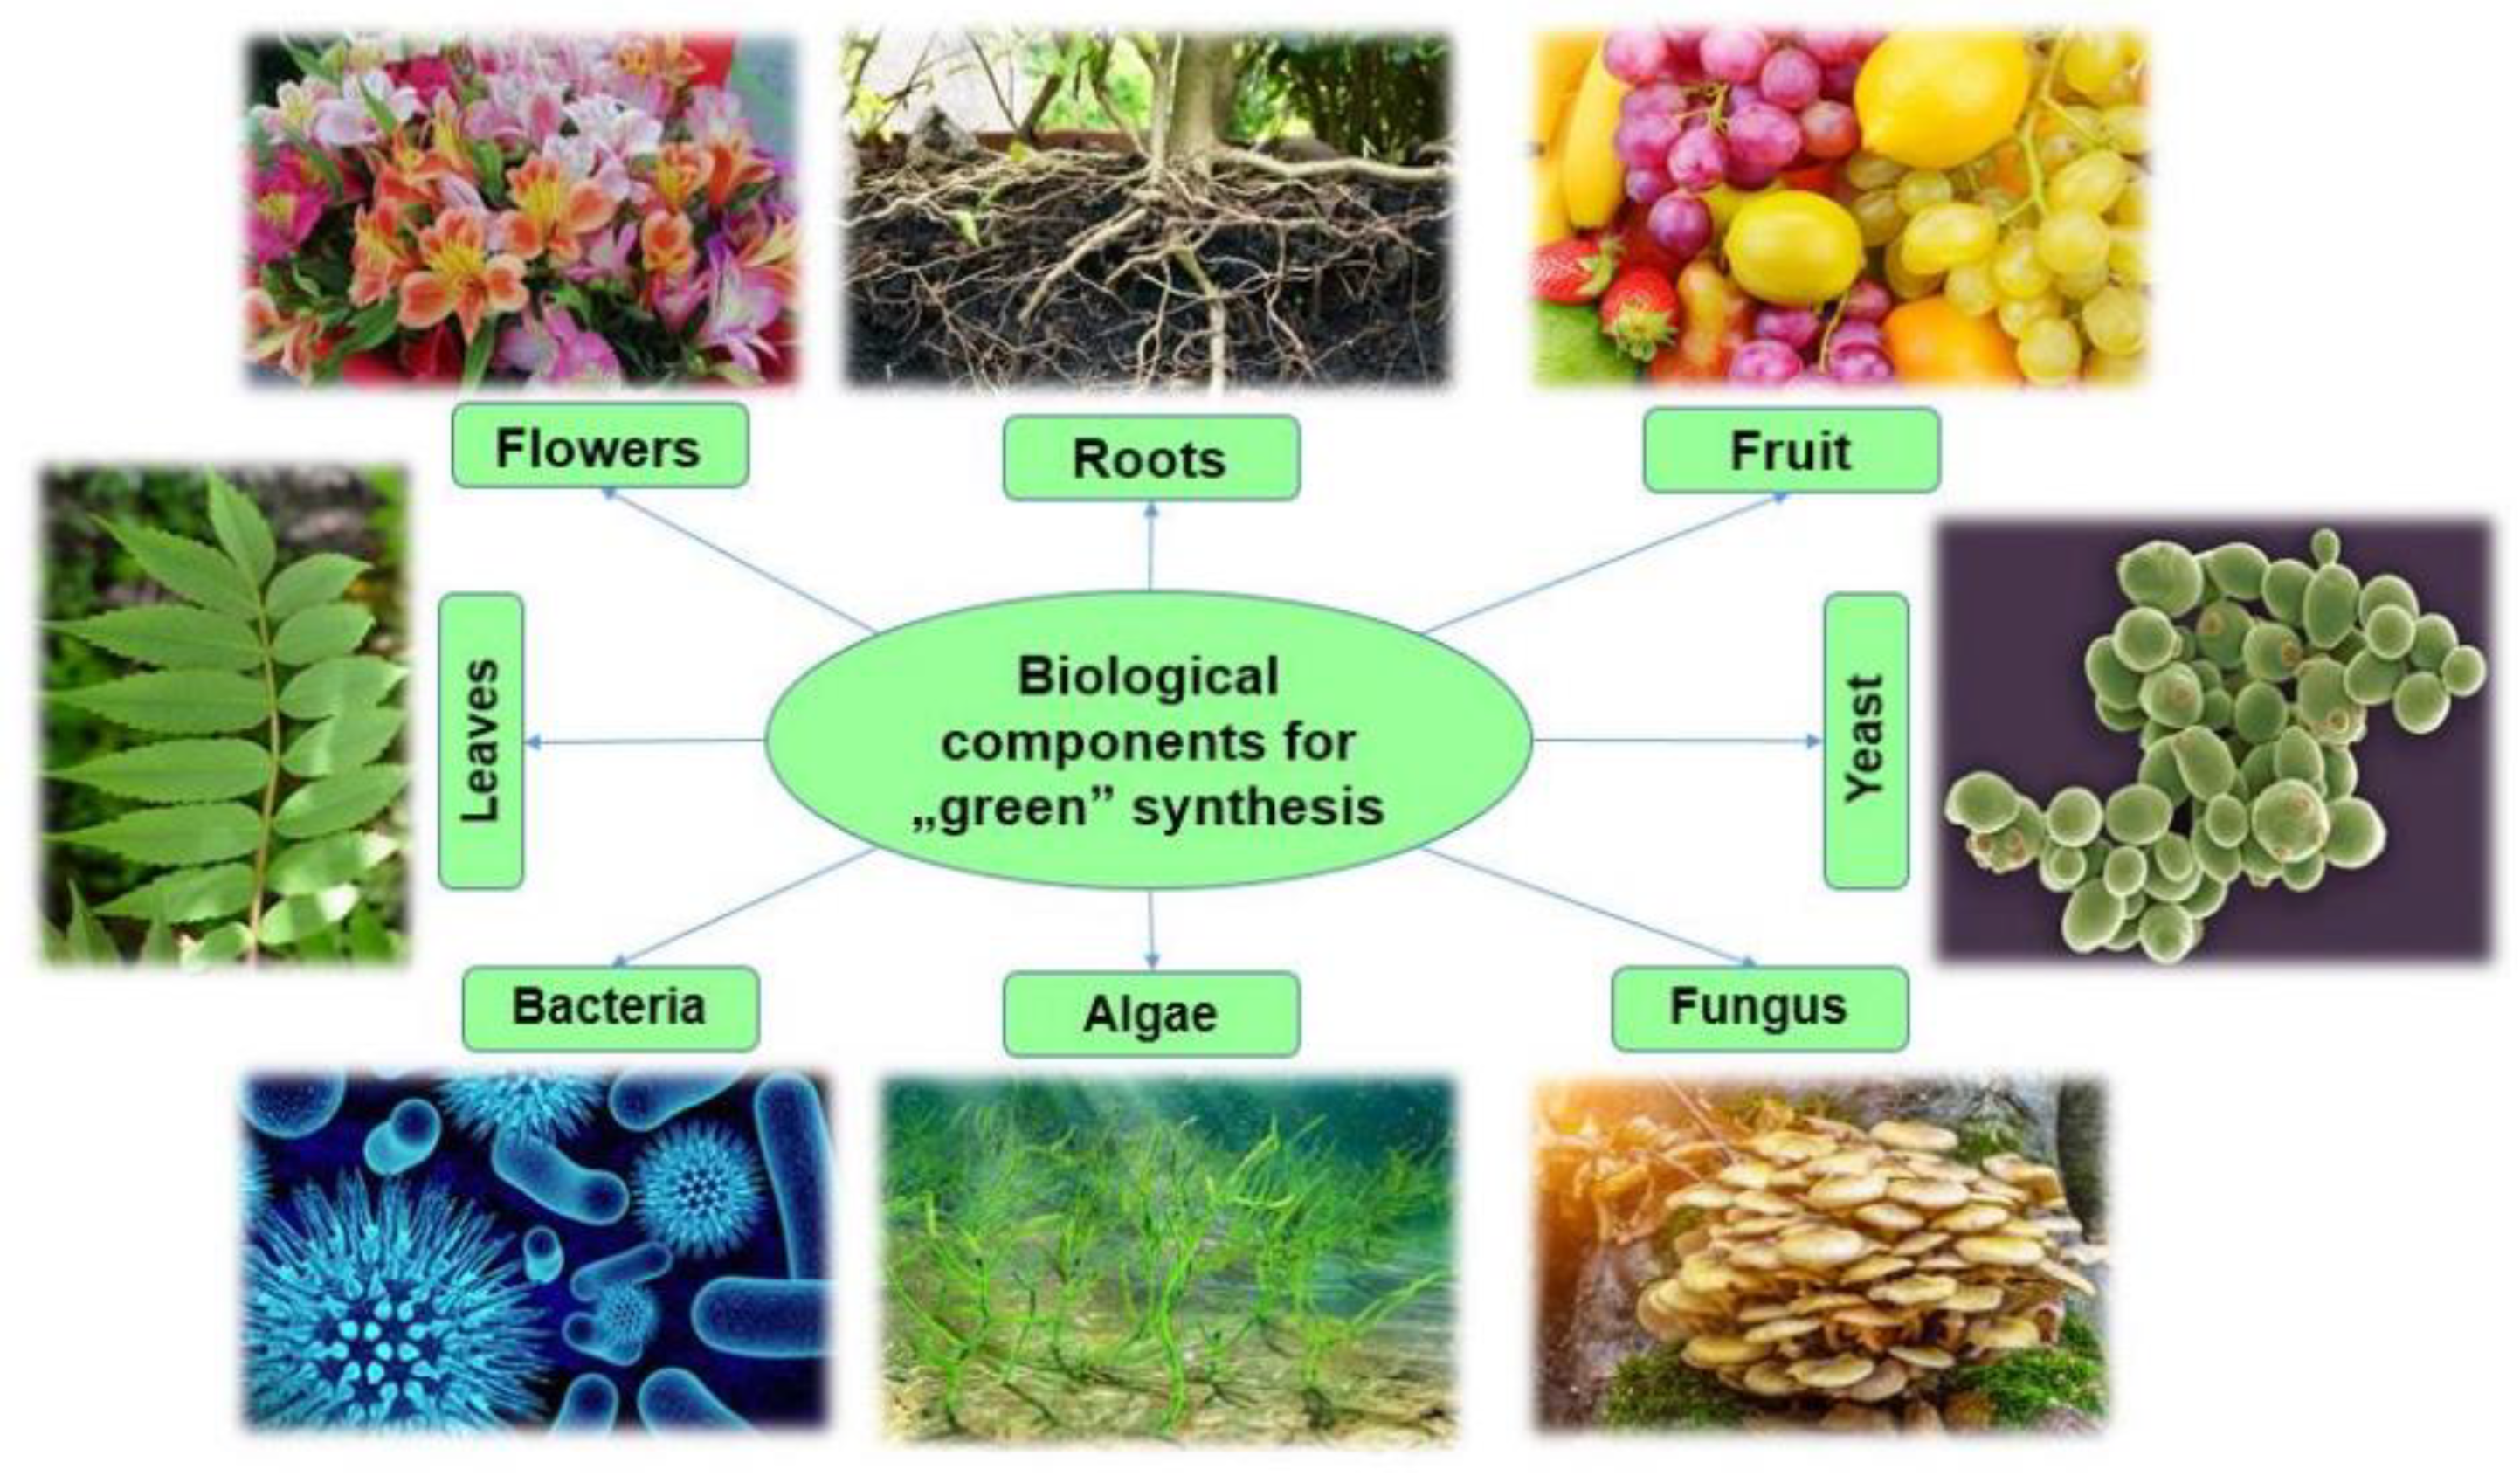
Figure 6.
Biologically active compounds found in plants (phytochemicals) due to the presence of functional groups are able to reduce metal ions. Reproduced from [110]. Copyright 2021 under Creative Commons Attribution (CC BY) license.
Figure 6.
Biologically active compounds found in plants (phytochemicals) due to the presence of functional groups are able to reduce metal ions. Reproduced from [110]. Copyright 2021 under Creative Commons Attribution (CC BY) license.
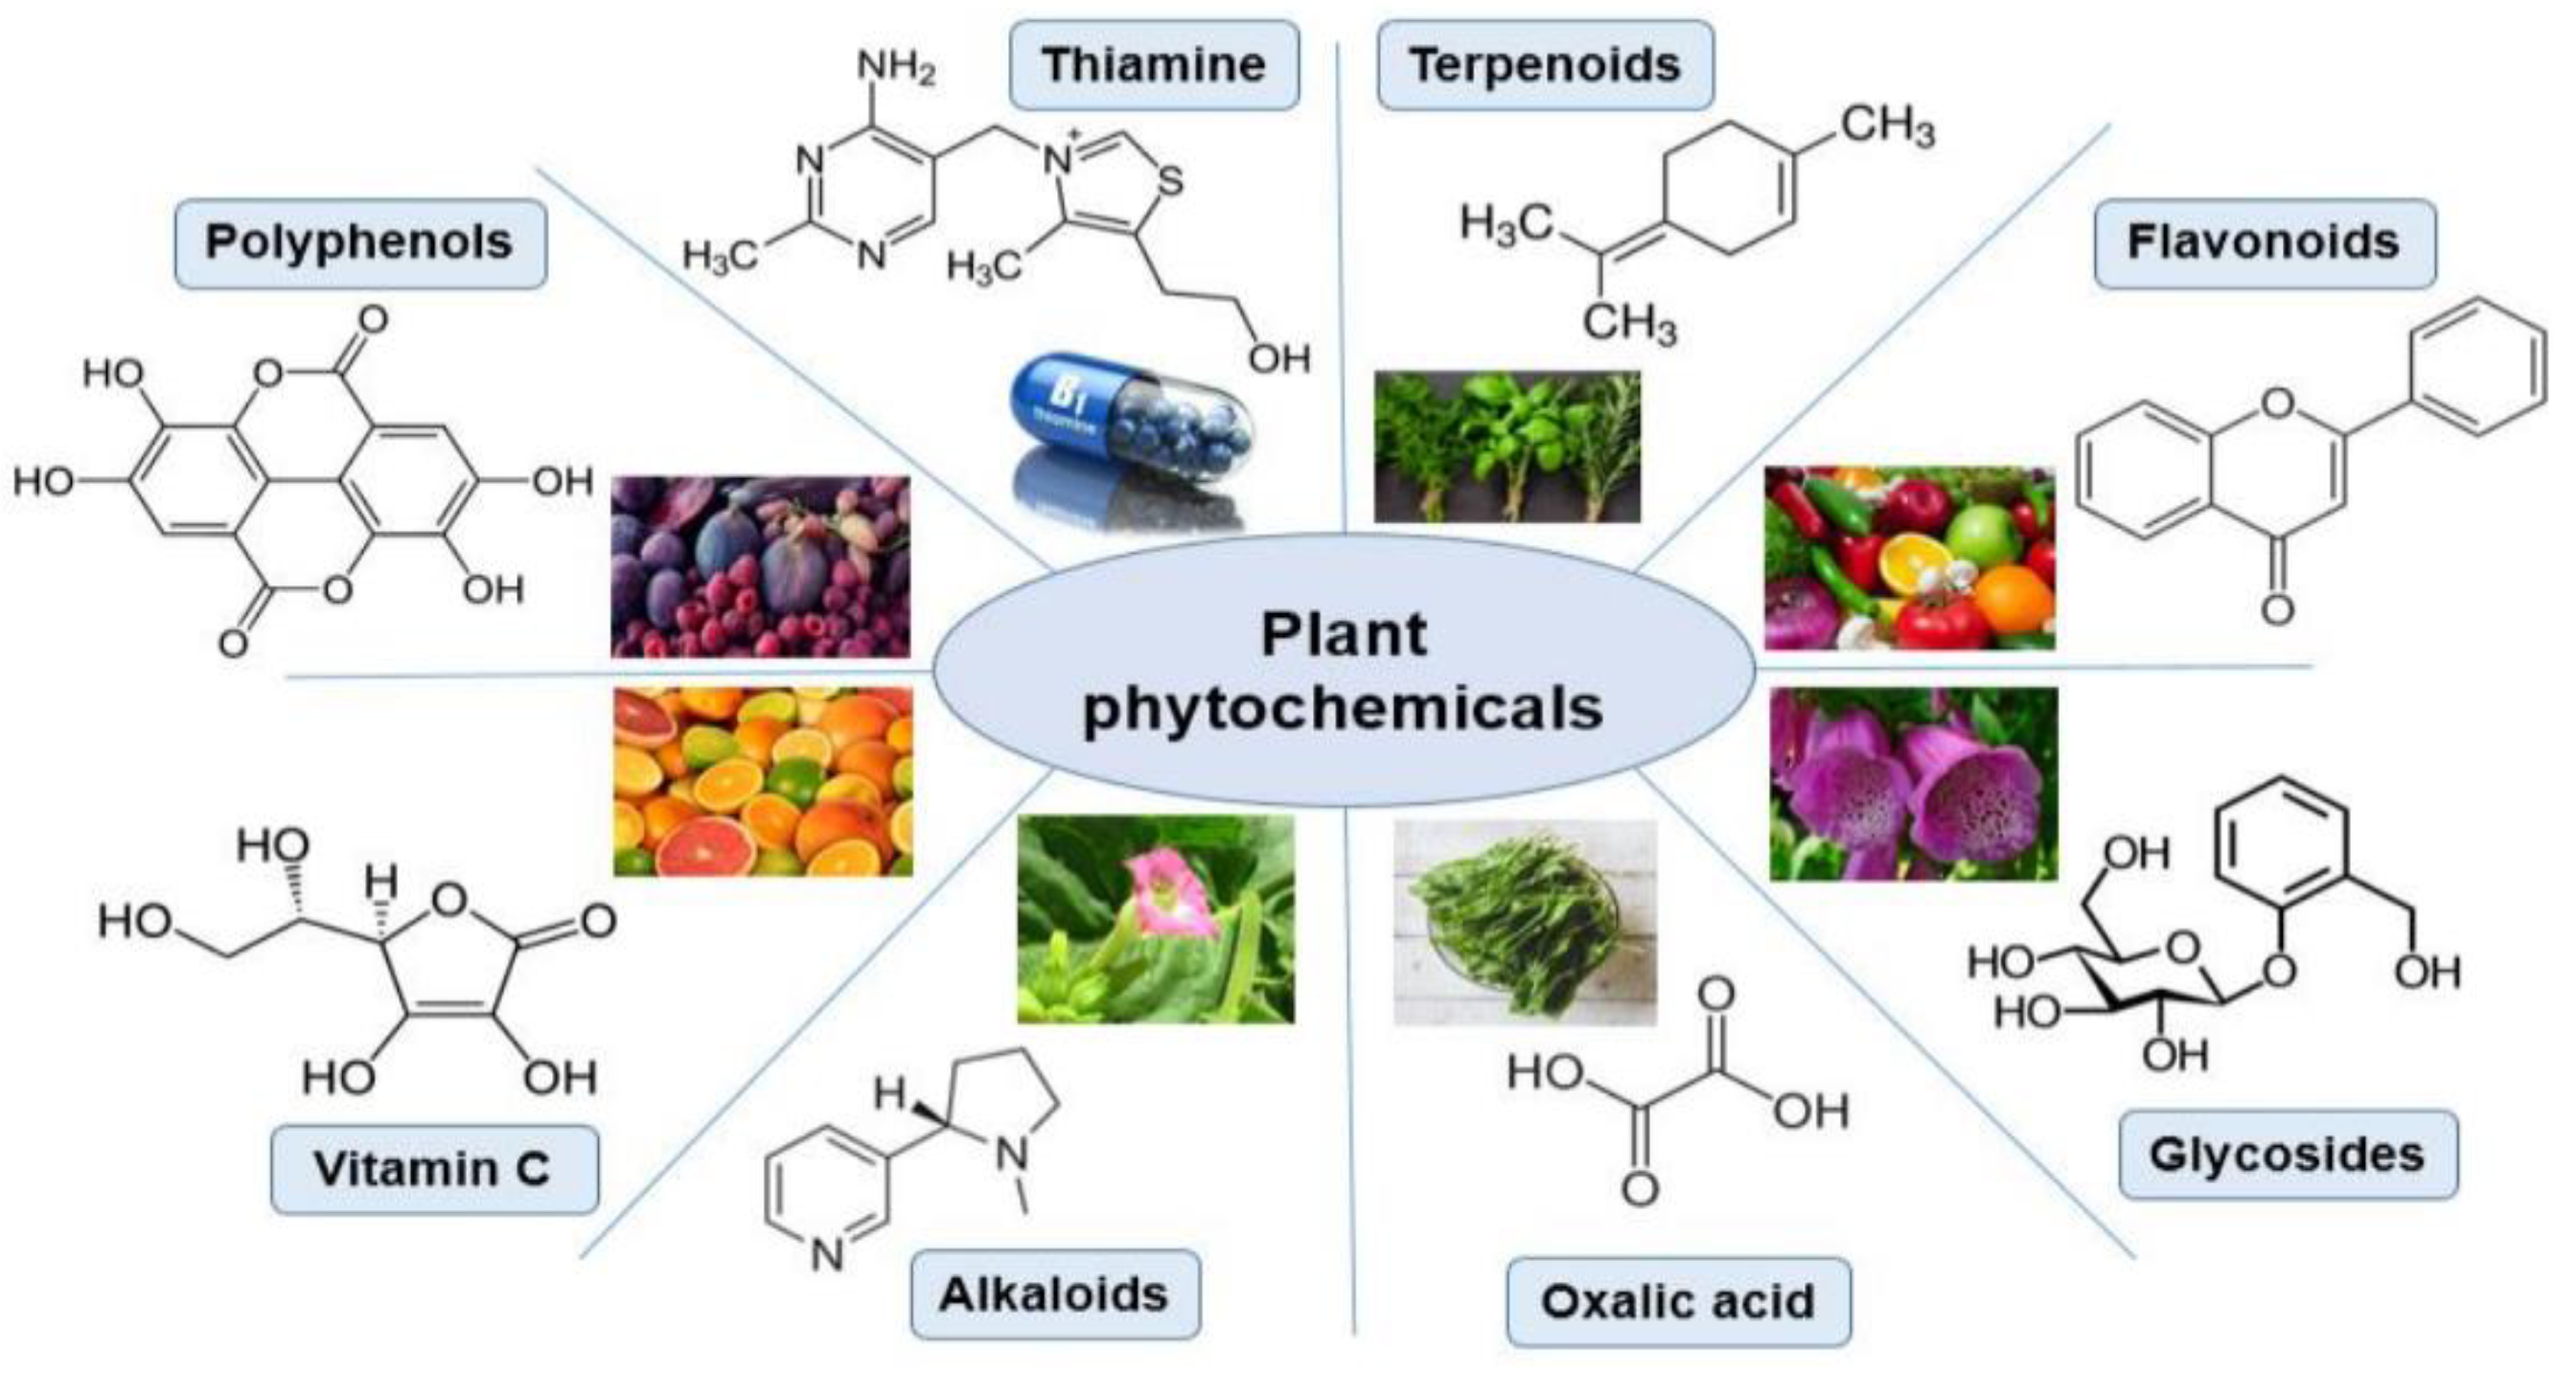
Figure 7.
Crystal structures of (a) α-MnO2, (b) β-MnO2, (c) γ- MnO2, (d) δ- MnO2, and (e) λ-MnO2. Reproduced with permission from [173]. Copyright 2008 American Chemical Society.
Figure 7.
Crystal structures of (a) α-MnO2, (b) β-MnO2, (c) γ- MnO2, (d) δ- MnO2, and (e) λ-MnO2. Reproduced with permission from [173]. Copyright 2008 American Chemical Society.
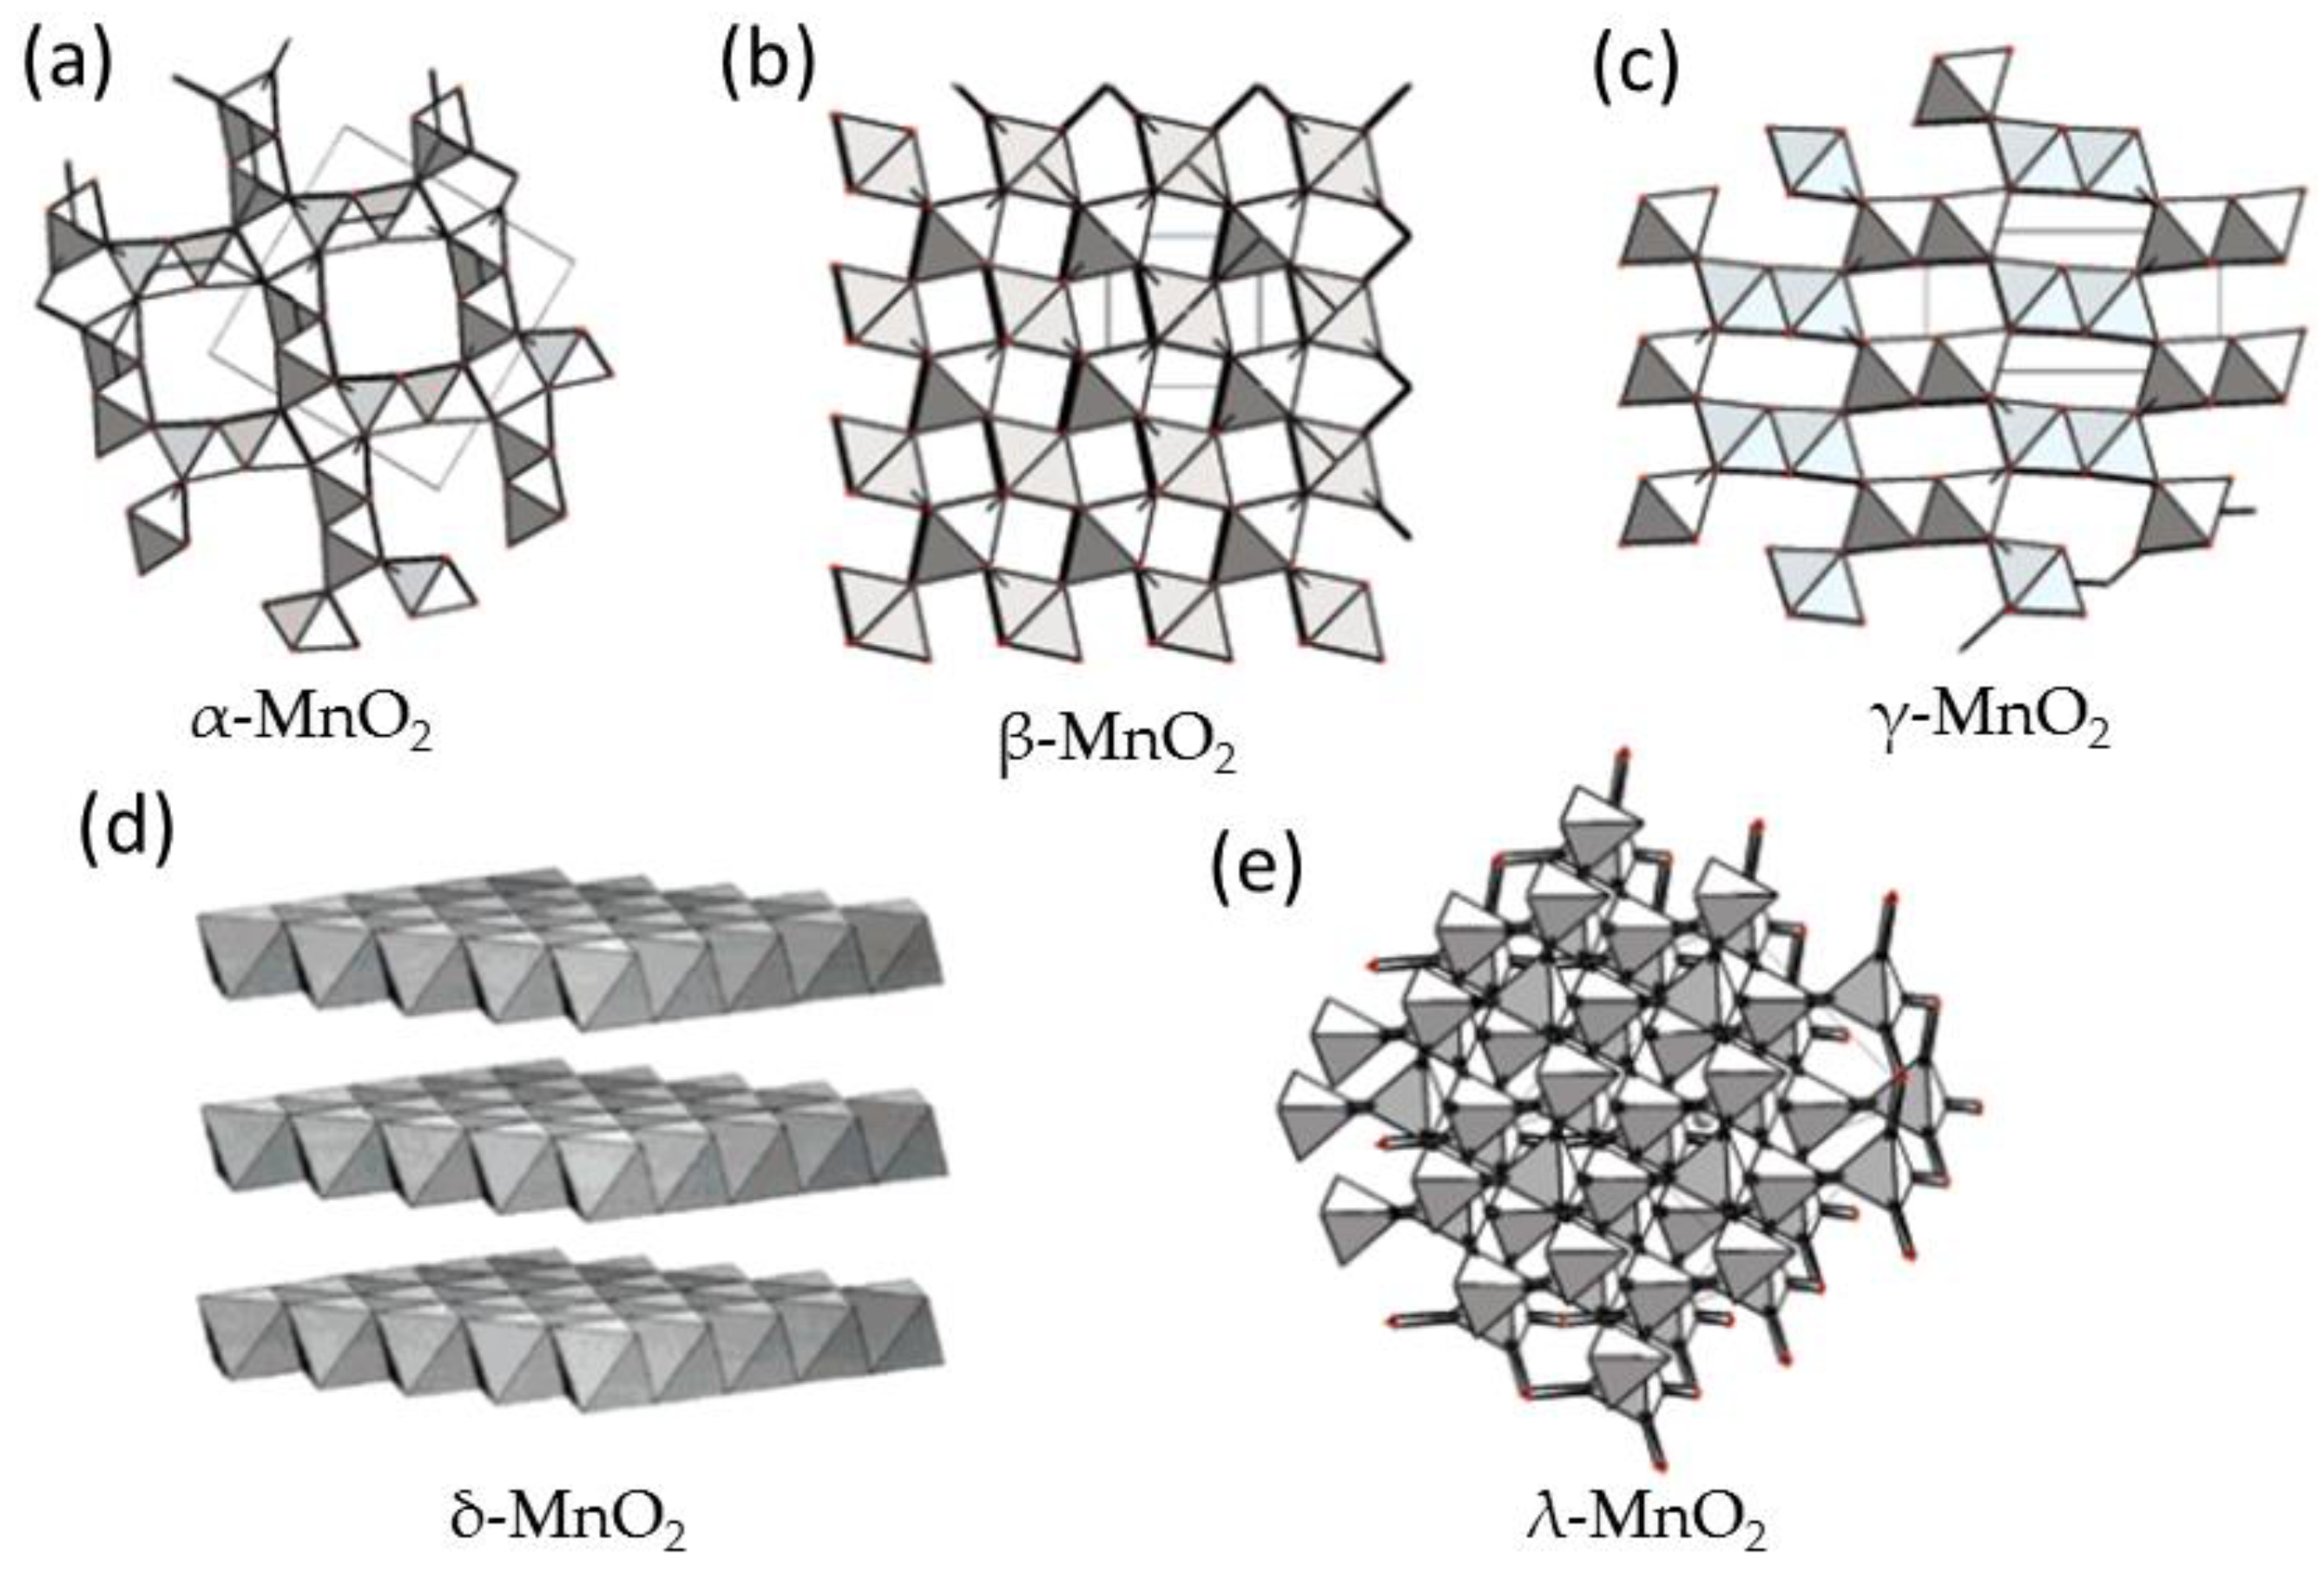
Figure 8.
SEM images of various nanostructured MnO2 materials. These micrographs show the morphologies of the different MDO samples described in the text. Reproduced from [176]. Copyright 2017 under the Creative Commons Attribution (CC BY) License.
Figure 8.
SEM images of various nanostructured MnO2 materials. These micrographs show the morphologies of the different MDO samples described in the text. Reproduced from [176]. Copyright 2017 under the Creative Commons Attribution (CC BY) License.
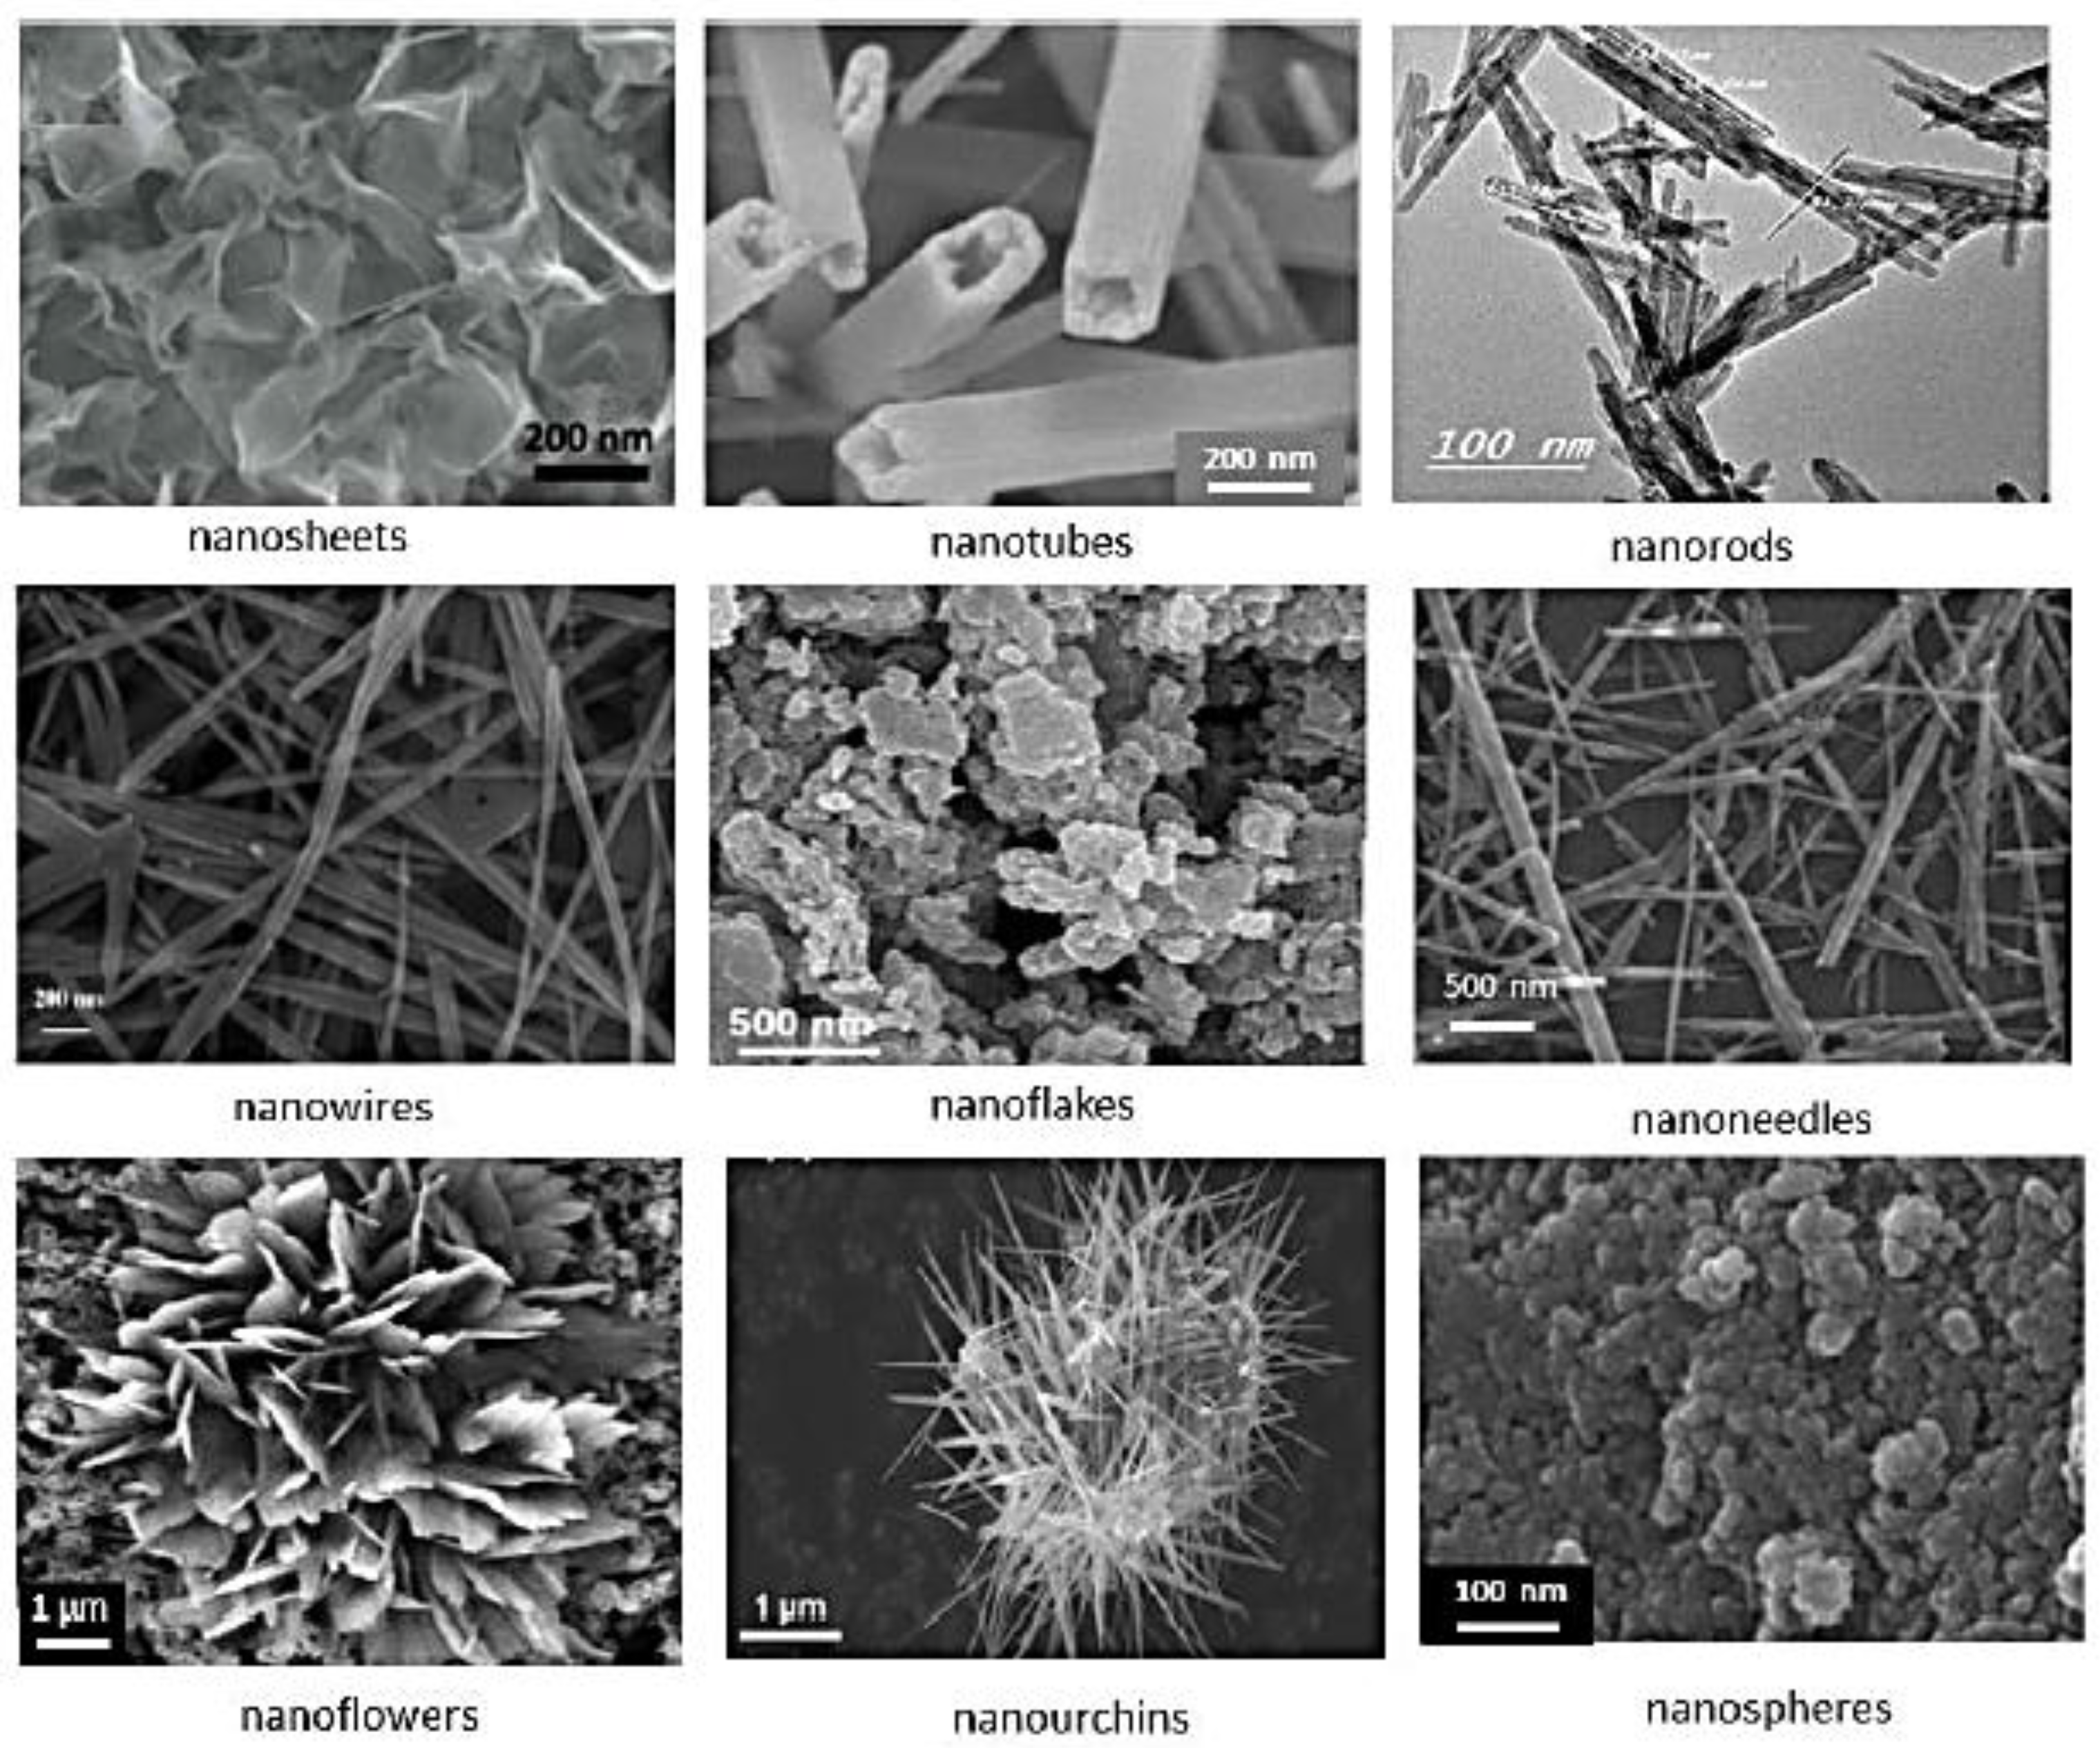
Figure 9.
Plants and fruits used for the green bio-synthesis of nanostructured MDOs.
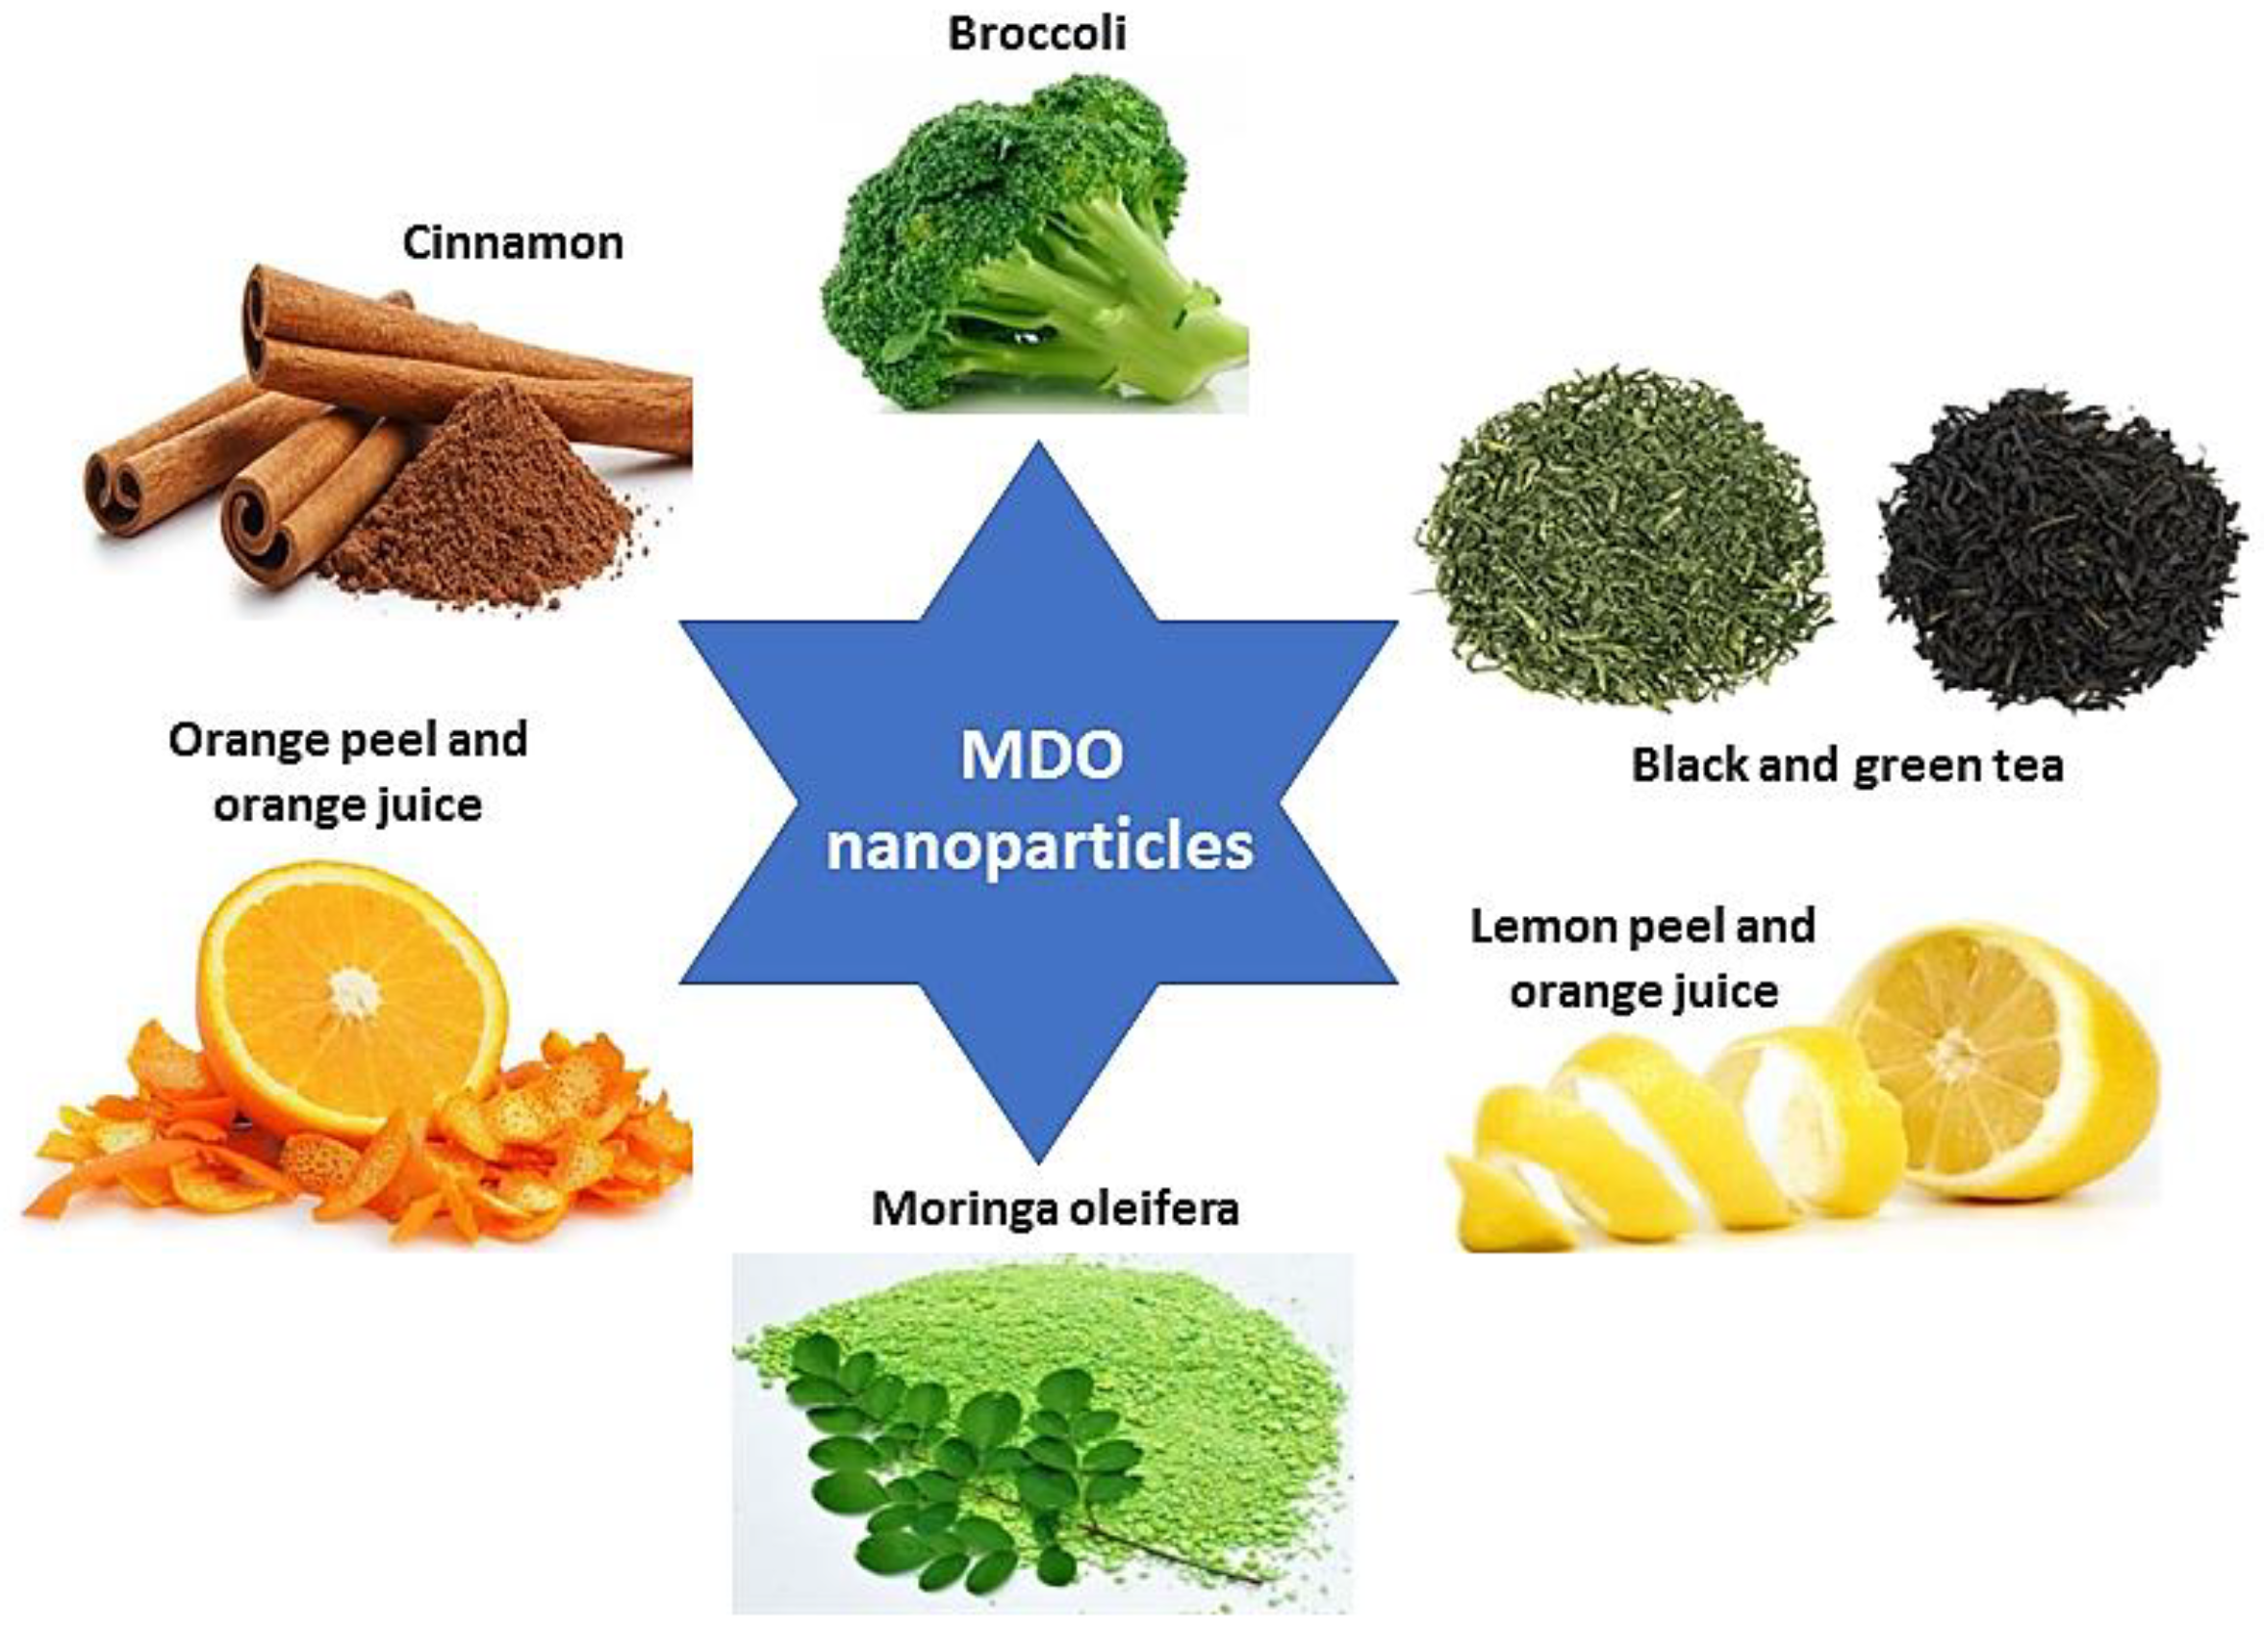
Figure 10.
Molecular structure of the anti-oxidative components found in (a) lemon juice and (b) lemon peel. Reproduced with permission from [72]. Copyright 2018 Elsevier.
Figure 10.
Molecular structure of the anti-oxidative components found in (a) lemon juice and (b) lemon peel. Reproduced with permission from [72]. Copyright 2018 Elsevier.
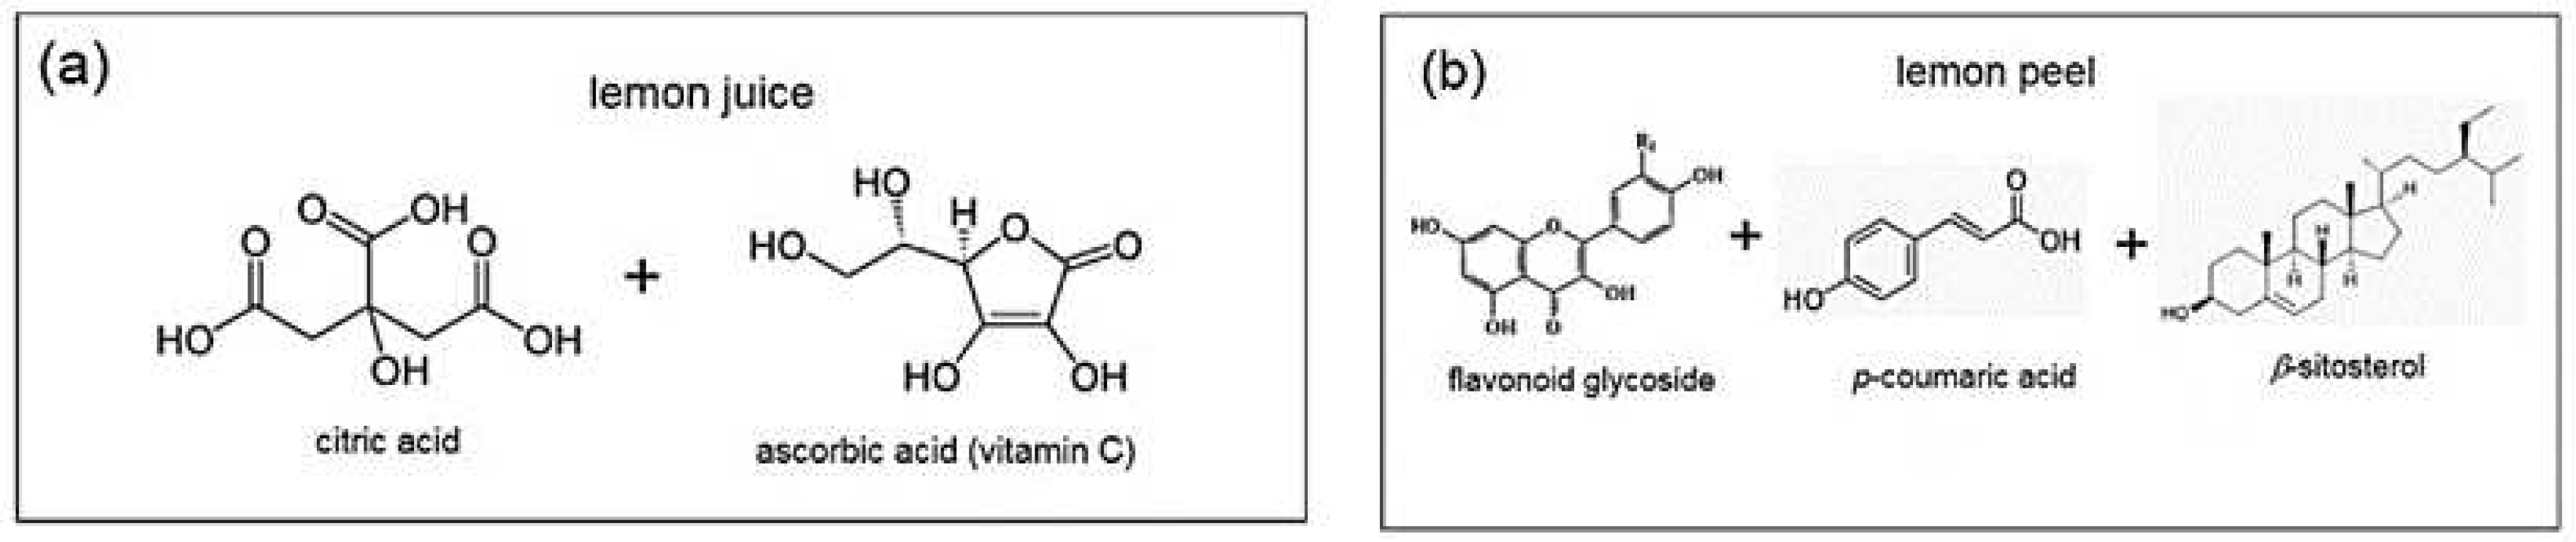
Figure 11.
Green synthesized MnO2 using lemon peel and lemon juice extract. (a) XRD patterns of P-MnO2 (a) and J-MnO2 (b). The results of a Rietveld refinement are shown for P-MnO2 with refined composition K0.12MnO2 in (a). A comparison between XRD patterns from J-MnO2 and the empty capillary is shown in (b), because of a lack of sufficient long-range order. (c) SEM images of green synthesized samples J-MnO2 (i) and P-MnO2 (ii) and TEM images of green synthesized samples J-MnO2 (iii) and P-MnO2 (iv). Rate capability tests of Li half cells for J-MnO2 (d) and P-MnO2 (e) electrodes. (f) Discharge capacity as a function of cycle number for both cells. Reproduced with permission from [72]. Copyright 2018 Elsevier.
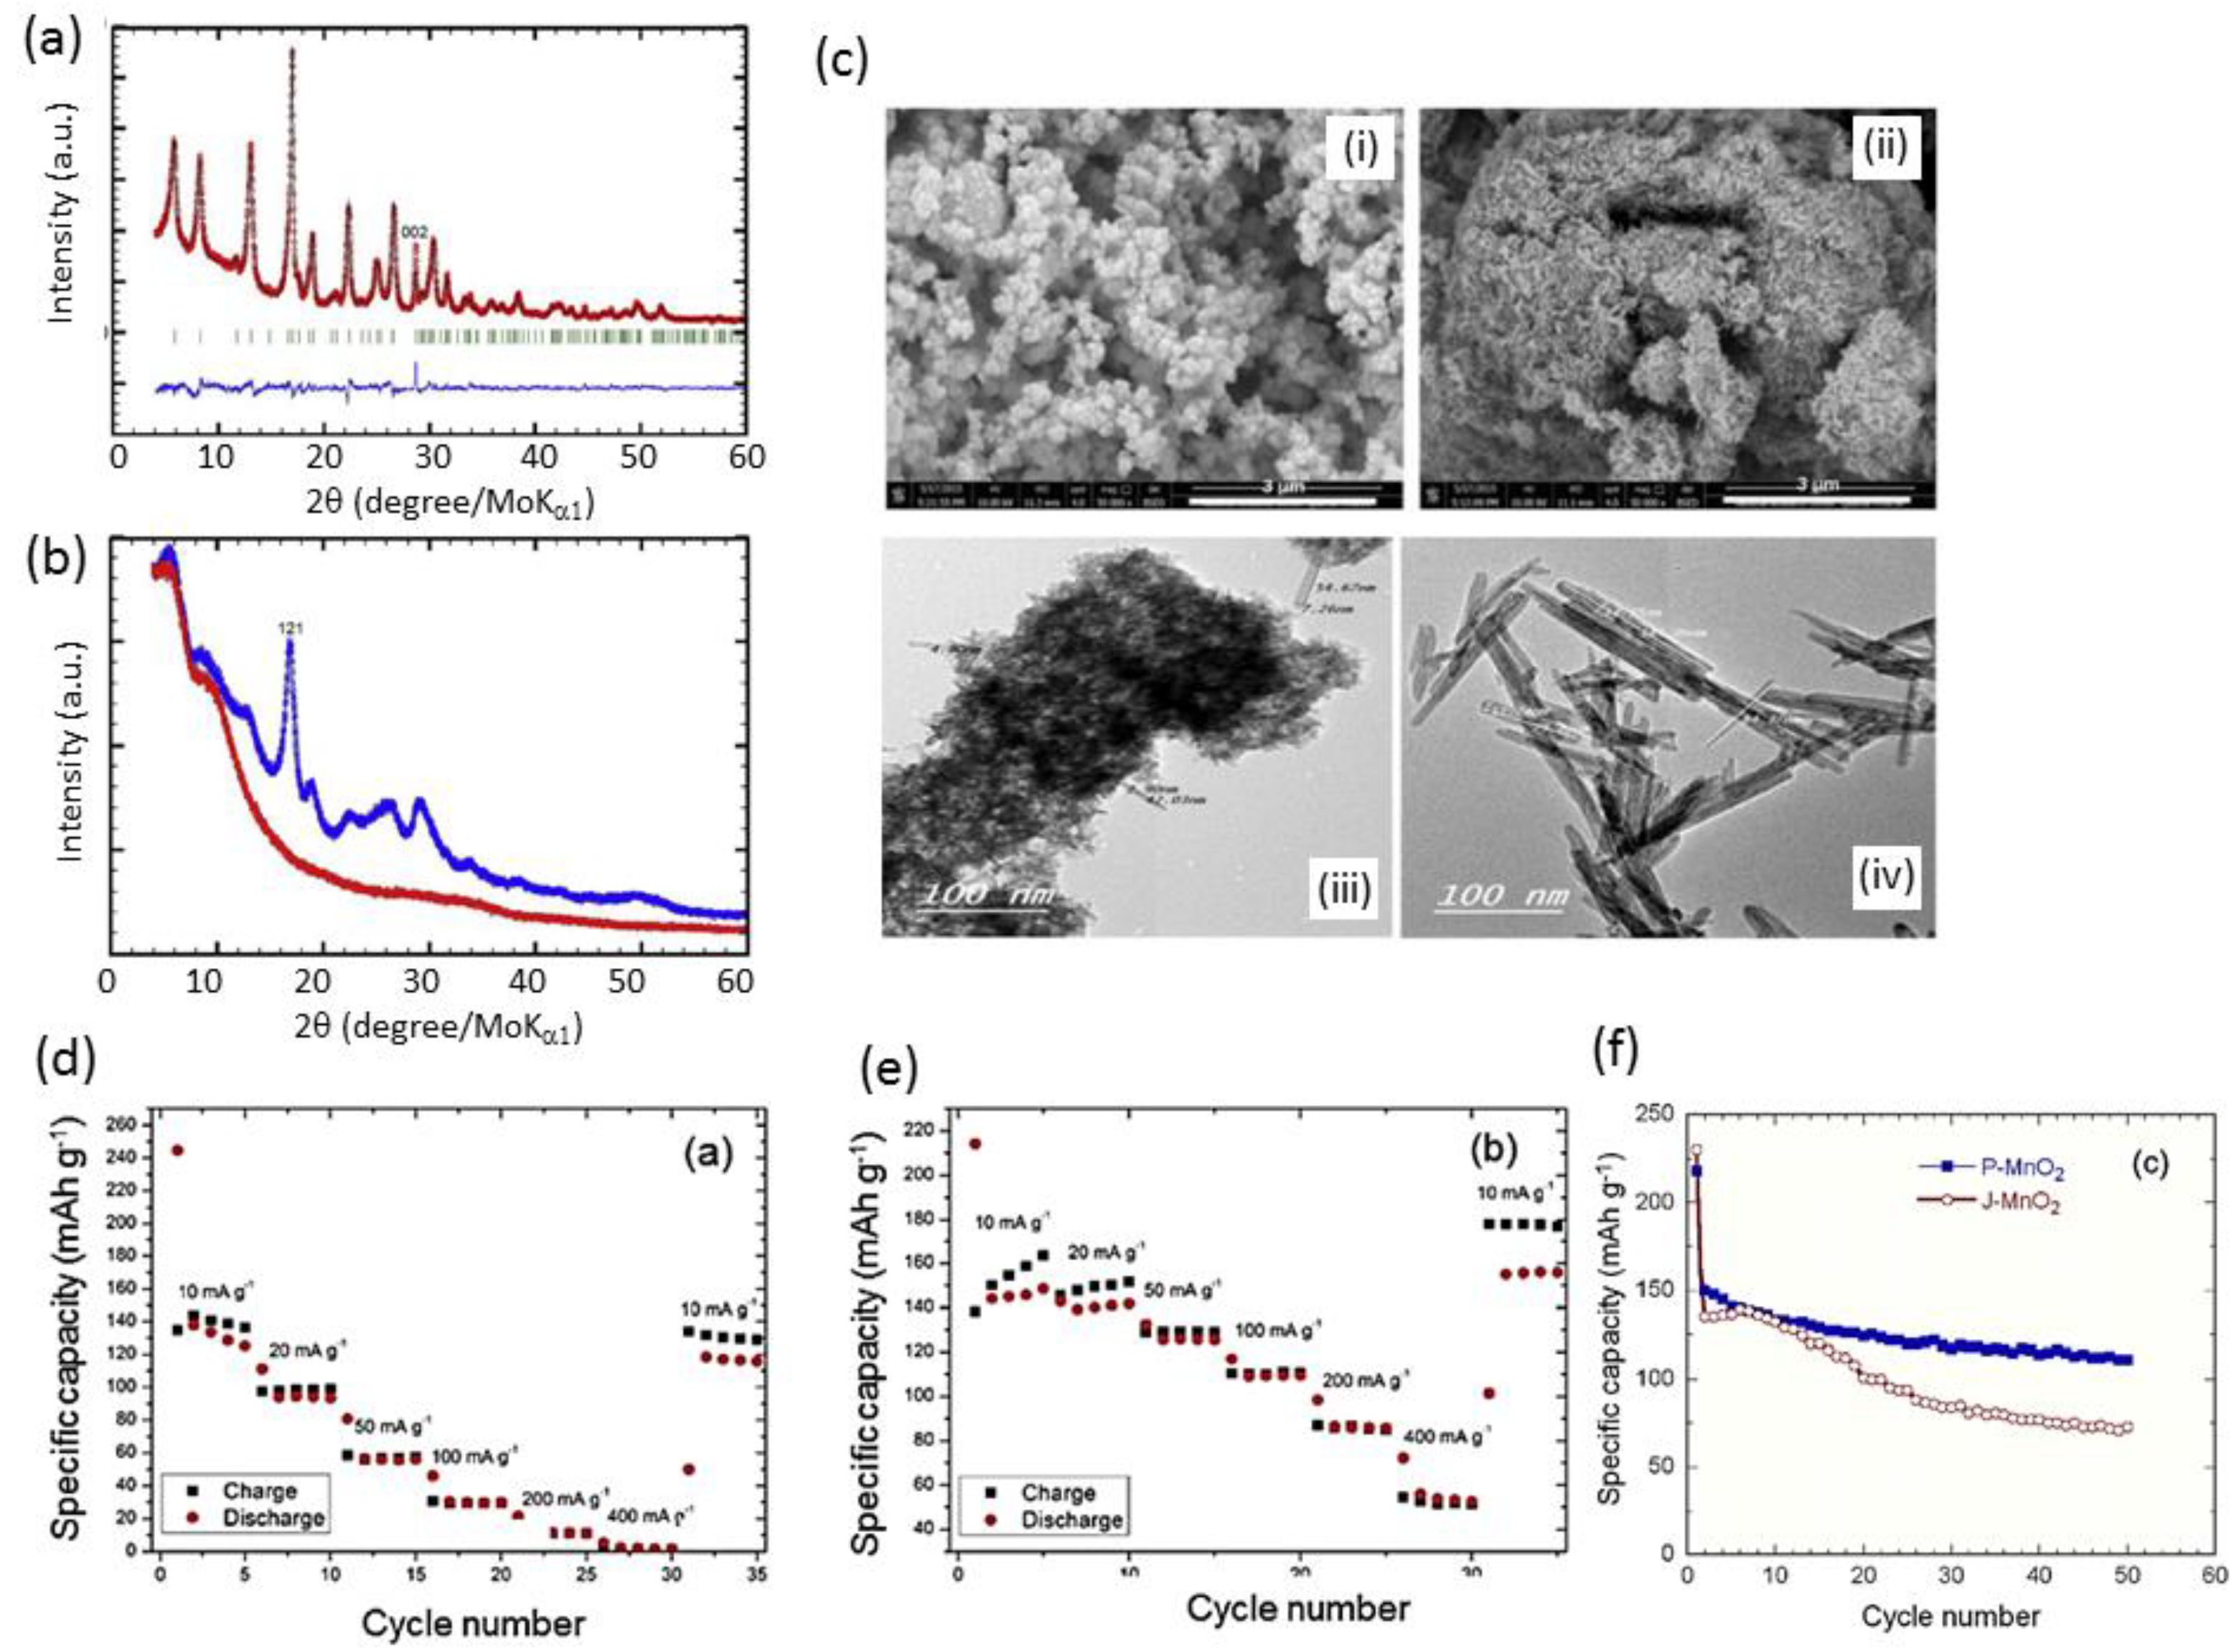
Figure 12.
The significant amounts of flavonoids included in black and green tea. R = Galloyl group. Reproduced with permission from [75]. Copyright 2018 Elsevier.
Figure 12.
The significant amounts of flavonoids included in black and green tea. R = Galloyl group. Reproduced with permission from [75]. Copyright 2018 Elsevier.
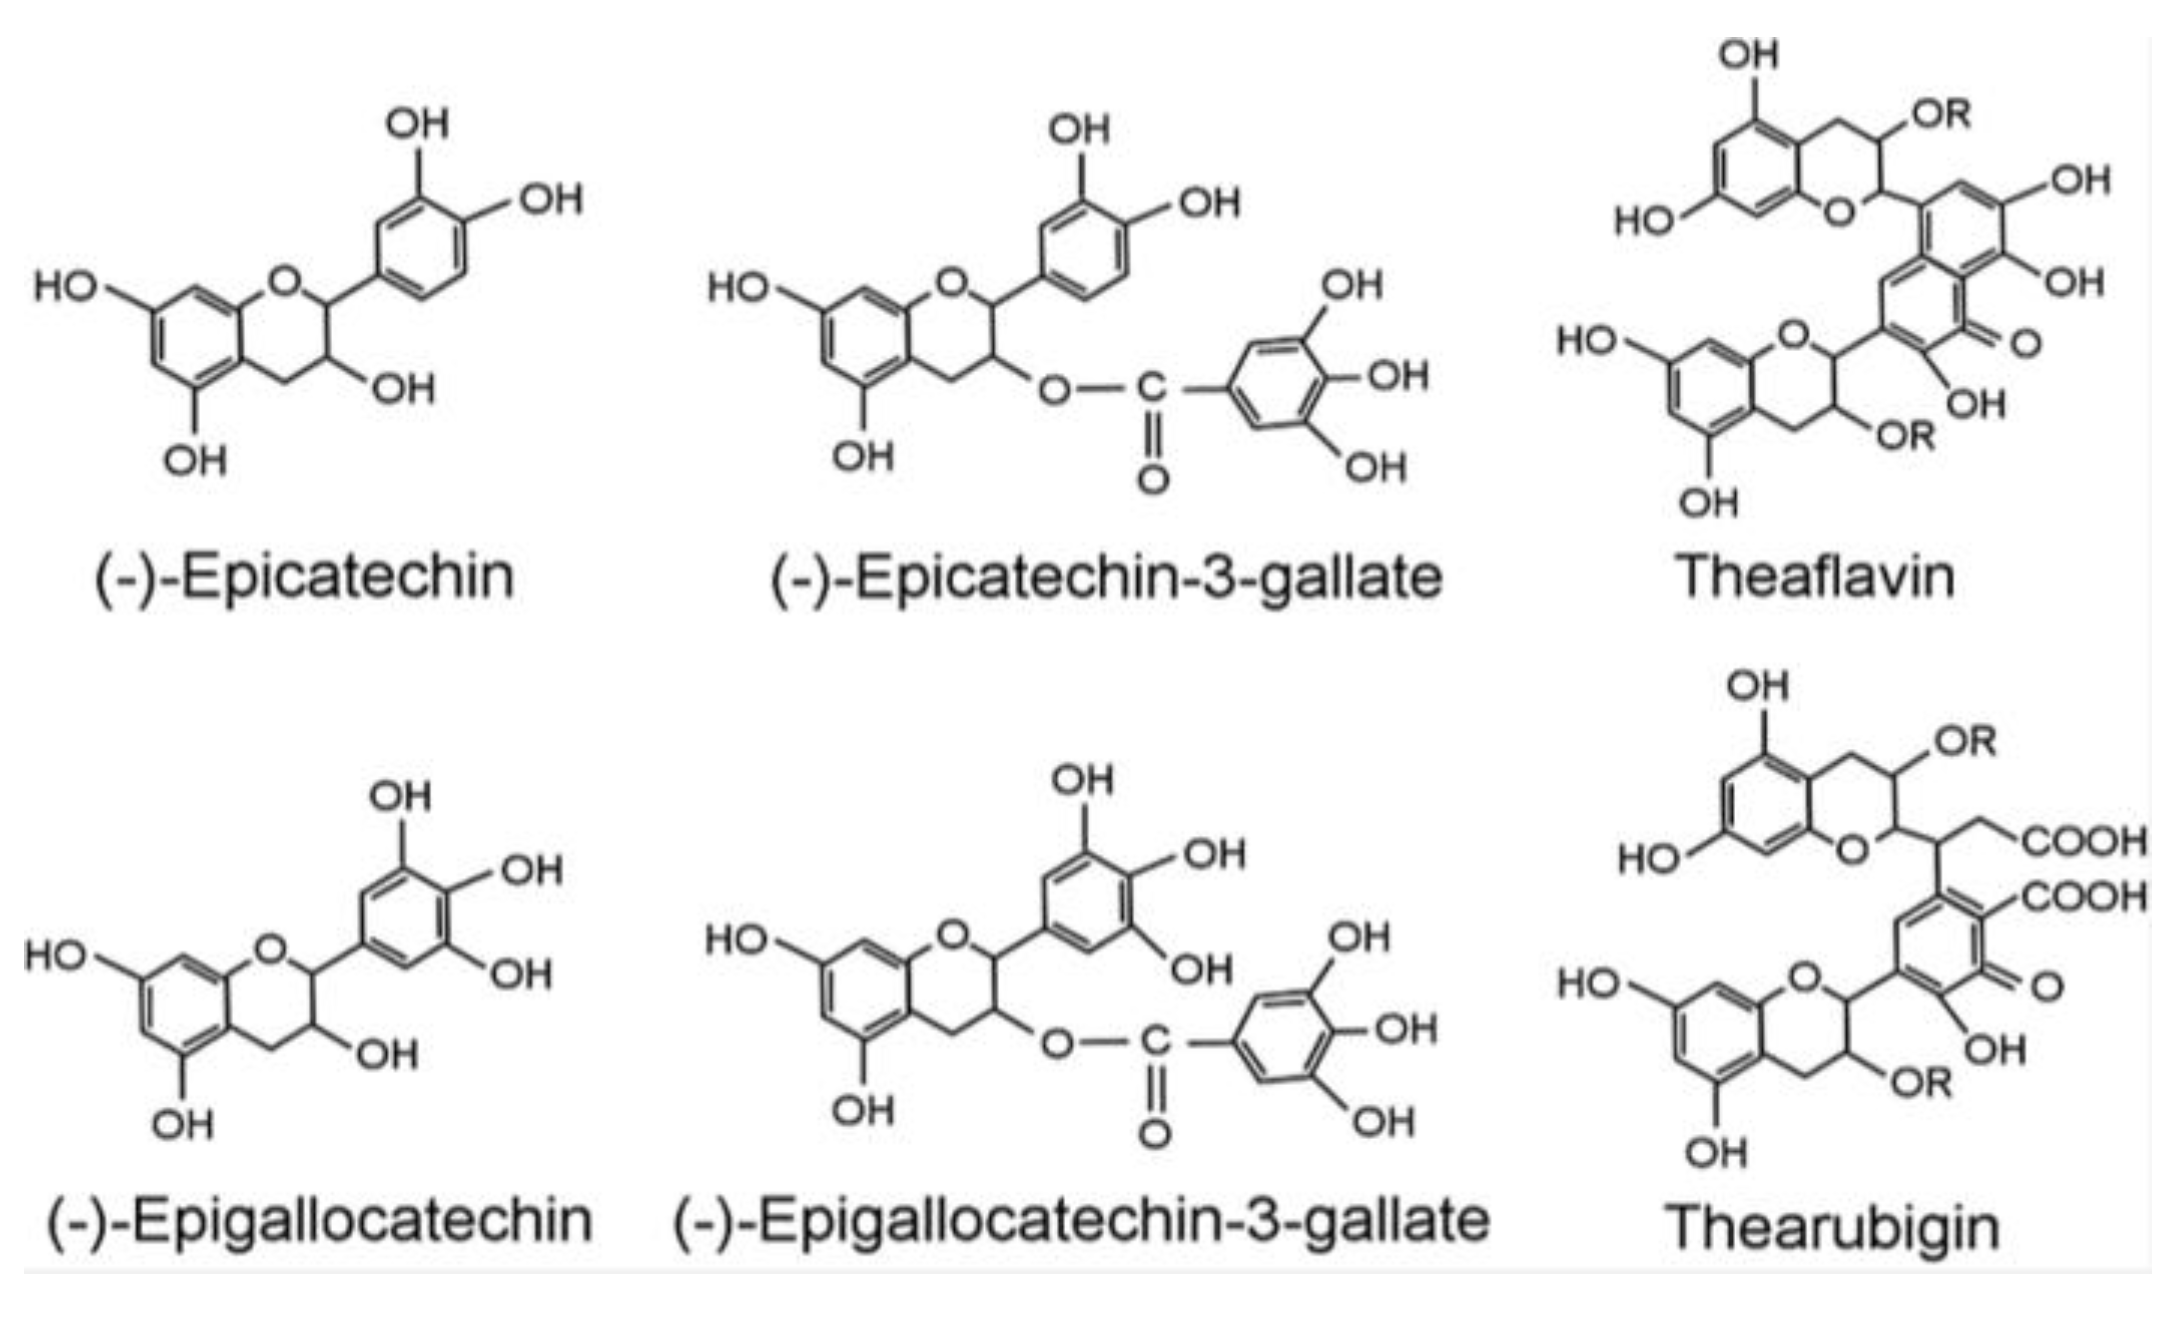
Figure 13.
Green synthesized MnO2 using black and green tea. (a) Rietveld refinement of GT-MnO2 (i) and XRD diffraction pattern of BT-MnO2 (ii) showing much poorer crystallinity. (b) Raman scattering spectra of GT-MnO2 and BT-MnO2 α-phases recorded using a 523 nm laser excitation. (c) Electrochemical properties of MnO2//Li half-cells. Discharge-charge profiles of (i) BT-MnO2 and (ii) GT-MnO2 as positive electrode materials recorded at current density 10 mAg-1 (C/26) in the potential range 1.5-3.5 V vs. Li+/Li0. (iii) Cycling performance cycled at constant current density 20 mAg-1 (≈C/10) in the potential range 1.5-3.5 V vs. Li+/Li0 and Coulombic efficiency of GT-MnO2 and BT-MnO2. Reproduced with permission from [75]. Copyright 2018 Elsevier.
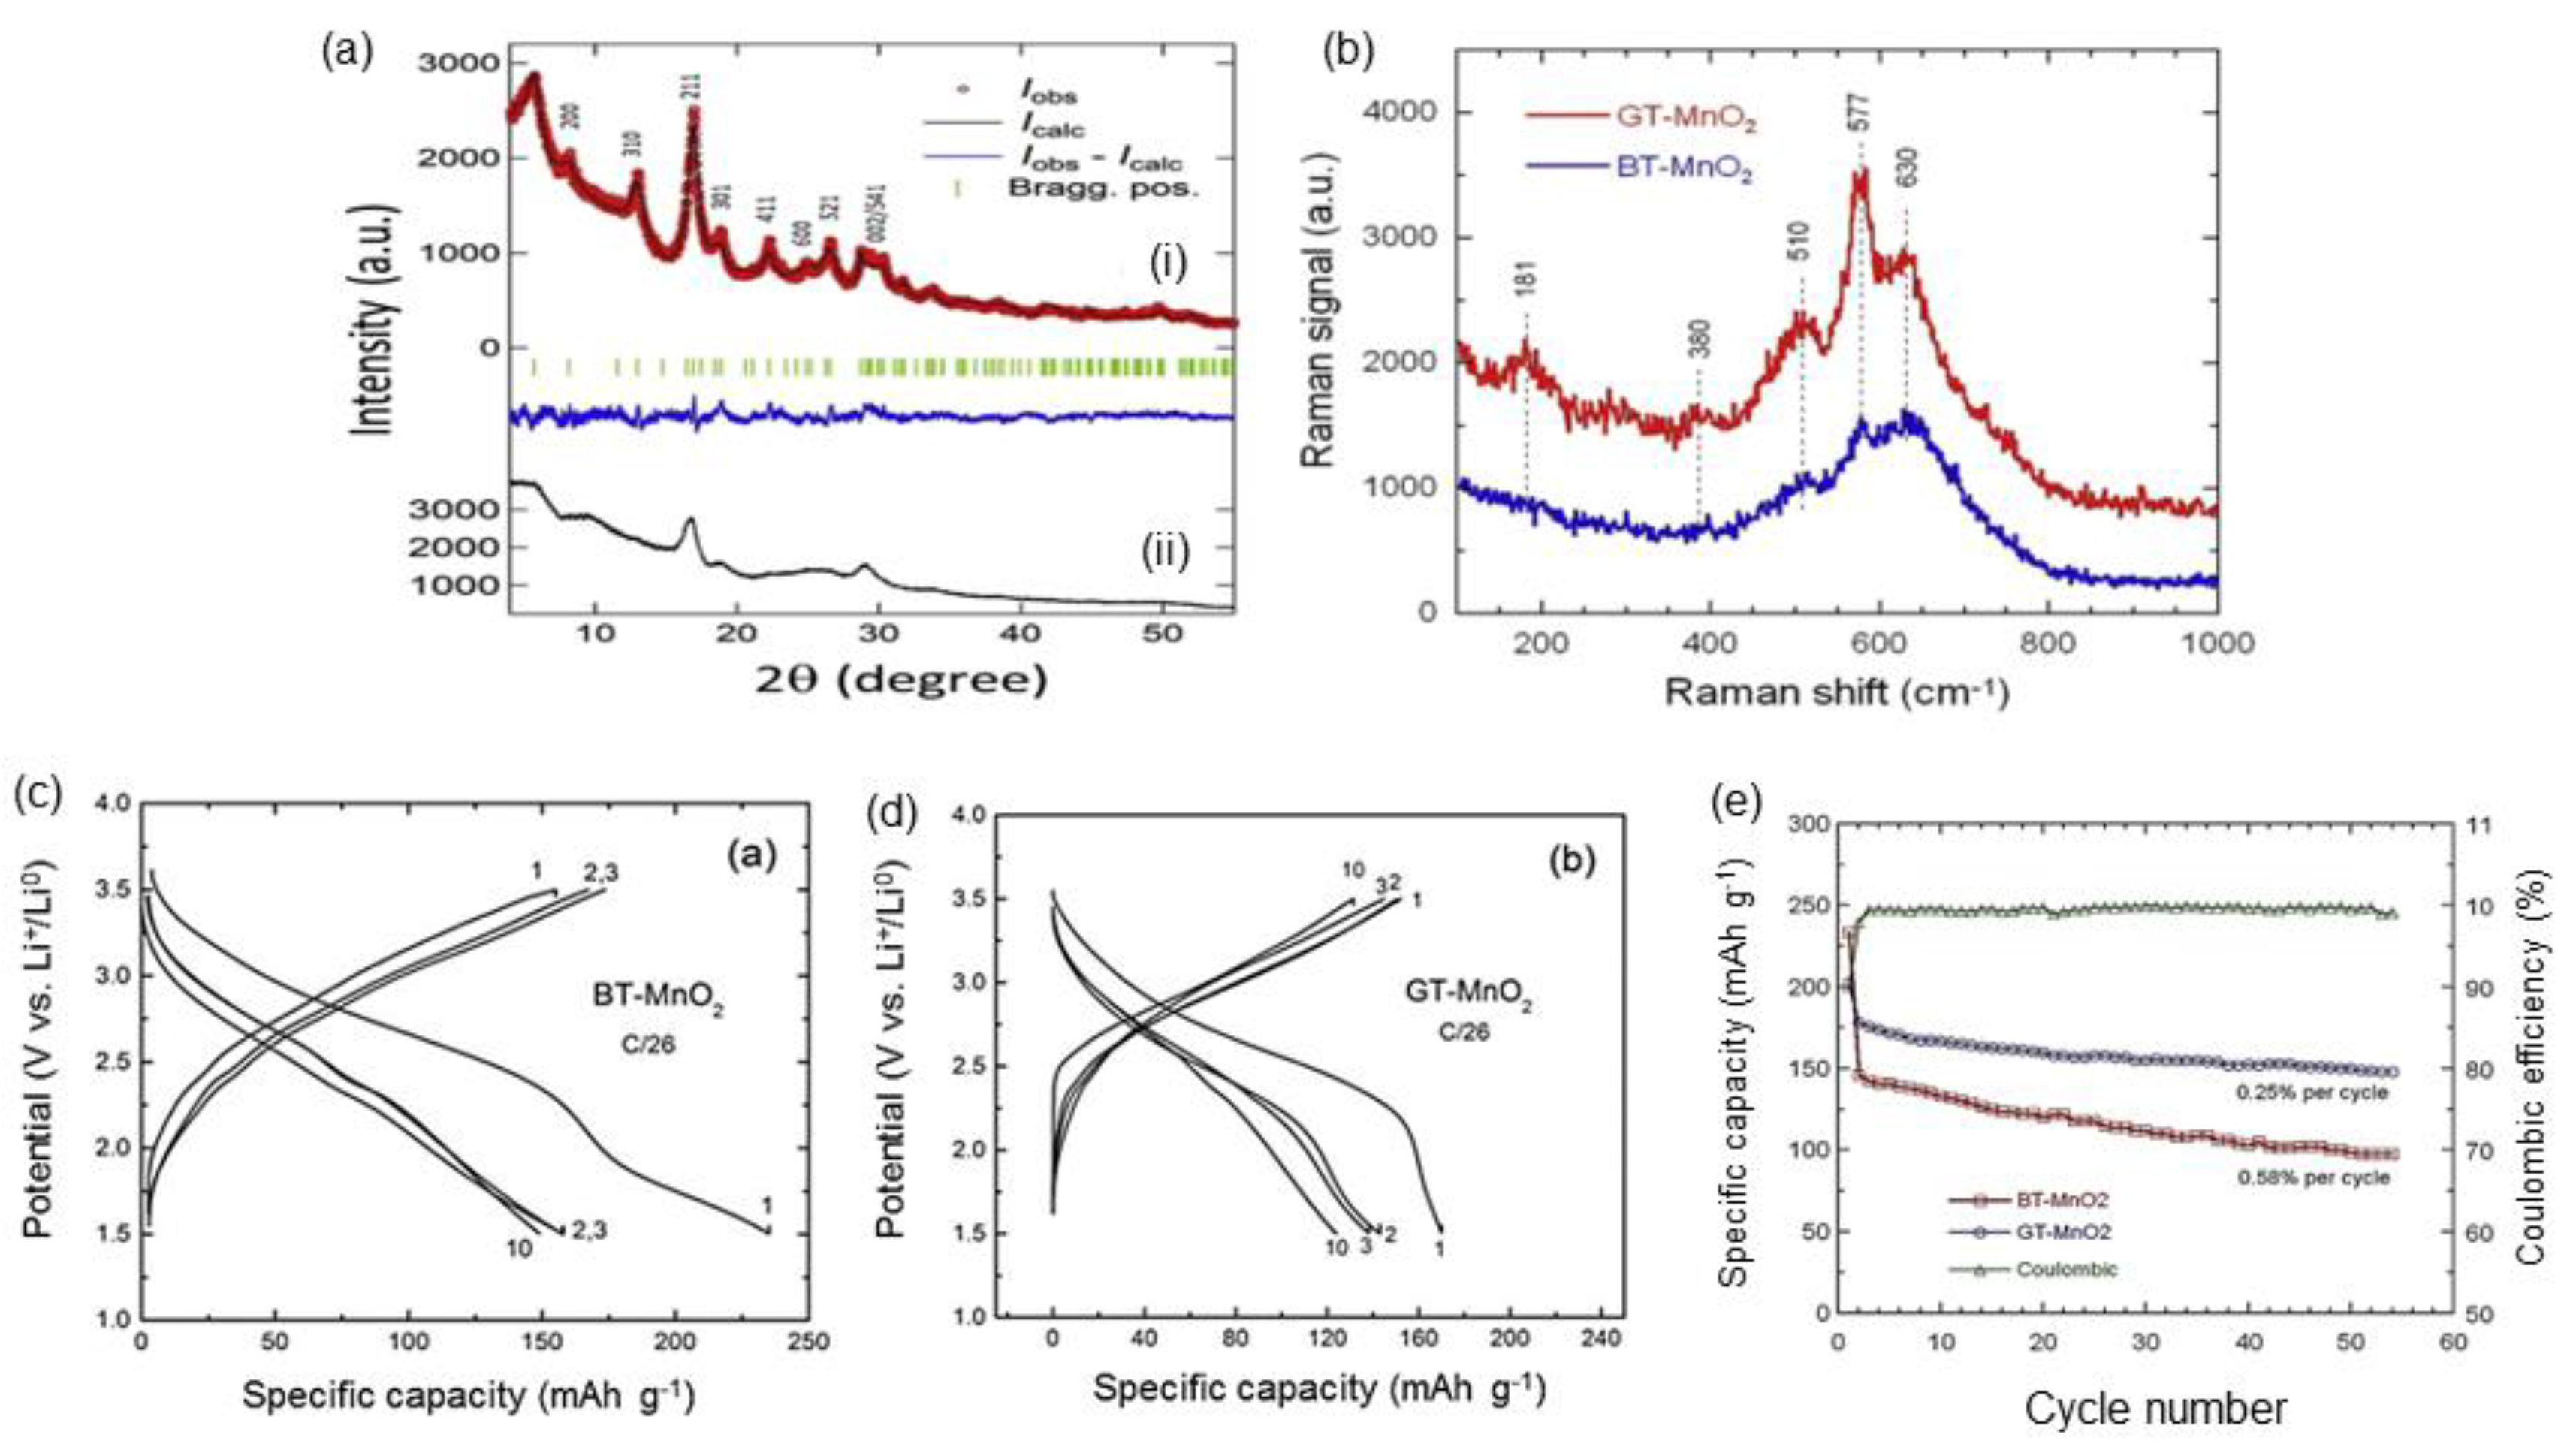
Figure 14.
Broccoli extract's antioxidant species (a) sulforaphane, (b) vitamin coenzyme Q10 and (c)α-lipoic acid. Reproduced from [240]. Copyright 2020 under Creative Commons Attribution (CC BY 4.0) license.
Figure 14.
Broccoli extract's antioxidant species (a) sulforaphane, (b) vitamin coenzyme Q10 and (c)α-lipoic acid. Reproduced from [240]. Copyright 2020 under Creative Commons Attribution (CC BY 4.0) license.
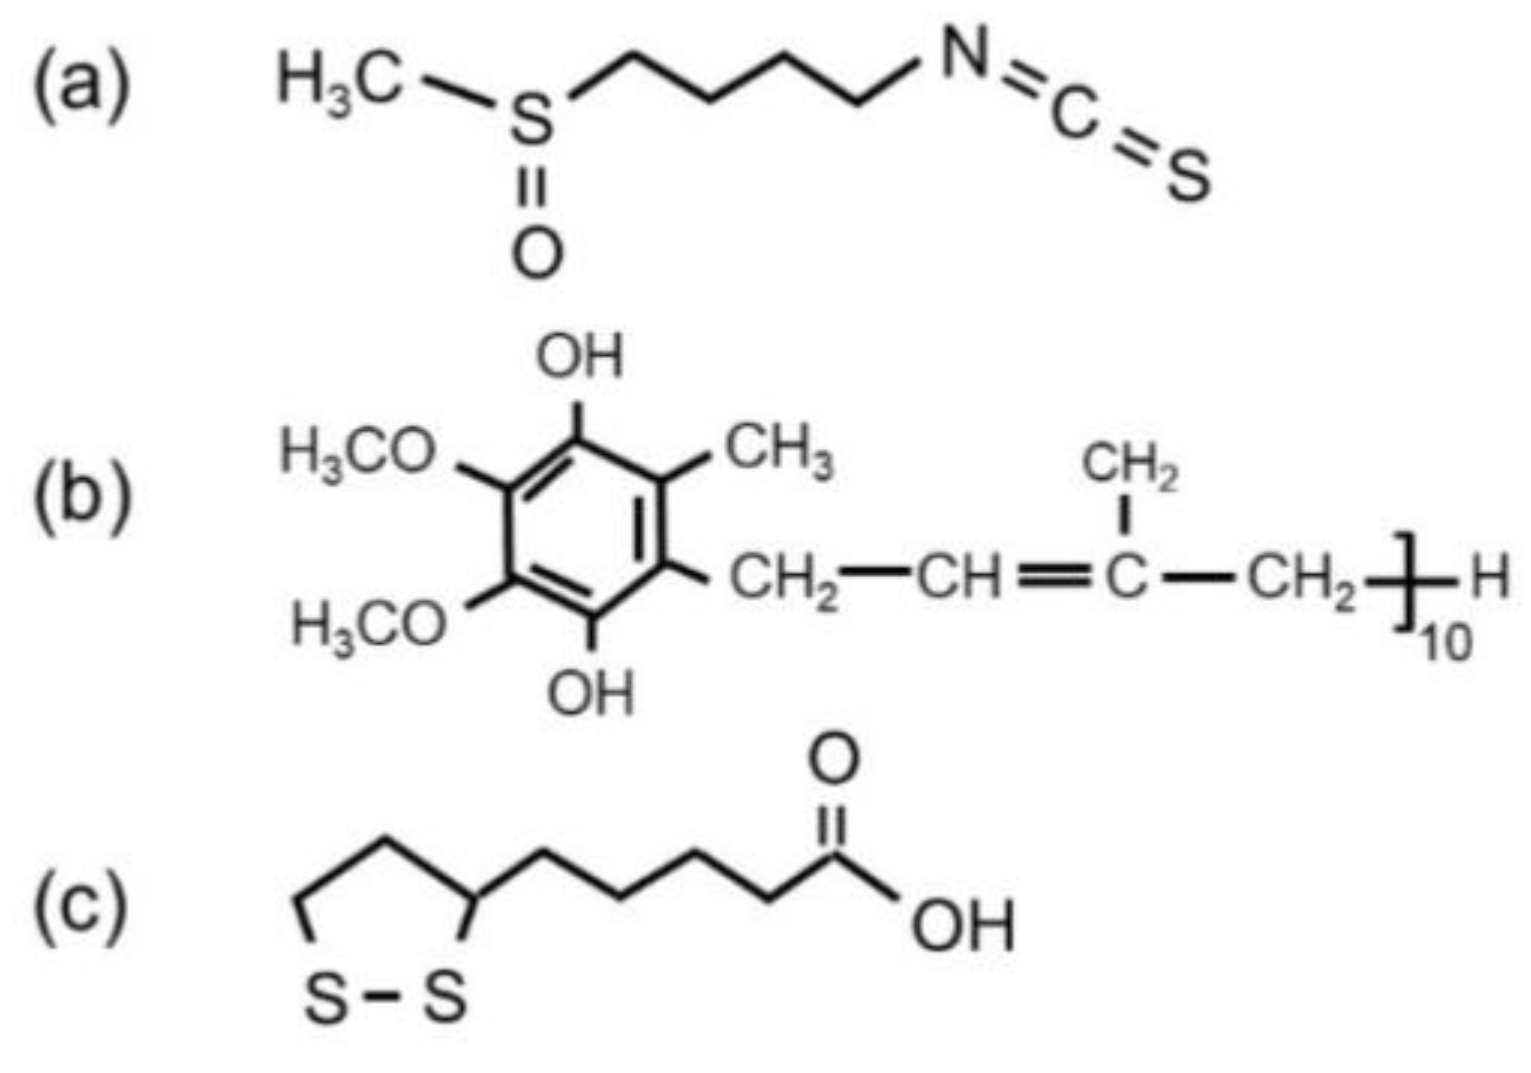
Figure 15.
Green synthesized α-KyMnO2 using broccoli extract. (a) XRD patterns of α-KyMnO2 NPs. (b) N2 adsorption-desorption isotherm of α-KyMnO2 nanoneedles and the pore size distribution (inset). (c) Differential weight dW/dT showing the decomposition temperature from α-KyMnO2 to Mn2O3. (d) Voltage profiles (2nd cycle) of the K0.03MnO2//Li cells at various C-rates. (e) Modified Peukert plot in the range 0.1C to 10C. (f) Cycling stability of the K0.03MnO2//Li cell obtained at 0.1C. Reproduced from [240]. Copyright 2020 under Creative Commons Attribution (CC BY 4.0) license.
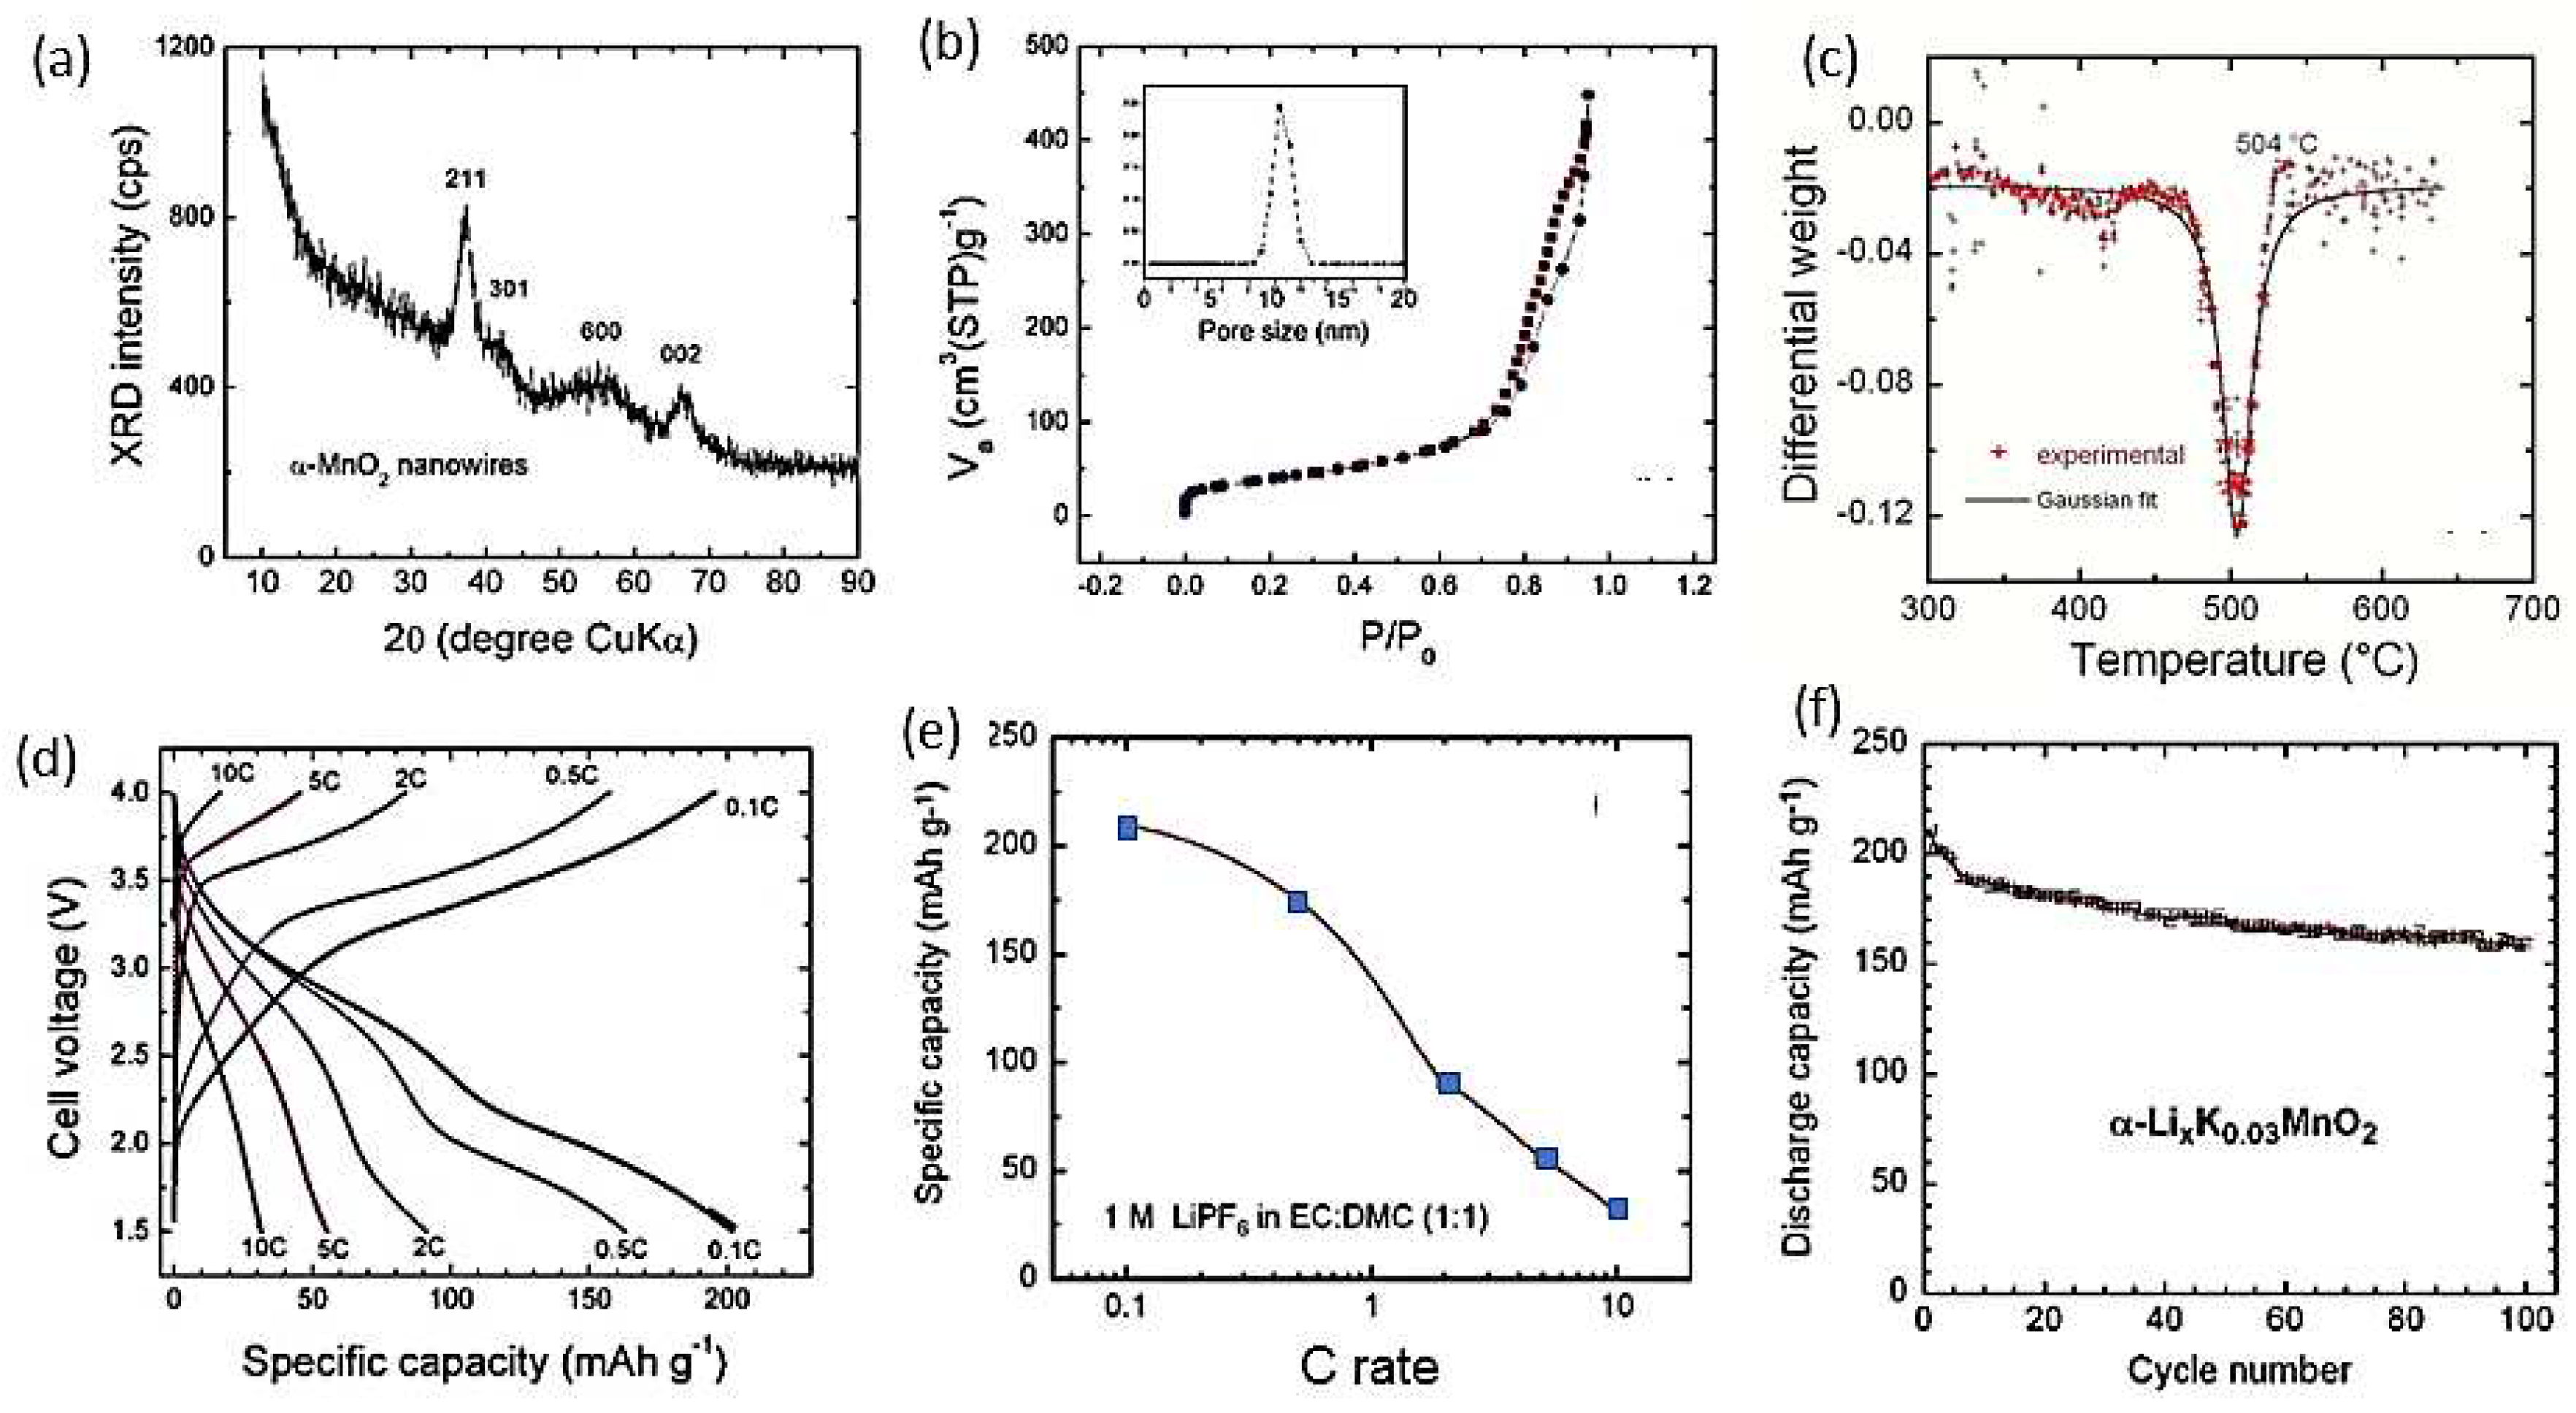
Figure 16.
Green synthesized MnO2 nanoparticles using extracts of orange peel and orange juice. X-ray powder diffraction patterns of (a) OP-MnO2 and (b) OJ-MnO2. (a) and (b) GCD characteristics of the MnO2 in 0.5 mol L-1 Na2SO4 at different current densities for (c) OP-MnO2 and (d) OJ-MnO2. (e) GCD curves at 0.5 A g-1 for both samples. (f) Csp vs. current densities. (g) Cycling stability of OP-MnO2 at 3 A g-1 for 500 cycles. Reproduced with permission from [73]. Copyright 2019 Elsevier.
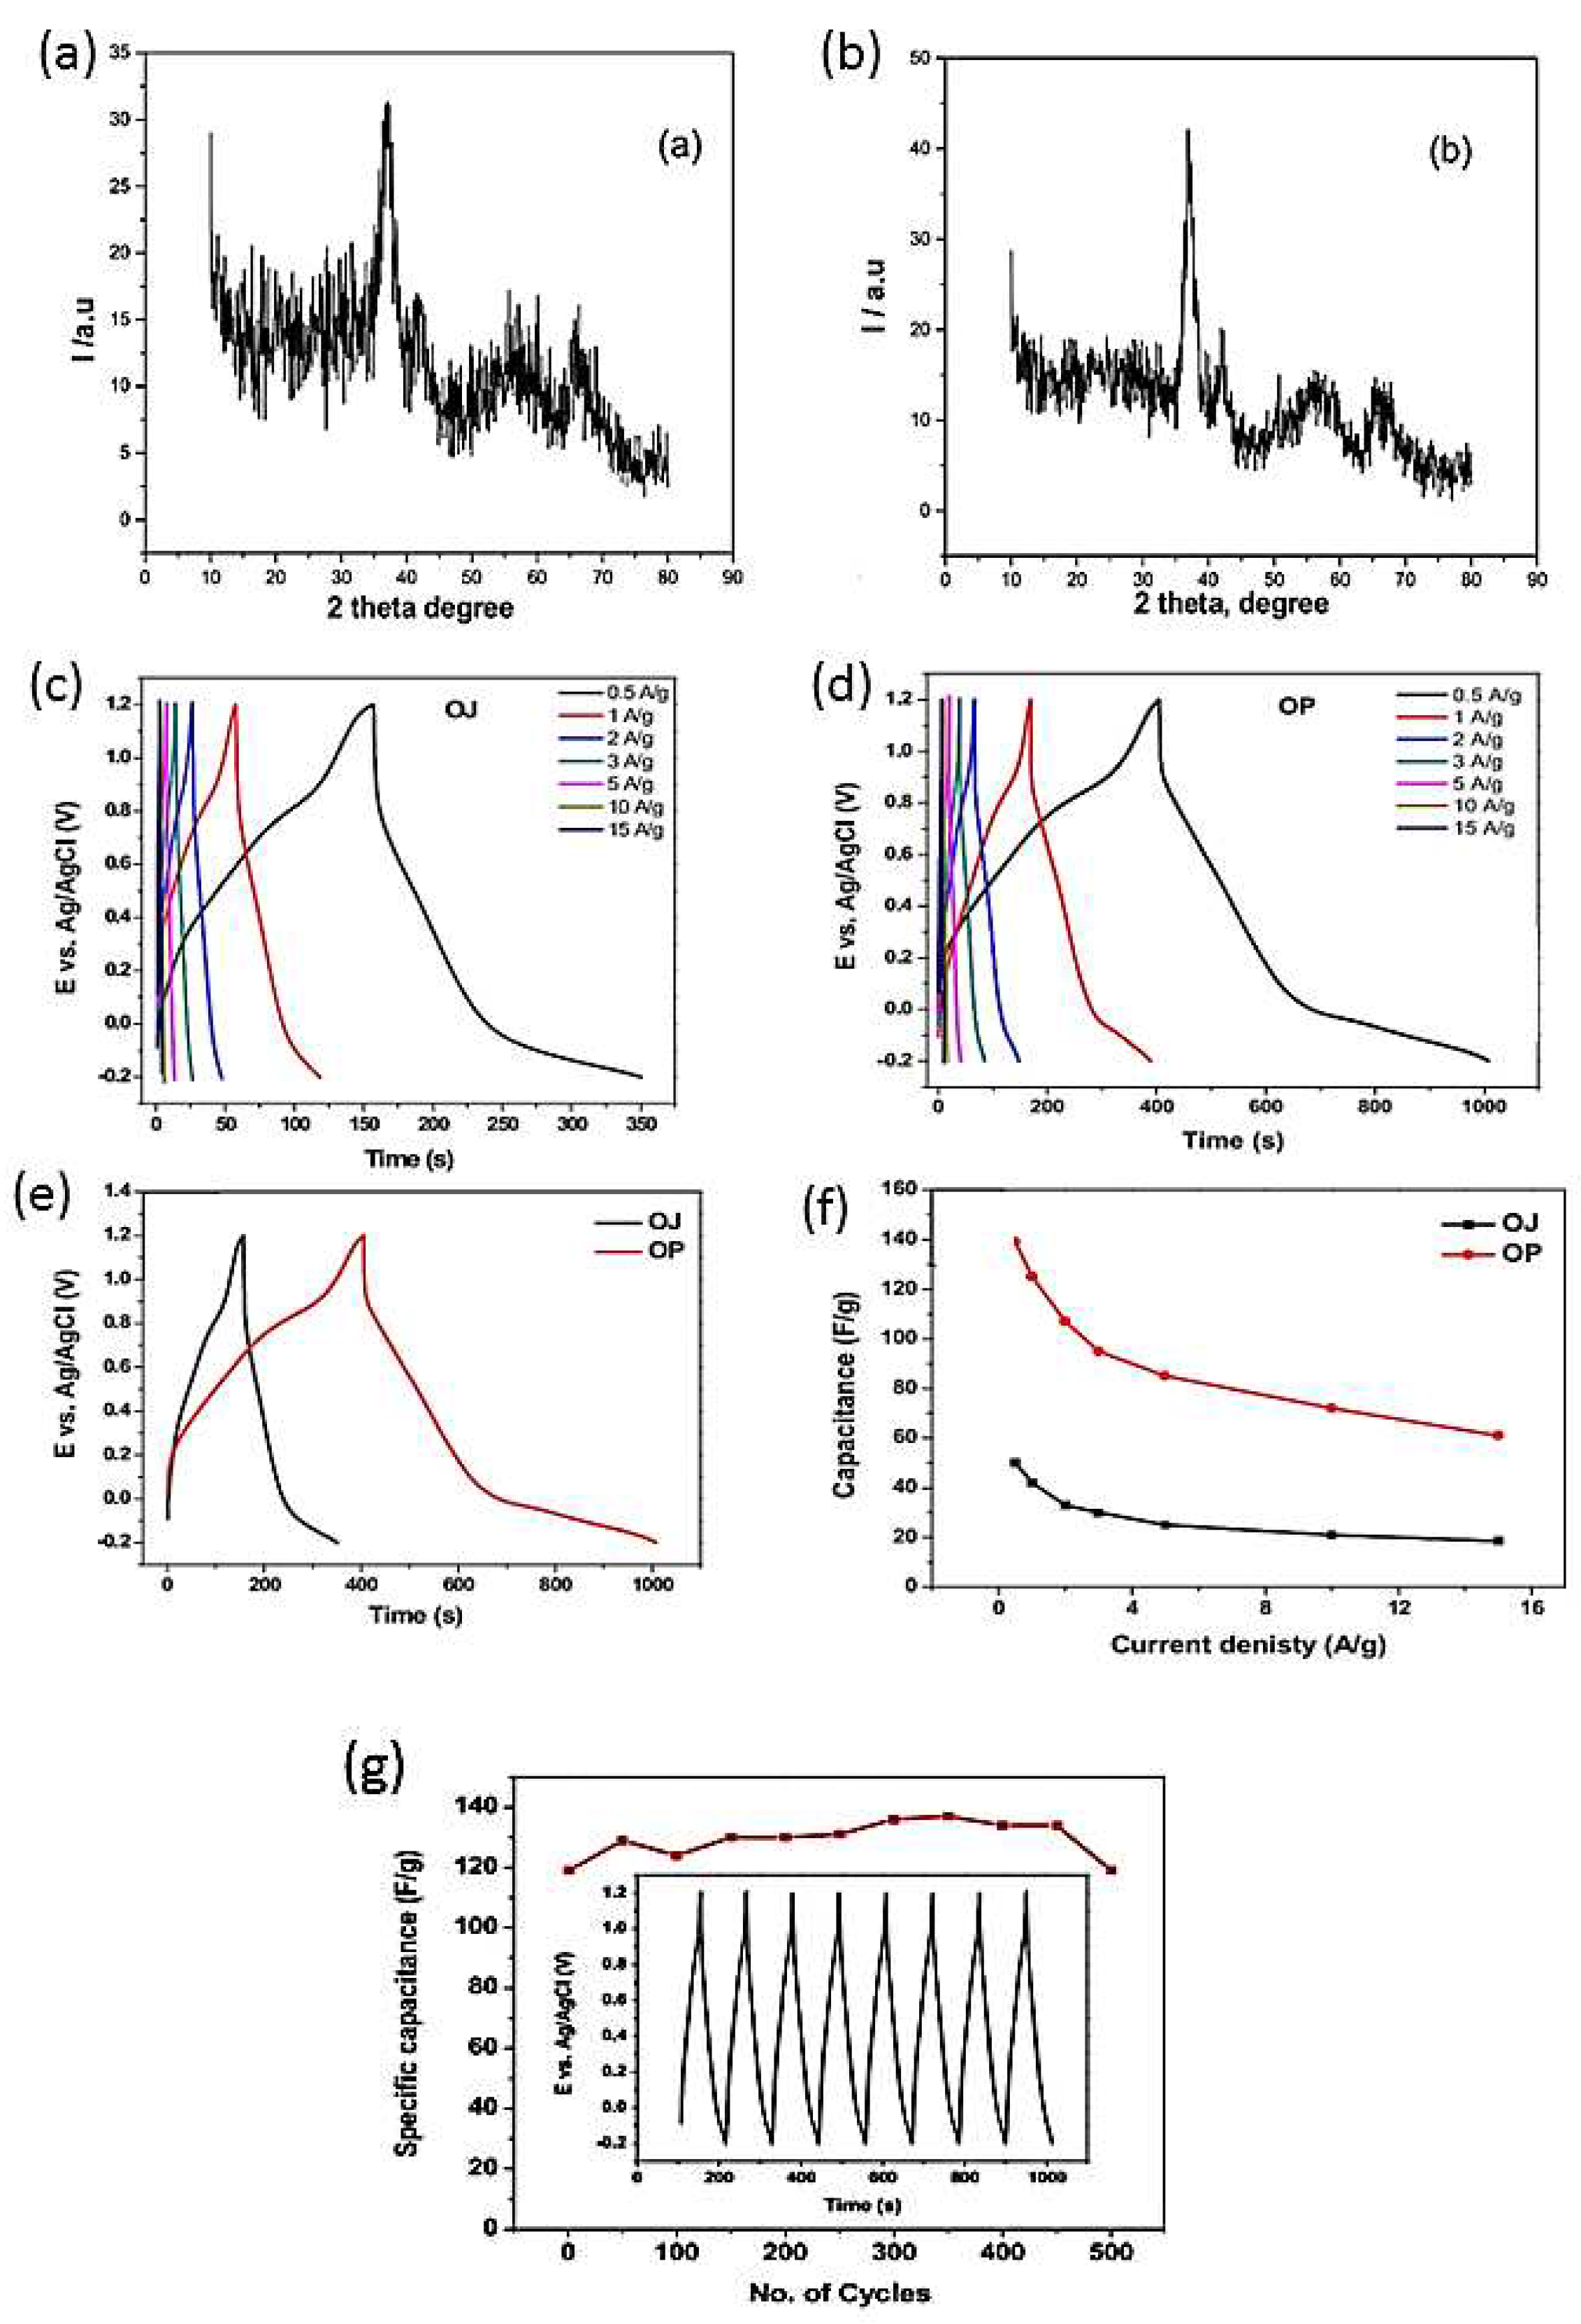
Figure 17.
Green synthesized MnO2 nanoparticles using extracts of Moringa oleifera leaves and extracts of cinnamon. (a) X-ray powder diffraction patterns. (b) determination of the material bandgap using the Kubelka–Munk plot from diffuse reflectance spectra. (c) Evolution of the UV-Vis absorbance of methylene blue dye in presence of M-MnO2. (d) Photodegradation rate (%) of methylene blue (MB) dye on M-MnO2 and C-MnO2 samples under visible light irradiation. (e) Photodegradation rate (%) of Congo red (CR) dye under visible light irradiation. (f) Mechanism of methylene blue and Congo red degradation on α-MnO2 nanoparticles under visible light irradiation Reproduced with permission from [177]. Copyright 2021 Springer.
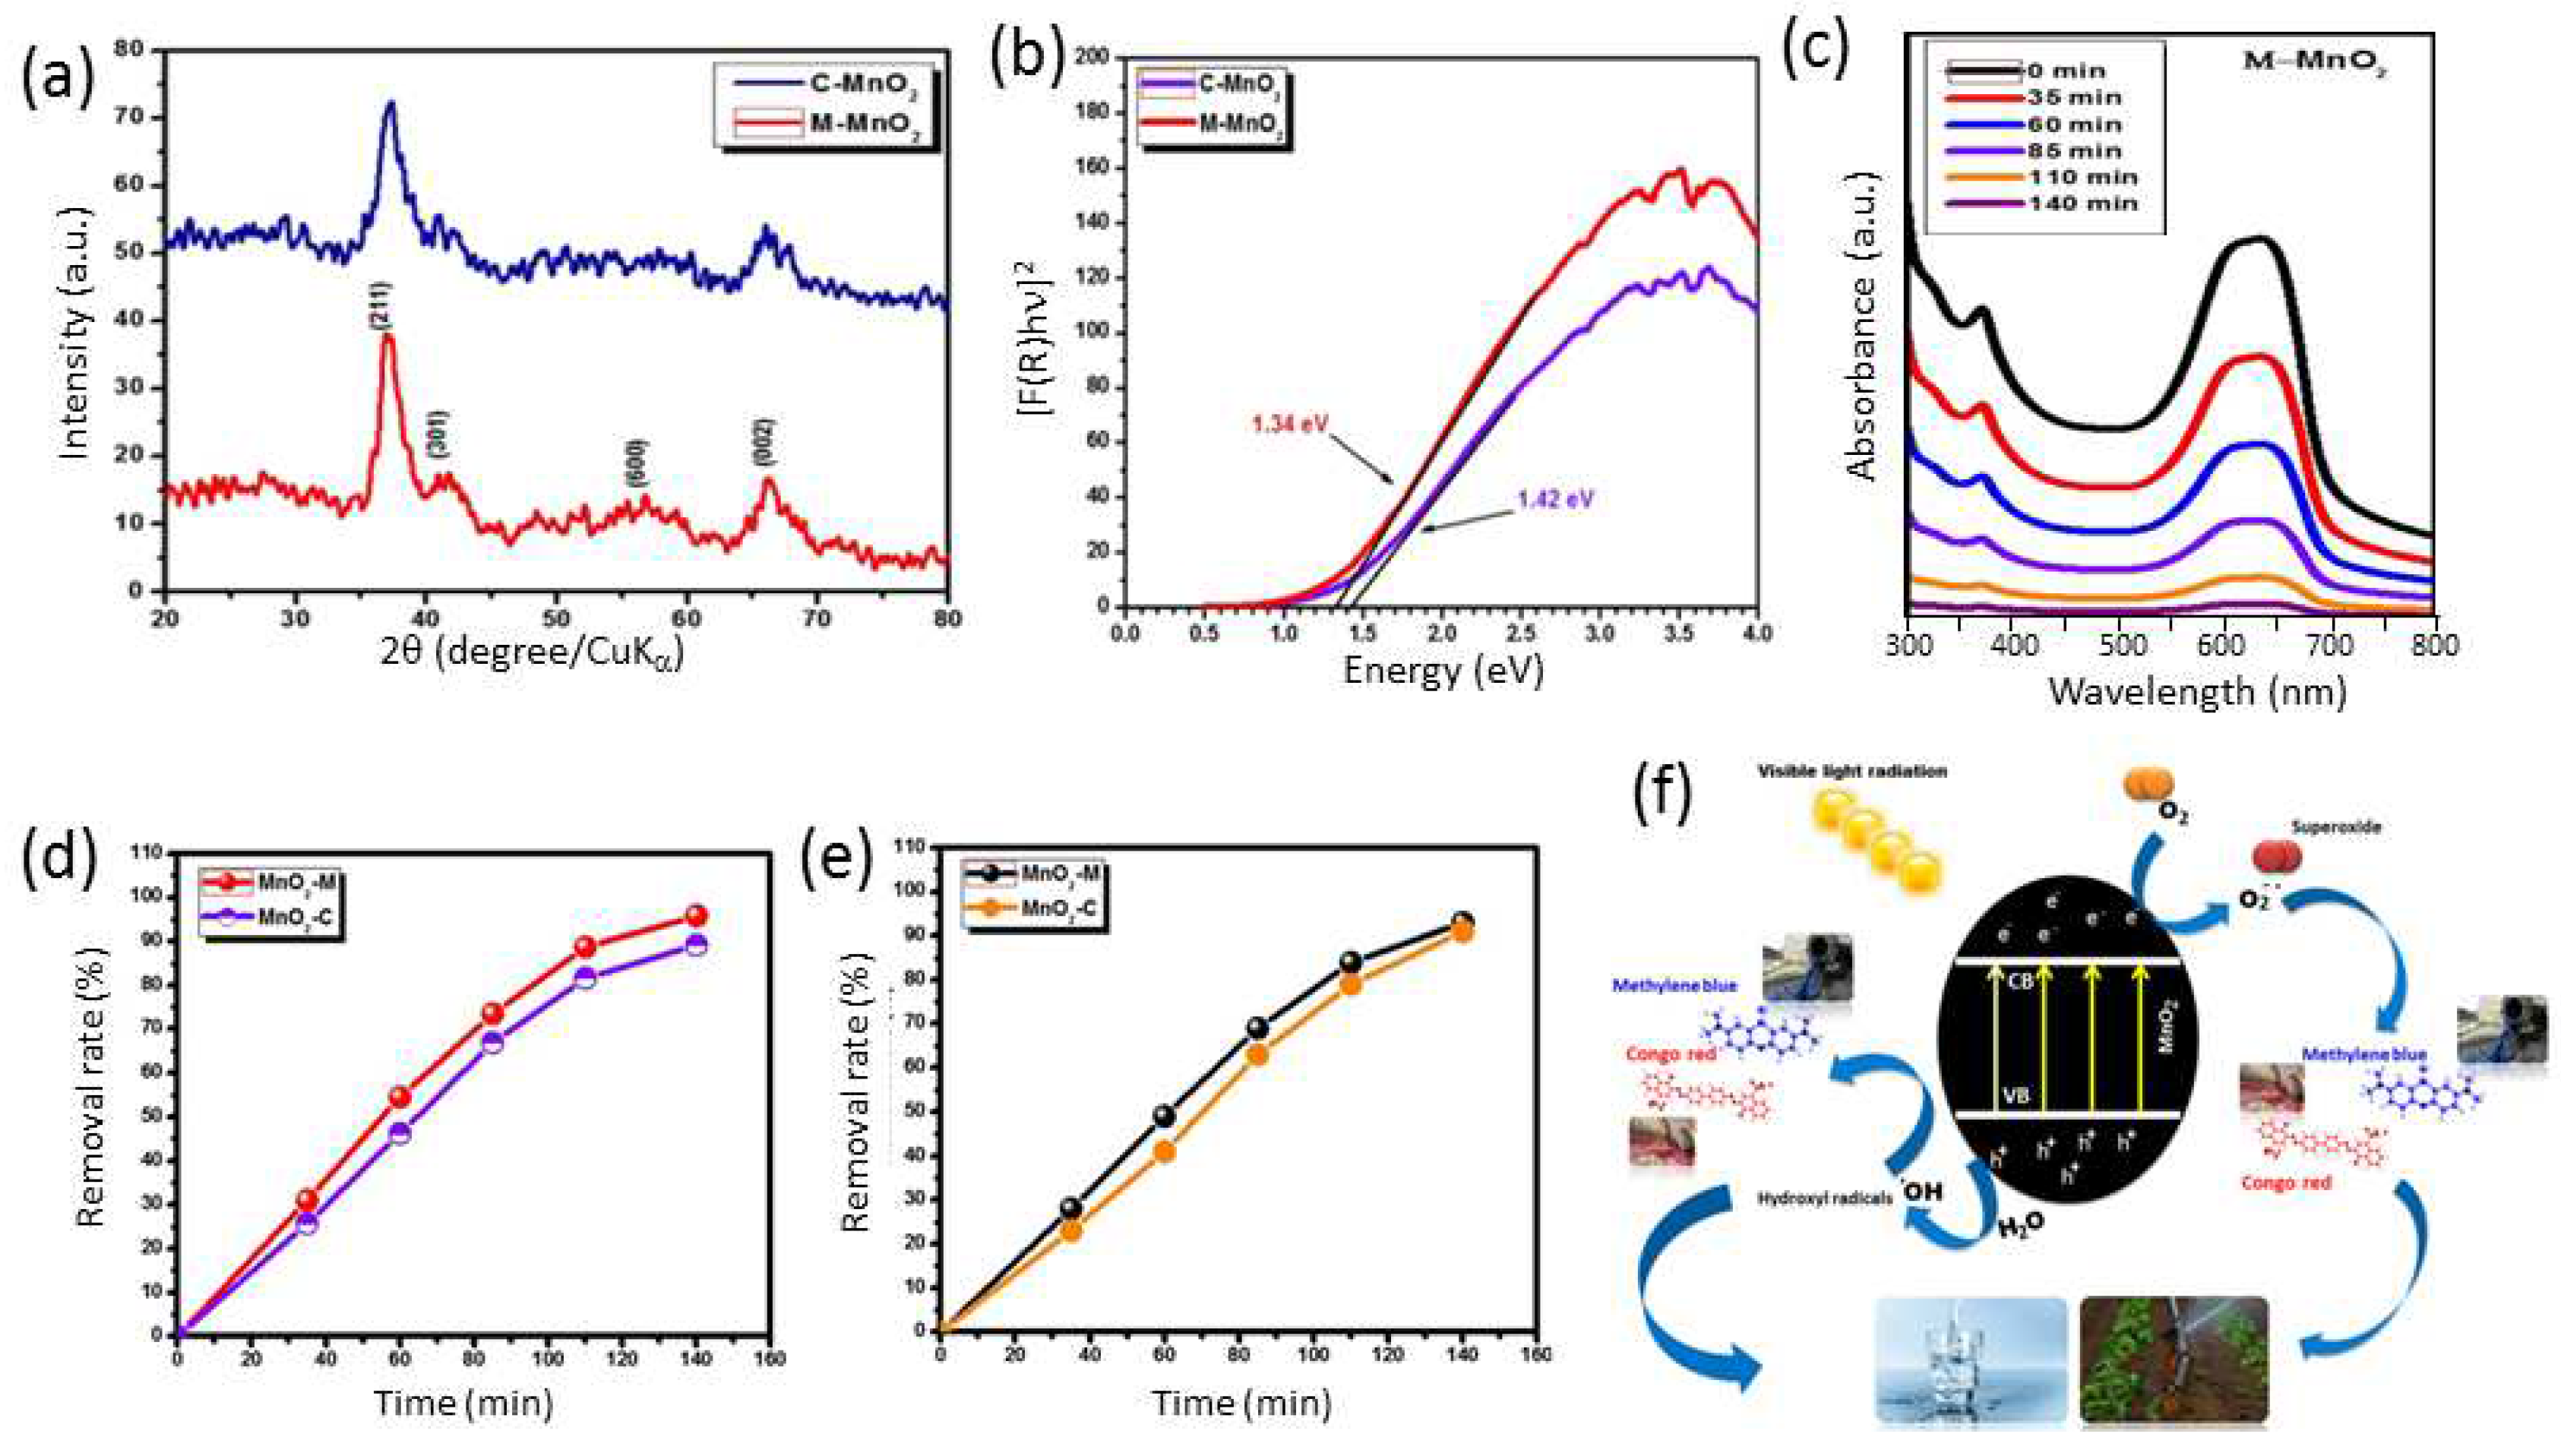
Figure 18.
(a) UV–visible spectrum, and (b) X-ray diffraction pattern of synthesized iron oxide nanoparticles via Echinochloa frumentacea grains extract. Reproduced with permission from [272]. Copyright 2022 Elsevier.
Figure 18.
(a) UV–visible spectrum, and (b) X-ray diffraction pattern of synthesized iron oxide nanoparticles via Echinochloa frumentacea grains extract. Reproduced with permission from [272]. Copyright 2022 Elsevier.
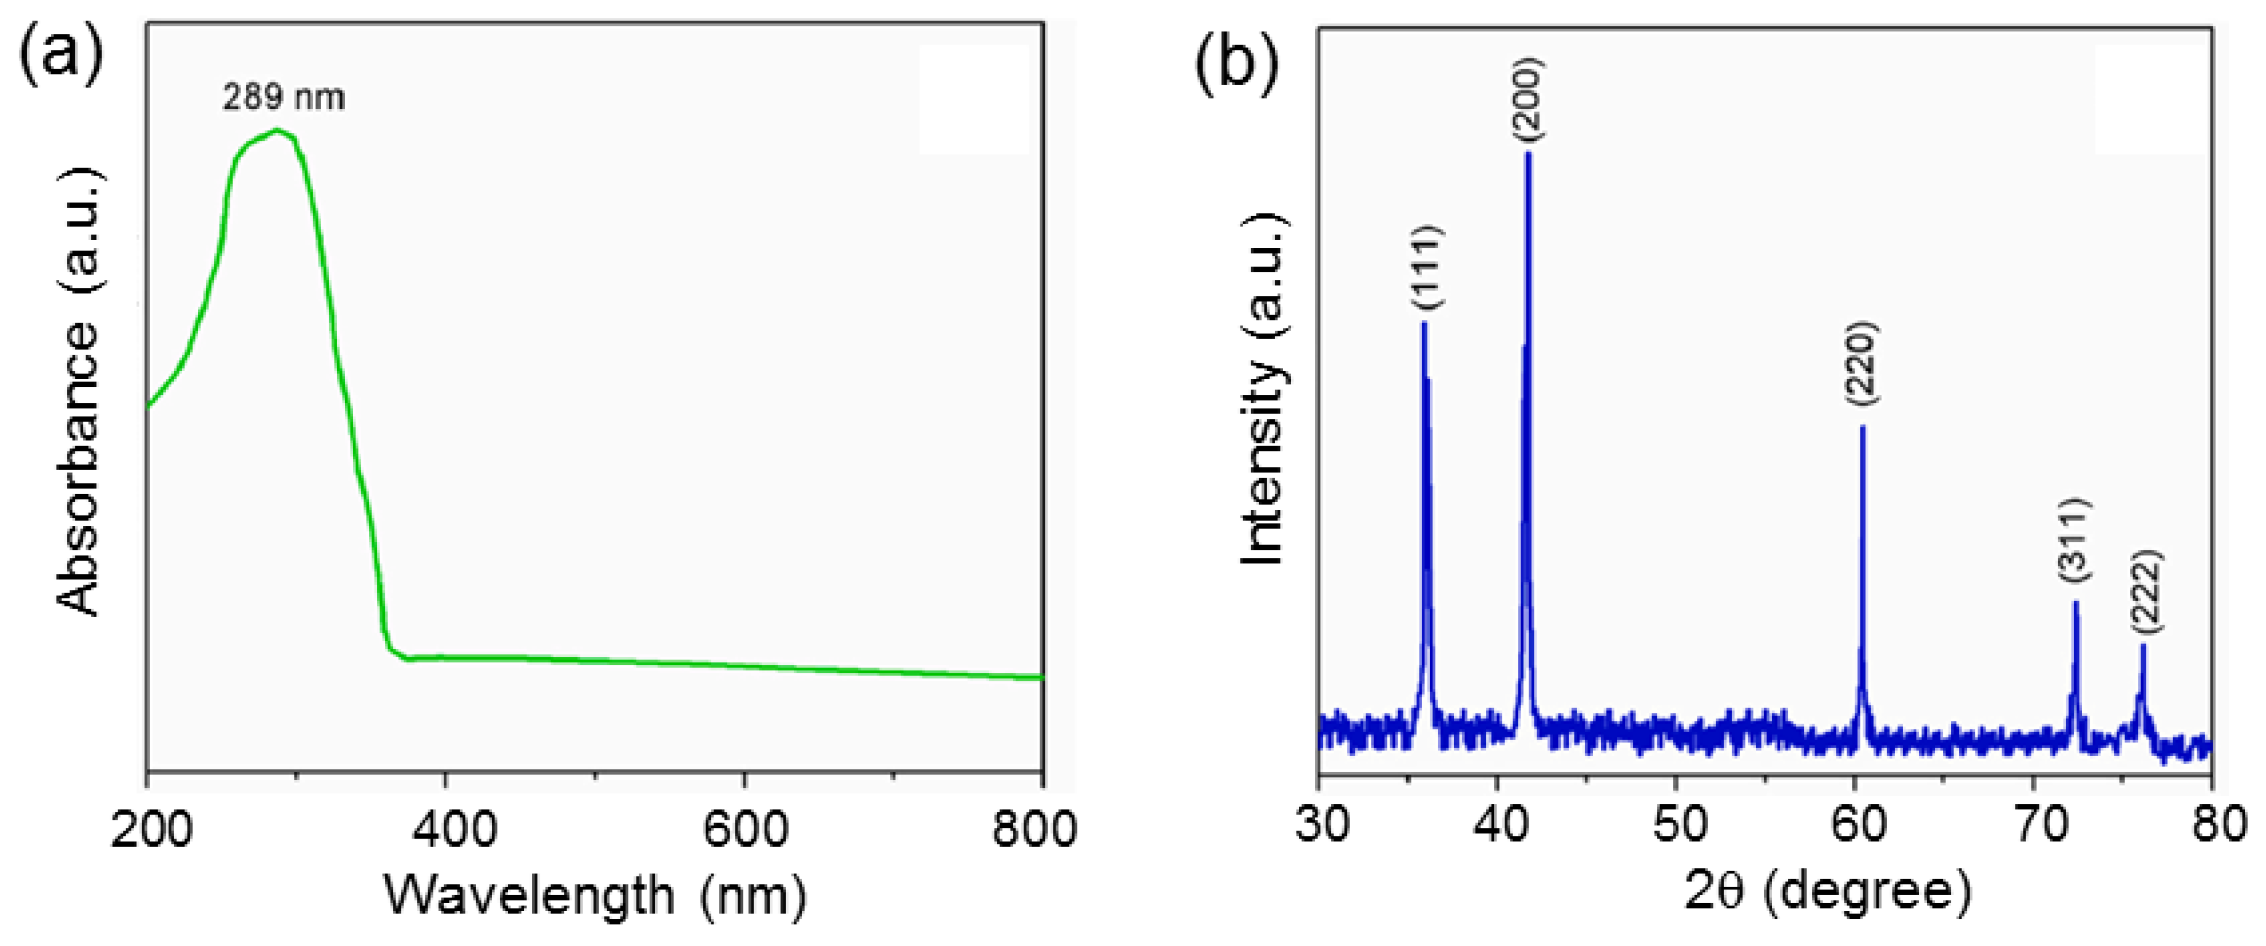
Figure 19.
(a) XRD pattern and (b) SEM image of Fe3O4 nanoparticles synthesized using Caricaya papaya leaf extract. Reproduced from [278]. Copyright 2014 under the Creative Commons Attribution (CC BY 4.0) license.
Figure 19.
(a) XRD pattern and (b) SEM image of Fe3O4 nanoparticles synthesized using Caricaya papaya leaf extract. Reproduced from [278]. Copyright 2014 under the Creative Commons Attribution (CC BY 4.0) license.
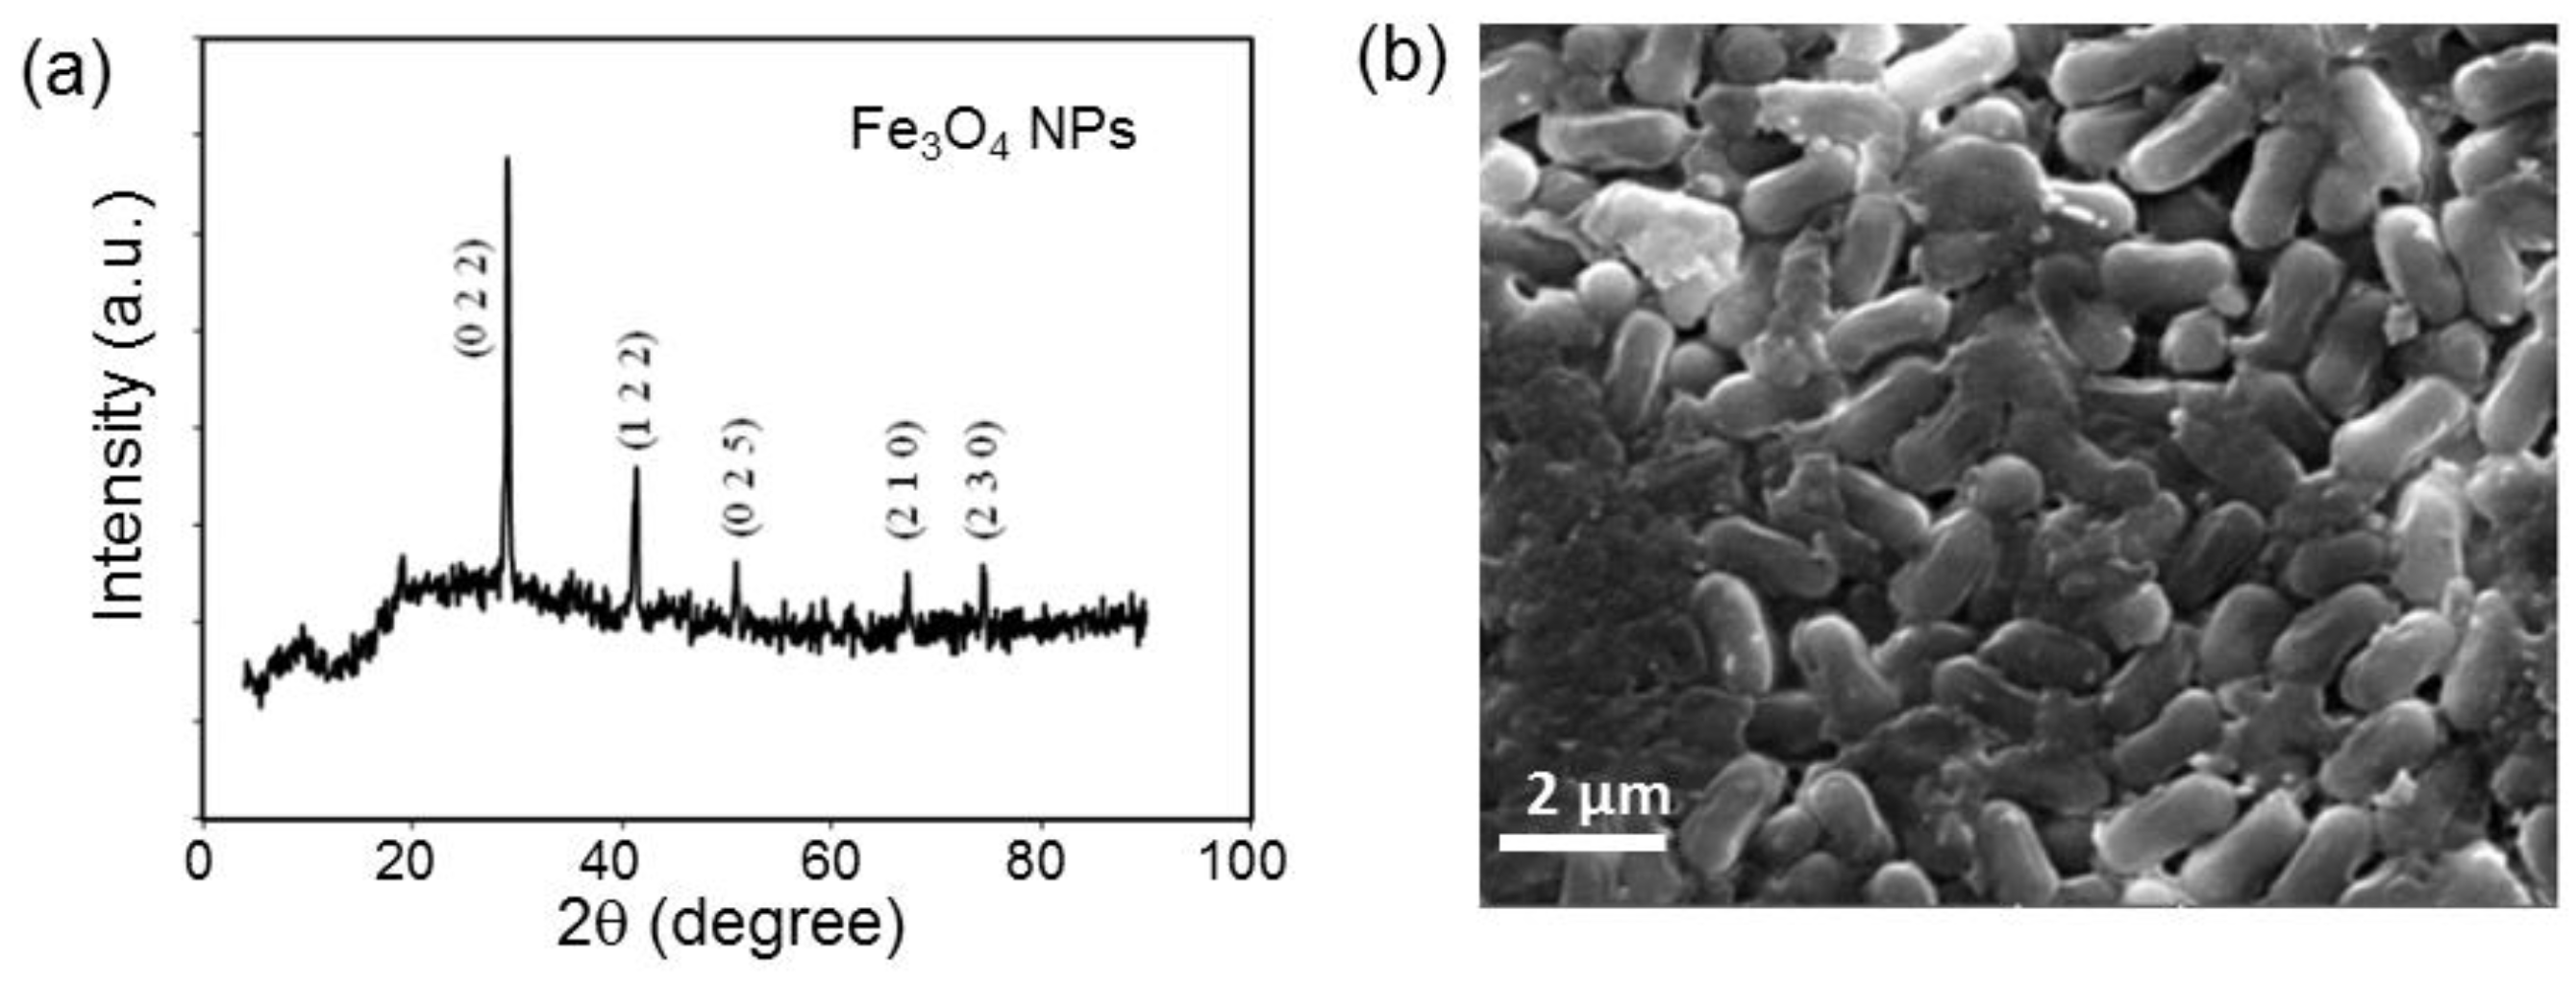
Figure 20.
Activities of synthesized iron oxide nanoparticles via Echinochloa frumentacea grains extract as (a) antioxidant, (b) anti-inflammatory and (c) anti-diabetic. Reproduced with permission from [272]. Copyright 2022 Elsevier.
Figure 20.
Activities of synthesized iron oxide nanoparticles via Echinochloa frumentacea grains extract as (a) antioxidant, (b) anti-inflammatory and (c) anti-diabetic. Reproduced with permission from [272]. Copyright 2022 Elsevier.
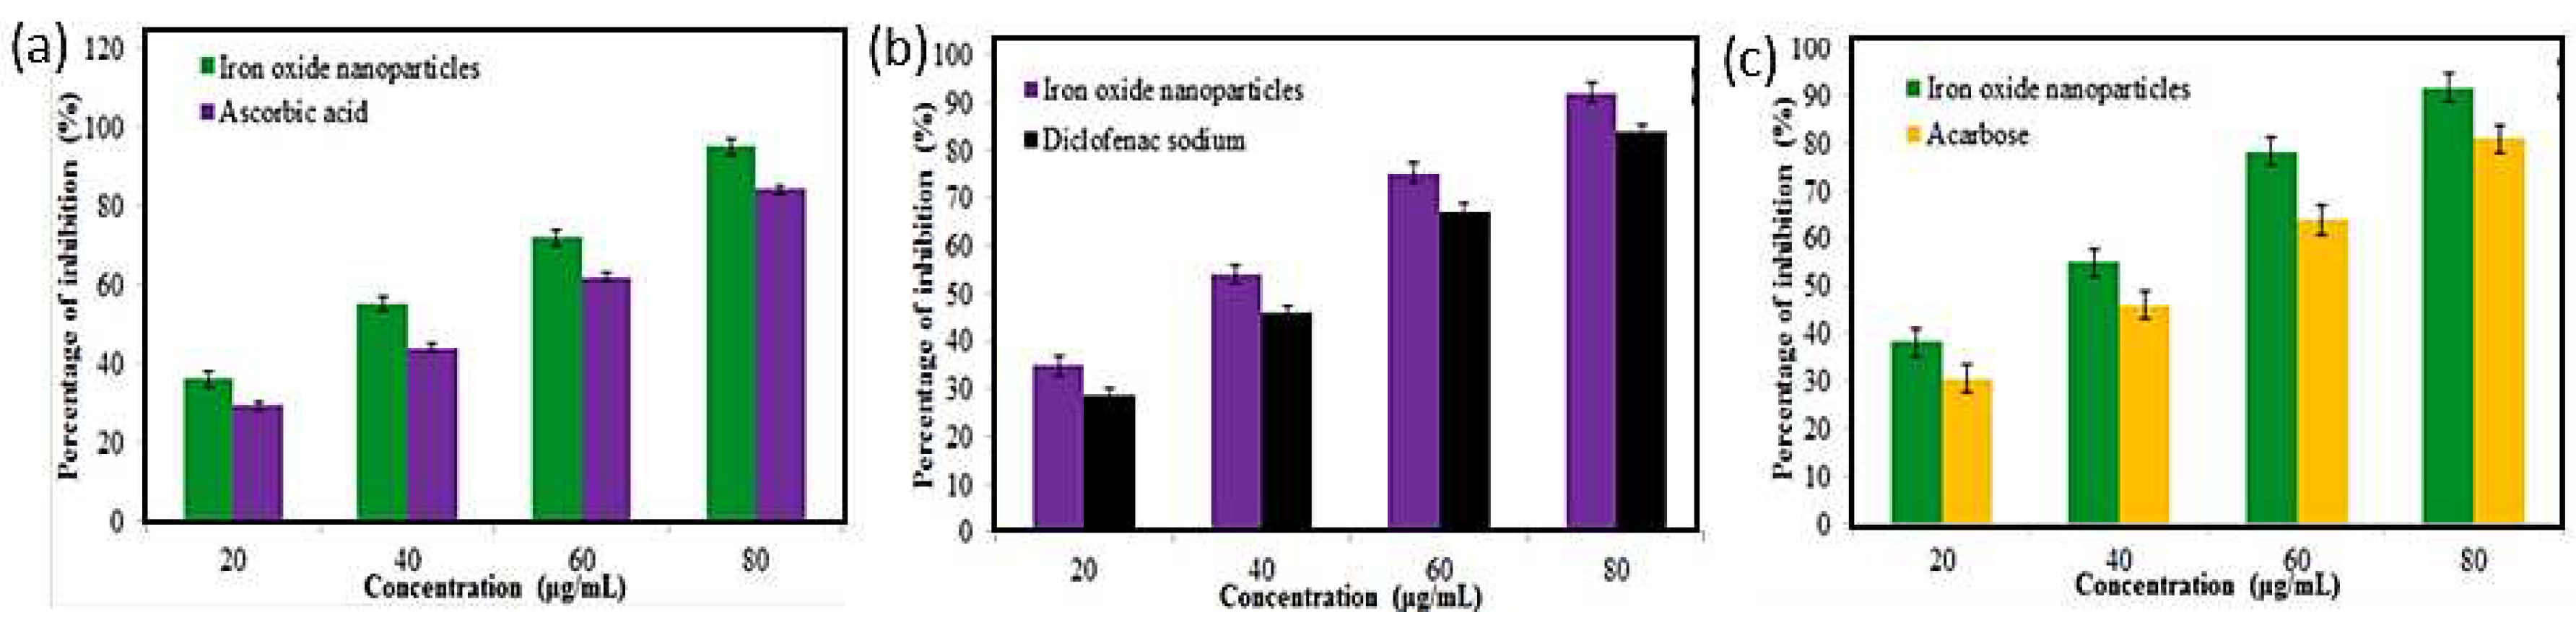
Figure 21.
(a) Absorption spectra of Ag NPs, aqueous AgNO3 and ginger rhizome extract in water. Inset shows the colors of aqueous AgNO3, ginger extract, and ginger extract + AgNO3 at 10 and 20 min time intervals. (b) X-ray diffraction pattern of synthesized silver nanoparticles prepared at pH = 10. Reproduced with permission from [289]. Copyright 2021 Elsevier.
Figure 22.
Silver nanoparticles effectively inhibit extracellular SARS-CoV-2.3A. Schematic representation of (a) virus pre-treatment assay, (b) cell post-treatment assay and (c) cell pre-treatment assay. Reproduced with permission from [302]. Copyright 2020 Elsevier.
Figure 22.
Silver nanoparticles effectively inhibit extracellular SARS-CoV-2.3A. Schematic representation of (a) virus pre-treatment assay, (b) cell post-treatment assay and (c) cell pre-treatment assay. Reproduced with permission from [302]. Copyright 2020 Elsevier.
Figure 23.
Suggested anticancer mechanisms of Au NPs. Reproduced from [336]. Copyright 2021 under Creative Commons Attribution (CC BY) license.
Figure 23.
Suggested anticancer mechanisms of Au NPs. Reproduced from [336]. Copyright 2021 under Creative Commons Attribution (CC BY) license.

Table 1.
Crystallographic data of α-, β-, γ-, δ-, λ-MnO2.
| Crystal structure | α-MnO2 | β-MnO2 | γ-MnO2 | δ-MnO2 | λ-MnO2 |
|---|---|---|---|---|---|
| Chemical name Crystal structure Lattice paramter (Å) Tunnel Tunnel size (Å) |
hollandite tetragonal a = 9.96 c = 2.85 (2×2) 4.6 |
pyrolisite tetragonal a = 4.39 c = 2.87 (1×1) 1.89 |
nsutite intergrowth a= 9.65 c = 4.43 (1×1), (1×2) 1.82, 2.3 |
birnessite rhombohedral ahex = 2.94 chex = 21.86 interlayer distance 7.0 |
spinel cubic a= 8.04 - - |
Disclaimer/Publisher’s Note: The statements, opinions and data contained in all publications are solely those of the individual author(s) and contributor(s) and not of MDPI and/or the editor(s). MDPI and/or the editor(s) disclaim responsibility for any injury to people or property resulting from any ideas, methods, instructions or products referred to in the content. |
© 2023 by the authors. Licensee MDPI, Basel, Switzerland. This article is an open access article distributed under the terms and conditions of the Creative Commons Attribution (CC BY) license (https://creativecommons.org/licenses/by/4.0/).
Copyright: This open access article is published under a Creative Commons CC BY 4.0 license, which permit the free download, distribution, and reuse, provided that the author and preprint are cited in any reuse.


