1. Introduction
Water is considered as a key natural resource that is vital to all life and the socioeconomic growth of every nation [
1]. The increasing pressure on water and the environment, as a result of the rapid expansion of population around the world is becoming an issue of great concern [
2]. Water use among sectors is occasionally competitive in terms of quantity and quality due to its non-uniform distribution and availability [
3]. Agriculture is the key contender among different users since it consumes a significant percentage of freshwater to provide a secure food supply for the ever-increasing population. Consequently, the agricultural sector needs special consideration and scientific research on how to increase its output [
1,
4].
Worldwide inefficient water use wastes a significant amount of water, which is already scarce. Particularly, the careless use of it for agriculture is making the water deficit worse in many places. This poor use of water is leading to a greater than necessary increase in fresh water withdrawals and could result in unneeded competition between various industries. The introduction and use of new and existing technology to optimize water use efficiency in the agricultural sector, which uses a significant amount of fresh water, is one of the alternatives that can address these issues [
5].
Optimizing water use in agriculture involves balancing the crop's need for water with the amount of water that is actually applied to the crop. Achieving adequate water management is necessary to maximize yield production and water use efficiency. Deficit irrigation and alternate irrigation, along with other irrigation forms, can increase water use effectiveness. Due to their affordability and technical simplicity, the technologies can also be used by commercial farmlands and individual farmers. However, the crop water requirement and crop coefficient—two highly important parameters—are necessary for the application of these technologies. These variables play a major role in every irrigation and drainage design strategy. Therefore, establishing these parameters in areas with potential for irrigation, such as central Ethiopia, will be useful in maximizing water use efficiency [
6,
7].
Wheat (
Triticum aestivum L.) has served as the staple diet for most major civilizations around the world [
8]. Based on grain acres, it is the most significant grain in the world, and it comes in second place in terms of overall output volume. It is also a crucial source of calories for humans. Hence, the population numbers of different regions are showing rapid growth, and wheat is one of the major crops in the food chain system, the desire to enhance its productivity is becoming the first priority of different organizations and agricultural firms. In the Ethiopian context, wheat (
Triticum aestivum L.) is one of the major cereal food crops grown. Covering about 13.25% of the total cultivated area under grain crops, wheat is the fourth most important crop in area coverage, following Tef, maize, and sorghum [
3].
Numerous studies have shown that, when it comes to irrigated crop production, knowing the exact quantity of crop water requirements during the crop growing season and the crop coefficient for a specific growth stage is crucial for proper planning and management of irrigation [
3,
9,
10,
11]. Currently, irrigated wheat production is given the highest priority in Ethiopia. However, there is a lack of site- and crop- specific data needed for planning and management of irrigated wheat crops. Thus, field measurement-based determination of the crop water requirement (ETc) and crop coefficient (kc) of wheat (
Triticum aestivum L.) is urgently needed. Therefore, the purpose of this study was to determine the water requirement and crop coefficient of the wheat crop under central Ethiopia (Bishoftu) conditions.
2. Materials and Methods
2.1. Description of the Study Area
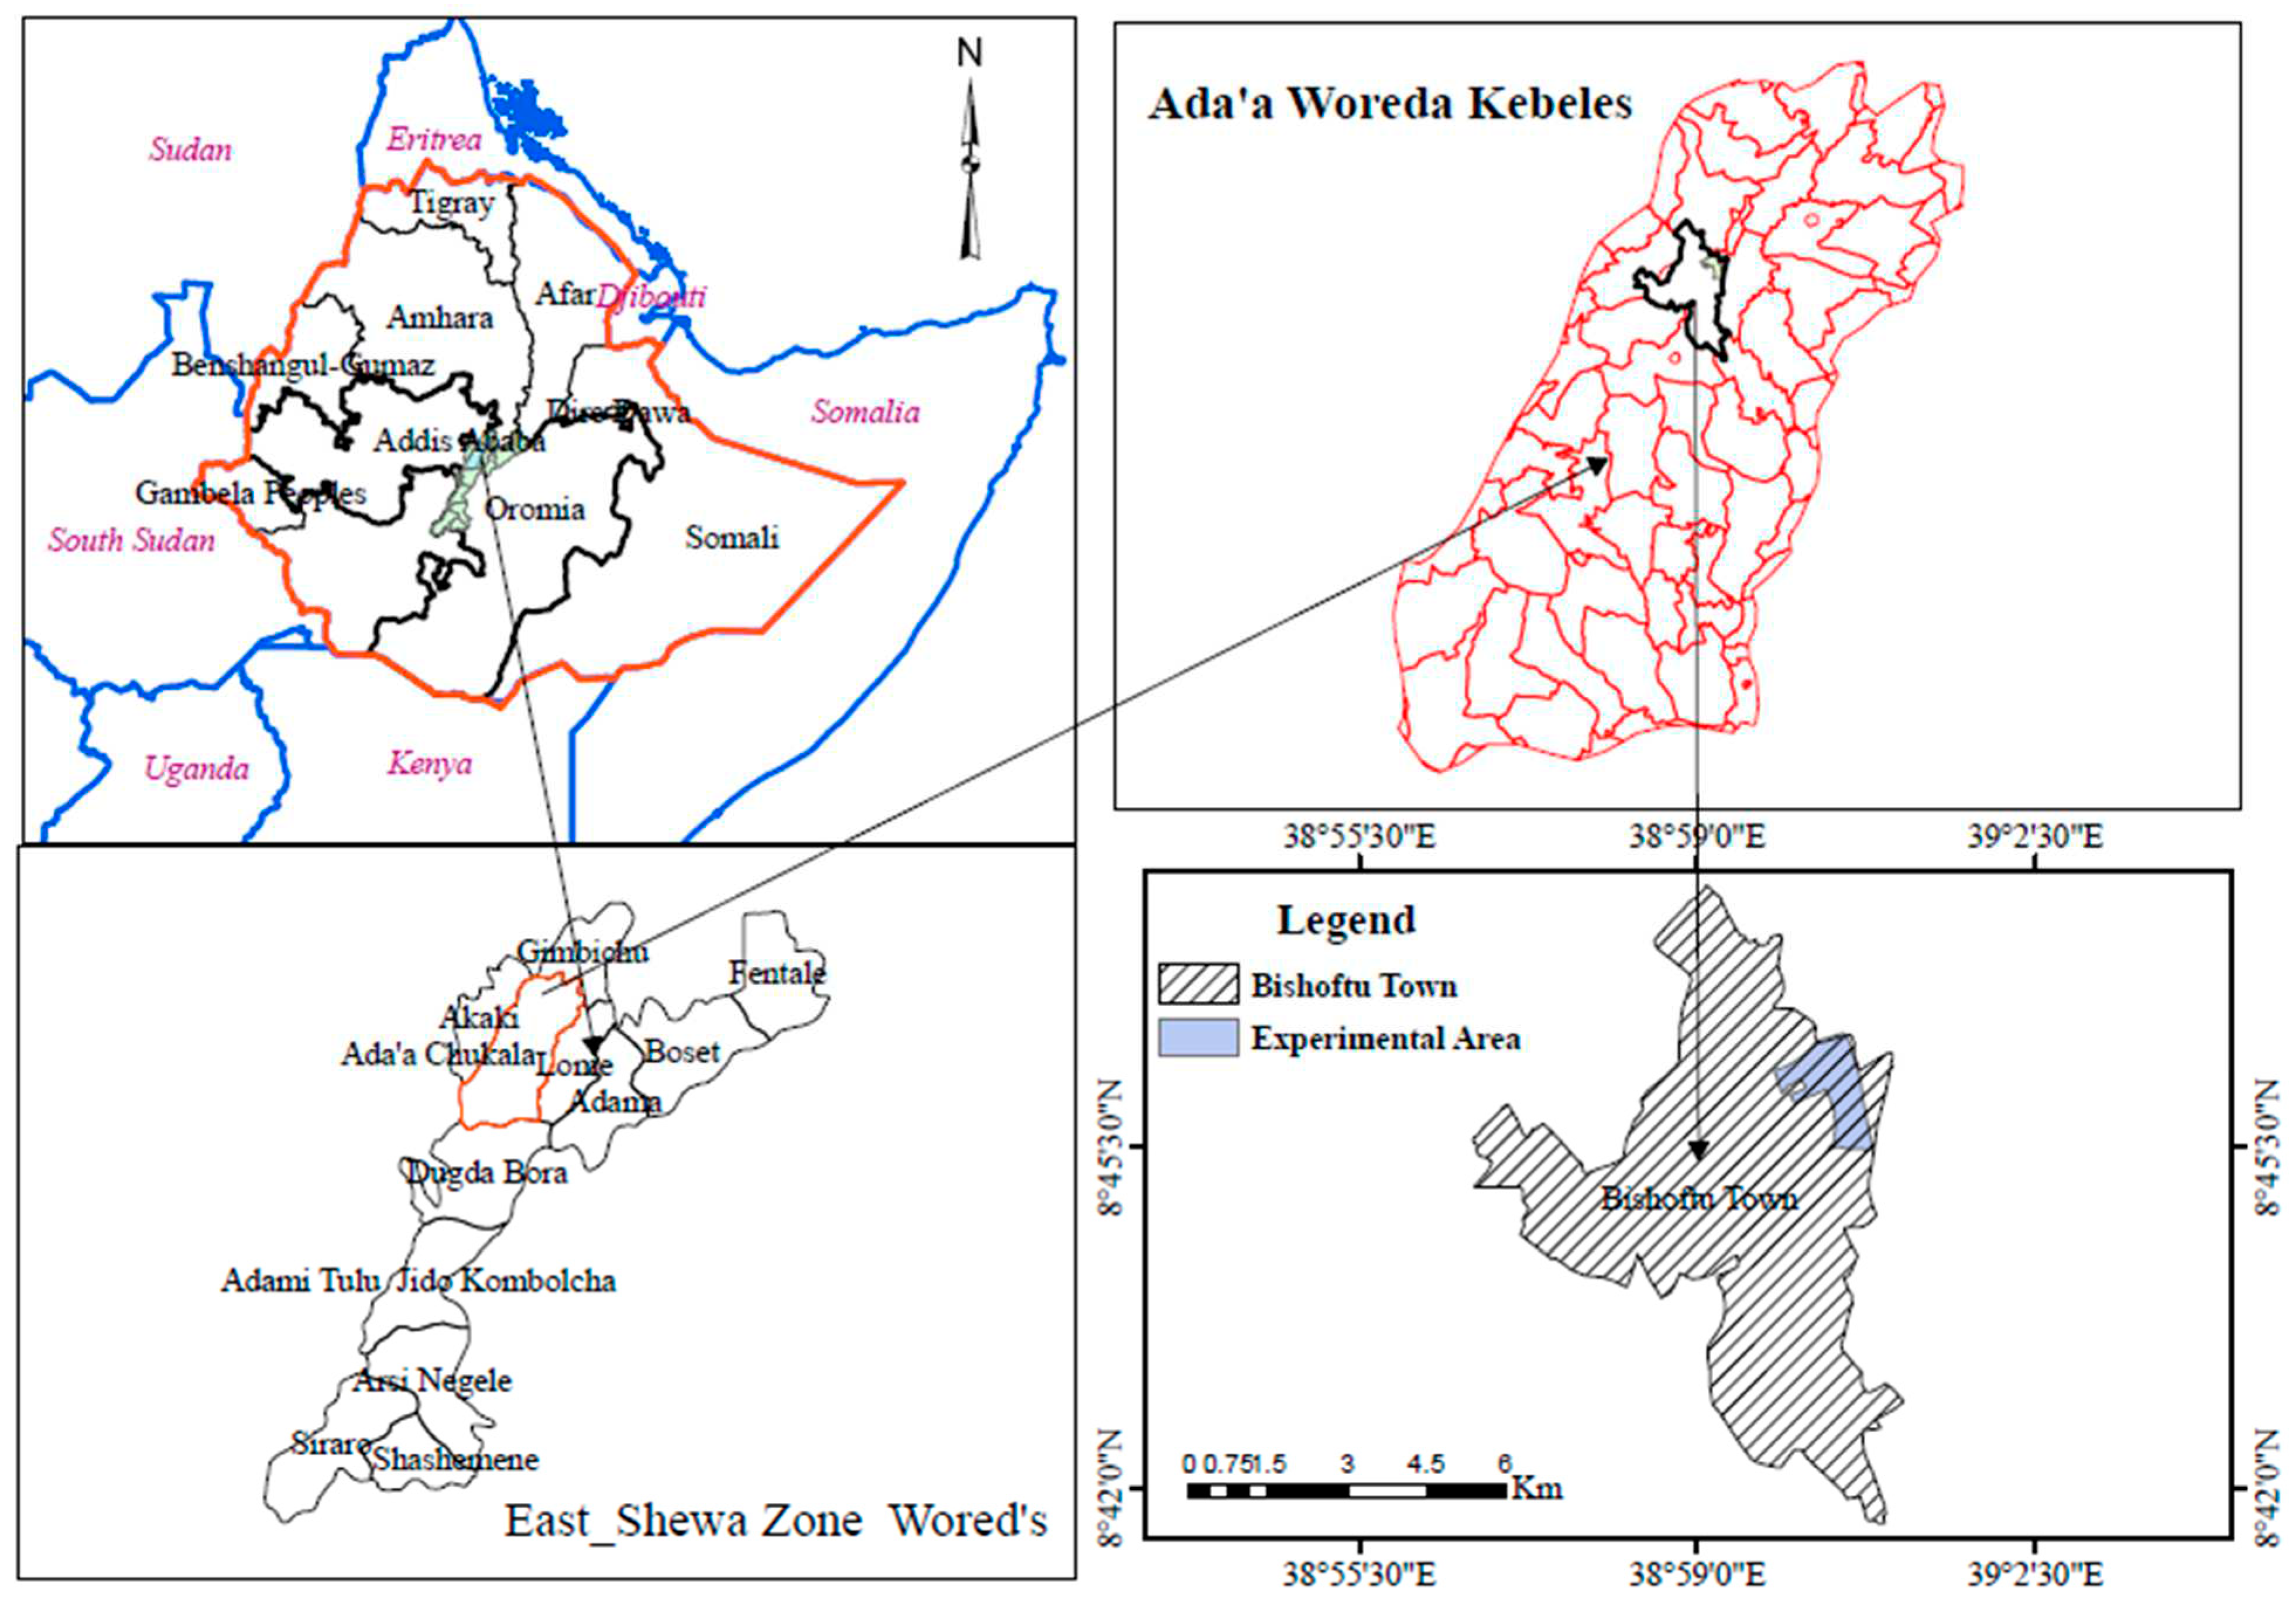
The experiment was conducted at the Debre Zeit Agricultural Research Center (DZARC) in the off-season from December to April 2021/22. The study site is located at 8
o.73
’ latitude and longitude of 39
o.98
’, with an altitude varying between 1931 and 2017 above mean sea level and found at a distance of 46 km to the southeast of Addis Ababa (
Figure 1). The mean annual rainfall is about 801.3 mm and has a single rainy season that extends from March to October and peaks in July. The mean annual maximum temperature is 25.5 °C, with variations between 23.7 °C and 27.7 °C in July and May, respectively. The mean annual minimum temperature is about 10.5 °C, with the coolest temperature of about 7.4 °C in July.
2.2. Experimental Material and Setup
The experiment was implemented on two non-weighing lysimeters. The lysimeters were constructed near a meteorological station at a distance of 20 m. It was constructed with an air tube that was used as an aeration pipe to facilitate air movement at the root zone, and there was a concrete bund of 10 cm depth above the ground surface to avoid the inflow and outflow of water from the system. The net area of a single lysimeter was 4 m
2 (2 m width by 2 m length) and 1 m depth to allow unrestricted root growth. An experimental wheat variety called Utuba was used. The variety was released by the Debre Zeit Agricultural Research Center Durum Wheat Breeding Department in 2015. It takes approximately 120 days to reach maturity, and it has a high protein content and high yield potential relative to early-released varieties [
12]. Urea and NPS were used as sources of fertilizer, with a recommended fertilizer rate with respect to the crop variety.
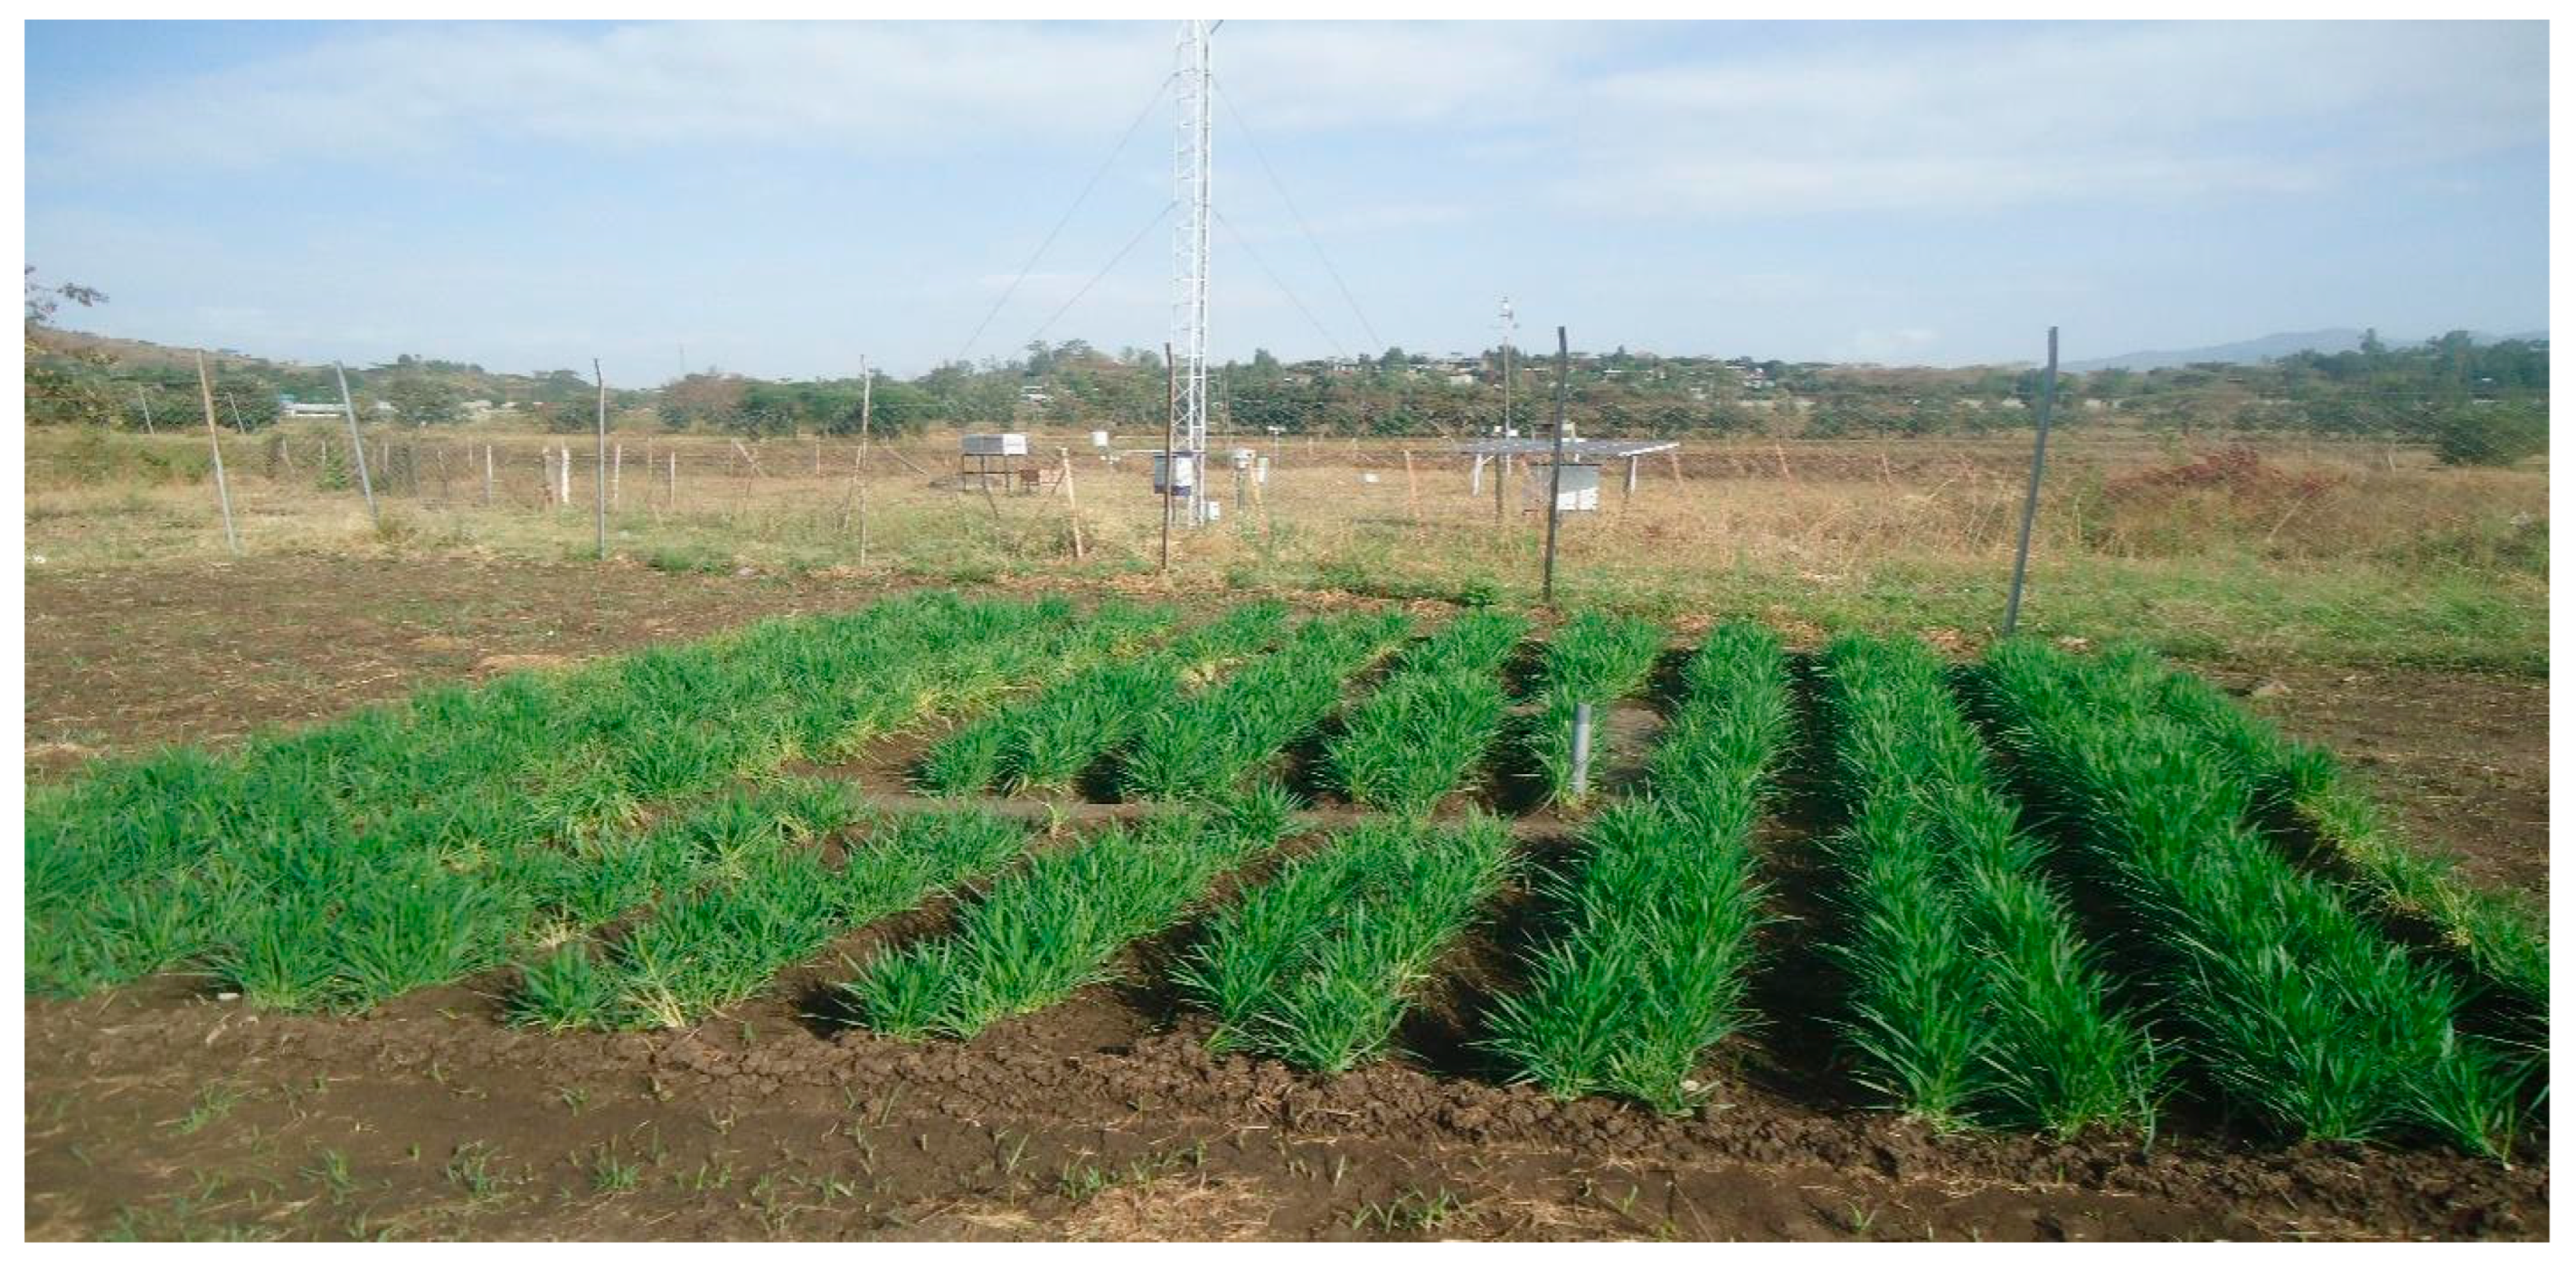
Sowing of the seed was done in double rows with a row spacing of 20 cm and a furrow width of 40 cm for proper irrigation water application and agricultural practices. Three furrows and four ridges with a length of 2 m inside each lysimeter and 2 m from the outside in each direction of the lysimeter (buffer zone) were constructed, and similar planting procedure with the lysimeter was applied. Furrows were arranged from the northern to the southern directions. The buffer area was used to maintain the natural environment consistent with the experimental plots, whereby the same crop was planted on 32 m
2, excluding the lysimeter area (
Figure 2). The buffer zone helped to observe the difference between the crop growth that was planted in and outside the lysimeter. The same treatment was applied to the lysimeters with respect to irrigation and fertilizer application as well as pest and weed management.
2.3. Soil Sampling and Analysis
Soil samples were collected from the lysimeter unit as well as from the buffer zone with similar procedures. The samples were taken up to a depth of 60 cm with an interval of 0–15 cm, 15–30 cm, and 30–60 cm using augurs and sample collecting bags. The collected samples were subjected to the analysis of physical parameters of the soil. These include the field capacity, permanent welting point, soil texture, electric conductivity, and pH. For bulk density analysis, undisturbed sample was collected using core samplers of known dimension from the same depth intervals described above. The analysis was conducted in the DZARC soil laboratory.
2.4. Data Analysis
a, Moisture holding capacity of the soil and permanent welting point
The water holding capacity and permanent welting point of the soil were determined following standard soil laboratory procedures. The acquired samples were dried naturally in a soil sample drying storage and ground by hand. The ground sample was weighted and immersed in water until saturation was reached for 24 hours before being extracted using a syringe. Following that, it was placed in a pressure plate for 24 hours to remove oversaturated water and maintain field capacity. Permanent welting point was determined using pressure plate. The pressure plate was set to 3 bar for the field capacity (FC) and 15 bar for the permanent welting point (PWP) determination. Equations 1-3 were used for the analysis.
where, FC is field capacity of the soil, PWP is permanent welting point of the soil, ρ
b is dry bulk density (gm/cm
3), Ms is mass of the dry soil (gm), and Vt is total sample volume (cm
3).
b. Soil moisture content
Depending on the stage of crop growth, the soil moisture was monitored both before and after each irrigation treatment at various depths. The upper 30 cm of depth, contains 61-68% of the effective root distribution of wheat[
13]. Soil moisture was monitored up to 60 cm depth, considering as total effective root zone.
where, Wwet is weight of wet soil (w/w), Wdry is weight of dry soil (w/w), θ is volumetric moisture content (%), Z
r Soil depth (mm), w is soil moisture content in on weight basis, Δθ is change in soil moisture in mm, θ
t1 and θ
t2 are soil moisture content between consecutive days (mm).
c. Effective Rainfall (Pe):-. This data on rainfall was obtained from an observatory weather station located close to the experiment. The effective rainfall was then computed using the FAO CropWAT8.0 version model (FAO, 1992).
where, P is rainfall and Pe is effective rainfall in mm.
d. Estimation of Crop evapotranspiration (ETc):- The water-balance equation was used to compute the crop's evapotranspiration, as suggested and indicated by [
1,
3,
14,
15].
Where, ETc is the crop evapotranspiration (mm/day), I is irrigation (mm), Pe is rainfall (mm), Δθ is change in soil moisture, Dp is drainage water depth in mm, and ΔR is change in runoff in mm.
e. Estimation of Reference Evapotranspiration (ETo):- The FAO-supplied model (CropWAT) and FAO Penman-Monteith method were utilized in order to estimate reference evapotranspiration because they can produce reliable results [
16]. The formula for the FAO Penman-Monteith equation is shown in the equation below.
where, ETo is reference evapotranspiration (mm/day), Rn is net radiation at the crop surface (MJ m
-2), G is Soil heat flux density (MJ m
-2 day
-1), T is Mean daily air temperature at 2 meter height (
0C), U
2 is wind speed at 2 meter height (ms
-1), e
s is Saturation vapor pressure (KPa), e
a is actual vapor pressure (KPa), e
s - e
a is saturation vapor pressure deficit (KPa), Δ is Slop vapor pressure curve (KPa), and γ is Psychometric constant (KPa
0C
-1).
f. Estimation of Crop Coefficient (Kc):- Several authors have used equation of the form 13 to derive growing stage crop coefficient [
1,
3,
14,
15,
17].
where, k
ci, ET
ci and ET
oi are crop coefficient, crop evapotranspiration and reference evapotranspiration during the i
th crop growth stage.
3. Results and Discussions
3.1. Soil Physical Properties
The results of the soil physical properties of the study area (
Table 1) revealed that the soil texture was clay and that there was no salinity threat as both the buffer zone and lysimeter showed salinity levels of 0.105 ds/m. The field capacity of the lysimeter ranged from 50.0% to 51.8%. Moisture content at wilting point is relatively high (32.35-35.80%). As a result, total available water over 60cm of root zone is 116mm. The average bulk density ranged from 1.09 – 1.16 gm/cm
3 for 60 cm soil depth.
3.2. Weather Condition of the Experimental Site during Crop Growing Season
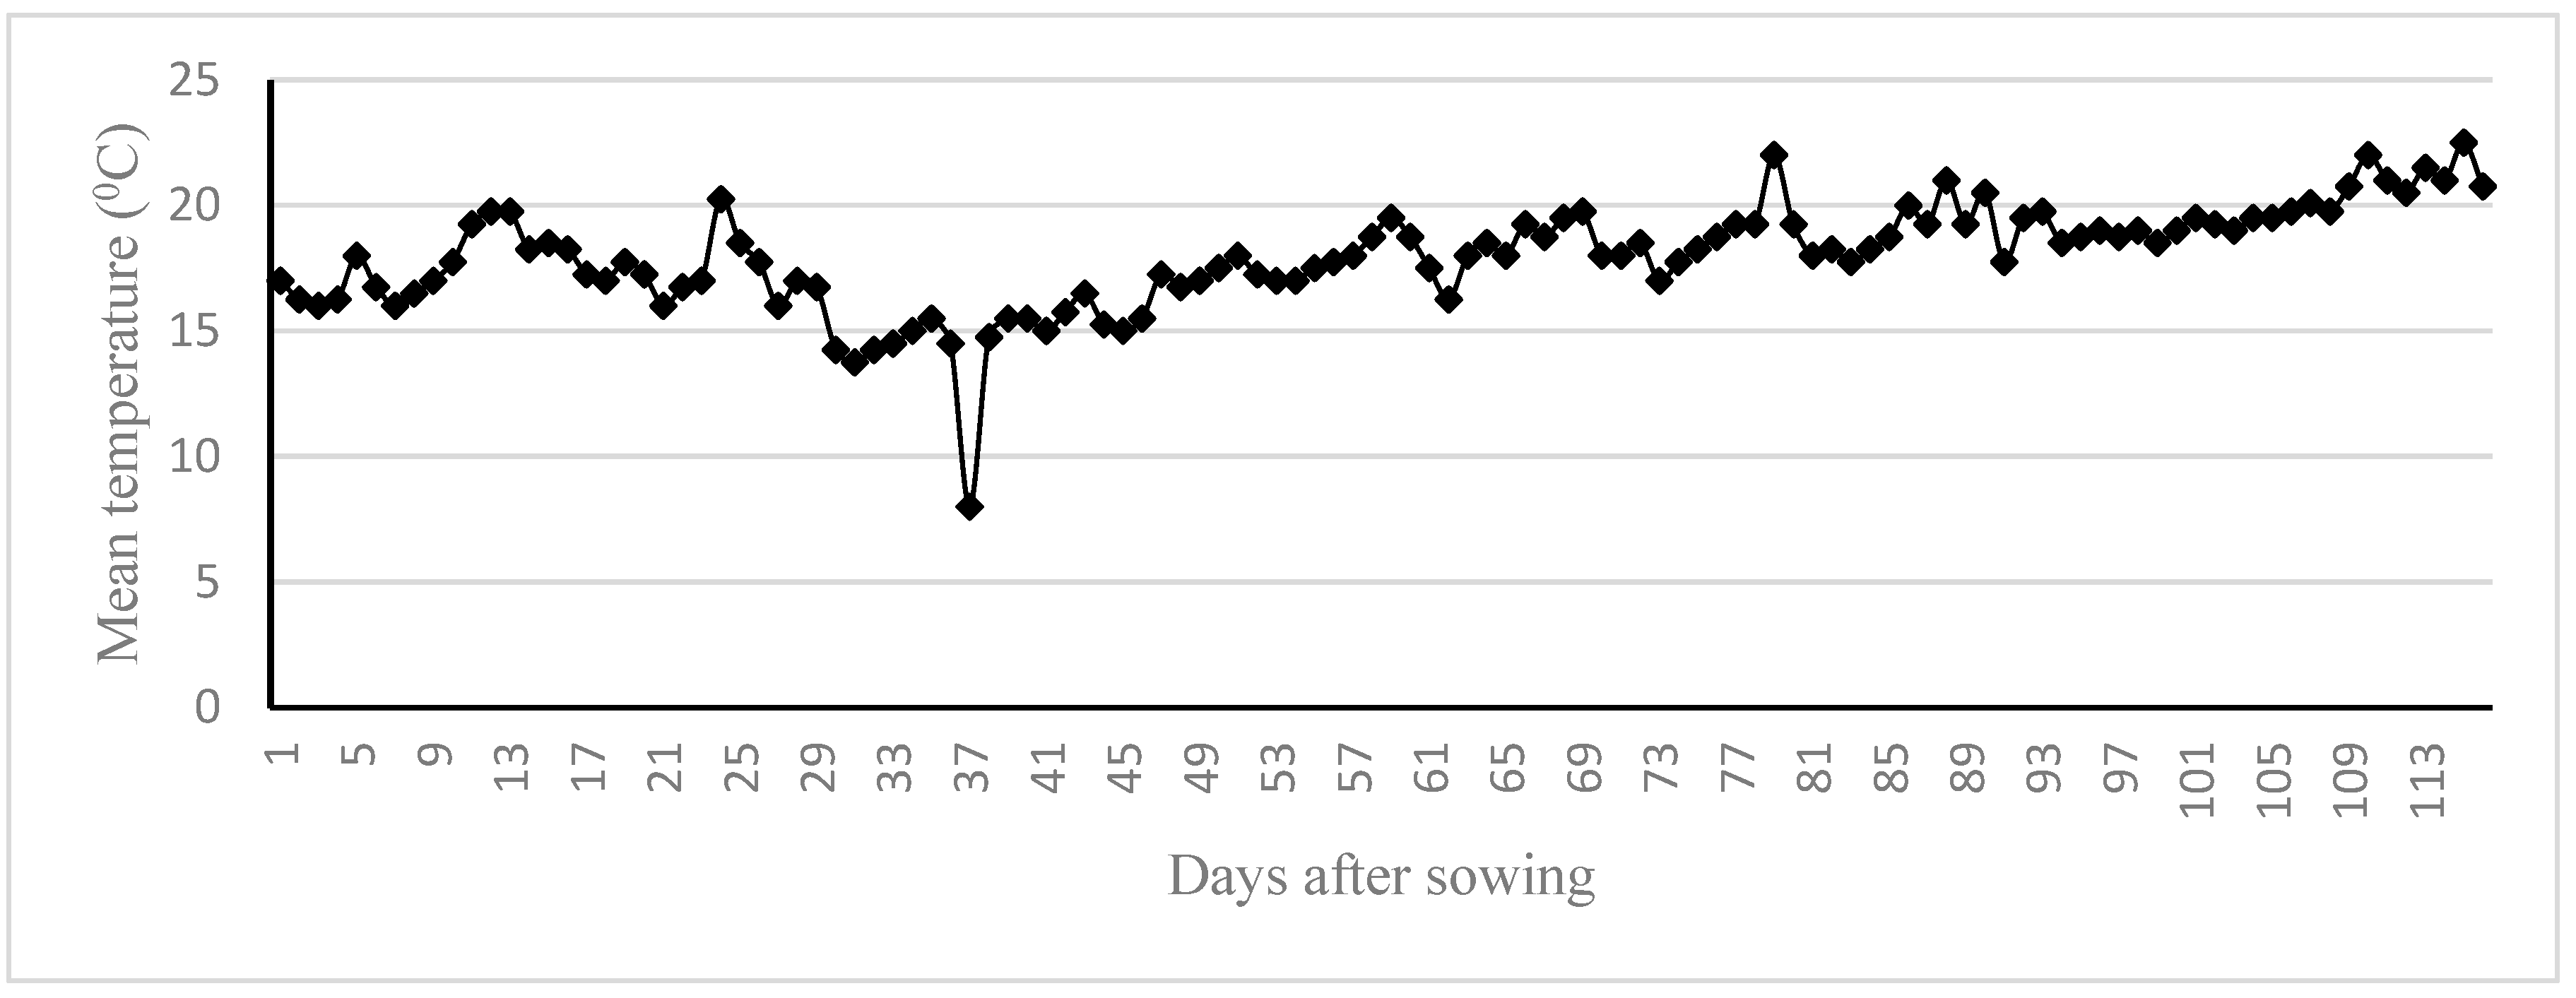
The average minimum and maximum temperature of the growing season was 7.3 °C and 27.78 °C respectively (
Figure 3). The maximum rainfall recorded was 14.5mm in January, which was during the initial stage of the crop growth and the remaining growing season was totally dry without any significant amount of rainfall
3.3. Soil Moisture Content
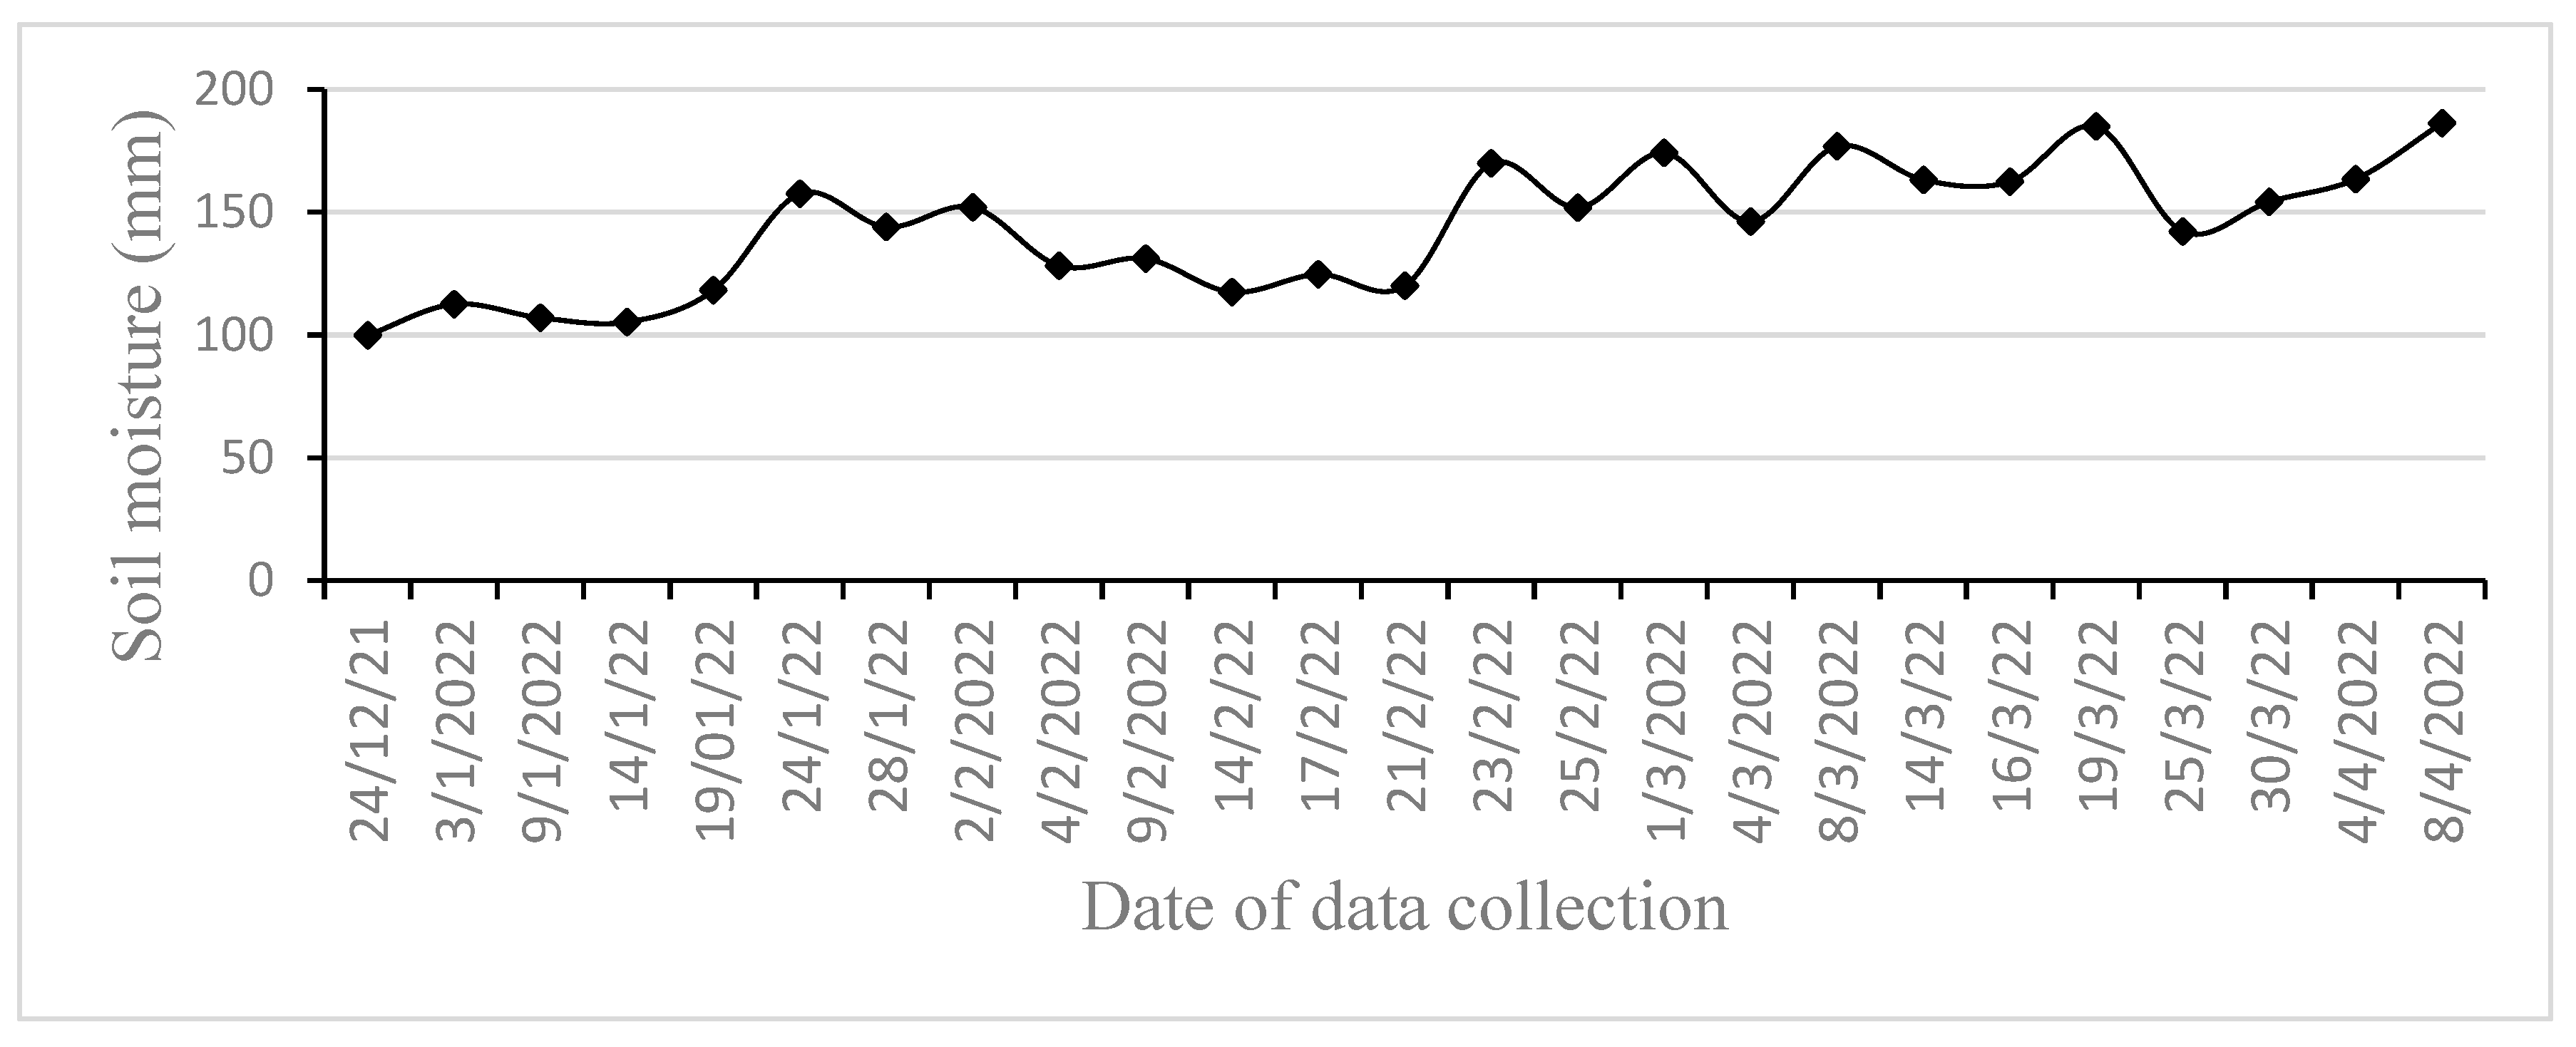
The soil moisture was monitored as explained in the methodology, and moisture throughout the growing season is presented in
Figure 4. Keeping the soil moisture in the effective root zone was considered the best option while applying irrigation water. As the results indicate, the moisture content during the mid- and late-season was found to be high compared to the initial and development stages. The reason behind this phenomenon might be due to the reduction of evaporation from the soil as ground coverage was at its maximum at this growth stage or the increase the depth of irrigation as root growth increased.
3.4. Reference Evapotranspiration (ETo)
The averaged reference evapotranspiration (ETo) of the growing season was found to be 5.1 mm/day, which was estimated using CROPWAT model. The value of the reference evapotranspiration during the growing season was ranged between 6.19 mm/day and 2.8 mm/day.
3.5. Measured Crop Evapotranspiration (ETc)
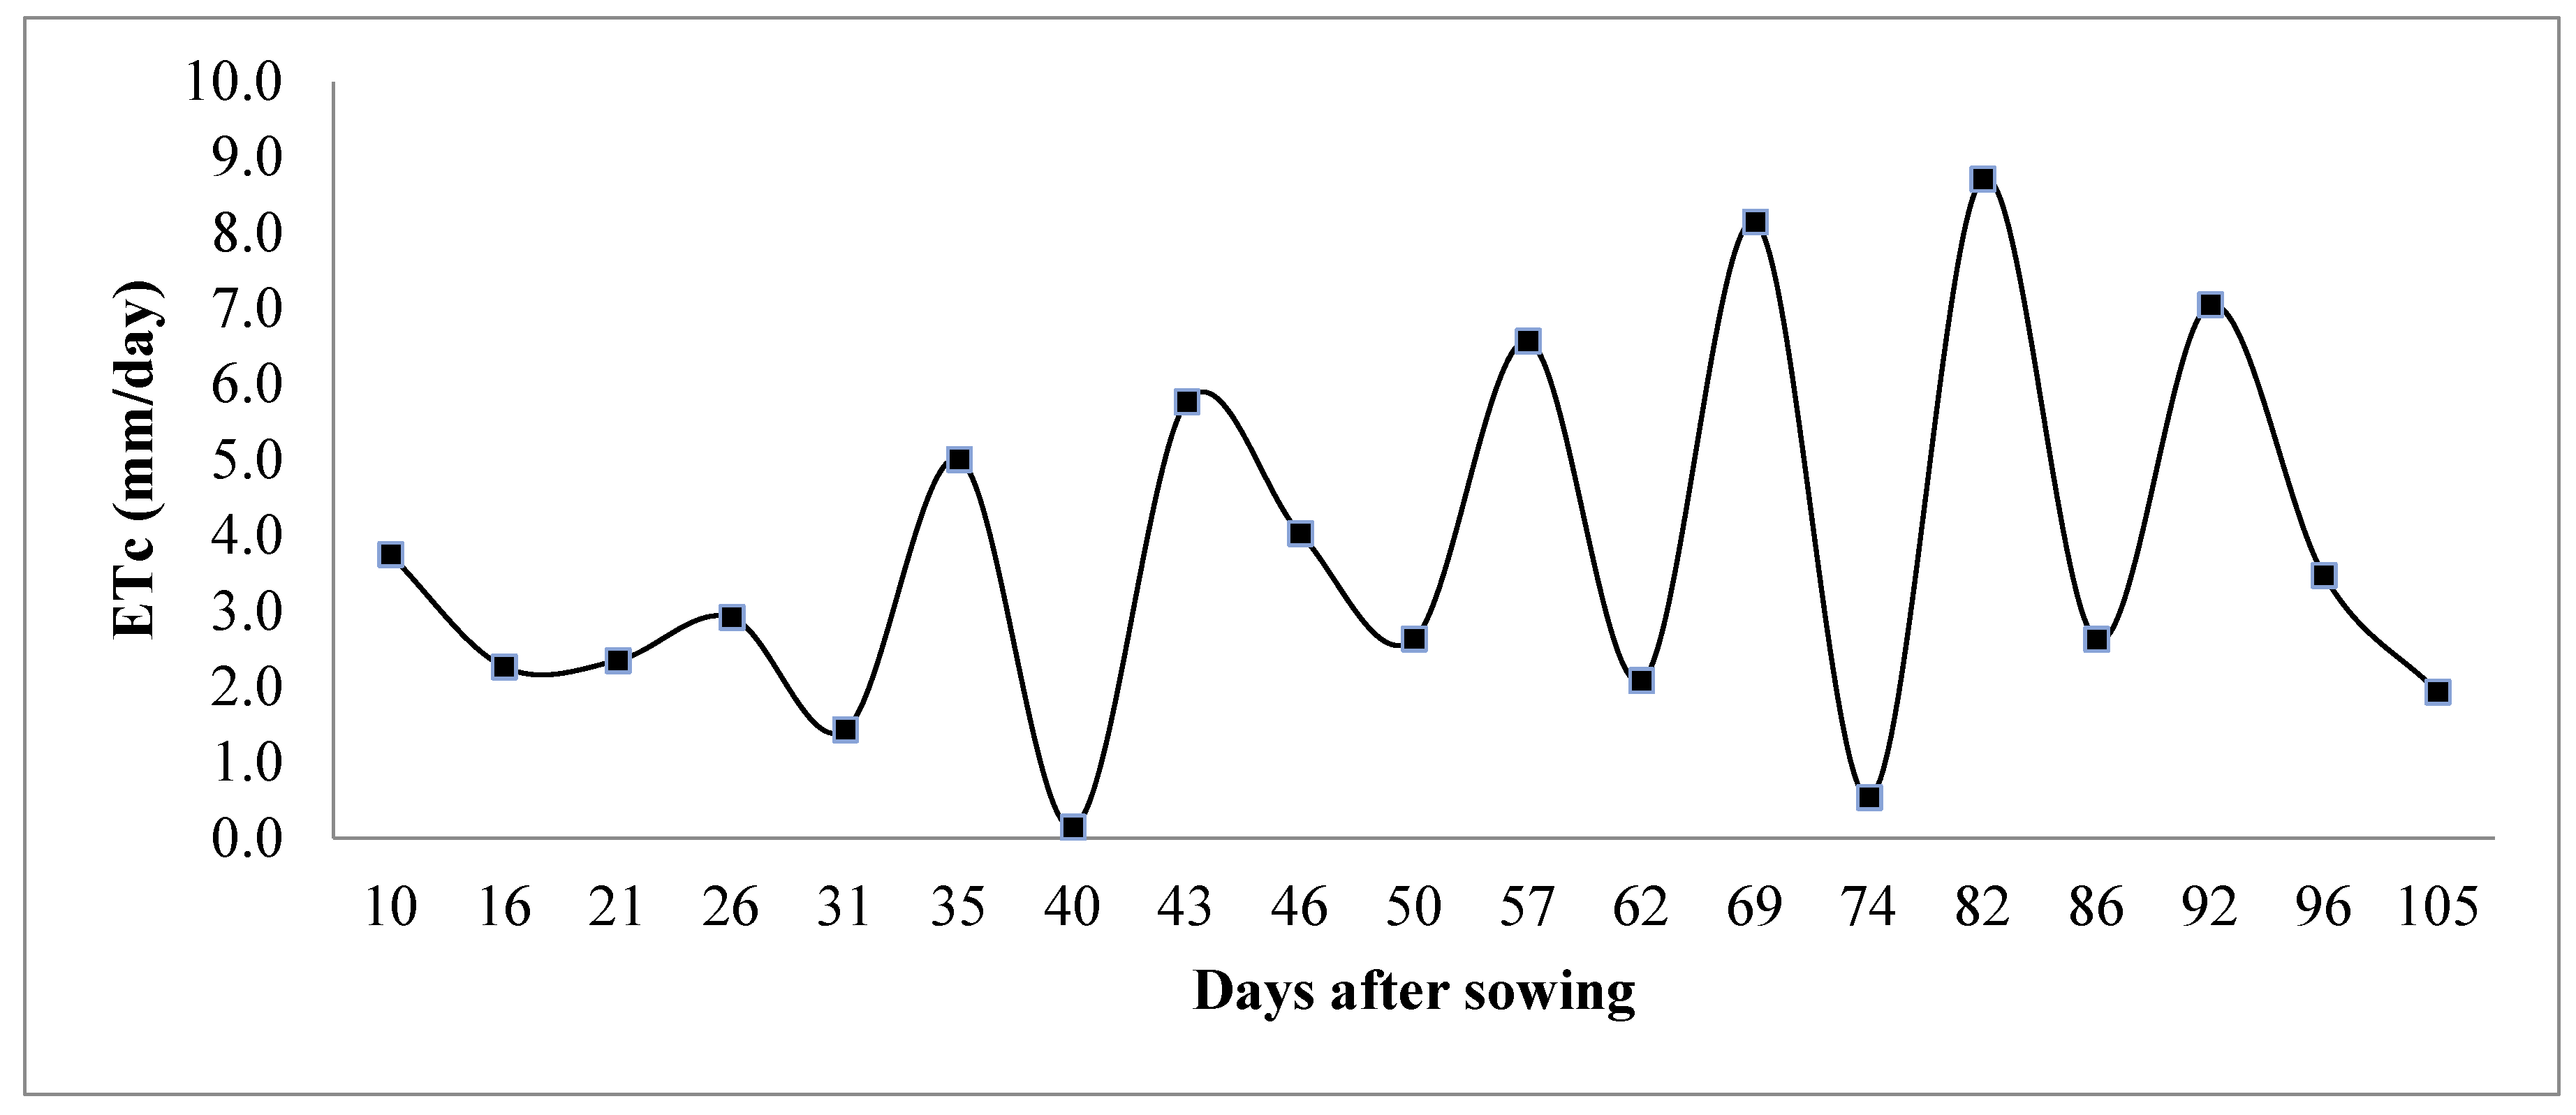
The water balance equations 10 and 11 were applied to determine the water demanded by the wheat crop. As depicted in
Table 2, the water requirement at the initial stage was 40.35 mm and increased to 82.44mm during the development stage. As the ground cover at initial stage was small, the largest portion of water loss might be accounted to evaporation. The demand continuously increased till it showed a decrement at a late stage, which proved that the water demand of a crop is highly dependent on the greenness of the plant, and when the plant changes its green color, the water requirement tends to decrease (
Figure 5).
As shown in the
Figure 5, the water demand of wheat at different growth stages varied continuously with respect to growth stage. This demonstrates that applying the same amount of water throughout the growth stage without distinguishing the crop growth stage can result in a significant loss of water that could be used to expand the area to crop additional crops During the growing season, observations revealed that when the weather was exceptionally sunny and hot, the water demand was significant and the soil moisture dries rather quickly, and vice versa.
The results of this investigation showed that less water was used at the beginning, development, and end of the experiment when compared to the findings of the study conducted by [
3] in Melkassa. However, the current study had a higher water demand at the mid-stage. Their study showed that the seasonal water demand of the crop was found to be 413.8 mm which a bit greater than our result (392.75 mm). Obviously, seasonal variations in climate and site-specific variables contribute to the variations in the amount of crop water requirement. More specifically, these factors could include the climate differences between the two places, the season in which the cultivation took place, the species of crop employed as an experimental crop, the soil type, or the cultivation management technique.
Other studies conducted by different scholars in different locations similarly showed variation from the current result (
Table 3). These results have a higher water requirement than the current results [
18,
19]. The variation was expected as water requirements are dependent on different physical parameters, particularly soil type and climate conditions.
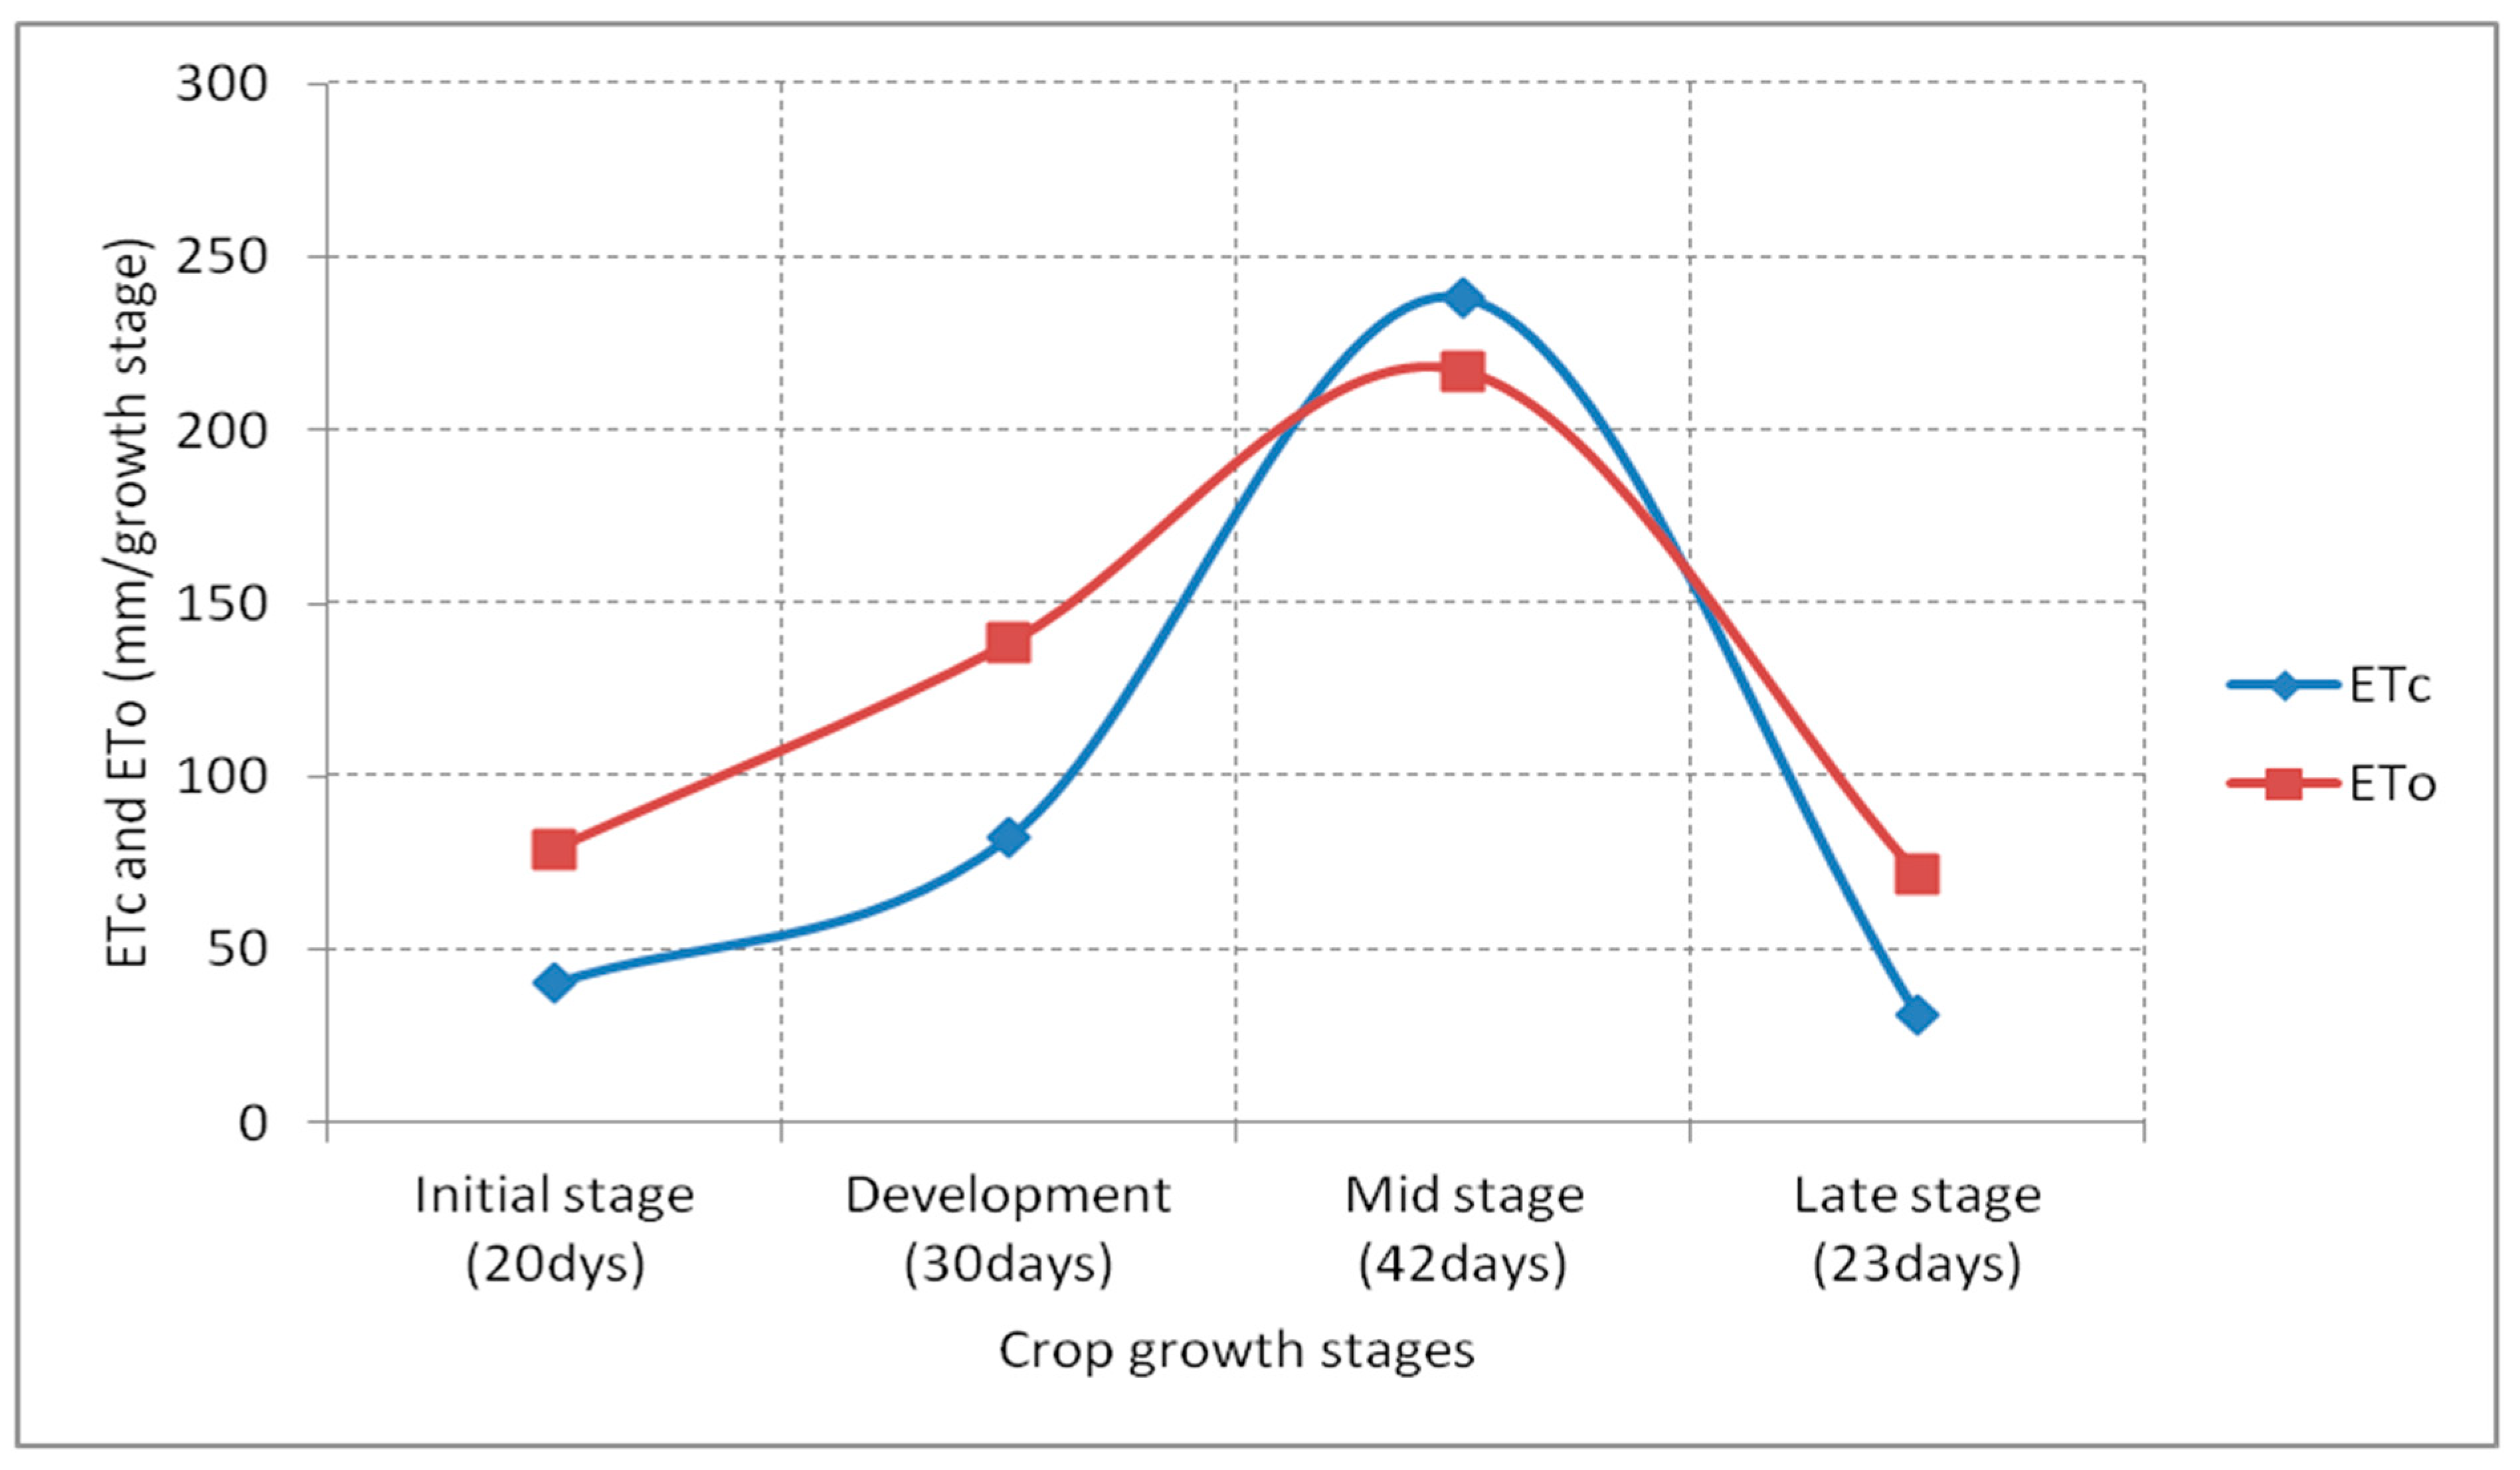
Measure crop evapotranspiration and estimated reference evapotranspiration based on local climate parameters are necessary to develop crop coefficient.
Figure 6 indicates the curves of these two important variables over the growing season of the wheat crop.
As it can be seen from (
Figure 6), the reference evapotranspiration (ETo) during the growing season was higher than crop evapotranspiration (ETc) for the first two growth stages (initial and development) and the late growing stage. However, during the mid-growth stage, the water loss through crop evapotranspiration was higher than the reference evapotranspiration. This shows that as crop progresses in its development and reaches maximum physiological development, its water demand becomes greater than that dictated by evaporative demand of the atmosphere.
3.6. Crop Coefficient (kc)
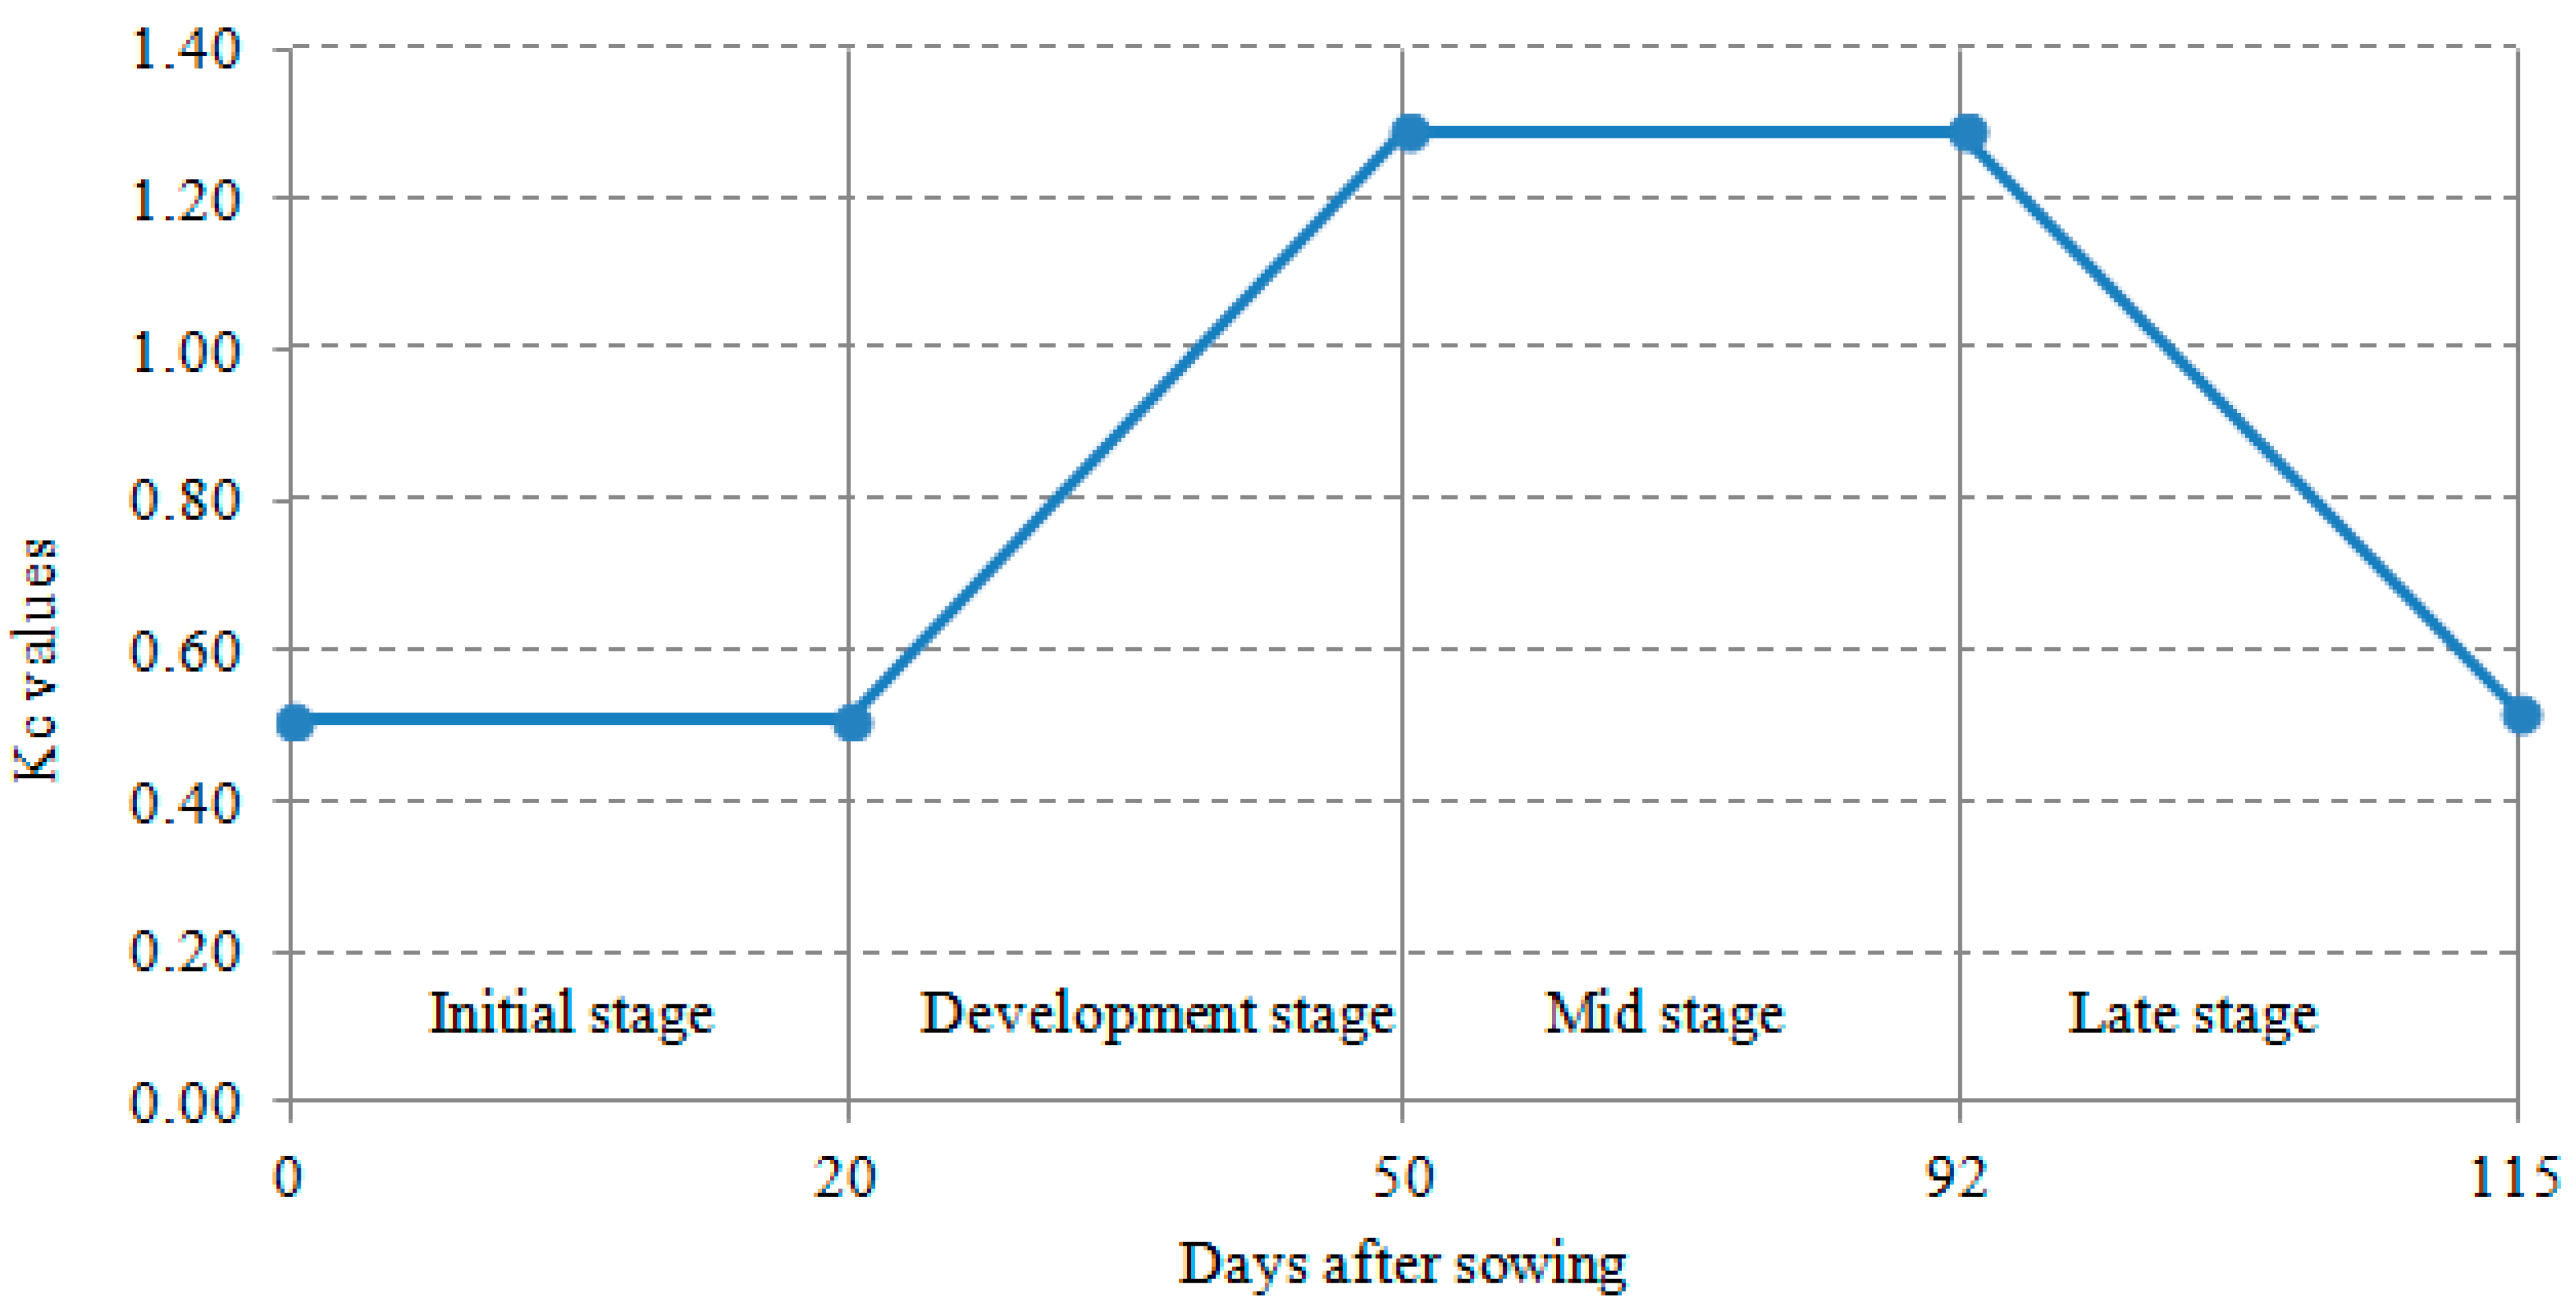
The results of field measurement of the crop coefficient for wheat are presented in (
Table 4 and
Figure 7). The crop coefficient is a parameter estimated from ETc and ETo. When the value of ETc drops during the growth stage due to weather fluctuations, kc becomes small, and vice versa. The kc values found in this study were 0.51, 0.83, 1.29, and 0.52 at the initial, development, mid, and late stages, respectively. The result indicated that increasing the growth date (stage) of the crop also increased the crop coefficient until it reaches the late stage. While the crop reaches its late growing stage, the plant loses its greenness and gradually ceases photosynthesis process. At this stage the reference evapotranspiration becomes higher than crop evapotranspiration, and as a result, kc value becomes smaller than the previous two growing stages [
16].
Similar experimental studies conducted in different parts of the world have shown that there is variation in kc values based on the different physical and climate properties of the area (
Table 5). For instance, research conducted by [
3] on the wheat crop coefficient identified 0.54, 1.15, and 0.67 for the early, middle, and late stages of the crop growing season. [
20] also discovered that the kc values for early, mid, and late-season winter and spring wheat were 0.60, 1.3, and 0.30, respectively. The findings of this investigation were aligned to see whether they agree with previous studies or not and the result was presented in
Table 5. According to [
18], the wheat crop's kc at early, mid, and late season growing stages were 0.27, 1.03, and 0.89, respectively, which was different from the current result.
All these variations show the importance of calibration and validation of crop coefficient to the specific areas of interest before using the values given in different literatures. The graphical representation of the kc values over the growth stage and season is portrayed in
Figure 7.
3.7. Crop Coefficient as a Function of Days of the Growing Season (DGS)
Crop coefficient kc values as a function of days of growth stage (DGS) were fitted to a regression equation. As a result, a fourth-order polynomial equation with a high coefficient of determination, R2 = 0.999, was developed. The established relationship can be used to anticipate crop coefficients when constructing and planning irrigation systems in locations outside of the research area that have similar climate and soil conditions. The equation has the following form:
Kc= 5E-08 (DGS)4 - 1E-05(DGS)3 + 0.0012(DGS)2 - 0.0186(DGS) + 0.51
With R2 =0.99
The equation was tested using the kc data generated by the current study. There is a little numerical discrepancy between the study's findings and the kc value predicted by the equation. The difference, however, was not statistically significant, indicating that one may use the equation to estimate the kc value for the known length of developing stage.
4. Summary and Conclusions
For effective irrigation scheme planning and irrigation water management, it is essential to know how much and when to apply the water. This knowledge must include details on the type of crop grown, the type and characteristics of soil, the season during which it is grown, the local climate, and the irrigation technique to be used. The objective of this study was to measure the water demand of a wheat crop and establish its crop coefficient under Bishofitu climate conditions in Ethiopia. Non-weighing lysimeters were utilized to measure the soil water balance components to be able to determine the water use of the wheat crop.
The results indicated that the seasonal net water requirement of the wheat crop was found to be 392.75 mm. The crop evapotranspiration during initial, development, mid-stage, and late stages was 40.35 mm, 82.44 mm, 238.66 mm, and 31.3 mm, respectively. The crop coefficient (kc) was determined to be 0.51, 0.83, 1.29, and 0.52 for the initial, development, mid, and late growth stages, respectively. A regression equation that predicts kc values as a function of crop growth stage developed in this study can also be used to estimate kc under data-scarce conditions.
The results further revealed that considering the climate of the area and the soil condition must be a priority in order to have better water conservation in crop production, especially cereal crops. Additionally, the result indicated that for areas similar to the experimental site regarding agro-ecology and crop variety, already developed kc equations can be used to estimate the crop water requirement and crop coefficient. As the results presented in this paper are based on a none season experiment, repetition of the experiment would be recommended to generate reliable information useful efficient and effective management of irrigation.
Acknowledgments
The authors would like thank the Ethiopian Institute of Agricultural Research (EIAR) and funding the research project. We are also grateful to the Debre Zeit Agricultural Center for providing the experimental field with all its facilities.
Conflicts of Interest
I declare that there no conflict of interest.
References
- Shenkut, A.; Tesfaye, K.; Abegaz, F. Determination of Water Requirement and Crop Coefficient for Sorghum (Sorghum bicolor L.) at Melkassa, Ethiopia. Sci. Technol. Arts Res. J. 2013, 2, 16. [Google Scholar] [CrossRef]
- Yihun, Y.M. Agricultural water productivity optimization for irrigated teff (Eragrostic Tef) in a water scarce semi-arid region of Ethiopia. Leiden: CRC Press/Balkema, 2015.
- Tezera, K. Determination of Wheat (Triticum Aestivum L) Seasonal Water Demand and Crop Coefficient for Effective Irrigation Water Planning and Management in Semi-Arid, Central Rift Valley of Ethiopia. Int. J. Environ. Sci. Nat. Resour. 2019, 21. [Google Scholar] [CrossRef]
- Bashir, M.U. Irrigation Scheduling Of Wheat At Different Nitrogen Levels In Semi-Arid Region. Turk. J. Field Crops 2017. [Google Scholar] [CrossRef]
- Nair, S.; Johnson, J.; Wang, C. Efficiency of Irrigation Water Use: A Review from the Perspectives of Multiple Disciplines. Agron. J. 2013, 105, 351–363. [Google Scholar] [CrossRef]
- Eshete, D.G.; Sinshaw, B.G.; Legese, K.G. Critical review on improving irrigation water use efficiency: Advances, challenges, and opportunities in the Ethiopia context. Water-Energy Nexus 2020, 3, 143–154. [Google Scholar] [CrossRef]
- Callejas Moncaleano, D.C.; Pande, S.; Rietveld, L. Water Use Efficiency: A Review of Contextual and Behavioral Factors. Front. Water 2021, 3, 685650. [Google Scholar] [CrossRef]
- Curtis, B.C.; Rajaram, S.; Macharson, H.G. Bread wheat improvement and production. FAO plant production and protection series No. 30. 2002.
- Pakparvar, M.; et al. Remote sensing estimation of actual evapotranspiration and crop coefficients for a multiple land use arid landscape of southern Iran with limited available data. J. Hydroinformatics 2014, 16, 1441–1460. [Google Scholar] [CrossRef]
- Piccinni, G.; Ko, J.; Wentz, A.; Leskovar, D.; Marek, T.; Howell, T. Determination Of Crop Coefficients (Kc) For Irrigation Management Of Crops. 2007.
- Yarami, N.; Kamgar-Haghighi, A.A.; Sepaskhah, A.R.; Zand-Parsa, S. Determination of the potential evapotranspiration and crop coefficient for saffron using a water-balance lysimeter. Arch. Agron. Soil Sci. 2011, 57, 727–740. [Google Scholar] [CrossRef]
- Temtme, M. Durum wheat (Triticum durum Desf) Variety ‘Utuba’ Performance in Ethiopia. Agric. Res. Technol. Open Access J. 2018, 18. [Google Scholar] [CrossRef]
- Fan, J.; McConkey, B.; Wang, H.; Janzen, H. Root distribution by depth for temperate agricultural crops. Field Crops Res. 2016, 189, 68–74. [Google Scholar] [CrossRef]
- Hordofa, T. Crop Water Requirement and Crop Coefficient of Tef (Eragrostis tef) in Central Rift Valley of Ethiopia. J. Nat. Sci. Res. 2020, 11, 34. [Google Scholar]
- Yadeta, B.; Ayana, M.; Yitayew, M.; Hordofa, T. Determination of Water Requirement and Crop Coefficient for Sugarcane Using Lysimeter Experiment under Semiarid Climatic Conditions of Ethiopia,” J. Irrig. Drain. Eng. 2021, 147, 04021051. [Google Scholar] [CrossRef]
- Allen, R.G.; Pereira, L.S.; Raes, D.; Smith, M. Crop evapotranspiration - Guidelines for computing crop water requirements - FAO Irrigation and drainage paper 56, p. 15.
- Allen, R.G. Food and Agriculture Organization of the United Nations, Eds., Crop evapotranspiration: guidelines for computing crop water requirements. in FAO irrigation and drainage paper, no. 56. Rome: Food and Agriculture Organization of the United Nations, 1998.
- Kenjabaev, S.; Dernedde, Y.; Frede, H.-G.; Stulina, G. Determination of actual crop evapotranspiration (ETc) and dual crop coefficients (Kc) for cotton, wheat and maize in Fergana Valley: integration of the FAO-56 approach and BUDGET,” p. 405, 14. 20 May.
- Laaboudi, A.; et al. Crop coefficient and water requirement for wheat (Triticum aestivum) in different climate regimes of Algeria,” undefined, 2015. Available online: https://www.semanticscholar.org/paper/Crop-coefficient-and-water-requirement-for-wheat-in-Laaboudi-Allaoua/a693a6c2e47c5eae0cceaf3e82ca12763ee6d32c (accessed on 9 December 2021).
- Irmak, S.; Djaman, K.; Sharma, V. Evapotranspiration and single (normal) and basal crop coefficients of winter wheat (Triticum aestivum L.). Available online: https://www.academia.edu/16194182/Evapotranspiration_and_single_normal_and_basal_crop_coefficients_of_winter_wheat_Triticum_aestivum_L_ (accessed on 17 May 2021).
|
Disclaimer/Publisher’s Note: The statements, opinions and data contained in all publications are solely those of the individual author(s) and contributor(s) and not of MDPI and/or the editor(s). MDPI and/or the editor(s) disclaim responsibility for any injury to people or property resulting from any ideas, methods, instructions or products referred to in the content. |
© 2023 by the authors. Licensee MDPI, Basel, Switzerland. This article is an open access article distributed under the terms and conditions of the Creative Commons Attribution (CC BY) license (http://creativecommons.org/licenses/by/4.0/).
