
Submitted:
16 October 2023
Posted:
17 October 2023
You are already at the latest version
Abstract
Low Emission Zone (LEZ) is an important mechanism to limit the negative environmental impact of traffic pollution in an urban area. Car traffic in the zone is strictly regulated to meet certain technical and environmental criteria. Such solutions of urban environment protection are gaining popularity, especially in European conurbations. Nowadays there are above 300 zones in Europe, mostly established in Italy and Germany. So far there are no LEZs in Eastern and Central European countries. However, the Warsaw authorities are just discussing launching of a LEZ in the city in 2024. According to the ongoing project, the zone is to be launched gradually, in five phases between 2024 and 2032, with the traffic criteria being tightened accordingly. The progressive emission reductions of the predominant pollutants in LEZ in consecutive phases were estimated on the basis of the Real Driving Emissions (RDE) test, carried out in 2020 by the ICCT. The gradually reduced emissions of NOx and PM were subsequently utilized as the input dataset for the regional CALPUFF model predictions, to calculate concentrations of these main traffic-induced pollutants within the LEZ area. The direct effect of the zone activation is reduction of air pollution in the urban center, which is mostly exposed to the pollution risk due to heavy traffic. Computer simulations reveal that implementation of the zone in the case of Warsaw will result in a quite significant reduction of NOx concentrations within the LEZ, such that its mean concentration in the zone becomes comparable to the rest of the conurbation. However, it will bring only a slight reduction of PM2.5 concentrations. This situation is due to the long-standing dominance of coal combustion in the Polish economy, which also applies to the urban municipal sector. As a consequence, particulate matter emissions of this sector are clearly predominant over the road traffic contribution. Balance can be achieved once the ongoing de-carbonization of the national economy has been completed.
Keywords:
Urban air pollution
; Road traffic emission
; RDE emission test
; Low emission zone
; Environmental impact
1. Introduction
Above 70% of European citizens live in urban areas [1], where, due to high population densities and economic activities, they are exposed to high levels of air pollution [2,3,4]. The adverse concentrations often exceed the WHO guidelines, especially the currently established more restrictive limits [5,6]. Exposures to particulate matter, nitrogen oxides, ozone, and other pollutants, are associated with serious health problems [7,8,9,10,11,12], including the premature mortality in European cities. According to [13] report, the highest number of premature deaths in Europe being an effect of heavy traffic and associated nitrogen dioxide emissions, has been recorded in major metropolitan areas of Western Europe, such as Germany, Italy, Spain, France, Belgium [2,6,14]. Also many Polish cities including Warsaw are among the most polluted ones in Europe [15,16]. However, while in Western European cities the impact of traffic sources and the nitrogen oxides emission is predominant, in Warsaw the greatest threat is posed by particulate matter (PMs), emitted mainly by the municipal sector area sources. This is mainly due to the country’s heavy reliance on coal, but also results from burning of low-quality fuels in the residential heating installations.
Transportation is a major source of greenhouse gases and also contributes considerably to local air pollution. The related social costs are significant, ranging from reduced life expectancy and increased infant mortality to far-reaching economic consequences [17,18]. The European strategy for tackling the problem emphasizes the need to decarbonize the transport sector and to reduce emissions of other harmful pollutants associated with vehicle traffic in the cities [19,20,21]. One important mechanism to limit the negative impact of traffic pollution in the urban areas that is already implemented in many Western European cities, is creation of the Low Emission Zones (LEZ) [22,23,24]) also often alternatively referred to as the Clean Transportation Zones (CTZ) [25,26,27]. The zones are geographical areas where traffic of the most polluting vehicles is strictly regulated. This usually means that such vehicles cannot move in the area, or the restriction of driving is combined with a charge for admission and/or a penalty for driving in without permission. The main objective is to improve health of residents by reducing concentrations of NO2 as well as the fine particulate matter because of their predominantly negative health [28,29,30].
Implementation of the Low Emission Zone directly reduces the negative influence of the road transport on environmental quality inside the zone's area, but its impact also extends to the entire city. Usually, the city authorities have been left with a lot of freedom in defining the related criteria and in deciding whether the condition of the local environment justifies introduction of the zone [25]. However, since the road transport directly affects air pollution and in the absence of statutory criteria for its environmental impact, it is usually a good practice for local authorities to comply with air protection programs when introducing the zones [18,28,31], which comprehensively makes it possible to improve air quality in a given area.
Low emission zones that regulate the vehicle traffic in chosen areas where environmental criteria are not met, are gaining popularity, especially in Europe. In 2022 there were above 300 LEZs in Europe [25,26,27,32,33,34], in a total of 14 countries. Most zones were established in Italy (172), Germany (78), Great Britain (17), Netherlands (14), France and Sweden (each 8), Austria (6), Denmark (4), Norway (3), Spain and Belgium (each 2). In Greece, Finland and Portugal function one low emission zone each in the capitals of these countries [27]. In addition, some countries intend to significantly increase the number of zones by 2025, for example France (up to 42) and Spain (up to 149). Implementations of LEZs vary, depending on the size and characteristics of the city, and the primary pollutants considered are usually nitrogen oxides and particulate matter [11,35,36,37]. So far, no low emission zones have been established in the countries of Eastern-Central Europe and the Balkans, despite very poor air quality in these countries.
Generally, air quality in Poland is one of the worst in Europe. Poor air quality in Warsaw, unlike in most large Western European agglomerations, primarily depends on the level of PM2.5 concentrations emitted mainly by the municipal sector area sources. A similar situation is also observed in most other Polish conurbations, mainly due to country’s long-term reliance on coal [21,38]. According to the [15] or [16], in 2018 thirty six of the fifty most PM polluted cities in the European Union were located in Poland, and in some of these cities the levels of the fine particulate matter significantly exceeded EU limits. In the same year, about 12% of all premature deaths caused by PM2.5, NO2, and ozone (O3) exposures in EU-28 occurred in Poland. At the same time, Warsaw is one of the most polluted cities in Poland. In particular, in 2018-2019, the average annual concentrations of PM10 as well as fine particulate matter PM2.5 recorded in the conurbation area significantly exceeded the limits recommended by WHO [6,12].
Although the municipal sector PM2.5 emission is the predominant pollutant causing premature mortality and other adverse health effects, the impact of the road traffic also significantly contributes to air quality deterioration in most Polish cities. Recently, there are over 20 million cars on Polish roads and 1.5 million are registered every year, of which about 25% are registered in Warsaw [30]. The impact of the urban transport is mainly responsible for NO2 and hydrocarbon pollution, but also contributes considerably to the total PM concentrations [21,38]. In 2019, Warsaw was one of the four cities in Poland where NO2 concentrations often exceeded the annual EU limit, mainly due to the transport sector emission. The electro-mobility and alternative fuels give local governments a new tool that can have a real impact on improving air quality [39,40,41,42]. On the other hand, low emission zones can additionally reduce vehicle traffic emissivity in city centers, making them more friendly to residents.
So far, only one zone has been built in Poland, a pilot one in Kraków, which was however quickly protested against. It happened because very restrictive regulations defining the zone limited possibility of driving in only to the fully electric vehicles or the ones powered by hydrogen or natural gas. Such a solution lacks social acceptance and increases reluctance to establish such a zone, mainly because there are simply not enough electric vehicles in Poland nor those powered by hydrogen. As a consequence, there is a real risk of a dead regulation or establishing non-functional zones only in a very small areas, e.g., in the old towns.
Although there are already hundreds of low emission zones operating in Europe, none of them is such restrictive as that designed in Kraków. For example, London introduced the ultra-low emission zone (ULEZ) only in 2019, after 11 years of operation of the low-emission zone (LEZ) [18,29], where not only zero- but also low-emission cars were admitted. Other European conurbations have been following this path for a long time Oslo, Hamburg, Amsterdam, Paris, Brussels, Madrid, Helsinki, Copenhagen, Athens. They introduce bans on conventional cars and limit transit traffic, but also invest in electro-mobility infrastructure, public transport and car-sharing [30].
To have a real impact on lowering pollution levels in cities, the zero- and low-emission cars have to replace in a noticeable proportion the conventional cars in order to create an effect of scale [30]. A great deal of responsibility in this regard rests with local governments, which are the only ones competent to demarcate areas and create exemptions for some vehicles. In other words, they can implement a zone that meets real needs, e.g., allowing admission to it also for low-emission vehicles, like plug-in hybrids and classic hybrids. Low Emission Zones would then have a better chance of being created and accepted by the local community, and in effect fighting smog more effectively.
The fairly obvious conclusion from the previous implementations of LEZs in European cities is that zone effectiveness in reducing air pollution directly depends on the road traffic in the overall emission field that is shown in [26,43] to be the main factor which determines effectiveness of the zones. The progressive implementation of the zones, i.e., their gradual closing to various types of cars, is more advantageous. They should be, first of all, established by municipalities that know local restrictions and basic parameters of the car fleet. Secondly, they should be created in larger areas that is more effective in reducing smog. According to [25,27], banning traffic in a small area provokes increased traffic outside the zone that does not improve the environmental effect and at the same time worsens the comfort of moving around the city. Thirdly, an already operating zone may ultimately affect the social awareness and future purchasing decisions of drivers who in the face of real restrictions will pay more attention to the emissivity of the purchased vehicles.
2. RDE Emissivity Test in Warsaw and Some Conclusions
As stated above, motor vehicles are in Warsaw a significant source of pollutant emissions which contribute to the city's air quality deterioration, particularly in central districts [44]. Any activity aimed at improving this situation should take into account the current technical characteristics of the car fleet in the city, especially in terms of their emissivity. This task has been completed by The Real Urban Emissions (TRUE) initiative, jointly established by the Federation International de l'Automobile (FIA) and the International Council on Clean Transportation (ICCT). The initiative aims to provide city authorities with data on the real emissions for basic vehicles categories operating in the city, breakdown by fuel type, millage, and Euro norm certification. The characteristics covering the basic pollutants determining the urban environment quality (emission data of NOX and PM2.5 are utilized in this study), provide a key set of information being crucial for strategic decision-making, including the design of the Low Emission Zone.
In the autumn of 2020, as a part of the TRUE initiative, real-world emission investigations were carried out in Warsaw. The purpose was to provide detailed information on the real car fleet emissivity and to support efforts of the city authorities in the fight against poor air quality. Real Driving Emissions (RDE) tests are needed to reduce the gap between results from the laboratory or rolling road tests and those which were emitted in the real world. Using remote sensing technology, over 220 000 valid measurements have been performed referring to 147 777 unique vehicles in Warsaw. The related reports [18] and [44] provide a detailed assessment of the actual emissions from the Warsaw vehicle fleet, as well as some policy recommendations for improving the environmental performance of the cars in the city. In particular, its goal is to help to determine how the Warsaw authorities can reduce the traffic-induced air pollution. The study also contains very timely analysis for the city, which started a discussion of the LEZ launch in Warsaw at that time.
Passenger cars are the most common in the sample, accounting for 68% of the vehicles surveyed, followed by vehicles without a specific class (23%), light commercial vehicles (8%), and buses (1%). Emission standards were assigned only to cars for which vehicle class information was available. Vehicles of other classes, such as motorcycles, heavy trucks, and forestry and agricultural tractors, accounted for less than 0.5% of the entire surveyed fleet.
Moreover, the emissions of imported used vehicles that are very common in Poland, are also examined within the test and a solution is proposed to the problem of relatively high emissions from this category of cars [45]. According to the findings [18], imported used vehicles account for 32% of all measurements obtained for passenger cars. The average age of this category vehicles is more than twice as old than that of domestic-bought ones and their average mileage is also about 1.5 times higher than for the domestic cars. For all pollutants studied, the average emission from these vehicles by fuel type is about twice higher than that from the domestic-bought cars. The high emissions are largely due to the high share of the imported cars that are older or after-accident ones, therefore emitting more pollutants. Results obtained in the Warsaw case study are compared with the similar investigations of the TRUE study conducted in parallel in Brussels, which helps in better understanding how policies carried out in the two cities affect emissions from the light vehicles, vans, and buses.
Figure 1 shows NOX emissions by fuel type with breakdowns by emission category and the related yearly distance travelled. The average distance driven by a Warsaw car in 2020 was estimated at 7,500 km [18]. It is seen that NOX emissions from gasoline vehicles decrease with the tightening of standards, while the diesel cars prior to the introduction of the Euro 6 standard, show only a moderate improvement. The average levels of NOX emissions from diesel passenger cars in Warsaw that meet emission standards from Euro 2 to Euro 6, exceed the limits set by regulations. This confirms the results of TRUE studies in other European cities. More specifically, average NOX emissions for these vehicles are 1.6 to 4.3 times higher than the limits set by regulations [18] This discrepancy is additionally highlighted in Figure 1. And still, diesel cars that are formally subject to the Euro 6 norm emit three times more NOX than their gasoline-powered ones. Only diesel vehicles meeting the Euro 6dT and Euro 6d show comparable NOx emission level.
Also the PM emissions data collected in Warsaw study depicted in Figure 2 confirm the results of studies conducted in other European cities. In particular, pre-Euro 5 diesel vehicles, which are not equipped with diesel particulate filters (DPFs), emitted PM at levels 4 to 11 times higher than for gasoline-engine cars. On the other hand, the presence of DPF filters has significantly improved the emission results of PM from diesel vehicles under the Euro 5 which emitted 80% less PM compared to the Euro 4 diesels. Also noteworthy is the relatively high level of PM emissions observed for gasoline vehicles meeting Euro 1 to Euro 3 standards, as these older gasoline cars were more common among the all surveyed in Warsaw than older diesel vehicles.
Although the average PM emissions from diesel vehicles have decreased dramatically after introduction of the Euro 4 standard and reduced due to the use of DPFs, improper maintenance, aging, intentional tampering or removal of DPF filters can again increase levels of PM emissions from individual vehicles. The improper operations and modifications of DPF filters observed in the Warsaw vehicle fleet confirm the findings of an earlier TRUE study in Brussels. The study revealed also that PM car emissions often exceed the required limit, what suggests that malfunctioning or tampering in the DPFs may be a more common problem.
Generally, it is strongly recommended in [17] to immediately withdraw vehicles certified below Euro 4 standard, regardless of the fuel type. These cars are more than 15 years old and currently account for 37% of NOX and 51% of PM emissions, respectively, that is a disproportionate share of pollution in relation to their share of traffic. The proposed policy should also ban at an early stage Euro 4 and Euro 5 diesel vehicles, which are responsible for 27% of NOx and 28% of PM total emissions, respectively. Environmental benefit means reducing the use of old vehicles, usually operating beyond the required emission lifetime [44] and characterized by increased emissions.
3. Characteristics of the Low Emission Zone Planned in Warsaw
Creation of the Low Emission Zone by the Warsaw authorities is a response to residents’ demands for improving air quality. The topic has been raised repeatedly by NGOs and social movements concerned with the health and quality of life in the city. The implementation of LEZ is also an obligation of the Warsaw authorities, resulting from the implementation of the Air Protection Program for the Mazovian Voivodeship [46]. In Poland, a sufficiently softened version of the earlier unsuccessful LEZ project has already been adopted by Kraków where the zone is to take effect from 2024. The authorities of Wrocław also presented their own project.
The Warsaw authorities also intend to implement in 2024 the first stage of the zone which will restrict the most polluting vehicles from driving in the city center [47]. The area of the zone, the subsequent deadlines for tightening limits, and the requirements or exceptions for selected groups of people or vehicles are being the subject of public consultations. Due to the project [48,49], the zone (covering about 8% of the city domain) will be in place from July 2024 and will cover most of the center and adjacent parts of the neighboring districts. The zone's boundaries will coincide with the major roads and railroads that will not be however included into the zone. The western and southern boundaries of the zone are formed by the major arterial streets, while the railroad bypass bounds the zone to the east and north. The planned zone’s area is shown in Figure 3.
The project of LEZ creation in Warsaw takes into account all important TRUE [18] and [17,44] recommendations discussed in the previous sections [17,18,44]. In particular, this means very strict limitations for the pre-Euro 4 diesel engines from the first stage of the zone’s launch. The entire process of implementing the zone has been divided into five two-year stages. In the first stage (starting in 2024), the LEZ driving restriction would apply to pre-Euro 2 gasoline vehicles (older than 27 years) and pre-Euro 4 diesel vehicles (older than 18 years). Later, consistently every two years, the requirements for emission standards (and the related vehicle age) for gasoline and diesel cars traveling in the zone will be increased, respectively, until the final stage, starting in 2032. Figure 4 shows details on the subsequent steps of the zone implementation [47]. The City Council may also decide to expand the zone in the future. Such a decision, however, will require prior consultation with the residents.
The increasing requirements for vehicles of gasoline and diesel categories will result in an appropriate reduction in emissions, both NOx and PM, in the consecutive stages. The results of the RDE emissivity test [18] discussed in Section 2 and especially the emissivity results presented in Figs 1-2 were utilized to quantify the expected reduction of NOx and PM emission levels after implementation of the subsequent stages of the zone implementation.
The estimates were obtained taking into account the natural vehicle replacement by new ones at the subsequent stages of meeting more restrictive emissivity standards. Table 1 presents the assessed reduction of the total NOX and PM emissions during implementation of the subsequent stages of the zone. The indicated percentage reductions in emissions of major pollutants are comparable to the estimates presented in [47].
4. Simulation Results
In order to assess influence of the zone implementation on the atmospheric pollution in the Warsaw conurbation, modeling of pollutant dispersion in the city was carried out using the Gaussian Modeling System CALPUFF, v.7.0 [50]. The model simulation was used to calculate the average annual concentrations of the main pollutants in the city, with particular focus on the LEZ area.
The area considered in the computations encompasses Warsaw and its immediate surroundings, i.e. a strip approximately 30 km wide (Figure 5). The emission field includes three categories of sources, located both in the city and in the surroundings (their numbers are given in parentheses, respectively): (a) point sources (4073), (b) traffic line sources (1806+4918), (c) municipal area sources (1452+5819). The transboundary pollution inflow, including the primary and secondary pollutants, was also considered [38].
The spatial resolution applied in computer simulation is 0.5 km x 0.5 km homogeneous grid inside Warsaw as well as in the surrounding satellite cities, and 1 km x 1 km in the vicinity belt. The simulations were performed for the year 2018 (representing baseline emission dataset), as well as after implementing the subsequent LEZ restrictions, discussed above. The related annual mean concentration maps for the key pollutants, NOX and PM2.5, are presented in Figure 6.
Figure 6a presents the annual mean NOx concentration map for the baseline (2018) emission data. The following, Figs 6b-c show the NOx concentration maps after launching stage 3 of the LEZ (2024) and stage 5 (2032), respectively. These maps show significant, about 36% reduction of NOX concentration within the zone. On the other hand, the launch of the zone also has some minor impact on the average concentration of a given pollutant throughout the city. In this case, the city-wide averaged NOx concentration, after the activation of the final stage of the LEZ, drops by about 1-1.5 μg/m3, compared to the baseline data. The map shown in Figure 6d additionally takes into account the reduction of the municipal sector emission as a result of the just ongoing anti-smog program, as well as the comprehensive modernization of the transportation sector. As shown in [21], the implementation of these projects will additionally reduce NOX emissions by about 25%.
In a similar way, Figure 7 shows the impact of LEZ activation on PM2.5 concentration in the city. In this case, however, the effect of launching the zone is far less spectacular as compared to NOX. The maps in Figure 7b-c depicting the activation of stages 3 and 5, show a slight reduction in concentrations within the zone boundaries. Concentrations averaged within the entire zone decrease by about 1.0 μg/m3 as compared to the initial state shown in Figure 7a. A significant reduction in PM2.5 concentrations throughout the city is achieved in this case by the implementation of the anti-smog project in the municipal sector (Figure 7d).
The fundamental difference in the effectiveness of LEZ for the two pollutants presented reflects the structure of the fuel mix in Poland. In particular, for the baseline data, NOX concentration averaged for the city is 25.8 mg/m3, while within the LEZ boundaries is 35 mg/m3, thus is much higher due to a high volume of the vehicle traffic inside the zone. After full implementation of the zone, the corresponding concentrations are 24.4 μg/m3 and 23 μg/m3, respectively, i.e., the average concentration in the zone is even lower than in the city. The difference remains when the anti-smog modernization projects have been completed, where the final concentrations are 18.4 μg/m3 and 16 μg/m3, respectively. The analogous differences for PM2.5 concentrations are much smaller and for Warsaw and the LEZ are, respectively, 19.9 and 19.7 for the baseline data, 19.08 and 18.8 for the LEZ implementation, 15.9 and 15.0 resulting from modernization of the area emissions of the municipal sector due to the anti-smog program.
The evident discrepancies in the zone's efficiency with respect to emission reduction of the above key pollutants are additionally explained in Figure 8. This figure shows the emission source apportionments for NOX and PM2.5 pollutions. The former (left panel) depicts that full NOx emission consists of above 50% from the line (traffic) sources contribution, mainly those in the city (Line_waw, yellow). Thus, launching the subsequent zone stages results in a significant reduction in NOx concentrations within its borders. Additionally, a quite important contribution of the area sources, and especially external inflow, results in a definite reduction in concentrations within the city, when the anti-smog modernization program is completed. The mean NOX concentration inside the LEZ in each case remains lower by about 2 μg/m3 than the city averaged value.
The right panel in Figure 8 shows that the area sources of the municipal sector (red) have a predominant share in the final PM2.5 concentration while at the same time the contribution of traffic is minor. Mainly, only the primary traffic emission (yellow) that is moderate, is reduced by implementing the LEZ restrictions. For this reason, the subsequent maps in Figure 7 show only minor changes in PM2.5 concentrations associated with the activation of the consecutive LEZ stages. On the other hand, due to the dominating impact of the area sources as well as the transboundary inflow, the launch of the overall (for the surrounding region) anti-smog modernization program results in a clear reduction in pollution throughout the city. The PM2.5 concentration levels inside and outside the zone remain close to each other.
The effectiveness of LEZ implementation can also be expressed in reduction of the achieved population exposure. Table 2 presents population exposures to NOX and PM2.5, averaged over the entire city and LEZ domain, respectively.
The last three columns in Table 2 present the average exposure to NOX pollution presented on the maps Figure 6a-c, and the average exposure to PM2.5 pollution shown on the maps Figure 7a-c. LEZ implementation changes the NOx exposure values in the same way as the average concentrations. In particular, the exposure inside LEZ in the base year is much higher than the exposure for the city as a whole, but becoming smaller after full implementation of the zone. Also in the case of particulate matters, the spatial distribution of the exposure coincides with the corresponding map of PM2.5 concentrations, which is the result of a fairly uniform distribution of population density in Warsaw. In this case, the effect of the zone's implementation on changes in exposure values is negligible, but exposure to PM2.5 in the LEZ is always lower than in the city as a whole, including the baseline year. This is due to the dominant contribution of the municipal sector to PM2.5 concentration with only a small contribution of transportation (cf. Figure 8) and the fact that a major part of the dominant PM2.5 emission sources is located outside the LEZ.
The numerous implementations of LEZ presented in the literature differ not only in the size of the city, nor the zone itself, and nor the approach applied, but also in the main criterion used to assess the effectiveness of a given implementation. This may be the concentration of the main pollutants, the exposure of the residents or the resulting health effects. Since the car traffic is in this case the main source of air pollution, a natural indicator of the zone's effectiveness is reduction of NOx concentration, often supplemented by PMs pollution. Hence NOx concentration is a reliable indicator when comparing different LEZ implementations. In particular, it was shown in [29] that LEZ in London caused NOx concentration reduction of 17%, while additional Ultra LEZ activation increased the reduction up to 20%. At the same time, the Malmö LEZ activation [23] provided 13.5% reduction, while in Haifa [33] it was about 13%. The implementation of the LEZ in Greater Paris [35] showed a reduction in residents' exposure to the combined NO2 and PM2.5 pollution by about 20%. Thus, given the substantial differences in approach used in the analysis and taking additionally into account that the share of old vehicles in Warsaw is much greater than in the above mentioned cities, the results obtained in our study can be considered comparable. Significant differences are seen in the case of PM pollution, because in this case contribution of sources other than those from the car traffic, is more important [24].
This study presents technical assumptions and expected effects of activating a Low Emission Zone in Warsaw, the first stage of which is to be launched in July 2024. In planning the zone, the experience and principles of good practice established in the activation of numerous zones in Western European cities were taken into account. The general strategy of low emission mobility in European conurbations emphasizes the need to decarbonize the transportation sector and to reduce the related harmful emissions. In most West European Union countries different policies are implemented to support the development of electro-mobility, micro-mobility, and car-sharing that involve, for example, exemptions from road taxes, registration taxes, financial benefits, and free parking areas in some cities. Moreover, in most of the major cities LEZs are implemented to limit the negative impact of traffic on air quality in selected urban areas. Nowadays, as stated above, there are above 300 LEZs in Europe, but surprisingly, there is no such zone in the Central and Eastern European (CEE) cities, even if the air quality in this region is often much below the accepted WHO air quality norms. It also refers to Poland, one of the largest countries in CEE.
The design of the Warsaw’s LEZ takes into account the principles developed earlier for the zone creating, as well as the recommendations of institutions performing the RDE emissivity test for the transport sector [17,18,25,44]. These rules suggest, among other things, a gentle gradual introduction of the zone, broad public consultation on the planned restrictions and possible future expansion of the zone's boundaries, but also a rapid exclusion of traffic of the most harmful diesel vehicles.
However, the results presented in the paper show that despite the inclusion of generally recommended rules, the effectiveness of the zone in reducing the negative impact of transport on urban environment is different than in Western European cities, where the road traffic is the main source of the nitrogen oxides and particulate matter concentrations. In Warsaw, due to the predominance of coal combustion in the national economy, that is also evident in the municipal emission, this source is mainly responsible for particulate matter emission (see also [9,21]), with a noticeably smaller contribution from transportation, as is quantitatively explained in Figure 8. A similar problem is likely to persist in other CEE countries, although with different intensity. For this reason, as shown in Section 4, the activation of the subsequent LEZ steps results in a substantial reduction of NOX concentrations in the zone, accompanied by only a slight decrease of PM2.5 pollution. The latter is determined by particulate matter emission from the municipal sector, but is also due to the transboundary inflow. A similar problem is to be expected in other Polish cities, such as Kraków or Wrocław, which are currently launching LEZs. A more balanced contribution of the road transport and the municipal sector to particulate matter emissions will only be possible when the ongoing de-carbonization process has been completed [21]. The related situation is visualized by the NOX and PM2.5 concentration maps shown in Figure 6d and Figure 7d, respectively.
A well-known problem affecting the final emissivity of the car fleet in Warsaw is the high share of imported used cars. The inflow of older higher-emission vehicles should be prevented. It can be obtained by introducing a nationwide policy limiting the age of imported vehicles. Such a policy could also be complemented by other measures, such as scrappage programs, tax breaks, and other financial incentives discouraging the purchase of old vehicles. At the local level, the problem of emissions from imported used vehicles can be addressed by introducing road traffic restrictions connected with the age of vehicles or emission standards.
The creation of LEZ in the city has a direct impact on reducing the level of air pollution within the zone and also, but to a small extent, in its closer surroundings. However, an indirect goal of the zone’s restrictions is also to modify the shopping habits of drivers, in particular very popular in Poland purchasing of used cars. Very restrictive norms related to age and millage may discourage the purchase of the most polluting old cars. This effect may be enhanced by the government's limitations on the used cars import. A similar importance is attached to the consistently increased restrictions on the vehicle emissivity along with the activation of the subsequent phases of the zone. In this case, however, some general problem refers to the planned Euro 7 emissivity legislation, which aims to introduce emission durability requirements of up to 15 years or 240,000 km for the certified vehicles. However, the age and mileage of around 30% of vehicles used in Warsaw are higher than those specified by the requirements [18,44]. This suggests that considering longer lifetimes may be needed to accurately represent the usage of passenger cars in Polish and also other European cities.
High potential for reducing air pollutant emissions from the urban transportation is connected with possible expansion of electro-mobility, while at the same time there are rather not many BEV and HPEV cars operating in Warsaw. In the last two years the fleet of electric cars in Poland more than tripled, and also more than 600 new charging stations were installed in Poland in 2022 [41,42]. This is a better result than in previous years, but still not enough to meet the ambitious targets set by the EU regulations [51]. In the realistic scenario [52], which assumes the introduction of subsidies at an increased level in relation to the pilot program launched in 2020, the Polish all-electric vehicle fleet in 2025 may number around 300,000 units, and about 25% of new cars are usually registered in Warsaw. On the other hand, the recently adopted regulation of the European Union that considers discontinuation of the registration of new combustion-engine cars in the EU after 2035 [51], should increase drivers' interest in purchasing electric/hybrid vehicles, particularly that many car companies are recently modifying their production profile towards electro-mobility. However, the real environmental effect of the above urban car fleet modernization in Poland will not be fully seen unless the processes of de-carbonization of the energy and municipal sectors supported by the actual development of green energy sources [21], are completed.
Author Contributions
Piotr Holnicki: Conceptualization, Methodology, Formal analysis, Data curation, Investigation, Writing–original draft, Writing–review & editing. Andrzej Kałuszko: Resources, Data curation, Software, Computer simulation, Visualization. Zbigniew Nahorski: Conceptualization, Formal analysis, Supervision, Writing–review & editing, Funding acquisition.
Acknowledgments
Research conducted by Zbigniew Nahorski was partially supported by the National Science Centre, Poland under the Grant DEC-2018/30/Q/HS4/00764.
Conflicts of Interest
The authors declare no conflict of interest.
References
- (World Bank 2021) Urban population (% of total population) - European Union. Available online: https://data.worldbank.org/indicator/SP.URB.TOTL.IN.ZS?locations=EU (accessed on 15 March 2023).
- (EEA 2022) Urban air quality. Available online: https://www.eea.europa.eu/themes/air/urban-air-quality (accessed on 10 August 2023).
- (EEA 2018). Exceedance of air quality standard in Europe 2018. Available online: https://www.eea.europa.eu/ims/exceedance-of-air-quality-standards (accessed on 10 October 2023).
- (EEA 2019) Report, No 10/2019. Air quality in Europe — 2019. Available online: https://www.eea.europa.eu/publications/air-quality-in-europe-2019 (accessed on 10 October 2023).
- (EEA 2021) Air quality standards. Available online: https://www.eea.europa.eu/themes/air/air-quality-concentrations/air-quality-standards (accessed on 5 October 2023).
- (WHO 2018). Ambient (outdoor) air pollution. 2018. Available online: https://www.who.int/newsroom/ fact-sheets/detail/ambient-(outdoor)-air-quality-and-health (accessed on 10 October 2023).
- (IQAir 2023). Available online: https://www.iqair.com/world-air-quality-ranking (accessed on 5 August 2023).
- Cakaj, A.; Lisiak-Zielińska, M.; Khaniabadi, Y.O.; Sicard, P. Premature deaths related to urban air pollution in Poland. Atmospheric Environment. 2023, 301, 119723. [Google Scholar] [CrossRef]
- Holnicki, P.; Tainio, M.; Kałuszko, A.; Nahorski, Z. Burden of mortality and disease attributable to multiple air pollutants in Warsaw, Poland. International Journal of Environmental Research and Public Health. 2017, 14, 1359. [Google Scholar] [CrossRef]
- Mueller, N.; Rojas-Rueda, D.; Cole-Hunter, T.; de Nazelle, A.; Dons, E.; Gerike, R.; Götschi, T.; Int Panisi, L.; Kahlmeier, S.; Nieuwenhuijsen, M. ; Health impact assessment of active transportation: A systematic review. Preventive Medicine. 2015, 76, 103–114. [Google Scholar] [CrossRef] [PubMed]
- Qadir, R.M.; Abbaszade, G.; Shnelle-Kreis, K.; Chow, J.C.; Zimmermann, R. Concentrations and source contributions of particulate organic matter before and after implementation of a low emission zone in Munich, Germany. Environmental Pollution 2013, 175, 158–167. [Google Scholar] [CrossRef]
- (WHO 2021). WHO global air quality guidelines 2021. Available online: https://apps.who.int/iris/handle/10665/345329 (accessed on 10 April 2023).
- (NILU 2022) Premature deaths due to air pollution continue to fall in the EU. Available online: https://www.nilu.com/2022/11/premature-deaths-due-to-air-pollution-continue-to-fall-in-the-eu/ (accessed on 15 May 2023).
- (JRC 2019) Air quality: traffic measures could effectively reduce NO2 concentrations by 40% in Europe’s cities. Available online: https://joint-research-centre.ec.europa.eu/jrc-news/air-quality-traffic-measures-could-effectively-reduce-no2-concentrations-40-europes-cities-2019-11-27_en (accessed on 5 August 2023).
- (ISGlobal 2021) Ranking of cities 2021. Available online: https://isglobalranking.org/ranking/#air.
- (IQAir 2023) Air quality in Warsaw. Available online: https://www.iqair.com/poland/mazovia/warsaw (accessed on 4 October 2023).
- (ICCT 2022a) Zalecenia dotyczące strefy czystego transportu w Warszawie (In Polish). Available online: https://theicct.org/wp-content/uploads/2022/04/fs1-true-warsaw-emissions-po-apr22.pdf (accessed on 15 May 2023).
- Lee, K.; Bernard, Y.; Dallmann, T.; Tietge, U.; Pniewska, I.; Rintanen, I. Evaluation of real-world vehicle emissions in Warsaw. TRUE (The Real Urban Emissions) Report, Warsaw, 2022. Available online: https://theicct.org/wp-content/uploads/2022/04/true-warsaw-emissions-apr22.pdf (accessed on 10 January 2023).
- Degraeuwe, B.; Pisoni, E.; Peduzzi, E.; De Meij, A.; Monforti-Ferrario, F.; Bodis, K.; Mascherpa, A.; Astorga-Llorens, M.; Thunis, P. and Vignati, E. Urban NO2 Atlas (EUR 29943 EN). 2019, Publications Office of the European Union, Luxembourg.
- Tezel-Oguz, M.N.; Sari, D.; Ozkurt, N.; Keskin, S.S. Application of reduction scenarios on traffic-related NOx emissions in Trabzon, Turkey. Atmospheric Pollution Research. 2020, 11(12).
- Holnicki, P.; Kałuszko, A.; Nahorski, Z. Scenario analysis of air quality improvement in Warsaw, Poland, by the end of the current decade. Atmosphere. 2022, 1613, 1–14. [Google Scholar] [CrossRef]
- Bernardo, V.; Fageda, X.; Lores-Fillol, R. Pollution and congestion in urban areas: The effects of low emission zones. Economics of Transportation. 2021, 26-27, 100221.
- Flanagan, E.; Malmqvist, E.; Gustafsson, S.; Oudin, A. Estimated public health benefits of a low-emission zone in Malmö, Sweden. Environmental Research. 2022, 214, 114124. [Google Scholar] [CrossRef] [PubMed]
- Holman, C.; Harrison, R.; Querol, X. Review of the efficacy of low emission zones to improve urban air quality in European cities. Atmospheric Environment. 2015, 161, 169. [Google Scholar] [CrossRef]
- (PSPA 2019) Clean Transport Zones. PSPA Report, Warsaw 2019 (in Polish). Available online: https://pspa.com.pl/wp-content/uploads/2020/08/strefy_czystego_transportu_raport_S.pdf (accessed on 10 August 2023).
- (Clean Cities 2022) The development trends of low-and zero-emission zones in Europe. Available online: The-development-trends-of-low-emission-and-zero-emission-zones-in-Europe-1(29).pdf (accessed on 10 August 2023).
- (T&E 2023) Quantifying the impact of low- and zero-emission zones in six European cities. Available online: https://www.transportenvironment.org/wp-content/uploads/2023/05/zones-compressed.pdf (accessed on 10 August 2023).
- Duque, L., Relvas, H., Silveira, C., Ferreira, J., Monteiro, A., Gama, C., Rafael, S., Freitas, S., Borrego, C., Miranda, A.I., 2016. Evaluating strategies to reduce urban air pollution. Atmospheric Environment. 127, 196-207.
- Hajmohammadi, H. , Heydecker, B. Evaluation of air quality effects of the London ultra-low emission zone by state-space modelling. Atmospheric Pollution Research. 13, 101514.
- Kowalska-Pyzalska, A. Perspectives of development of low emission zones in Poland: A short review. Frontiers in Energy Research. 2022, 10, 898391 Available online:. [Google Scholar] [CrossRef]
- Panteliadis, P.; Maciej Strak, M.; Hoek, G.; Weijers, E.; van der Zee, S.; Dijkema, M. Implementation of a low emission zone and evaluation of effects on air quality by long-term monitoring. Atmospheric Environment. 2014, 86, 113–119. [Google Scholar] [CrossRef]
- Ferreira, F. , Gomes, P., Tente, H., Carvalho, A.C., Pereira, P., J. Monjardino, J. Air quality improvements following implementation of Lisbon's Low Emission Zone. Atmospheric Environment 2015, 122, 373–381. [Google Scholar] [CrossRef]
- Tartakovsky, D.; Kordova-Biezuner, L.; Berlin, E.; Broday, D.M. Air quality impacts of the low emission zone policy in Haifa. Atmospheric Environment. 2020, 232, 117472. [Google Scholar] [CrossRef]
- (T&E 2019) Low-Emission Zones are a success - but they must now move to zero-emission-emission mobility. Available online: https://www.transportenvironment.org/wp-content/uploads/2021/07/2019_09_Briefing_LEZ-ZEZ_final.pdf (accessed on 5 May 2023).
- Host, S.; Honoré, C.; Joly, F.; Saunal, A. ; Le Tertre. A.; Medina, S. Implementation of various hypothetical low emission zone scenarios in Greater Paris: Assessment of fine-scale reduction in exposure and expected health benefits. Environmental Research 2020, 185, 109405. [Google Scholar] [CrossRef] [PubMed]
- Lurkin, V.; Hambuckers, J.; van Wonsel, T. Urban low emissions zones: A behavioral operations management perspective. Transportation Research Part A: Policy and Practice 2021, 144, 222–240. [Google Scholar] [CrossRef]
- Malina, Ch.; Scheffler, F. 2015. The impact of Low Emission Zones on particulate matter concentration and public health. Transportation Research Part A: Policy and Practice 2015, 77, 372–385. [Google Scholar]
- Holnicki, P.; Nahorski, Z.; Kałuszko, A. Impact of car fleet modernization on the traffic originated air pollution in an urban area – case study. Atmosphere. 2021, 12, 1581. [Google Scholar] [CrossRef]
- (EV 2021) Emissions from electric vehicles. Available online: https://afdc.energy.gov/vehicles/electric_emissions.html (accessed on 10 April 2023).
- (HPEV 2021) Hybrid cars - an effective tool to fight smog. Available online: https://energy5.com/examining-the-popularity-of-hybrid-electric-cars-and-its-impact-on-the-environment (accessed on 5 May 2023).
- (PSPA 2021) Perspectives e-mobility in Poland (in Polish). Available online: https://pspa.com.pl/2022/raport/pspa-ocenia-rok-2021-w-polskiej-elektromobilnosci-raport/ (accessed on 5 October 2023).
- (PSPA 2022) Electric Mobility Inevitable, or not. PSPA report Warsaw, 2022. Available online: https://pspa.com.pl/?raporty=electric-mobility-inevitable-or-not (accessed on 5 October 2023).
- (T&E 2022) Clean Cities. The development trends of low- and zero-emission zones in Europe. Available online: https://cleancitiescampaign.org/wp- content/uploads/2022/07/ (accessed on 5 October 2023).
- (ICCT 2022b) Ocena rzeczywistej emisyjności pojazdów w Warszawie (In Polish). Available online: https://theicct.org/wp-content/uploads/2022/04/true-warsaw-emissions-po-apr22.pdf.
- (UN 2021) UN Environment Programme. Used vehicles and the environment. Available online: https://www.unep.org/resources/report/used-vehicles-and-environment-progress-and-updates-2021 (accessed on 10 August 2023).
- (Anti-smog 2022) Anti-smog resolution of the Mazovian Voivodeship (In Polish). Available online: https://www.powietrze.mazovia.pl/uchwala-antysmogowa/informacje-ogolne-na-temat- uchwały-antysmogowej (accessed on 15 May 2023).
- (CTZ 2023) Design of Clean Transportation Zone in Warsaw (in Polish). Available online: https://warszawa19115.pl/web/guest/-/strefa-czystego-transportu-sct- (accessed on 15 May 2023).
- (SCT 2022) Clean transport Zones in Poland. Kraków and Warsaw. Available online: https://e.autokult.pl/czy-dzieki-strefom-czystego-transportu-w-polskich-miastach-rzeczywiscie-bedzie-zylo-sie-lepiej,6860088560659136a (accessed on 15 May 2023).
- Warsaw’s clean transport zone by 2024. Available online: https://www.eltis.org/in-brief/news/warsaw-install-clean-transport-zone-2024 (accessed on 5 October 2023).
- (Exponent 2019) CALPUFF Version 7 - Users Guide Addendum. Exponent, Inc. Maynard, MA (2019). Doc. no. Z170308064614 – 0072.
- (EU 2022) Available online:. Available online: https://www.france24.com/en/europe/20220609-eu-parliament-approves-ban-on-new-fossil-fueled-cars-by-2035 (accessed on 5 October 2023).
- (PSPA 2023) Year 2022 in Polish e-mobility. PSPA Report, Warsaw 2023 (in Polish). Available online: https://pspa.com.pl/?raporty=rok-2022-w-polskiej-elektromobilnosci (accessed on 5 October 2023).
Figure 1.
Average NOx emissions from diesel and gasoline passenger cars for each emission standard and the yearly distance travelled (in km), obtained during the 2020 Warsaw remote sensing campaign [18]. The X-axis indicates the Euro-norm emission categories and the yearly distance driven, related to car traffic in each category.
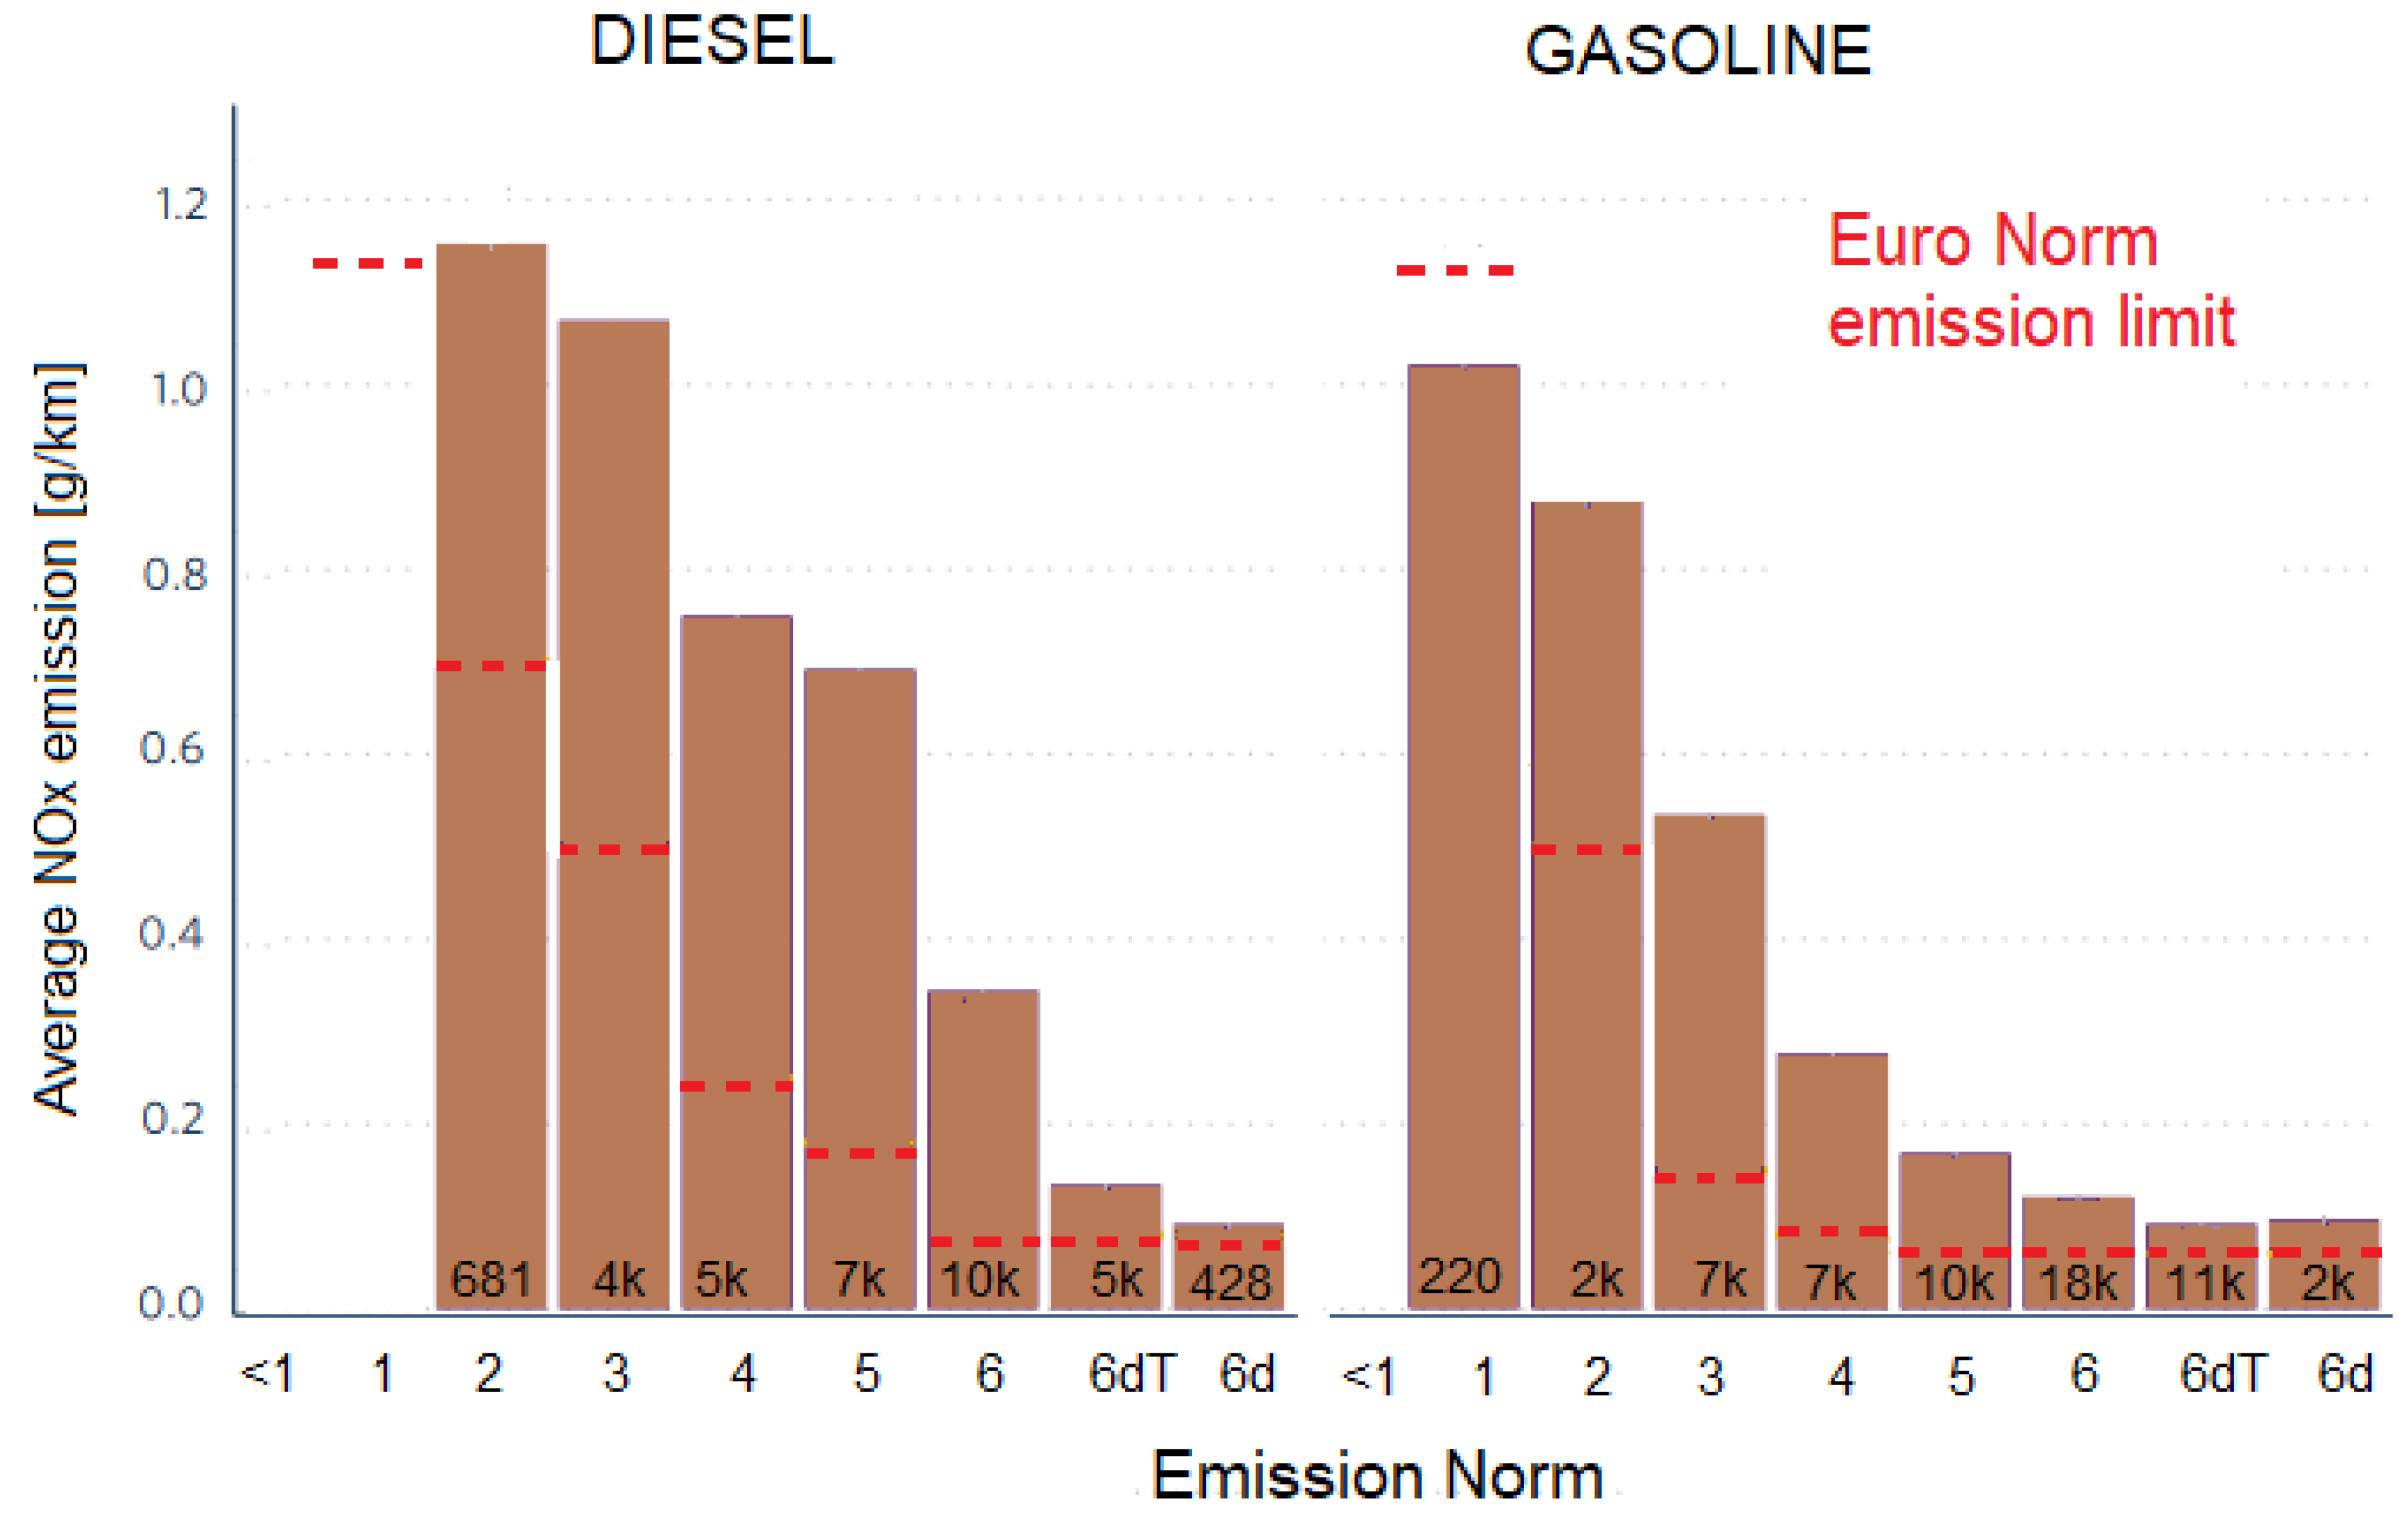
Figure 2.
Average PM emissions from diesel and gasoline passenger cars for each emission standard and the yearly distance travelled, obtained during the 2020 Warsaw remote sensing campaign [18].
Figure 2.
Average PM emissions from diesel and gasoline passenger cars for each emission standard and the yearly distance travelled, obtained during the 2020 Warsaw remote sensing campaign [18].
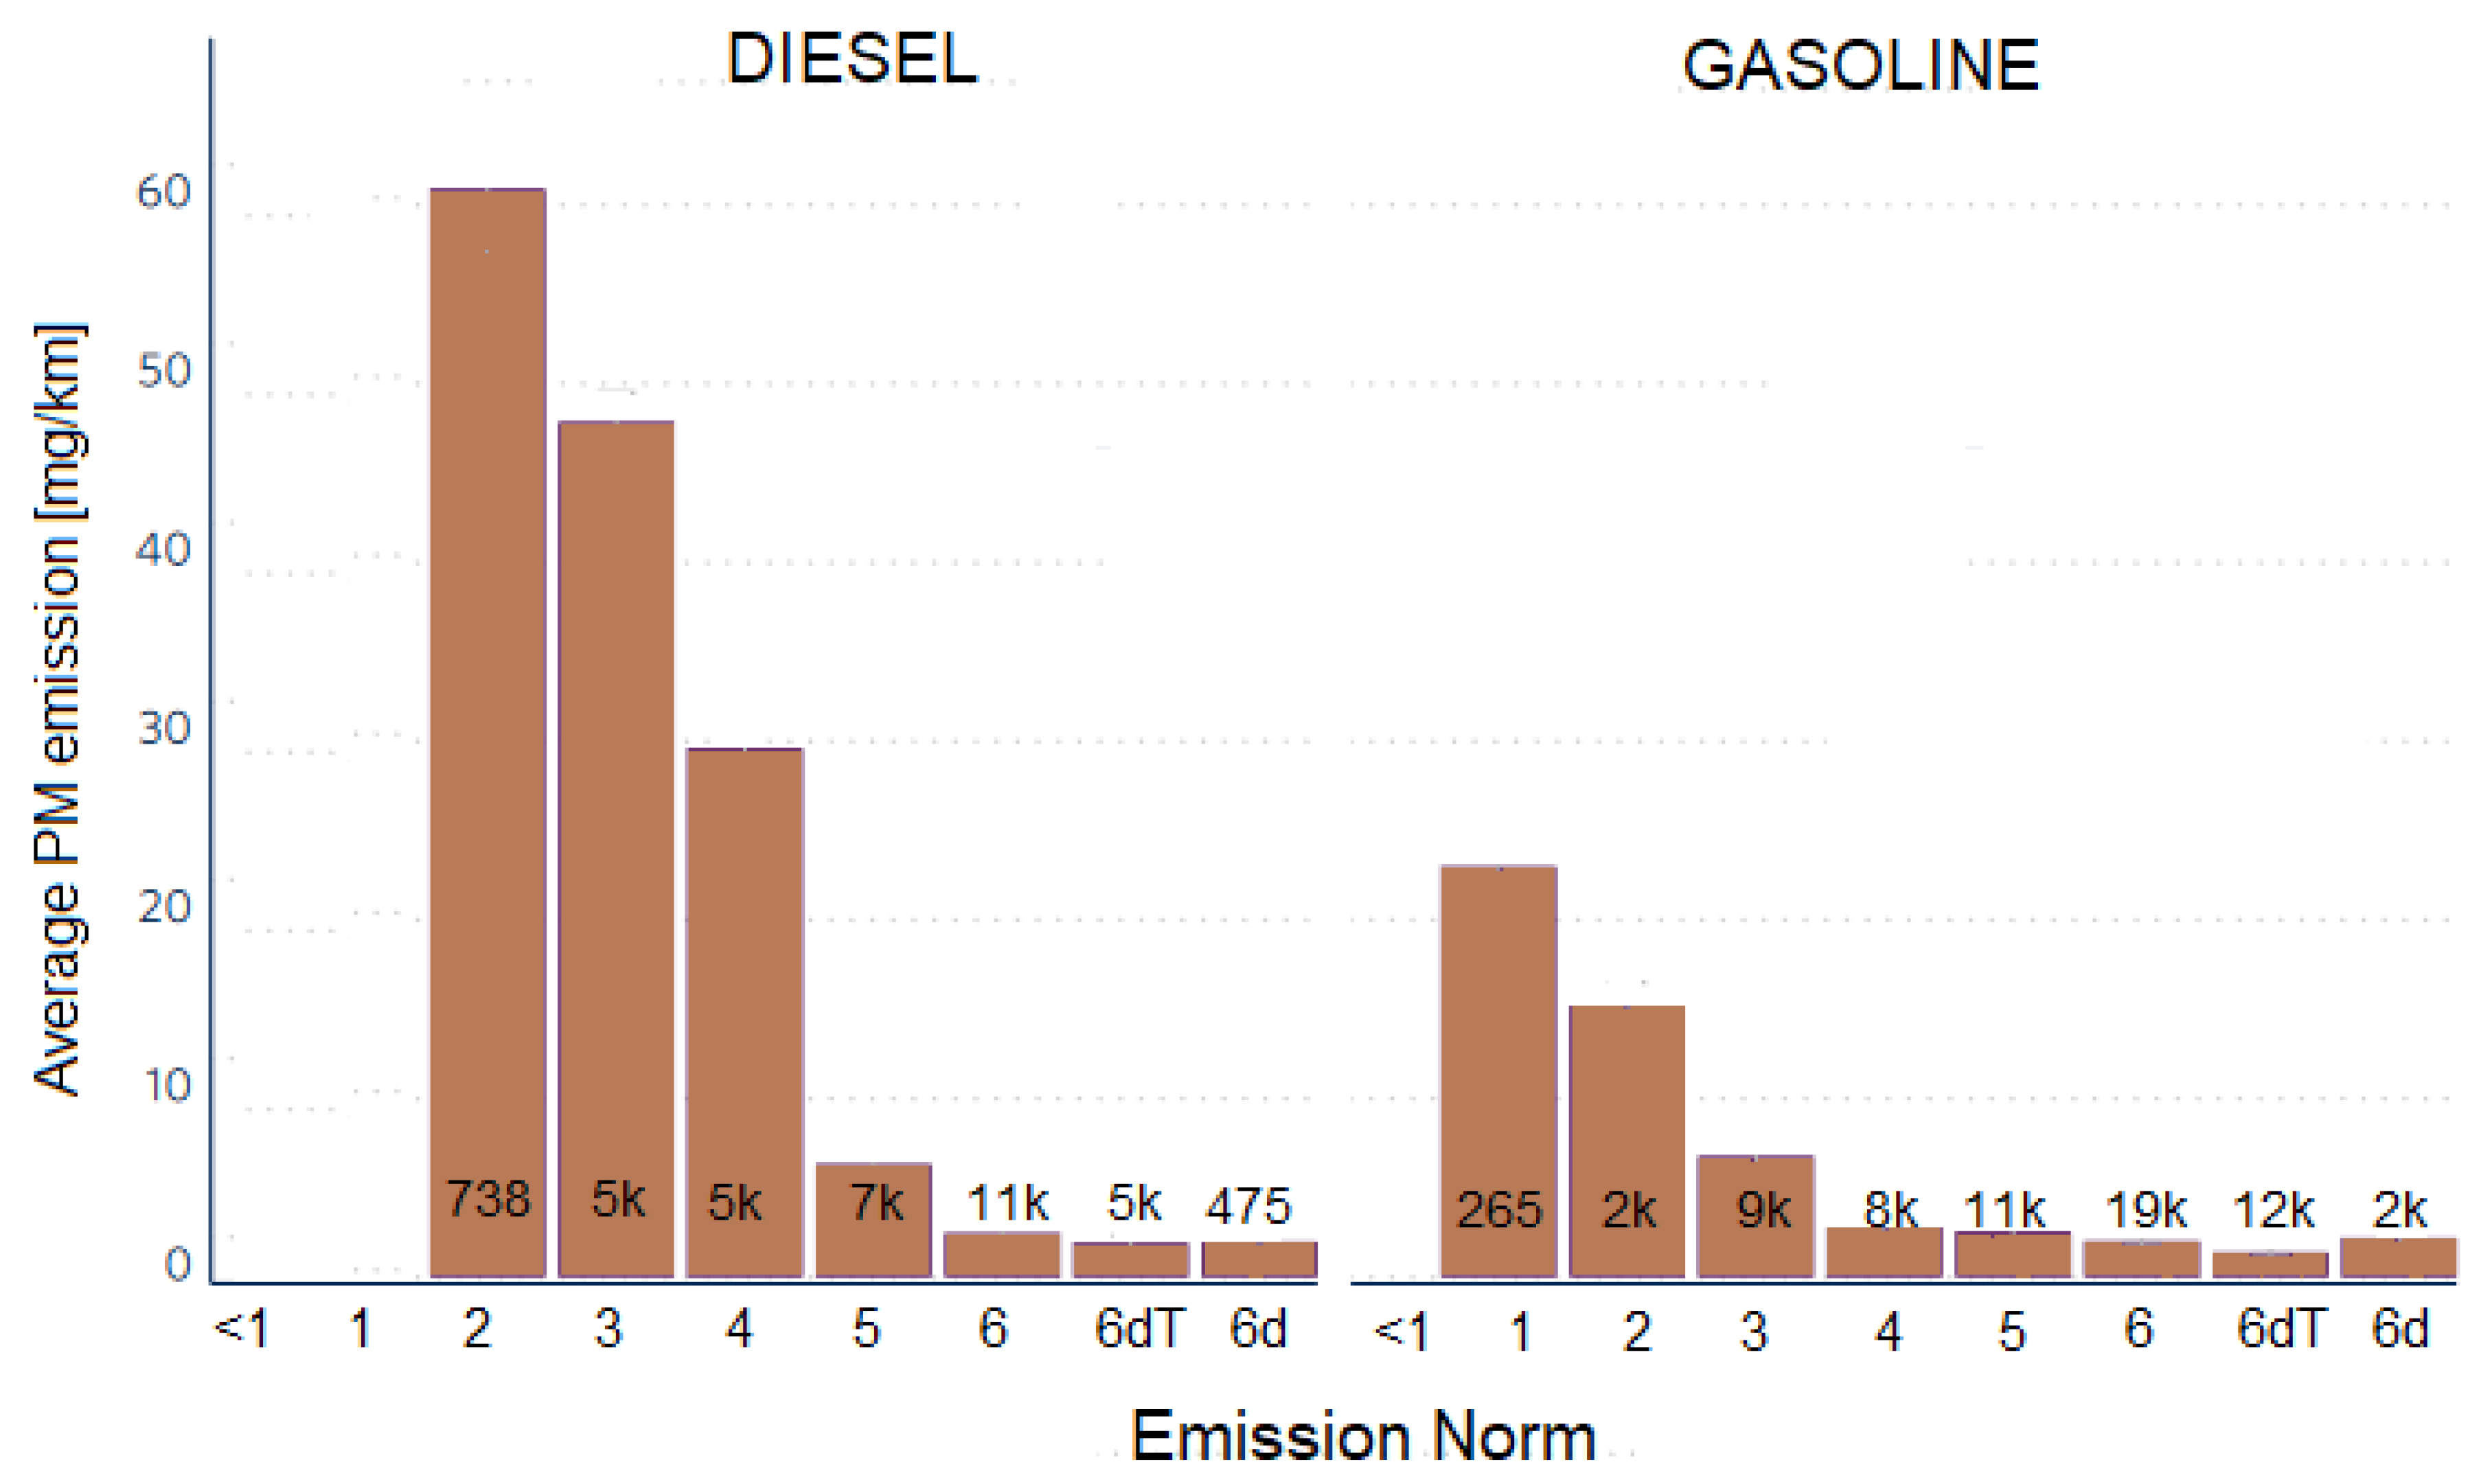
Figure 3.
The border of the planned Low Emission Zone in Warsaw.
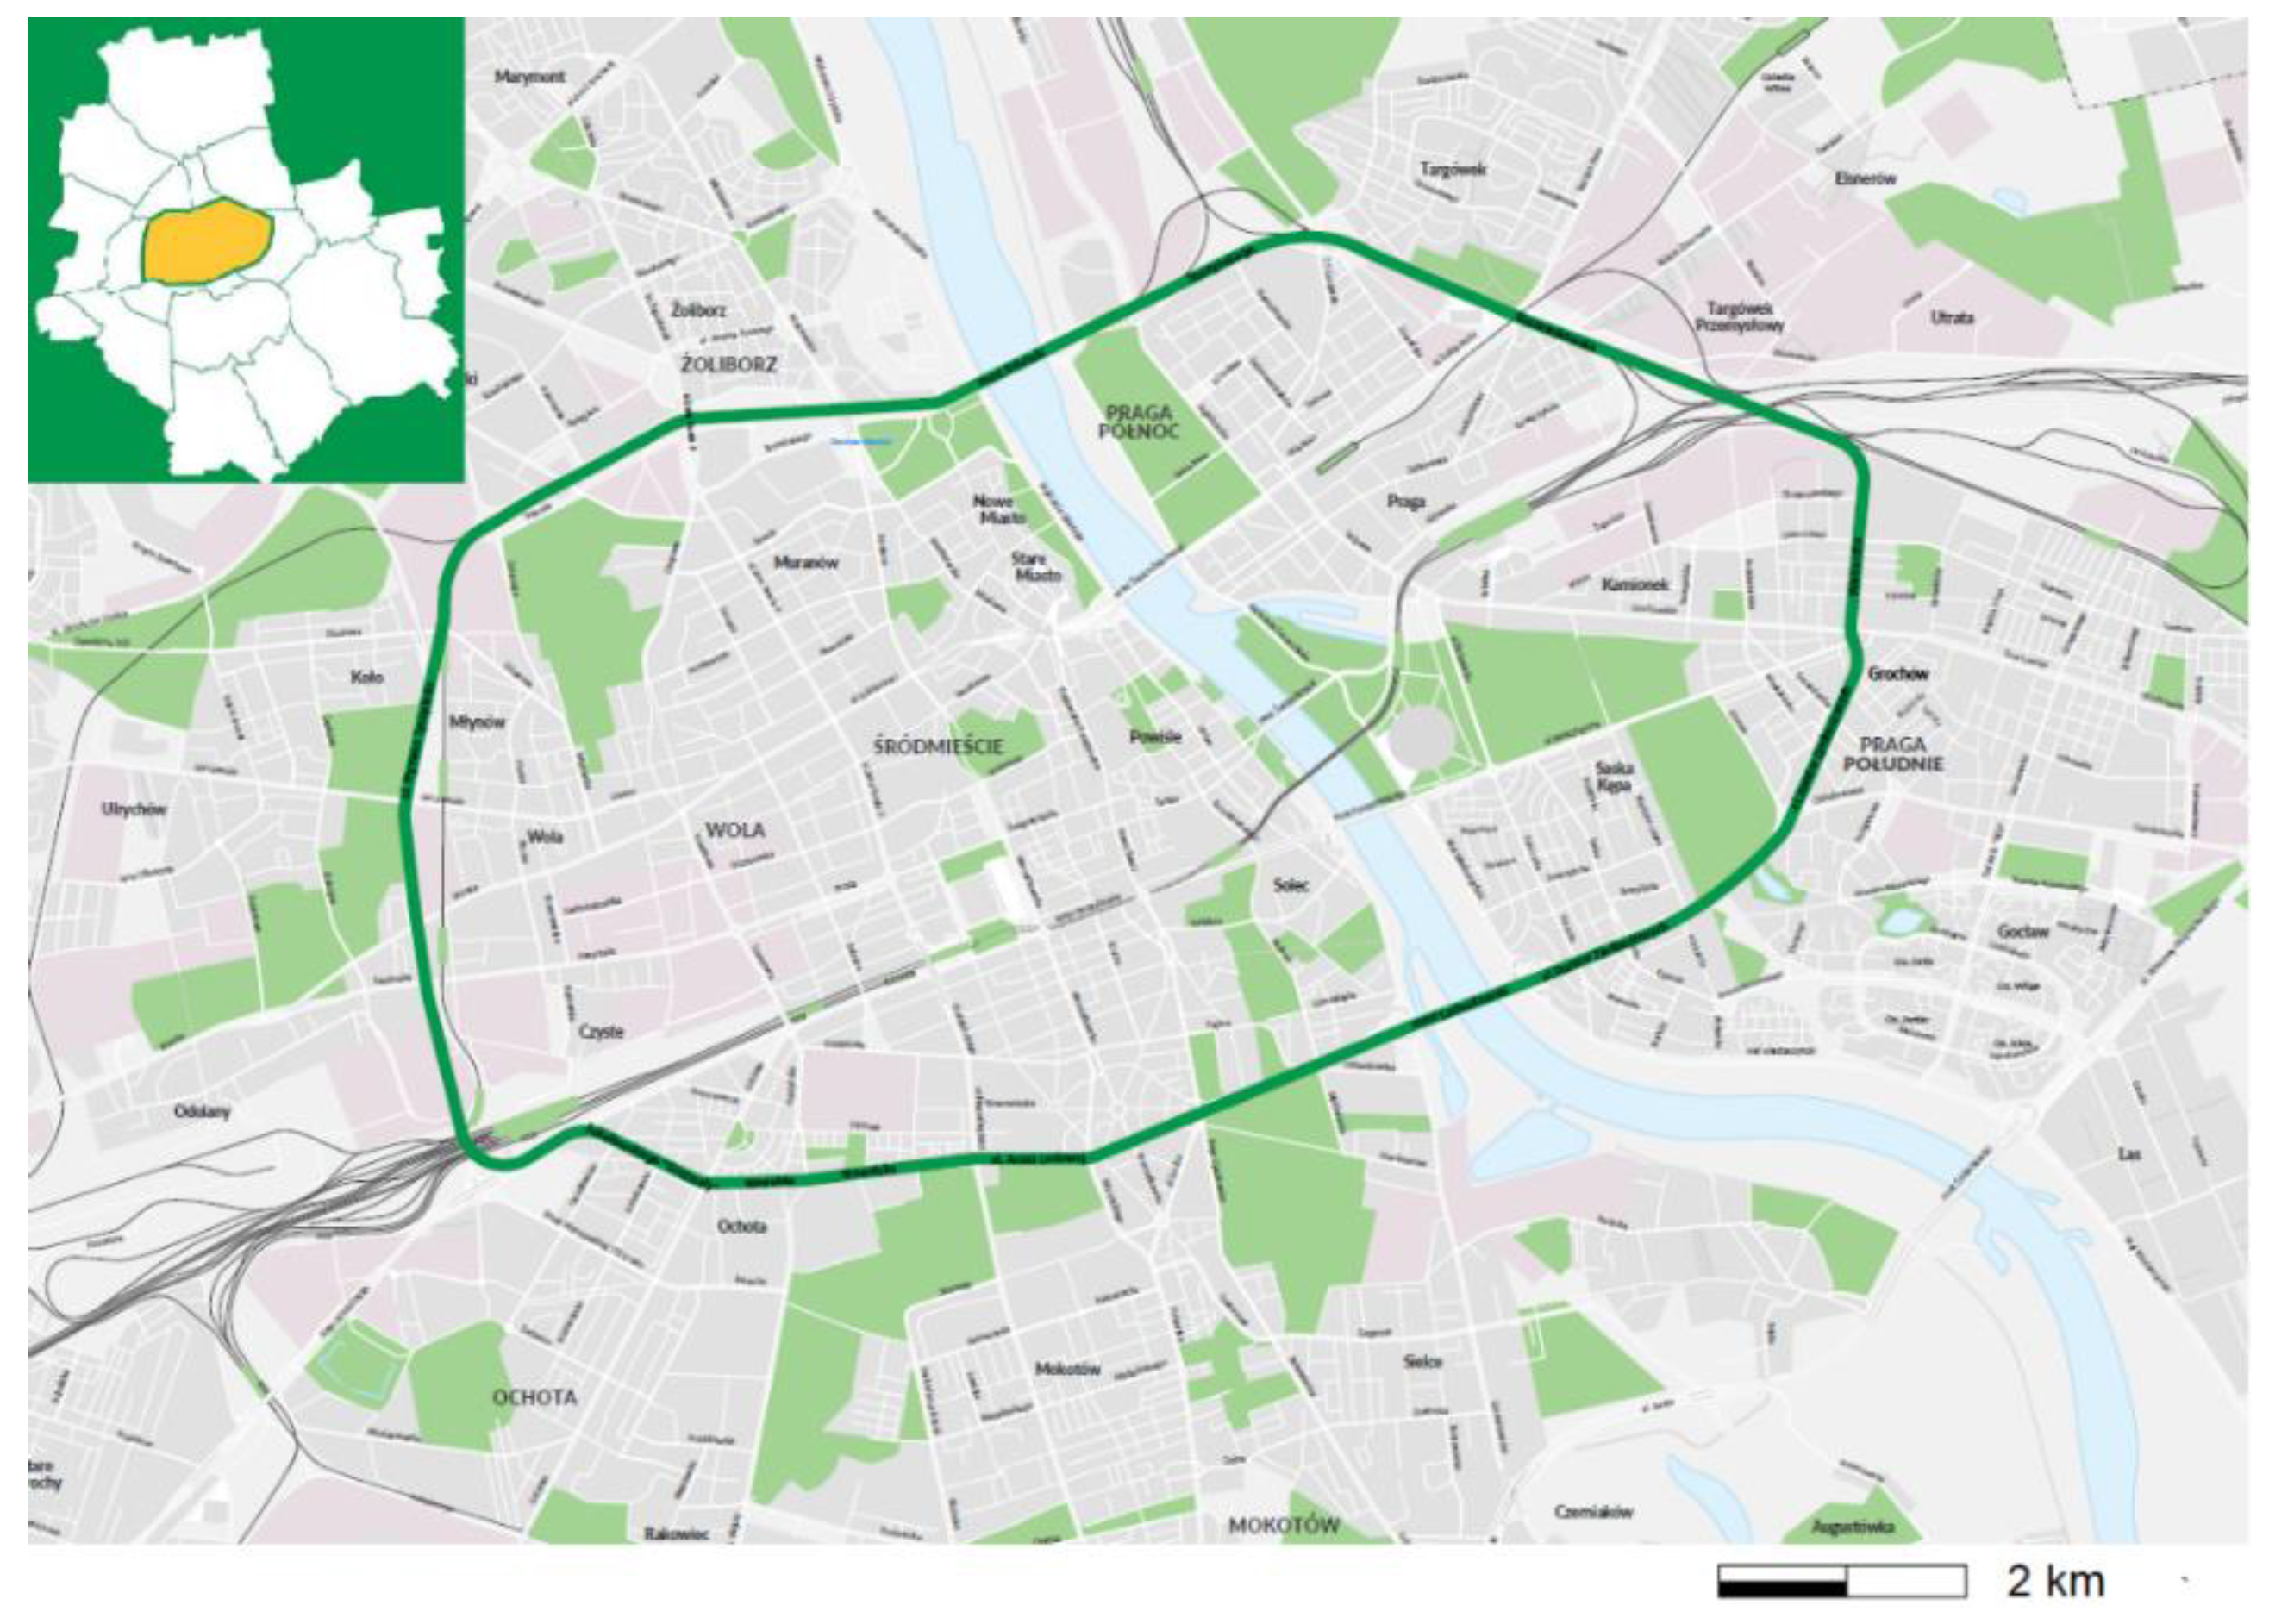
Figure 4.
The planned implementation of the Low Emission Zone in Warsaw. The vehicle ages correspond to the start of the first stage of the zone’s launch.
Figure 4.
The planned implementation of the Low Emission Zone in Warsaw. The vehicle ages correspond to the start of the first stage of the zone’s launch.
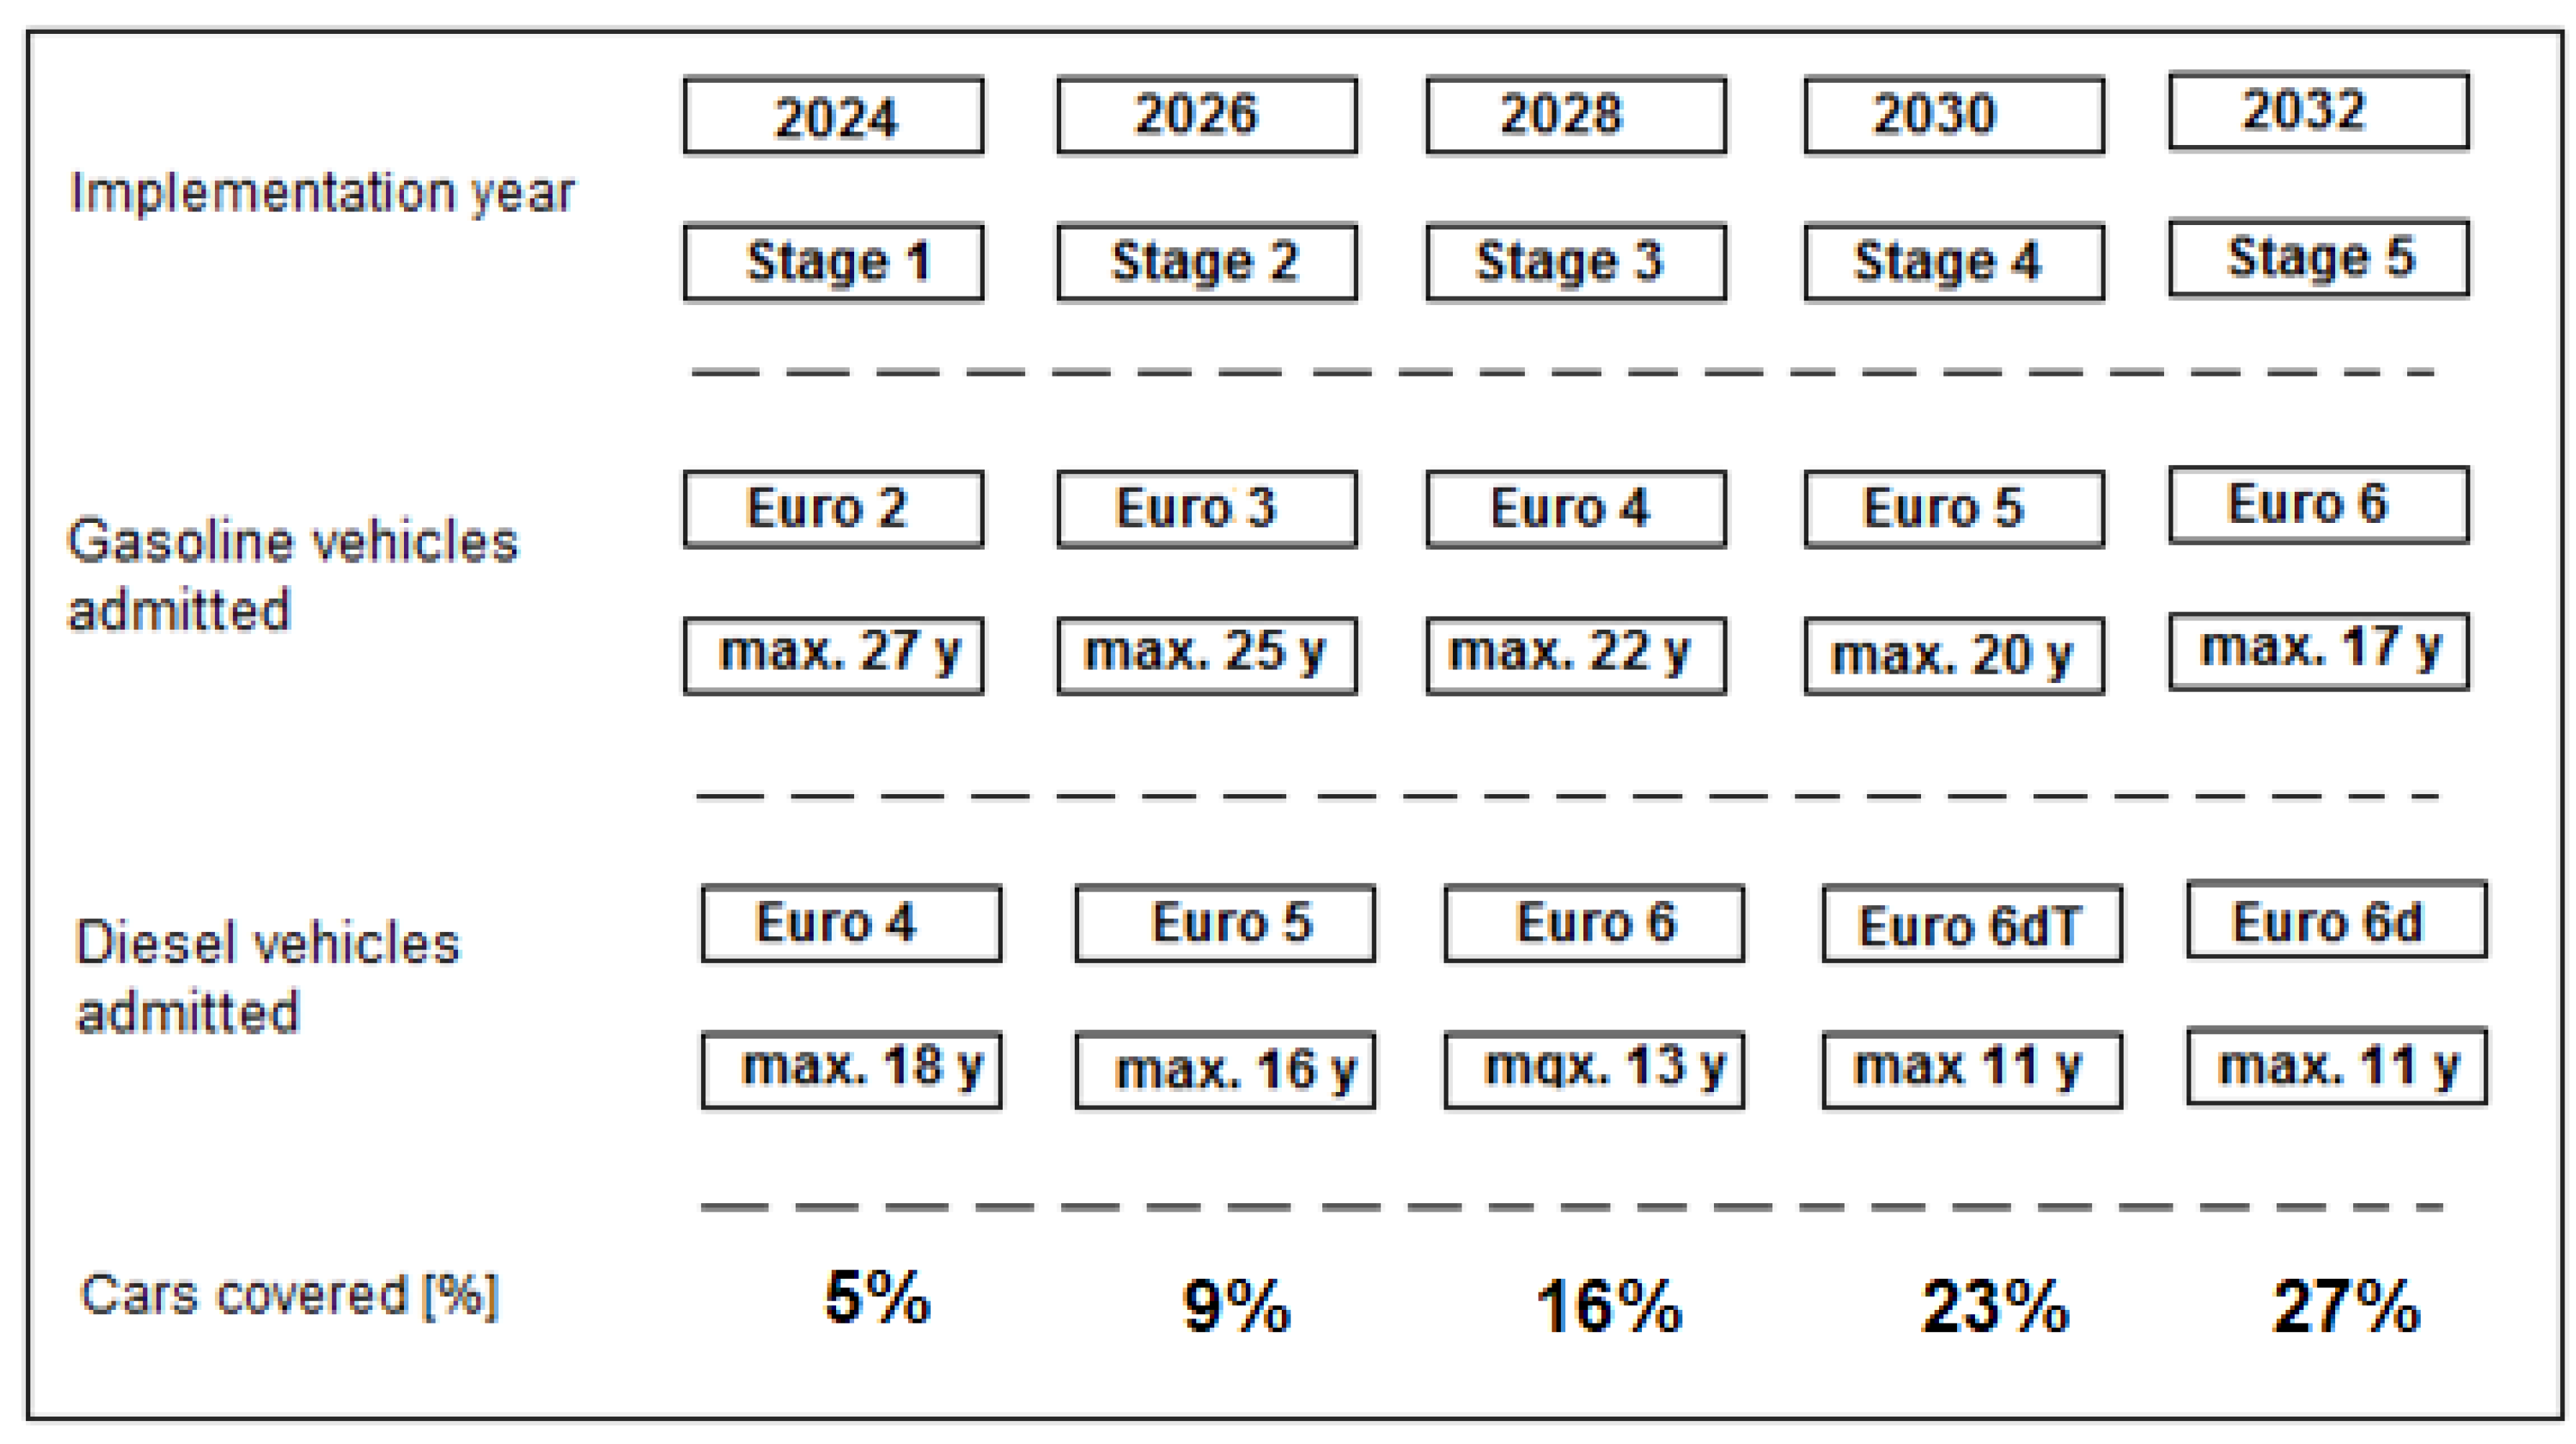
Figure 5.
The study emission field and the receptor area inside Warsaw.
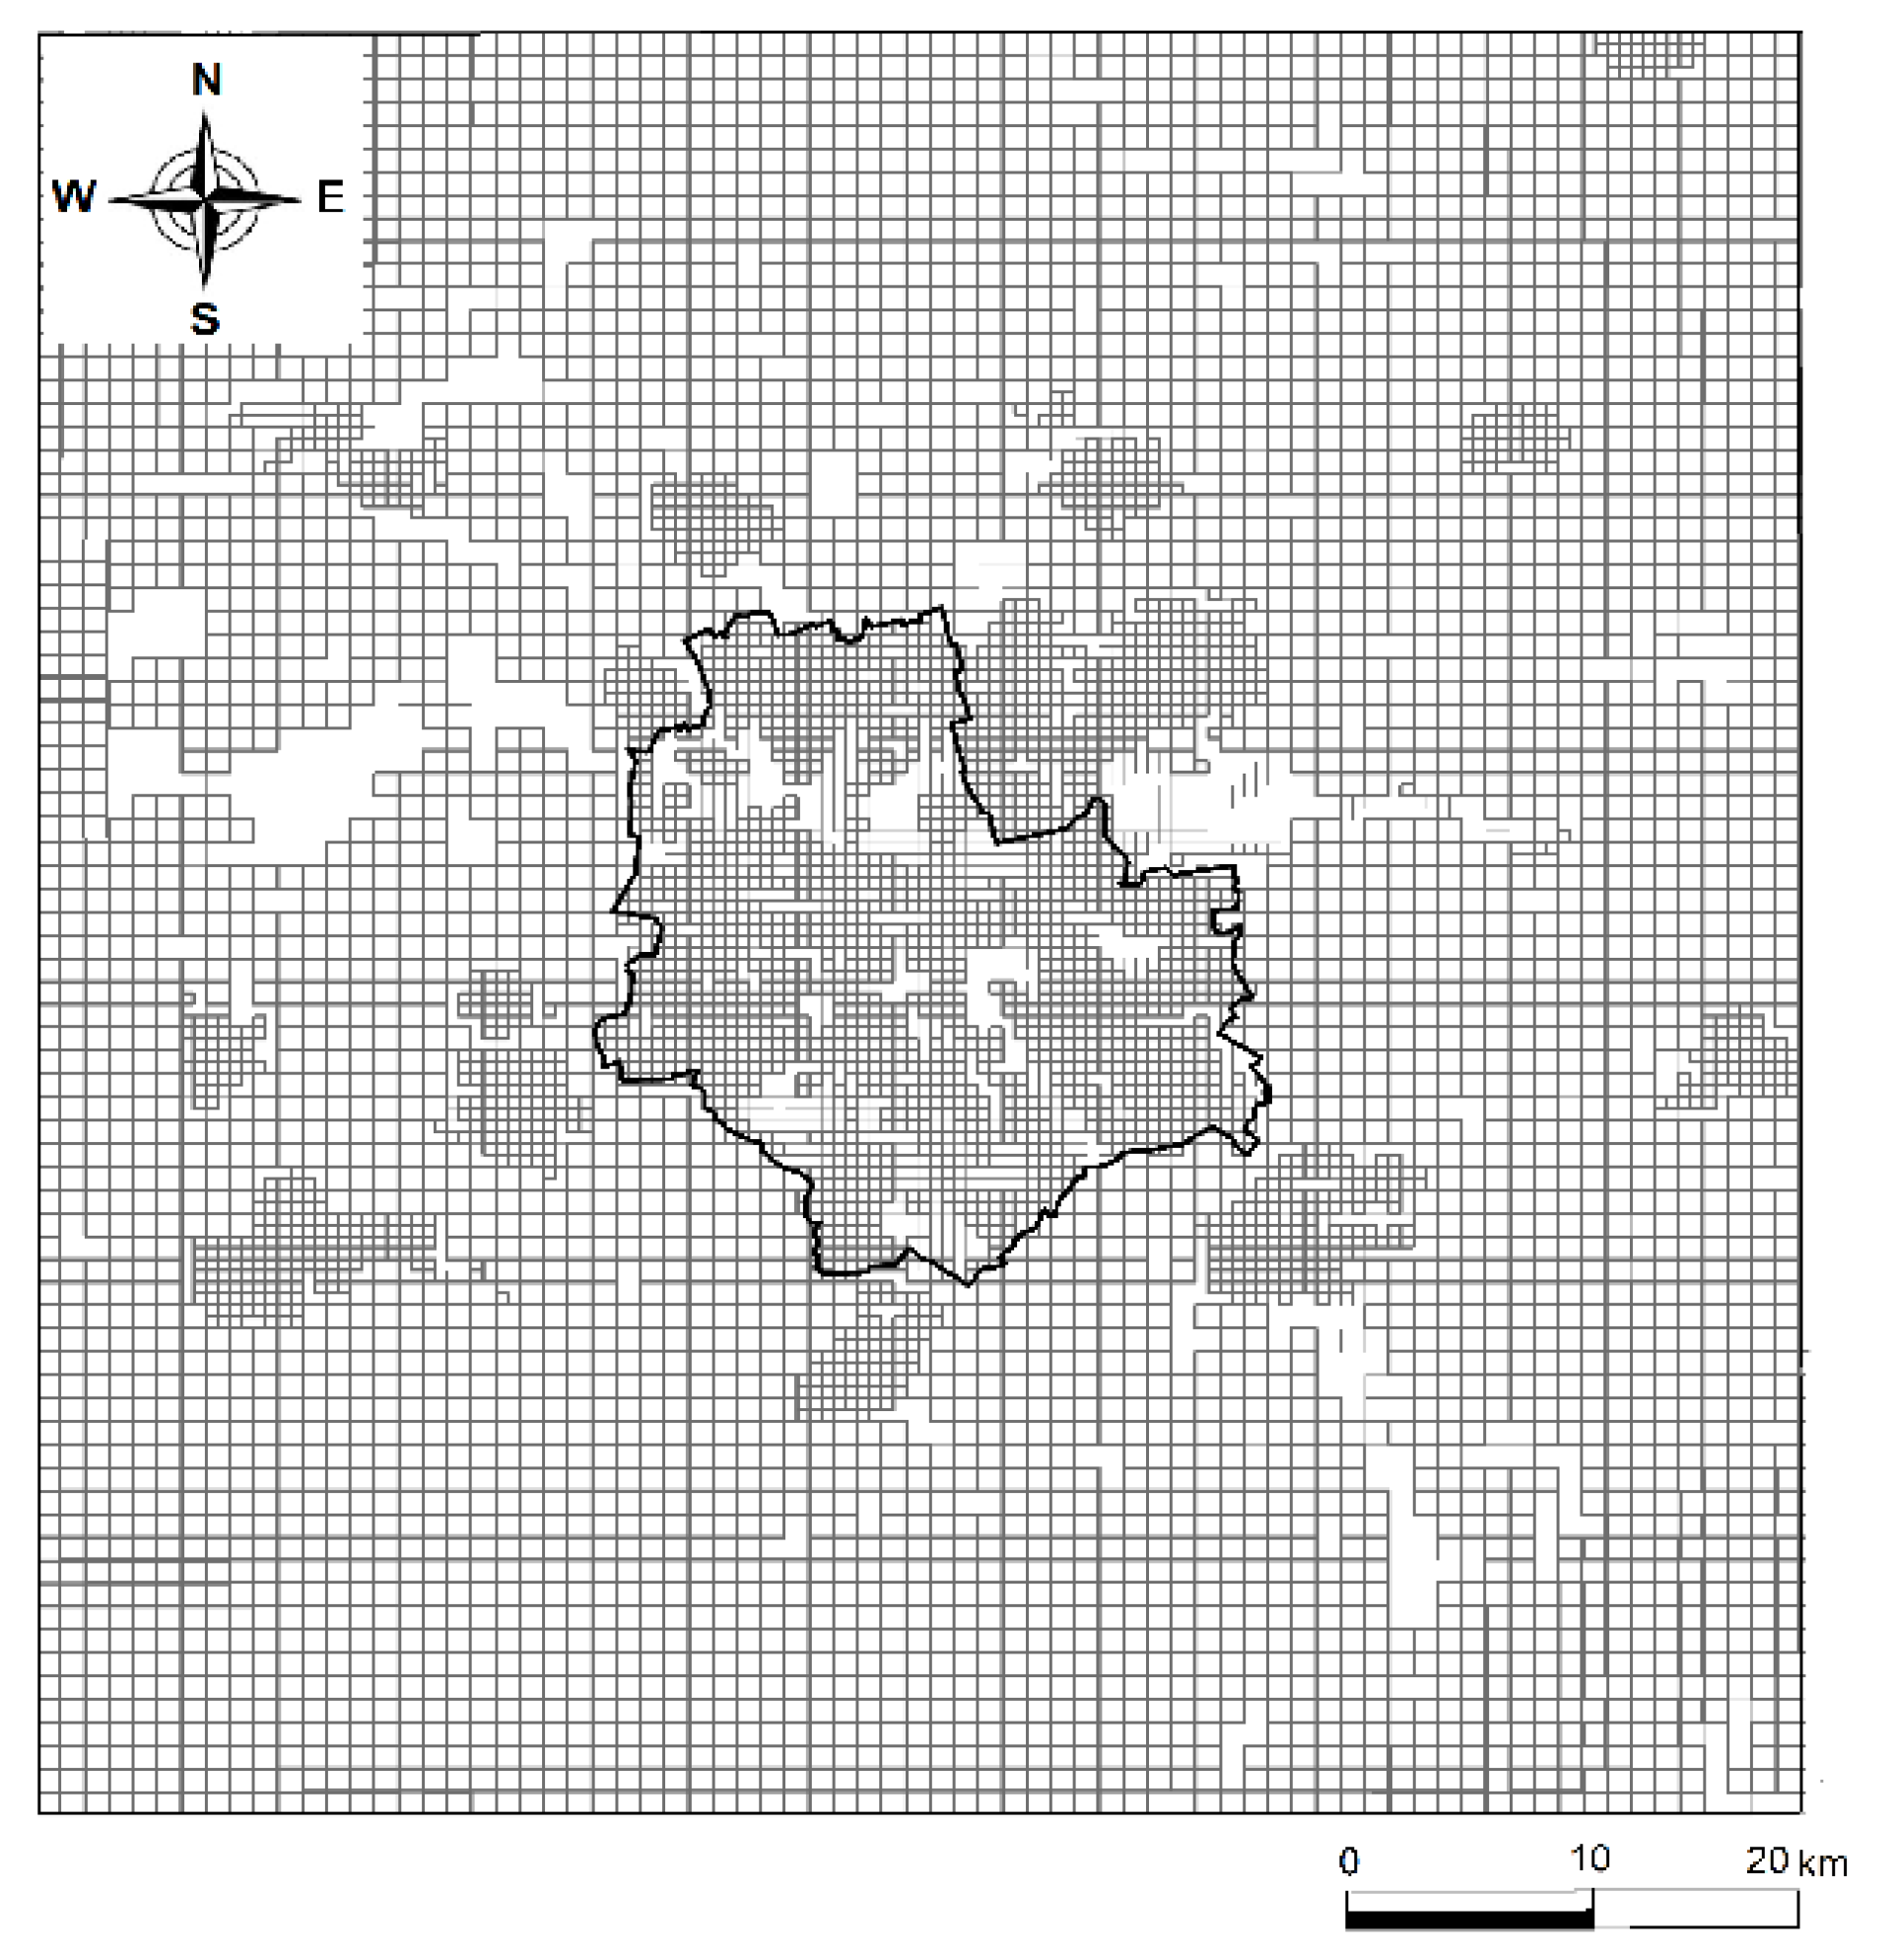
Figure 6.
Concentration of NOx vs. LEZ implementation: (a) baseline emission, (b) 3rd stage LEZ, (c) 5th stage LEZ, (d) 5th stage LEZ+20% total emissions reduction. The annual mean concentration limit is 30 μg/m3. (Enlarged maps of the zone are shown in Figure S1 in the Supplementary Material).
Figure 6.
Concentration of NOx vs. LEZ implementation: (a) baseline emission, (b) 3rd stage LEZ, (c) 5th stage LEZ, (d) 5th stage LEZ+20% total emissions reduction. The annual mean concentration limit is 30 μg/m3. (Enlarged maps of the zone are shown in Figure S1 in the Supplementary Material).
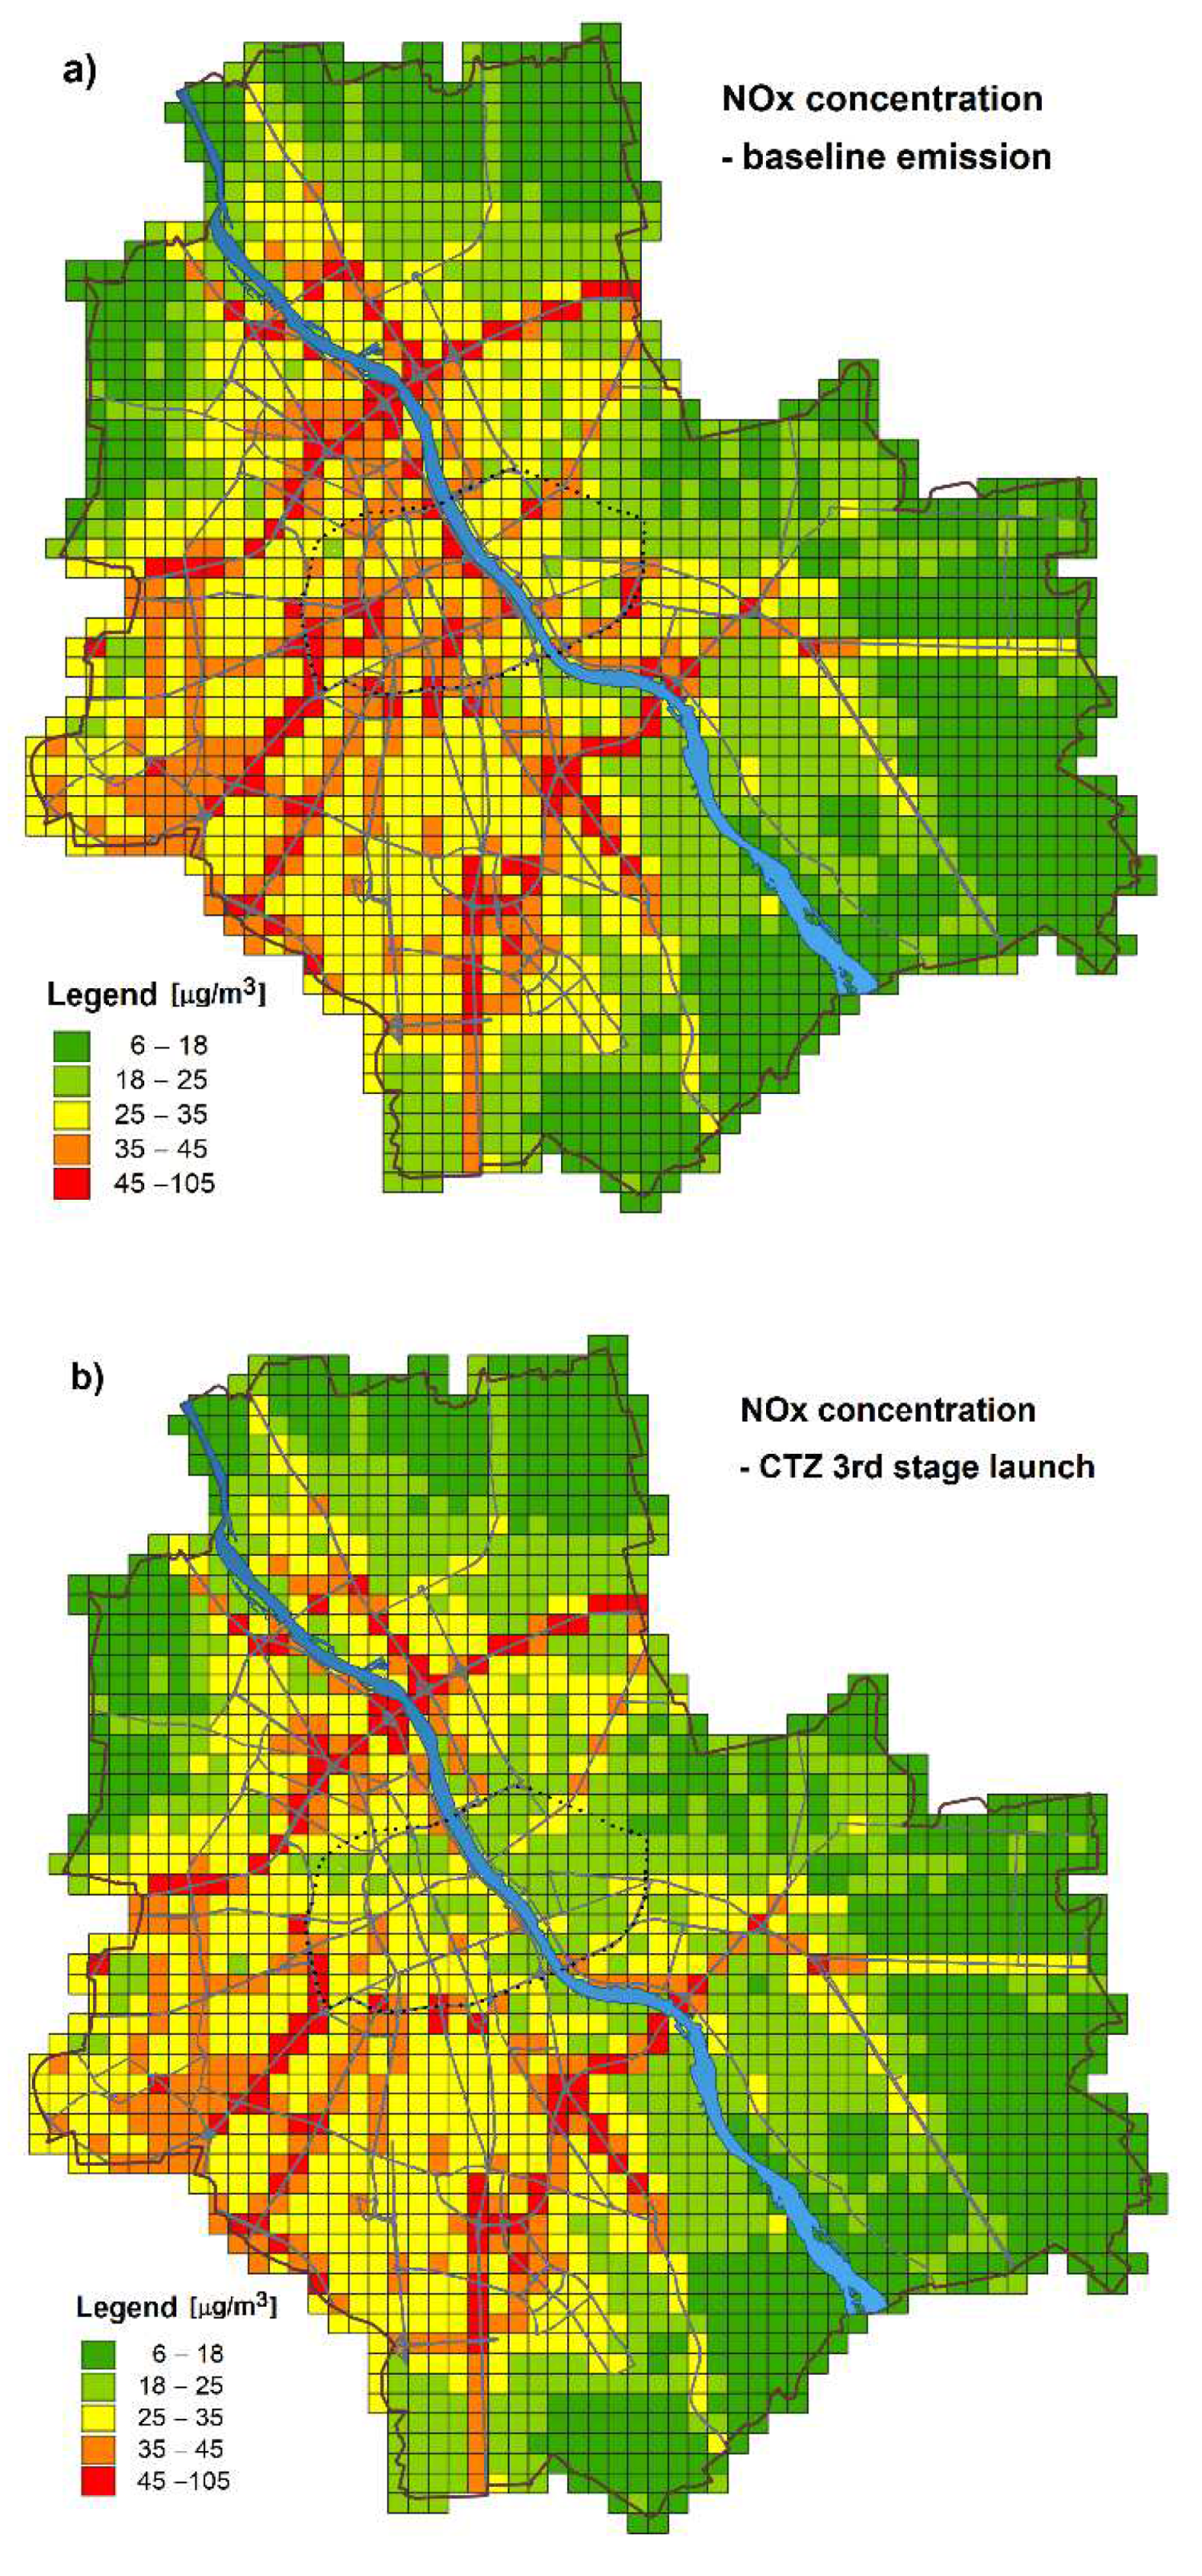
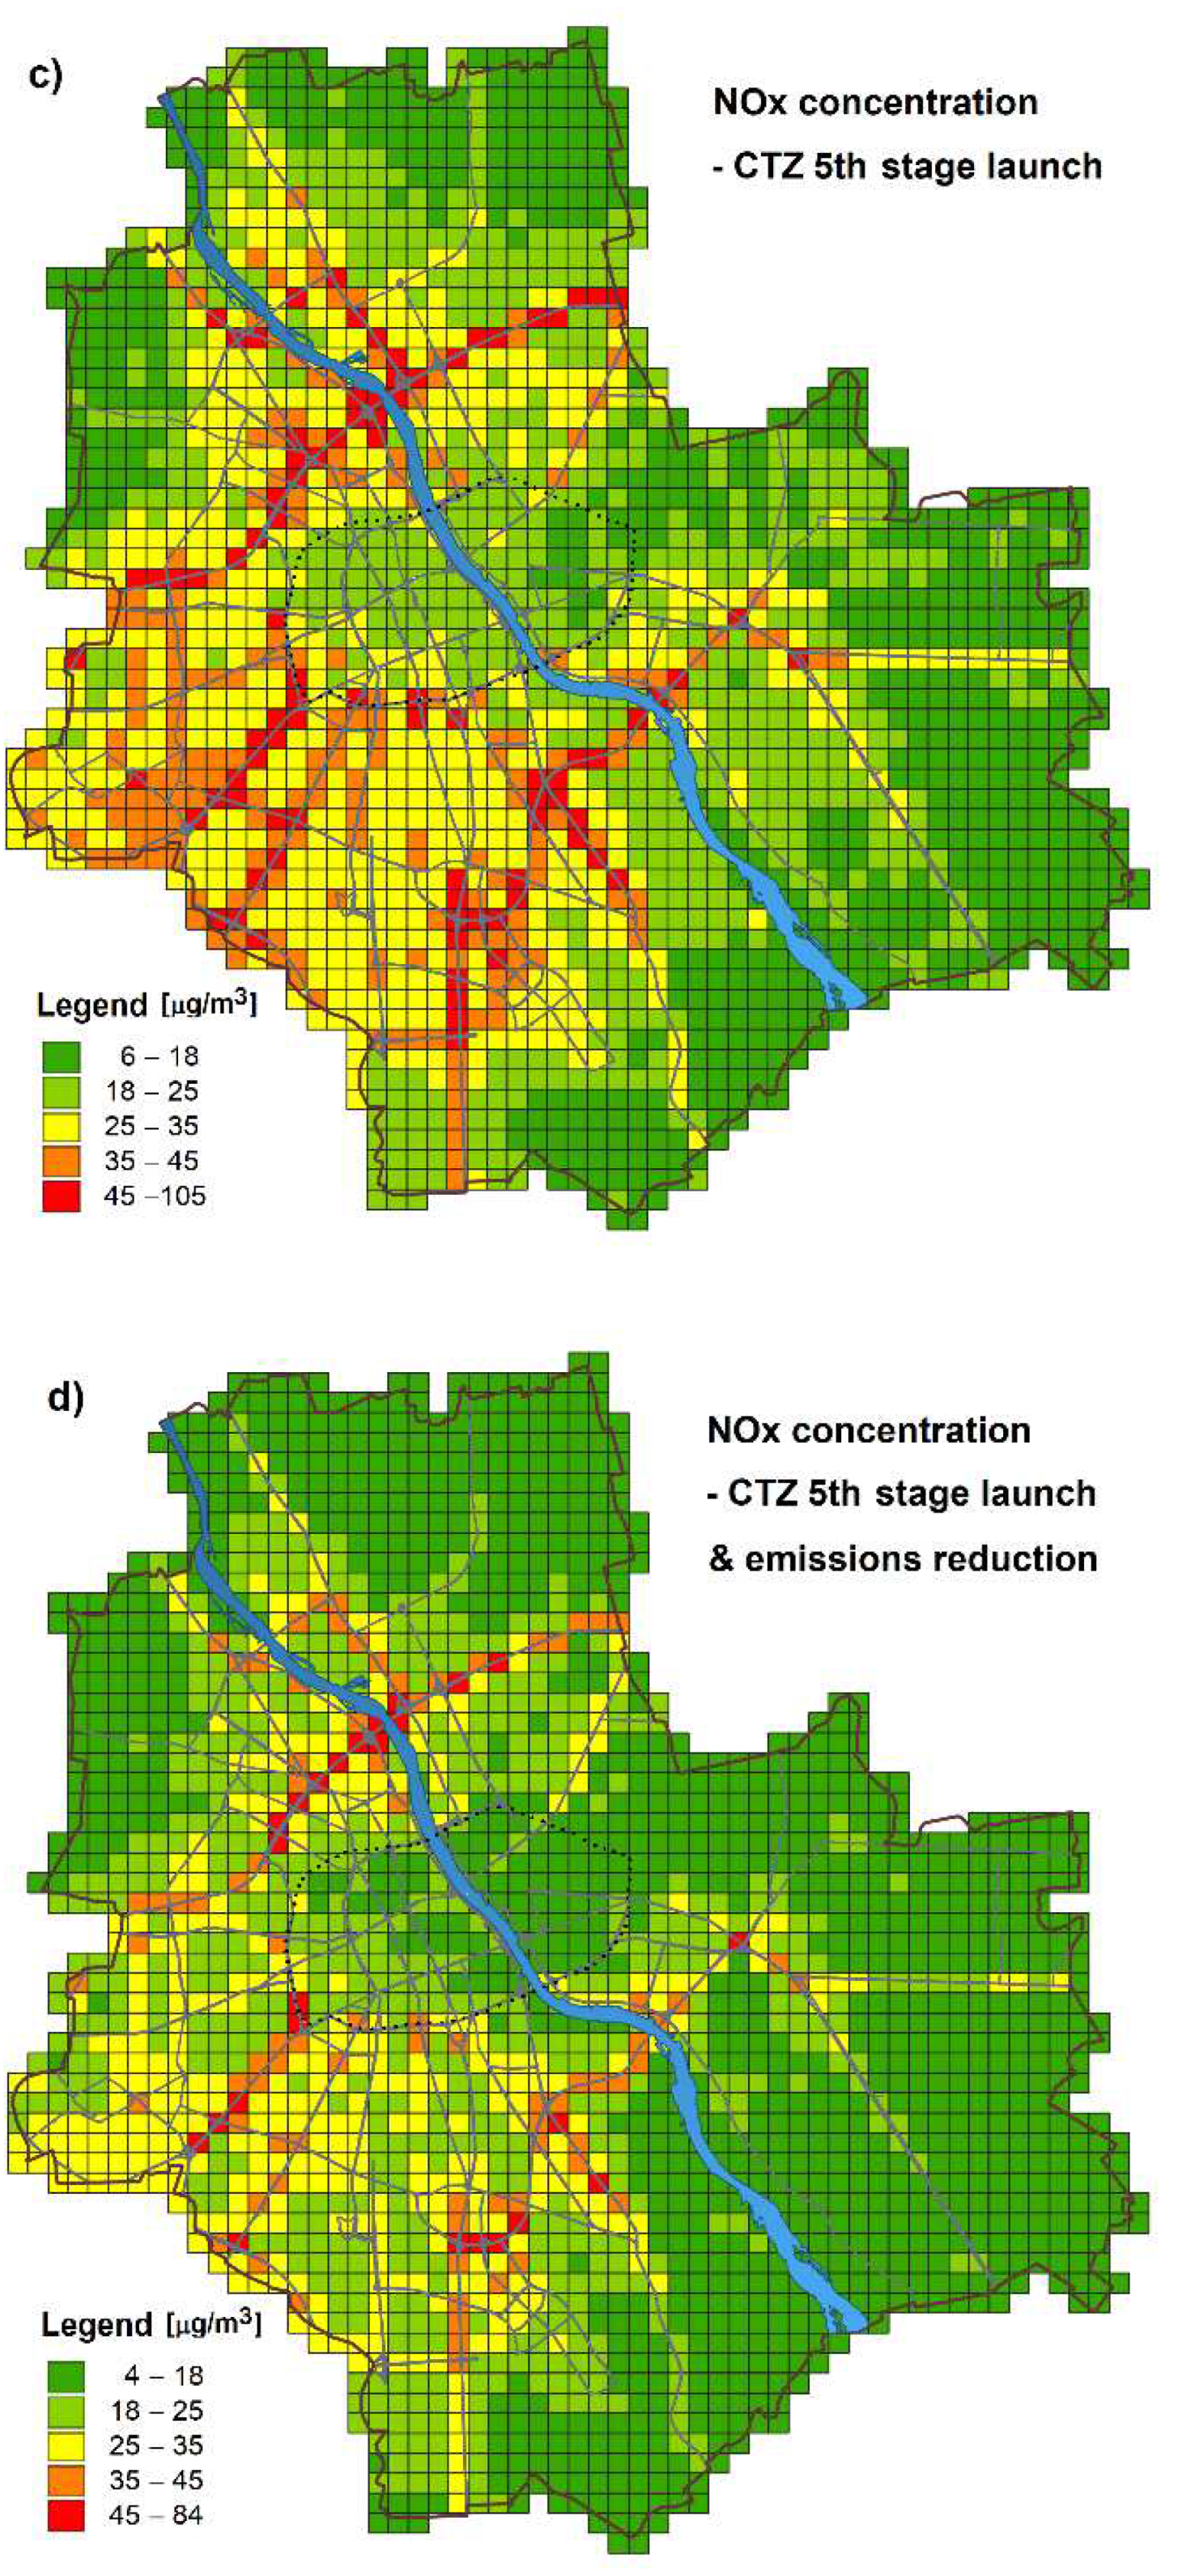
Figure 7.
Concentration of PM2.5 vs. LEZ implementation: (a) baseline emission, (b) 3rd LEZ stage, (c) 5th stage LEZ, (d) 5th stage LEZ+20% total emissions reduction. The annual mean concentration limit is 20 μg/m3. (Enlarged maps of the zone are shown in Figure S2 in the Supplementary Material.).
Figure 7.
Concentration of PM2.5 vs. LEZ implementation: (a) baseline emission, (b) 3rd LEZ stage, (c) 5th stage LEZ, (d) 5th stage LEZ+20% total emissions reduction. The annual mean concentration limit is 20 μg/m3. (Enlarged maps of the zone are shown in Figure S2 in the Supplementary Material.).
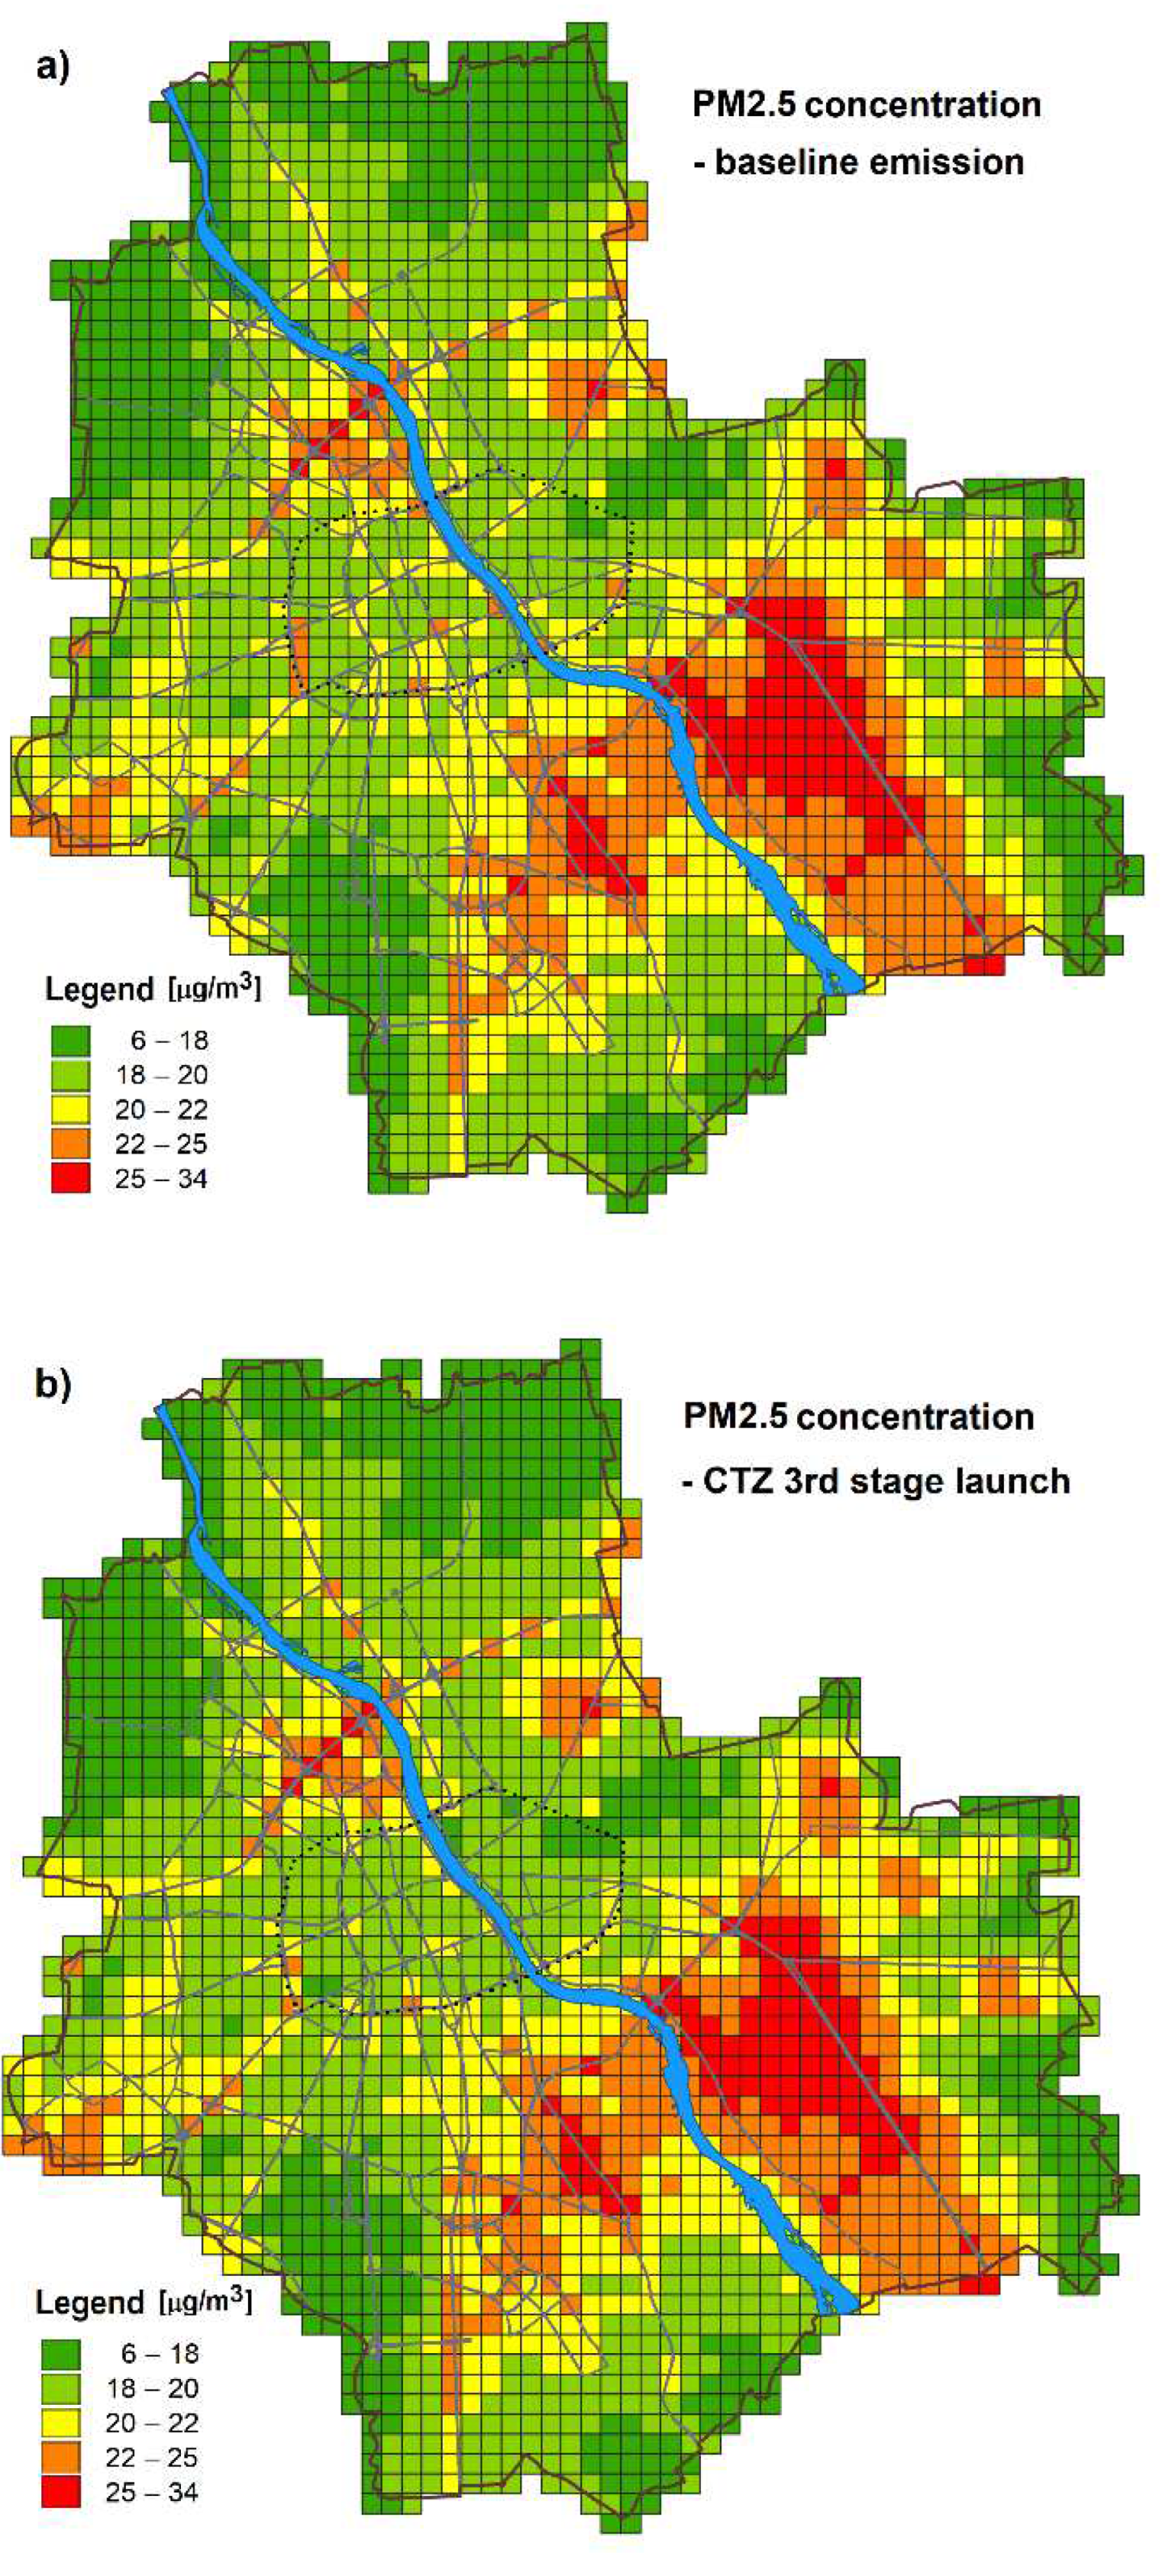
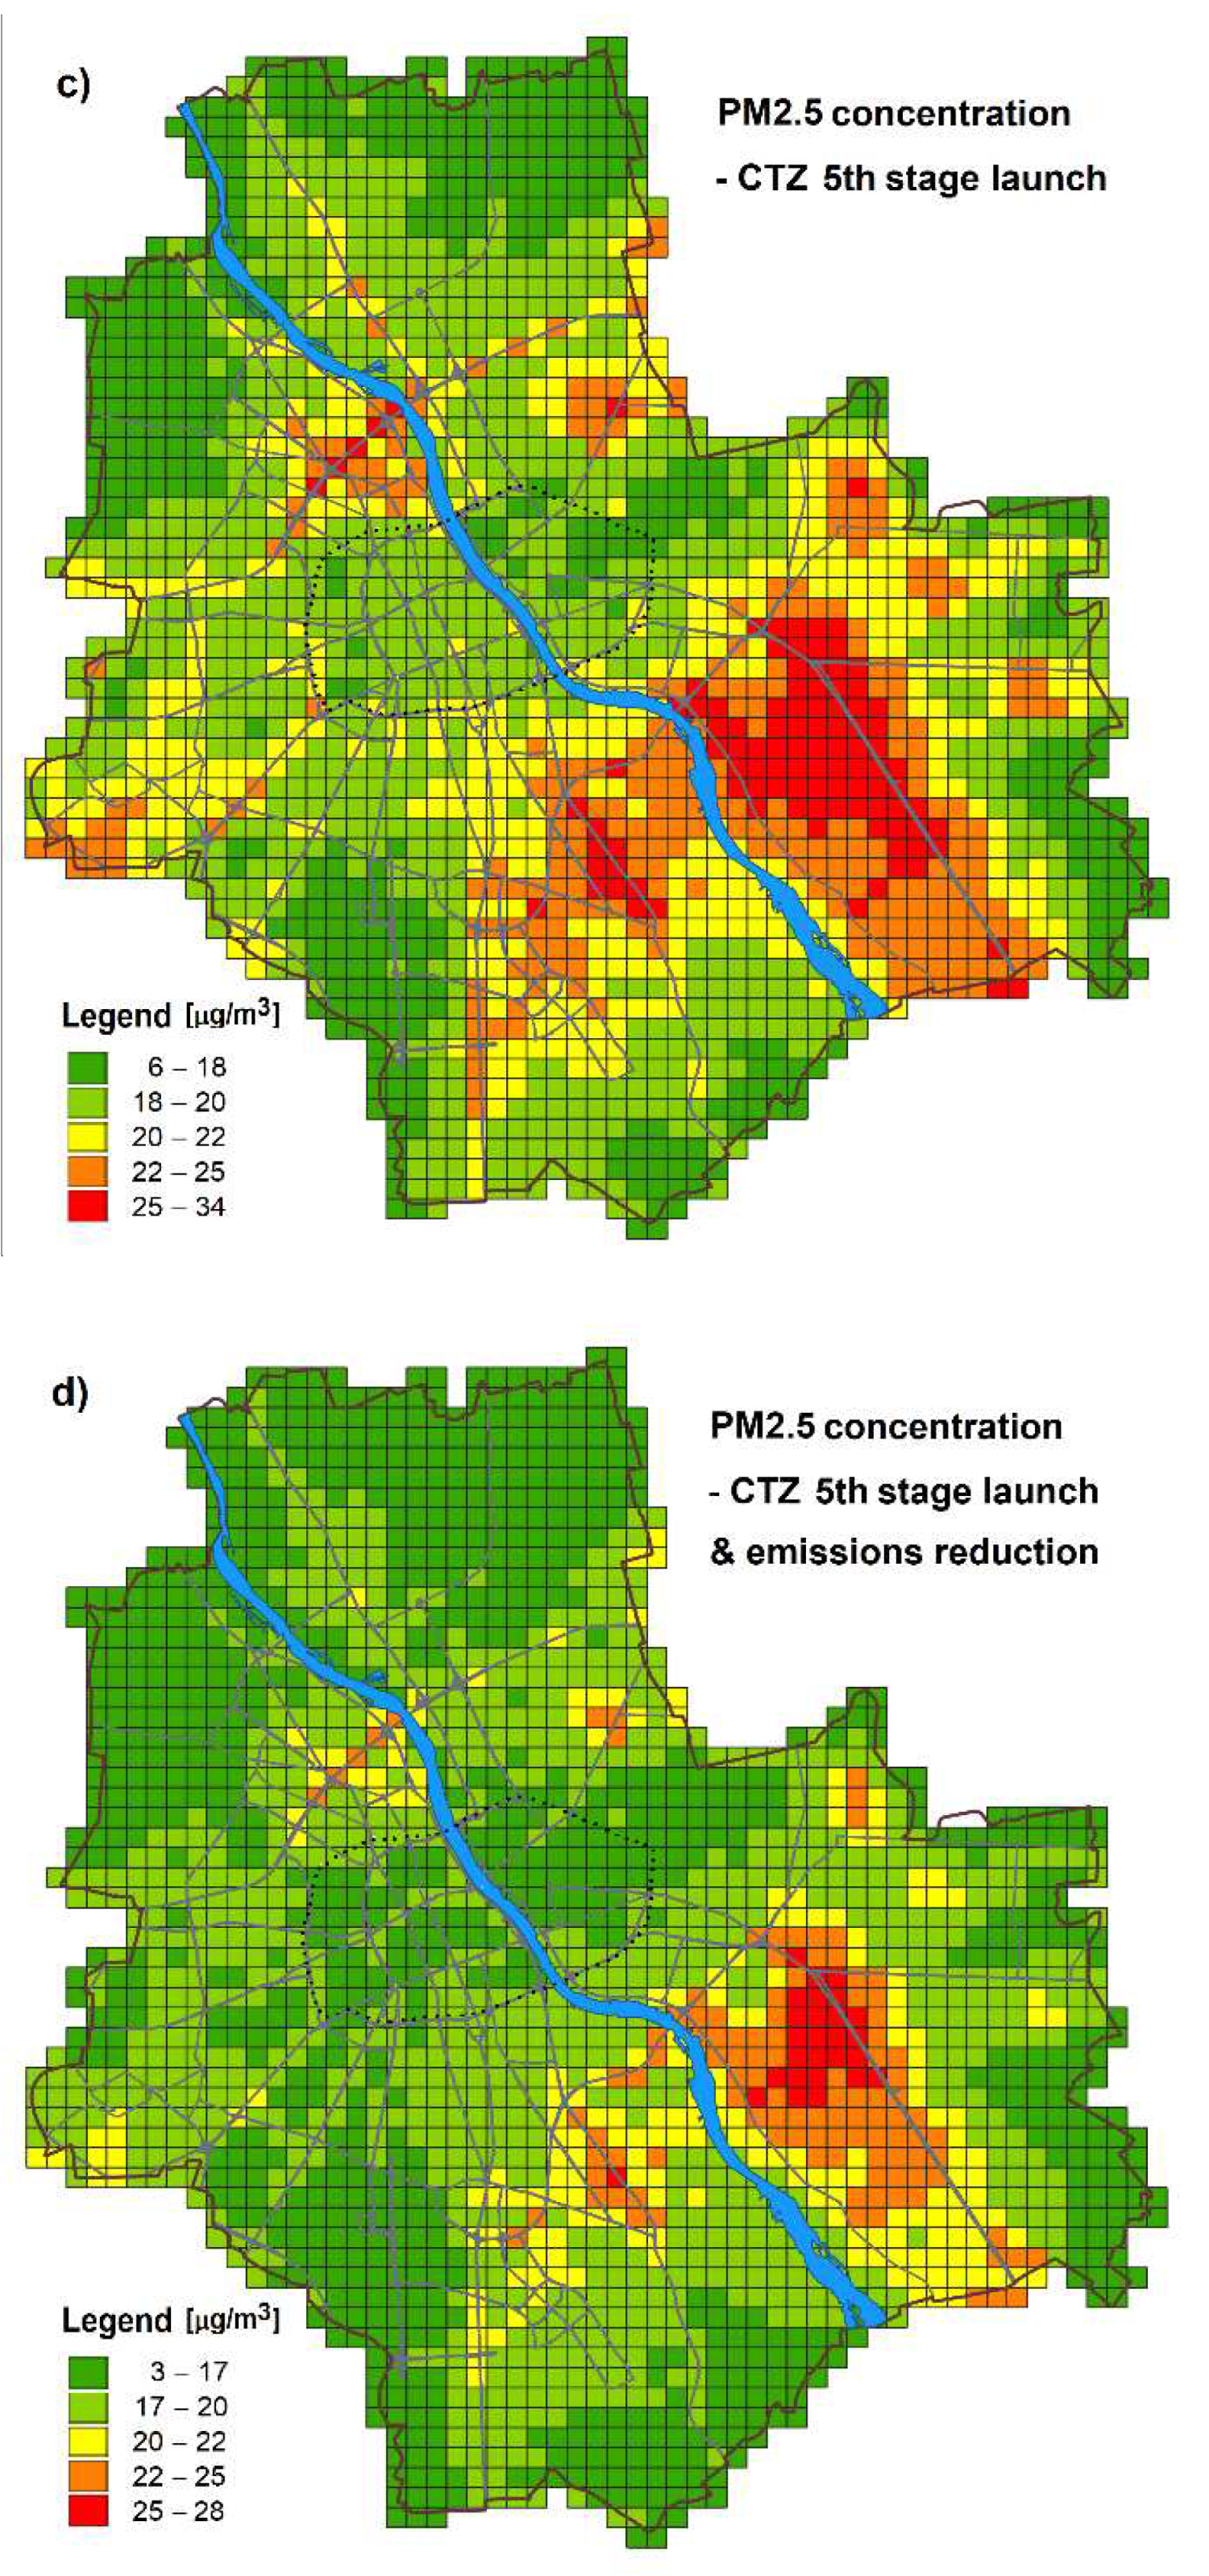
Figure 8.
Source apportionment for baseline emission dataset, NOX (left) and PM2.5 (right) pollution. Abbreviations used: waw/prox – Warsaw/vicinity emissions, prim/sec – primary/secondary PM emission.
Figure 8.
Source apportionment for baseline emission dataset, NOX (left) and PM2.5 (right) pollution. Abbreviations used: waw/prox – Warsaw/vicinity emissions, prim/sec – primary/secondary PM emission.
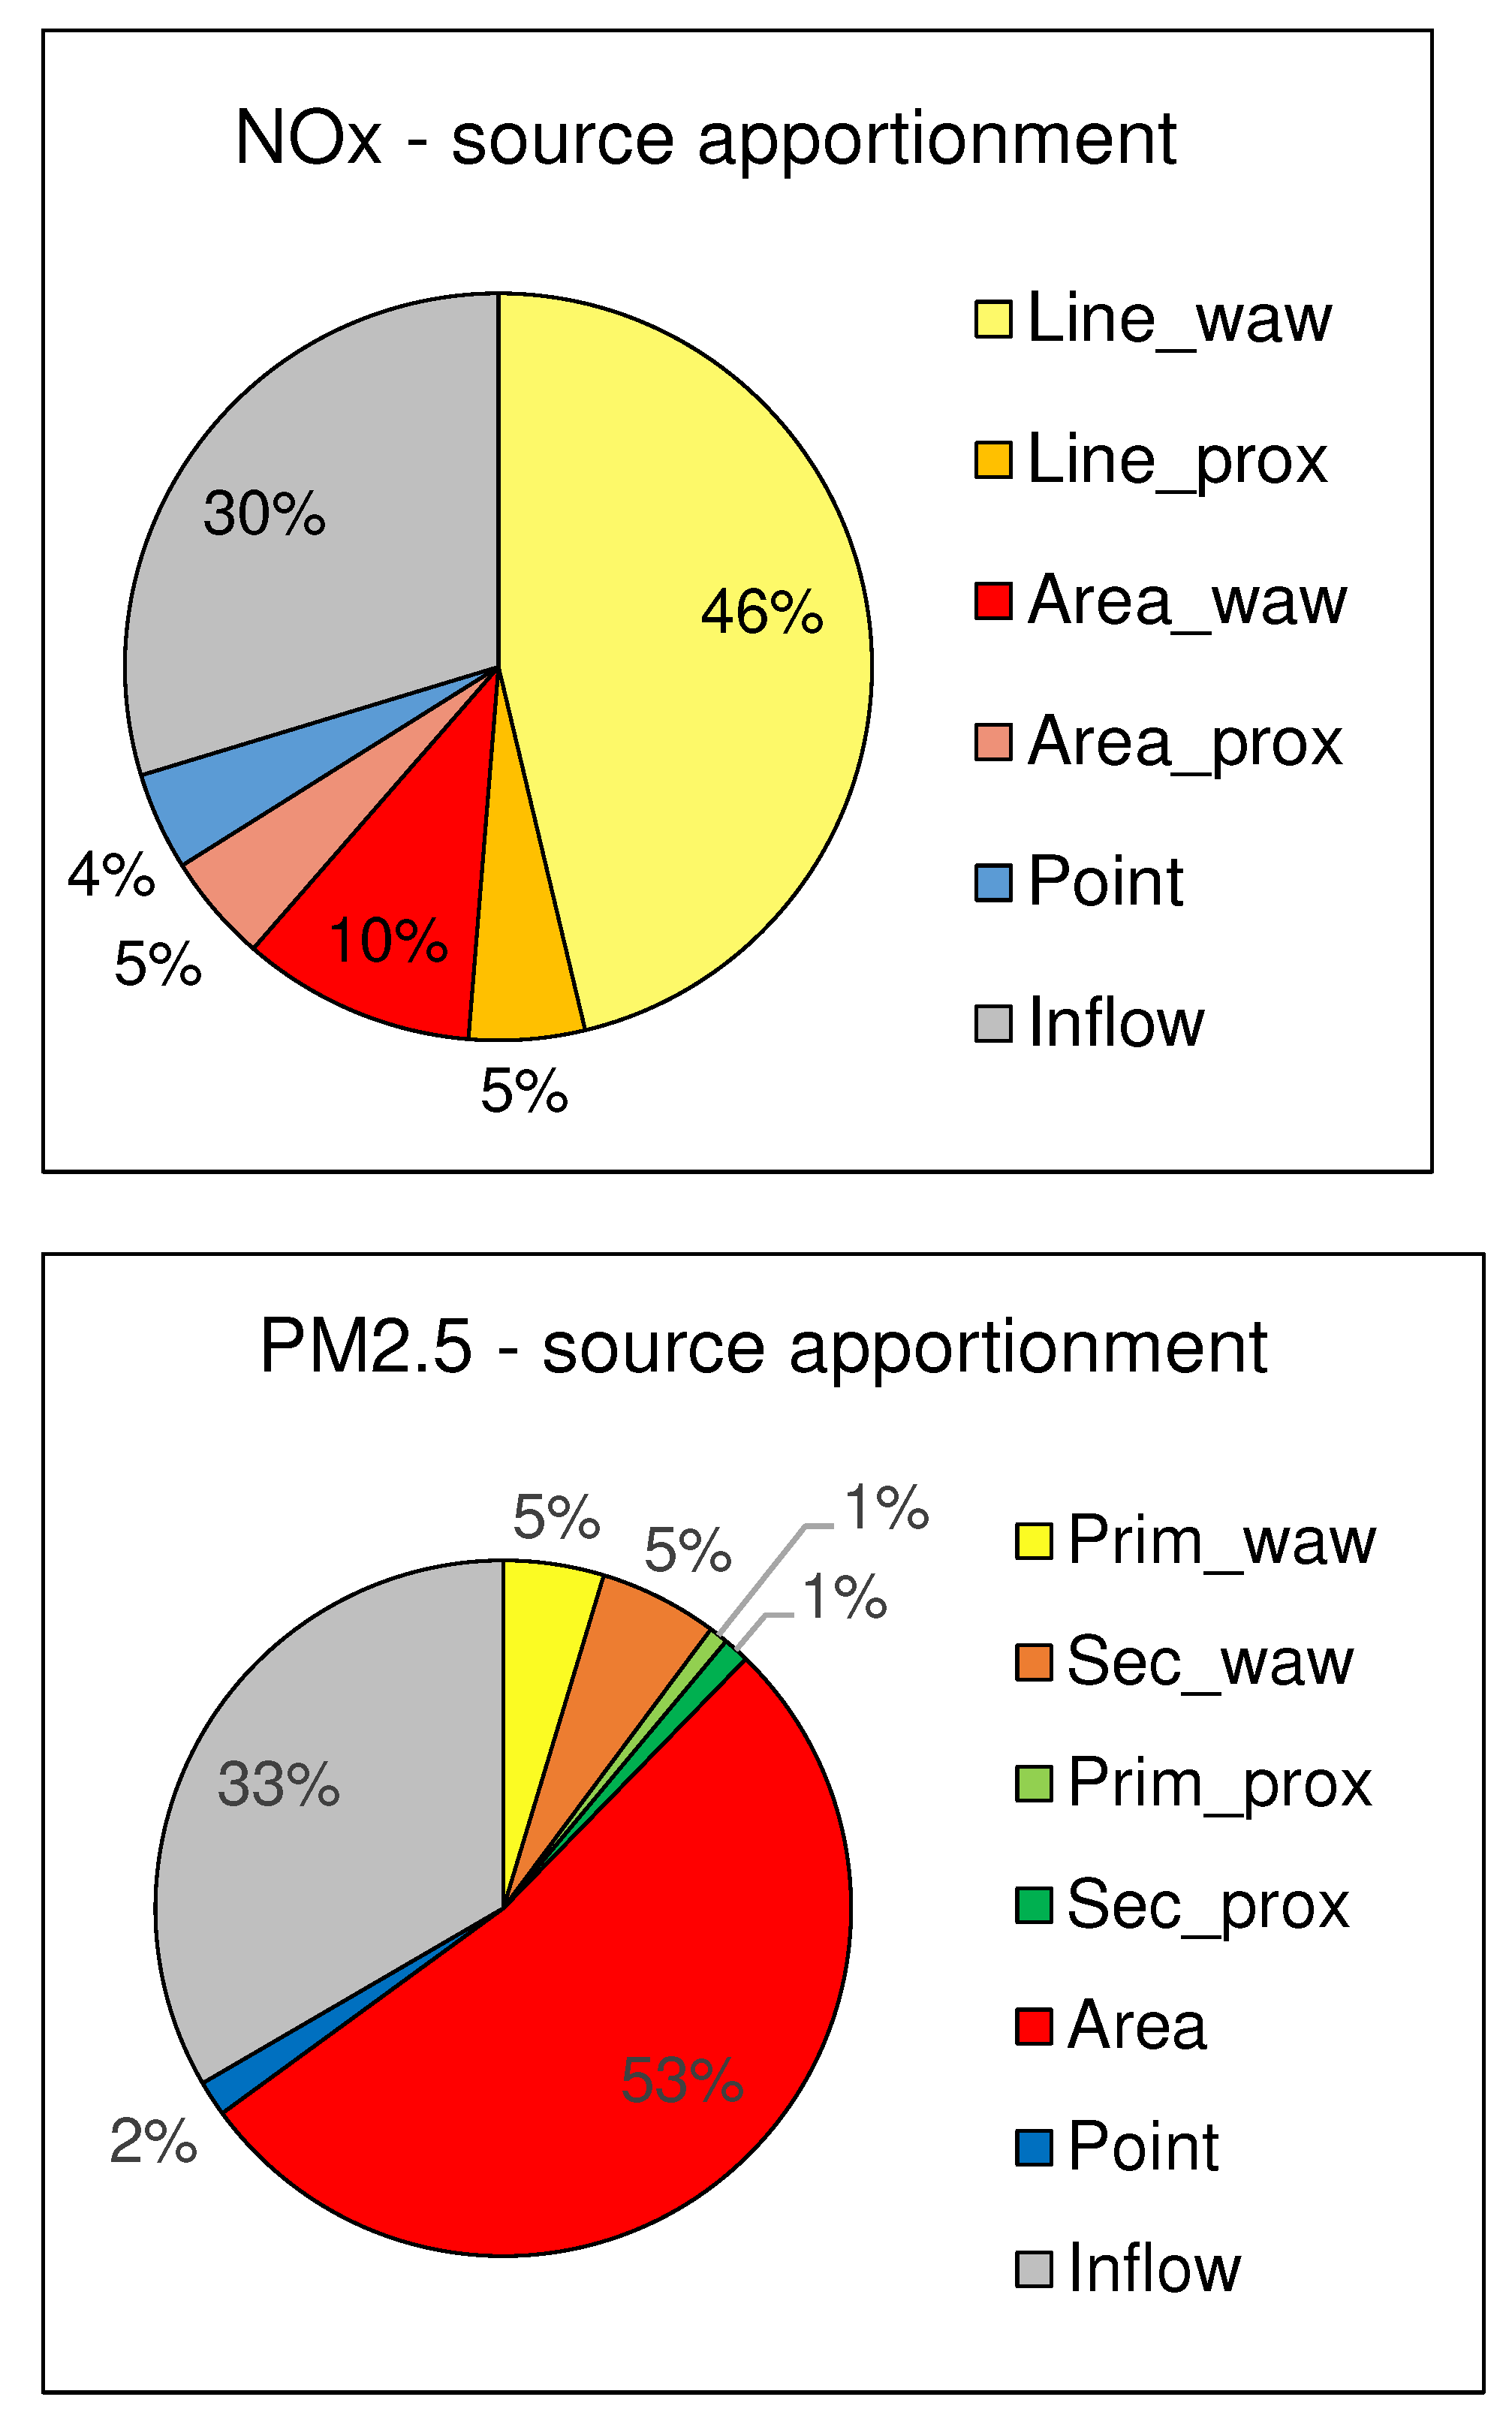

Table 1.
The expected NOx and PM emission reduction in the zone resulting from LEZ implementation.
| STAGE | ST 1 (2024) E2 (G) E4 (D) |
ST 2 (2026) E3 (G) E5 (D) | ST 3 (2028) E4 (G) E6 (D) |
ST 4 (2030) E5 (G) E6dT (D) | ST 5 (2032) E6 (G) E6d( D) | |
| EMISSION | ||||||
| NOx | Gasoline/Diesel share | 41% - G 59% - D | 42% - G 58% - D | 51% - G 49% - D | 52% - G 48% - D | 55% - G 45% - D |
| Total emission reduction | 11% | 23% | 49% | 66% | 75% | |
| PM | Gasoline/Diesel share | 62% - G 38% - D | 56% - G 44% - D | 59% - G 41% - D | 62% - G 38% - D | 60% - G 40% - D |
| Total emission reduction | 32% | 55% | 66% | 70% | 73% |
Table 2.
Comparison of the population exposures to the main pollutants [μg/m3] connected with LEZ implementation.
Table 2.
Comparison of the population exposures to the main pollutants [μg/m3] connected with LEZ implementation.
| STAGE | Baseline [μg/m3] | 3rd Stage [μγ/m3] | 5th Stage [μg/m3] | |
| NOX | City | 26.0 | 25.1 (-3%) | 24.7 (-5%) |
| LEZ | 34.6 | 27.1 (-22%) | 23.3 (-33%) | |
| PM2.5 | City | 20.59 | 20.55 (-0.2%) | 20.52 (-0.3%) |
| LEZ | 19.73 | 19.11 (-3%) | 18.79 (-5%) | |
Disclaimer/Publisher’s Note: The statements, opinions and data contained in all publications are solely those of the individual author(s) and contributor(s) and not of MDPI and/or the editor(s). MDPI and/or the editor(s) disclaim responsibility for any injury to people or property resulting from any ideas, methods, instructions or products referred to in the content. |
© 2023 by the authors. Licensee MDPI, Basel, Switzerland. This article is an open access article distributed under the terms and conditions of the Creative Commons Attribution (CC BY) license (http://creativecommons.org/licenses/by/4.0/).
Copyright: This open access article is published under a Creative Commons CC BY 4.0 license, which permit the free download, distribution, and reuse, provided that the author and preprint are cited in any reuse.


