
Submitted:
16 October 2023
Posted:
17 October 2023
You are already at the latest version
Abstract
Self-compacting concrete is essential for vertical structures due to high reinforcement and usage of pumps for transporting the concrete at the working site. SCC is mainly influenced by self-curing for arid areas. To explore the SCC (Self-Compacting Concrete) mixture and condition influencing the self-curing condition were determined using the experimental procedure. Determination of various parameters was done using T50 slump flow, V-funnel, L-box-box, J ring test, compressive strength, splitting tensile strength, and flexural strength test. After the experimental investigation, it shows that if the dose if the dosage of superplasticizer (SNF%) increases, it will improve the concrete mixture's different properties, such as flowability and ability to pass. Higher water-to-cement ratios (w/c) generally result in enhanced flowability and stability. Mixture 9 (SNF 0.35, w/c 0.5) demonstrates favourable results across all parameters, indicating excellent flowability and stability. Mixture 9 (SNF 0.35, w/c 0.5) also shows favourable flowability and stability characteristics. Lower concentrations, such as 0.5%, may have a positive effect up to a certain point but might not provide sustained improvement over the curing period. On the other hand, concentrations of 1% and 2% demonstrated consistent and significant enhancement in strength throughout the 28 days. It is found that the higher concentrations of PEG 4000 may be more effective in improving the material strength.
Keywords:
SSC
; J-ring test
; workability
; SCC
; L box
; T50 slump flow
1. Introduction
Self-compacting concrete (SCC) is a type of concrete that is very strong and effective while still being highly workable. This is the particular variety of concrete exhibits for the ability to flow smoothly through restricted spaces without experiencing segregation or bleeding, making it a preferred choice for extensive construction projects. Additionally, the process of self-curing, often referred to as internal curing, involves introducing additional moisture into concrete. This additional moisture aids in promoting the efficient hydration of cement and helps reduce the occurrence of self-desiccation [1,2].
Self-compacting concrete, commonly referred to as SCC, originated in 1988 when Professor Okamura introduced this innovative concrete formulation to enhance the durability characteristics of concrete structures Self-consolidating concrete (SCC) is a concrete variety recognized for its capacity to flow unrestrictedly and attain enhanced structural integrity as a result of its inherent self-weight [3]. Self-compacting concrete is one of the construction industry's most promising innovations in past years. SCC is an exceptionally flowable type of concrete that exhibits resistance to segregation. It effortlessly spreads and fills formwork, even in densely arranged reinforcement, without mechanical vibration [4,5,6]. Aggregates constitute a substantial sixty to seventy percent of the total self-consolidating concrete (SCC) volume. The selection of aggregates is a critical factor in influencing fresh and hardened concrete characteristics. Properties of aggregates, such as their shape, texture, and grading, significantly affect a variety of fresh concrete attributes, including workability, finish quality, bleeding, pumpability and resistance to segregation [7,8]. On the flip side, the attributes of cured concrete encompass factors like strength, stiffness, shrinkage, creep, density, and permeability. Employing SCC offers several advantages, such as an enhancement in the overall concrete quality and a reduction in on-site repair requirements. It also leads to shorter construction timelines, reduced overall expenses, and the seamless integration of automation in concrete production processes [9,10]. Eliminating the need for vibrators also enhances health and safety conditions. Additional advantages encompass simplified placement procedures, the ability to construct thinner concrete sections, expanded design flexibility, and the potential for repurposing what is presently considered waste dust. Furthermore, researchers have investigated the produced sand extensively, and their findings have been documented in the published literature. This research has demonstrated that the strength properties of SCC can be enhanced through various means, including the utilization of waste products like silica fume and the incorporation of fibers [11,12].
Concrete can derive advantages from an additional moisture supply, a technique referred to as self-curing or internal curing. This method enhances the efficiency of cement hydration and guards against the concrete drying out autonomously. Achieving internal curing in concrete can be executed through two main approaches. [13,14]. The first technique uses saturated lightweight porous aggregate, also known as LWA, to provide an internal water source [1,15]. These water sources can be employed to substitute the water lost due to chemical shrinkage throughout the cement hydration process. A secondary method entails the utilization of polyethylene glycol (PEG), which serves the dual purpose of preventing water loss through evaporation from the concrete's surface and retaining a higher water content within the concrete. [16,17,18]. The first approach is going to be used for this particular research project. Compared to concrete mixes prepared with simply Portland cement, those created with SCC that include fly ash, blast furnace slag, and silica fume need a lower dose of superplasticizer to get a comparable slump flow. This is because the SCC contains these other materials [19,20].
These admixtures do not restrict themselves to the span of a single dimension in any way. They are favoured in constructing almost every high-rise structure because high-strength concrete cannot be achieved without superplasticizers, which are essential to the process [21,22]. During mass concreting procedures such as dam construction of a dam it is critical to effectively manage the cement hydration rate. Failure to do so can lead to a significant temperature increase, potentially reaching as high as 500 degrees Celsius above the ambient temperature. Such elevated temperatures can potentially induce substantial cracking and structural damage [23,24]. Hence, it is essential to take suitable measures, such as the incorporation of retarding superplasticizers. These measures not only decelerate the pace of cement hydration but also enhance the overall durability of the concrete. The utilization of retarders in the blending stage of ready-mixed concrete enables the preservation of concrete freshness for an extended duration, a critical necessity within the construction sector when ready-mixed concrete is employed [25,26]. Admixtures find extensive applications across various scenarios encompassing prestressed concrete, concrete bridges, densely reinforced concrete, and numerous other contexts. Consequently, the need for comprehensive experimental investigations arises to evaluate the impact of these admixtures and determine the most suitable dosage for their effective utilization. [2,27,28].
The central objective of this investigation is to determine the optimal quantities of sand, coarse aggregate, and cement while also examining the influence of different super-plasticizer proportions in self-compacting concrete (SCC) to attain the highest achievable compressive strength. The incorporation of an internal curing agent leads to the establishment of an internal water reservoir and an increase in relative humidity. This is achieved by forming a thin water film, effectively reducing the rate of self-desiccation to an ideal level. [18,29,30,31].
2. Materials and Methods
This section includes the various raw materials their properties, and test setups.
2.1. Materials
Polyethylene glycol (PEG) with an atomic weight of 4000 was selected as a self-curing agent. The chemical structure of Polyethylene glycol is represented by the general formula H(OCH2CH2)nOH, where n denotes the typical number of repeating ethylene oxide units and can vary within the range of 4 to approximately 180. Polyethylene glycol is a compound composed of ethylene oxide and water. The remarkable hydrophilicity of Polyethylene glycol 4000 cannot be emphasized enough. A well-graded coarse aggregate with a maximum dimension of 14 millimeters in all stages of specimen preparation for the tests. The fine aggregate was natural sand with a fineness modulus 2.76. The fine aggregate was categorized under Gradation Zone 2, per the grading curve specifications for the aggregate. Furthermore, we conducted a sieving process to eliminate any particles with dimensions smaller than 5 millimeters from the fine aggregate [32,33,34,35,36,37,38,39,40].
2.2. Test Setups
When a concrete mixture satisfies the requirements for all three workability aspects, it qualifies as a self-consolidating concrete (SCC) mixture. These fundamental fresh attributes essential for SCC are filling ability, passage ability, and resistance to segregation. Filling ability denotes the concrete's capability to occupy the available space within a container. Various testing methods have been devised to gauge and appraise these characteristics. It's important to note that no single testing method can comprehensively assess all workability properties simultaneously, primarily because these attributes are interrelated. Consequently, due to their inherent connections, most tests indirectly assess multiple attributes concurrently. The European Guidelines EFNARC have suggested five different testing methodologies to describe an SCC mix. Table III lists the various testing procedures and the EFNARC-recommended values for those procedures.
2.2.1. Slump Flow Test
SCC flowability can be evaluated through a widely-used and straightforward test. This test assesses the flow rate of SCC in the absence of obstructions, offering a precise measure of its filling capacity. The primary apparatus employed for this test is the classic slump cone, also utilized in conventional slump testing. However, in this specific test, the concrete poured into the molds is free of embedded rods. A slump cone is affixed to a stable, non-absorbent, and level plate to perform the test. The cone is then filled with concrete without any compaction. After filling the slump cone with concrete, it is raised to a vertical position, and the concrete flows freely out of it for evaluation [41,42].
The measurement of concrete diameter involves assessing two perpendicular directions, and the resulting data is based on the average of these two diameters. While there is no universally defined threshold value for slump flow, according to EFNARC guidelines, SCC possesses excellent filling ability and uniformity when the spread diameter falls within the range of 650mm to 800mm. This observation is consistently supported by SCC exhibiting notable uniformity and filling capacity within this specific diameter range. The test for slump flow is straightforward to perform, providing valuable insights into the characteristics of a typical SCC mixture. Additionally, visual observations conducted during the test and measurements of the T50cm flow time can be instrumental to glean more information regarding segregation resistance.
2.2.2. T50 cm Slump Flow
Slump flow test is performed on the sample prepared by recoding the time in seconds and till the moment flow made a circle of 500 mm diameter. Mostly T50 cm slump flow is useful to find the relative viscosity that is influenced by the flow rate of the mixture made for SCC. If the flow time is cooperatively less, it means that the flow has the larger capacity. Mostly, the T50 cm slump flow test is useful in the case of marinating the quality control of SCC.
2.2.3. V-Funnel Test
Generally, the function of this test is to investigate the flow parameter and chances of segregation in an SCC mixture. Figure 2 demonstrates the V funnel test used in this research however, the size of the funnel varies between 75 mm x 75 mm or 65 mm x 75 mm. A nearly 12-liter concrete mixture needs to be prepared for this test. The concrete mixture is then filled in the V funnel, which is provided with a trap door, the total time from opening to complete exit is noted, which is measured and known as flow time, mostly it lies in the range of 6 to 12 seconds for SSC [26].
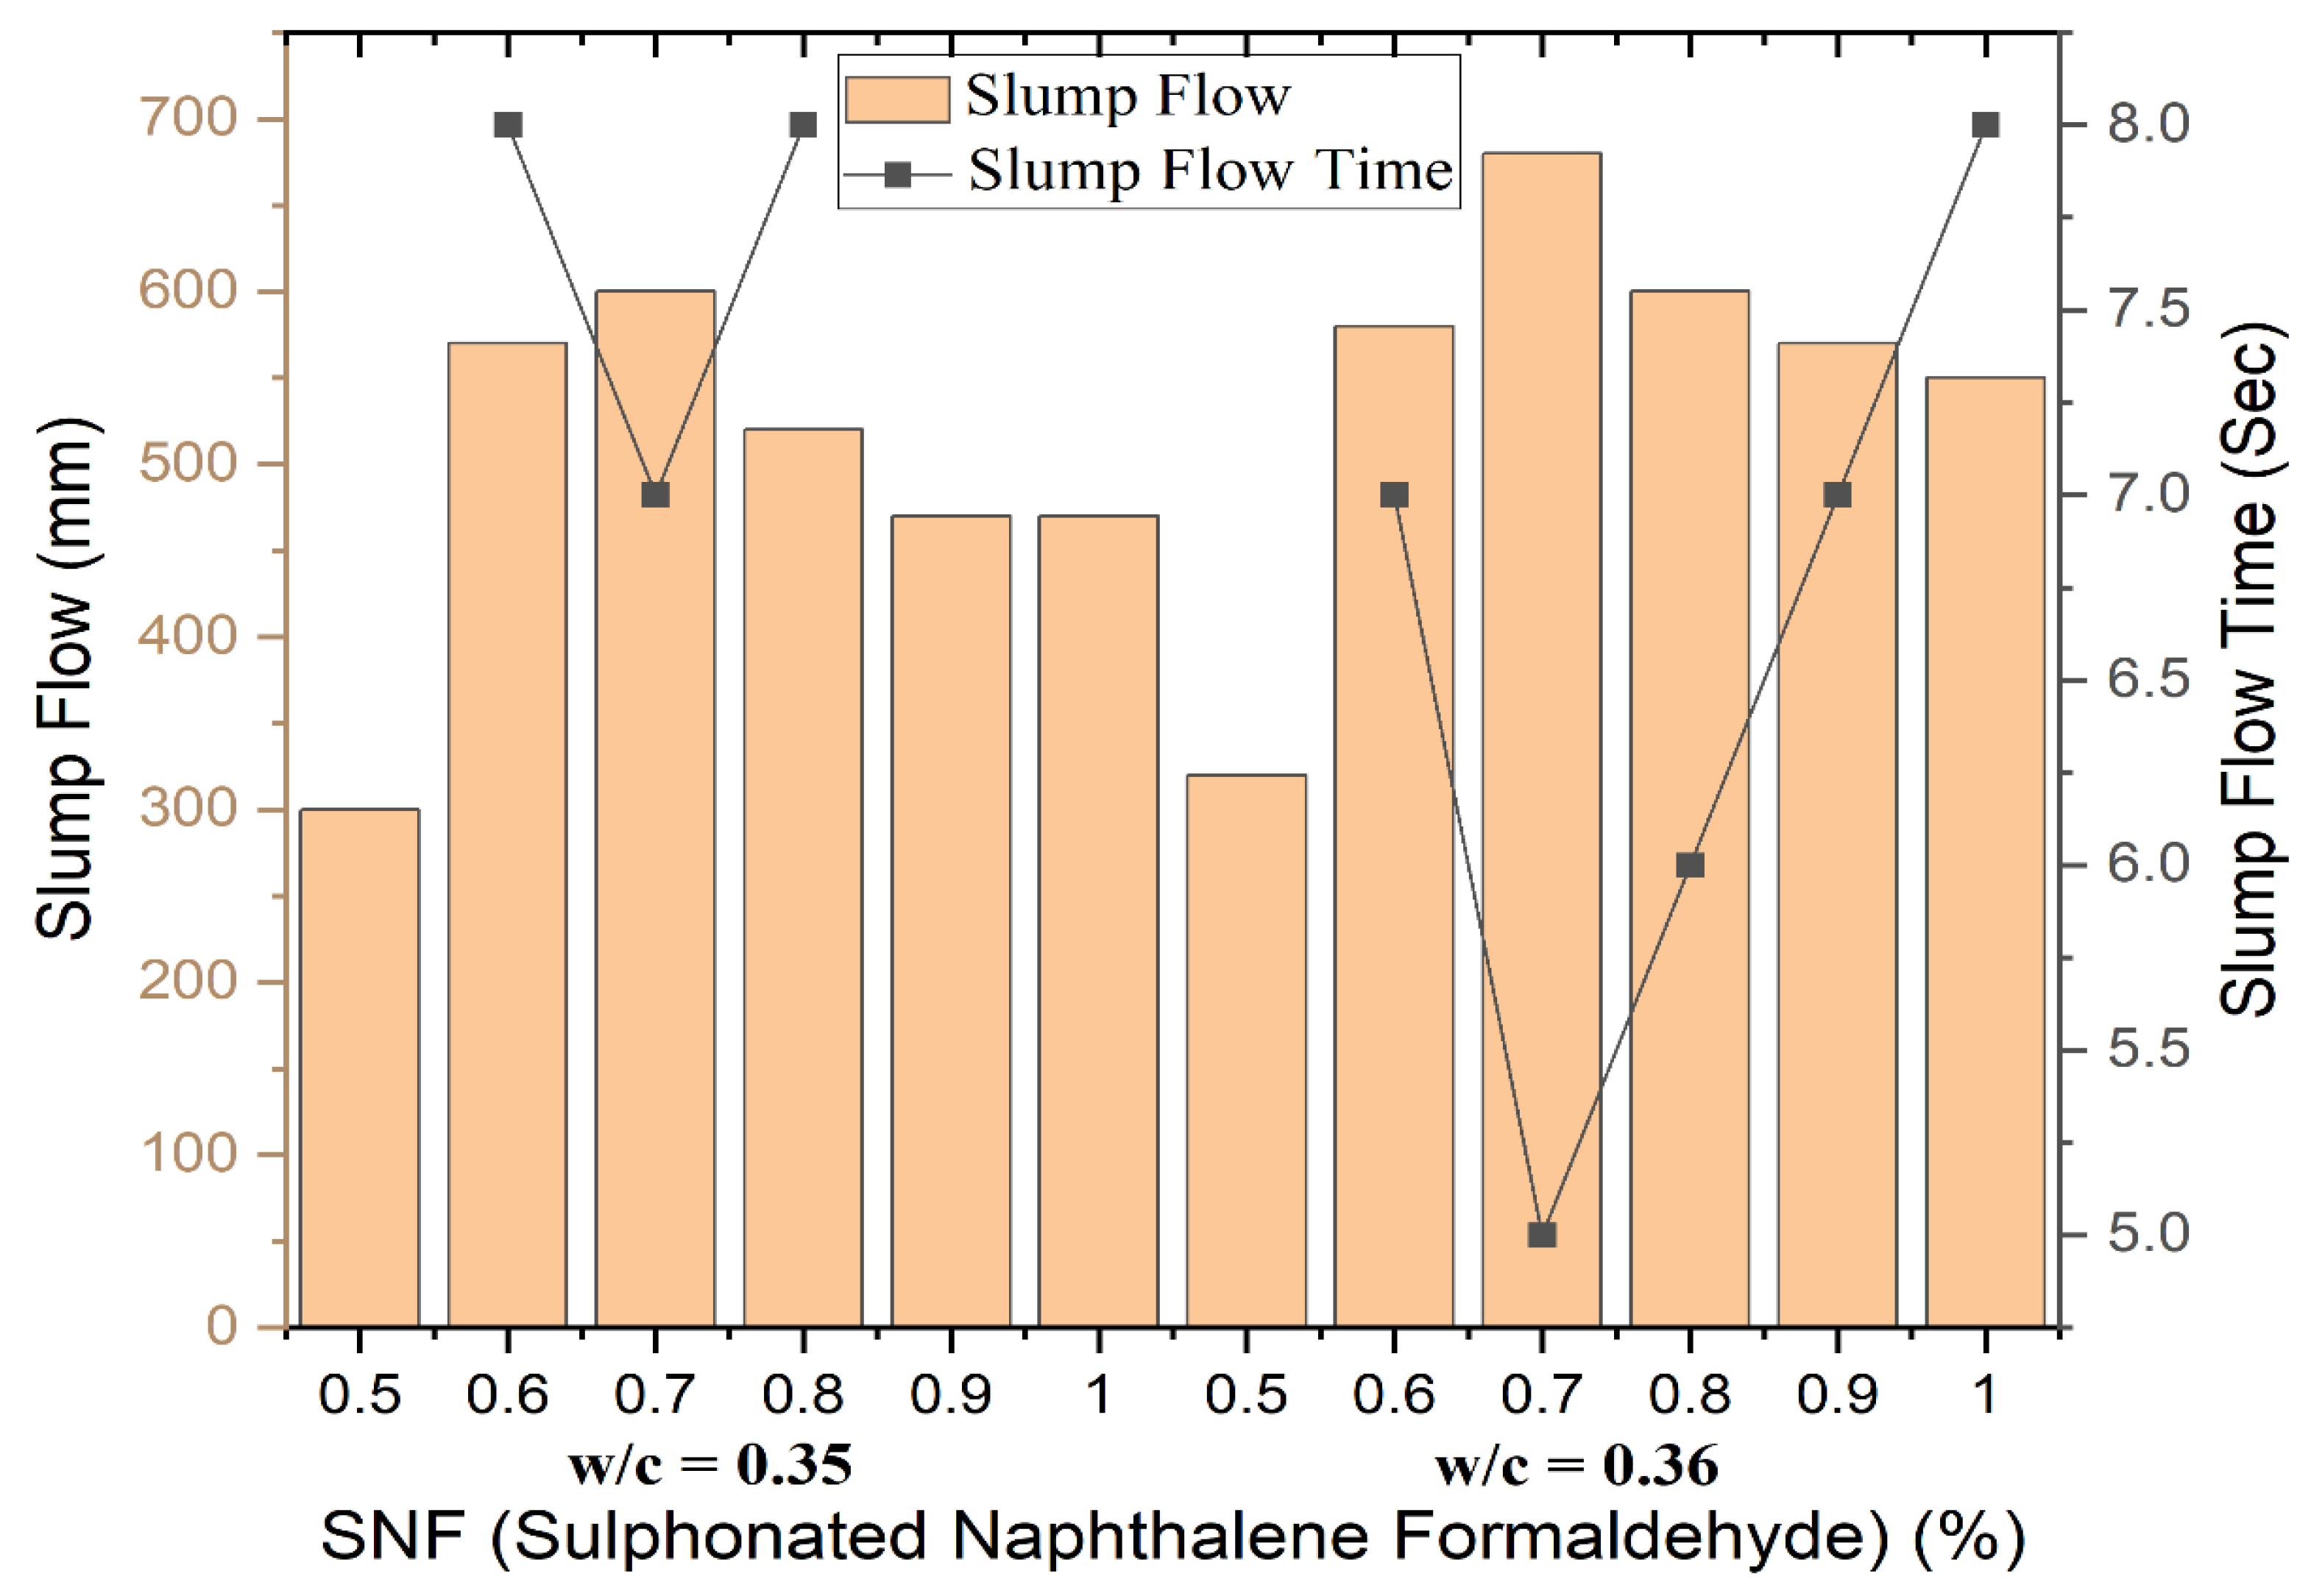
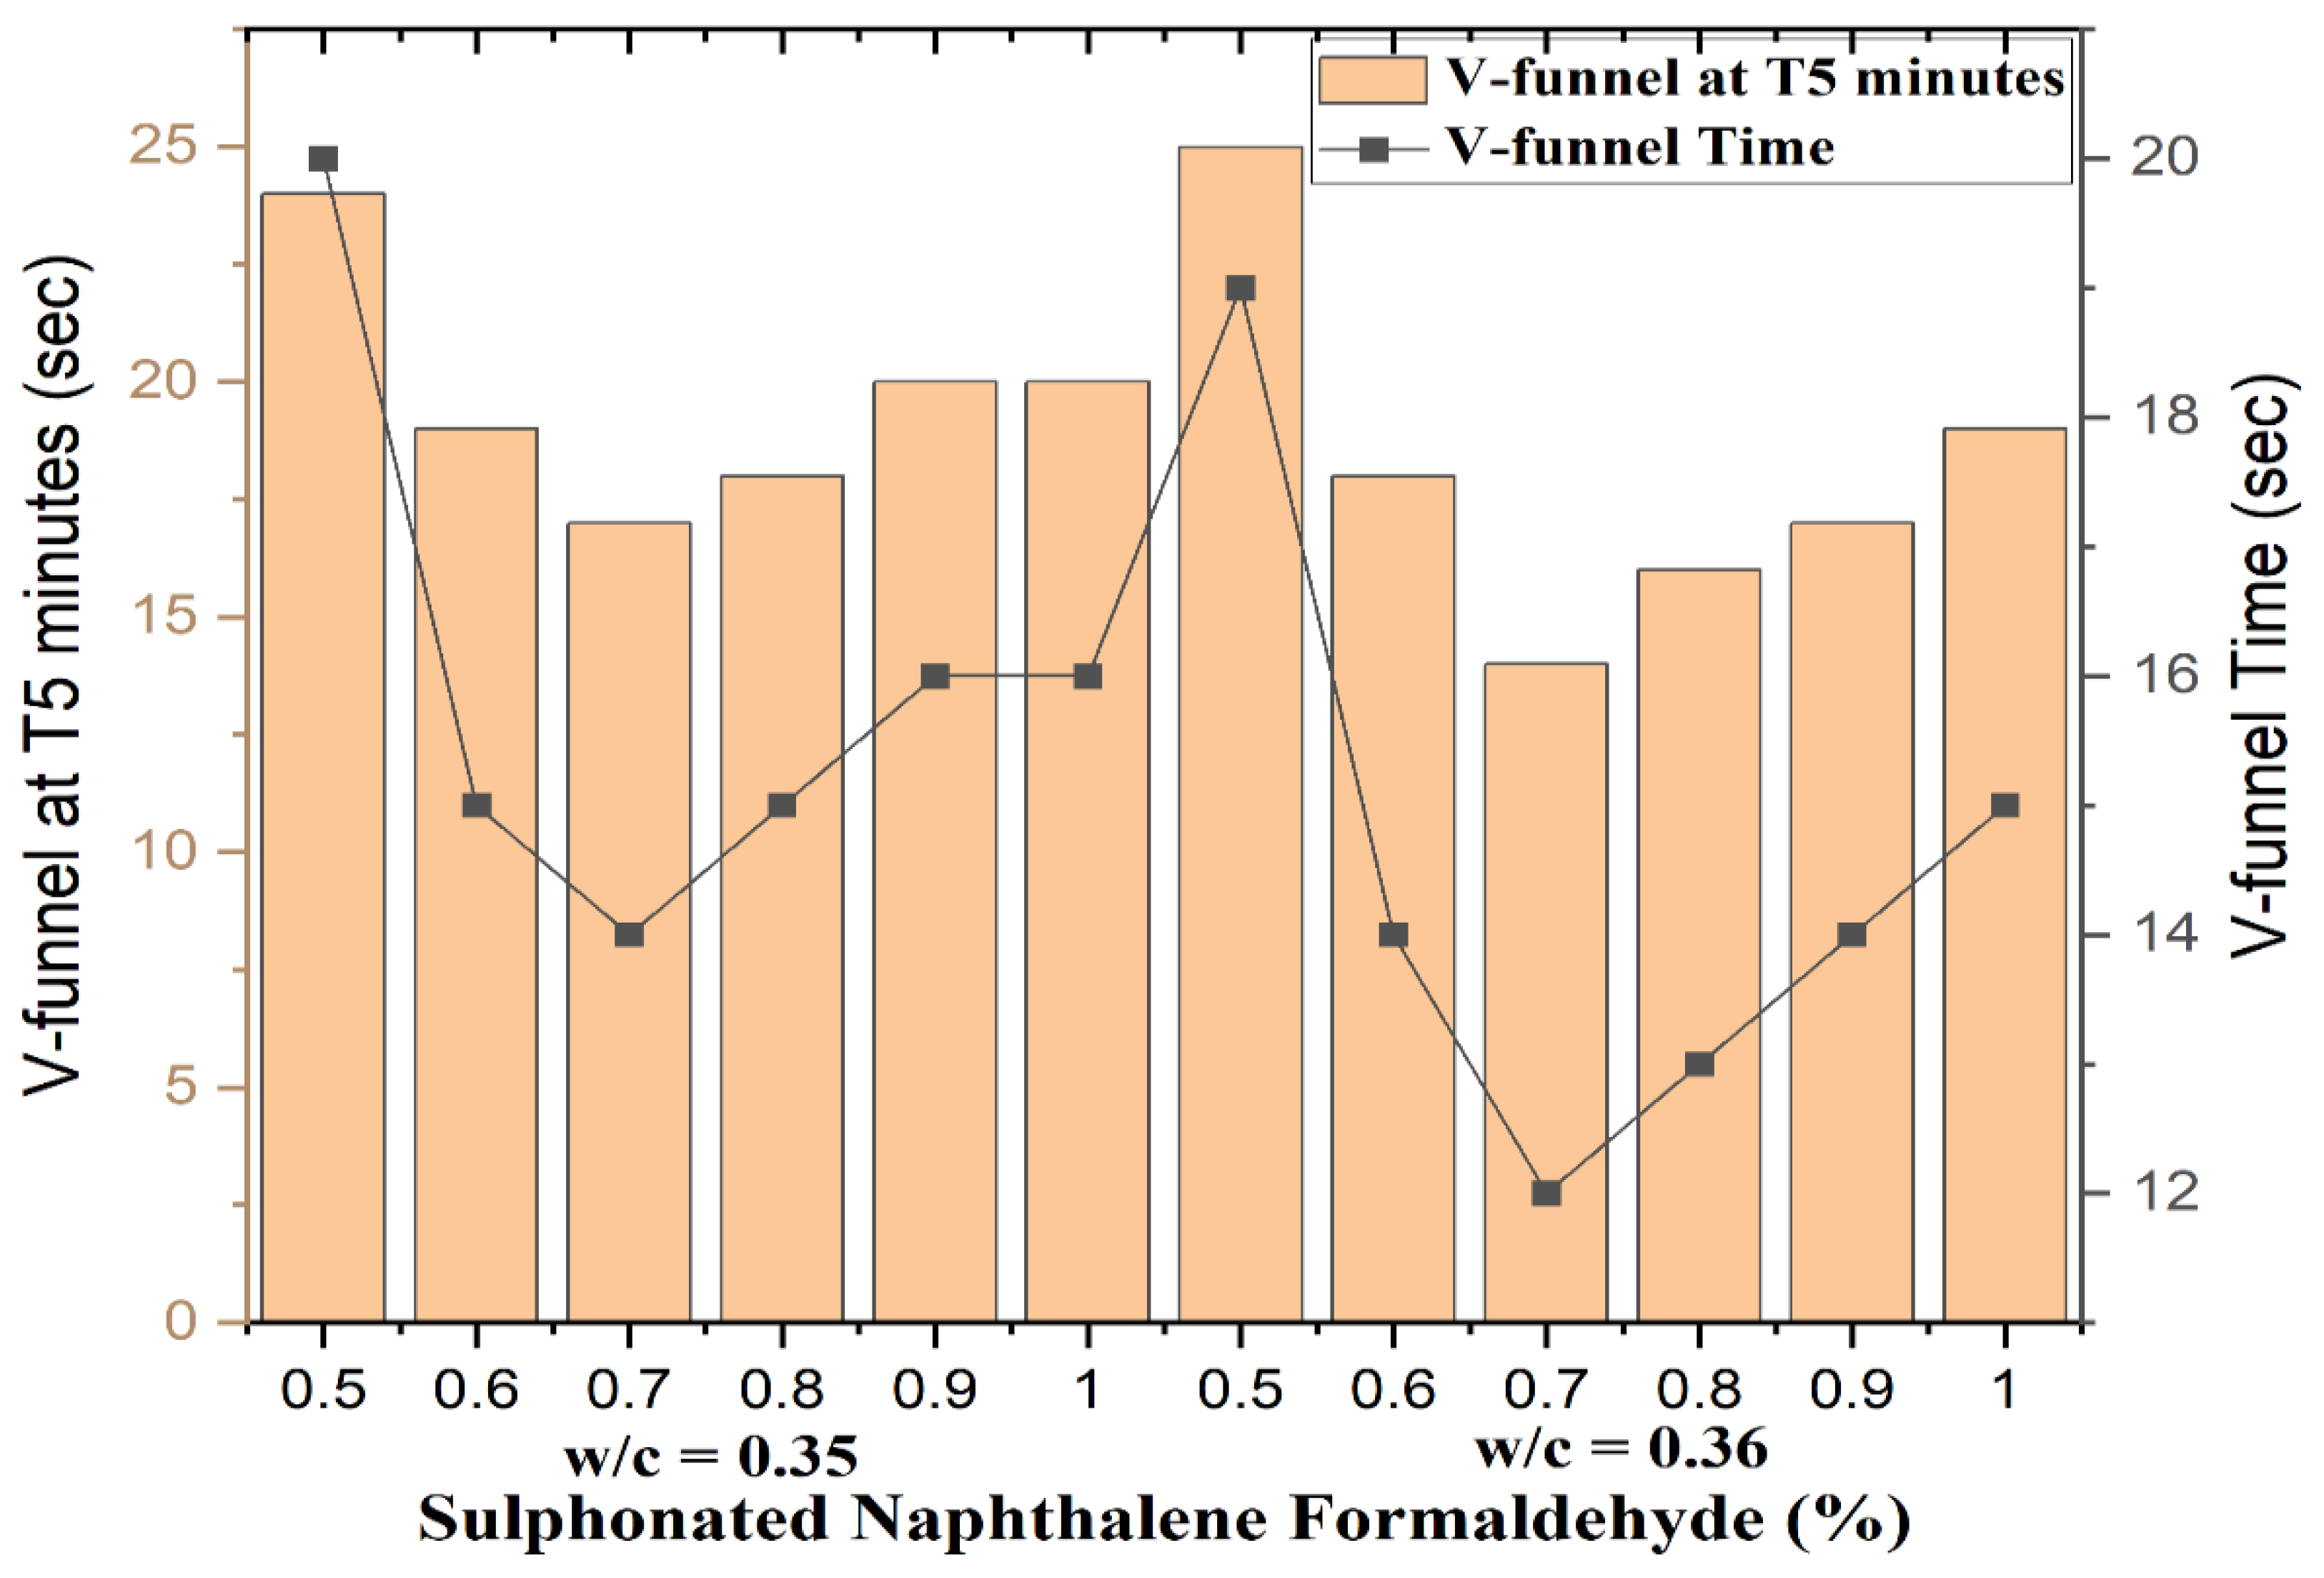
Figure 1.
Graph among the slump flow, slump flow time, and SNF.
Figure 2.
Graph between V funnel test and SNF dosage.
2.2.4. L-Box Test
This test is suitable to perform at the site and laboratory; it gives the transverse and passing through the L-box. The L-box apparatus consists of a rectangular section designed as an 'L,' featuring vertical and horizontal sections separated by a movable gate. Positioned in front of the movable gate are vertical reinforcing bars. The apparatus's design is illustrated in Figure 3. To perform this test, approximately 14 liters of SCC are required.
2.2.5. J-Ring Test
Figure 4, the J-Ring constitutes an open steel ring with a 300-millimeter diameter securely connected to vertical reinforcing bars at appropriate intervals. This examination is conducted with the slump flow test, where the J-Ring is centrally positioned, and the slump cone is placed inside it. Concrete is then poured into the cone, and the cone is raised, allowing the concrete to flow through the spaces between the bars, spreading horizontally. During this test, the diameter of the horizontal spread and the T50 time are measured, mirroring the Slump flow test. Subsequently, a comparison is made between the horizontal spread achieved with the J-Ring and without it. Additionally, the height differential between the concrete immediately within the J-Ring and outside concrete is measured at four distinct locations [28].
The blockage assessment is determined by calculating the variance between the slump flow and the J-Ring flow. This disparity serves as an indicator of a mixture's flowability. A practical ability to flow is signified by a variance of under 25 millimeters, while poor flowability is indicated by a variance exceeding 50 millimeters.

Table 1.
Efnarc table to satisfy self-compaction concrete.
| S. No. | Property | Test Methods | Unit | Typical Range Values |
|---|---|---|---|---|
| 1. | Filling ability | Slump flow | mm | 650 - 800 |
| 2. | T50 cm slump flow | sec | 2 - 5 | |
| 3. | V-funnel | sec | 6 - 12 | |
| 4. | Passing ability | L-box | (H2/H1) | 0.8 – 1.0 |
| 5. | U-box | (H2 - H1) mm | 0 - 30 | |
| 6. | J-ring | mm | 0 - 10 | |
| 7. | Segregation resistance | V-funnel at T5 minutes | sec | 0 - +3 |
2.3. Synthesis
The mixing procedure involved two distinct phases. Initially, a concrete mixer with a 100-liter capacity was employed to blend fine sand, crushed coarse aggregate in a saturated surface-dry state, and fly ash (FA) for approximately 2.5 minutes. After completing the dry mixing phase, a pre-mixed liquid solution comprising an alkaline solution, superplasticizer, and additional water was introduced into the concrete mixer. The wet mixing continued for an additional three minutes. After this, the fresh concrete mix was manually stirred for two to three minutes to ensure uniformity. Once the freshly prepared concrete mixture was ready for analysis, it underwent essential workability tests for evaluating SCC properties. After confirming that the new concrete mix met the prescribed workability standards per EFNARC guidelines, it was subsequently cast into steel molds measuring 100 millimeters by 100 millimeters by 100 millimeters.
3. Results
3.1. Self-Compacting Concrete
The information in Table 2, which lists numerous concrete mix parameters, will be examined in this section. These parameters consist of the water-to-cement ratio (w/c), the superplasticizer dosage (SNF%), the slump flow table diameter, the slump flow time at T50 cm, the V-funnel time, and the V-funnel time at T5 minutes. These values provide insight into the workability and flow characteristics of the concrete mixtures [43,44,45,46,47].
The slump flow table diameter ranges from 300 mm to 680 mm in slump flow table diameter. Greater values indicate greater workability and fluidity of the concrete mixture. With a diameter of 680 mm, mixture number 9 (SNF 0.36, w/c 0.7) has the greatest droop flow diameter.
T50 cm slump flow time represents the amount of time required for 50 cm of concrete to flow. The T50 cm decline flow time can vary between 5 and 8 seconds. Mix 9 (SNF 0.36, w/c 0.7) has the shortest T50 cm time, signifying superior fluidity relative to other mixtures. Figure 1 shows the variation of slump flow diameter and time with variation in superplastizers dosage.
V-funnel time measures the amount of time required for concrete to travel through a V-shaped funnel. The duration of the v-funnel ranges from 12 to 20 seconds. Mix 9 (SNF 0.36, w/c 0.7) again exhibits the minimum v-funnel time, indicating enhanced flow characteristics.
V-funnel time at T5 minutes indicates the flow time following 5 minutes of mingling. The values range from 14 to 25 seconds in the table. At T5 minutes, mix 7 (SNF 0.36, w/c 0.5) has the longest v-funnel time. Increasing the superplasticizer concentration (SNF %) improves the mix's workability and fluidity. In general, a higher water-to-cement ratio (w/c) increases flowability. Mix number 9 (SNF 0.36, w/c 0.7) exhibits the most favorable flow characteristics across all parameters. Figure 2 shows the variation of v-funnel time and v-funnel time at 5 minutes with the interpretation of superplastizers dosage.
Table 3 provides valuable information regarding the various concrete mix parameters, allowing us to assess the workability and fluidity of each mix. By analysing the data, we have determined that mixed number 9 (SNF 0.36, w/c 0.7) has superior flow properties to the other mixtures. Based on these findings, concrete mix designs may be improved for use in situations where workability and flow characteristics are essential.
The parameters are the water-to-cement ratio (w/c), the superplasticizer dose (SNF%), the L-box blockage ratio, the U-box difference, and the J-ring measurement. These evaluations aid in determining the suitability of concrete mixtures for construction applications by evaluating their flowability and stability.
The L-box obstructing ratio varies between 0.55 and 0.81. The higher the obstructing ratio, the greater the concrete's flowability and ability to travel through narrow spaces. The ninth mixture (SNF 0.36, w/c 0.7) has the maximum blocking ratio, indicating excellent flow characteristics.
U-box difference refers to the vertical difference (in millimeters) between the concrete heights in the u-shaped box. The u-box difference values range between 28 and 52 millimetres. The ninth mixture (SNF 0.35, w/c 0.5) has the lowest U-box difference, indicating greater stability. Figure 3 shows the variation of the L-box ratio and U-box ratio with the interpretation of superplasticiser dosage.
In J-ring measurement, concrete distribution around a steel cone indicates the mix's capacity to pass. J-ring values range from 8 mm to 54 mm. The ninth mixture (SNF 0.35, w/c 0.5) has the lowest J-ring measurement, indicating excellent flowability and workability. Figure 4 shows the variation of j-ring values with the interpretation of superplasticiser dosage.
Increasing the superplasticizer dosage (SNF%) tends to enhance the concrete mixture's flowability and ability to pass. Higher water-to-cement ratios (w/c) generally result in improved flowability and stability. Mixture 9 (SNF 0.35, w/c 0.5) demonstrates favourable results across all parameters, indicating excellent flowability and stability. Mixture number 9 (SNF 0.35, w/c 0.5) consistently displays favourable flowability and stability characteristics. These findings can be used to optimise concrete mixture designs for applications requiring superior flowability and stability. The project's particular requirements must be considered while choosing the right combination design based on the provided test results.
3.2. Self-curing concrete
3.2.1. Compressive Strength
In the domain of literature, let us delve into the profound significance of the data pertinent to Table 4 containing the various proportions of PEG 4000 (percent) and their corresponding strength measurements taken at distinct time intervals. Table 4 describes the interplay between PEG 4000 concentration and the resulting mechanical strength, both emerging as critical elements in materials science.
A thorough examination reveals that the duration of three days functions as an initial benchmark, allowing concrete samples to manifest their strength progressively. At this point, when the concentration of PEG 4000 is zero percent, the compressive strength settles at a modest 8.5 MPa. However, as time passes, a transformation occurs, ushering in a significant increase in strength. After a period of twenty-eight days, the concrete's compressive strength increases from 18.47 MPa to 37.57 MPa, demonstrating a significant increase.
Nonetheless, the domain of PEG 4000 concentration encompasses more than mere absence, as its progressive incorporation begins to steadily manifest profound changes. When 0.5% PEG 4000 concentration is introduced, a discernible pattern emerges. At three days, the compressive strength decreased marginally, stabilizing at 6.75 MPa. However, as the duration extends to seven days, the strength value rises to 14.358 MPa before reaching a plateau of 23.11 MPa on the twenty-eighth day. Such a pattern is consistent with subsequent repetitions, confirming the intricate relationship between concentration and power [48].
When the concentration is increased to 1%, the three-day strength increases to 15.44 MPa and reaches a maximum of 41.6 MPa after twenty-eight days. This ascent is accompanied by a persistent trend, with the seven-day pressure reading 32.162 MPa and rising to 42.33 MPa by the endpoint. Such coherence highlights the significance of PEG 4000 concentration in determining the resilience of concrete [23].
This intricate tapestry of PEG 4000 concentration and its effect on the strength of concrete reveals intriguing insights upon further investigation. The three-day strengths decrease to 13,37 MPa and 10,665 MPa, respectively, when the concentration increases to 1.5% and 2%. However, both concentrations exhibit growth and resilience over time, following a similar trajectory. The progressive increase in the seven-day and twenty-eight-day strengths demonstrates the profound effect of PEG 4000 on the material's durability. Values such as 26.22 MPa, 37.65 MPa, 21.33 MPa, and 35.24 MPa illustrate how the concrete changes as the PEG 4000 concentration rises [49].
Ultimately, this literary analysis reveals the complex relationship between PEG 4000 concentration and concrete strength development. The interaction between time and concentration reveals a story of growth and change, illuminating the profound implications for the field of materials science. Figure 5 graphically elaborate on the compressive strength of various mix.
3.2.2. Splitting tensile strength
In the absence of PEG 4000 (0% concentration), the 3-day strength measured 0.77 MPa, which progressively rose to 1.67 MPa after 7 days and further improved to 2.88 MPa at 28 days. These findings illustrate that material strength exhibited a positive correlation with the curing duration. When introducing a 0.5% PEG 4000 concentration, the 3-day strength slightly decreased to 0.7 MPa compared to the 0% concentration. Nonetheless, it rebounded to 1.52 MPa at 7 days and increased to 2.79 MPa at 28 days. Comparing these results with the 0% concentration, it becomes evident that the inclusion of 0.5% PEG 4000 positively impacted strength after the initial curing period. Similarly, the material exhibited a 3-day strength of 0.73 MPa with a continuous increase to 1.59 MPa at 7 days and 2.634 MPa at 28 days when PEG 4000 was included at a concentration of 0.73%. These results suggest incorporating 0.73% PEG 4000 enhances the material's strength over time.
Moving on to the next concentration, at 0.5% PEG 4000, the 3 days strength was 0.6 MPa, slightly lower than the previous concentrations. However, it increased to 1.283 MPa at 7 days and remained relatively stable at 1.29 MPa at 28 days. These results indicate that the material's strength was not significantly affected by the addition of PEG 4000 at a 0.5% concentration.
When the concentration was 0.63%, the 3 days strength increased to 1.33 MPa, which was higher than the previous concentration. However, the strength decreased to 1.1.32 MPa at 7 days, then increased again to 1.26 MPa at 28 days. These findings suggest that the impact of PEG 4000 at 0.63% on the material's strength was inconsistent throughout the curing period.
At a concentration of 0.59%, the material displayed a 3 days strength of 1.245 MPa. The strength increased slightly to 1.26 MPa at 7 days but showed no improvement at 28 days. These results suggest that adding PEG 4000 at 0.59% had a limited impact on the material's strength over time.
Moving to the higher concentrations, at 1% PEG 4000, the 3 days strength was 1.23 MPa, which increased to 2.56 MPa at 7 days and further increased to 2.73 MPa at 28 days. These findings indicate that the inclusion of PEG 4000 at 1% positively affected the material's strength throughout the curing period.
Similarly, at a concentration of 1.18%, the 3 days strength was 1.18 MPa, slightly lower than the previous concentration of 1%. However, the strength increased to 2.45 MPa at 7 days and 2.77 MPa at 28 days. These results suggest that adding PEG 4000 at 1.18% positively impacted the material's strength after the initial curing period.
Lastly, at 1.5% PEG 4000, the 3 days strength was 1.15 MPa. The strength increased to 2.26 MPa at 7 days and 2.59 MPa at 28 days. These findings indicate that the inclusion of PEG 4000 at 1.5% positively affected the material's strength throughout the curing period.
In summary, the data shows that the strength of the material varied based on the concentration of PEG 4000. Lower concentrations, such as 0.7% and 0.73%, enhanced the material's strength over time. However, at concentrations like 0.5%, the impact on strength was minimal. Higher concentrations, such as 1% and 1.5%, consistently improved the material's strength throughout the curing period. The data suggests that the optimal concentration of PEG 4000 for enhancing strength depends on the specific application and desired curing time. Further experiments and analysis could be conducted to determine the ideal concentration for particular requirements. Figure 6 graphically describes splitting tensile strength with the variation of PEG 4000.
3.2.3. Flexural Strength
Starting with a PEG 4000 concentration of 0%, the 3 days strength was 0.57 MPa, which increased slightly to 0.58 MPa and 0.57 MPa for subsequent trials. At 7 days, the strength improved to 1.236 MPa, 1.25 MPa, and 1.23 MPa, respectively. By 28 days, the strength continued to increase, reaching 2.174 MPa, 2.574 MPa, and 2.374 MPa. These results indicate a generally positive trend, with the material gaining strength over time without PEG 4000.
Moving on to a concentration of 0.5% PEG 4000, the 3 days strength increased to 0.7 MPa. At 7 days, the strength improved further to 1.492 MPa, 1.428 MPa, and 1.372 MPa for the different trials. However, at 28 days, the strength slightly decreased to 1.74 MPa, 1.69 MPa, and 1.8 MPa. These results suggest that adding PEG 4000 at 0.5% concentration positively affected the material's strength for up to 7 days, but the improvement diminished or even decreased by 28 days.
At a 1% PEG 4000 concentration, the 3 days strength increased to 1.05 MPa and 1.03 MPa for two trials, followed by a higher strength of 1.18 MPa in the third trial. The 7 days strength showed a similar pattern, with values of 2.188 MPa, 2.144 MPa, and 2.448 MPa, respectively. At 28 days, the strength continued to increase to 3.056 MPa, 2.944 MPa, and 2.968 MPa. These findings suggest that including PEG 4000 at 1% concentration significantly enhanced the material's strength over time.
When the concentration was 1.5% PEG 4000, the 3 days strength was 0.87 MPa, 0.92 MPa, and 0.82 MPa for the different trials. At 7 days, the strength increased to 1.712 MPa, 1.8 MPa, and 1.608 MPa. By 28 days, the strength further improved to 2.524 MPa, 2.568 MPa, and 2.424 MPa. These results indicate that adding PEG 4000 at 1.5% concentration positively affected the material's strength, although the improvement was relatively modest compared to the 1% concentration.
Finally, at a 2% PEG 4000 concentration, the 3 days strength was 0.786 MPa, 0.764 MPa, and 0.802 MPa. The 7 days strength improved to 1.572 MPa, 1.528 MPa, and 1.604 MPa, and at 28 days, the strength reached its highest values of 3.1 MPa, 3.08 MPa, and 3.11 MPa. These results indicate that the inclusion of PEG 4000 at 2% concentration had a substantial positive impact on the material's strength, with continuous improvement over the curing period.
In summary, the data suggests that the concentration of PEG 4000 significantly influences the material's strength. Lower concentrations, such as 0.5%, may have a positive effect up to a certain point but might not provide sustained improvement over the curing period. On the other hand, concentrations of 1% and 2% demonstrated consistent and significant enhancement in strength throughout the 28-day period. These findings indicate that higher concentrations of PEG 4000 can be more effective in improving the material's strength. However, it is important to consider the material's specific requirements and desired properties when determining the optimal concentration of PEG 4000. Figure 7 shows the graphical representation of flexural strength at different ages with the variation of PEG 4000 [50].
5. Conclusions
This study aimed to find the optimal sand, coarse aggregate, cement, and superplasticizer proportions for maximum concrete strength. The study of how inter-curing agents create internal water reservoirs, increasing humidity and reducing self-desiccation are studied, and result are as below:
- Increasing the superplasticizer dosage (SNF%) enhances the flowability and possibility of the concrete mixture, while higher water-to-cement ratios (w/c) generally improve flowability and stability.
- Mixture number 9 (SNF 0.35, w/c 0.5) consistently exhibits excellent flowability and stability, making it a valuable choice. These findings offer insights for optimizing concrete mix designs, especially in applications where superior flowability and stability are essential. However, it's crucial to consider project-specific requirements when selecting the most suitable method based on the test results provided.
- In summary, the data suggests that the concentration of PEG 4000 significantly influences the material's strength. Lower concentrations, such as 0.5%, may have a positive effect up to a certain point but might not provide sustained improvement over the curing period.
- Concentrations of 1% and 2% demonstrated consistent and significant enhancement in strength throughout the 28-day period. It shows that the higher concentrations of PEG 4000 can be more effective in improving the material strength. However, it is important to consider the material's specific requirements and desired properties when determining the optimal concentration of PEG 4000.
Author Contributions
Conceptualization, M.V. and R.K.M.; Methodology, M.V. and R.K.M.; Software, M.V. and R.K.M.; Validation, M.V., R.K.M., M.I.K. and J.M.K; Formal analysis, M.V. and R.K.M.; Resources, M.I.K and J.M.K.; Writing – original draft, M.V.; Writing – review & editing, , M.V., R.K.M., M.I.K. and J.M.K; Supervision, M.I.K and J.M.K. All authors have read and agreed to the published version of the manuscript.
Funding
The authors extend their appreciation to Researcher Supporting Project number (RSPD2023R692), King Saud University, Riyadh, Kingdom of Saudi Arabia.
Institutional Review Board Statement
Not applicable.
Informed Consent Statement
Not applicable.
Data Availability Statement
Not applicable.
Acknowledgments
The authors extend their appreciation to Researcher Supporting Project number (RSPD2023R692), King Saud University, Riyadh, Kingdom of Saudi Arabia.
Conflicts of Interest
The authors declare no conflict of interest.
References
- Uysal, M. Self-Compacting Concrete Incorporating Filler Additives: Performance at High Temperatures. Constr. Build. Mater. 2012, 26, 701–706. [Google Scholar] [CrossRef]
- Safiuddin, M.; Salam, M.A.; Jumaat, M.Z. Key Fresh Properties of Self-Consolidating High-Strength POFA Concrete. J. Mater. Civ. Eng. 2014, 26, 134–142. [Google Scholar] [CrossRef]
- Tao, J.; Yuan, Y.; Taerwe, L. Compressive Strength of Self-Compacting Concrete during High-Temperature Exposure. J. Mater. Civ. Eng. 2010, 22, 1005–1011. [Google Scholar] [CrossRef]
- Okrajnov-Bajic, R.; Vasovic, D. Self-Compacting Concrete and Its Application in Contemporary Architectural Practice. Spatium 2009, 28–34. [Google Scholar] [CrossRef]
- Su, N.; Hsu, K.C.; Chai, H.W. A Simple Mix Design Method for Self-Compacting Concrete. Cem. Concr. Res. 2001, 31, 1799–1807. [Google Scholar] [CrossRef]
- Noumowé, A.; Carré, H.; Daoud, A.; Toutanji, H. High-Strength Self-Compacting Concrete Exposed to Fire Test. J. Mater. Civ. Eng. 2006, 18, 754–758. [Google Scholar] [CrossRef]
- Güneyisi, E.; Gesoglu, M.; Azez, O.A.; Öz, H.Ö. Effect of Nano Silica on the Workability of Self-Compacting Concretes Having Untreated and Surface Treated Lightweight Aggregates. Constr. Build. Mater. 2016, 115, 371–380. [Google Scholar] [CrossRef]
- Praveen Kumar Gupta, Rakesh Kumar, Y. K. Gupta, P.K.M. Effect of Acidic Environment on Self Compacting Concrete. Int. J. Civ. Eng. Technol. 2017, 8, 595–606. [Google Scholar]
- Deneme, I.Ö. Modelling of Compressive Strength of Self-Compacting Concrete Containing Fly Ash by Gene Expression Programming. Rev. la Constr. 2020, 19, 346–358. [Google Scholar] [CrossRef]
- Rodriguez de Sensale, G.; Rodriguez Viacava, I.; Aguado, A. Simple and Rational Methodology for the Formulation of Self-Compacting Concrete Mixes. J. Mater. Civ. Eng. 2016, 28, 04015116. [Google Scholar] [CrossRef]
- Sarker, P.K. Self-Healing of Microcracks in High-Volume Fly-Ash-Incorporated Engineered Cementitious Composites. Civ. Eng. Dimens. 2015, 17, 133–139. [Google Scholar] [CrossRef]
- Ismail, M.K.; Hassan, A.A.A. Influence of Mixture Composition and Type of Cementitious Materials on Enhancing the Fresh Properties and Stability of Self-Consolidating Rubberized Concrete. J. Mater. Civ. Eng. 2016, 28, 04015075. [Google Scholar] [CrossRef]
- Ling, T.C.; Poon, C.S.; Kou, S.C. Influence of Recycled Glass Content and Curing Conditions on the Properties of Self-Compacting Concrete after Exposure to Elevated Temperatures. Cem. Concr. Compos. 2012, 34, 265–272. [Google Scholar] [CrossRef]
- García, L.; Valcuende, M.; Balasch, S.; Fernández-LLebrez, J. Study of Robustness of Self-Compacting Concretes Made with Low Fines Content. J. Mater. Civ. Eng. 2013, 25, 497–503. [Google Scholar] [CrossRef]
- Vivek K; Bhavana B; Prema Kumar W P; Prathap Kumar M T Experimental Investigation on Properties of Self-Compacting and Self-Curing Concrete with Silica Fume and Light Weight Aggregates. Int. J. Eng. Res. 2015, V4, 203–210. [CrossRef]
- Verma, M.; Nigam, M. Mechanical Behaviour of Self Compacting and Self Curing Concrete. Int. J. Innov. Res. Sci. Eng. Technol. 2017, 6, 14361–14366. [Google Scholar] [CrossRef]
- Demie, S.; Nuruddin, M.F.; Shafiq, N.; Fadhil, M.; Shafiq, N. Effects of Micro-Structure Characteristics of Interfacial Transition Zone on the Compressive Strength of Self-Compacting Geopolymer Concrete. Constr. Build. Mater. 2020, 41, 91–98. [Google Scholar] [CrossRef]
- Journal, I.; Engineering, O. Flexural Behaviour of Self Compacting Self Curing Concrete Beam. 2015, 2, 37–40. [Google Scholar]
- Bingöl, A.F.; Tohumcu, I. Effects of Different Curing Regimes on the Compressive Strength Properties of Self Compacting Concrete Incorporating Fly Ash and Silica Fume. Mater. Des. 2013, 51, 12–18. [Google Scholar] [CrossRef]
- Akanksha, M.; Patil, A.; Vyawahare, P.M.R. Comparative Study on Durability of Self Cured SCC and Normally Cured SCC. 2014, 3, 1201–1208. [Google Scholar]
- Aggarwal, P.; Siddique, R.; Aggarwal, Y.; Gupta, S.M. Leonardo Electronic Journal of Practices and Technologies Self-Compacting Concrete-Procedure for Mix Design. Leonardo Electron. J. Pract. Technol. 2008, 15–24. [Google Scholar]
- Dhir, R.K.; Hewlett, P.C.; Dyer, T.D. Durability of “self-Cure” Concrete. Cem. Concr. Res. 1995, 25, 1153–1158. [Google Scholar] [CrossRef]
- Mallikarjuna Reddy, V.; Praveen, R. Effect of Polyethylene Glycol in Self-Curing of Self Compacting Concrete. Int. J. Recent Technol. Eng. 2019, 8, 7280–7283. [Google Scholar] [CrossRef]
- Persson, B. A Comparison between Mechanical Properties of Self-Compacting Concrete and the Corresponding Properties of Normal Concrete. Cem. Concr. Res. 2001, 31, 193–198. [Google Scholar] [CrossRef]
- Junaid, S.M.; Saddam, S.; Junaid, M.; Yusuf, K.; Huzaifa, S.A. Self-Curing Concrete. 2015, 1, 1–7. [Google Scholar]
- Massana, J.; Reyes, E.; Bernal, J.; León, N.; Sánchez-Espinosa, E. Influence of Nano- and Micro-Silica Additions on the Durability of a High-Performance Self-Compacting Concrete. Constr. Build. Mater. 2018, 165, 93–103. [Google Scholar] [CrossRef]
- Fareed Ahmed, M.; Fadhil Nuruddin, M.; Shafiq, N. Compressive Strength and Workability Characteristics of Low-Calcium Fly Ash-Based Self-Compacting Geopolymer Concrete. World Acad. Sci. Eng. Technol. 2011, 74, 8–14. [Google Scholar] [CrossRef]
- El-Dieb, A.S. Self-Curing Concrete: Water Retention, Hydration and Moisture Transport. Constr. Build. Mater. 2007, 21, 1282–1287. [Google Scholar] [CrossRef]
- Mousa, M.I.; Mahdy, M.G.; Abdel-Reheem, A.H.; Yehia, A.Z. Physical Properties of Self-Curing Concrete (SCUC). HBRC J. 2015, 11, 167–175. [Google Scholar] [CrossRef]
- Łaz´niewska-Piekarczyk, B. The Influence of Selected New Generation Admixtures on the Workability, Air-Voids Parameters and Frost-Resistance of Self Compacting Concrete. Constr. Build. Mater. J. 2012, 31, 310–319. [Google Scholar] [CrossRef]
- Hameed, M.H.; Abbas, Z.K.; Ali Al-Ahmed, A.H. Fresh and Hardened Properties of Nano Self-Compacting Concrete with Micro and Nano Silica. IOP Conf. Ser. Mater. Sci. Eng. 2020, 671, 012079. [Google Scholar] [CrossRef]
- IS 2386 (Part VI) Methods of Test for Aggregates for Concrete Part VI Measuring Mortar Making Properties of Fine Aggregate. Bur. Indian Stand. 1997, 2386.
- IS 2386 (Part IV) Methods of Test for Aggregates for Concrete Part IV Mechanical Properties. Bur. Indian Stand. 1997, 2386.
- IS 383 1970 Specification for Coarse and Fine Aggregates from Natural Sources for Concrete. Bur. Indian Stand. 1997, 1–20.
- IS 2386 (Part III) Methods of Test for Aggregates for Concrete Part III Specific Gravity, Density, Voids, Absorption and Bulking. Bur. Indian Stand. 1997, 2386.
- IS 2386 (Part VIII) Methods of Test for Aggregates for Concrete Part VIII Petrographic Examination. Bur. Indian Stand. 1997, 2386.
- IS 2386 (Part II) Methods of Test for Aggregates for Concrete Part II Estimation of Deleterious Materials and Organic Impurties. Bur. Indian Stand. 1998, 2386.
- IS 2386 (PartV) Methods of Test for Aggregates for Concrete Part V Soundness. Bur. Indian Stand. 1997.
- IS 2386 (Part I) Methods of Test for Aggregates for Concrete Part I Particle Size and Shape. Bur. Indian Stand. 1997, 2386.
- IS 2386 (Part VII) Methods of Test for Aggregates for Concrete Part VII Alkali Aggregate Reactivity. Bur. Indian Stand. 1997.
- IS 9103 1999 Concrete Admixture -Specification; 2018.
- IS 12119 1987 General Requirements for Pan Mixers for Concrete; 1999. 12.
- Suriya, D.; Chandar, S.P.; Ravichandran, P.T. Impact of M-Sand on Rheological, Mechanical, and Microstructural Properties of Self-Compacting Concrete. Buildings 2023, 13. [Google Scholar] [CrossRef]
- Bušić, R.; Miličević, I.; Dokšanović, T.; Grubišić, M. Durability Performance and Thermal Resistance of Structural Self-Compacting Concrete Improved with Waste Rubber and Silica Fume. Buildings 2023, 13. [Google Scholar] [CrossRef]
- Mathews, M.E.; Kiran, T.; Nammalvar, A.; Andrushia, A.D.; Alengaram, U.J. Efficacy of Fire Protection Techniques on Impact Resistance of Self-Compacting Concrete. Buildings 2023, 13. [Google Scholar] [CrossRef]
- de Souza, M.H.B.; Silva, L.R.R.; Ribeiro, V.A. dos S.; Gonçalves, P.C.; Melo, M. de L.N.M.; Gomes, C.E.M.; dos Santos, V.C. Influence of Superabsorbent Polymer in Self-Compacting Mortar. Buildings 2023, 13. [Google Scholar] [CrossRef]
- Marzouk, H.A.; Arab, M.A.; Fattouh, M.S.; Hamouda, A.S. Effect of Agricultural Phragmites, Rice Straw, Rice Husk, and Sugarcane Bagasse Ashes on the Properties and Microstructure of High-Strength Self-Compacted Self-Curing Concrete. Buildings 2023, 13. [Google Scholar] [CrossRef]
- Evangeline, S. Self Curing Concrete and Its Inherent Properties. Int. J. Eng. Res. Appl. 2014, 4, 66–71. [Google Scholar]
- K, S.; K, V.M.; Kaulgud, N. Morphology Based Surface Crack Detection. J. Adv. Res. Sci. 2015, 1, 15–20. [Google Scholar]
- Studies, P.; Self, O.; Concrete, C.; The, W.; Of, A.; Glycol, P. Self Curing Concrete Project 2014; 2014.
Figure 3.
Graph among L-box, U-box results, and SNF dosage.
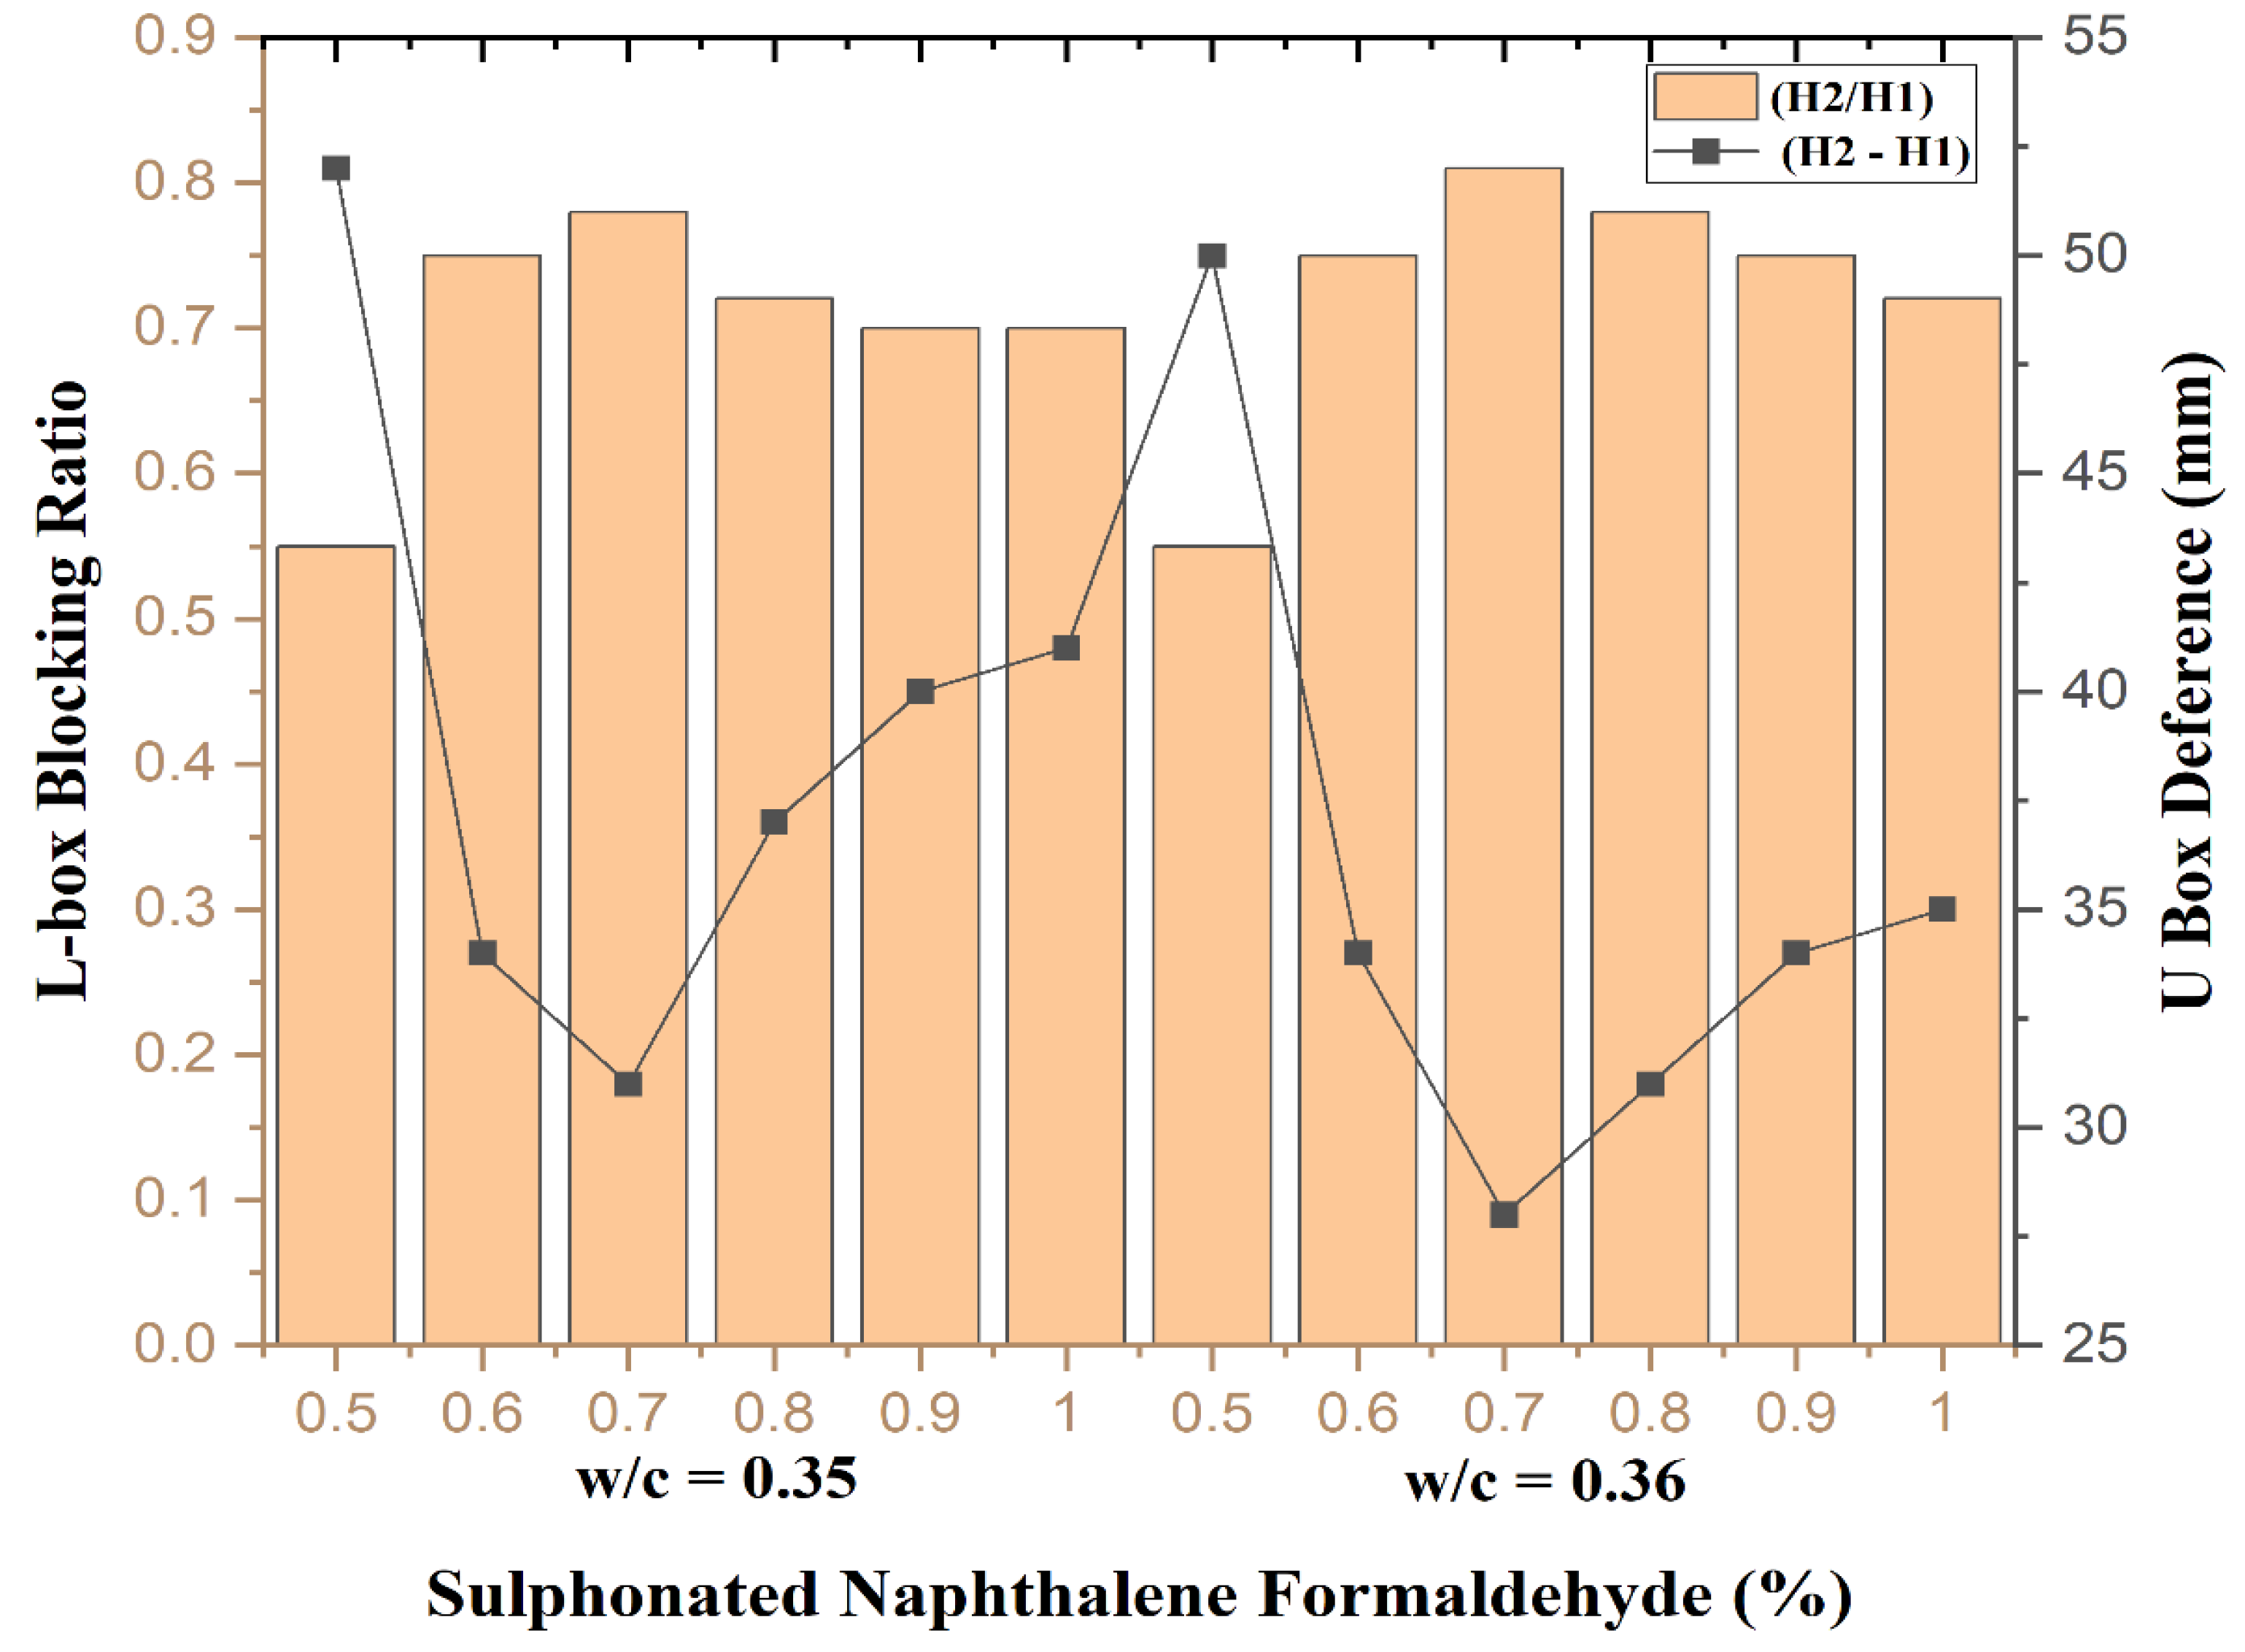
Figure 4.
Graph between the j-ring test and SNF dosage.
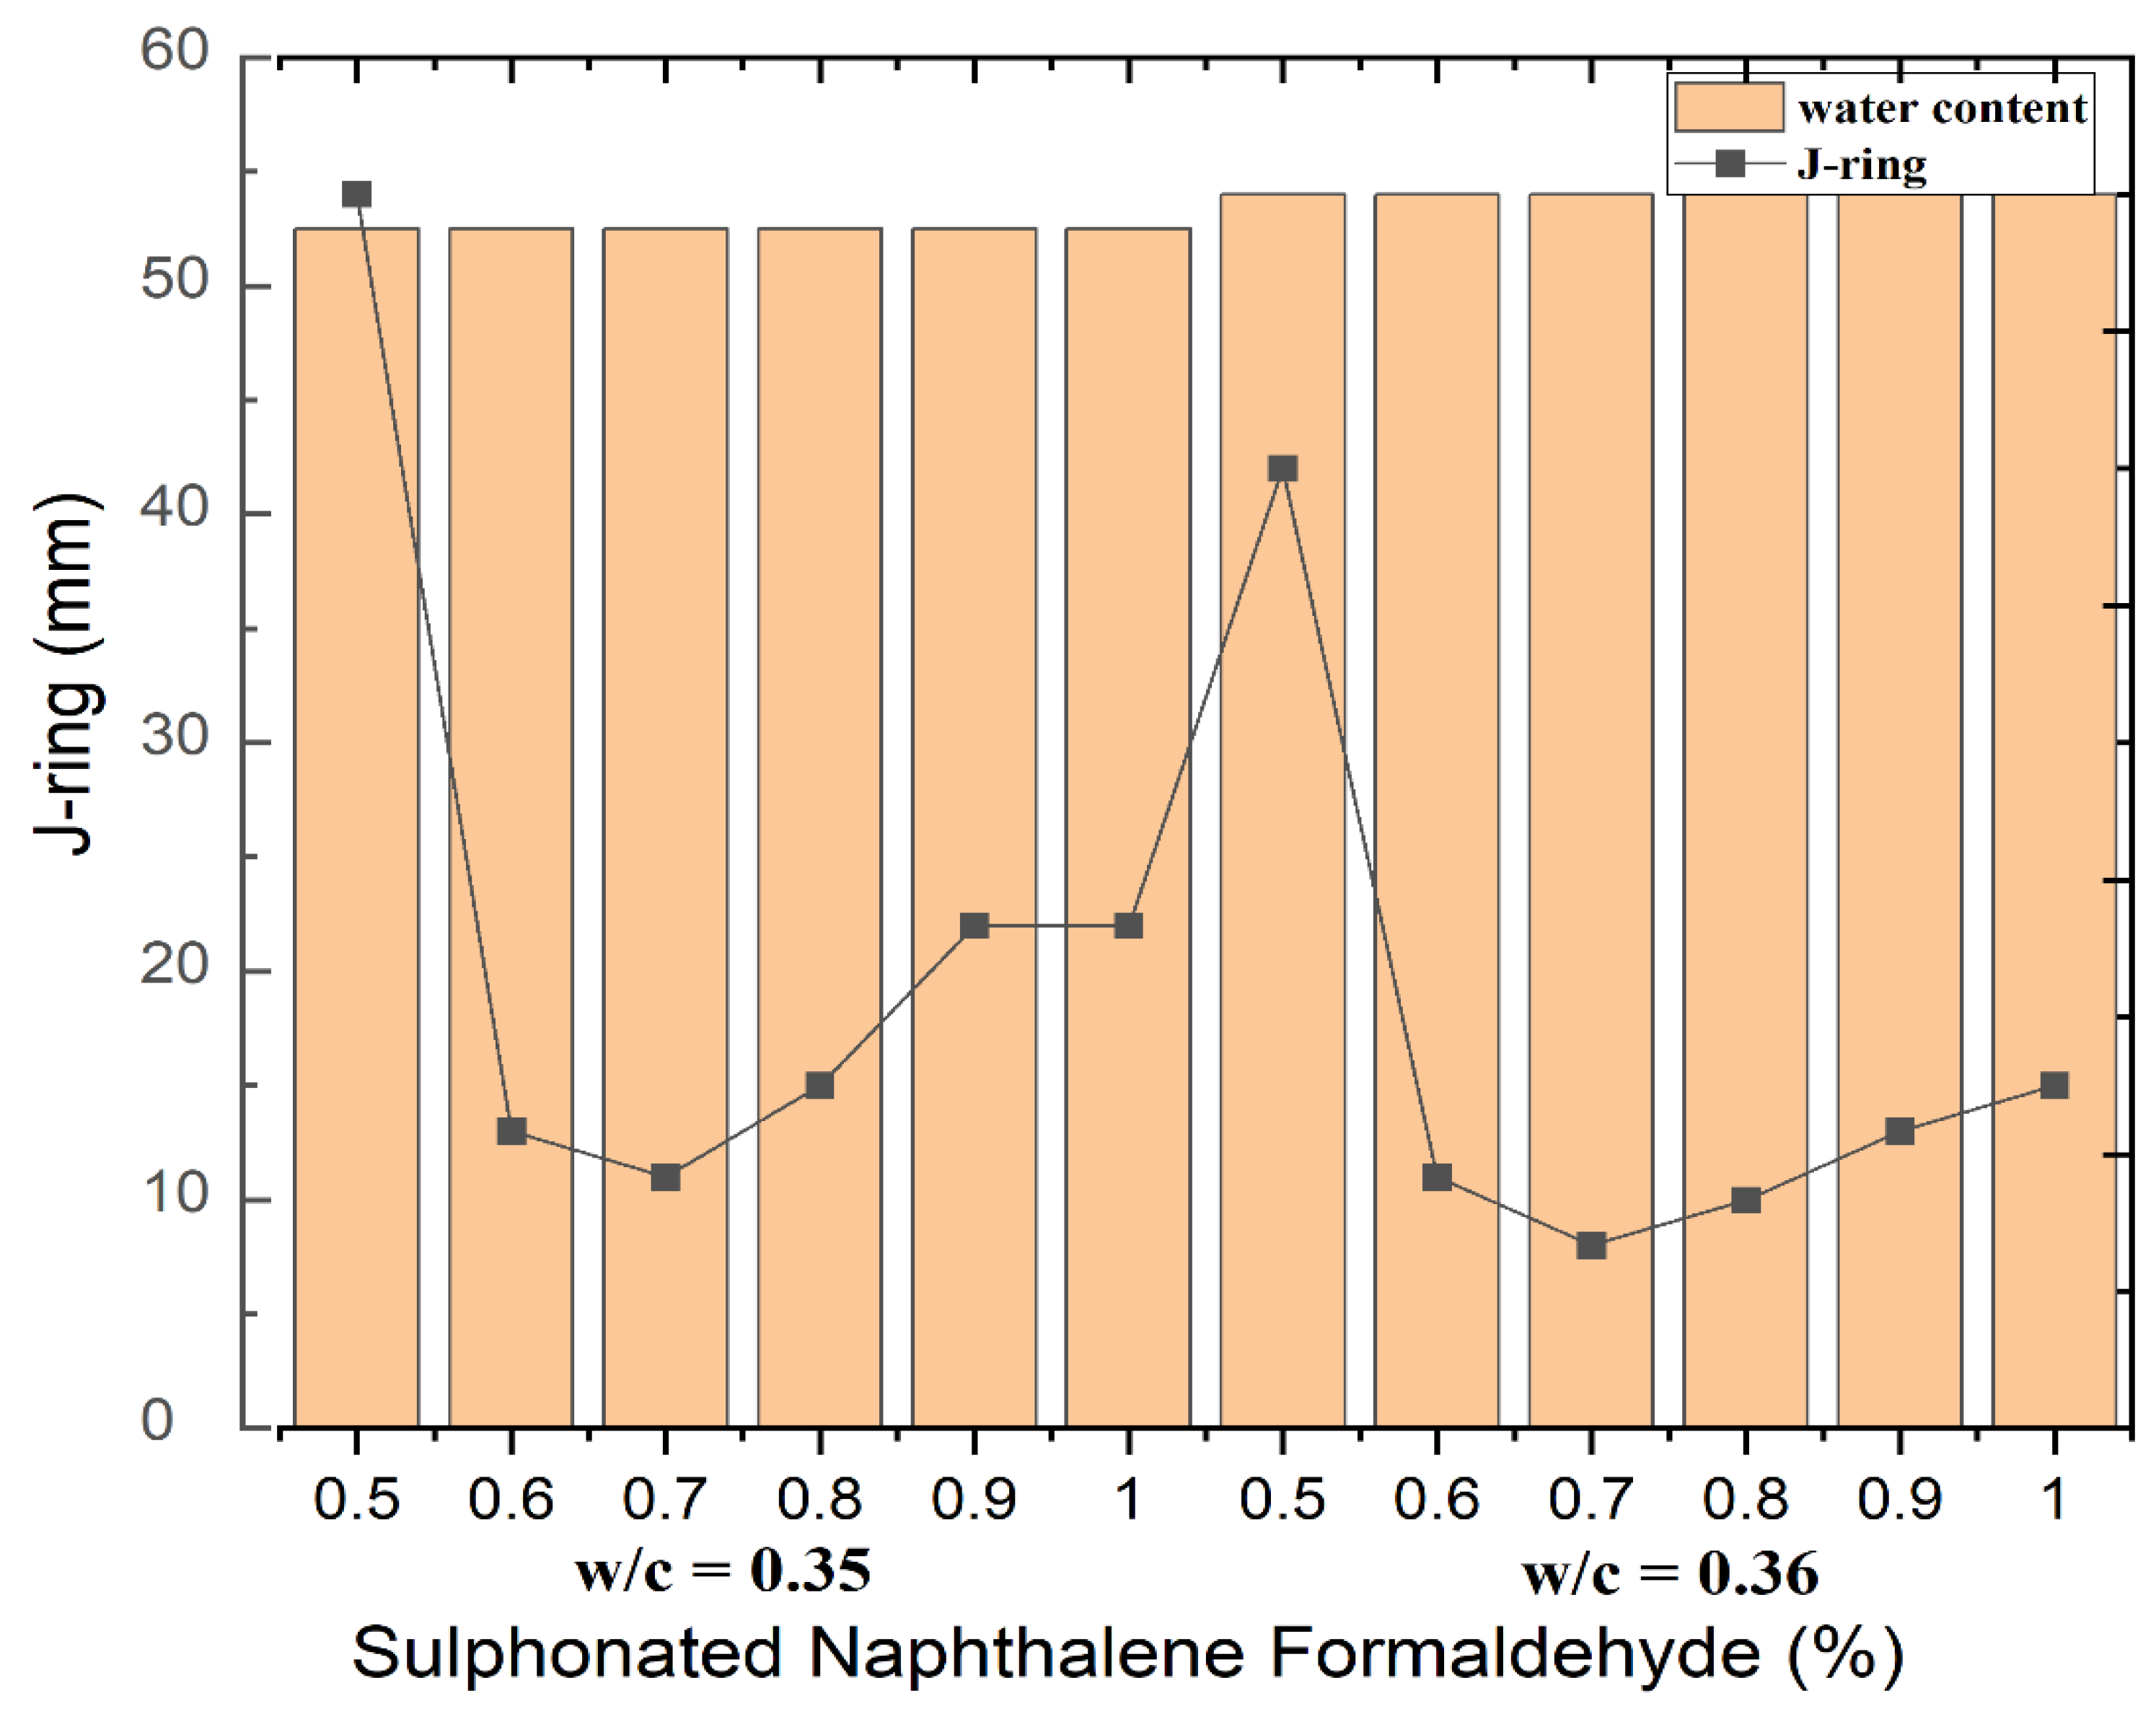
Figure 5.
Graph between compressive strength and PEG 4000.
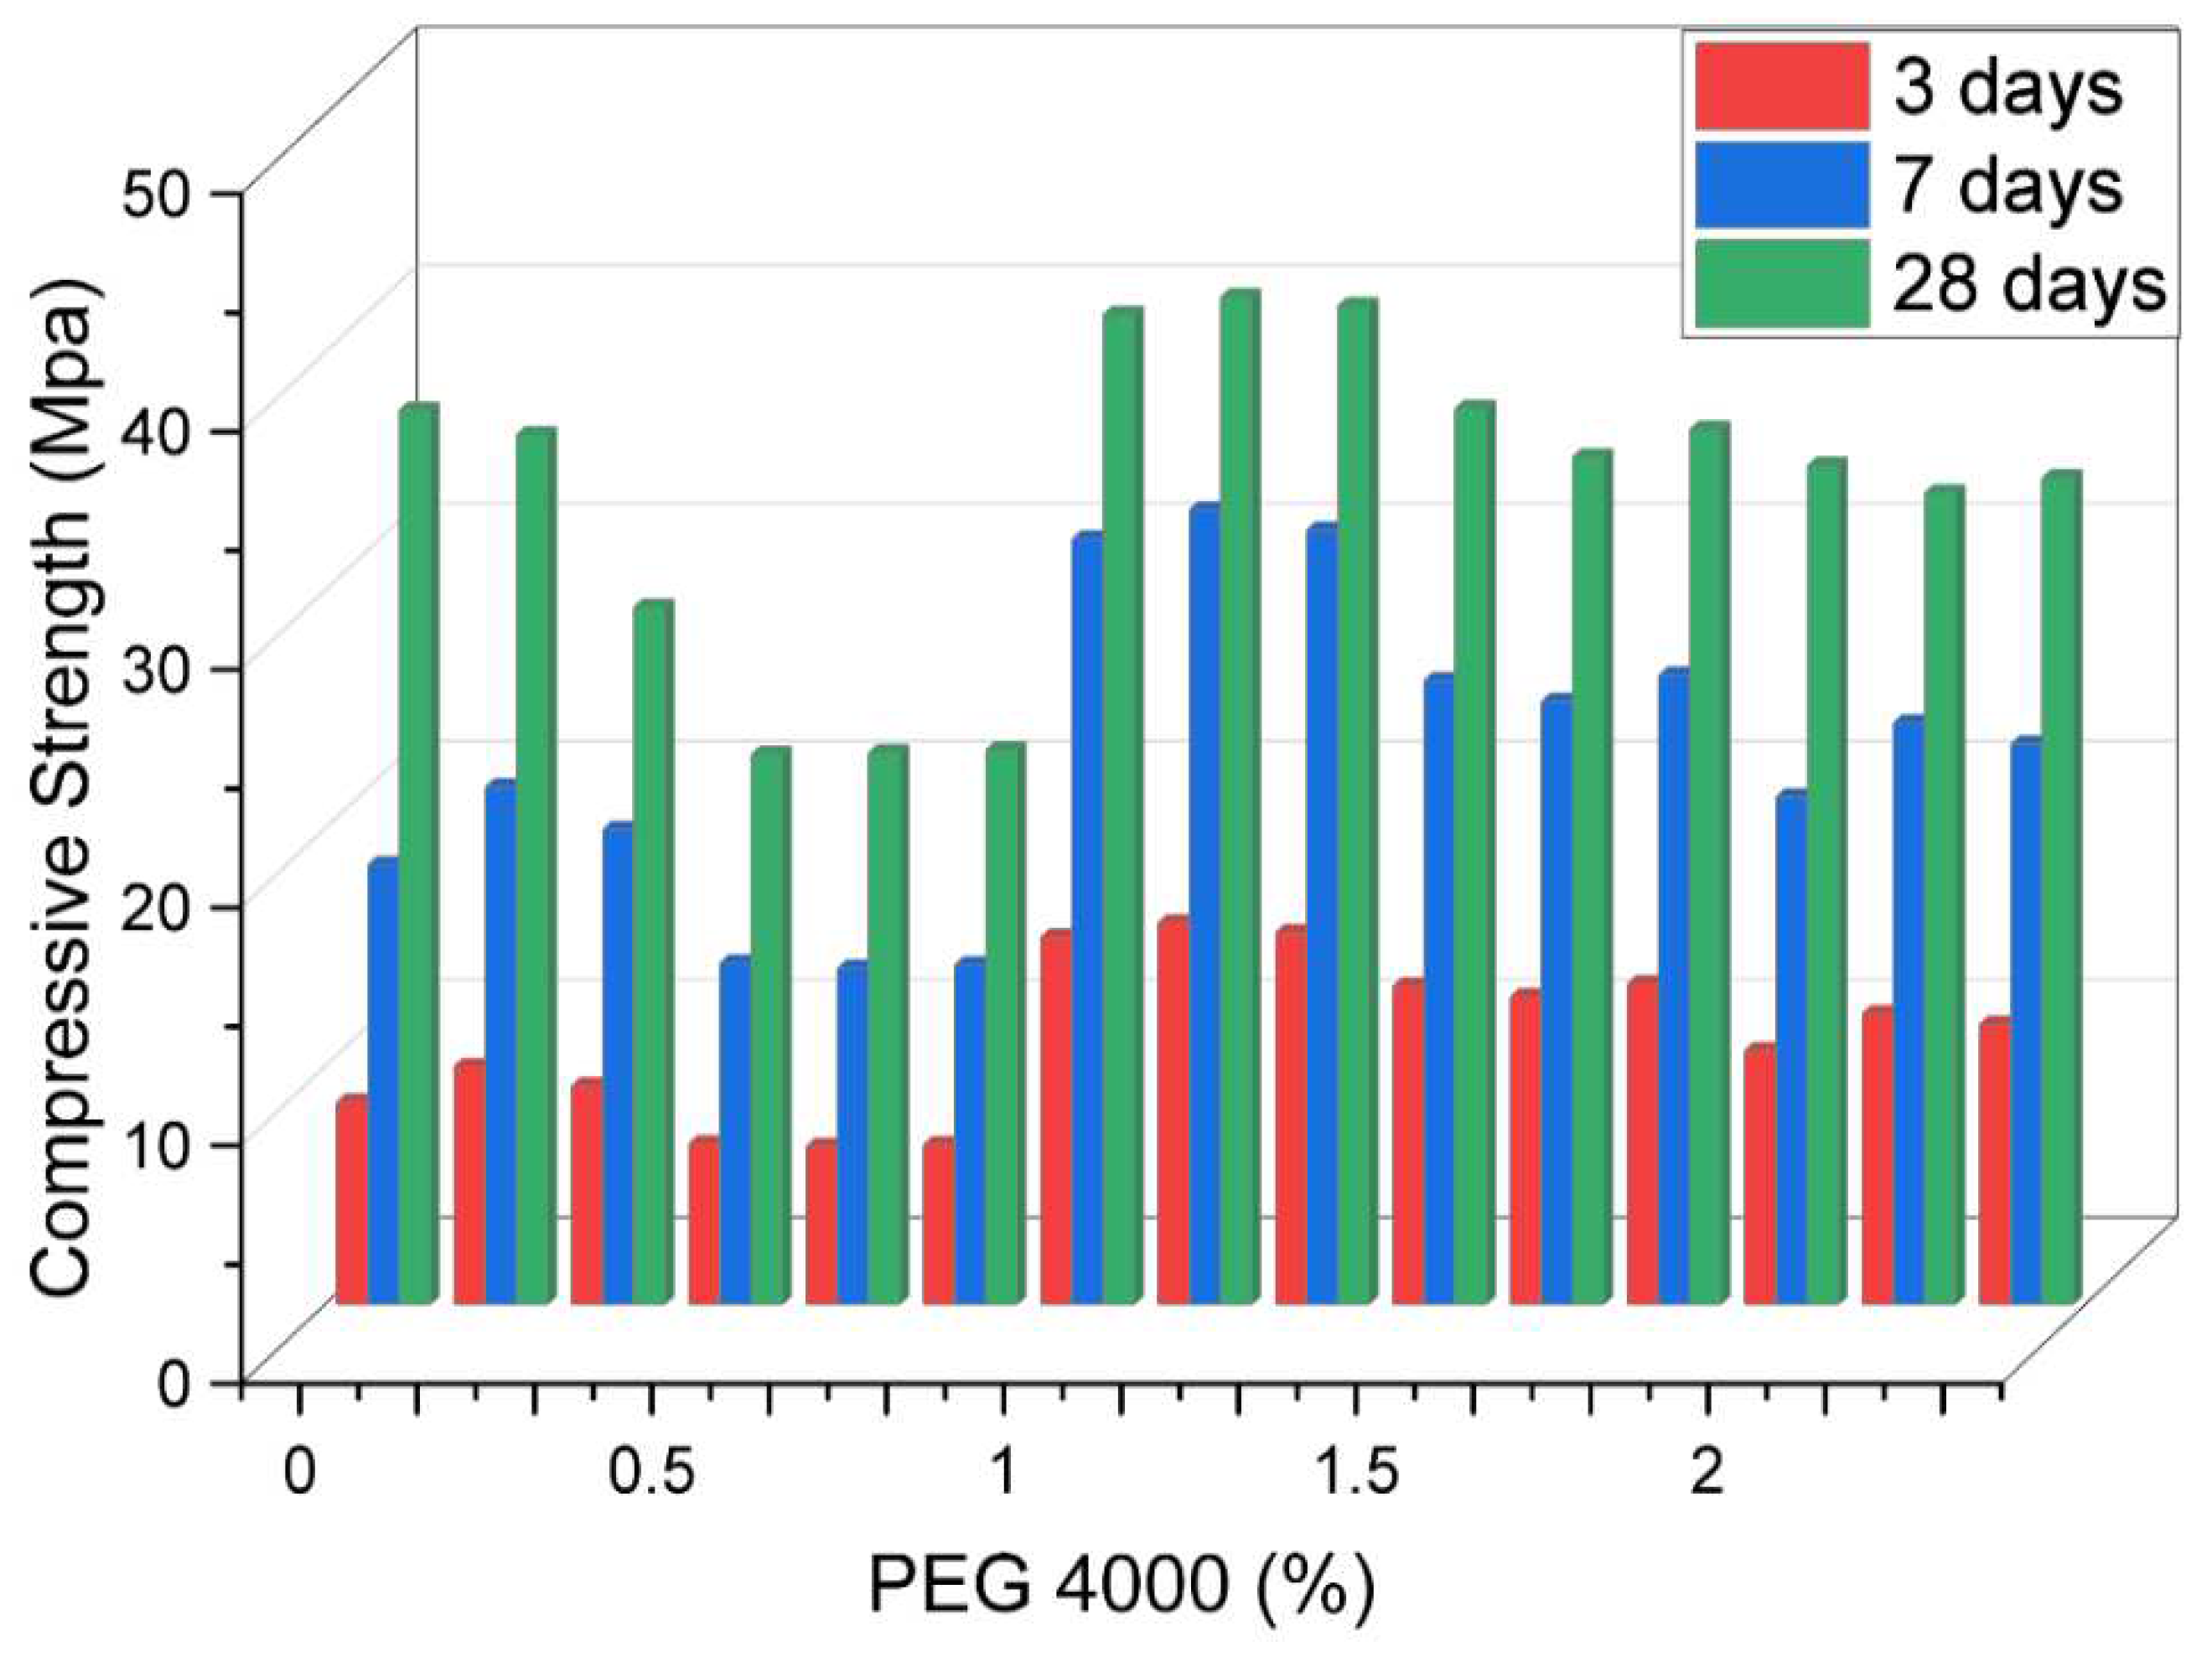
Figure 6.
Graph between splitting tensile and PEG 4000.
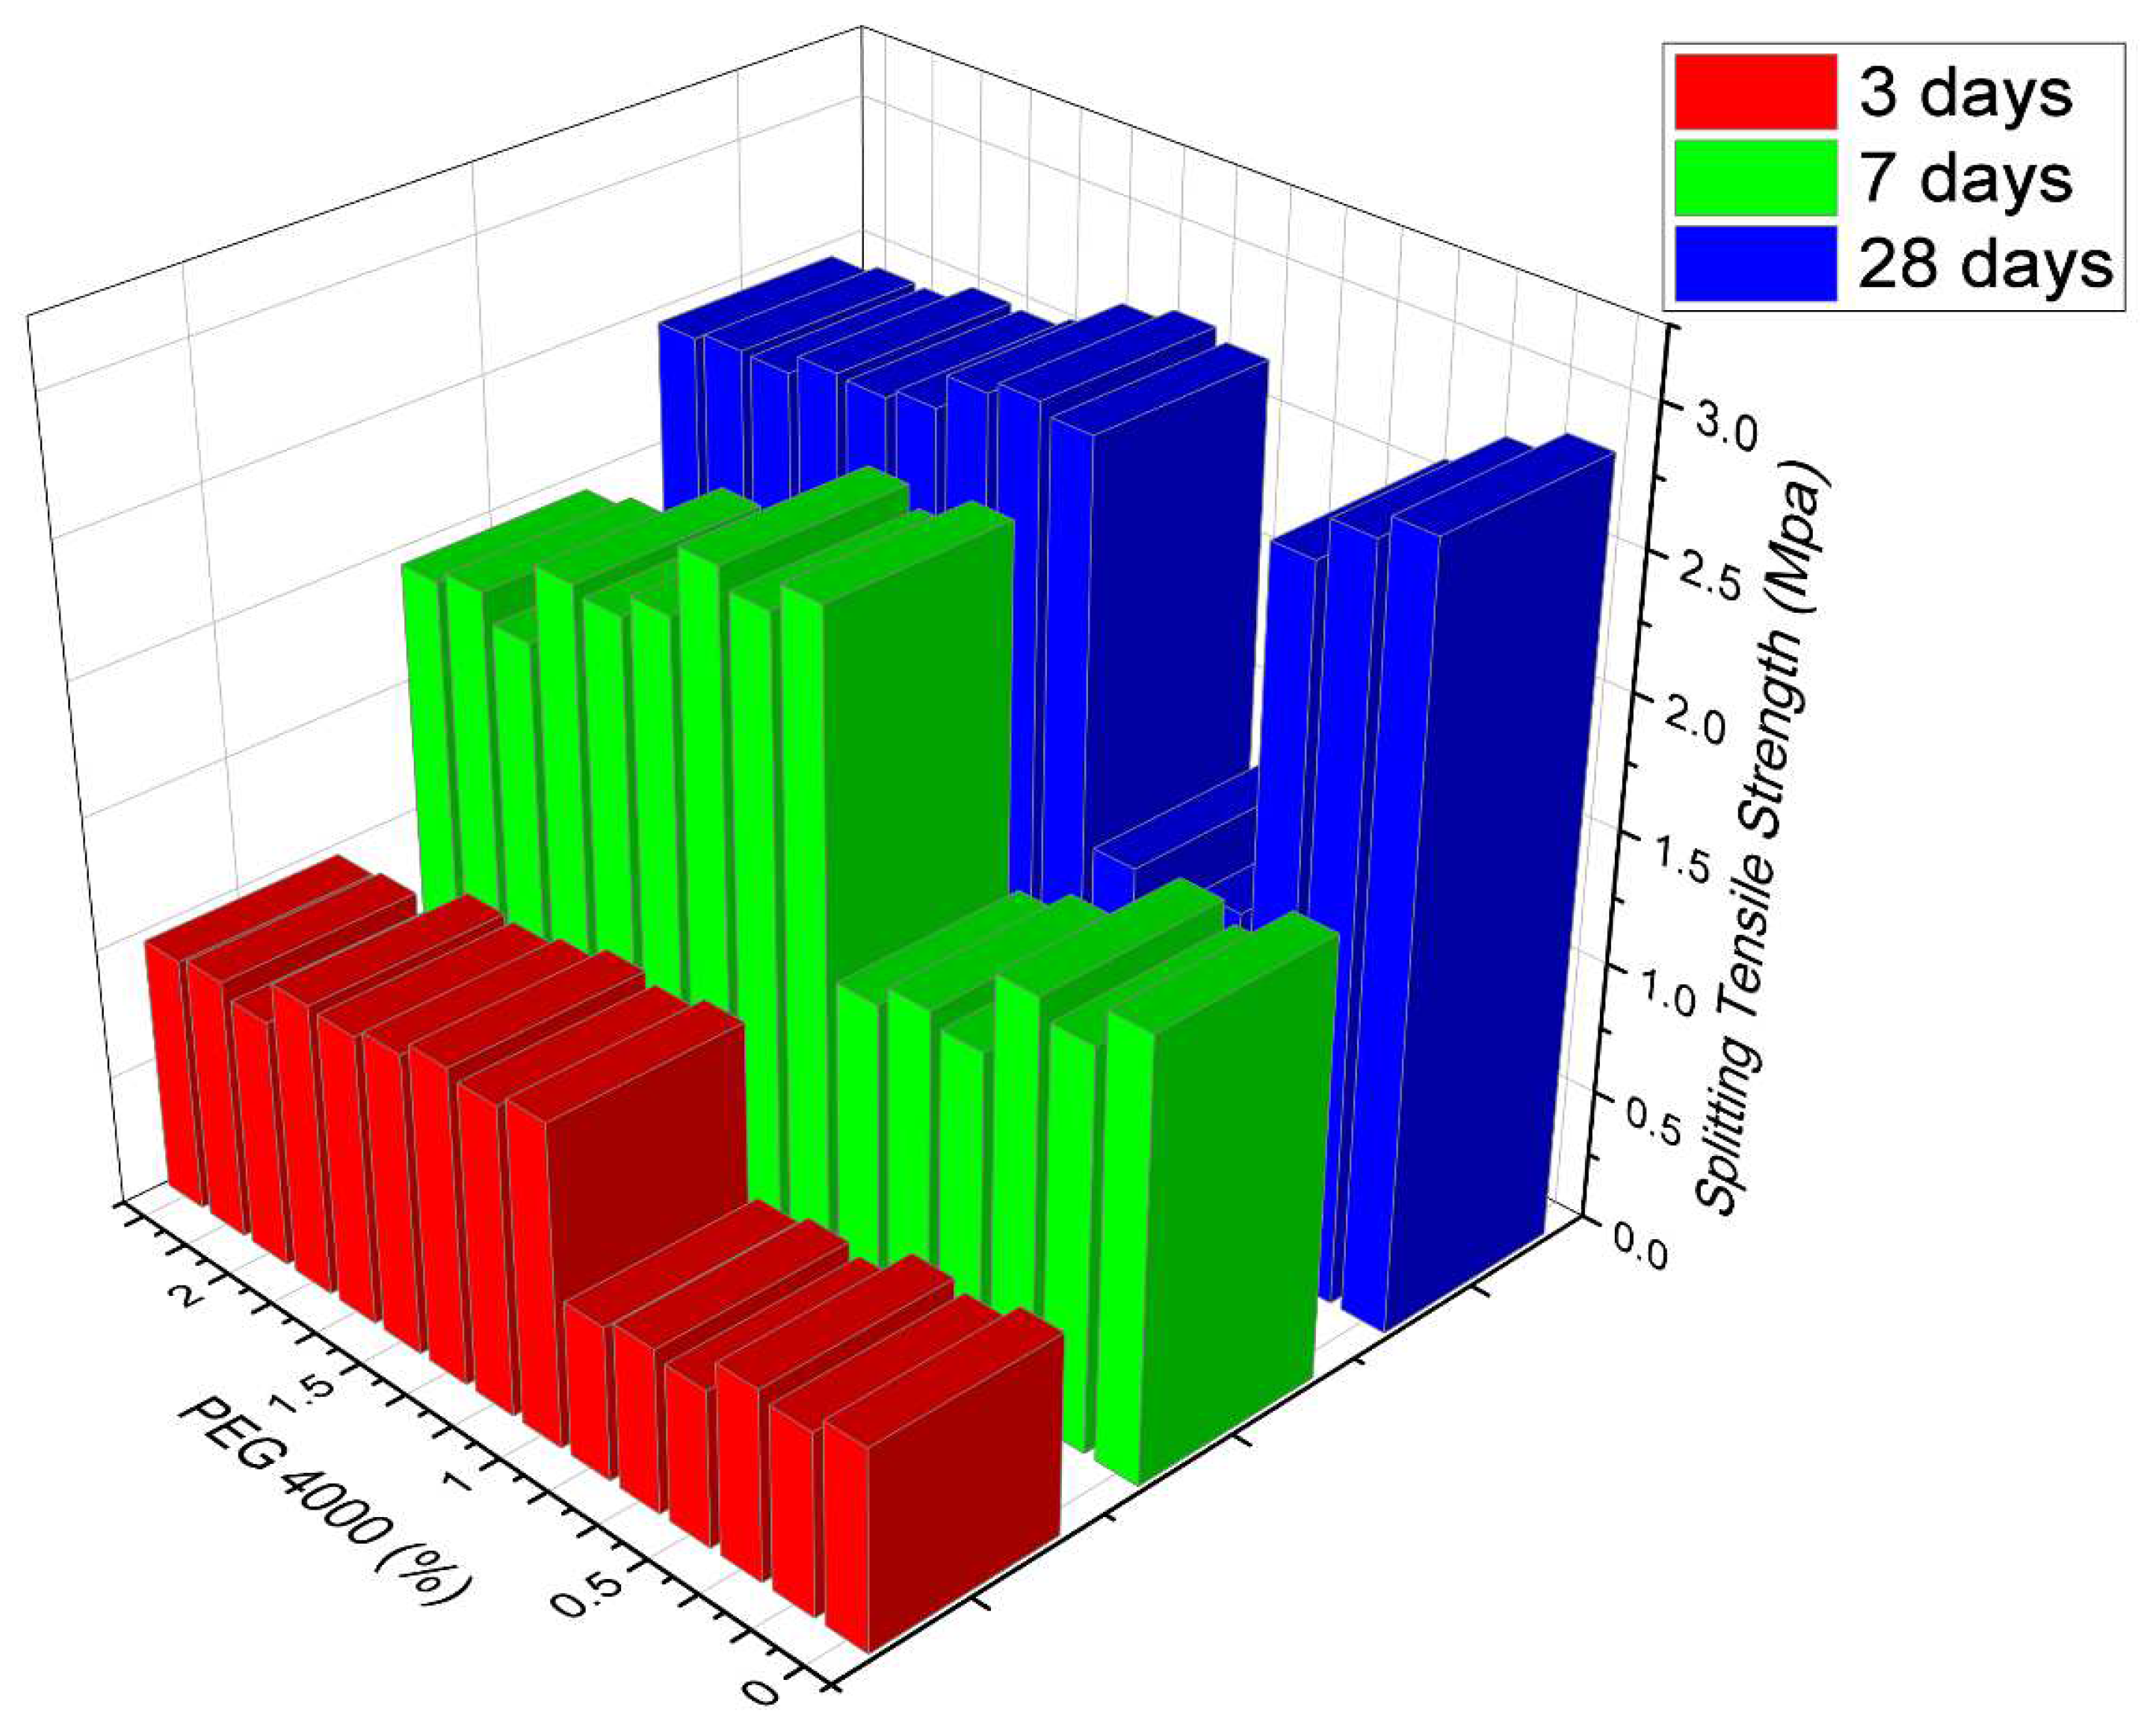
Figure 7.
Graph between flexural strength and PEG 4000 dosage.
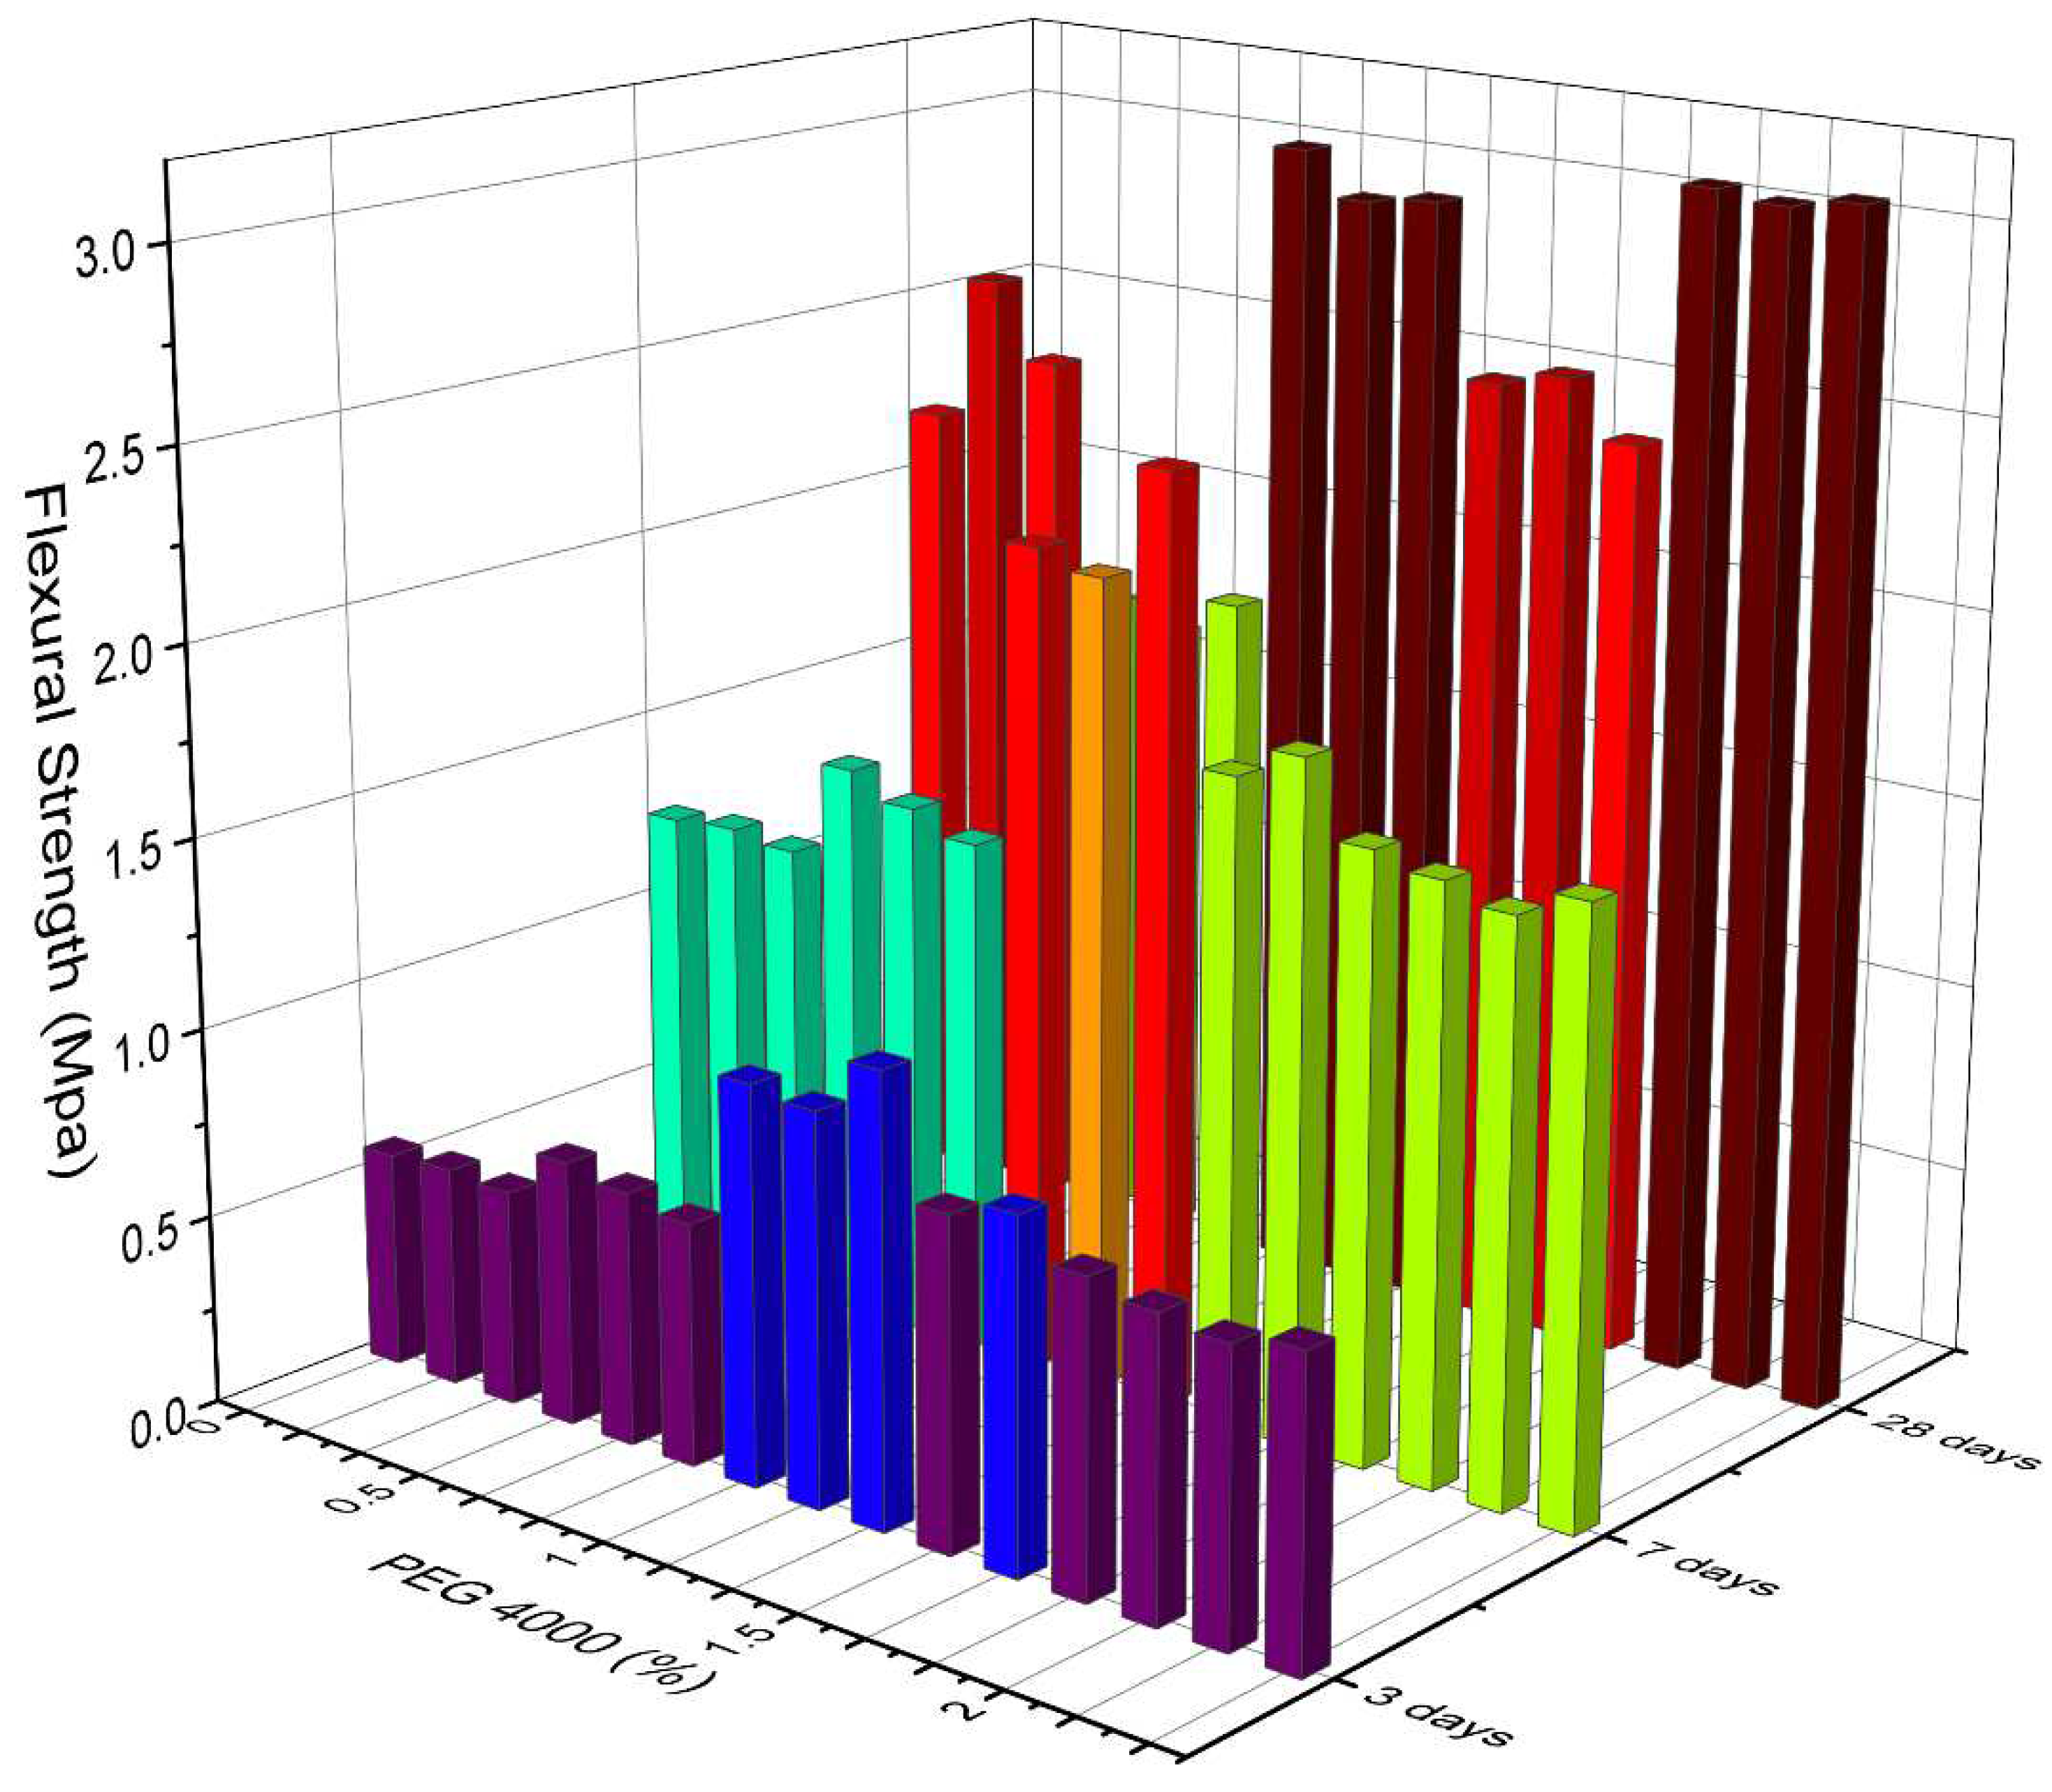
Table 2.
Slump flow diameter details.
| Mix No. | w/c | SNF (%) | Slump flow table diameter (in mm) | T50 cm slump flow (sec) | V-funnel Time (sec) | V-funnel at T5 minutes (sec) |
|---|---|---|---|---|---|---|
| 1 | .35 | .5 | 300 | - | 20 | 24 |
| 2 | .35 | .6 | 570 | 8 | 15 | 19 |
| 3 | .35 | .7 | 600 | 7 | 14 | 17 |
| 4 | .35 | .8 | 520 | 8 | 15 | 18 |
| 5 | .35 | .9 | 470 | - | 16 | 20 |
| 6 | .35 | 1.0 | 470 | - | 16 | 20 |
| 7 | .36 | .5 | 320 | - | 19 | 25 |
| 8 | .36 | .6 | 580 | 7 | 14 | 18 |
| 9 | .36 | .7 | 680 | 5 | 12 | 14 |
| 10 | .36 | .8 | 600 | 6 | 13 | 16 |
| 11 | .36 | .9 | 570 | 7 | 14 | 17 |
| 12 | .36 | 1.0 | 550 | 8 | 15 | 19 |
Table 3.
Data of L-box, U-box, and J-ring tests.
| Mix No. | w/c | SNF (%) | L-box Blocking Ratio (H2/H1) | U Box Difference (H2 - H1) mm | J-ring (mm) |
|---|---|---|---|---|---|
| 1 | .35 | .5 | 0.55 | 52 | 54 |
| 2 | .35 | .6 | 0.75 | 34 | 13 |
| 3 | .35 | .7 | 0.78 | 31 | 11 |
| 4 | .35 | .8 | 0.72 | 37 | 15 |
| 5 | .35 | .9 | 0.7 | 40 | 22 |
| 6 | .35 | 1.0 | 0.7 | 41 | 22 |
| 7 | .36 | .5 | 0.55 | 50 | 42 |
| 8 | .36 | .6 | 0.75 | 34 | 11 |
| 9 | .36 | .7 | 0.81 | 28 | 8 |
| 10 | .36 | .8 | 0.78 | 31 | 10 |
| 11 | .36 | .9 | 0.75 | 34 | 13 |
| 12 | .36 | 1.0 | 0.72 | 35 | 15 |
Table 4.
Mix design content.
| Mix No. | PEG4000 | Cement (kg/m3) | Water (kg/m3) | Fine aggregate (kg/m3) | Coarse aggregate (kg/m3) | SNF (%) |
|---|---|---|---|---|---|---|
| M1 | 0% | 550 | 198 | 880 | 720 | 0.7 |
| M2 | .5% | 550 | 198 | 880 | 720 | 0.7 |
| M3 | 1% | 550 | 198 | 880 | 720 | 0.7 |
| M4 | 1.5% | 550 | 198 | 880 | 720 | 0.7 |
| M5 | 2% | 550 | 198 | 880 | 720 | 0.7 |
Disclaimer/Publisher’s Note: The statements, opinions and data contained in all publications are solely those of the individual author(s) and contributor(s) and not of MDPI and/or the editor(s). MDPI and/or the editor(s) disclaim responsibility for any injury to people or property resulting from any ideas, methods, instructions or products referred to in the content. |
© 2023 by the authors. Licensee MDPI, Basel, Switzerland. This article is an open access article distributed under the terms and conditions of the Creative Commons Attribution (CC BY) license (http://creativecommons.org/licenses/by/4.0/).
Copyright: This open access article is published under a Creative Commons CC BY 4.0 license, which permit the free download, distribution, and reuse, provided that the author and preprint are cited in any reuse.


