Submitted:
13 October 2023
Posted:
16 October 2023
You are already at the latest version
Abstract
The Limpopo estuary mangrove forest covers about 928 ha, however 382 ha remain intact and 546 ha were degraded after the 2000 floods. Mangrove replanting campaigns have been carried out at the site. This article aims to evaluate the structure and carbon pool of aboveground and belowground living biomass and soil carbon in natural and replanted mangrove forests (2016, 2014 and 2010). The methodology consisted of selecting 40 strata where structural data were collected. Living biomass above and below ground and soil carbon was obtained based on the methodology described by Kauffman and Donato (2012). The results showed that A. marina was the most observed species in all study areas. The carbon reserve of living biomass above and below ground in the natural forest was 67.9±100.9 MgCha -1 and 65.0±77.1MgC ha -1 , respectively; and in the planted forests (2016, 2014, 2010) it was 1.1±0.5MgCha-1 and 2.1±1.0MgCha-1, 1.8±1.0MgCha-1 and 3.6±2.0MgCha-1, 3.7±2.0MgCha-1 and 5.3±2.5MgCha-1 . Soil carbon reserve was 229.4±119.4 MgCha-1 in natural forest and 230.3±134.8 MgCha-1 , 234.8±132.7MgC ha-1, 229.4±119.4 MgCha-1 in planted forests (2016, 2014, 2010). The total carbon reserve in the natural forest was 362.3 MgCha-1 and in the planted forestsn(2016, 2014, 2010) it was 233.5 MgCha-1 , 240.2 MgCha-1, 246.4 MgCha-1. Natural and restored forests had similar anoumts of soil carbon, which reinforces the idea that soil is a stabel carbon pool. Morever, restored forests failed to store the same amount of live biomass (an carbon), which supports the idea that it is better to prevent habitat degradation than to restore it.
Keywords:
Limpopo estuary
; mangrove forests
; hydrological restoration
; mangrove conservation
; biomass
; carbon storage
1. Introduction
The mangrove ecosystem is a heterogeneous habitat, with an unusual variety of plants and animals that grow in the intertidal zone, in tropical and subtropical regions [1]. The trees that make up the mangrove forest are characterized by structural (aerial root systems), morphological (leaves with salt extraction glands) and reproductive (dispersion of tidal propagules and viviparous embryos) adaptations that allow them to thrive in the prevailing conditions of high salinity, tidal flooding, strong winds, and organic and anaerobic soils [2,3,4].
Mangrove forests provide a range of ecosystem services to human society and coastal systems, such as shoreline protection against strong water currents, nutrient recycling, nurseries for many marine species, construction materials, wood fuel, food products and medicines [5,6,7]. They also play a key role in the global and oceanic carbon cycle, thus contributing to climate change mitigation by acting both as a sink of atmospheric CO2 and as a source of organic and inorganic carbon for adjacent ecosystems and a source of CO2 for the atmosphere, mostly, through changes in land [8].
Although they represent only 0.7% of the world's rainforest area, mangroves have been shown to contain globally significant carbon stores, particularly in the soil. For example, among coastal wetlands, total carbon stored in mangroves is approximately 1023 Mgha-1 in the tropics, five times more than seagrass beds (200Mg ha-1) and almost twice as much as marshes (600 Mg ha-1) [3,9,10].
Mozambique has the third largest mangrove area in Africa, with an estimated coverage of just over 300,000 ha [11]. The greatest extent is on the central coast, followed by North and South [12,13]. In the southern part of the country, the Limpopo mangrove forest covers about 928 ha [14]. Research has revealed that after the 2000 flood, around 382 ha (41.2%) remained intact and 546 ha (58.8%) were degraded [14]. This led to the development of restoration initiatives for degraded areas that began with the involvement of the CDS-ZC and local communities [14]. In 2010 (followed by 2014, 2016, 2018, 2020 and 2022) the first restoration of the mangrove was carried out, with the planting of the species Avicennia marina, Bruguiera gymnorrhiza, Ceriops tagal, Rhizophora mucronata and Xylocarpus granatum [14].
Restoration of mangroves has been successfully carried out in several countries, with a view to recovering ecosystem services. The, quantification of carbon reserves has become increasingly necessary in order to assess the changes that occur in the forest structure of planted areas and the recovery of important ecosystem services (carbon reserve) [15,16]. In Mozambique, mangrove restoration projects with the participation of local communities have been carried out in places like, the Limpopo river estuary, the Zambezi delta, Nhangau, among others. However, studies that evaluate the recovery of services ecosystem services in these places, such as carbon storage, were not carried out [14].
There is a growing interest in studies on carbon estimation in forests due to the possibility of offsetting greenhouse gas emissions [17] and the need to determine the potential carbon emission released into the atmosphere due to deforestation and changes in land use [18]. In this context, due to the ability of the mangrove forest to sequester high amounts of carbon, as well as the various ecosystem services they provide, this ecosystem is seen as being potentially suitable for these climate change mitigation strategies [19,20].
This study aims to evaluate the structure, composition and quantify the carbon reserves of living biomass above and below ground and soil carbon, comparing natural and planted mangrove areas in the years 2016, 2014 and 2010, in the Limpopo estuary, province from Gaza, Mozambique. The results of this study can be used to update/calibrate biomass estimation studies that use non-invasive or indirect methods. These results will also help in the preparation of mangrove conservation and management plans, as well as in the monitoring, maintenance and recovery of degraded areas in the country or in other regions.
2. Materials and Methods
2.1. Study area
This study was carried out in the Limpopo estuary, located in the Limpopo district, Zongoene administrative post, Gaza province (Figure 1) [21]. The estuary covers about 505 km2 of surface and a coastline that extends up to 50 km, located between Latitudes 25º 18 'and 25º 48' S and Longitude 33º 19 'and 33º 48' E [22].
The total population of Zongoene is 27.404 inhabitants (55% women), with agriculture and fishing being the main livelihood activities [22]. Five species occur in the Limpopo Estuary mangroves, namely: Avicennia marina (the most abundant species), Rhizophora mucronata, Bruguiera gymnorrhiza, Ceriops tagal and Xylocarpus granatum [14,22]. The mangrove forest covers about 928 ha, out of which only 382 ha (41.2%) remained intact [14]. Mangrove restauration with community involvement started in 2010, and so far more than 100 have been restored through planting, hydrological restoration and passive restoration [14].
2.2. Methods
2.2.1. Structural characterization, floristic composition, regeneration and state of conservation of the mangrove forest
Sampling was carried out in the Limpopo estuary, where the systematic stratified sampling method was used, which basically consists of selecting strata through an established systematization scheme, aiming to cover the population in all its extension, obtaining a uniform model [7,23,24]. Ten quadrats (10 x 10m2) were set in each sampling area (natural forest, forest planted in 2010, 2014 and 2016), totalling 40 quadrats. Within each quadrat, all trees above (300 cm height and 2.5 cm diameter) were classified as adults; and those below these values as juveniles. All adult trees were identified to the species level, counted and the following measurements were made: height estimation using a graduated stick and measurement of the diameter at breast height (DBH) [24]. Based on these data, structural parameters were calculated, such as species frequency, density, dominance, basal area and importance value index (VI).
To determine the condition of the forests, regarding cutting intensity, all adult individuals were classified into one of the five categories of cut, namely: intact; partial cut; severe cut; stump and natural death [24]. To determine the quality of the poles, the main trunk of adult trees was classified into one of three categories: straight pole; semi-straight pole and crooked pole [24].
Data on the natural regeneration pattern were obtained by the linear regeneration sampling method, where within the 10 x 10 m2 quadrat, 5 x 5 m2 sub-quadrats were set up for identification, counting and grouping of juveniles according to classes of regeneration I (RCI), for seedlings with less than 40 cm in height, RCII, for seedlings between 40 and 150 cm; and RCIIII, for trees with a height greater than 1.5 m, but less than 3.0 m (RCIII) [16,25].
2.2.2. Estimation of carbon reserve
The quantification of carbon in living trees above and below ground and soil carbon, as well as the estimate of the carbon sequestration rate was obtained based on the methodology described by Kauffman and Donato [26].
Sampling on live trees
In each quadrat of 10 x 10m2, the height (m) and diameter (cm), of all individuals with DBH ≥2.5 was carried out. Based on the data, the biomass in living trees above(ABG) and below ground(BGB) was determined, by the indirect method, from general allometric equations [27,28].
ABG = 0.0509* ρ *(D)2*H
BGB = 0.199* ρ 0.899*(D)2.22
where D is diameter at breast height (cm), H is height (m), ρ is the wood density of the respective species, obtained by the World Agroforestry Database and other authors [29,30,31]. The aboveground and belowground biomass values were added to obtain the total average biomass for each study area (Mg ha-1). It should be noted that a conversion factor was determined to estimate the carbon reserve of the vegetation, which was multiplying the biomass by 0.5 kg/C, because the biomass is approximately 50% of the dry weight [32].
Soil sampling
Soil samples were collected, one per quadrat at depths ranging from 0-15cm, 15-30cm, 30-50cm and 50-100cm, with the aid of a 1 m probe. At each depth interval, a 5 cm sample of the extracted core was taken, comprising at least 30 to 50 g of sample mass [26].
Laboratory Analysis
Soil samples collected in the field were weighed (wet weight) and dried in an oven at a constant temperature of 600C for a period of 48 hours until reaching constant weight (dry weight). This weight was used to calculate the apparent density, which is determined using the following equation:
Then, soil samples were crushed and 10g of each sample were placed in porcelain crucibles with known weight, and they were placed in a muffle (furnace) and incinerated at a temperature of 550°C for 3hrs and weighed. The organic matter content was determined based on the mass loss of the incinerated residue, considering the material lost by burning in the muffle temperature range from 105°C to 550°C. To calculate the organic matter content, the formula below was used:
where P is the weight of the sample (g) after heating to 600c, C is the tare of the empty crucible (g), T is the weight of the ash and the crucible (g).
The total soil carbon reservoir was determined by the soil horizon at depth intervals (cm), bulk density (g cm-3) and carbon content (%). Soil carbon per sampled depth interval was calculated using the following formula:
Soil carbon (Mg ha-1) = bulk density (g cm-3) * soil depth interval (cm) *% carbon concentration
Total carbon reserve was estimated by the addition of all component reservoirs (carbon from living biomass above and below soil and soil carbon) [26].
where ABG is aboveground biomass, BGB is belowground biomass and C is carbon
Total carbon reserve (Mg ha-1) = AGBTree + BGBTree + Csoil
The annual carbon increment rate was estimated by calculating the difference of total carbon (biomass alive above ground and soil carbon) from one year to another dividing by the life of each forest or useful life of the trees [27,33].
2.2.3. Data Analysis
Frequencies of categorical variables and calculation of averages and standard deviation for numerical variables were made. For parametric data, ANOVA test was used and for nonparametric data was used from Kruskal-Wallis, with a significance level of 5%, to measure group differences. For cases of significant differences, the TukeyHSD average comparison test was used to detect the origin of the difference in groups with a 5% significance level. Regression analysis was used to evaluate the relationship between height and diameter. Other additional tests such as Person correlation was performed.
3. Results
3.1. Floristic composition
A total of 1075 adult individuals were sampled in the natural forest and planted in different years (2016, 2014, 2010) in the Limpopo Estuary. In total, 5 species of mangroves were identified. Among them, A. marina was the most frequently observed species (60%, 46.7%, 100% and 50%), with greater dominance (83.7%, 82.5%, 100% and 83.2%) and density (58%, 72.9% , 100% and 77.1%) in the natural area, as well as in the areas planted in 2016, 2014 and 2010 (Table 1). While Xylocarpus granatum was the rarest species, being observed only in the planted forest in 2010. This corresponded to a 5.6% of frequency, 0.3% dominance and 0.5% density. Based on importance value indices, A. marina (201.7%) was the most important species in the natural area. The same scenario is observed in the areas planted in 2016, 2014 and 2010, accounting for 202.1%, 300% 210.3% of importance value (Table 1).
3.2. Structural attributes
The tallest trees were observed in the natural area, whose average height was 4.4±1.9m. In the forests replanted in 2016, 2014 and 2010, the average heights were 2.6± 0.6m; 2.9 ± 0.7m; 2.8 ± 0.7m (Table 2). Significant differences were found between sites (p<0.001), except for areas planted in 2016 and 2014, p=0.07 (Table 2). As for the diameter distribution, the natural area has higher DBH values with an average of 12.2±12.5m, in relation to the planted areas (2016, 2014 and 2010) whose average diameters were 4.3±1m; 5±5.6; 4.4±1.4m. These differences were significant (p<0.001), except in areas planted in 2014 and 2016, p=0.982 (Table A1).
The average density of trees in the natural area (108.0±93.0 trees/ha) is relatively lower when compared to the planted areas in 2014 and 2010, whose average densities were 415.0 ± 214.9 trees/ha and 415.0±214.9 trees/ha. The tests indicate, that there were no significant differences between the locations (Table A1). The average basal area is greater in the natural area (2.2±0.1m2) when compared to the planted areas (2016, 2014, 2010), whose total basal area was 0.34±0.003m2; 1.8 ± 0.02 m2; 0.81±0.003 m2. The forest planted in 2010 is the most complex (4,538) in relation to the remaining study areas (Table 2).
3.2.1. Relationship between height and diameter
The regression graphs between height and diameter were presented only for the species with the highest importance value index (A. marina). The box plot displays the distribution of percentiles in each case. The ends of the boxes are positioned at the 25th and 75th percentiles that correspond to the maximum and minimum values observed in the data set (Figure 2). In the natural area, most of the A. marina trees had most trees with diameter below 25cm and height between 2.5-7 m. Based on values of R2 = 0.6, the correlation between height and diameter is moderate with significant differences (p < 0.001). In the area planted in 2016, A. marina had more trees with a diameter below 5.2cm and heights ranging between 2.8-3.2m. R2 = 0.14, it can be stated that the correlation is very weak and with significant differences (p <0.001). In the area planted in 2014, most A. marina had diameter below 5cm and heights between 2.8-3.2m, and based on the values of R2=0.17, it is observed that the correlation was very weak and with significant differences (p<0.001). In the area planted in 2010, A. marina presented most of the individuals with a diameter below 6.5cm and heights that vary between 2.5-4.5m, and based on the values of R2=0.22, it is observed that the correlation is weak and statistically significant (p<0.001) (Figure 2).
3.2.2. Mangrove logging in the natural and planted area
Intact trees compose the majority of trees in natural and planted areas (2016, 2014 and 2010) (Figure 3). In the natural area, 36.8% of the sampled trees of A. marina are intact, followed by R. mucronata (35.7%). There were significant differences in the average density of intact trees in the natural forest when compared to the replanted forests (Kruskal-Wallis; p<0.001) (Figure A1). Among the planted forests, there were no differences in the mean density of intact trees (p˃0.001). The species B. gymnorhiza had the highest percentage of partial (33.3%) and severely cut trees (33.3%). In the planted areas (2016, 2014 and 2010), there are considerable percentages of partial cutting (12.5%, 31.8% and 31.6%, respectively) and severe cutting (18.2%, 21.1%, respectively) in A. marina (Figure 3) (Kruskal-Wallis; p > 0.001) (Figure A2, A3).
As for the quality of the stems, in the natural forest, 42.9% of the sampled R. mucronata trees are semi-straight, followed by B. gymnorhiza (33.3%). Avicennia marina had the highest percentage of straight and crooked stems (37.5%; 37.5%, respectively) (Figure 4). In the replanted forests (2016, 2014 and 2010), most of the sampled trees had straight stems. Semi-straight stems composed about 34% of all stems (36.8%, 35.7% and 34.6% for 2016, 2014 and 2010, respectively); and crooked stems composed between 28% and 36% of stems in (36.8%, 28.6% and 30.8%, in the same years, respectively). There were significant differences in the densities of straight poles, except for the 2014 and 2016 planted forests (Kruskal–Wallis; p ˂ 0.001) (Figure A4, A5, A6).
3.2.3. Pattern of natural regeneration in natural and replanted forests
Regeneration was observed at all study sites. The average density of juveniles in the natural area was higher in RCI (2185±2323 seedlings/ha), followed by RCII (1785±2331 seedlings/ha) and RCIII (331±654 seedlings/ha), with the ration of RCI: RCII:RCIII was 7:5:1. In the areas planted in 2016, the average density of juveniles was higher in RCII (779±927 seedlings/ha), followed by RCI (657±736 seedlings/ha) and RCIII (414±740 seedlings/ha), with the ration of RCI: RCII:RCIII was 2:2:1. In the areas planted in 2014 and 2010, the average density of juveniles was higher for RCI (810±1083 seedlings/ha; 867±851seedlings/ha), followed by RCII (420± 561seedlings/ha; 687±669 seedlings/ha) and RCIII (350±740 seedlings/ha; 233±253 seedlings/ha), with the ration being 2:1:1 and 4:3:1 (Table 3). Based on the statistical tests, there were no significant differences in the average density of juveniles between the sites, in the regeneration classes, in the natural forest when compared to replanted forests (Kruskal–Wallis; p˃0.001) (Table A2)
3.3. Carbon stored in natural and restored forests
3.3.1. Biomass above and below ground
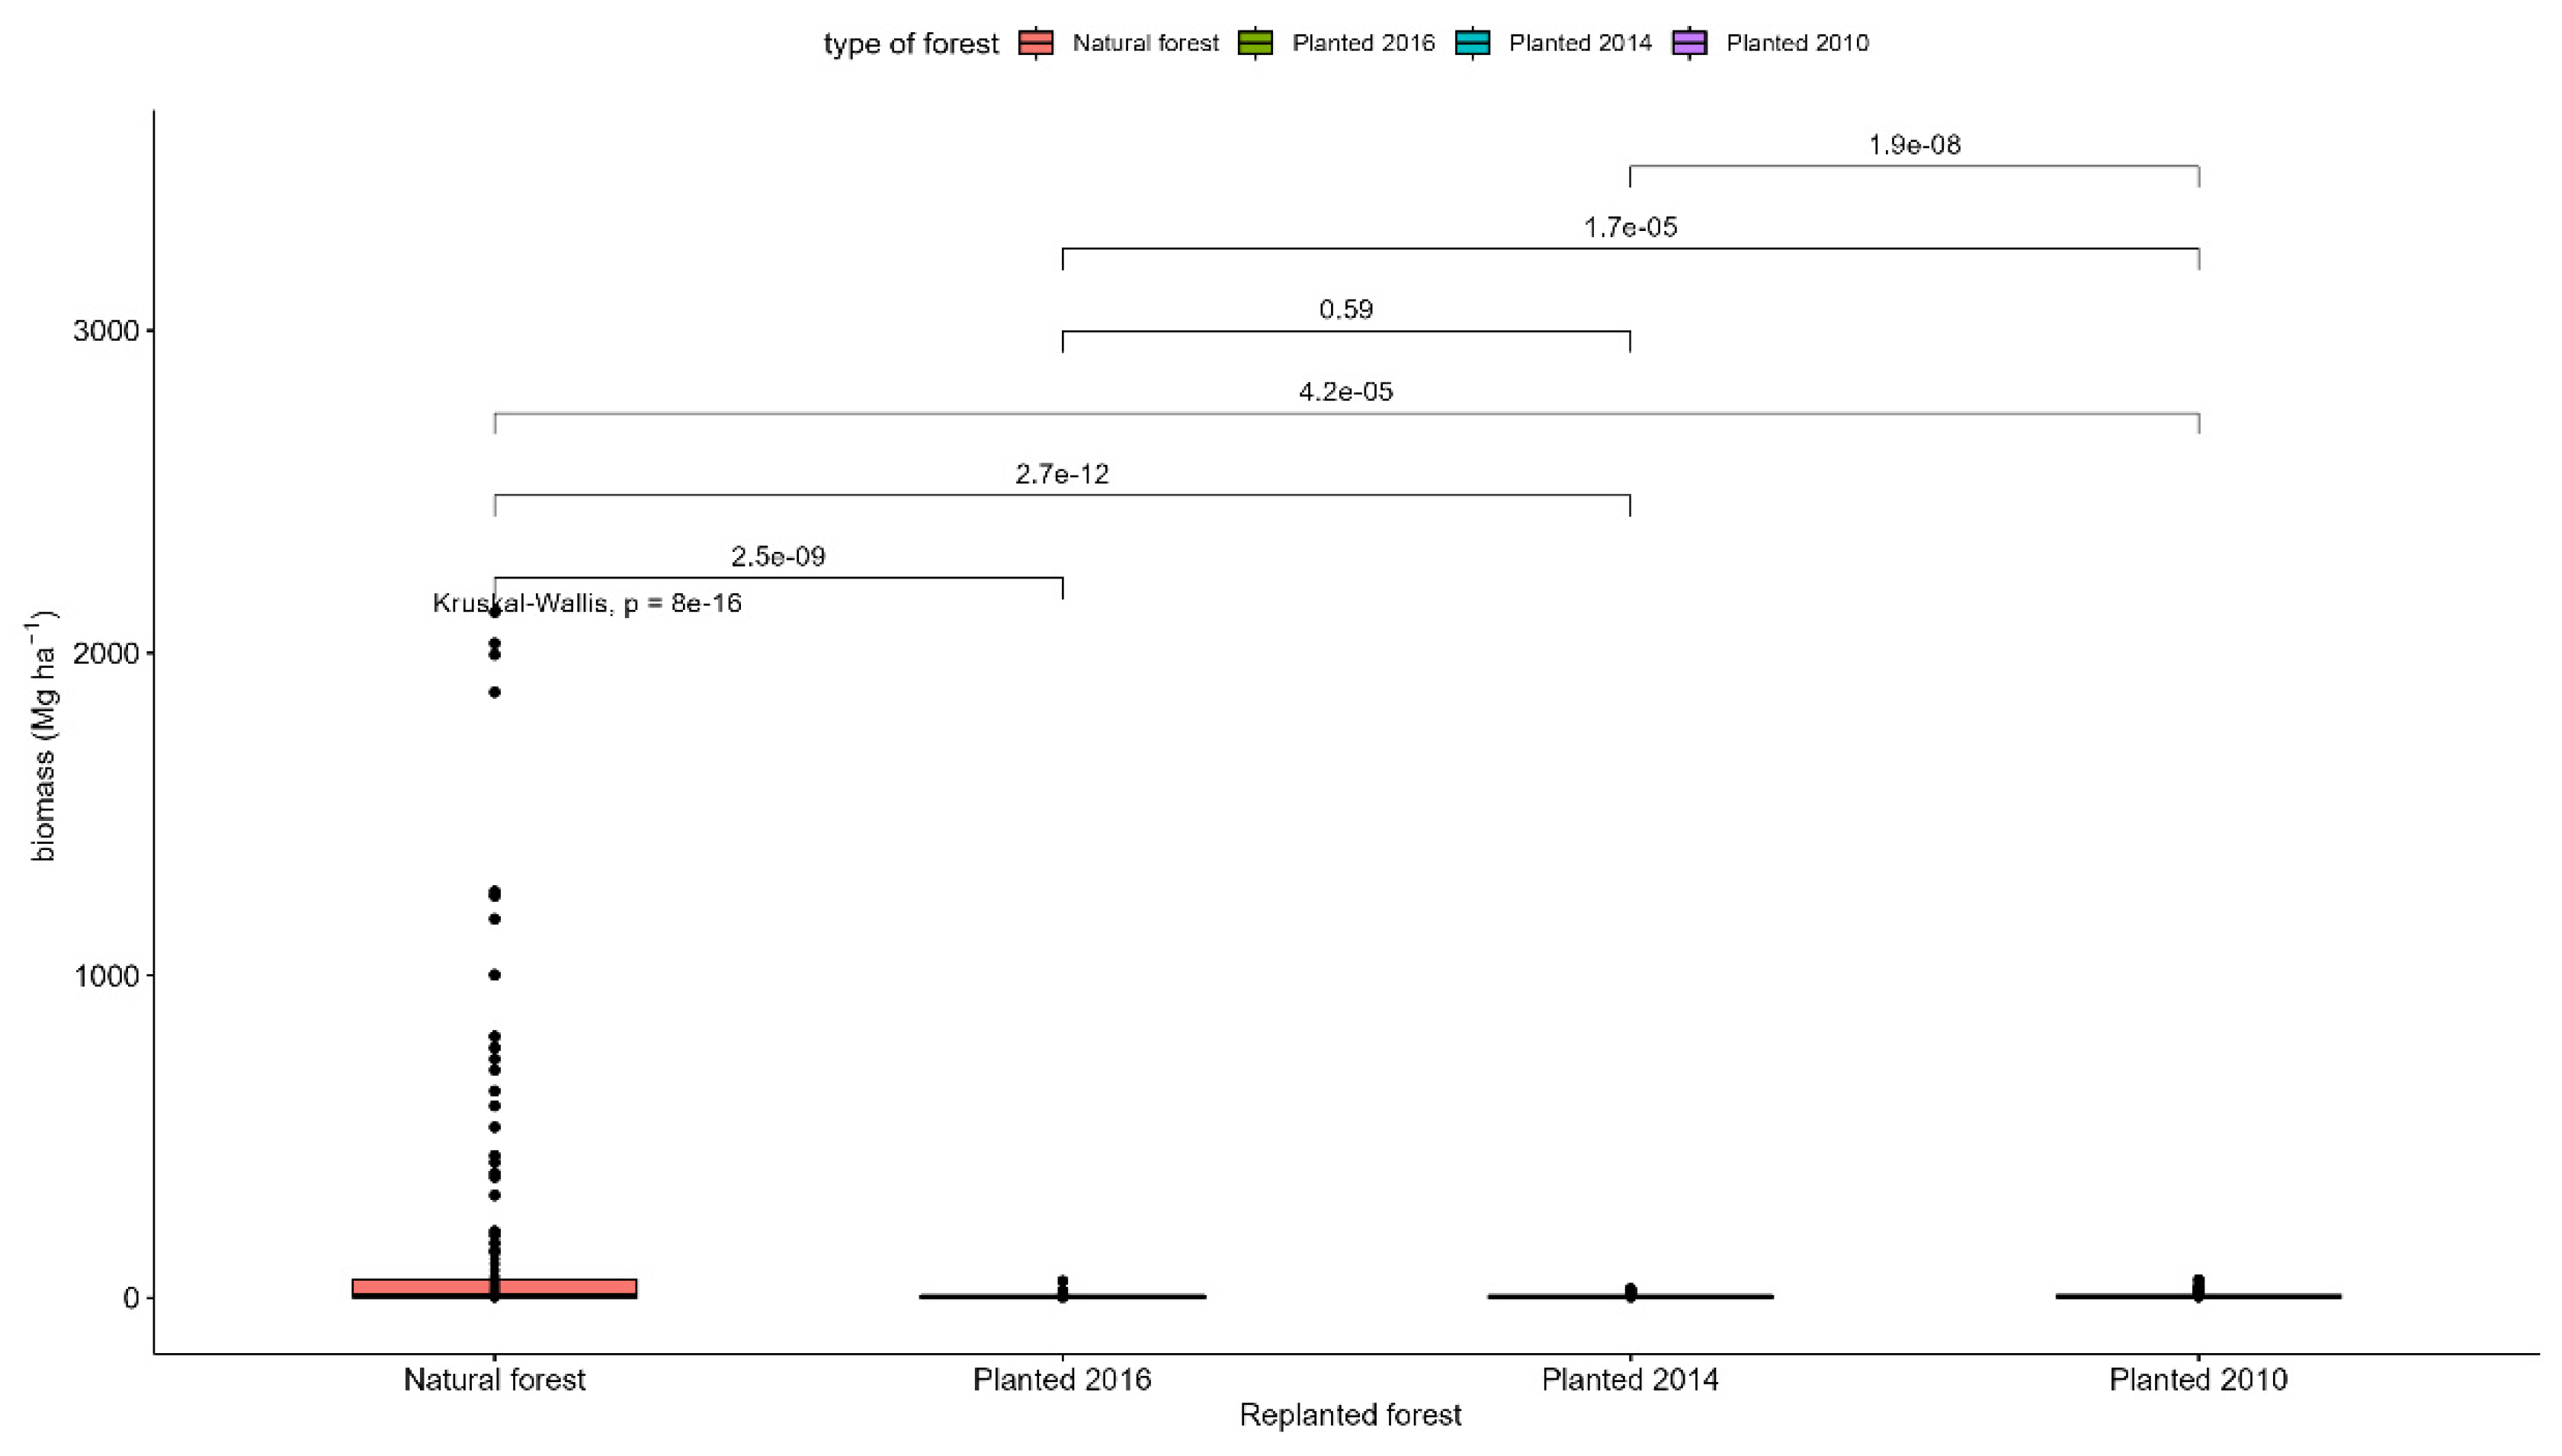
Aboveground and belowground living biomass carbon stock varied remarkably in the natural area compared to the planted areas. The average biomass for living trees above and below ground in the natural area was estimated at 135.8 ± 201.8 Mg ha-1 and 130.0 ± 154.3 Mg ha-1, respectively (Table 4). In the planted areas, aboveground and belowground living biomass reserves at the four-year planting age (2016) were 2.2± 1.1 Mg ha-1 and 4.3±1.9 Mg ha-1 (Table 4). Aboveground and belowground biomass increased after six years of age (2014), with an estimate of 3.6±2.1 Mg ha-1 and 1.8±1.0 Mg ha-1 (Table 4). After ten years the biomass reserves were estimated at 7.4 ± 4.0 Mg ha-1 and 10.6 ± 4.9 Mg ha-1, respectively (Table 4). Based on the tests, there were significant differences between the study areas (p˂0.001), except for areas planted in 2014 and 2010 (p˃0.001) (Figure A7, A8).
3.3.2. Soil carbon reserve
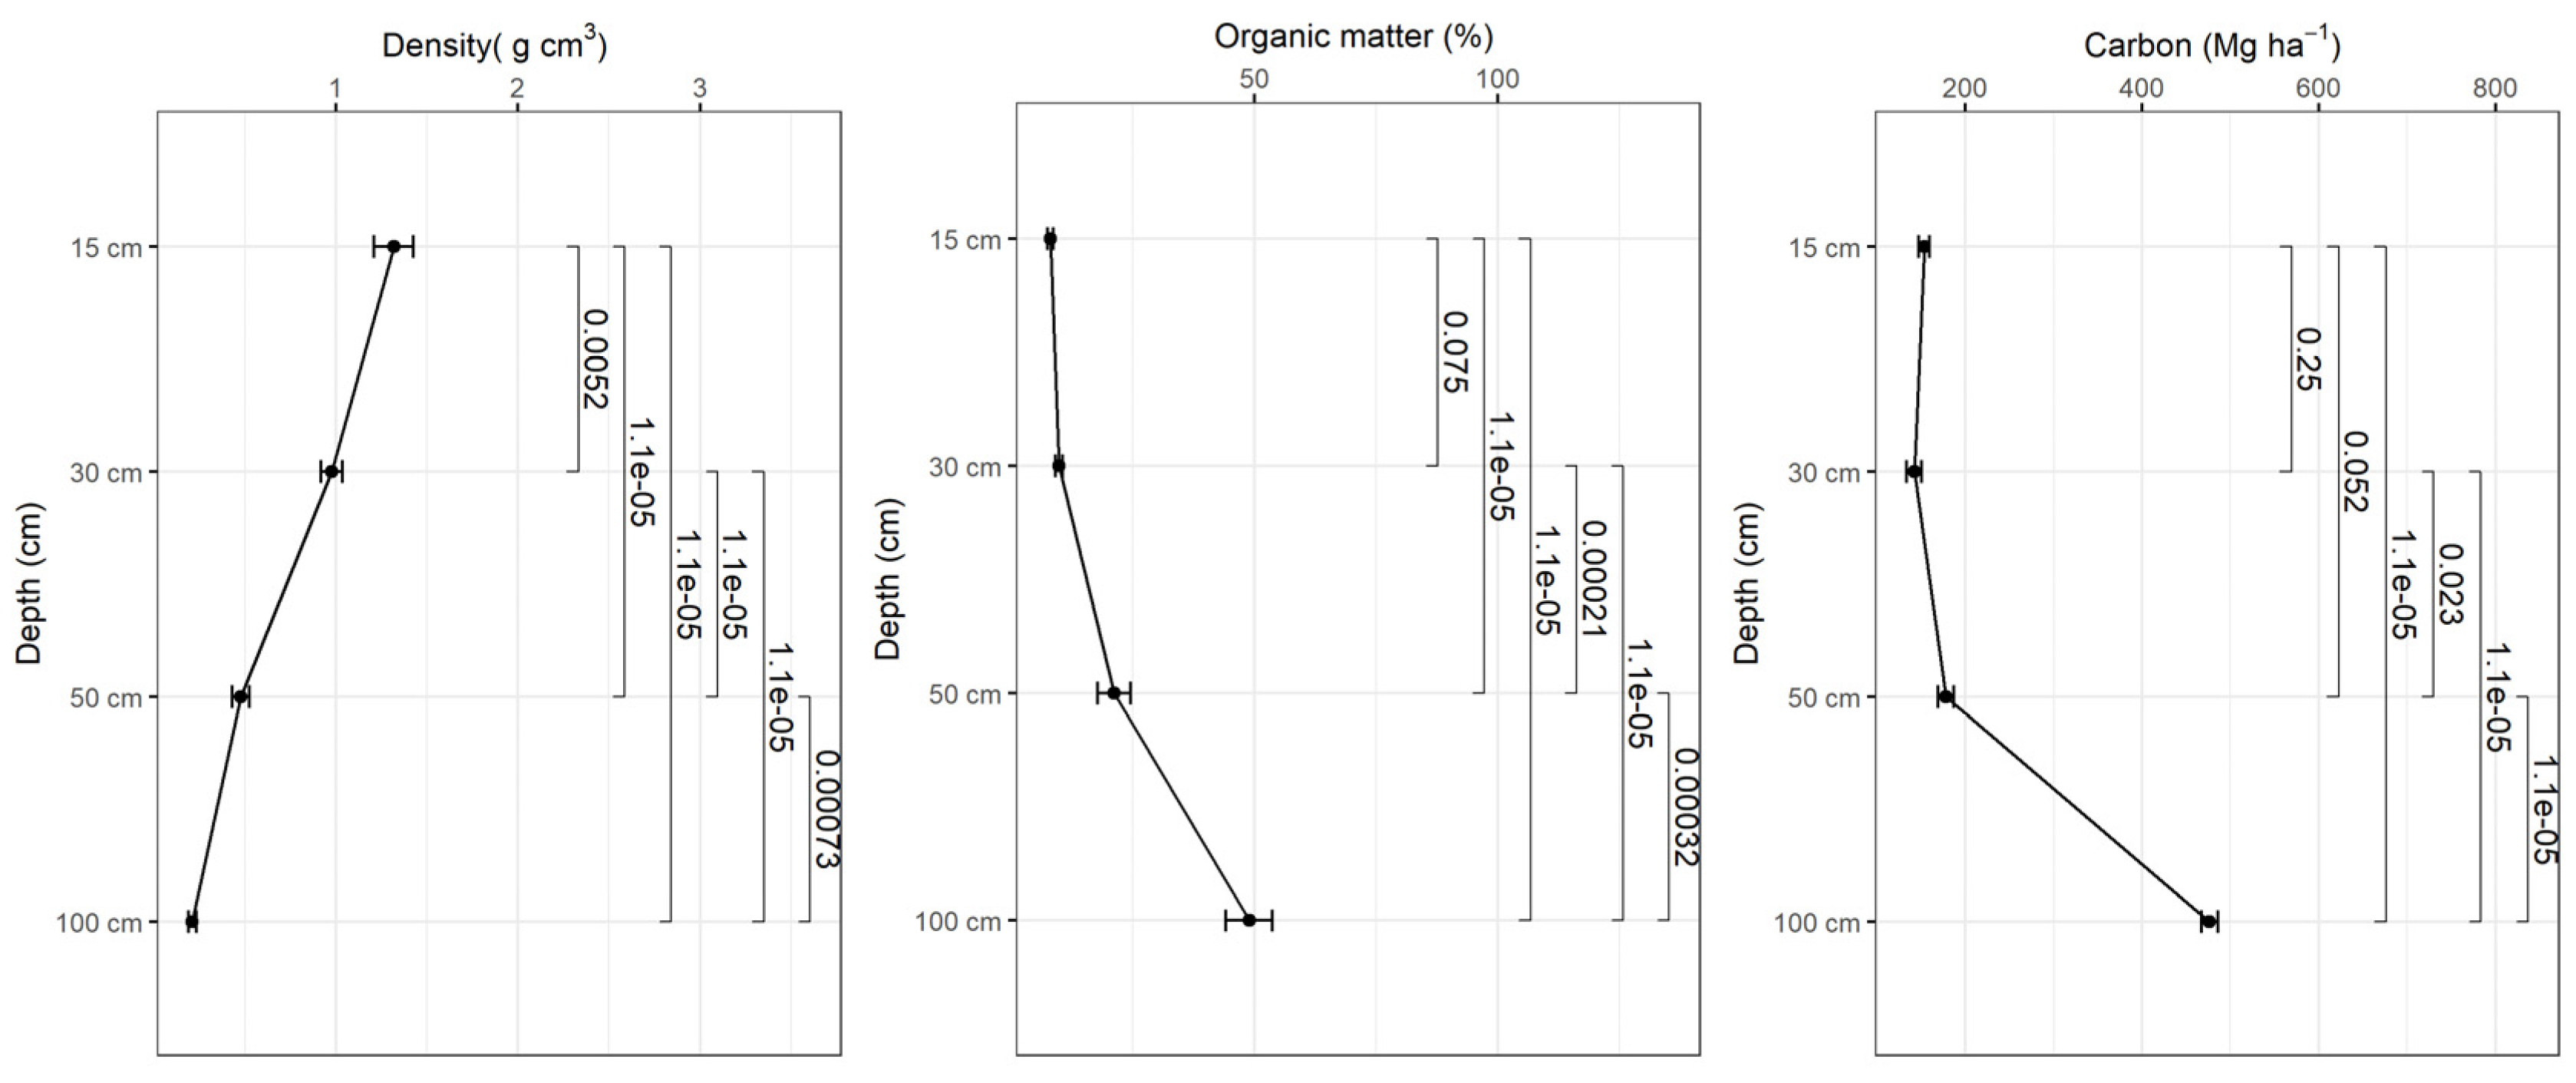
Bulk density decreases with depth and the organic matter content increases with depth in all study sites and based on the tests there were statistically significant differences in bulk density and organic matter content in different depth intervals (p<0.001) (Figure 5, 6, 7, 8). The average amount of carbon stored in the soil in this study was higher in replanted forests than in natural forest and this tends to increase with depth (Figure 5, 6, 7, 8).). The average soil carbon was estimated at 229.4 ± 119.4 Mg ha-1 in the natural forest, while in the replanted forests (2016, 2014 and 2010) it was estimated at 230.3 ± 134.8 Mg ha-1, 234.8 ± 132.7 Mg ha-1, and 237.4 ± 142.6 Mg ha-1, for years 2016, 2014 and 2010, respectively (Table 5). There were no statistically significant differences in total soil carbon in all study sites (p˃0.001) (Table 5).

Table 5.
Summary of statistical tests of the total values of bulk density, organic matter and soil carbon. 1Average ± Standard deviation 2Kruskal-Wallis.
Table 5.
Summary of statistical tests of the total values of bulk density, organic matter and soil carbon. 1Average ± Standard deviation 2Kruskal-Wallis.
| Natural forest | Planted 2016 | Planted 2014 | Planted 2010 | p-value2 | |
| Apparently density (gcm3) | 0.8 ±0.5 | 0.5 ±0.4 | 0.8 ±0.5 | 0.7 ±0.5 | 0.020 |
| Organic matter (%) | 18.6 ±13.8 | 35.8 ±32.3 | 21.0 ±19.2 | 22.1 ±18.9 | 0.030 |
| soil carbon (Mg ha-1) | 229.4 ±119.4 | 230.3 ±134.8 | 234.8 ±132.7 | 237.4 ±142.6 | 0.8 |
Figure 5.
Variation of bulk density, organic matter content and soil carbon as a function of depth in the natural forest.
Figure 5.
Variation of bulk density, organic matter content and soil carbon as a function of depth in the natural forest.
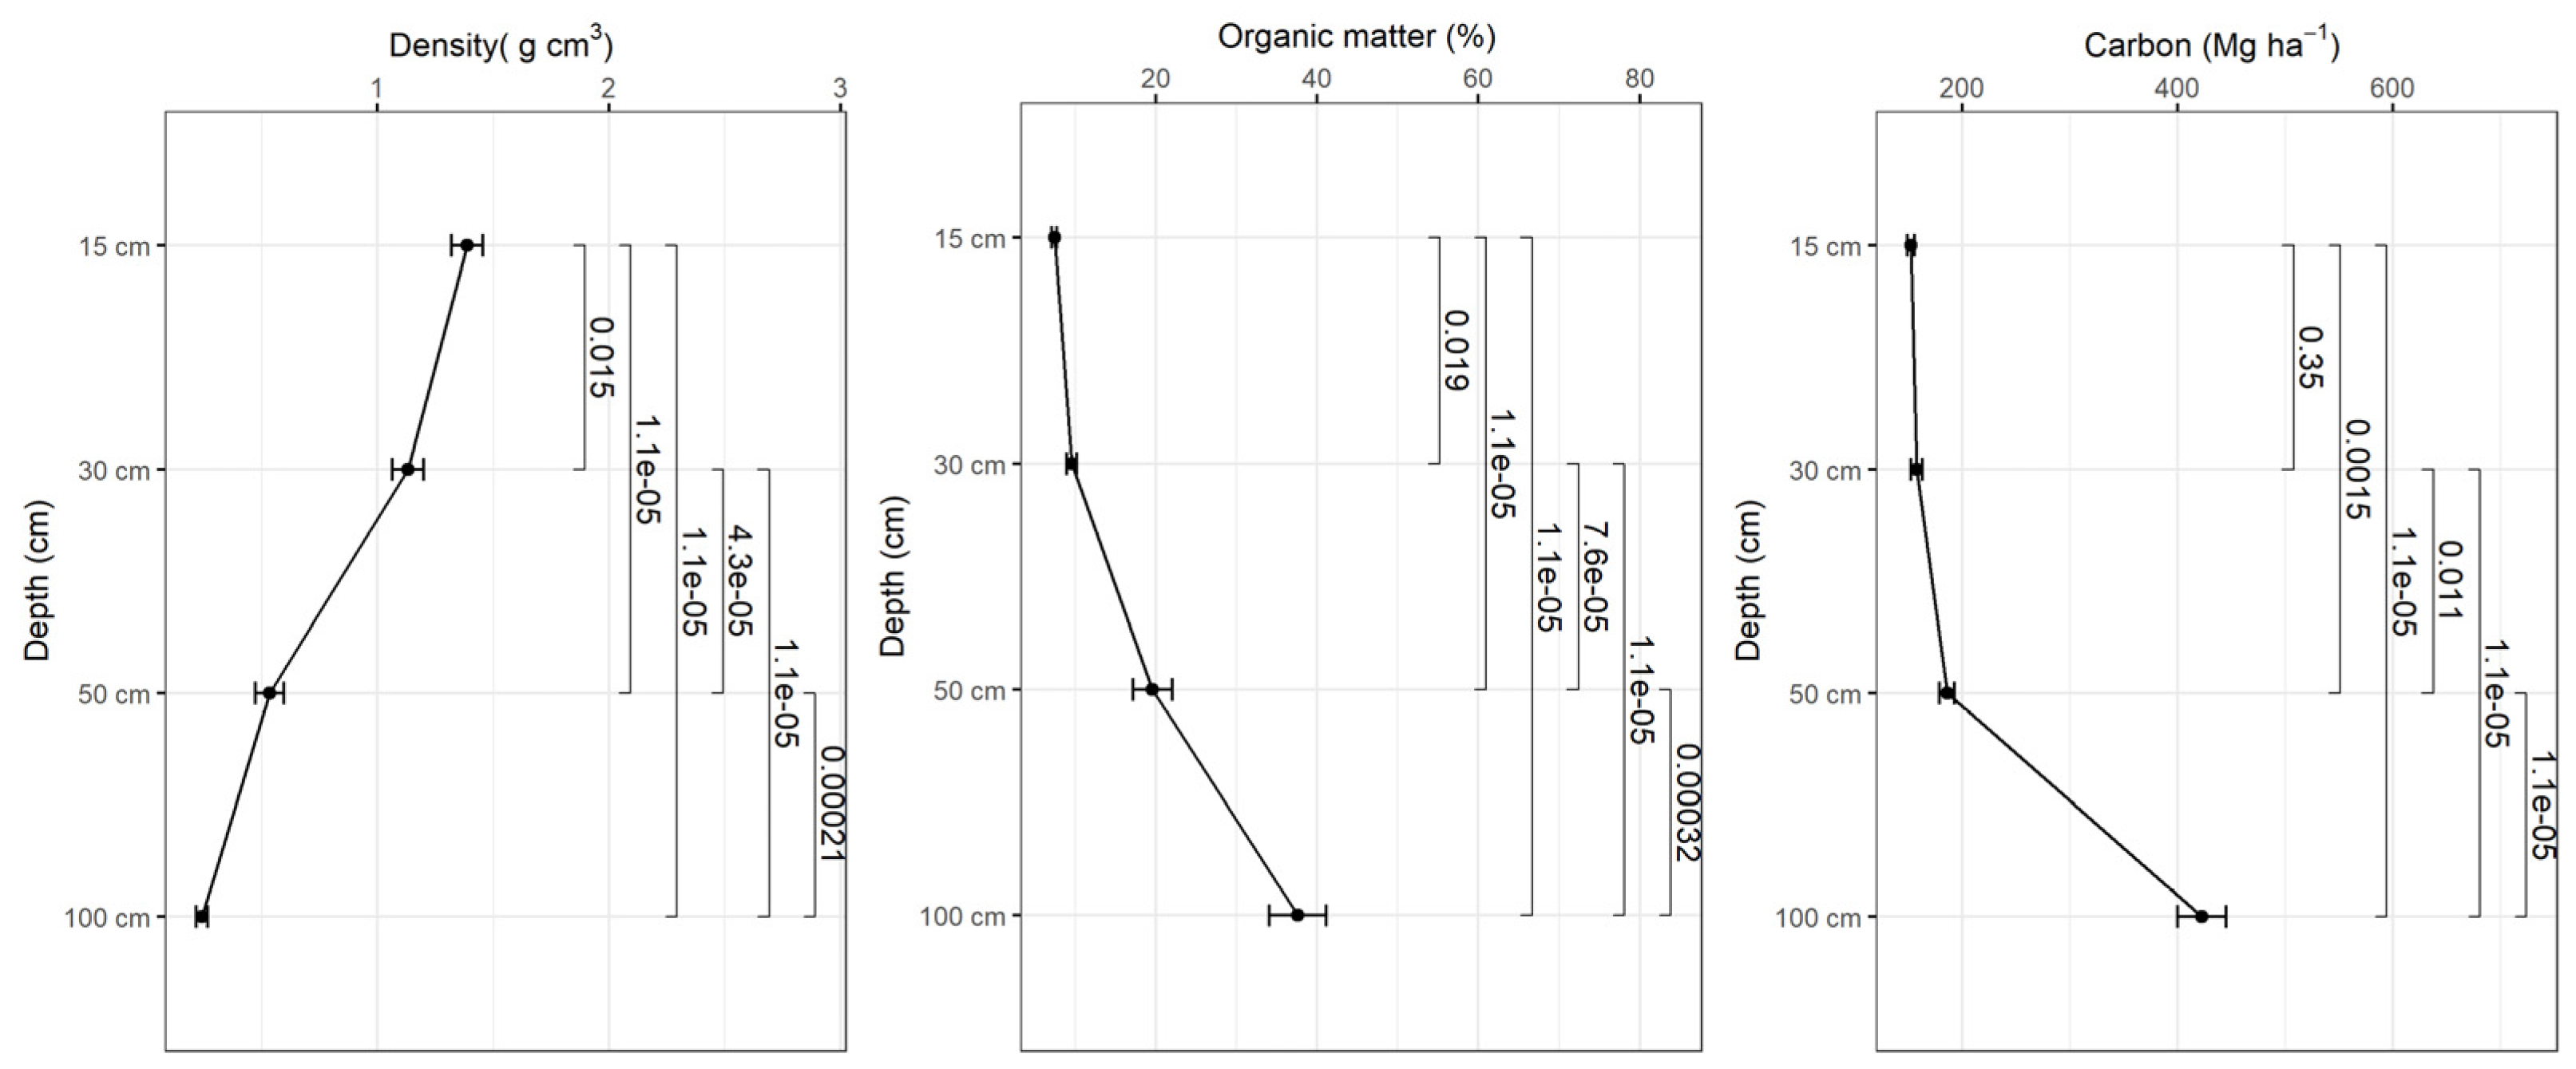
Figure 6.
Variation of apparent density, organic matter content and soil carbon as a function of depth in planted forest-2016.
Figure 6.
Variation of apparent density, organic matter content and soil carbon as a function of depth in planted forest-2016.
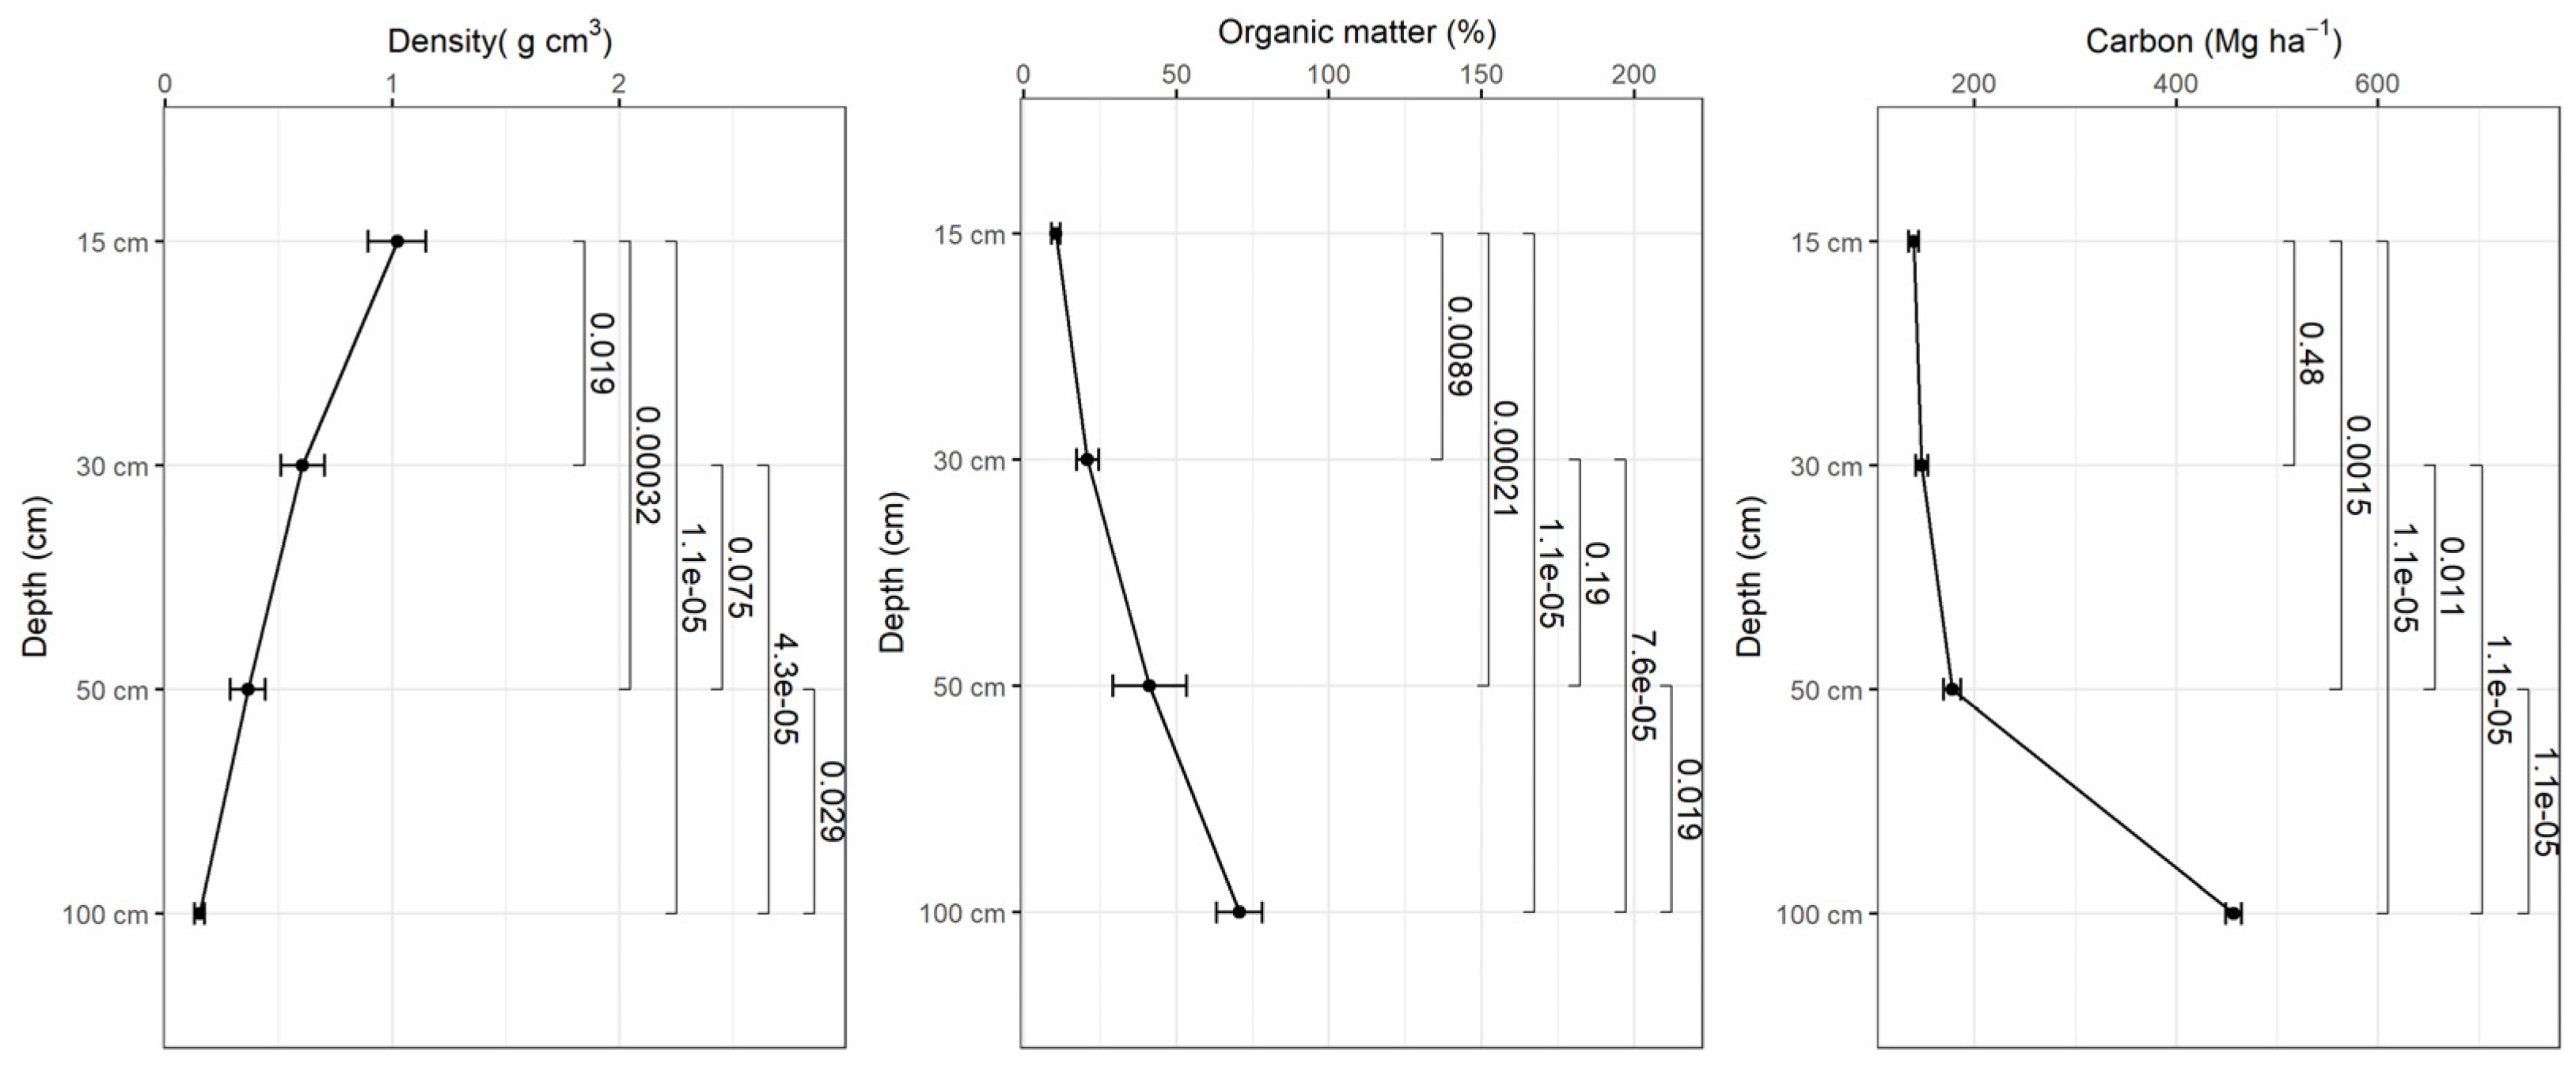
Figure 7.
Variation of apparent density, organic matter content and soil carbon as a function of depth in planted forest-2014.
Figure 7.
Variation of apparent density, organic matter content and soil carbon as a function of depth in planted forest-2014.
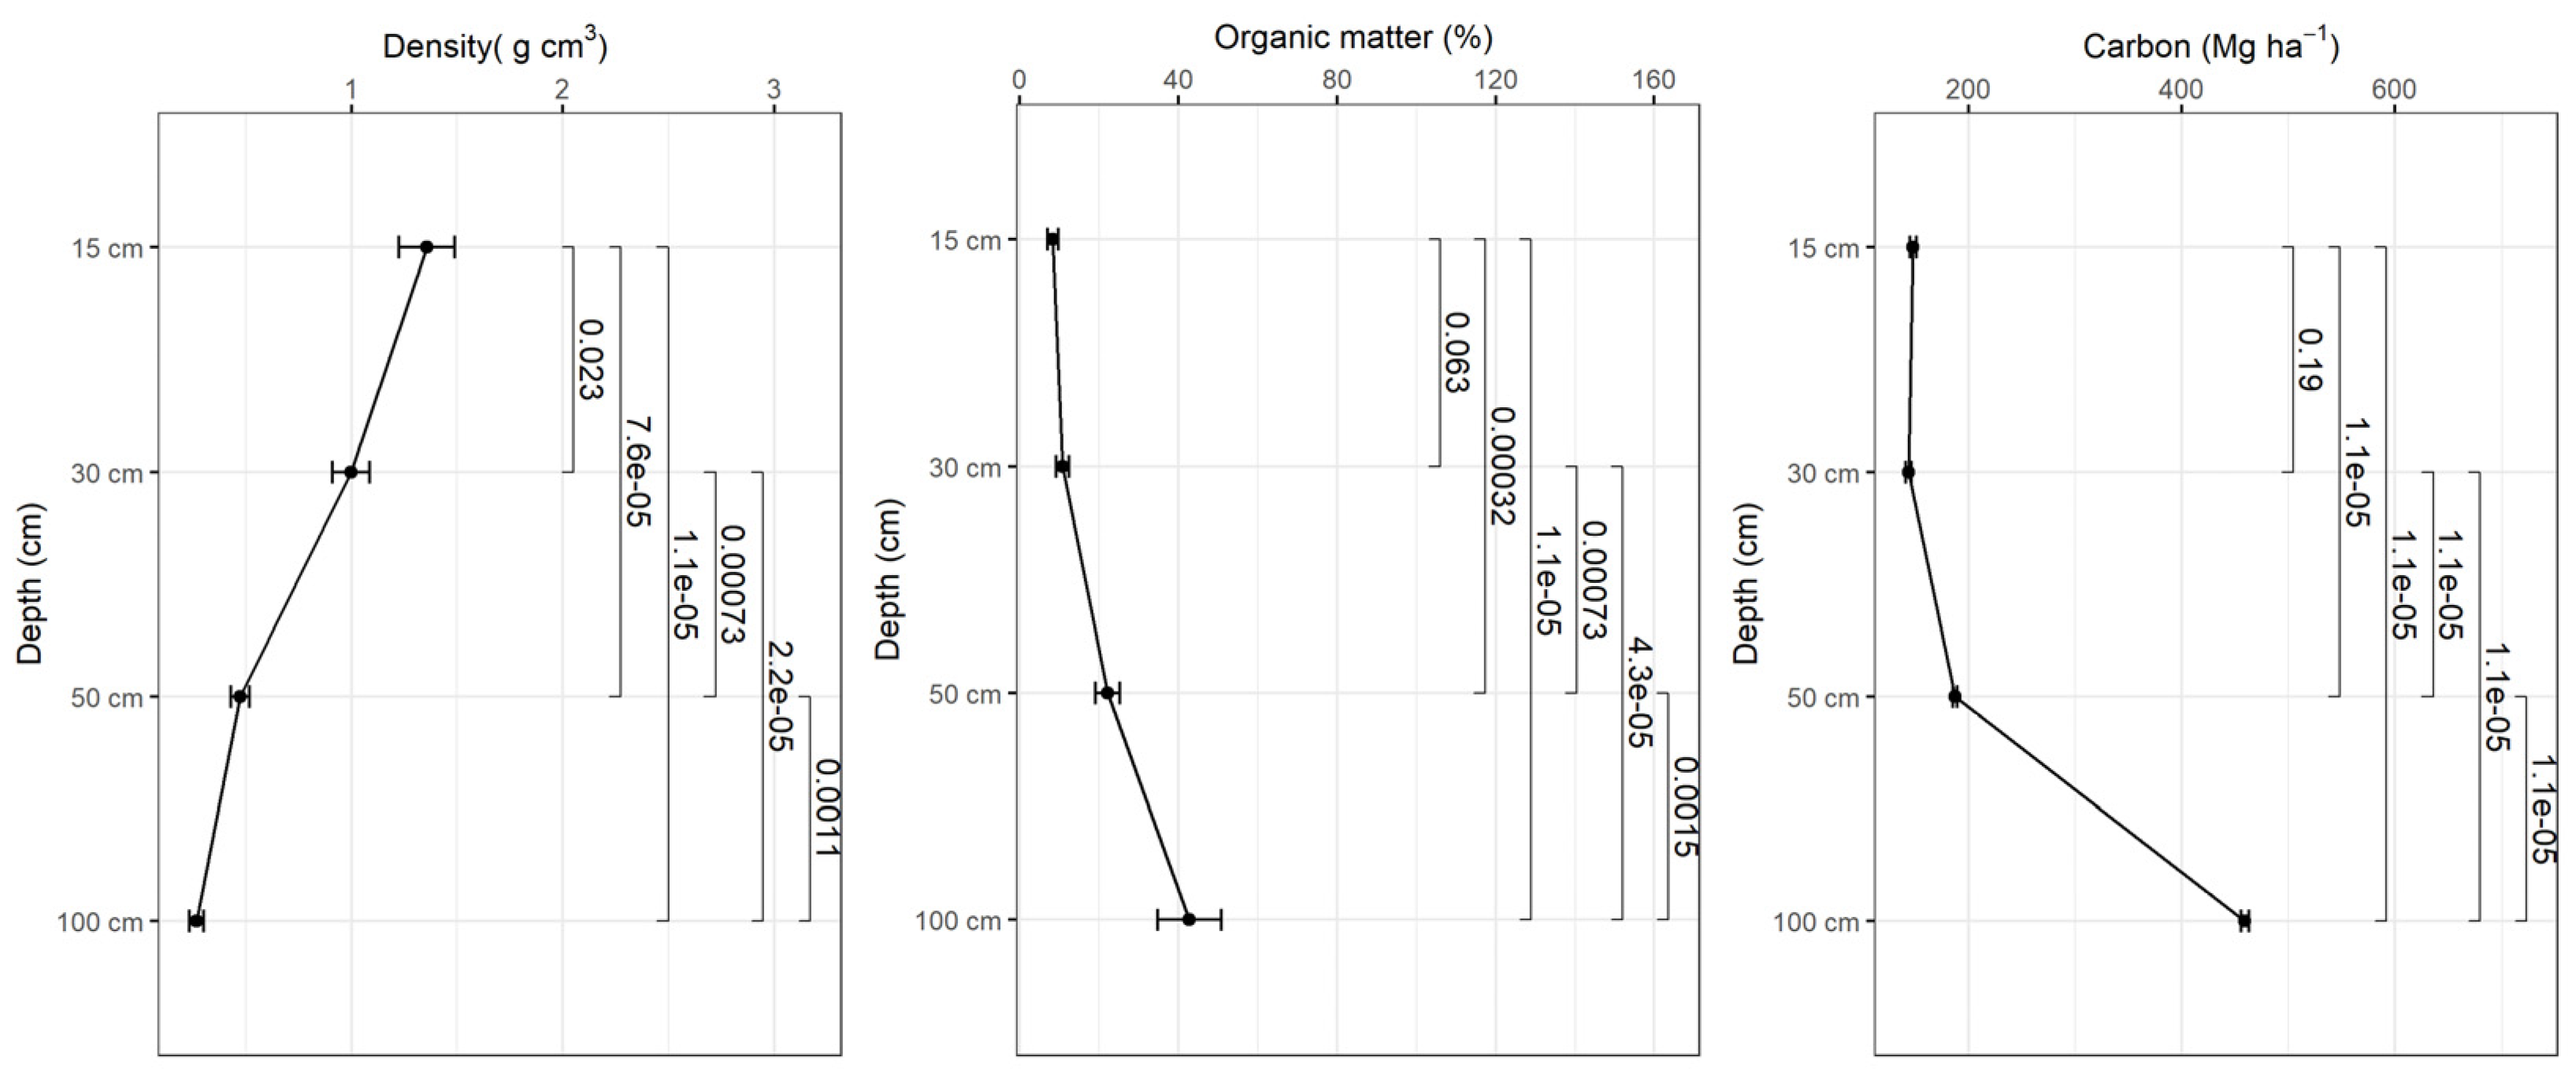
Figure 8.
Variation of apparent density, organic matter content and soil carbon as a function of depth in planted forest-2010.
Figure 8.
Variation of apparent density, organic matter content and soil carbon as a function of depth in planted forest-2010.
3.3.3. Total carbon reserve
The natural forest had the highest amount of carbon with 362.3 Mg ha-1, while in the replanted forests (2016, 2014 and 2010) it was estimated 233.5 MgCha-1, 240.2 MgCha-1 and 246.4 MgCha-1, respectively (Table 5). Among replanted forests, the longer the year of replanting, the greater the estimated carbon reserve. Baased on the amount of carbon that was stored in each replanted forest, we estimated an average carbon sequestration rate of 2.45 MgCO2ha-1 per year (Table 5).
Table 5.
Total carbon values in natural and replanted forests and annual carbon sequestration rate.
| Area | Total carbon (MgCha-1) | Annual carbon sequestration rate (MgCO2ha-1 per annum) |
| Natural forest | 362.3 | - |
| Planted forest 2016 | 233.5 | 3.3 |
| Planted forest 2014 | 240.2 | 1.5 |
| Planted forest 2010 | 246.4 | - |
4. Discussion
4.1. Floristic composition
Five mangrove species were found in the Limpopo estuary: A. marina, C. tagal, R. mucronata, B. gymnorhiza and X. granatum which was very rare with only a few individuals sampled. Avicennia marina was the species with the highest density, dominance and indices of importance values, in the natural and replanted forests. This result was expected due to several reasons. Avicennia marina is a very common species in the mangrove forests of Mozambique, and in southern Mozambique it is usually dominant [34]. Additionally, the species is resilient and resistant to environmental stressors. The species has high capacity to survive in conditions of salinity variation and high salinity, has a rapid regeneration capacity and resistance to events such as floods that have frequently occurred in the area [14,34].
In the case of the Limpopo, where 59% of the area was wiped away during the 2000 floods, A. marina survived, while other species became very uncommon and X. granatum was extinct from the area [14].
4.2. Structural attributes
Trees with greater height and average diameters were observed in the natural forest, indicating the maturation of the forest, while short trees with smaller diameters were found mainly in the replanted forests, because the mangrove is in an active process of regeneration and growth [35]. Planted and natural forests have specific characteristics at different stages of development [18]and growth in height and diameter for most mangrove species is influenced by factors such as forest age, disturbance, site conditions and suppression by the dominant species [36].
The average density of trees in the natural forest was relatively lower when compared to the replanted forests and it was verified that there were no significant differences. The average of the total basal area was higher in the natural forest in relation to the replanted ones. During the development of forests, they go through a period in which the land is occupied by a high density of trees, as in the case of replanted forests, with reduced diameter and height, until a phase of greater maturation, when the volume is compensated by some large trees, as in the case of natural forests, where the diameter and height are greater. Thus, the density is reduced with the maturation of the forests, thus justifying the results obtained in this study [35].
4.3. Height-to-diameter ratio
The relationship between diameter and height varied in the natural forest and in the replanted forests. Metabolic ecology predicts that trees should increase in diameter faster than in height. It is known that the height-DBH relationship changes with time and stabilizes when adult trees reach maturity, justifying the moderate relationship between the two parameters in the natural forest [37]. According to [38] the relationship between tree height and diameter is important to understand tree growth patterns and is often a necessary variable in tree volume and biomass models.
In the replanted forests (2016, 2014 and 2010), the correlation between diameter and height for A. marina was weak to very weak and with significant differences. These results were expected, as it is often observed in forests in formation [16]. The weak relationship between height and DBH in planted forests reflects the high spatiotemporal heterogeneity in the development and succession of planted mangroves and indirectly demonstrates the sensitivity of planting to fluctuations in environmental conditions, such as climate disturbances and pathogenic outbreaks, during succession [16].
4.4. State of conservation in the natural and planted area
As for the cutting condition, both in the natural forest and in the replanted ones, the highest average densities are related to intact trees. These results also coincide with studies carried out in the Quirimbas National Park, where they found that the intact stands had the highest average density in the entire research area [7]. These results may be associated with the efforts of community leaders and community members in the process of mangrove replanting and management, which marked the beginning of a common understanding of a broader estuarine system that previously lacked a community management structure [14].
The mangrove species that exhibited more partial and severe cutting in the natural and planted forest were A. marina, B. gymnorhiza and R. mucronata. Similar results were also documented by [24]. In most of East Africa, A. marina wood is used for many purposes, such as charcoal and firewood production, boat building, traditional drums, among other products [39,40,41]. Rhizophora mucronata, on the other hand, is mainly used for construction and charcoal production; while the wood of B. gymnorhiza, characterized by being heavy and durable, but difficult to saw and work, is used for construction, furniture, house posts and poles [40,42]. In the natural forest, there is a greater availability of semi-straight poles, while in the forests planted in 2016, 2014 and 2010, the poles are straight. This result was expected, since, according to [43], in planted forests, the spacing is mostly regular and closer, which induces the competitive interaction that may be responsible for the straightness of the main stem, thus having trees with narrower stakes in planted forests compared to natural forest. Poles quality also depends on site conditions and sivicultural treatments, for example, pruning.
4.5. Regeneration rate
When evaluating the ratio obtained in the natural forest (7:5:1) and planted in 2014 (2:1:1) and 2010 (4:3:1) it is noted that there is a higher proportion of seedlings in class I, while in the forest replanted in 2016 (2:2:1), there is a higher proportion of seedlings in class II. The lowest proportion of seedlings is evidenced in regeneration class I, in all study sites. According to the results of that study, regeneration did not reach the effective stocking rate of 6:3:1 for juveniles, as described by [44]. The reason for this may be the shading effects created by the parental canopy that prevent light from reaching the ground, thus limiting seedling growth in regeneration class I. crucial role in limiting seedling recruitment [45,46]. However, based on seedling densities, mangroves can potentially be considered to have good regeneration capacity.
4.6. Biomass carbon above and below ground.
The higher biomass and carbon above and below ground observed in the natural forest can be attributed to the relatively higher DBH and height values in relation to planted forests. It is known that height and DBH are extremely important variables in tree volume and biomass models [38]. The average biomass of living trees above and below ground found in this study (135.8 Mg ha-1 and 130 Mg ha-1) is above the limits found by [47] in Sofala Bay (84 Mg ha-1 and 64.7 Mg ha-1) and [48], in Maputo Bay (4.59 Mg ha1). On the other hand, these results are below the limits found by [23] in the Zambezi Delta in the highest classes for AGB (268.5 Mg ha-1) and above the limits found in the highest classes for BGB (72.8 Mg ha-1). These differences may be associated with tree density, species composition and height and DBH values that have a great influence on carbon sequestration [49]. The average biomass of living trees above and below ground in planted forests varies with the age of the forest, that is, the older the forest, the greater the estimated carbon reserve (2.2±1.1 Mg ha-1 and 4.3±1.9 Mg ha-1, forest planted 2016; 3.6±2.1 Mg ha-1 and 7.1±4.0 Mg ha-1, forest planted 2014; 7.4±4.0 Mg ha-1 and 10.6±4.9 Mg ha-1, forest planted 2010), indicating that with age, trees invest more in the stem than in other components, consequently increasing their biomass [16]. Restoration studies in Indonesia also showed that the age of planted mangroves had a significant effect on aboveground and belowground carbon stocks ranging from 2.13 Mg ha-1 to 1.0 Mg ha-1 in the youngest stands (4 years), 15.81 Mg ha-1 and 3.98 Mg ha-1 (5 years), 46.53 Mg ha-1 and 10.26 Mg ha-1 (7 years) [50].
4.7. Soil carbon
The results of this study demonstrated that the largest carbon reserves in the studied mangrove forests were found in the soil in relation to aboveground and belowground biomass. These results are similar to values observed in other tropical mangrove areas, where the largest carbon reserves were found in the soil, as shown in the following reports: Zambezi Delta [23]; Sofala Bay [47]; Madagascar [51]; Asia-Pacific region [10] and Micronesia [52,53].
The amount of total carbon stored in the soil in this study was higher in forests planted in 2010, 2014 and 2016 (230.3±134.8 MgCha-1; 234.8±132.7 MgCha-1, and 237.4±142.6 MgCha-1, respectively) compared to natural forest (229.4±119.4 Mg ha-1). These results are similar to those found on the East Coast of India [54], where replanted forest (151.5±7.9 Mg ha-1) had higher soil carbon than natural forest (143.4±8.2 Mg ha-1). These results may be associated with the silvicultural activities that take place regularly in the replanted areas, allowing the entrance of tidal water in each population in an adequate way, thus making the tidal flow more favorable, and allowing a good biological activity and greater accumulation of organic matter deposited in the soil [54]. On the other hand, it could be that the carbon stored in the soil remained stable in degraded areas.
4.8. Total carbon reserve
The results indicate that the natural forest (362.3 Mg ha-1) has a higher amount of total carbon than the forests planted in 2016, 2014 and 2010 (233.5 Mg ha-1; 240.2 Mg ha-1; 246.4 Mg ha-1). These results may be associated with the structural patterns of the forest, average tree density, basal area and height, having been relatively higher in the natural forest in relation to the replanted ones. This pattern of larger area carbon reserves represented by large trees can also be explained by the combination of nutrient input from alluvial material and tidal action that allows the assimilation of carbon by mangrove plants [55]. However, our results show that overall carbon storage in the natural mangrove forest is lower compared to those reported by other authors, eg [56] who recorded an average of 534 Mg ha-1 of total carbon in the Zambezi Delta, Dominican Republic with 853 Mg ha-1 [57] and Indonesia with 879 MgCha-1 [58] . These differences may be associated with variations in tree species composition, forest structure (tree density and average diameter) forest conservation status, carbon concentration and soil water content in each region [47,59]. Also this study only targeted on the main carbon pools (soil, and above and below biomass), while others also included minor pools such as litter.
The average annual rate of carbon increase is comparable to carbon sequestration rates found in the Sundarbans, where it was found an annual increase of 1.69 Mg C ha−1 a−1 for live biomass and 0.012 Mg C ha−1 a−1 for carbon in the sediment (Ray et al., 2011). However this number is way below that of the Philippines, where an annual increase of 10.2 MgCha-1year was found. Carbon sequestration rates vary according to several factors, including the natural conditions of the site such as rainfall, species composition and temperature.
5. Conclusions
This study looked at the forest structure, conservation condition and carbon storage of natural and replanted mangrove forests of the Limpopo Estuary, southern Mozambique. The results of the study indicate that there are still significant differences between the natural and the replanted forests, however some forest characteristics are not significantly different. Mangrove restoration creates opportunity for forest enhancement, such as reintroducing new species. On what regards to carbon storage, the natural forest stores larger amounts of carbon above and below ground, while soil reserves were higher in planted forests. This results indicate that, even though restored forest do not fully perform like a natural forest, they still deliver a number of worthy services, particularly on what pertains to carbon sequestration and storage, and climate change mitigation.. Thus, the results reported in this study reinforce the importance of drawing up conservation and management plans for mangroves, as well as the maintenance and restoration of mangrove forests in coastal areas is an urgent task. The results of this study can also be used to update/calibrate biomass estimation studies that use non-invasive or indirect methods.
Author Contributions
Conceptualization, F.I-C. and C.M.; methodology, F.I-C and C.M.; software, F.I-C.; validation, C.M and F.I-C; formal analysis, F.I-C.; investigation, F.I-C.; resources, C.M.; writing—original draft preparation, F.I-C.; writing—review and editing, C.M.; visualization, C.M.; supervision, C.M.;. All authors have read and agreed to the published version of the manuscript.
Funding
This research was funded by the WIOSAP Project (UNEP), in partnership with the Agency for Environmental Quality, Gaza (AQUA).
Gratitude extends to Salomão Bandeira, Paulino Da Costa, Neila Mucavele, Henriques Balidy, Jacinta Laissone, Agostinho Nhanzimo and all the community of Mahielane.
Data Availability Statement
Data presented in this study are available upon request from the corresponding author.
Acknowledgments
I would like to thank the UEM-Suecia program for the opportunity to receive a scholarship for my master's program, Environmental Quality Agency, Gaza (AQUA), for her very important contribution to the carrying out this study, the Faculty of Agronomy and Forestry Engineering, UEM, Maputo.
Conflicts of Interest
The authors declare no conflict of interest.
Appendix
Table A1.
summary of statistical tests of structural taxes in the study sites.
| Natural forest vs Replanted 2016 | |||
| Variable | Test | p-value | Alpha |
| Species density | t | 0,360 | 0,05 |
| DBH | Mann Whitney | <0.001 | 0,05 |
| Height | Mann Whitney | <0.001 | 0,05 |
| Natural forest vs Replanted 2014 | |||
| Variable | Test | p-value | Alpha |
| Species density | t | 0,014 | 0,05 |
| DBH | Mann Whitney | <0.001 | 0,05 |
| Height | Mann Whitney | <0.001 | 0,05 |
| Natural forest vs Replanted 2010 | |||
| Variable | Test | p-value | Alpha |
| Species density | t | 0,191 | 0,05 |
| DBH | Mann Whitney | <0.001 | 0,05 |
| Height | Mann Whitney | <0.001 | 0,05 |
| Forest replanted 2010 vs Replanted 2016 | |||
| Variable | Test | p-value | Alpha |
| Species density | t | 0,360 | 0,05 |
| DBH | Mann Whitney | <0.001 | 0,05 |
| Height | Mann Whitney | <0.001 | 0,05 |
| Forest Replanted 2010 vs Replanted 2014 | |||
| Variable | Test | p-value | Alpha |
| Species density | t | 0,235 | 0,05 |
| DBH | Mann Whitney | <0.001 | 0,05 |
| Height | Mann Whitney | <0.001 | 0,05 |
| Forest Replanted 2014 vs Replanted 2016 | |||
| Variable | Test | p-value | Alpha |
| Species density | t | 0,079 | 0,05 |
| DBH | Mann Whitney | 0,982 | 0,05 |
| Height | Mann Whitney | 0,070 | 0,05 |
Figure A1.
Statistical test to compare the density of intact trees in the study areas.

Figure A2.
Statistical tests for comparing the density of partially cut trees in the study areas.
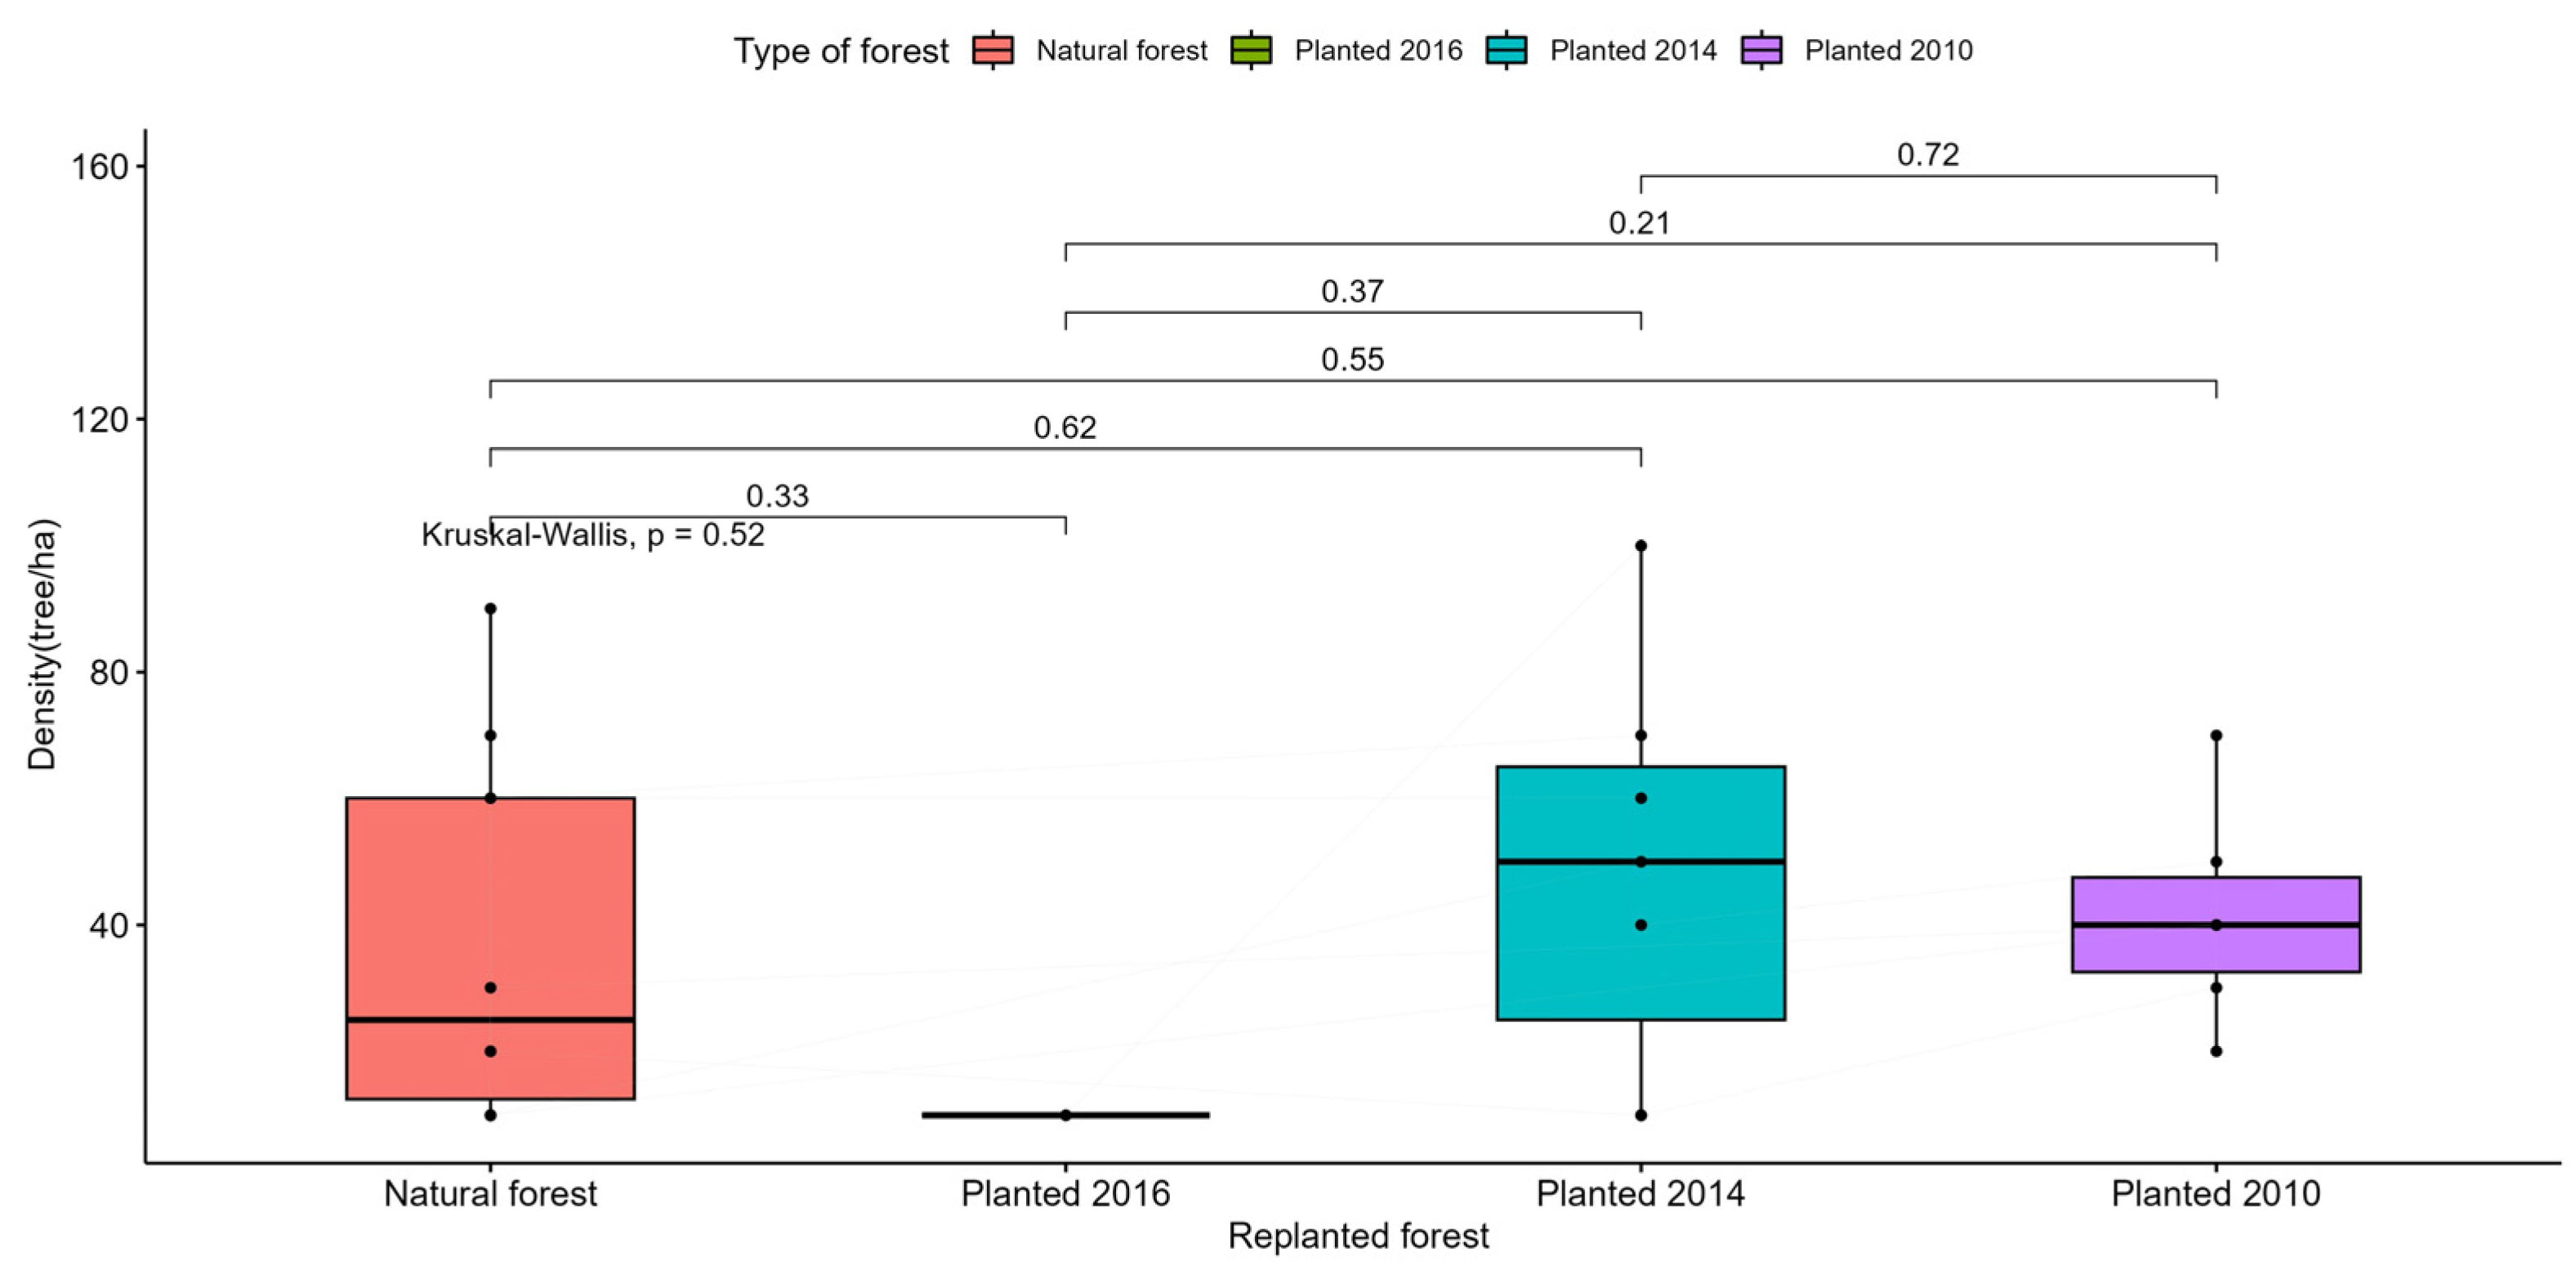
Figure A3.
Statistical test for comparing the average density (tree/ha) of trees in natural and replanted forests.
Figure A3.
Statistical test for comparing the average density (tree/ha) of trees in natural and replanted forests.
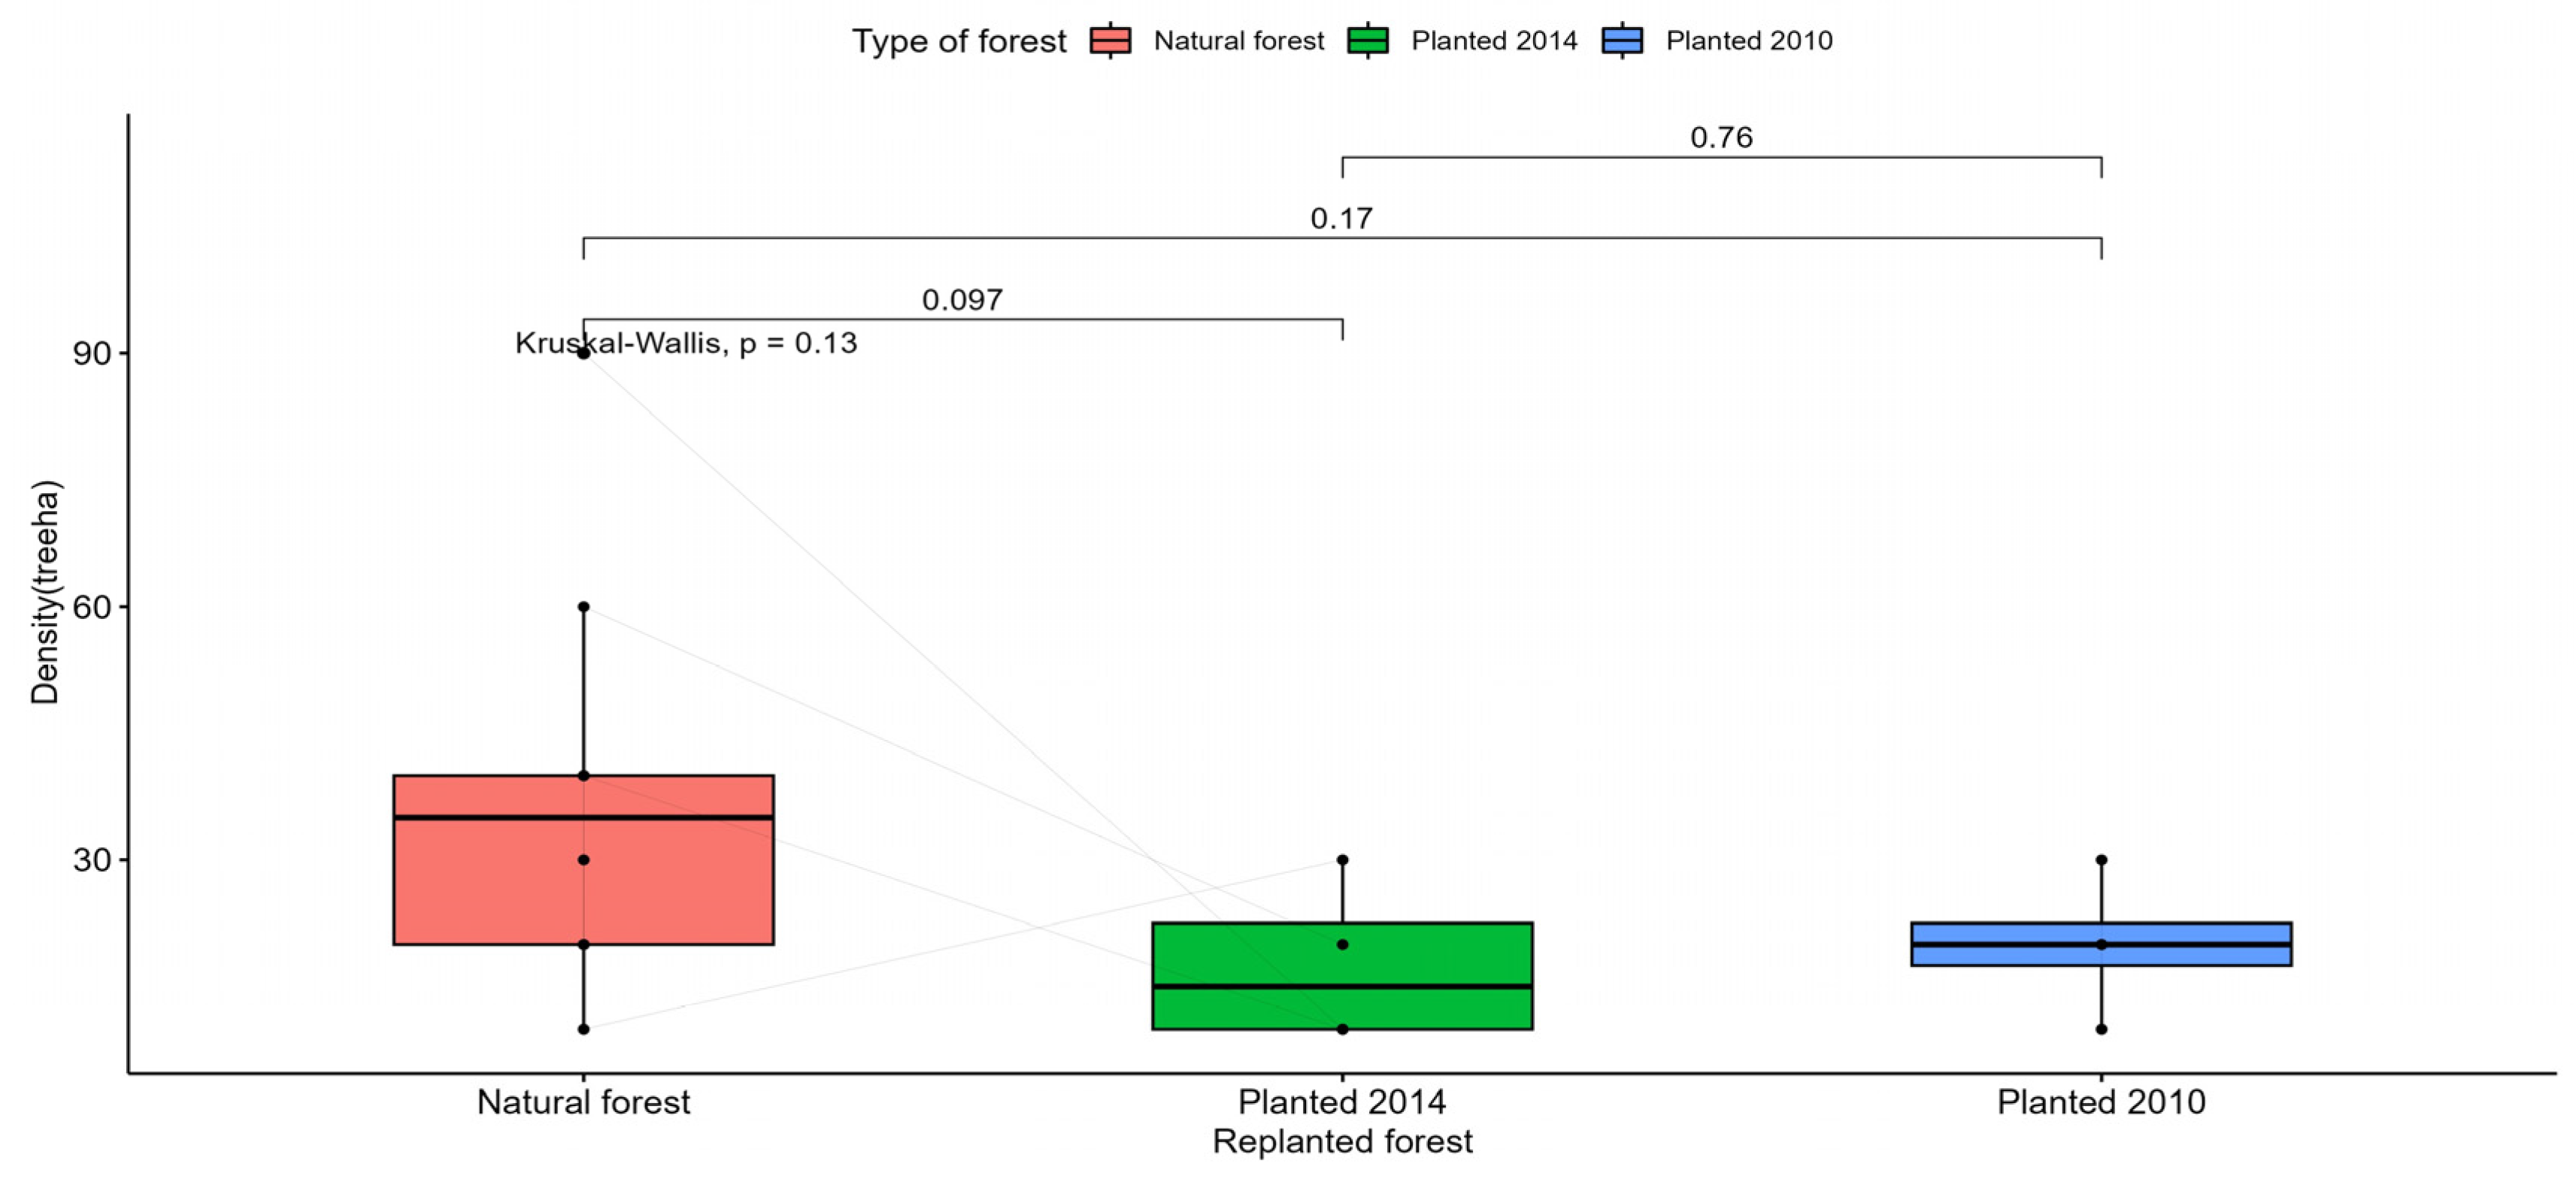
Figure A4.
Statistical test to compare the density of straight trees in the study areas.
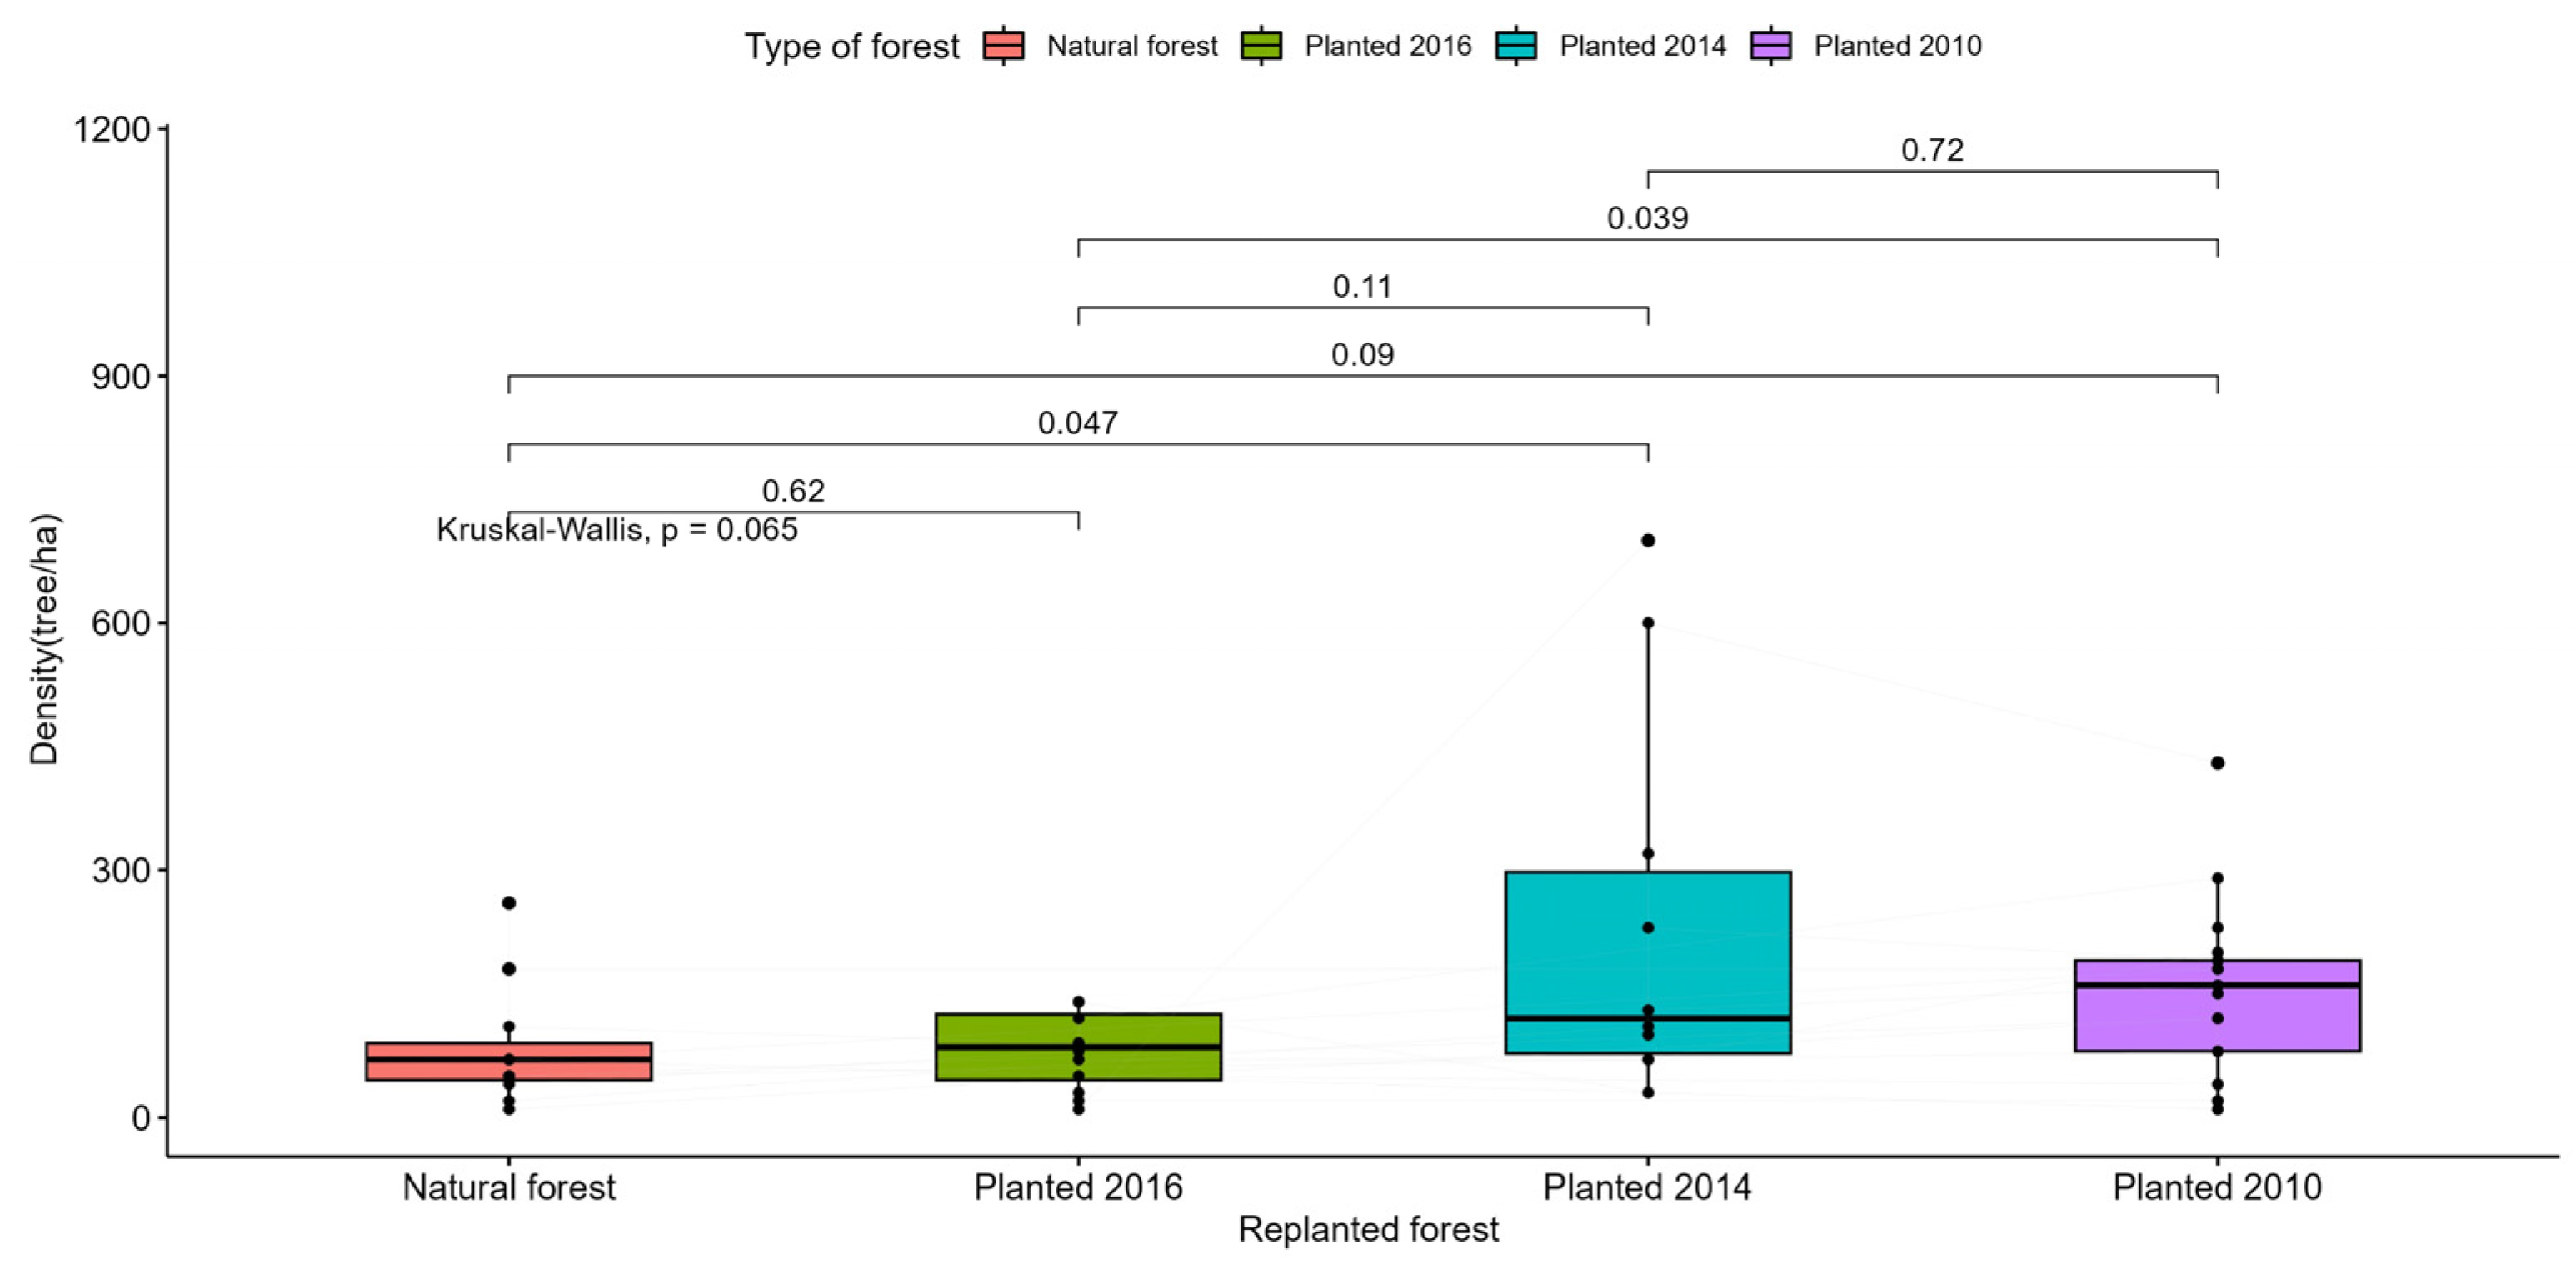
Figure A5.
Statistical test to compare the density of semi-straight trees in the study areas.
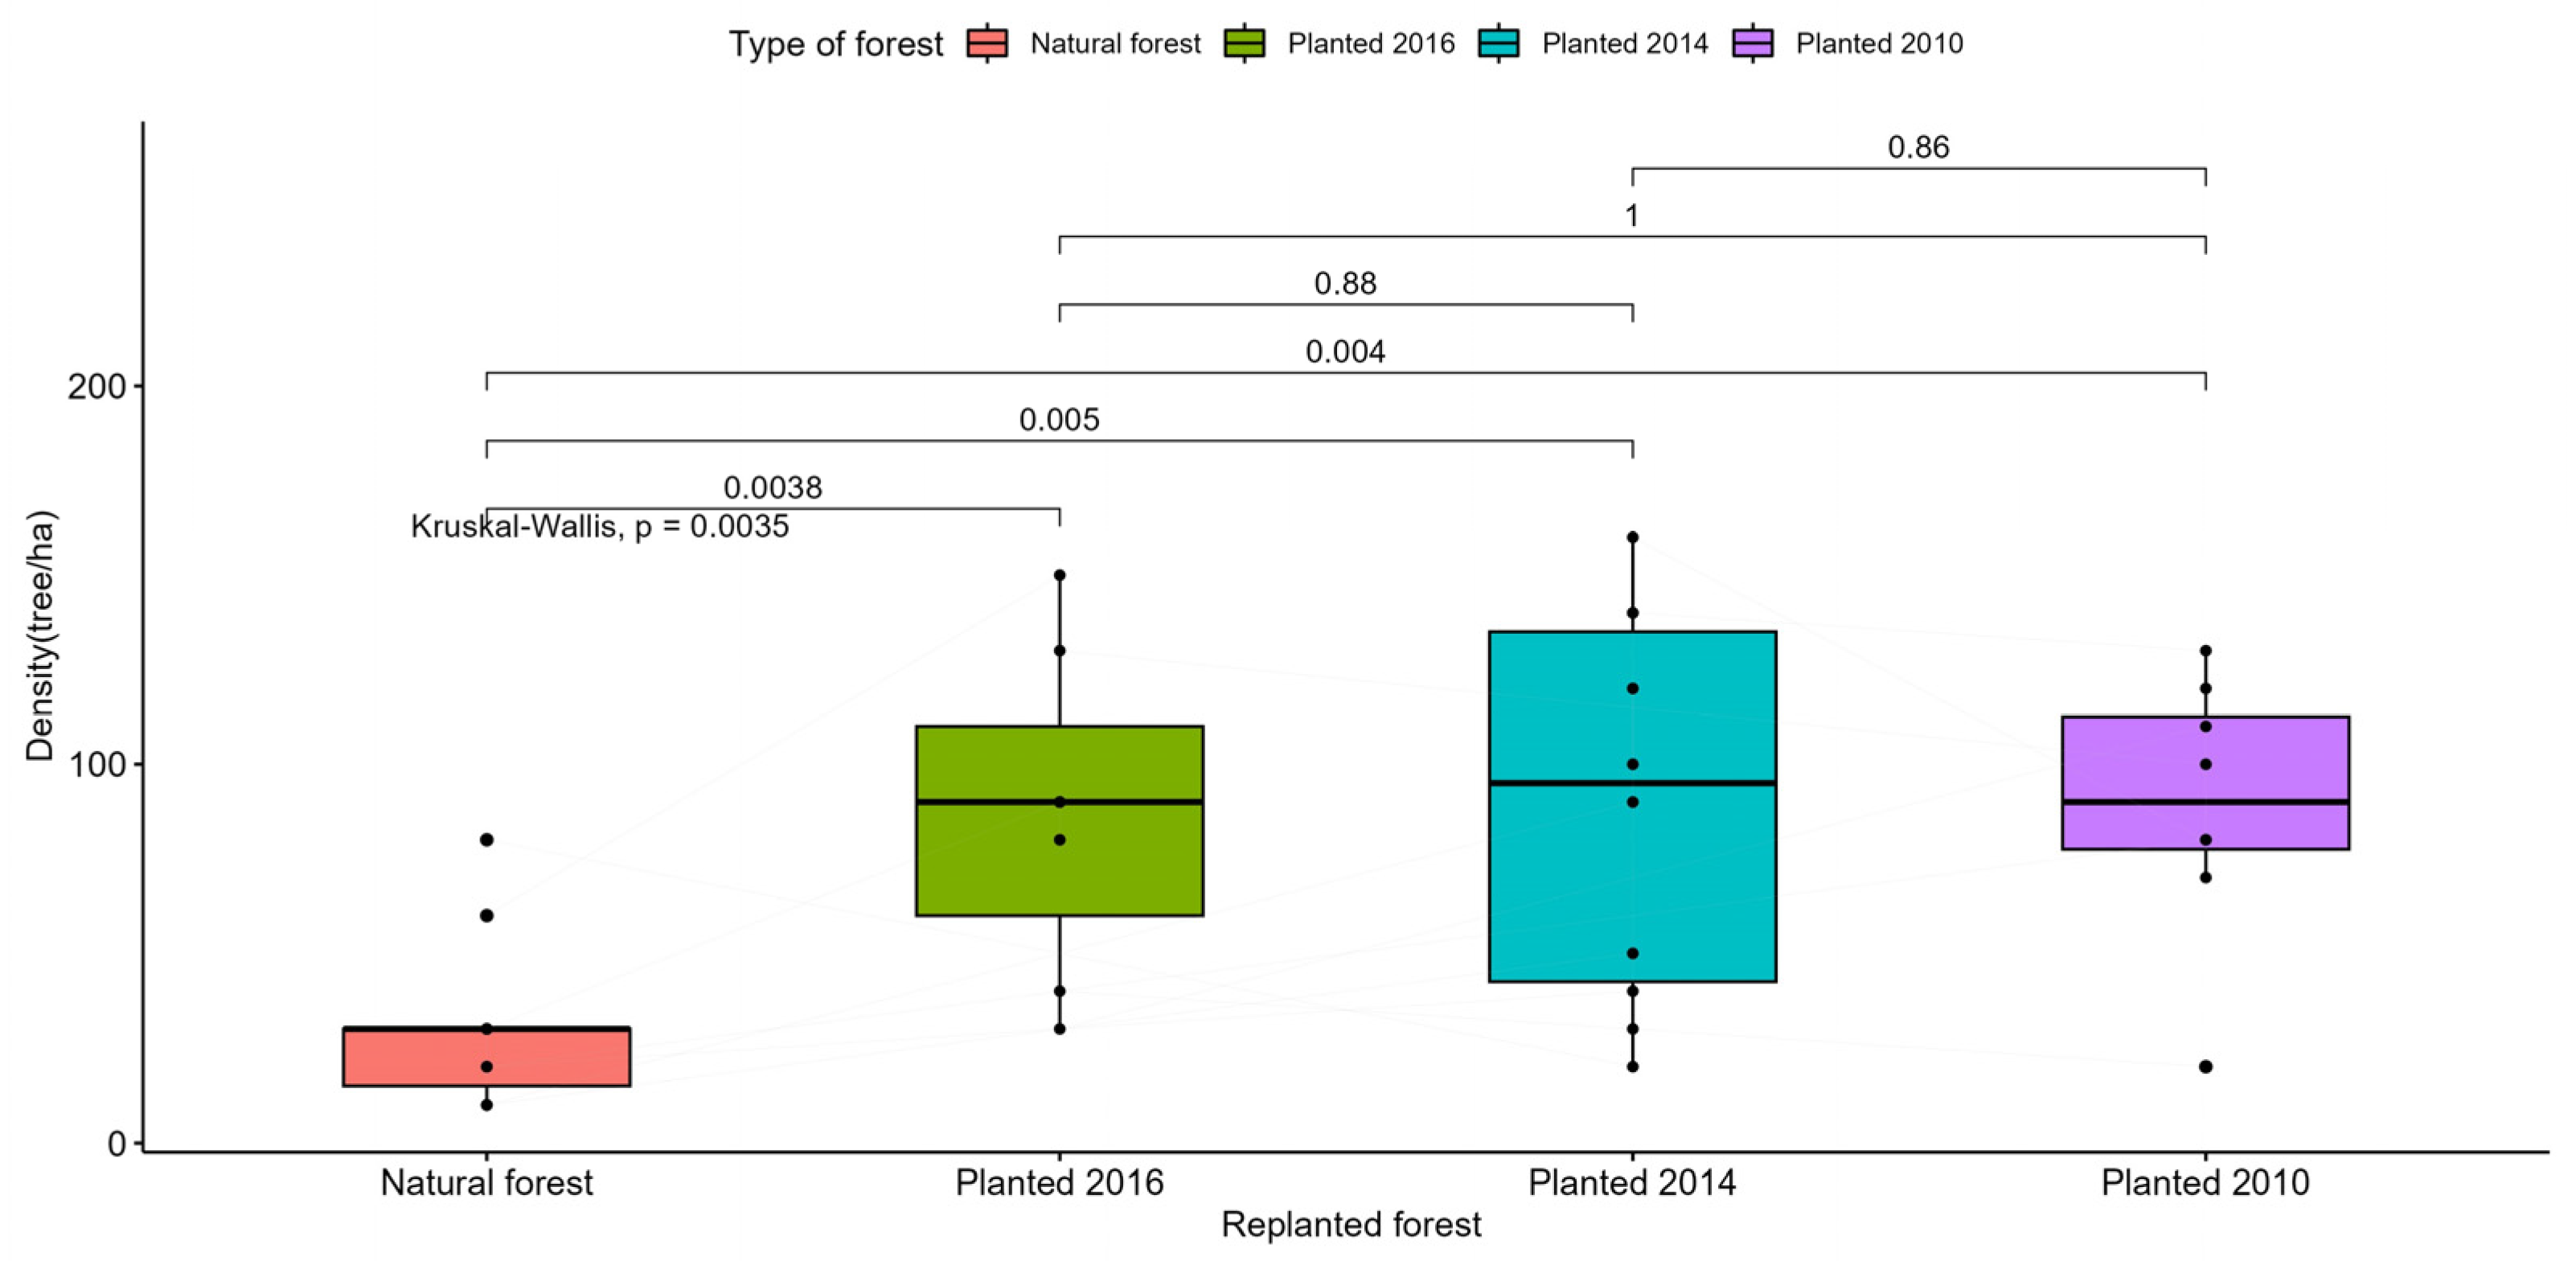
Figure A6.
Statistical test to compare the density of curved trees in the study areas.
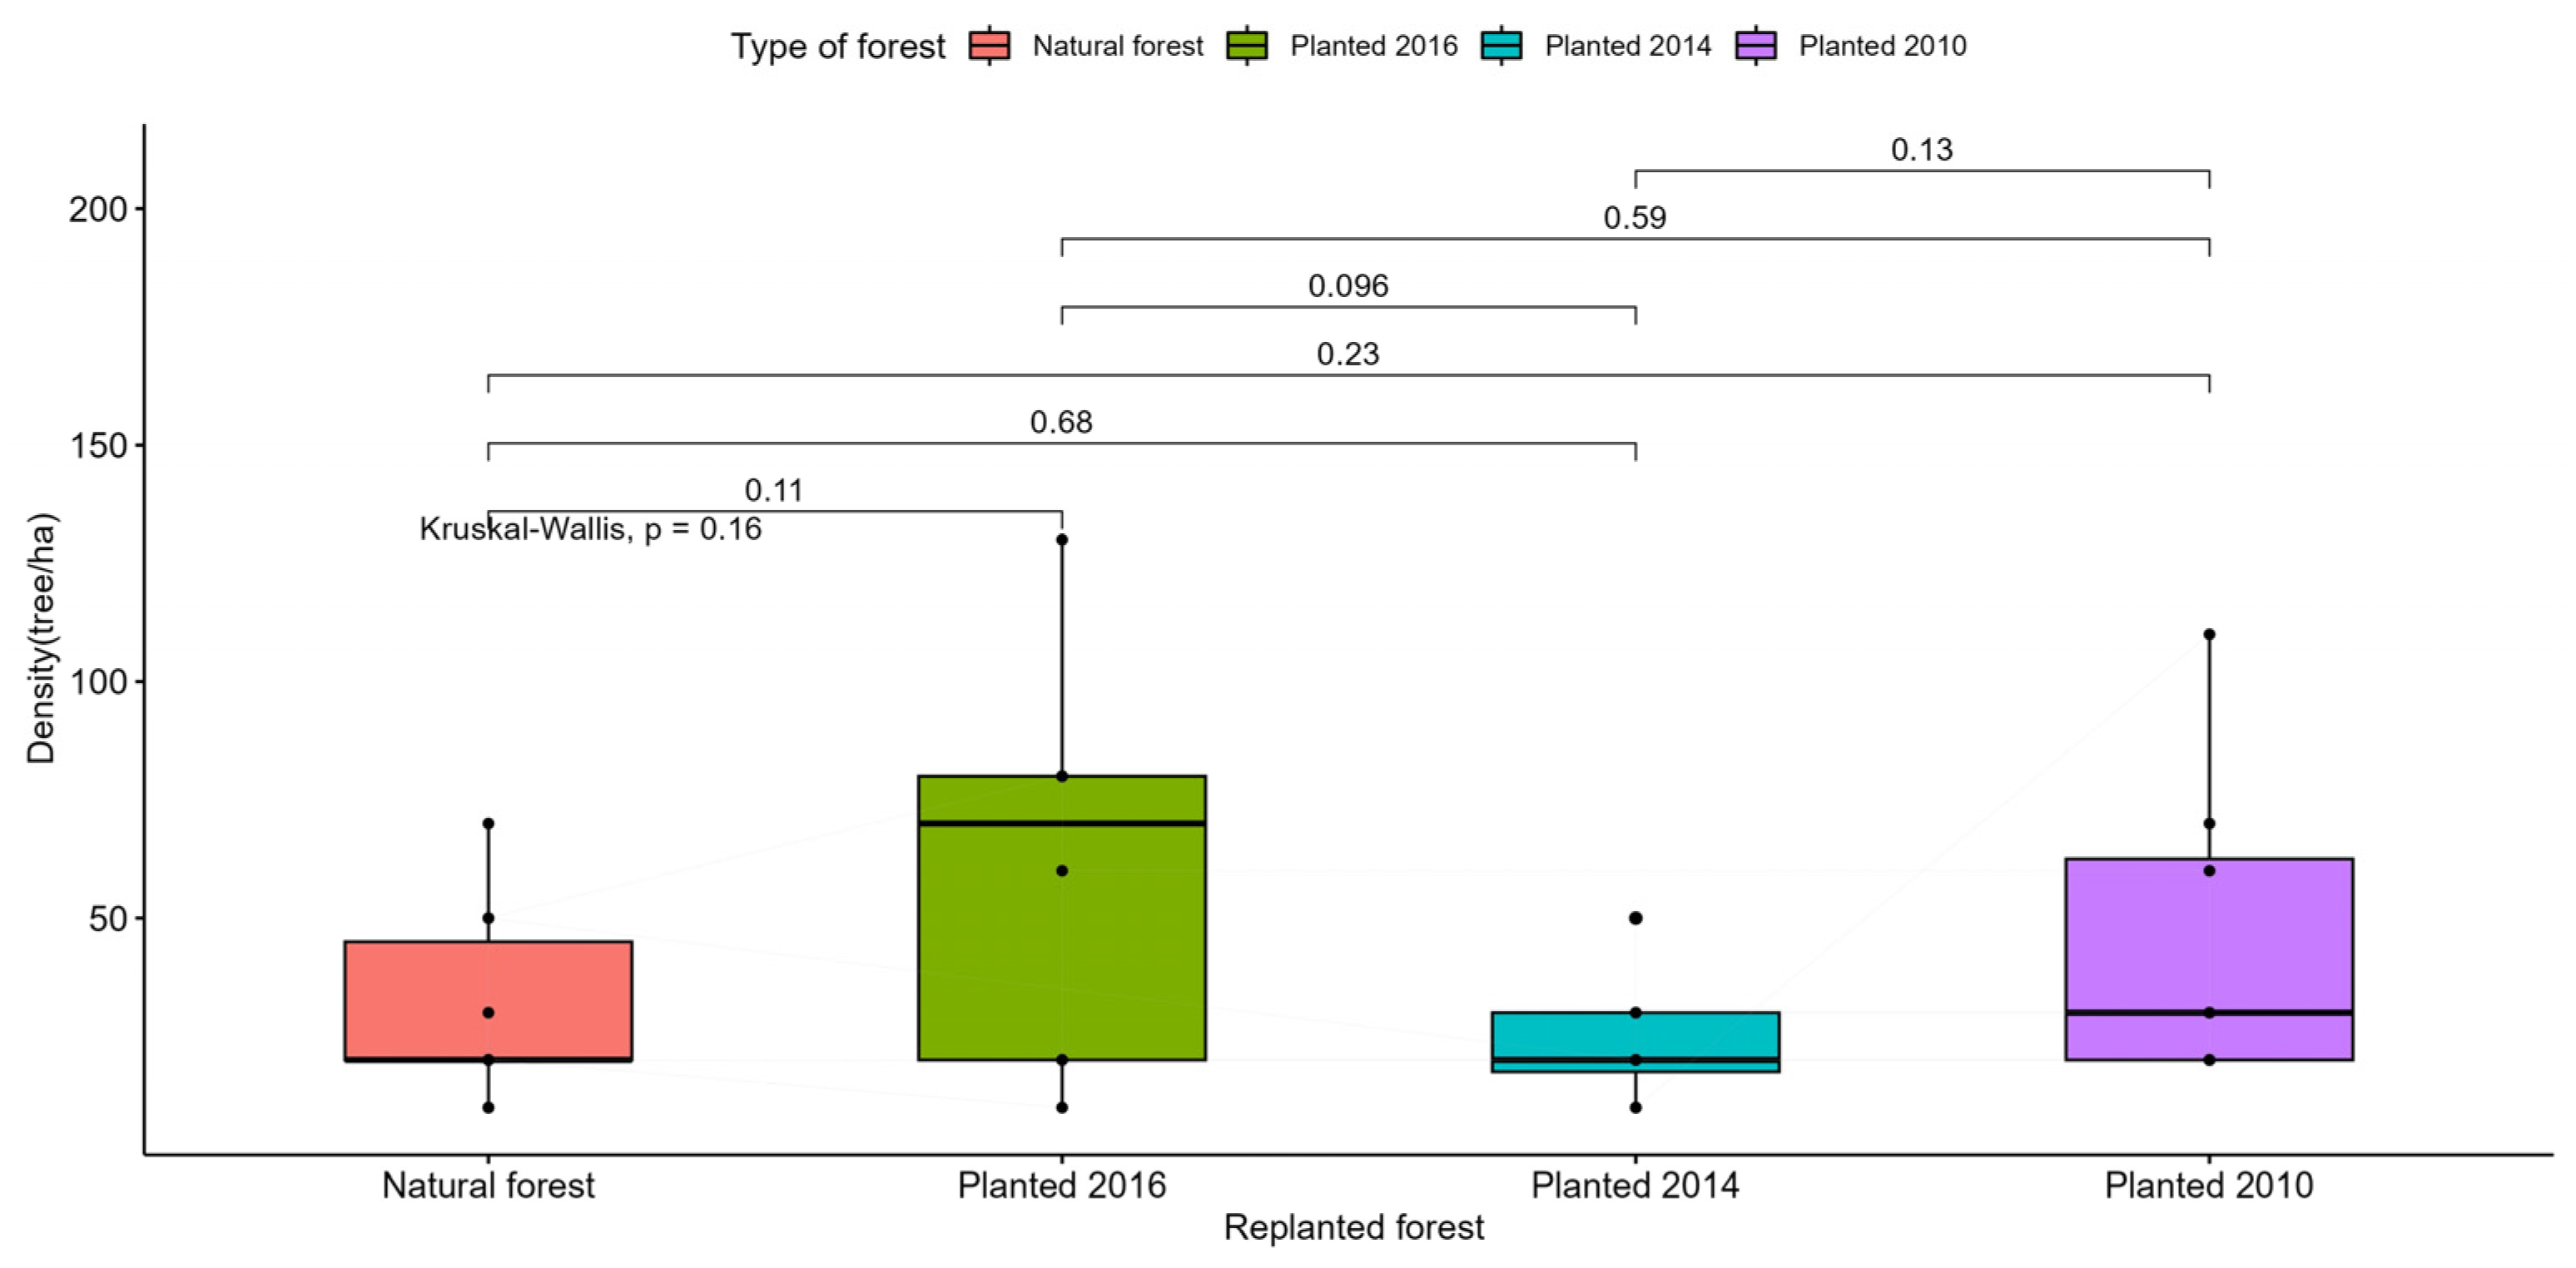
Table A2.
Summary of statistical tests of regeneration in the study areas.
| Natural forest vs Replanted 2016 | |||
| Variable | Test | p-value | Alpha |
| RCI seedling density | Kruskal-Wallis | 0,941 | 0.05 |
| RCII seedling density | Kruskal-Wallis | 0,370 | 0.05 |
| RCIII seedling density | Kruskal-Wallis | 0,735 | 0.05 |
| Natural forest vs Replanted 2014 | |||
| Variable | Test | p-value | Alpha |
| RCI seedling density | Kruskal-Wallis | 0,941 | 0.05 |
| RCII seedling density | Kruskal-Wallis | 0,370 | 0.05 |
| RCIII seedling density | Kruskal-Wallis | 0,334 | 0.05 |
| Natural forest vs Replanted 2010 | |||
| Variable | Test | p-value | Alpha |
| RCI seedling density | Kruskal-Wallis | 0,941 | 0.05 |
| RCII seedling density | Kruskal-Wallis | 0,735 | 0.05 |
| RCIII seedling density | Kruskal-Wallis | 0,334 | 0.05 |
| Replanted forest 2010 vs Replanted2016 | |||
| Variable | Test | p-value | Alpha |
| RCI seedling density | Kruskal-Wallis | 0,941 | 0.05 |
| RCII seedling density | Kruskal-Wallis | 1,000 | 0.05 |
| RCIII seedling density | Kruskal-Wallis | 0,849 | 0.05 |
| Replanted forest 2010 vs Replanted 2014 | |||
| Variable | Test | p-value | Alpha |
| Densidade de plântulas CR I | Kruskal-Wallis | 0,941 | 0.05 |
| Densidade de plântulas CR II | Kruskal-Wallis | 0,370 | 0.05 |
| Densidade de plântulas CR III | Kruskal-Wallis | 0,849 | 0.05 |
| Replanted forest 2014 vs Replanted 2016 | |||
| Variable | Test | p-value | Alpha |
| Densidade de plântulas da CR I | Kruskal-Wallis | 0,941 | 0.05 |
| Densidade de plântulas da CR II | Kruskal-Wallis | 0,370 | 0.05 |
| Densidade de plântulas da CR III | Kruskal-Wallis | 0,956 | 0.05 |
Figure A7.
Biomass variation as a function of sampling areas.
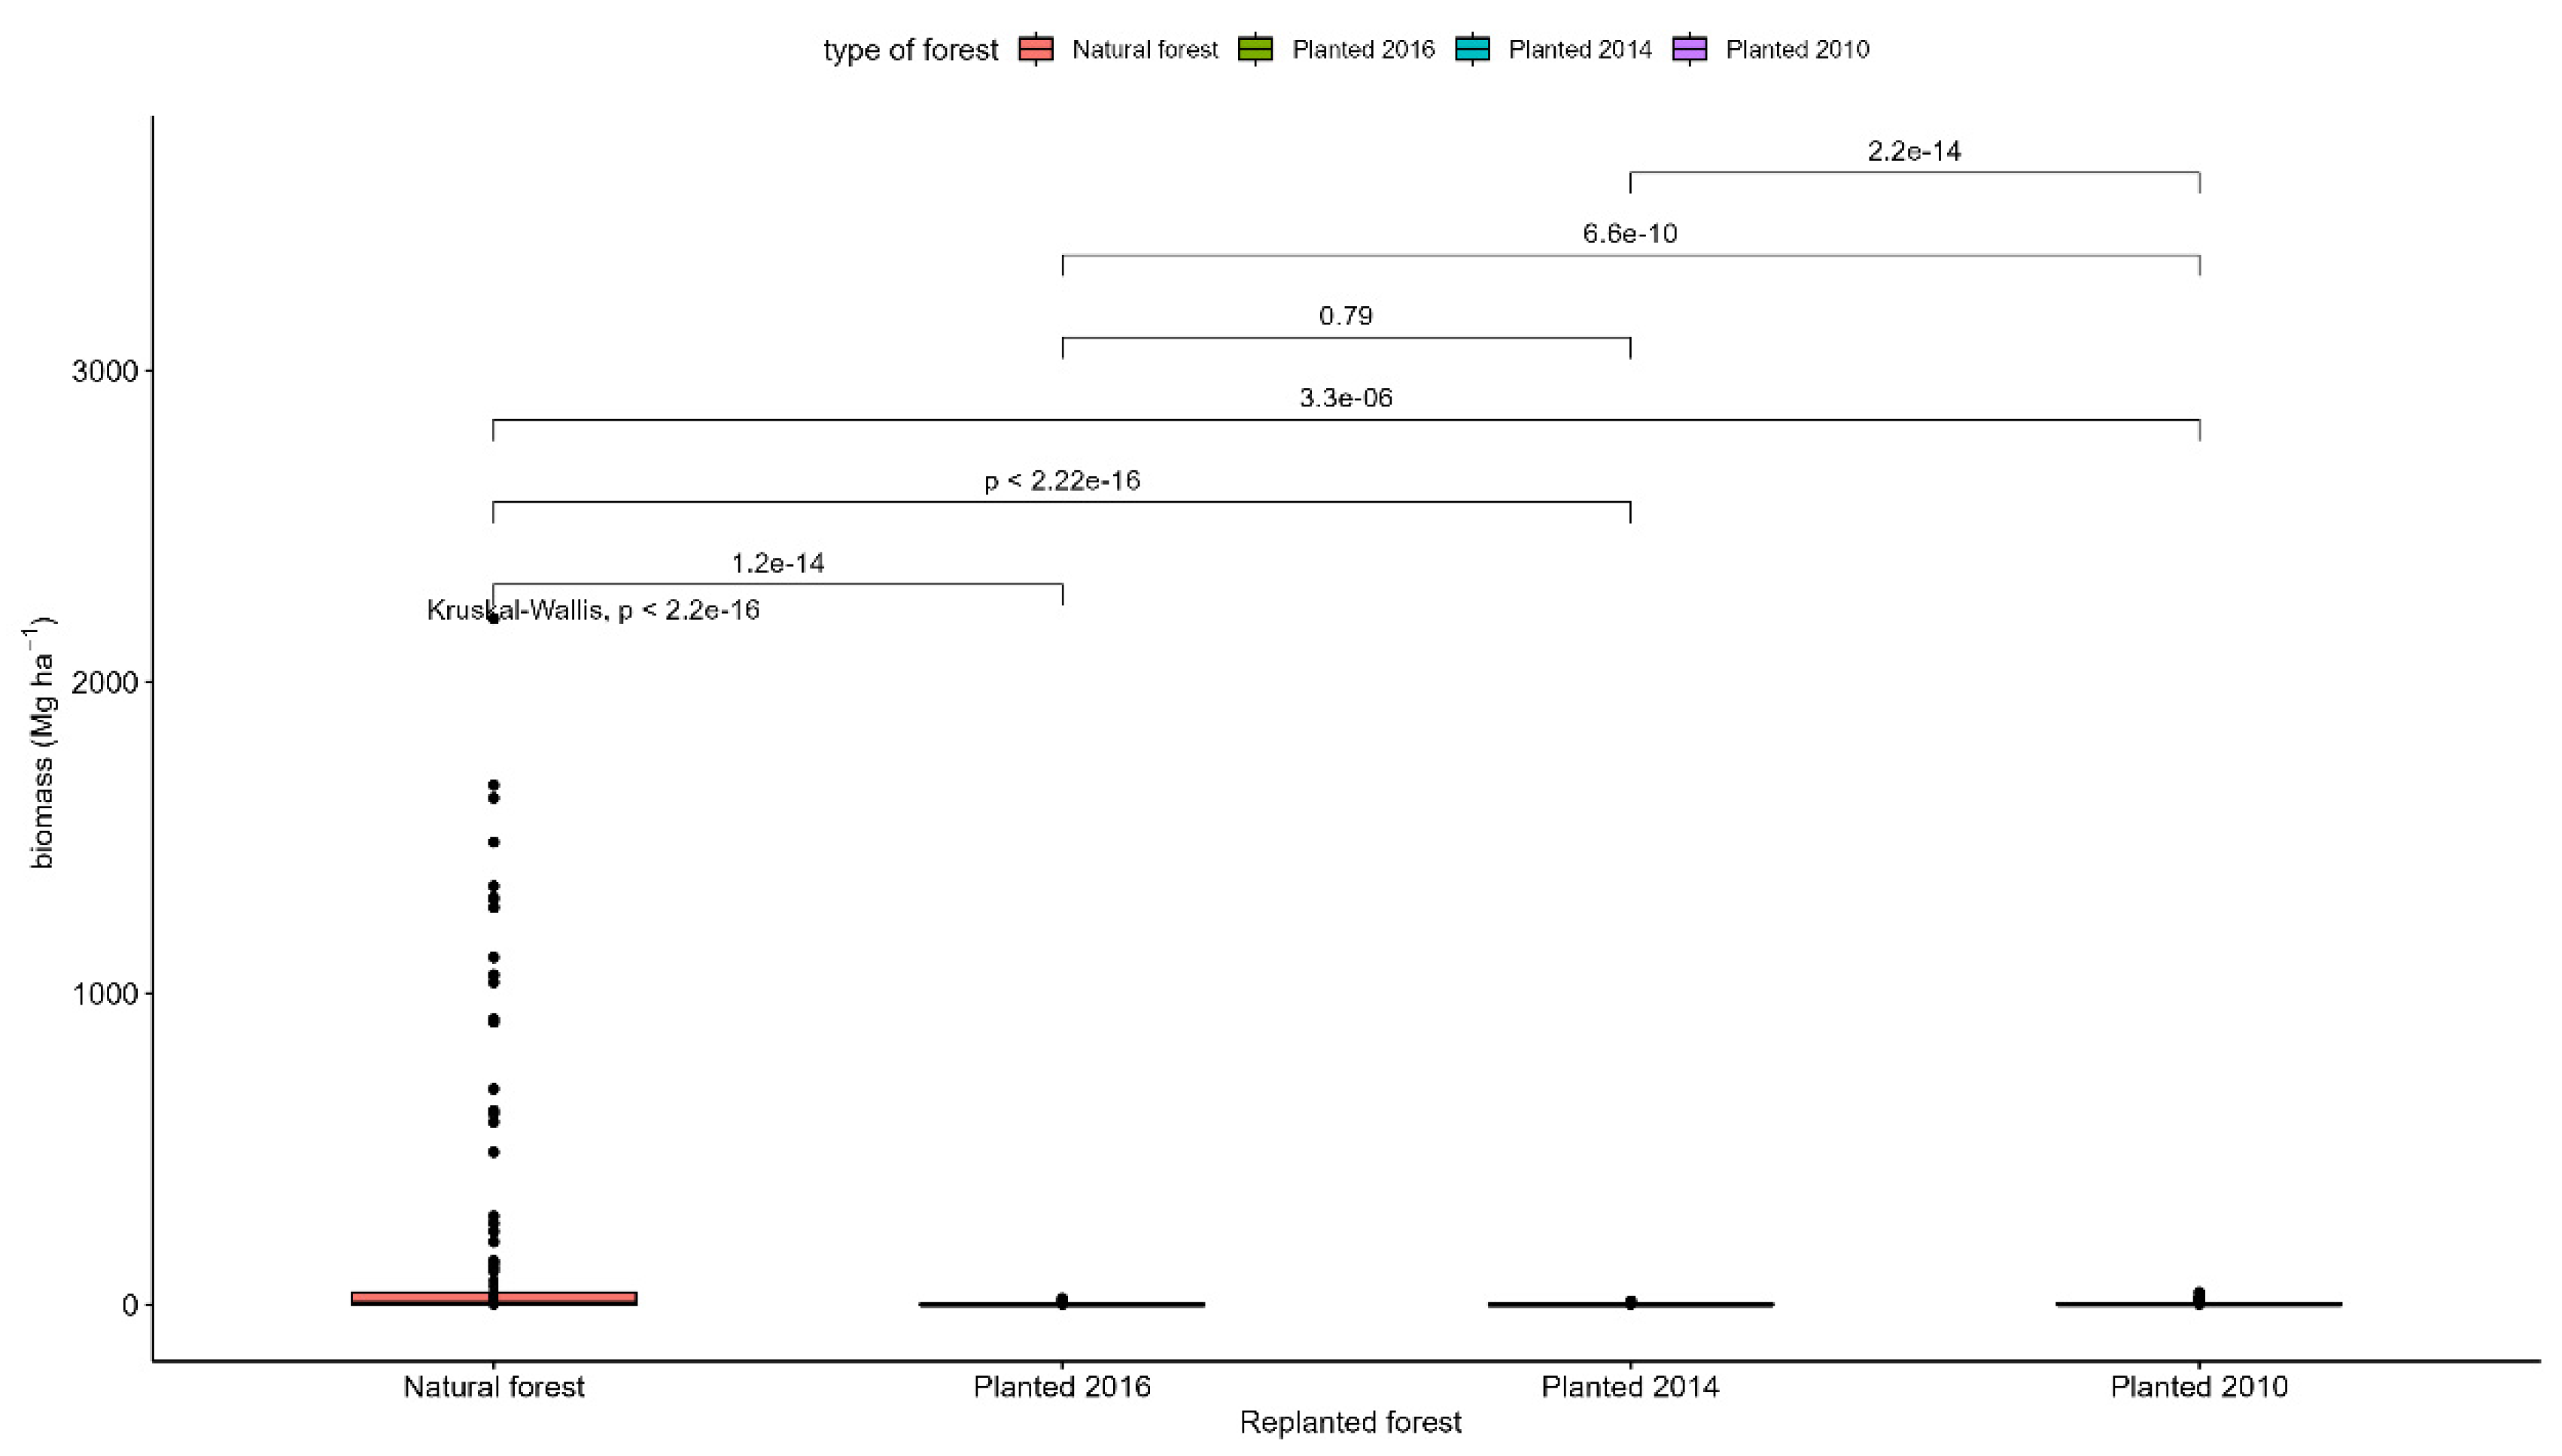
Figure A8.
Carbon variation as a function of sampling areas.
References
- Sachin O. Khairnar, B.V.S. and L.J. MANGROVE ECOSYSTEM - Its Threats and Conservation. Aqua find 2009, 1–6.
- Krauss, K.W.; Ball, M.C. On the halophytic nature of mangroves. Trees - Struct. Funct. 2013, 27, 7–11. [CrossRef]
- Alongi, D.M. Carbon sequestration in mangrove forests. Carbon Manag. 2012, 3, 313–322. [CrossRef]
- Kathiresan, K.; Bingham, B.L. Biology of mangroves and mangrove ecosystems. Adv. Mar. Biol. 2001, 40, 81–251. [CrossRef]
- Macamo, C.; Nicolau, D.; Machava, V.; Chitará, S.; ... A contribution to Mozambique’s biodiversity offsetting scheme: Framework to assess the ecological condition of mangrove forests. Biofund.Org.Mz 2021. Available from: https://www.biofund.org.mz/wp-content/uploads/2022/06/Mangrove-Metric-Final-Report--2021.pdf.
- Machava-António, V.; Bandeira, S.O.; Macamo, C.C.; Mahanzule, R. Value chain analysis of mangrove forests in central Mozambique: Uses, stakeholders and income. West. Indian Ocean J. Mar. Sci. 2020, 19, 1–17. [CrossRef]
- D.K. Nicolau, C.C. Macamo, S.O.Bandeira, A. Tajú, H.M. Mangrove change detection, structure and condition in a protected area of eastern Africa: the case of Quirimbas National Park, Mozambique. WIO J. Mar. Sci. 2017, 16(1): 47-60. [CrossRef]
- Vinh, T. Van; Marchand, C.; Linh, T.V.K.; Vinh, D.D.; Allenbach, M. Allometric models to estimate above-ground biomass and carbon stocks in Rhizophora apiculata tropical managed mangrove forests (Southern Viet Nam). For. Ecol. Manage. 2019, 434, 131–141. [CrossRef]
- Giri, C.; Ochieng, E.; Tieszen, L.L.; Zhu, Z.; Singh, A.; Loveland, T.; Masek, J.; Duke, N. Status and distribution of mangrove forests of the world using earth observation satellite data. Glob. Ecol. Biogeogr. 2011, 20, 154–159. [CrossRef]
- Donato, D.C.; Kauffman, J.B.; Murdiyarso, D.; Kurnianto, S.; Stidham, M.; Kanninen, M. Mangroves among the most carbon-rich forests in the tropics. Nat. Geosci. 2011, 4, 293–297. [CrossRef]
- WWF Mozambique Mangrove Mapping via Satellite from 1994-present. 2018, 16. [CrossRef]
- Fatoyinbo, T.; Simard, M. International Journal of Remote Height and biomass of mangroves in Africa from ICESat / GLAS and SRTM. Intergov. Panel Clim. Chang. 2013, 37–41.
- Chevallier, R. Balancing Development and Coastal Conservation : Mangroves in Mozambique; ISBN 9781919969831.
- Bandeira, S.; Balidy, H. Limpopo Estuary Mangrove Transformation, Rehabilitation and Management. 2016, 227–237. [CrossRef]
- Monga, E.; Mangora, M.M.; Trettin, C.C. Impact of mangrove planting on forest biomass carbon and other structural attributes in the Rufiji Delta, Tanzania. Glob. Ecol. Conserv. 2022, 35, e02100. [CrossRef]
- Kairo, J.G.; Lang’at, J.K.S.; Dahdouh-Guebas, F.; Bosire, J.; Karachi, M. Structural development and productivity of replanted mangrove plantations in Kenya. For. Ecol. Manage. 2008, 255, 2670–2677. [CrossRef]
- [Anonymous] Blue future: Coastal wetlands can have a crucial role in the fight against climate change. Nature 2016, 529, 255–256. [CrossRef]
- Luo, Z.; Sun, O.J.; Xu, H. A comparison of species composition and stand structure between planted and natural mangrove forests in Shenzhen Bay, South China. J. Plant Ecol. 2010, 3, 165–174. [CrossRef]
- Alongi, D.M. Impacts of Climate Change on Blue Carbon Stocks and Fluxes in Mangrove Forests. Forests 2022, 13, 149. [CrossRef]
- Quiros, T.E.A.L.; Sudo, K.; Ramilo, R. V.; Garay, H.G.; Soniega, M.P.G.; Baloloy, A.; Blanco, A.; Tamondong, A.; Nadaoka, K.; Nakaoka, M. Blue Carbon Ecosystem Services Through a Vulnerability Lens: Opportunities to Reduce Social Vulnerability in Fishing Communities. Front. Mar. Sci. 2021, 8. [CrossRef]
- Ministério da Administração estatal Minist é rio da Administra ç ão Estatal PERFIL DO DISTRITO DE PEMBA PROV Í NCIA DE CABO DELGADO Edição 2005. 2005, 1–54.
- Balidy, H.J.; Mahumane, C.E. Posto Administrativo de Zongoene: Situação Socioeconómica e Biofísica. 2008, 1, 52. Available from: https://silo.tips/downloadFile/posto-administrativo-de-zongoene.
- Stringer, C.E.; Trettin, C.C.; Zarnoch, S.J.; Tang, W. Carbon stocks of mangroves within the Zambezi River Delta, Mozambique. For. Ecol. Manage. 2015, 354, 139–148. [CrossRef]
- Bandeira, S.O.; Macamo, C.C.F.; Kairo, J.G.; Amade, F.; Jiddawi, N.; Paula, J. Evaluation of mangrove structure and condition in two trans-boundary areas in the Western Indian Ocean. Aquat. Conserv. Mar. Freshw. Ecosyst. 2009, 19, S46–S55. [CrossRef]
- Bundotich, G.; Karachi, M.; Fondo, E.; Kairo, J.G. Structural inventory of mangrove forests in Ngomeni. Adv. Coast. Ecol. people, Process. Ecosyst. Kenya. 2009, 111–121. Available from: https://www.oceandocs.org/bitstream/handle/1834/8315/ASC-1253933-16.pdf?sequence=2&isAllowed=y.
- Paper, W. Protocols for the measurement, monitoring and reporting of structure, biomass and carbon stocks in mangrove forests.
- Komiyama, A.; Ong, J.E.; Poungparn, S. Allometry, biomass, and productivity of mangrove forests: A review. Aquat. Bot. 2008, 89, 128–137. [CrossRef]
- Chave, J.; Andalo, C.; Brown, S.; Cairns, M.A.; Chambers, J.Q.; Eamus, D.; Fölster, H.; Fromard, F.; Higuchi, N.; Kira, T.; et al. Tree allometry and improved estimation of carbon stocks and balance in tropical forests. Oecologia 2005, 145, 87–99. [CrossRef]
- Kauffman, J.B.; Cole, T.G. Micronesian mangrove forest structure and tree responses to a severe typhoon. Wetlands 2010, 30, 1077–1084. [CrossRef]
- Comley, B.W.T.; McGuinness, K.A. Above- and below-ground biomass, and allometry, of four common northern Australian mangroves. Aust. J. Bot. 2005, 53, 431–436. [CrossRef]
- Clough, B.F.; Scott, K. Allometric relationships for estimating above-ground biomass in six mangrove species. For. Ecol. Manage. 1989, 27, 117–127. [CrossRef]
- IPPC Guidelines for National Greenhouse Gas Inventories: Wetlands. Intergov. Panel Clim. Chang. 2006, 3, 56–74.
- Handbook, F. Components of Forest GrowtW. 1955, 22–25.
- S. Bandeira, J.P. The Maputo Bay Ecosystem. West. Indian Ocean Mar. Sci. Assoc. 2014, 427.
- da Silva, N.R.; Maiab, R.C. Evaluation of the growth and survival of mangrove seedlings under different light intensities: Simulating the effect of mangrove deforestation. Rev. Arvore 2019, 43, 1–11. [CrossRef]
- Langat, S.K. REUSE OF SAMPLES : ETHICAL ISSUES ENCOUNTERED BY TWO INSTITUTIONAL ETHICS REVIEW COMMITTEES IN KENYA 1. 2005, 19. [CrossRef]
- Sumida, A. The diameter growth-height growth relationship as related to the diameter-height relationship. Tree Physiol. 2015, 35, 1031–1034. [CrossRef]
- Mugasha, W.A.; Eid, T.; Bollandsås, O.M.; Malimbwi, R.E.; Chamshama, S.A.O.; Zahabu, E.; Katani, J.Z. Allometric models for prediction of above- and belowground biomass of trees in the miombo woodlands of Tanzania. For. Ecol. Manage. 2013, 310, 87–101. [CrossRef]
- Macamo, C. da C.F.; Adams, J.B.; Bandeira, S.O.; Mabilana, H.A.; António, V.M. Spatial Dynamics and Structure of Human Disturbed Mangrove Forests in Contrasting Coastal Communities in Eastern Africa. Wetlands 2018, 38, 509–523. [CrossRef]
- Uebas, F.D.A.; Athenge, C.M.; Airo, J.G.K.; Oedam, N.K. U Tilization of M Angrove W Ood P Roducts Around M Ida C Reek ( K Enya ) a Mongst S Ubsistence and C Ommercial. 2000, 54, 513–527. [CrossRef]
- Taylor, M.; Ravilious, C.; Green, E.P. Mangroves of east Africa. UNEP World Conserv. Monit. Cent. 2000, 1–24.
- Kairo, J.G.; Dahdouh-Guebas, F.; Bosire, J.; Koedam, N. Restoration and management of mangrove systems - A lesson for and from the East African region. South African J. Bot. 2001, 67, 383–389. [CrossRef]
- J.K.S. Lang’at, J.G.K. Conservation and management of mangrove forests in Kenya. Kenya Mar. Fish. Res. Inst. 2013, 1–7.
- Kairo, J.G.; Dahdouh-Guebas, F.; Gwada, P.O.; Ochieng, C.; Koedam, N. Regeneration status of mangrove forests in Mida Creek, Kenya: A compromised or secured future? Ambio 2002, 31, 562–568. [CrossRef]
- Machava-ant, V.; Fernando, A.; Cravo, M.; Massingue, M.; Lima, H.; Macamo, C.; Paula, J. A Comparison of Mangrove Forest Structure and Ecosystem Services in Maputo Bay ( Eastern Africa ) and Pr í ncipe Island ( Western Africa ). 2022, 1–21. [CrossRef]
- Bosire, J.O.; Dahdouh-Guebas, F.; Kairo, J.G.; Wartel, S.; Kazungu, J.; Koedam, N. Success rates of recruited tree species and their contribution to the structural development of reforested mangrove stands. Mar. Ecol. Prog. Ser. 2006, 325, 85–91. [CrossRef]
- Sitoe, A.A.; Mandlate, L.J.C.; Guedes, B.S. Biomass and carbon stocks of Sofala Bay mangrove forests. Forests 2014, 5, 1967–1981. [CrossRef]
- Magalhães, T.M. Carbon Storage in Secondary Mangroves along the West Coastline of Maputo City, Mozambique. Wetlands 2019, 39, 239–249. [CrossRef]
- Adame, M.F.; Kauffman, J.B.; Medina, I.; Gamboa, J.N.; Torres, O.; Caamal, J.P.; Reza, M.; Herrera-Silveira, J.A. Carbon Stocks of Tropical Coastal Wetlands within the Karstic Landscape of the Mexican Caribbean. PLoS One 2013, 8, e56569. [CrossRef]
- Amelia, R.; Basyuni, M.; Alfinsyahri, A.; Sulistiyono, N.; Slamet, B.; Bimantara, Y.; Harahap, S.S.H.; Harahap, M.; Harahap, I.M.; Al Mustaniroh, S.S.; et al. Evaluation of Plant Growth and Potential of Carbon Storage in the Restored Mangrove of an Abandoned Pond in Lubuk Kertang, North Sumatra, Indonesia. Forests 2023, 14. [CrossRef]
- Jones, T.G.; Ratsimba, H.R.; Ravaoarinorotsihoarana, L.; Cripps, G.; Bey, A. Ecological segregation of the late jurassic stegosaurian and iguanodontian dinosaurs of the morrison formation in north america: Pronounced or subtle? Forests 2014, 5, 177–205. [CrossRef]
- Kauffman, J.B.; Heider, C.; Cole, T.G.; Dwire, K.A.; Donato, D.C. Ecosystem carbon stocks of micronesian mangrove forests. Wetlands 2011, 31, 343–352. [CrossRef]
- Murdiyarso, D.; Donato, D.; Kauffman, J.B.; Kurnianto, S.; Stidham, M.; Kanninen, M. Carbon storage in mangrove and peatland ecosystems. CIFOR Work. Pap. 2010, 1–40. [CrossRef]
- Sahu, S.C.; Kumar, M.; Ravindranath, N.H. Carbon stocks in natural and planted mangrove forests of Mahanadi Mangrove Wetland, East Coast of India. Curr. Sci. 2016, 110, 2253–2260. [CrossRef]
- Saintilan, N.; Wilson, N.C.; Rogers, K.; Rajkaran, A.; Krauss, K.W. Mangrove expansion and salt marsh decline at mangrove poleward limits. Glob. Chang. Biol. 2014, 20, 147–157. [CrossRef]
- J. Bosire, S. Bandeira, J.R. Coastal Climate Chan Change Ge Mitigation and Adaptation Through R Mangroves Ves in Mozambique :Pilot in the Zambezi Delta. Determination of carbon stocks through localized allometric equations component. 2012, 27.
- Kauffman, J.B.; Heider, C.; Norfolk, J.; Payton, F. Carbon stocks of intact mangroves and carbon emissions arising from their conversion in the Dominican Republic. Ecol. Appl. 2014, 24, 518–527. [CrossRef]
- Murdiyarso, D.; Purbopuspito, J.; Kauffman, J.B.; Warren, M.W.; Sasmito, S.D.; Donato, D.C.; Manuri, S.; Krisnawati, H.; Taberima, S.; Kurnianto, S. The potential of Indonesian mangrove forests for global climate change mitigation. Nat. Clim. Chang. 2015, 5, 1089–1092. [CrossRef]
- Savari, A.; Khaleghi, M.; Safahieh, A.R.; Hamidian Pour, M.; Ghaemmaghami, S. Estimation of biomass, carbon stocks and soil sequestration of Gowatr mangrove forests, Gulf of Oman. Iran. J. Fish. Sci. 2020, 19, 1657–1680. [CrossRef]
- Salmo Iii, S.G.; Lois, E.; Gianan, D. Post-disturbance carbon stocks and rates of sequestration: Implications on “blue carbon” estimates in Philippine mangroves. Philipp Sci Lett. 2019, 12, 122.
Figure 1.
Map of the Limpopo Estuary showing the study area.
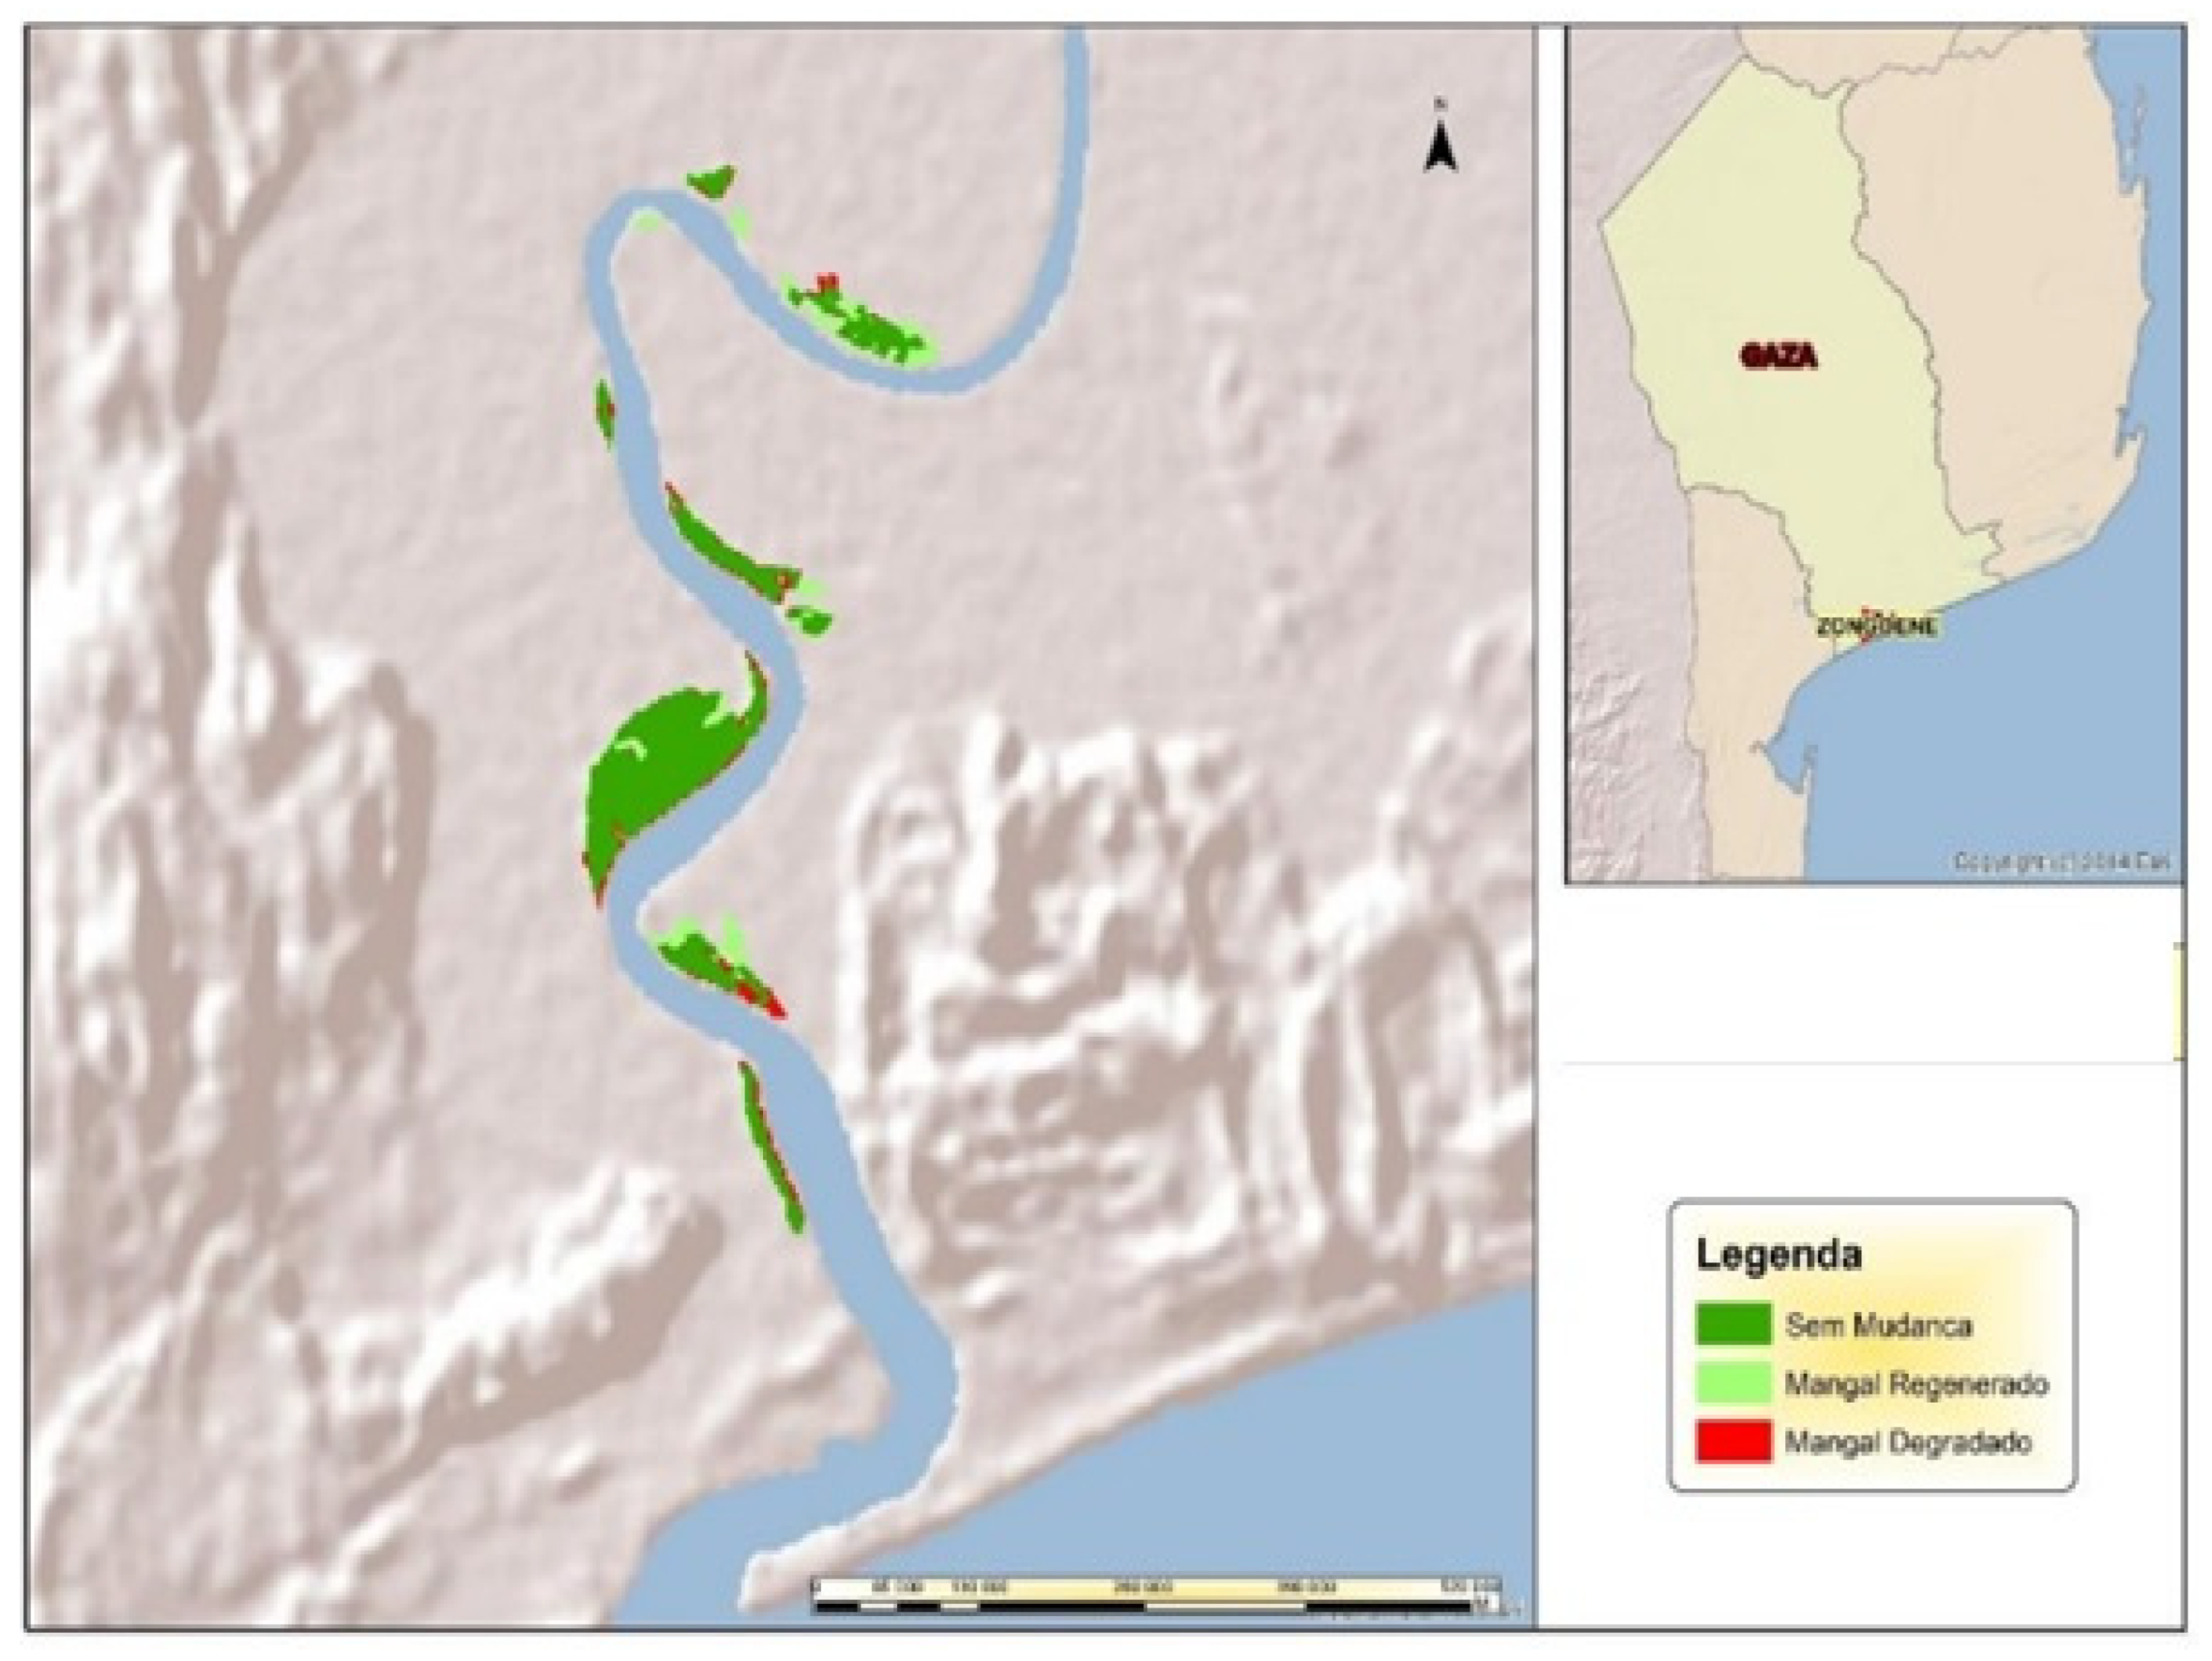
Figure 2.
Relationship between height and diameter for the species Avicennia marina in the study areas.
Figure 2.
Relationship between height and diameter for the species Avicennia marina in the study areas.
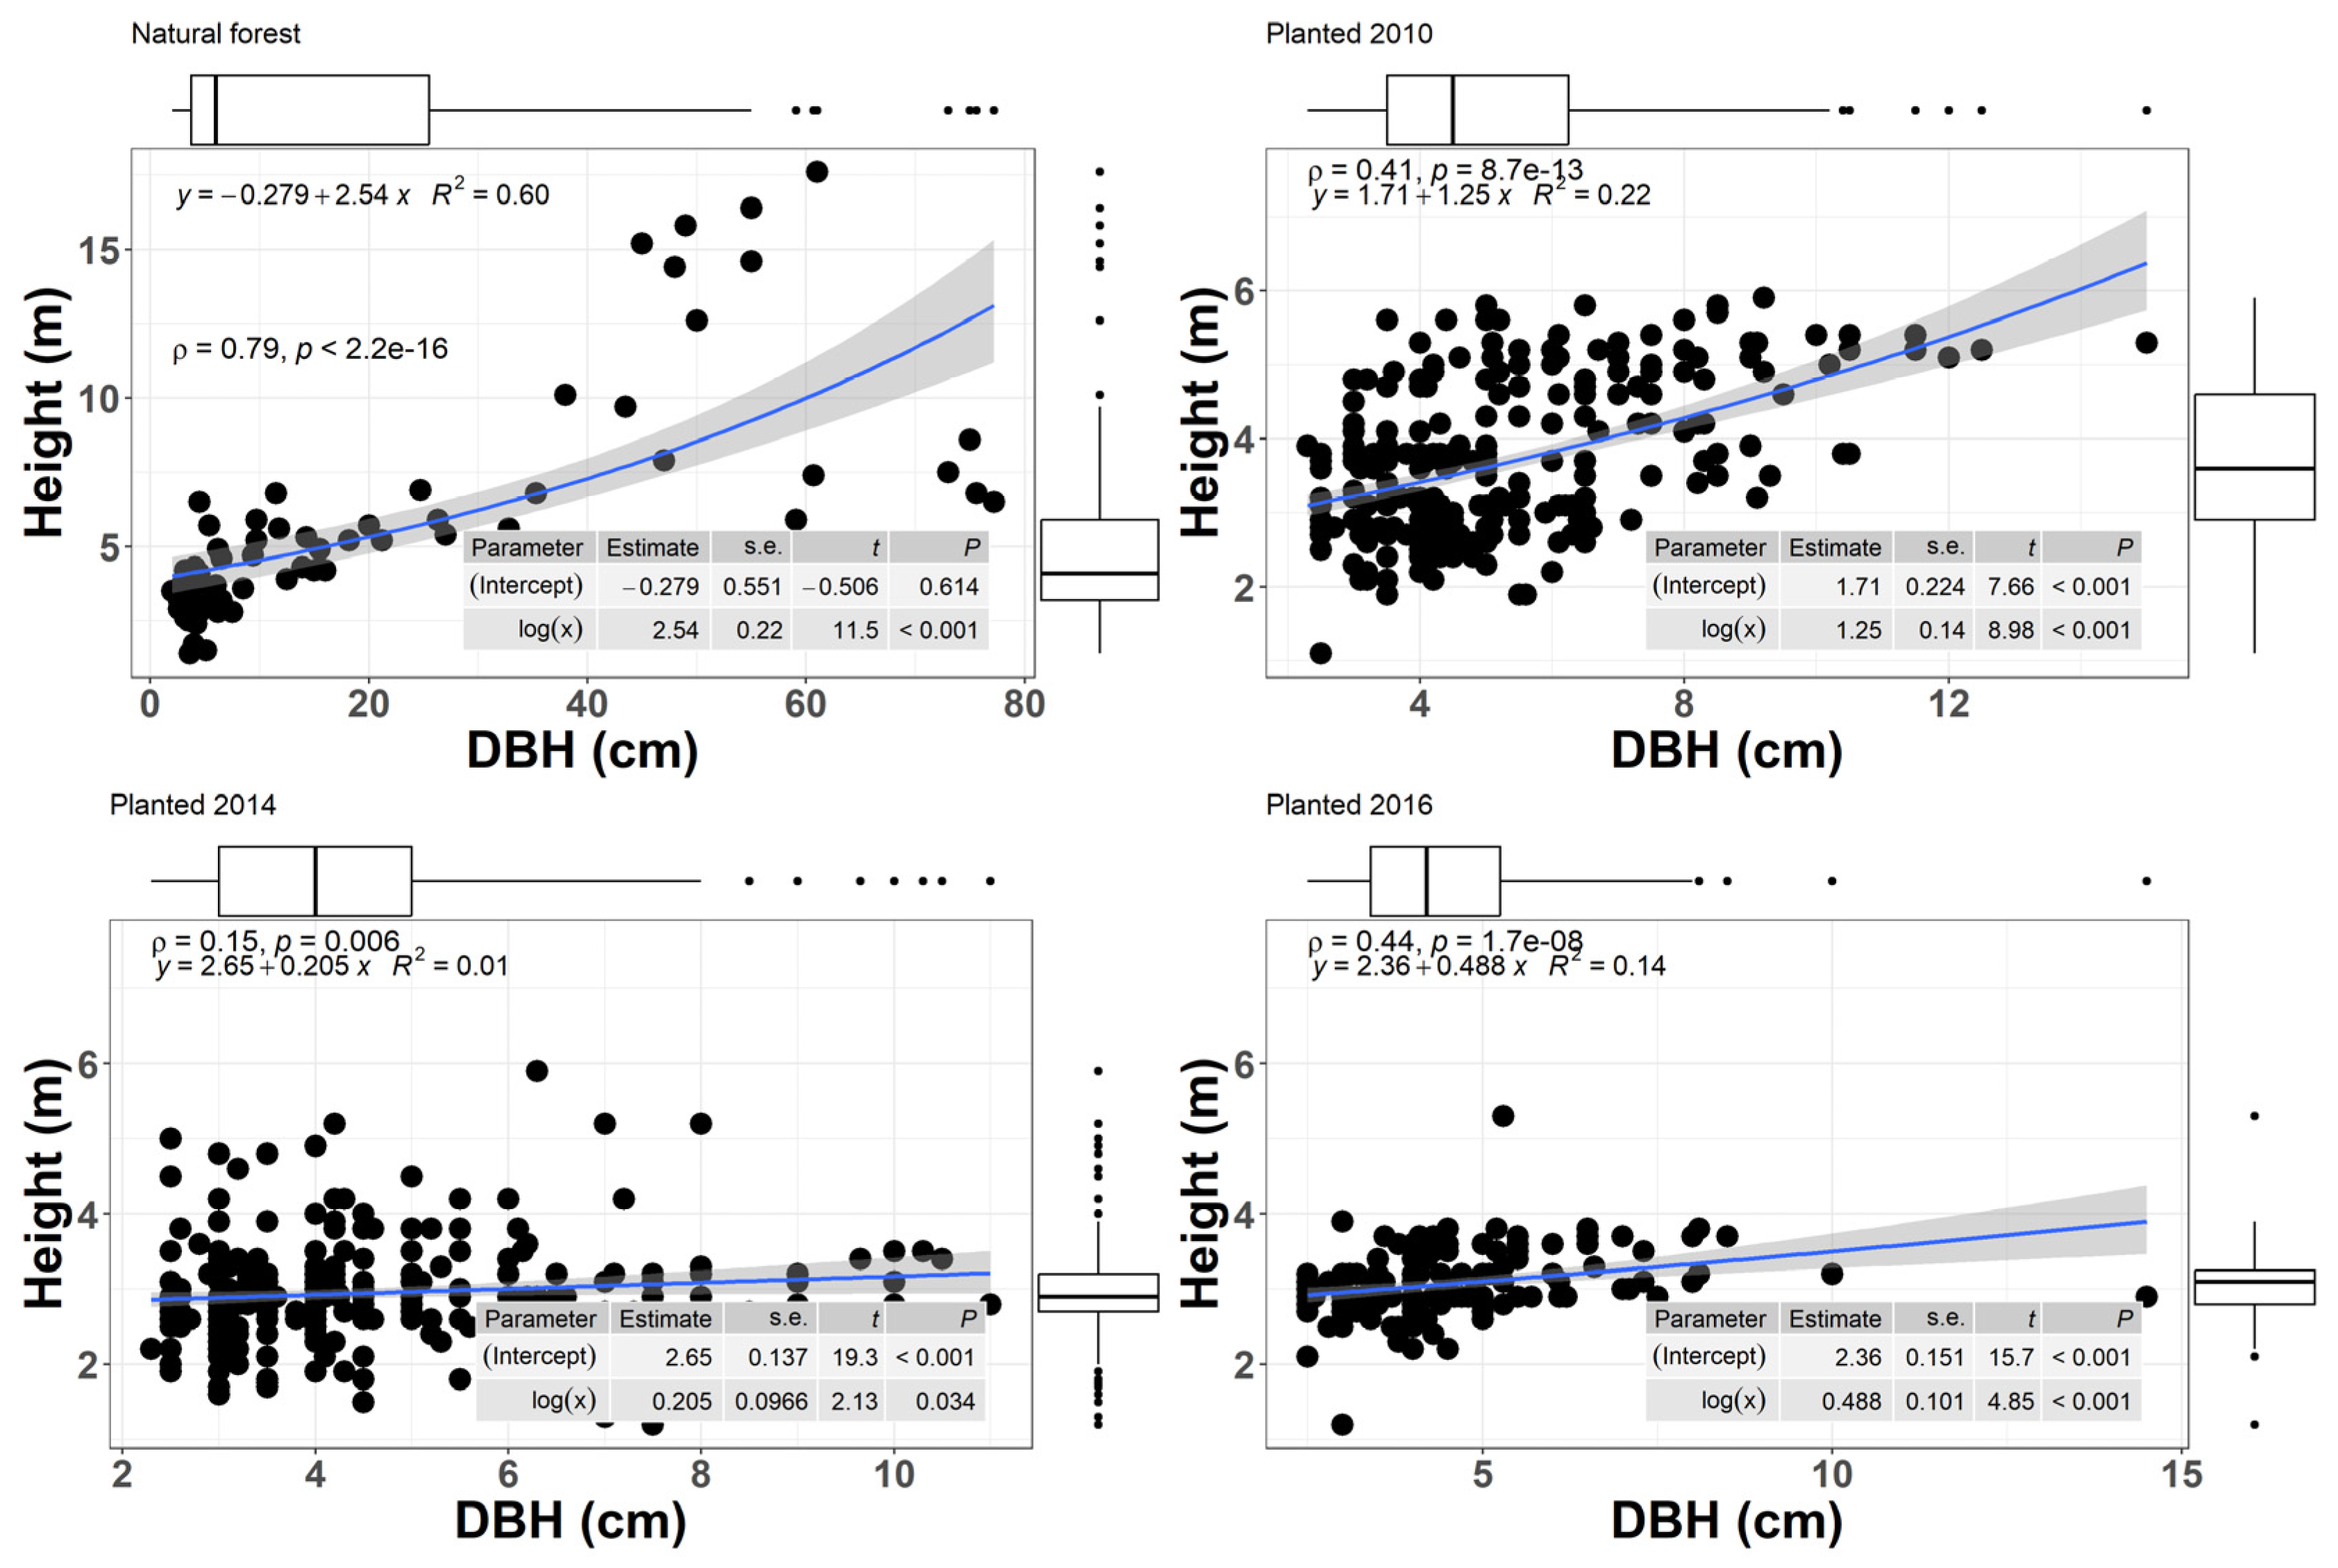
Figure 3.
Density (trees/ha) of trees at different cutting levels.
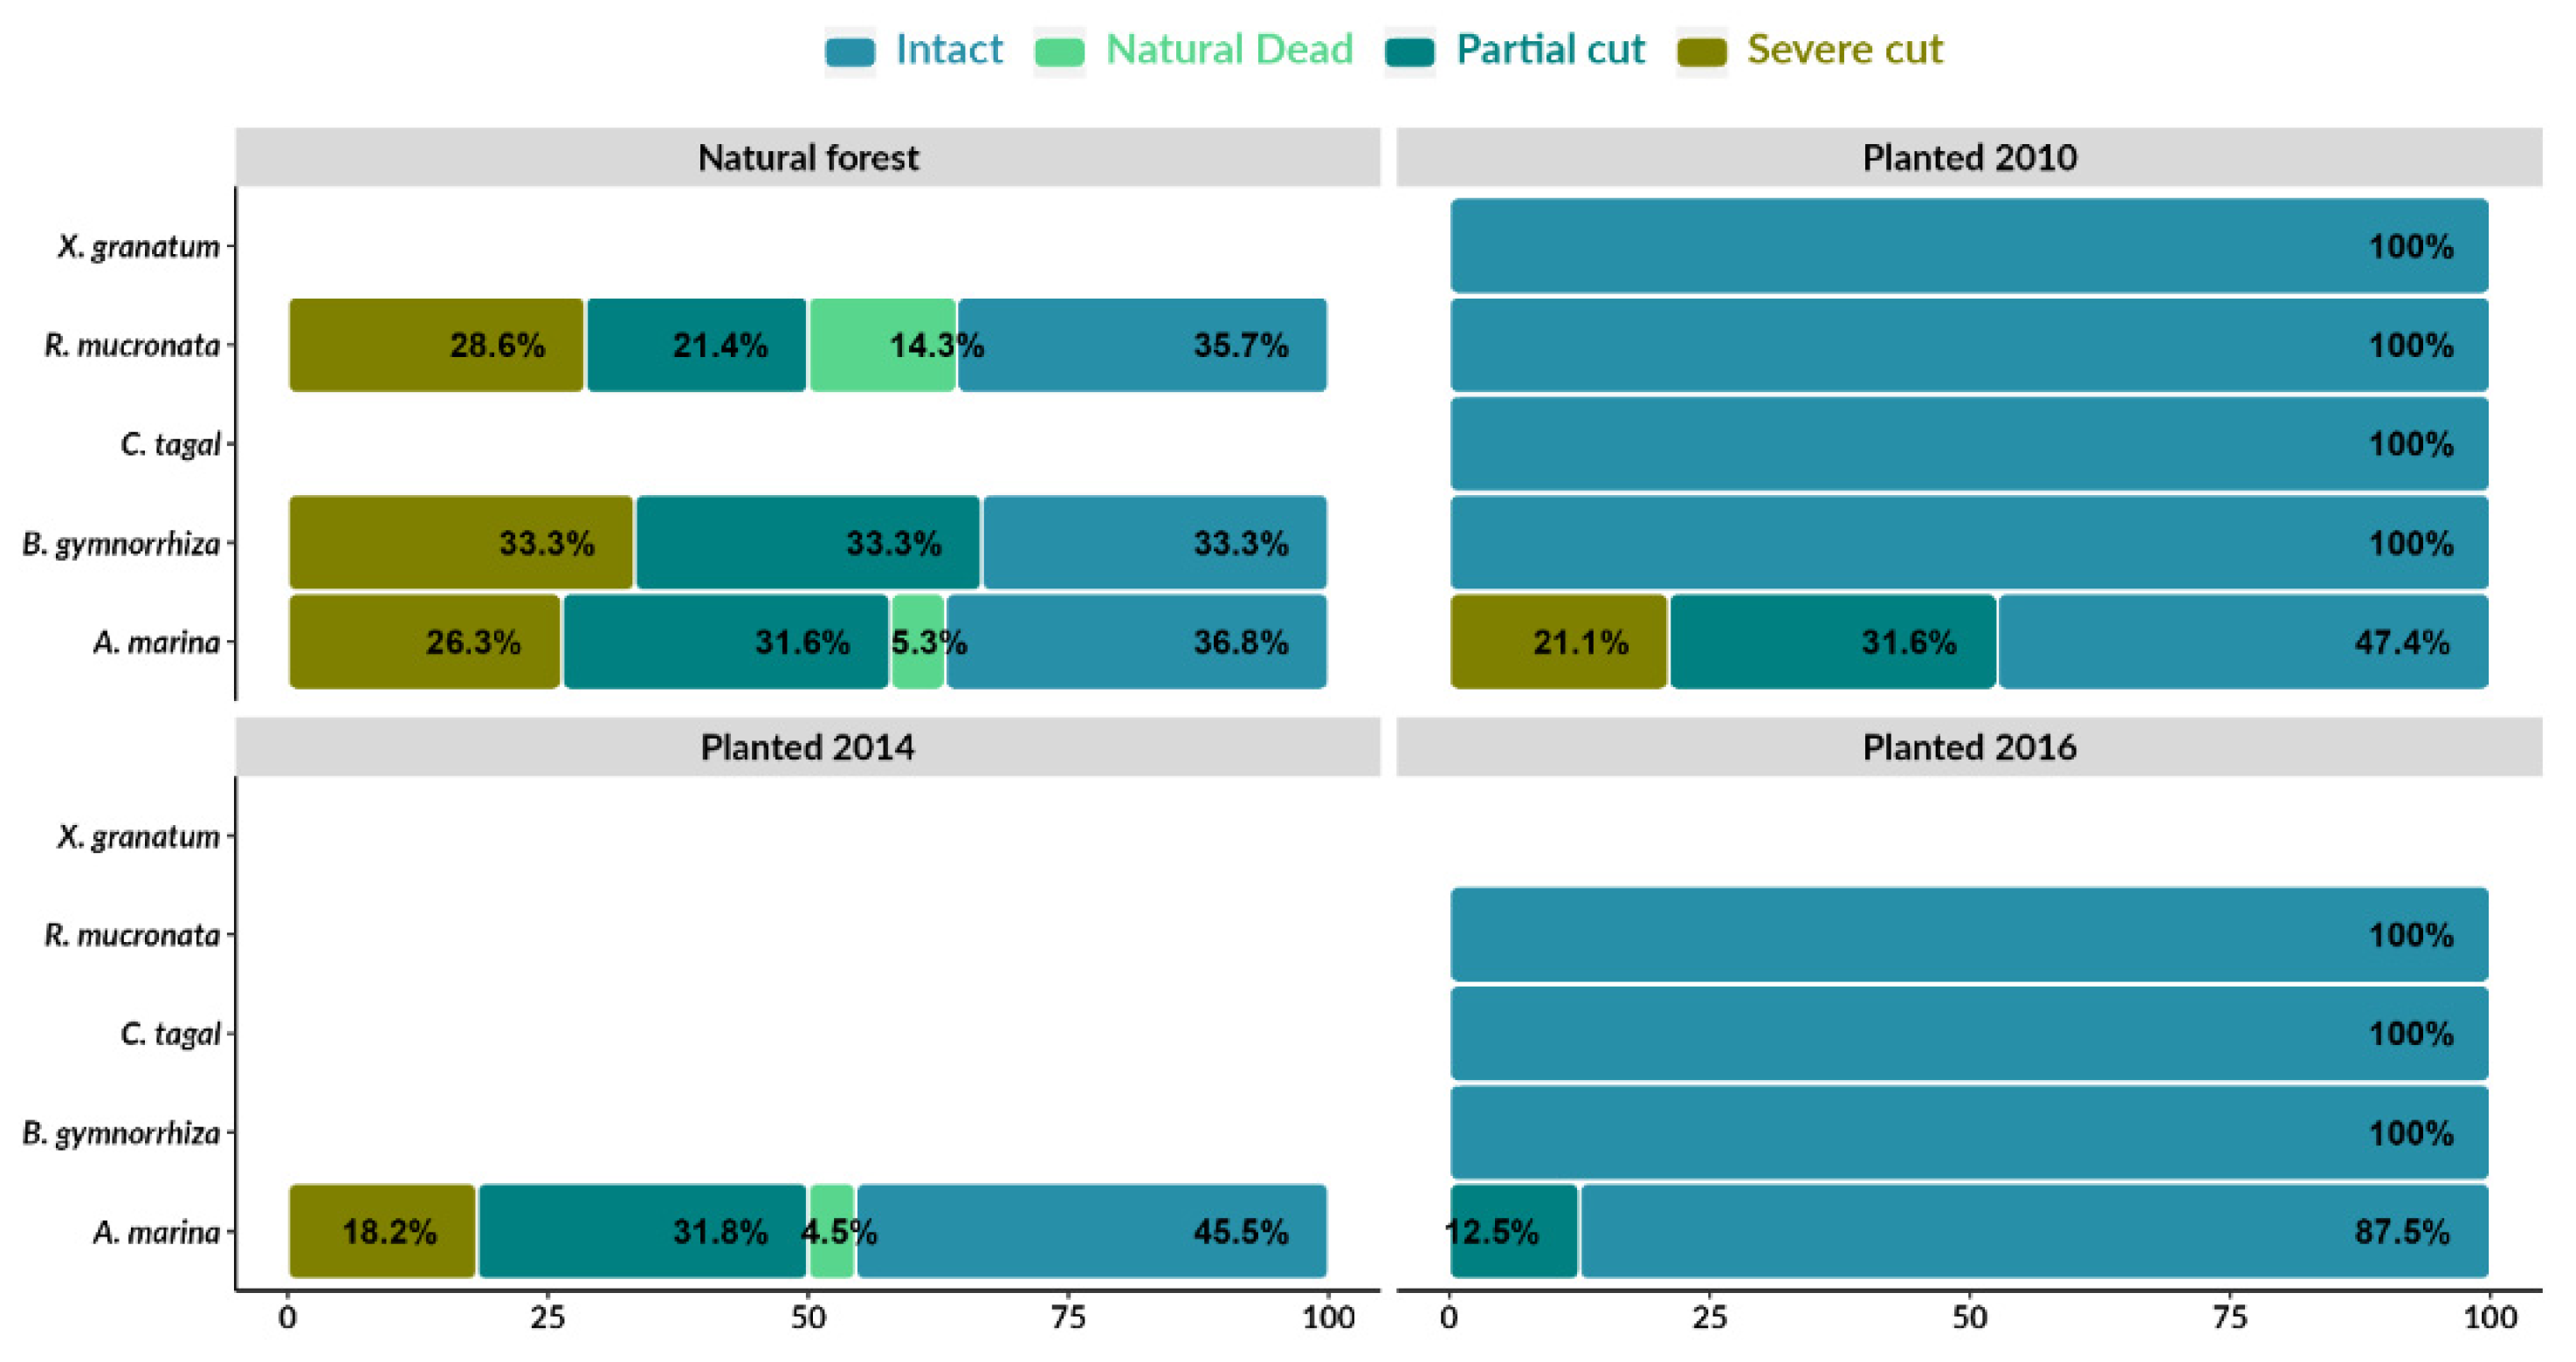
Figure 4.
Density (trees/ha) of trees and quality of cuttings in natural and replanted forests.
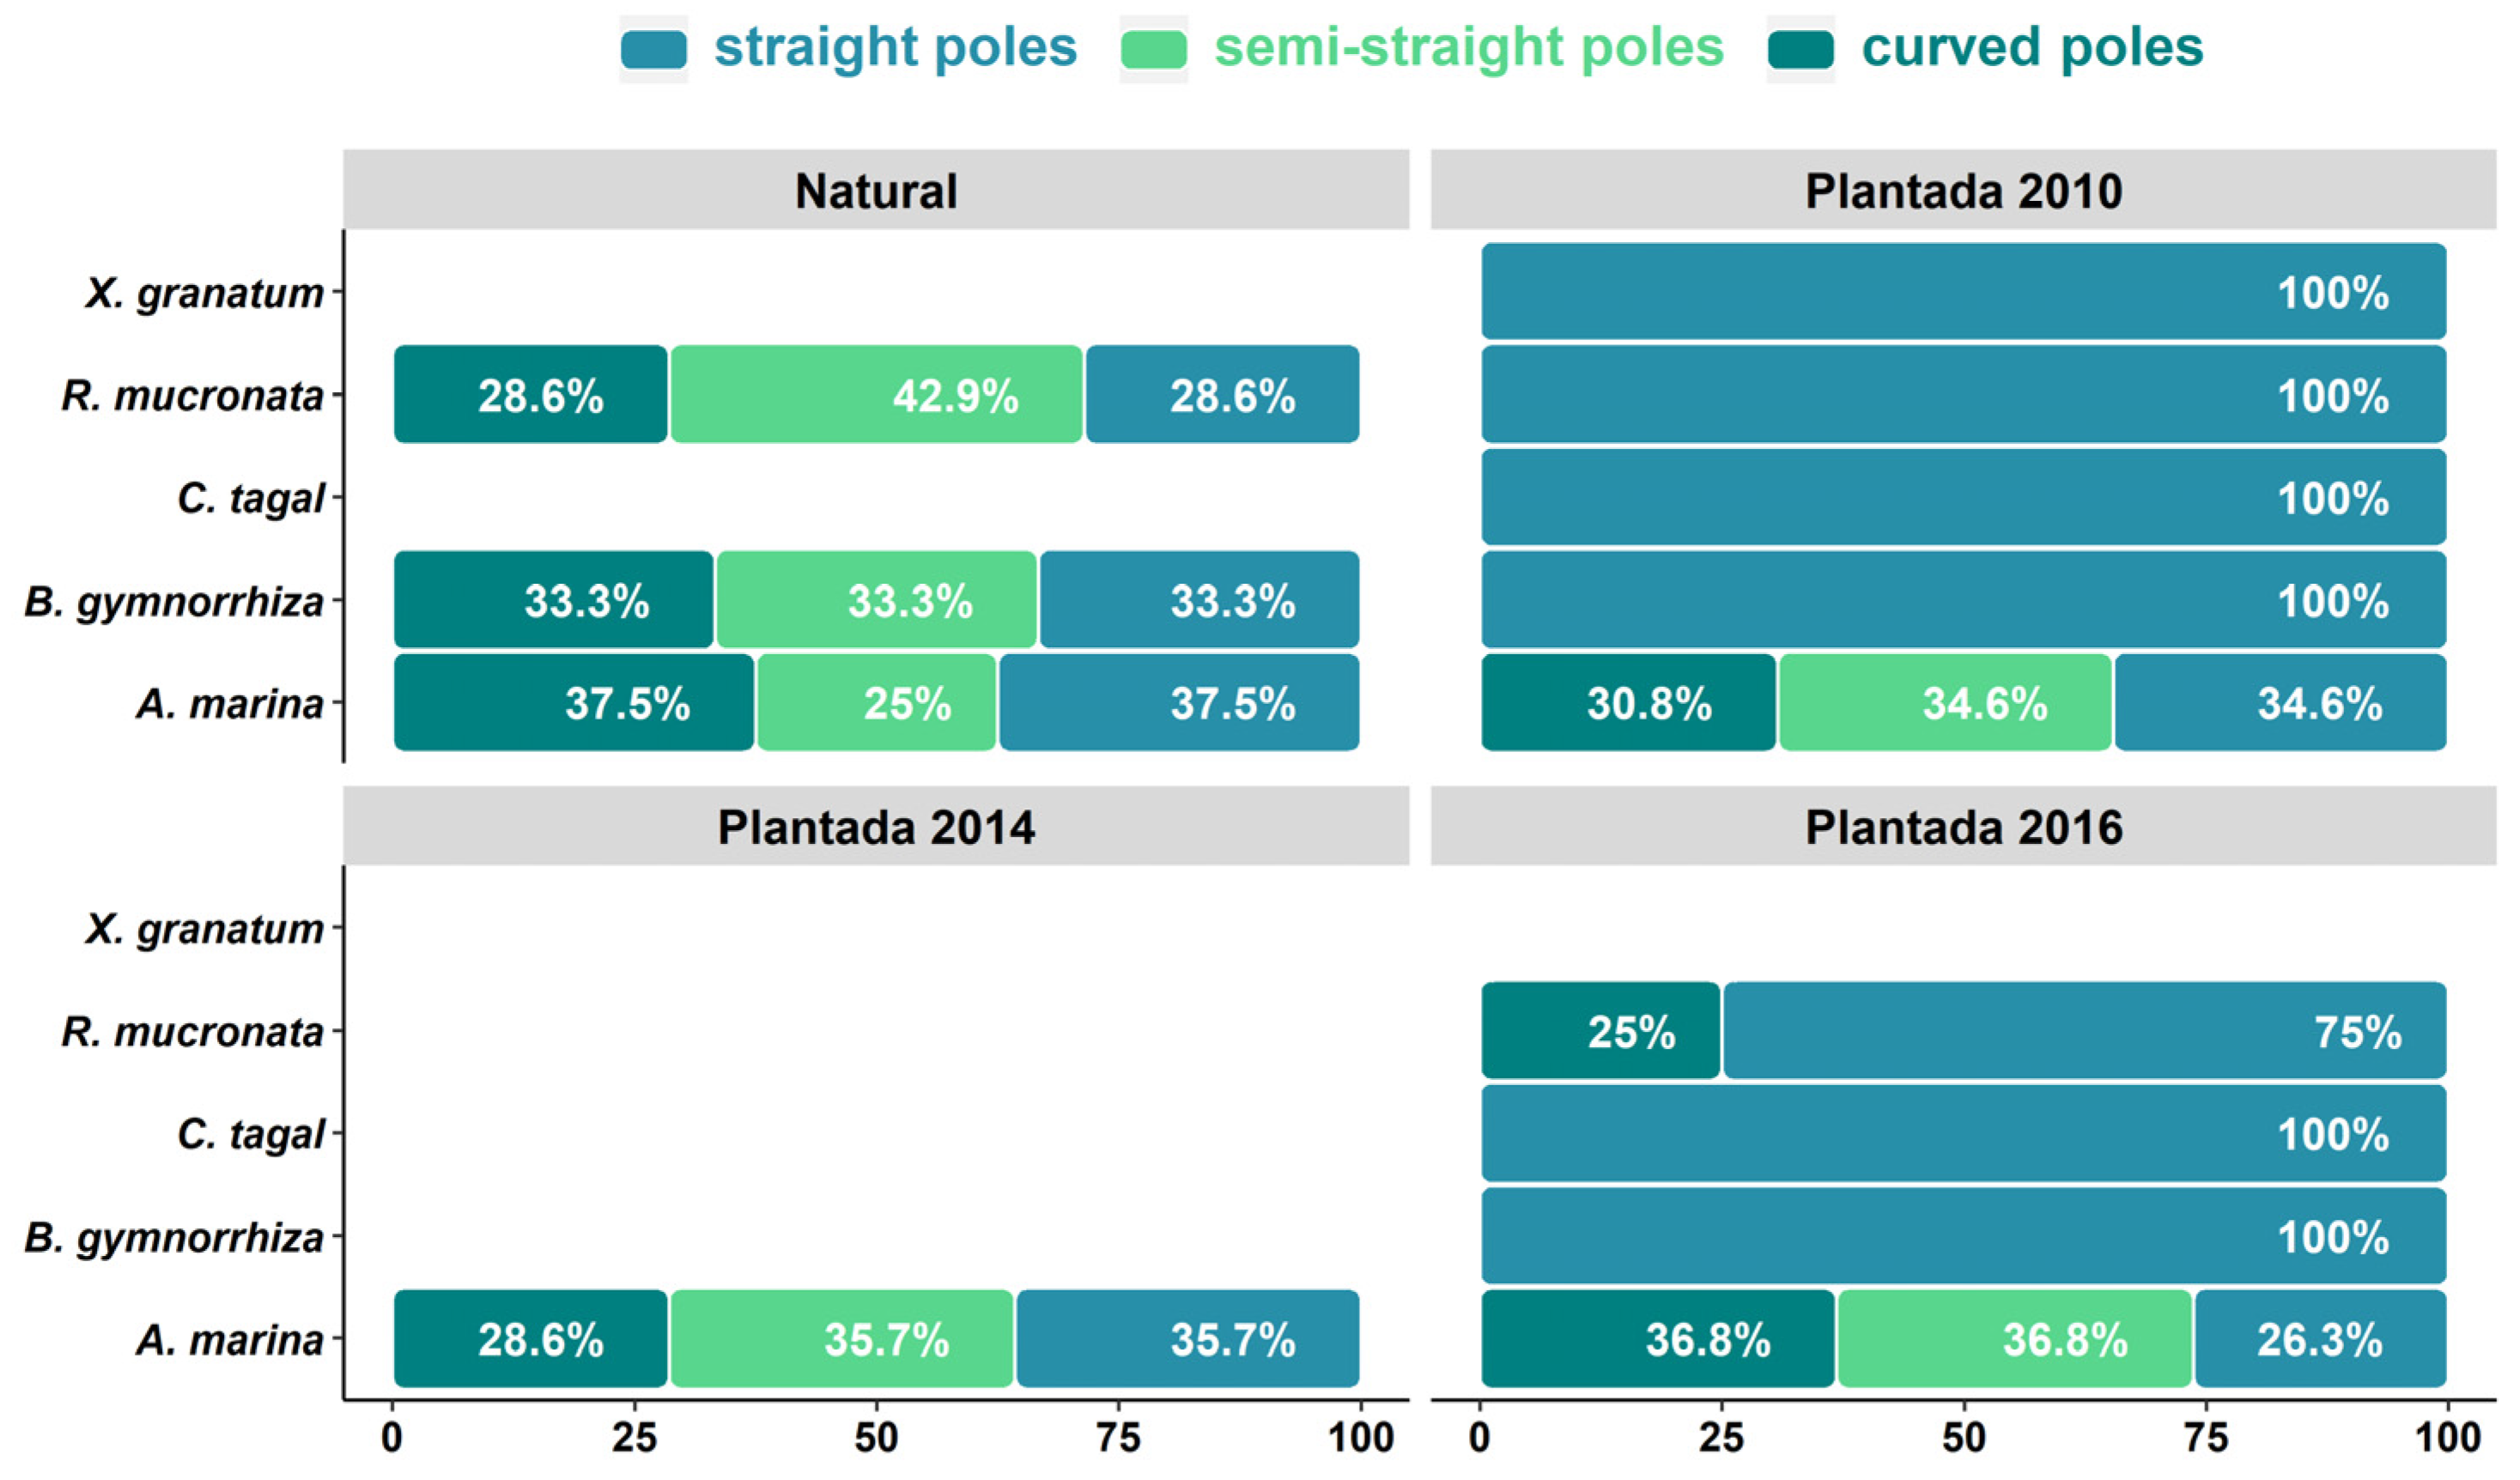
Table 1.
Relative values of frequency, density, dominance and importance value index (IV) for species recorded in natural and replanted forest in different years.
Table 1.
Relative values of frequency, density, dominance and importance value index (IV) for species recorded in natural and replanted forest in different years.
| Species | ||||||
| Type of forest | Relative values | A.marina | R.mucronata | B.gymnorhiza | C. tagal | X.granatum |
| Natural forest | Frequency | 60 | 33.3 | 6.7 | - | - |
| Density | 58 | 34.4 | 7.6 | - | - | |
| Dominance | 83.7 | 15 | 1.3 | - | - | |
| IV | 201.7 | 82.7 | 15.6 | - | - | |
| Planted forest 2016 |
Frequency | 46.7 | 26.7 | 6.7 | 20 | - |
| Density | 72.9 | 19.8 | 1.4 | 5.8 | - | |
| Dominance | 82.5 | 8.7 | 1.5 | 7.3 | - | |
| IV | 202.1 | 55.2 | 9.6 | 33.1 | - | |
| Planted forest 2014 |
Frequency | 100 | - | - | - | - |
| Density | 100 | - | - | - | - | |
| Dominance | 100 | - | - | - | - | |
| IV | 300 | - | - | - | - | |
| Planted forest 2010 |
Frequency | 50 | 16.7 | 11.1 | 16.7 | 5.6 |
| Density | 77.1 | 15 | 4.4 | 3 | 0.5 | |
| Dominance | 83.2 | 11.5 | 2.6 | 2.4 | 0.3 | |
| IV | 210.3 | 43.2 | 18.1 | 22.1 | 6.4 | |
Table 2.
Structural attributes of mangroves in the study sites (average values). SD- Standard desviation.
Table 2.
Structural attributes of mangroves in the study sites (average values). SD- Standard desviation.
| Type of forest | Species | Height ±SD | DBH ± SD | Basal area ±SD | Density ±SD | Complexity index |
| Natural |
A. marina (91) B. gymnorrhiza (12) R. mucronata (54) Average (52.3) |
5.4±3.7 3.6±0.5 4.2±1.6 4.4±1.9 |
18.1±21.5 8.8±3.9 9.6±12.1 12.2±12.5 |
5.6±0.1 0.1±0.01 1±0.1 2.2±0.07 |
114 ± 84 120 ± 120 90 ± 75 108±93 |
3.140 0.004 0.203 1.111 |
| Planted 2016 |
A. marina (151) B. gymnorrhiza (3) C. tagal (12) R. mucronata (41) Average (51.7) |
3.1 ± 0.5 2.0 ± 0.6 1.9 ± 1.1 2.0 ± 0.3 2.6± 0.6 |
4.6±1.7 4.7±0.4 4.9±1.6 3.0±0.5 4.3±1.0 |
0.3±0.002 0.01±0 0.02±0.001 0.03±0 0.34±0.003 |
215.0 ± 82.0 30.0 ± 30.0 40.0 ± 43.0 102.0 ± 62.0 96.0±54.0 |
2.815 0.0001 0.002 0.024 0.710 |
| Planted 2014 | A. marina (344) | 2.9 ± 0.7 | 5±5.6 | 1.8 ± 0.02 | 415.0 ± 214.9 | 1.953 |
| Planted 2010 |
A. marina (283) B. gymnorrhiza (16) C. tagal (11) R. mucronata (55) X. granatum (2) Average (73.4) |
3.7 ± 1.02 1.9 ± 0.7 1.7 ± 0.2 3.9 ± 1.2 2.6 ± 0.5 2.8± 0.7 |
5.1±2.2 3.9±1.3 4.6±1.4 4.5±1.3 4.0±0.7 4.4±1.4 |
0.68±0.002 0.02±0.001 0.02±0.001 0.09±0.001 0±0 0.81±0.003 |
314.0 ± 152.0 80.0 ± 56.0 36.0 ± 37.0 102.0 ± 62.0 183.0 ± 56.0 126.0±64.0 |
22.311 0.005 0.001 0.374 0 4.538 |
Table 3.
Juvenile density by regeneration classes.
| Density (seedlings/ha) | |||||
| Area | Species | RCI | RCII | RCIII | RCI: RCII: RCIII |
| 0 - 40 cm | 40.1 - 150 cm | 150.1 - 300 cm | 7:5:1 | ||
| Natural forest | A. marina | 1267 ± 2129 | 250 ± 378 | 433 ± 873 | |
| R. mucronata | 2971 ± 2334 | 3100 ± 2525 | 243 ± 447 | ||
| Total | 2185 ± 2323 | 1785 ± 2331 | 331 ± 654 | ||
| Replanted 2016 | A. marina | 567 ± 641 | 217 ± 214 | 450 ± 753 | 2:2:1 |
| C. tagal | 575 ± 675 | 725 ± 386 | 600 ± 1134 | ||
| R. mucronata | 875 ± 1056 | 1675 ± 1338 | 175 ± 126 | ||
| Total | 657 ± 736 | 779 ± 927 | 414 ± 740 | ||
| Replanted 2014 | A. marina | 1012 ± 1128 | 425 ± 634 | 412 ± 824 | 2:1:1 |
| C. tagal | 100 ± 141 | 400 ± 141 | 100 ± 141 | ||
| Total | 810 ± 1083 | 420 ± 561 | 350 ± 740 | ||
| Replanted 2010 | A. marina | 1040 ± 693 | 610 ± 536 | 290 ± 260 | 4:3:1 |
| C. tagal | 833 ± 1443 | 1267 ± 1026 | 167 ± 289 | ||
| X. granatum | 50 ± 71 | 200 ± 141 | 50 ± 71 | ||
| Total | 867 ± 851 | 687 ± 669 | 233 ± 253 | ||
Table 4.
Average values of above and belowground biomass and carbon in natural and planted forests.
| Above-ground biomass | Below-ground biomass | |||
| Biomass (Mg ha-1) | Carbon (Mg ha-1) | Biomass (Mg ha-1) | Carbon (Mg ha-1) | |
| Area | Average | Average | Average | Average |
| Natural forest | 135.8 ± 201.8 | 67.9 ±100.9 | 130.0 ± 154.3 | 65.0 ±77.1 |
| Planted forest 2016 | 2.2± 1.1 | 1.1 ± 0.5 | 4.3± 1.9 | 2.1 ± 1.0 |
| Planted forest 2014 | 3.6 ± 2.1 | 1.8 ± 1.0 | 7.1 ± 4.0 | 3.6 ± 2.0 |
| Planted forest 2010 | 7.4 ± 4.0 | 3.7 ± 2.0 | 10.6 ± 4.9 | 5.3 ± 2.5 |
Disclaimer/Publisher’s Note: The statements, opinions and data contained in all publications are solely those of the individual author(s) and contributor(s) and not of MDPI and/or the editor(s). MDPI and/or the editor(s) disclaim responsibility for any injury to people or property resulting from any ideas, methods, instructions or products referred to in the content. |
© 2023 by the authors. Licensee MDPI, Basel, Switzerland. This article is an open access article distributed under the terms and conditions of the Creative Commons Attribution (CC BY) license (http://creativecommons.org/licenses/by/4.0/).
Copyright: This open access article is published under a Creative Commons CC BY 4.0 license, which permit the free download, distribution, and reuse, provided that the author and preprint are cited in any reuse.


