Preprint
Article

Determination of the Concentration of Heavy Metals in Artisanal Cheeses Produced in the Mexican States of Tabasco and Chiapas

Altmetrics

Downloads

126

Views

63

Comments

0

A peer-reviewed article of this preprint also exists.

Submitted:

12 October 2023

Posted:

12 October 2023

You are already at the latest version

Alerts
Abstract
Cheese consumption provides humans with minerals, proteins, carbohydrates, and vitamins. In Mexico, several cheese varieties are produced, each with its texture, scent, and flavor. The artisanal cheeses made in the states of Tabasco and Chiapas —including, among others, the varieties named crema (cream), doble crema (double cream), oaxaca, panela, fresco, bola, poro, Cotija, and asadero— have a high demand in the domestic and foreign markets. The intensification of anthropic activity in these states causes an increased emission to the environment of contaminants like heavy metals, which could reach human foodstuffs through the food chains. In particular, heavy metal contents in cheeses consumed daily by these states' local population might represent a public health risk. Because of that, our objectives in this work were to determine the concentrations of lead, cadmium, nickel, copper, zinc, and iron in artisanal cheeses produced in the states of Tabasco and Chiapas, and to determine the values of the Hazard Quotient (HQ), Total Hazard Quotient (THQ), and Cancer Risk Total (CRT) for adult and young men and women. The results of our analyses of cheese samples from the states of Tabasco and Chiapas showed that the average concentrations (mg kg-1) of cadmium (0.0023±0.002, 0.0023±0.002 mg kg-1, respectively for each state), lead (0.0047±0.00, 0.0051±0.002), nickel (0.0039±0.0046, 0.0031±0.0039), copper (0.0199±0.021, 0.0202±0.022), zinc (0.1611±0.18, 0.194±0.21), and iron (61.84±4.23, 65.76±6.61 mg kg-1), the first three values lower than the limits established by the FAO/WHO and Codex Alimentarius. The value of THQ that we obtained was less than one, and that of CRT was within the limits established by the US-EPA, which means that the consumption of artisanal cheeses from Tabasco and Chiapas by humans does not imply a risk of disease or cancer.
Keywords: 
Subject: Chemistry and Materials Science  -   Food Chemistry

1. Introduction

The large variety of cheeses produced in different geographic regions represents healthy foodstuffs for human consumption because they contain high concentrations of proteins, fats, vitamins, and minerals —including macro (Na, K, Ca) and micro (Zn, Cu, Fe) elements, each having their own organoleptic and physicochemical properties (Moreno et al., 2010). In each geographic region, the natural grasslands, fodders, and grains fed to cattle might represent sources of contaminants of cheeses. In particular, heavy metals bioaccumulate in the muscles, organs, and bones of animals thus contaminating dairy products like milk, whey, cream, butter, and cheeses whose consumption might be a risk to human health. The intake of foodstuffs containing heavy metals has become a public health issue because of their carcinogenic, mutagenic, and cytotoxic effects (Meshref et al., 2014; Castro et al., 2019), because of which the Food and Agriculture Organization (FAO), World Health Organization (WHO), Codex Stan Alimentarius, EFSA (European Food Safety Authority) and Official Mexican Standard (NOM-243-SSA1-20109 have established strict regulations of the maximum permissible concentrations of heavy metals in foodstuffs. The risk for health of the intake of heavy metals is assessed using the Hazard Quotient (HQ), Total Hazard Quotient (THQ), and Cancer Risk Total (CRT) indexes established by the United States Environmental Protection Agency (US-EPA), which are of common use globally (Bermúdez et al., 2011).
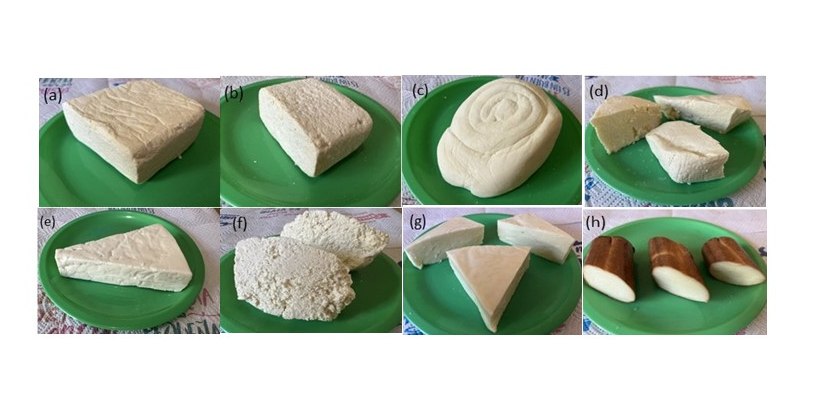
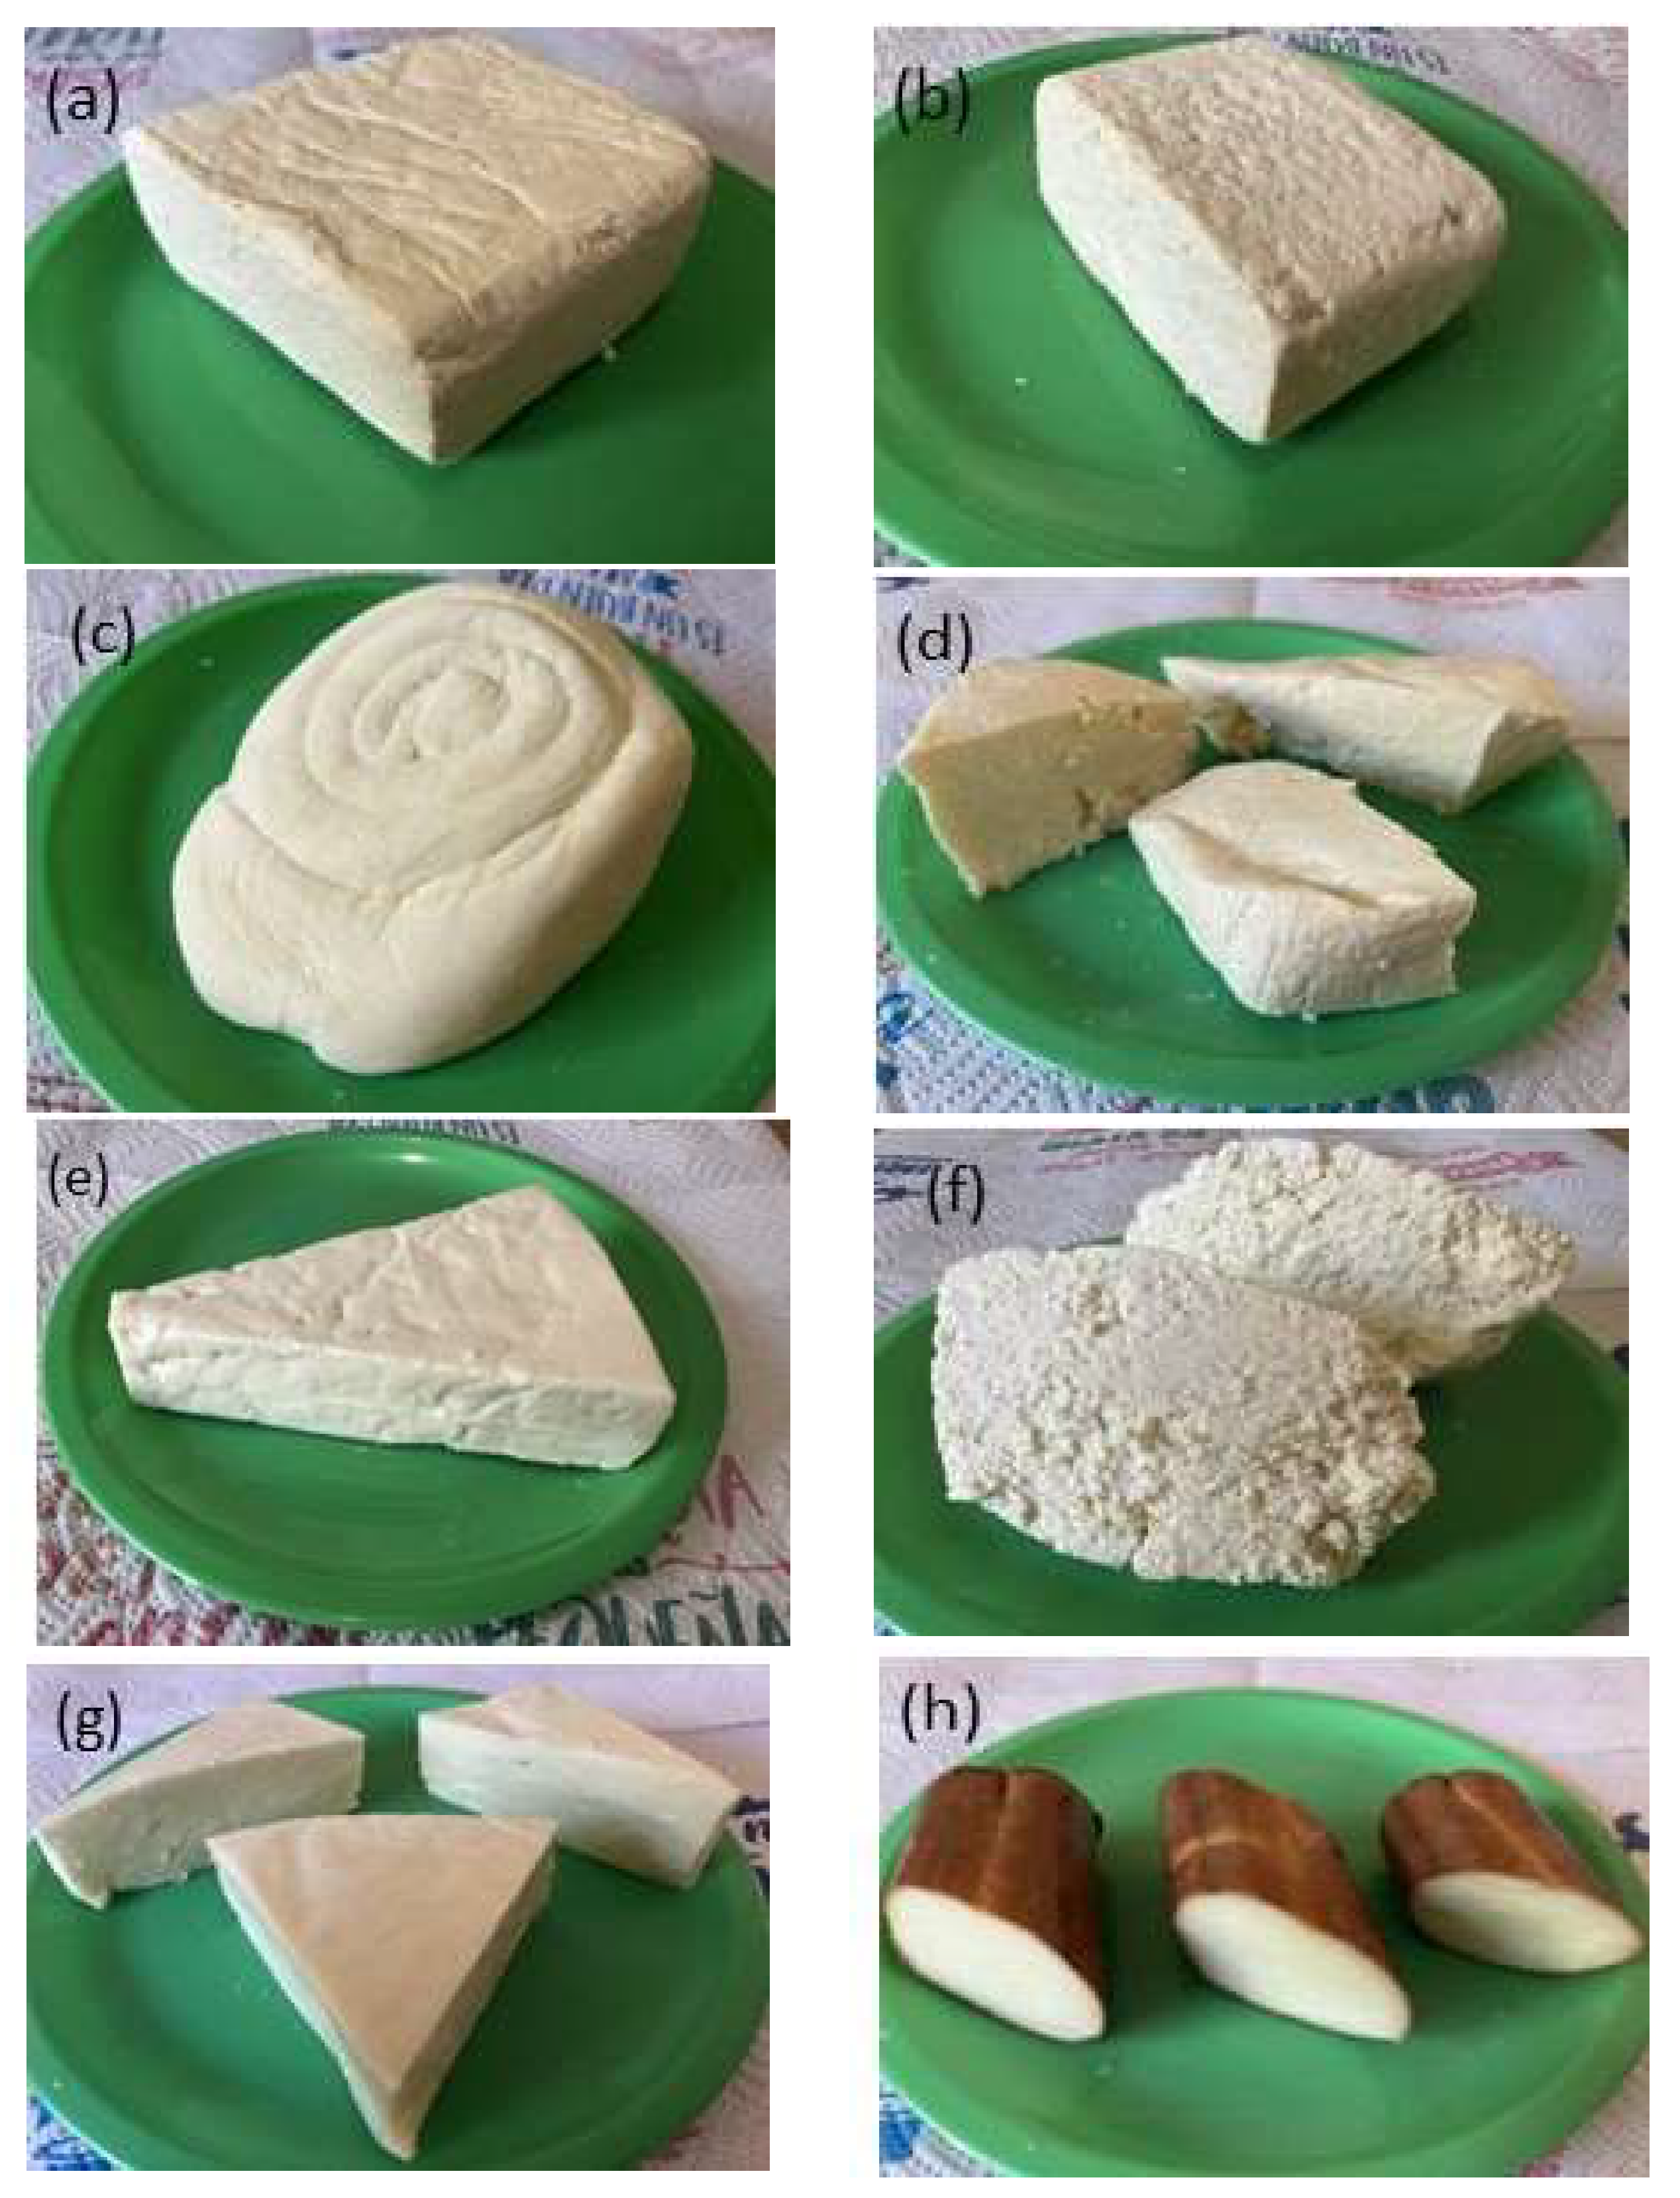
Mexico produces a large variety of industrial and artisanal cheeses using nearly 25% of the country’s total milk production. The nearly 40 varieties of artisanal cheeses made in Mexico account for approximately 70% of the total domestic cheese production, estimated at nearly 400 thousand tons per year and the per capita consumption in the country ranges from 2.1 to 6 kg yr-1 (González et al., 2016). The varieties of artisanal cheeses produced in the Mexican states of Tabasco and Chiapas include queso fresco (fresh cheese), queso crema (cream cheese), queso doble crema (double cream cheese), panela (Mexican cottage cheese), queso oaxaca (Mexican string cheese), queso Cotija (Mexican mild feta cheese or, when aged, Mexican parmesan cheese), queso asadero (grillable cheese), and queso de bola (ball-shaped cheese or Mexican Edam cheese), and in smaller amounts, mozzarella and provolone cheeses (Figure 1 and Figure 2). Of the above-mentioned artisanal cheese varieties, oaxaca, fresco, panela, cream, and double cream have high demand in the local, regional, and global markets. There has been a recent increase in heavy metal environmental contamination in Tabasco and Chiapas during the past years due to some anthropic activities —mostly, the petroleum industry, technified agriculture, and internal combustion engines, because of which, in this work, our objectives were to determine the concentrations of cadmium (Cd), lead (Pb), nickel (Ni), copper (Cu), zinc (Zn), and iron (Fe) in eight varieties : (a) double cream, (b) cream or soup, (c) oaxaca, (d) panela, (e) Cotija, (f) fresco, (g) mozzarella, (h) provolone of artisanal cheeses made in the states of Tabasco and Chiapas, and the values of the HQ, THQ, and CRT indexes for these cheeses.

2. Materials and Methods

2.1. Artisanal cheese samples

For the analysis of heavy metals, we acquired 44 samples of artisanal cheeses from seven varieties (doble crema, crema, oaxaca, fresco, panela, mozarella, and provolone) in four municipalities (Huimanguillo, Balancán, Tenosique, and Centro) of the state of Tabasco, and 44 samples from five varieties (doble crema, oaxaca, panela, Cotija, and fresco) in four municipalities (Solosuchiapa, Juárez, Catazajá, and Reforma) of the state of Chiapas. The average weight of samples was 1 kg (Figure 1, Table 1 and Table 2).

2.2. Sample preparation

All the glassware used in the experimental procedures was washed in a 5% hydrochloric acid solution for 24 h and afterwards rinsed with deionized water to remove possible contaminants that could interfere in the results of the analyses. Cheese samples were digested following the method of Bakircioglu et al. (2011). Samples were first homogenized by being finely chopped (approximately 2 mm). A 1 g aliquot of each sample homogenate was weighted in a Ohaus analytical balance and placed in a porcelain crucible and calcined in a Thermo Scientific-BF51794C-1 furnace at 450-500 °C for 16 h and, after, slowly cooled to room temperature. The resulting ashes were treated with 1 mL of concentrated nitric acid and calcined once more at 450-500 °C for 6 h to completely destroy the organic matrix. After the second calcination, samples were dissolved in 2 mL of concentrated nitric acid and 2 mL of hydrogen peroxide, after which the resulting solutions were filtered with no. 41 Whatman paper and the filtrate was diluted to 100 mL in a 100 mL volumetric flask. Each final solution was placed in a Teflon jar and stored at 10 °C until they were analyzed in a Thermo Scientific ICE 3000 Series atomic absorption spectrometer as described below.

2.3. Analytical parameters for atomic absorption spectrometry

To determine the concentration in samples of heavy metals (measured in mg L-1), calibration curves were run at different wavelengths for each heavy metal analyzed as follows: 217.0 nm for Pb, 228.8 nm for Cd, 232.0 nm for Ni, 324.8 nm for Cu, 213.9 nm for Zn, and 248.3 nm for Fe. A mixture of air-acetylene combustion gas was used and the wavelength was adjusted for each heavy metal.

2.4. Risk analysis

2.4.1. Daily intake of metals

The health risks of human intake of artisanal cheeses made in Tabasco and Chiapas was estimated based on the results of heavy metal determinations in the analyzed samples by assuming a per capita yearly intake of 6 kg —taking into account the yearly intake value of between 4 and 8 kg established for developing countries by the OECD/FAO (2018)— using Eq. 1 as suggested by Castro et al. (2019).
C h r o n i c   D a i l y   I n t a k e   C D I = ( C   m e t a l ) ( D   i n t a k e ) B   a v e r a g e   w e i g h t  
where C metal is the metal concentration determined in cheese samples in mg kg-1, D intake is the per capita consumption of cheese in kg yr-1), B average weight is the body weight of individuals in kg.

2.4.2. Hazard quotient

The hazard quotient was estimated by Eq. 2.
H Q = C D I R f D
where HQ is the hazard quotient, CDI is chronic daily intake, RfD is oral reference dose value of exposure to the chronic daily intake in mg kg-1. Table 1 contains the values used for calculation of HQ (Castro et al., 2019).

2.4.3. Total hazard quotient

The total hazard quotient is calculated adding the HQ values for each metal (Eq. 3).
T H Q = H Q C d + H Q P b + H Q N i + H Q C u + H Q Z n + H Q F e  
where THQ is the total hazard quotient, HQCd is the hazard quotient for cadmium, HQPb is the hazard quotient for lead, HQNi is the hazard quotient for nickel, HQCu is the hazard quotient for copper, HQZn is the hazard quotient for zinc, and HQFe is the hazard quotient for iron.
According to the recommendations of the US-EPA, values of THQ smaller than one imply no risk, while values of THQ greater than one suggest a high risk for human health 1 (Castro et al., 2019).

2.4.4. Cancer risk and total cancer risk

The total cancer risk was calculated by adding the cancer risk values for the carcinogenic metals cadmium, nickel, and lead (Eq. 4 and 5; Castro et al., 2019; Reinholds et al., 2020).
C R = C D I S f  
C R T = C R C d + N i + P b      
where CR is the cancer risk, TCR is the total cancer risk, CRCd+Ni+Pb is the cancer risk for cadmium, nickel and lead, CDI is chronic daily intake, and slope factors (Sf). The average body weights of the Mexican population were established by the OCDE/FAO (2018) to be 74.8 kg for adult males, 68.7 kg for adult females, 62.9 kg for young females, and 70.4 kg for young males.

3. Results and Discussion

Table 2 and Table 3 show the average, standard deviation, minimum value, and maximum value of the concentrations of heavy metals in the artisanal cheese samples from Tabasco and Chiapas, respectively. In the following sections we discuss our results for each analyzed heavy metal.

3.1. Lead

The International Programme of Chemical Safety (IPCS) and the International Agency for Research on Cancer (IARC) classify lead as a probable human carcinogen (2A). The high toxicity of lead might cause diseases and, at high concentrations, several types of cancer (Ziarati et al., 2018; Romero et al., 2019). Our results showed that the concentration of lead in the 88 artisanal cheese samples we analyzed were below the 0.02 mg kg-1 and 2 mg kg-1 maximum limits for dairy products for human consumption established by the European Commission (EC. 2001) and FAO/WHO (1999), respectively. The 44 analyzed samples from Tabasco had an average lead concentration of 0.0041, with minimum 0.0002 and maximum 0.0125 mg kg-1. By artisanal cheese variety, the average, minimum, and maximum values of lead concentration in mg kg-1 were: 0.0056, 0.0004, and 0.0125 for cream or soup and double crema; 0.0045, 0,0028, and 0.0084 for oaxaca; 0.0037, 0.0005, and 0.0068 for fresco; and 0.0041, 0.0031, and 0.0047 for panela. For the 44 samples from Chiapas, we found an average, minimum, and maximum values of lead concentration in mg kg-1 of 0.0051, 0.0003, and 0.0089. For the latter state’s artisanal cheese varieties, the average, minimum, and maximum values of lead concentration in mg kg-1 were: 0.0062, 0.0029, and 0.0089 for crema; 0.0054, 0.0039, and 0.0088 for Cotija; 0.0044, 0.0003, and 0.0083 for oaxaca; and 0.0028, 0.0005, and 0.0078 for panela.
Figure 3a shows the distribution of the lead concentration values that we observed in the samples of artisanal cheese varieties crema, oaxaca, panela, Cotija, and fresco we collected in the states of Tabasco and Chiapas. The maximum lead concentration of 0.0125 mg kg-1 that we observed corresponded to a sample of crema artisanal cheese from the municipality of Huimanguillo, Tabasco could have been due to pollution during the manufacturing process (Benítez, 2019). In general, the varieties crema and Cotija had higher lead concentrations than the varieties panela, oaxaca, and fresco, which could be explained by the former varieties having a less content of water by weight (47.94% and 41.36%, respectively) than the latter (56.64, 55.71, and 59.96%). The box plot in Figure 3b shows no significant differences between the lead concentrations in the samples of artisanal cheeses made in Tabasco and Chiapas, which could mean that in both processes the contamination sources were the same.
In a study of fresco cheese from the Mexican state of Puebla, Benítez et al. (2019) found an average lead concentration of 2.96 mg kg-1. Castro et al. (2017) analyzed the lead concentration values in artisanal cheeses made in Santa Ana Xalmimilulco, Puebla, reporting averages of 0.11±0.04 mg kg-1 for ranchero and 0.05±0.03 mg kg-1 for Oaxaca cheese varieties, the authors attributing the presence of led in the cheeses to the alfalfa fed to cattle being irrigation with polluted water from the Atoyac River. In studies made in Turkey, Yüzbaşi et al. (2003) observed lead concentrations between 0.0364 and 0.251 mg kg-1 in the artisanal kasar cheese samples from Ankara, and Bakircioglu et al. (2011) reported lead concentrations ranging from 0.60±0.17 and 0.48±17 mg kg-1 for cream and white cheese made in Edirne. Moreno et al. (2010) analyzed 57 varieties of cheese from different regions of Spain and found that their lead contents were between 5.0±0.01 and 110.0±8.2 µg kg-1, while, in Italy, Lante et al. (2006) reported a lead concentration of 0.06 mg kg-1 in crescenza and squacquerone cheeses.

3.2. Cadmium

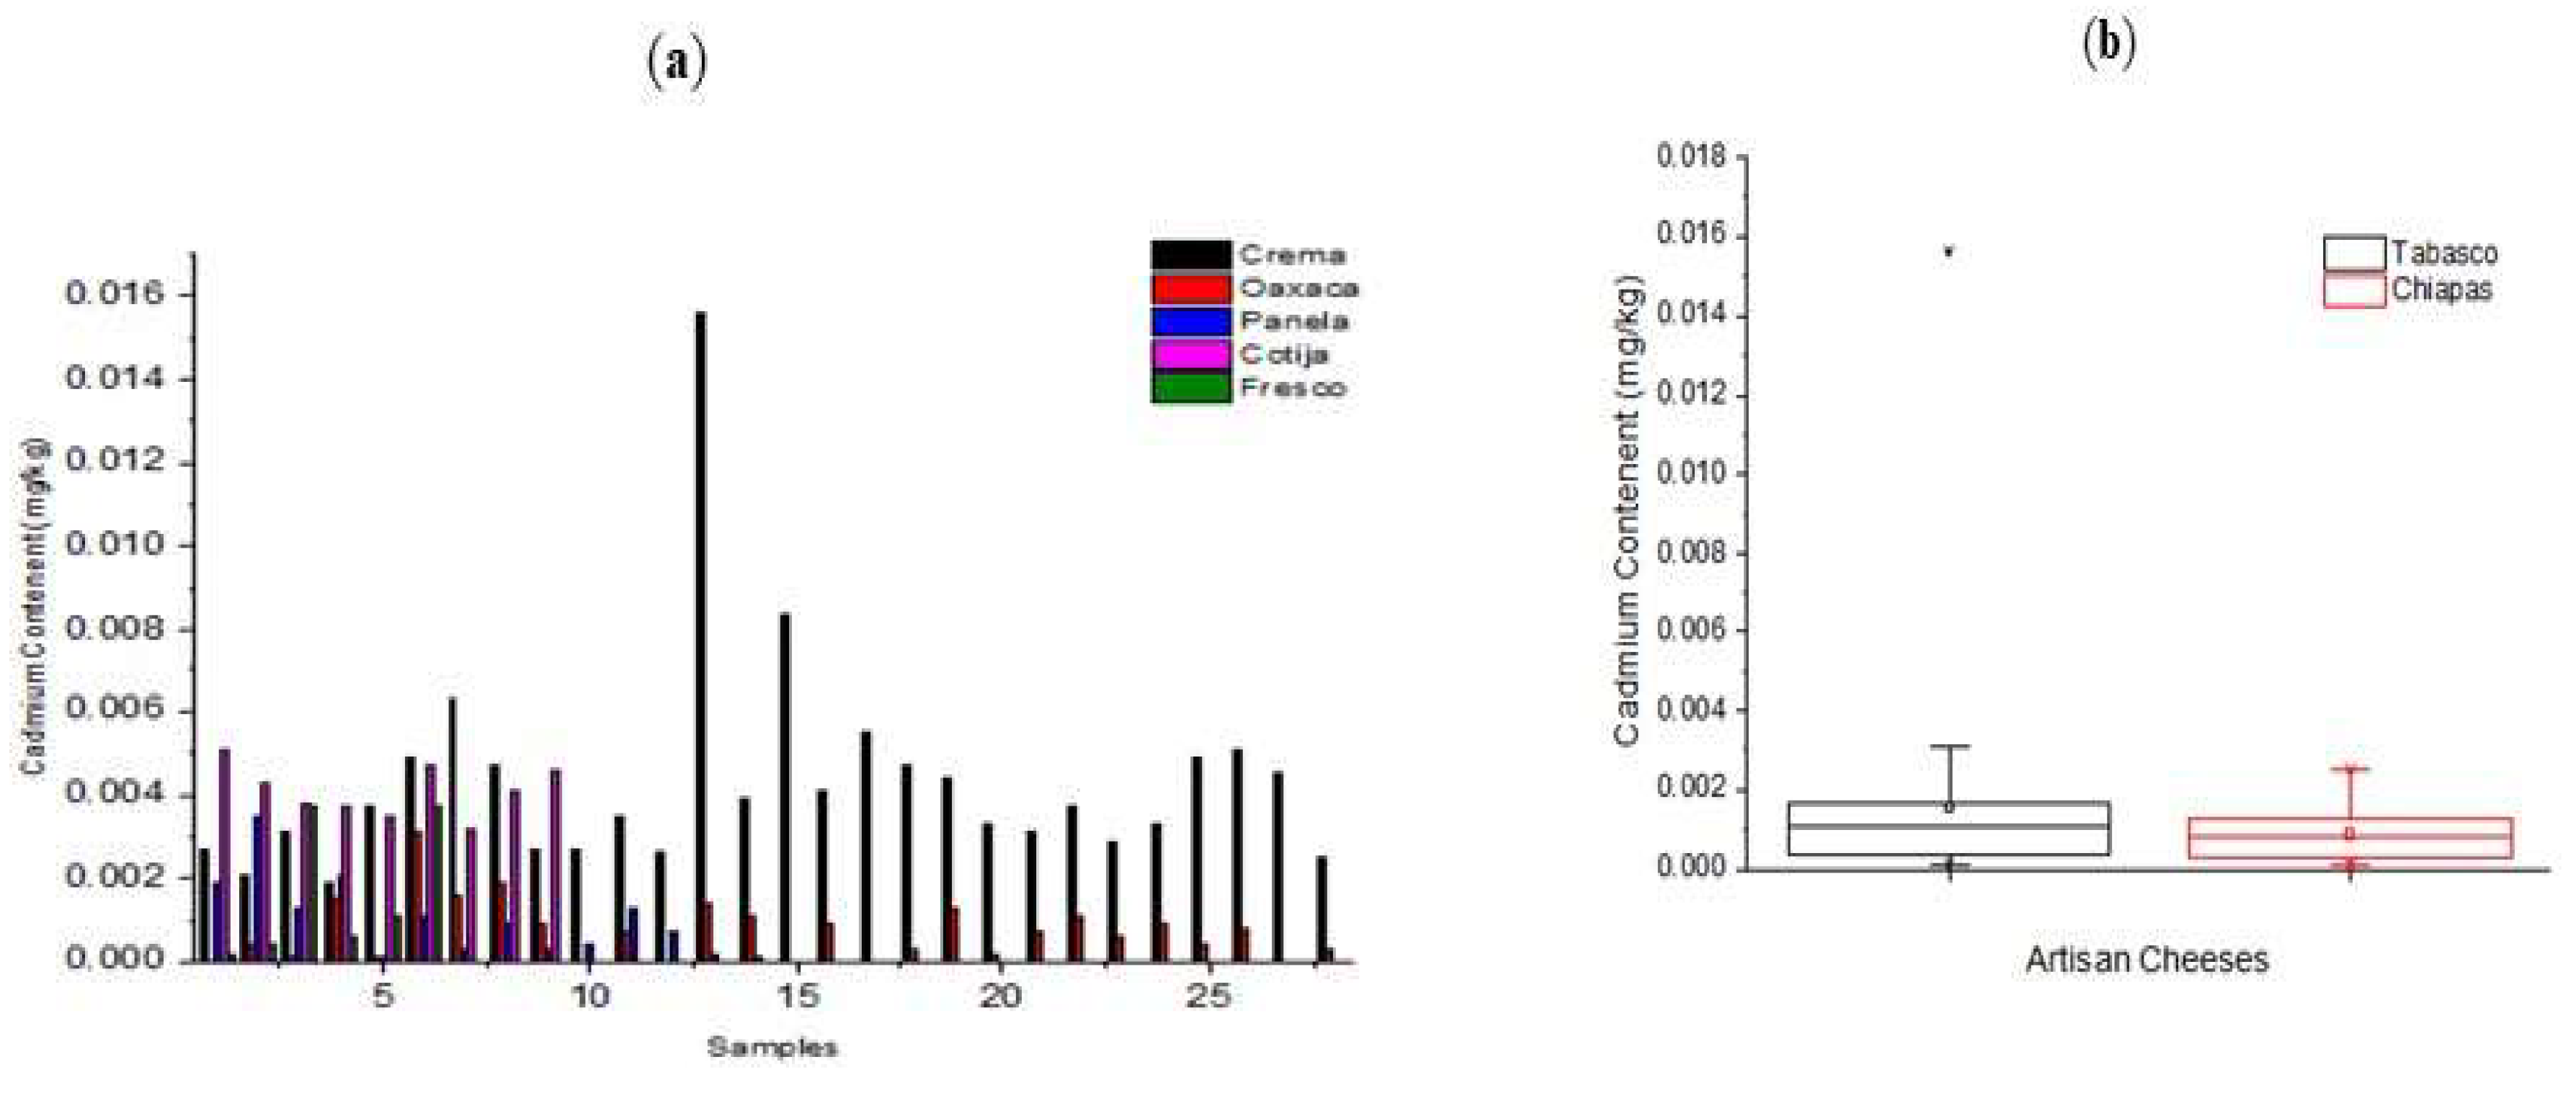
The IARC and IPCS determined that the ingestion of even a small amount of cadmium is highly toxic for humans, therefore determining its presence in food is essential (Moreno et al., 2010). The results of our determination of the content of Cd in cheese samples from Tabasco show average concentrations between 0.0023±0.0025 and 0.0056 mg kg-1. By cheese variety, the average, minimum, and maximum values of cadmium concentration in mg kg-1 were: 0.0045, 0.0019, and 0.0156 for crema; 0.0009, 0.00, and 0.0031 for oaxaca; 0.0011, 0.0002, and 0.0037 for fresco; and 0.0019, 0.0001, and 0.0075 for panela. For the analyzed cheese samples from Chiapas we found an average Cd concentration of 0.0023±0.0025 with a minimum of 0.00, and a maximum of 0.0055 mg kg-1. By cheese variety, the average, minimum, and maximum values of cadmium concentration in mg kg-1 were: 0.0043, 0.0029, and 0.0077 for crema; 0.0042, 0.0032, and 0.0062 for Cotija; 0.0019, 0.00, and 0.0046 for oaxaca; and 0.0014, 0.0002, and 0.0034 for panela.
The distribution of the cadmium concentrations we found in the crema, oaxaca, panela, Cotija, and fresco cheese samples from Tabasco and Chiapas shows that the highest Cd concentrations correspond to crema and Cotija cheeses, and the lowest Cd concentrations, to the panela, oaxaca, and fresco samples (Figure 4a). The latter result may have been due to the lower water content of the crema (47.94% by weight) and Cotija samples (41.36%) relative to that in the panela, oaxaca, and fresco (>55%). We did not observe significant differences between the content of cadmium in cheese samples from Tabasco and Chiapas (Figure 4b), which suggests that the possible sources of cadmium pollution were similar in both states. We found that the cadmium concentrations in all the samples we analyzed were under the maximum values established by the Codex Alimentarius 0.05 mg kg-1 and the 1.0 mg kg-1 FAO/WHO (1999).
In a study made in the Mexican state of Puebla, Castro et al. (2021) found the presence of cadmium in urine, blood, and milk of Holstein cattle in the Santa Ana Xalmimilulco region in the municipality of Huejotzingo, and determined its concentration in milk samples to be 0.54 mg kg-1, which the authors attributed to the cattle’s ingestion of alfalfa containing heavy metals. In their study of heavy metal content in samples of fresco cheeses sold in markets in the city of Puebla, Benítez el al. (2019) found heavy metals including an average Cd concentration of 0.13 mg kg-1. In Egipt, Meshref et al (2014) reported an average cadmium concentration of 0.09 mg kg-1 in Kareish in the Beni-Suef region. Elbarbary and Hamouda (2013) found 0.24 mg kg-1 of cadmium in feta cheese samples. In Turkey, Çetinkaya et al. (2016) reported an average cadmium concentration of 0.028 mg kg-1 in cami bogazi cheese samples from the Trabzon region. The concentrations of cadmium in cheeses reported in the literature that we found were higher than those we observed in our study.

3.3. Nickel

The United States Department of Health and Human Services (DHHS) determined that metallic nickel and some nickel compounds are carcinogens, and the ingestion of high Ni concentrations can be hazardous for human health (Izah et al., 2016; Naseri et al., 2021). The European Commission and FAO have not established the permitted maximum intake limit of nickel for humans; however, the Integrated Risk Information System of the United States Environmental Protection Agency (US-EPA-IRIS) established a 300 µg/kg limit (Romero et al., 2019), and the WHO (2007) posed a tolerable daily intake of 11 μg kg-1 of body weight for children and, in 2008, of 12 μg kg-1 of body weight for adults (Olivares et al., 2015).
The results of our analysis of artisanal cheese samples from Tabasco showed an average nickel concentration of 0.0039±0.0046 mg kg-1, a maximum value of 0.0132 mg kg-1, and a minimum of 0.0002 mg kg-1. By cheese variety, the average, maximum and minimum values in mg kg-1 were: 0.0059, 0.0002, and 0.0132 for crema; 0.0029, 0.0005, and 0.0049 for oaxaca; 0.0031, 0.0021, and 0.0042 for fresco; and 0.0029, 0.0004, and 0.0056 for panela. For the cheese samples from Chiapas, we found an average Ni concentration of 0.0031±0.0039 mg kg-1 with a minimum of 0.0003 mg kg-1 and a maximum 0.0091 mg kg-1. For the same state by variety, we found average, minimum, and maximum Ni concentrations in mg kg-1 of 0.0050, 0.0015, and 0.0091 for crema; 0.0052, 0.0027, and 0.0079 for Cotija; 0.0031, 0.0016, and 0.0052 for oaxaca; and 0.0017, 0.0006, and 0.0031 for panela. The distribution of nickel concentrations in cheese samples we analyzed from Tabasco and Chiapas (Figure 5) shows that matured cheeses with lower humidity content like crema and Cotija have higher concentrations of nickel than the more humid varieties like oaxaca, panela, and fresco, again showing similar contamination sources in both geographic areas. Our results compare well with those of the analyses of Ni concentrations made by Castro et al. (2017) in samples of oaxaca (0.003 mg kg-1) and ranchero (0.01 mg kg-1) artisanal cheeses from the Mexican state of Puebla. However, the values of nickel concentration in artisanal cheeses reported by Nöel et al. (2012) for French samples (0.409 mg kg-1), and by Olujimi et al. (2018) for milk (7.70 mg kg-1) and cheese (8.33 mg kg-1) samples from the Nigerian Ogun and Oyo states are much higher than those reported for Mexico. In Nigeria, Olujimi et al. (2018) attributed the contamination with nickel of milk and cheese to oil industry activities and the use of agrochemical inputs.

3.4. Sources of lead, cadmium, and nickel in artisanal cheeses from Tabasco and Chiapas

The presence of lead, cadmium, and nickel in the artisanal cheeses made in Tabasco and Chiapas might come from the natural and anthropic sources described below:
(a)
Oil industry. Large oil production facilities in Tabasco include Samaria, Jujo, El Golpe, Delta del Grijalva, Bellota, Ogarrio, Cinco Presidentes, and Cuenca de Macuspana, and in Chiapas, Cactus. Southeastern México has 99 oil fields with 935 active wells and 2,360 km of oil ducts connecting wells and oil fields with pumping stations and oil processing centers (Fiedler et al., 2009). Manríquez et al. (2000) determined heavy metals were present in the Mexican crude oils Maya, Istmo, and Olmeca, reporting concentrations between 8 and 277 mg L-1 of vanadium and 2.5 to 52.0 mg L-1 of lead. Siebe et al. (2005) reported the presence of lead (0.01-0.1 mg L-1), chromium (2.0 mg L-1), zinc (0.1-2.5 of 0.2 mg L-1), cadmium (0.02-0.04 mg L-1), and copper (0.2-0.4 mg L-1). In the Cinco Presidentes well in Tabasco, Fridler et al. (2009) analyzed heavy metal concentrations average in ground water reported for Nickel 9 ug L-1, zinc 38 ug L-1, copper 16 ug L-1, cadmium 0.5 ug L-1 and lead 8 ug L-1; in sediments, nickel (49-92 mg kg-1), chromium (73-138 mg kg-1) and lead (8-95 mg kg-1). Villanueva and Botello (2005) determined the content of heavy metals in the sediments of the Laguna el Yucateco in Tabasco and in the muscles of the inhabiting aquatic organisms, reporting between 14.27 and 329.24 µg g-1 of lead, 0.76– 5.52 µg g-1 of cadmium, and 44.61±5.38 µg g-1 of nickel in sediments, and in the muscle of several edible species, 0.33-4.30 mg kg-1 of cadmium, 0.19-15.68 mg kg-1 of lead, and 0.1-8.75 mg kg-1, of nickel —the latter concentrations being above the maximum limits established in the Codex Alimentarius and FAO/WHO (1999). Therefore, the presence of heavy metals is an ecological risk factor because they can move from soils to groundwater, and from there, to aquatic ecosystems where edible species bioaccumulate them.
(b)
Agriculture. In the state of Tabasco, nearly 239,904 ha are used for food production using technified agriculture (de la Cruz et al., 2012; Báez et al., 2017; Báez et al., 2018; Hernández, et al., 2018; Murillo et al., 2019; Salgado et al., 2016), and in Chiapas, white maize, sorghum, African palm, bean, cacao, and chilli are sown in nearly 14,000 ha in the municipalities of Catazajá, Palenque, Reforma, and La Libertad (Velázquez y Gómez, 2010; Trinidad et al., 2016; Rojas et al., 2018;). To enhance the yields of crops, large amounts of chemical fertilizers like urea, sulfates, phosphate, and potassium superphosphate are added to the soil, which may be sources of heavy metal pollution. Atafar et al. (2010) found lead (3.32 to 4.28 mg kg-1) and cadmium (0.02-1.12 mg kg-1) in potassium sulphate, ammonium sulfate, and potassium nitrate. Nouri et al. (2008) reported the presence of 0.03 mg kg-1 of cadmium and 1.0 mg kg-1 of copper in urea, and in potassium superphosphate, 12.2 mg kg-1 of cadmium, 60 mg kg-1 of zinc, and 22.5 mg kg-1 of copper. In phosphate fertilizers, Ma et al. (2021) reported the presence of 0.04-65 mg kg-1 of cadmium, 1-20 mg kg-1 of lead, 11-71 mg kg-1 of nickel, 4-130 mg kg-1 of copper, and 6-500 mg kg-1 of zinc.
(c)
Urban areas and roads. The large towns and terrestrial communication networks in the regions where artisanal cheese samples were collected are possible sources of heavy metal pollution. Internal combustion engines used in vehicles and the oil industry might emit gasses containing high amounts of heavy metals (de la Cruz et al., 2012). The solid microparticles generated during gasoline and diesel combustion travel long distances dispersing heavy metals and are deposited by gravity on croplands and grazelands (Zhang et al., 2012). Akpoveta and Osakwe (2014) reported contents of 0.24 ppm of lead, 1.68 ppm of cadmium, 1.74 ppm of copper, and 1.43 ppm of zinc in gasolines, and of 1.01 ppm of lead, 1.50 ppm of cadmium, 1.77 ppm of copper, and 2.87 ppm of nickel in diesel.
(d)
Processing tools and inputs. The use of metallic utensils and the addition of salt during the manufacturing of artisanal cheeses are possible sources of heavy metal pollution (Elbarbary and Hamouda, 2013; Meshref et al., 2014; Castro et al., 2018; Sidawi et al., 2021).
(e)
Volcanic emissions. The eruption of the Chichonal volcano in 1982 emitted large quantities of ashes over Chiapas, Tabasco, Campeche, and southern Veracruz (Tilling, 2009). Rincón et al. (2018) analyzed the sediments from the Chichonal volcano finding 3.26-7.06 mg kg-1 of cadmium, 3.2-4.5 mg kg-1 of lead, 3.2-4.3 mg kg-1 of nickel, 0.83-2.76 mg kg-1 of copper, 3.5-17 mg kg-1 of zinc, and 52-126 mg kg-1 of iron, thus showing that volcanic activity contributed to the distribution of heavy metals on the regions in Tabasco and Chiapas where we collected the samples of artisanal cheeses.

3.5. Copper

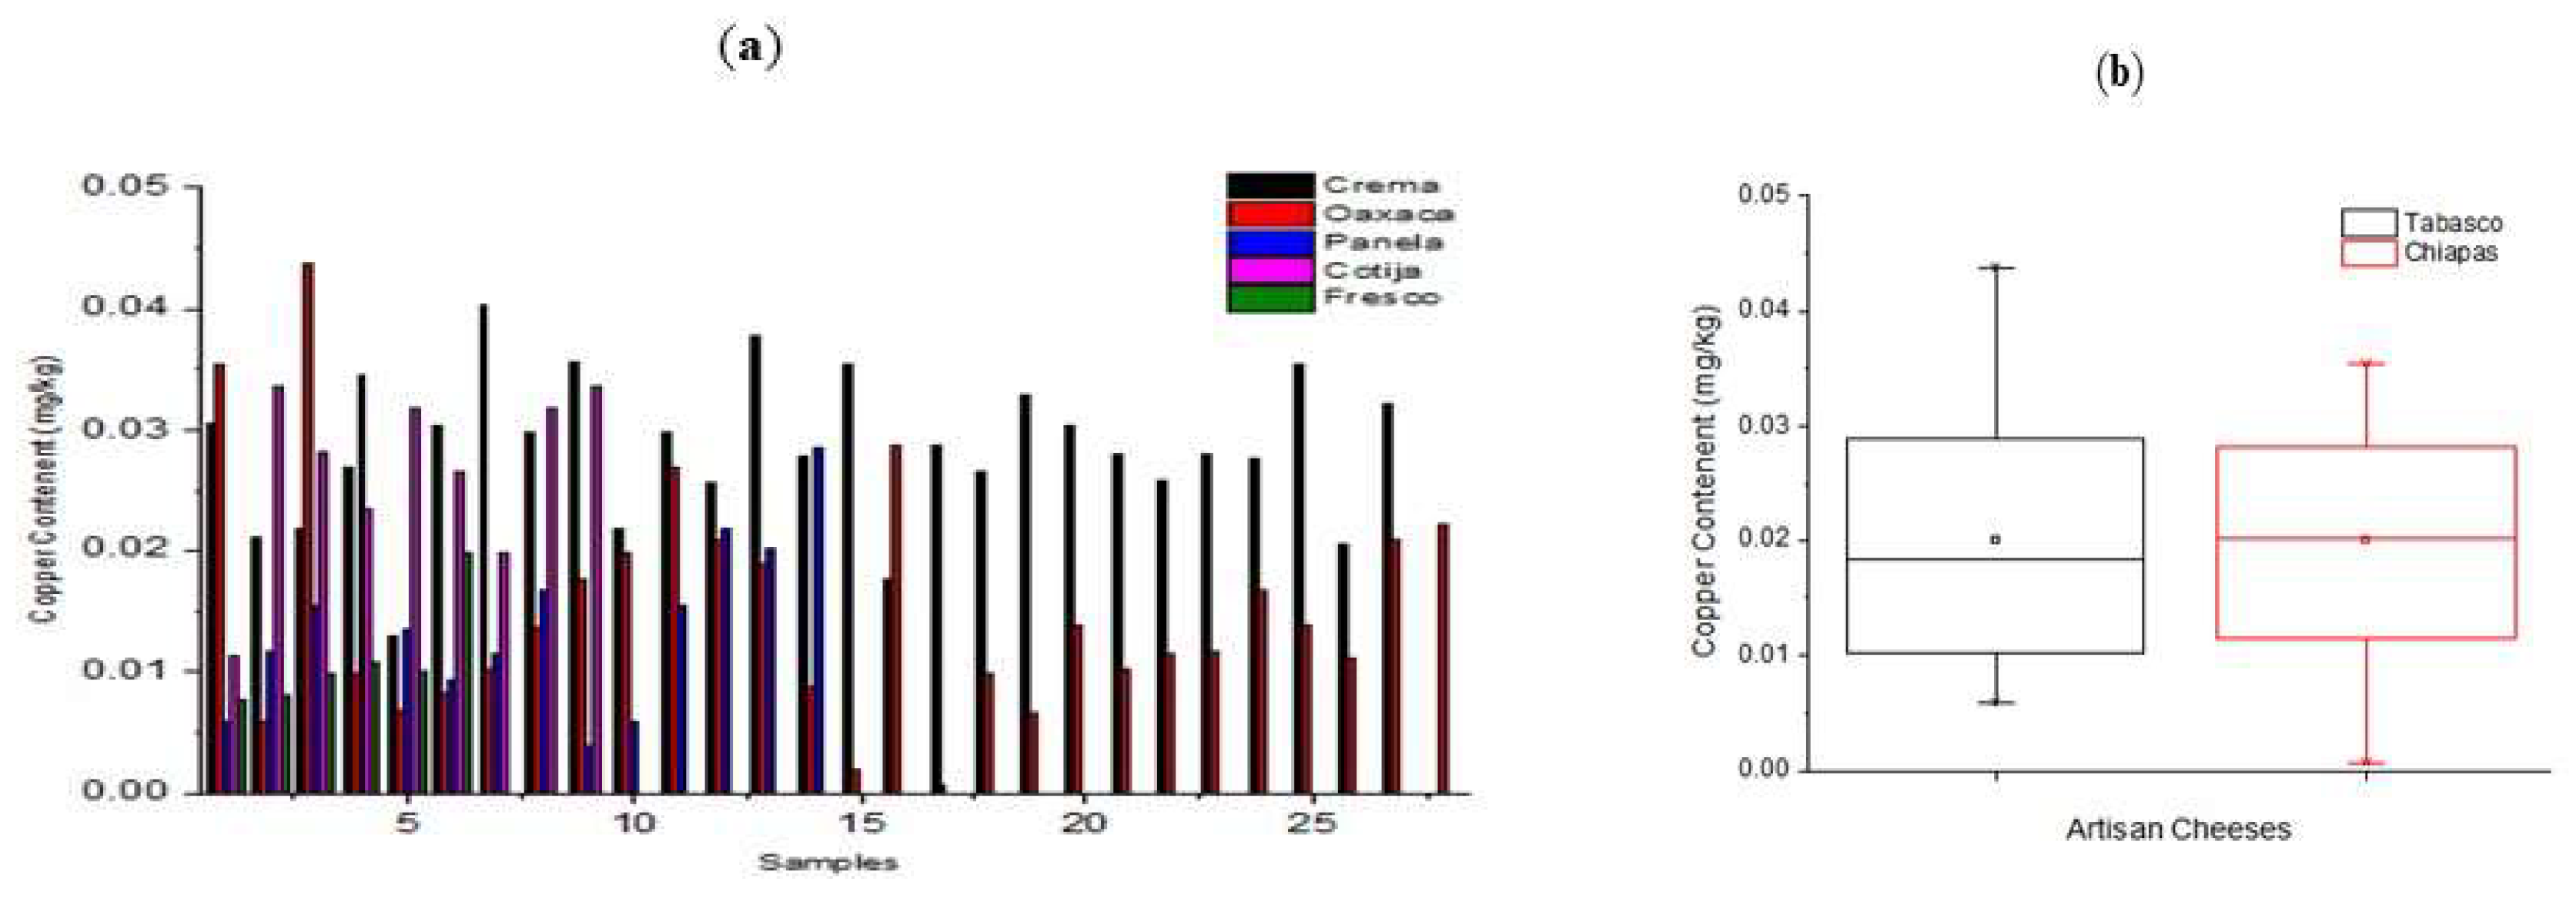
Copper is an essential microelement active in vital functions of the human body; however, the ingestion of high concentrations of copper might cause health issues (Sidawi et al., 2021). The results of our analyses of cheese samples made in Tabasco and Chiapas showed copper concentrations below the maximum limits established by the FAO/WHO (1999). The average, minimum, and maximum copper concentration in mg kg-1 that we observed in cheese samples from Tabasco were 0.0199±0.021, 0.0059, and 0.0437. By cheese variety, the average, minimum, and maximum copper concentrations in mg kg-1 were 0.0285, 0.0129, and 0.0402 for crema, 0.0233, 0.0059, and 0.0884 for oaxaca, 0.0093, 0.0078, and 0.0108 for fresco, and 0.0148, 0.0059, and 0.0346 for panela. In the cheese samples from Chiapas, the average, minimum, and maximum copper concentration in mg kg-1 that we recorded were 0.0202±0.022, 0.0007, and 0.0354. By cheese variety, the average, minimum, and maximum copper concentration in mg kg-1 were: 0.0271, 0.0167, and 0.0354 for crema; 0.0141, 0.0067, and 0.0223 for Oaxaca; 0.0267, 0.0113, and 0.0337 for Cotija; and 0.0165, 0.0059, and 0.0285 for panela.
The distribution of copper concentrations we observed in cheese samples from Tabasco and Chiapas shown in Figure 6a shows a high variation in such concentrations. By cheese variety, our results determined the samples of crema contained copper at concentrations ranging between 0.0402 and 0.0129 mg kg-1, of oaxaca between 0.0437 and 0.0007 mg kg-1, of Cotija between 0.0337 y 0.0113 mg kg-1 of frescos between 0.0197 and 0.0078 mg kg-1, and of panela between 0.0346 and 0.0039 mg kg-1. We can attribute this variability and the low concentration of copper in the cheese samples from Tabasco and Chiapas to the states’ soil type variation. In both states the soil types include Gleysol, Fluvisol, Histosol, Leptosol-Vertisol, Acrisol, Vertisol, Luvisol, and Ferralsol, whose differences in the values of pH, electric conductivity, cation exchange capacity, and organic matter content are factors determining the amount of extractable concentration of copper in each soil type (Palma et al., 2007; INEGI 2022). De la Cruz et al. (2012) report extractable copper concentrations of 0.99-2.45 mg kg-1 in Vertisols and 0.98-2.45 mg kg-1 in Fluvisoles. Salgado, et al. (2016) reported extractable copper concentrations in subunits of Acrisols of 0.60±0. 30 mg kg-1 (subunit ACdyhfr) 0.80±0.50 mg kg-1 (ACfrpl), 0.40±0.30 mg kg-1 (ACfrum), 1.10±0.20 mg kg-1 (ACglpl), 0.80±0.50 mg kg-1 (AChupl), 0.60±0.50 mg kg-1 (AChuum), 0.80±0.20 mg kg-1 (ACumgl) and 0.70±0.50 mg kg-1 (ACumpl). As seen in Figure 6b, we found no significant differences in copper concentrations in cheese samples from Tabasco and Chiapas, which was due to both states having similar soil types. The value of copper concentration that we found in the analyzed cheese samples was below the 0.40 mg L-1 maximum permitted limit in milk and dairy products by the European Commission (2001). The copper contained in the artisanal cheese samples from Tabasco and Chiapas may contribute to the recommended daily ingestion of 3 mg for adults FAO/WHO (1999).
Oaxaca and ranchero cheeses made in Santa Ana Xalmimilulco, Puebla, Castro et al. (2018) reported a 0.02 mg kg-1 copper content, and for cheese samples from markets in the city of Puebla, Rojas (2019) reported an average copper concentration of 1.81 ±1.21 mg kg-1. In Egipt, Meshref et al. (3014) reported copper concentrations of between 0.002 and 0.53 mg kg-1 in samples of Kareish cheese made in the Beni-Suef region. In Europe, Elbarbary and Hamouda (2013) reported copper concentrations of 3.25±1.06 mg kg-1 for feta cheese, and Reinholds et al. (2020), found an average copper concentration of 0.29 mg kg-1. In cheeses made in the Kvemo Kartli region of Georgia, Sidawi et al (2021) determined an average copper concentration of 1.261±0.739 mg kg-1 in imeruli cheese and 2.463±2.314 mg kg-1 in sulguni cheese. Previous reports of copper content in cheese samples are similar or higher than those we determined in our analysis of cheese varieties made in the states of Tabasco and Chiapas.

3.6. Zinc

Zinc is another essential element that when ingested at high concentrations might lead to neurological, hematological, immunological, renal, hepatic, cardiovascular, and genotoxic conditions (Elbarbary et al., 2013). The average, minimum, and maximum concentrations of zinc in mg kg-1 that we determined in the cheese samples from the states of Tabasco were 0.161±0.18, 0.0204, and 0.301 mg kg-1. By cheese variety, the average, minimum, and maximum zinc concentrations in mg kg-1 we observed were: 0.0874, 0.0204, and 0.2418 for crema; 0.1579, 0.0317, and 0.2645 for Oaxaca; 0.2584, 0.2435, and 0.2785 for fresco; and 0.2437, 0.1436, 0.2927 for panela. For the samples from Chiapas, the average, minimum, and maximum zinc concentrations in mg kg-1 that we observed were 0.194±0.21, 0.0421, and 0.437 mg kg-1. By cheese variety, the average, minimum, and maximum zinc concentrations in mg kg-1 we recorded were: 0.1008, 0.0421, and 0.3699 for crema; 0.2437, 0.0677, 0.4369 for oaxaca; 0.2216, 0.1664, and 0.3708 for Cotija; and 0.2181, 0.1325, and 0.3308 for panela.
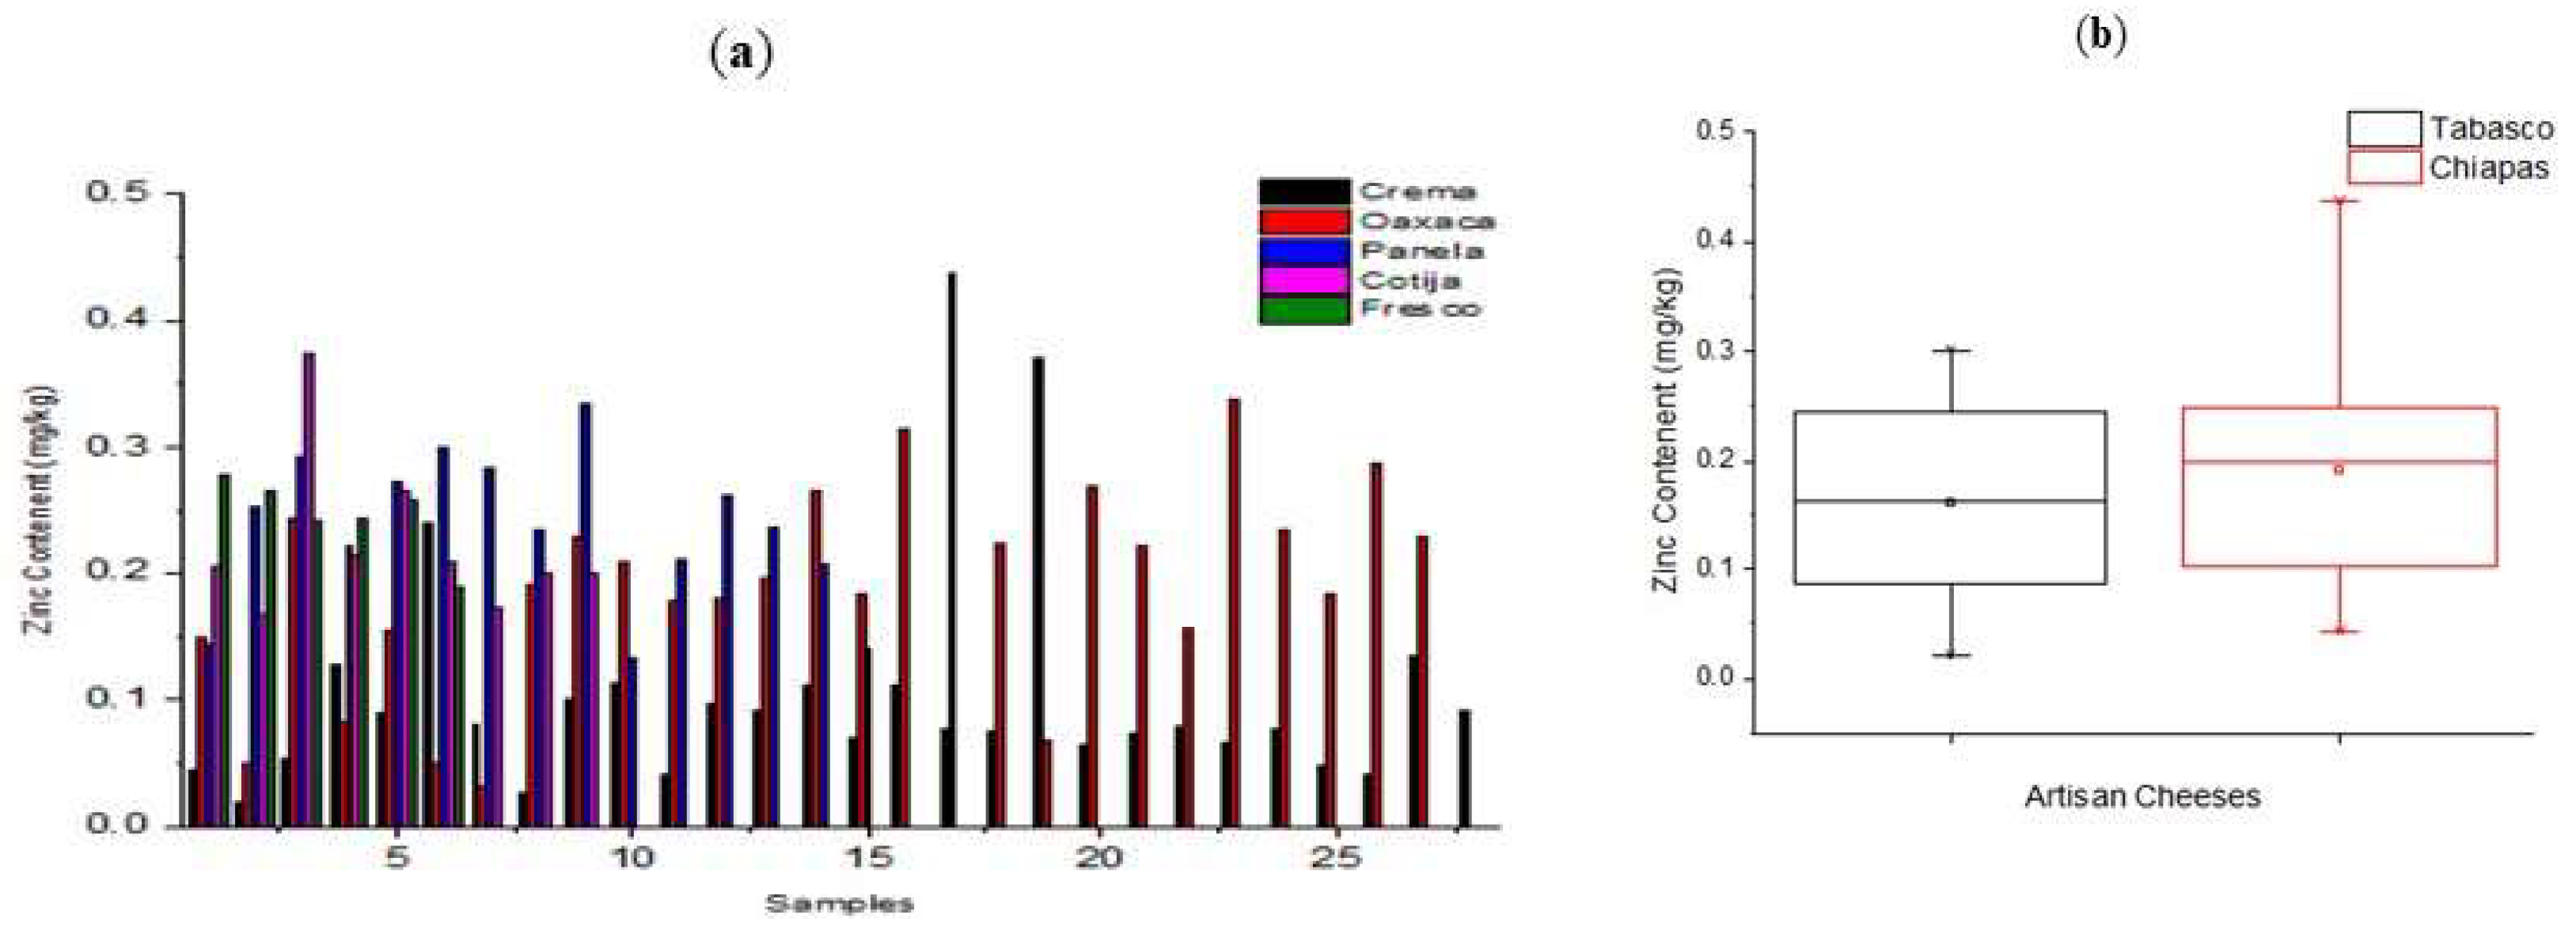
As seen in Figure 7a, we found an ample variation in the zinc concentration of the cheese samples that we analyzed, for example, these values (expressed in mg kg-1) were 0.0204-0.369 for crema, 0.032-0.437 for oaxaca, 0.188-0.278 for Cotija, 0.167-0.374 for fresco, and 0.132-0.334 for panela. Such variability in zinc content might have been due to the diversity of soil types in Tabasco and Chiapas, and to the physicochemical variables of these types (Palma et al., 2007). We found no significant differences between the zinc concentrations we recorded in the cheese samples from the states of Tabasco and Chiapas (Figure 7b), which agrees both with the similarities in soil types between both states and with the recognition that the content of zinc in the cheese samples was due to the soil types present in the geographic regions where they were collected, as previously reported in other studies. De la Cruz et al. (2012) determined Zn concentrations of 0.68-0.85 mg kg-1 in Fluvisols, and of 0.66-0.87 mg kg-1 in Vertisols, and in different Acrisol units, Salgado et al. (2016) reported Zn concentrations in mg kg-1 of 0.30±0.20 (ACdyhfr), 0.50±0.30 (ACfrpl), 0.40±0.10 (ACfrum), 0.50±0.20 (ACglpl), 0.60±0.50 (AChupl), 0.30±0.20 (AChuum), 0.30±0.20 (ACumgl), and 0.51±0.30 (ACumpl).
The recommended daily intake of zinc for adult women and men is 8 mg and 11 mg kg-1, respectively. The range of zinc concentration we found in cheese samples from Tabasco and Chiapas suggests that their consumption might contribute to satisfy the minimum requirement of zinc for humans. Our results agree with those of Castro et al. (2017) for cheeses in the Mexican state of Puebla, who reported zinc concentrations of 0.18±0.09 mg kg-1 for oaxaca and 0.74±0.1 mg kg-1 for ranchero cheeses. In Iran, Ghafari and Sobhanardakani (2017) found 0.198 mg kg-1 of zinc in cheeses from the Hamedan province and, in Kartli, Georgia, Sidawi et al. (2021) reported zinc contents of 75.86 ±52.528 mg kg-1 in imeruli and 124.8±97.775 mg kg-1 in sulguni cheeses. For blue cheese sold in the European Union, Reinholds et al. (2020) reported zinc concentrations between 10.4 and 39.5 mg kg-1. For Turkey, Centinkaya et al. (2016) found an average zinc concentration of 27.52±1.85 mg kg-1 in cheese samples in the Cami Bogazi region, and for white cheeses, Mendil (2006) reported 12.0 mg kg-1 and Orak et al. (2005) 15.57 mg kg-1 of zinc. The authors attributed the presence of zinc in cheeses to the use of contaminated machinery and containers during cheese making, and to the transport of zinc through the food web due to the environmental pollution of soil, water, and fodder.

3.7. Iron

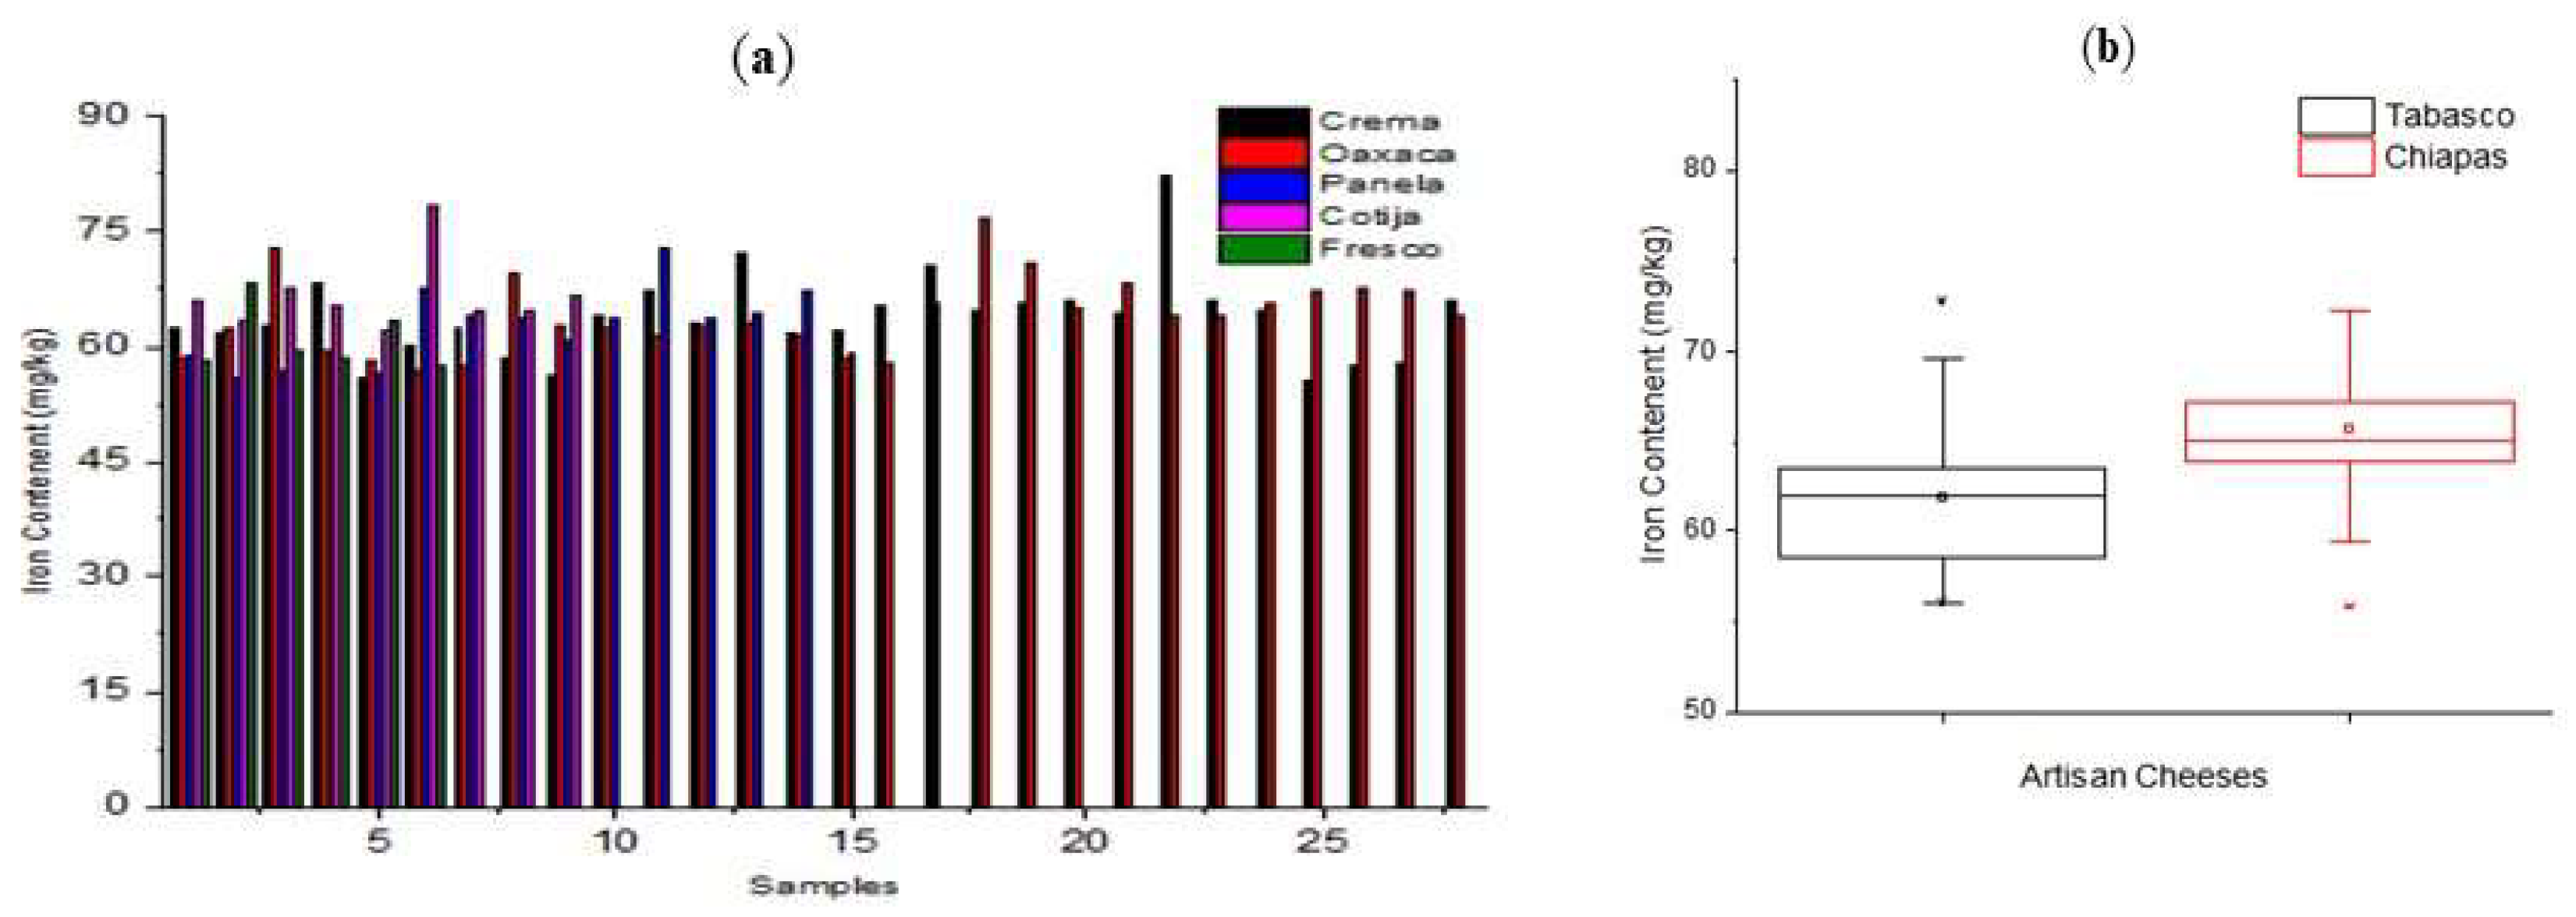
Iron is essential for oxygen transportation and storage in the human body, but ingestion of large quantities of iron may lead to blood, heart, kidney, and endocrine system conditions, cellular damage, and mutations (Jaishankar et al., 2014; Izah et al., 2016). The average, minimum, and maximum Fe concentrations in mg kg-1 that we found in cheese samples from Tabasco were 61.84±4.23, 55.97, and 72.76, and the same figures by cheese varieties in the state were 62.58, 55.97, and 72.08 for crema, 62.15, 56.92, and 72.76 for Oaxaca, 61.61, 58.38, and 68.29 for fresco, and 60.25, 56.07, 67.77 for panela. For cheese samples from Chiapas, the average, minimum, and maximum Fe concentrations in mg kg-1 were 65.76±6.61, 55.82, and 97.41, and by cheeses variety: 64.37, 55.82, and 72.33 for crema; 68.09, 57.96, and 97.41 for Oaxaca; 65.91, 62.19, and 72.09 for Cotija; and 64.72, 59.86, and 72.94 for panela. Figure 8a shows a uniform Fe concentration in all samples from both states, and Figure 8b, that there were no significant differences in Fe concentration between samples from Tabasco and Chiapas.
We attributed the presence of Fe in the analyzed cheese samples from Tabasco and Chiapas to soil types in the region, where Ferralsols rich in iron sesquioxides are dominant. Acrisols —which are easily identified by their yellowish to reddish dark color, strong acidity, and a B horizon accumulating alluvial clay— are rich in iron and aluminum sesquioxides (Palma et al., 2007). Salgado et al. (2016), analyzed Fe concentrations in subunits of Acrisols finding 67.00±52.00 (ACdyhfr), 76.00±21.00 (ACfrpl), 51.00±16.00 (ACfrum), 115.00±58.00 (ACglpl), 85.00±29.00 (AChupl), 94.00±29.00 (AChuum), 72.00±15.00 (ACumgl), and 64.00±49.00 (ACumpl) mg kg-1. De la Cruz et al. (2012) found Fe concentrations of 67.6 in Vertisols and 112.2 mg kg-1 in Fluvisols. The above-mentioned soil types are rich in organic matter with high concentrations of humic and fulvic acids, which give soil acidic pH values between 4.6 and 5.7, chemical conditions which facilitate the biosorption of iron by grass rhizomes and its accumulation in stalks.
According to our results, the concentrations of iron that we observed in cheese samples from Tabasco and Chiapas are within the parameters for human consumption and may cover a large part of the recommended daily intake of 8 mg for adult males, 18 mg for adult females, 11 mg for young males, 15 mg for young females, and 27 mg for pregnant women. Our results were similar to those of Sidawi et al. (2021) who analyzed cheese samples from the Kvemo Kartli in Georgia, finding Fe concentrations of 69.09±64.918 mg kg-1 in imeruli and 101.1±91.166 mg kg-1 in sulguni cheeses, and to the results of Jalili (2016) who found Fe concentrations between 67.7±4.5 and 71.3±4.9 mg kg-1 in iron-fortified feta cheeses. In contrast, the values for Fe concentration we found exceed the values reported in previous studies made in Turkey by Kirdar et al. (2013) in akcaka tik cheeses (between 7.49 and 29.05 mg kg-1) and by Centinkaya et al. (2016) in cami bogazi cheeses from the Trabzon region (0.371±0.177 mg kg-1), in Egypt, where Meshref et al. (2014) determined Fe concentrations between 1.763 and 17.739 ppm in kareish cheeses from the Beni-Suef region, and in Europe by Reinholds et al. (2020) who found Fe concentrations between 1.57 and 12.4 mg kg-1 in blue cheeses.

3.8. Risk analysis

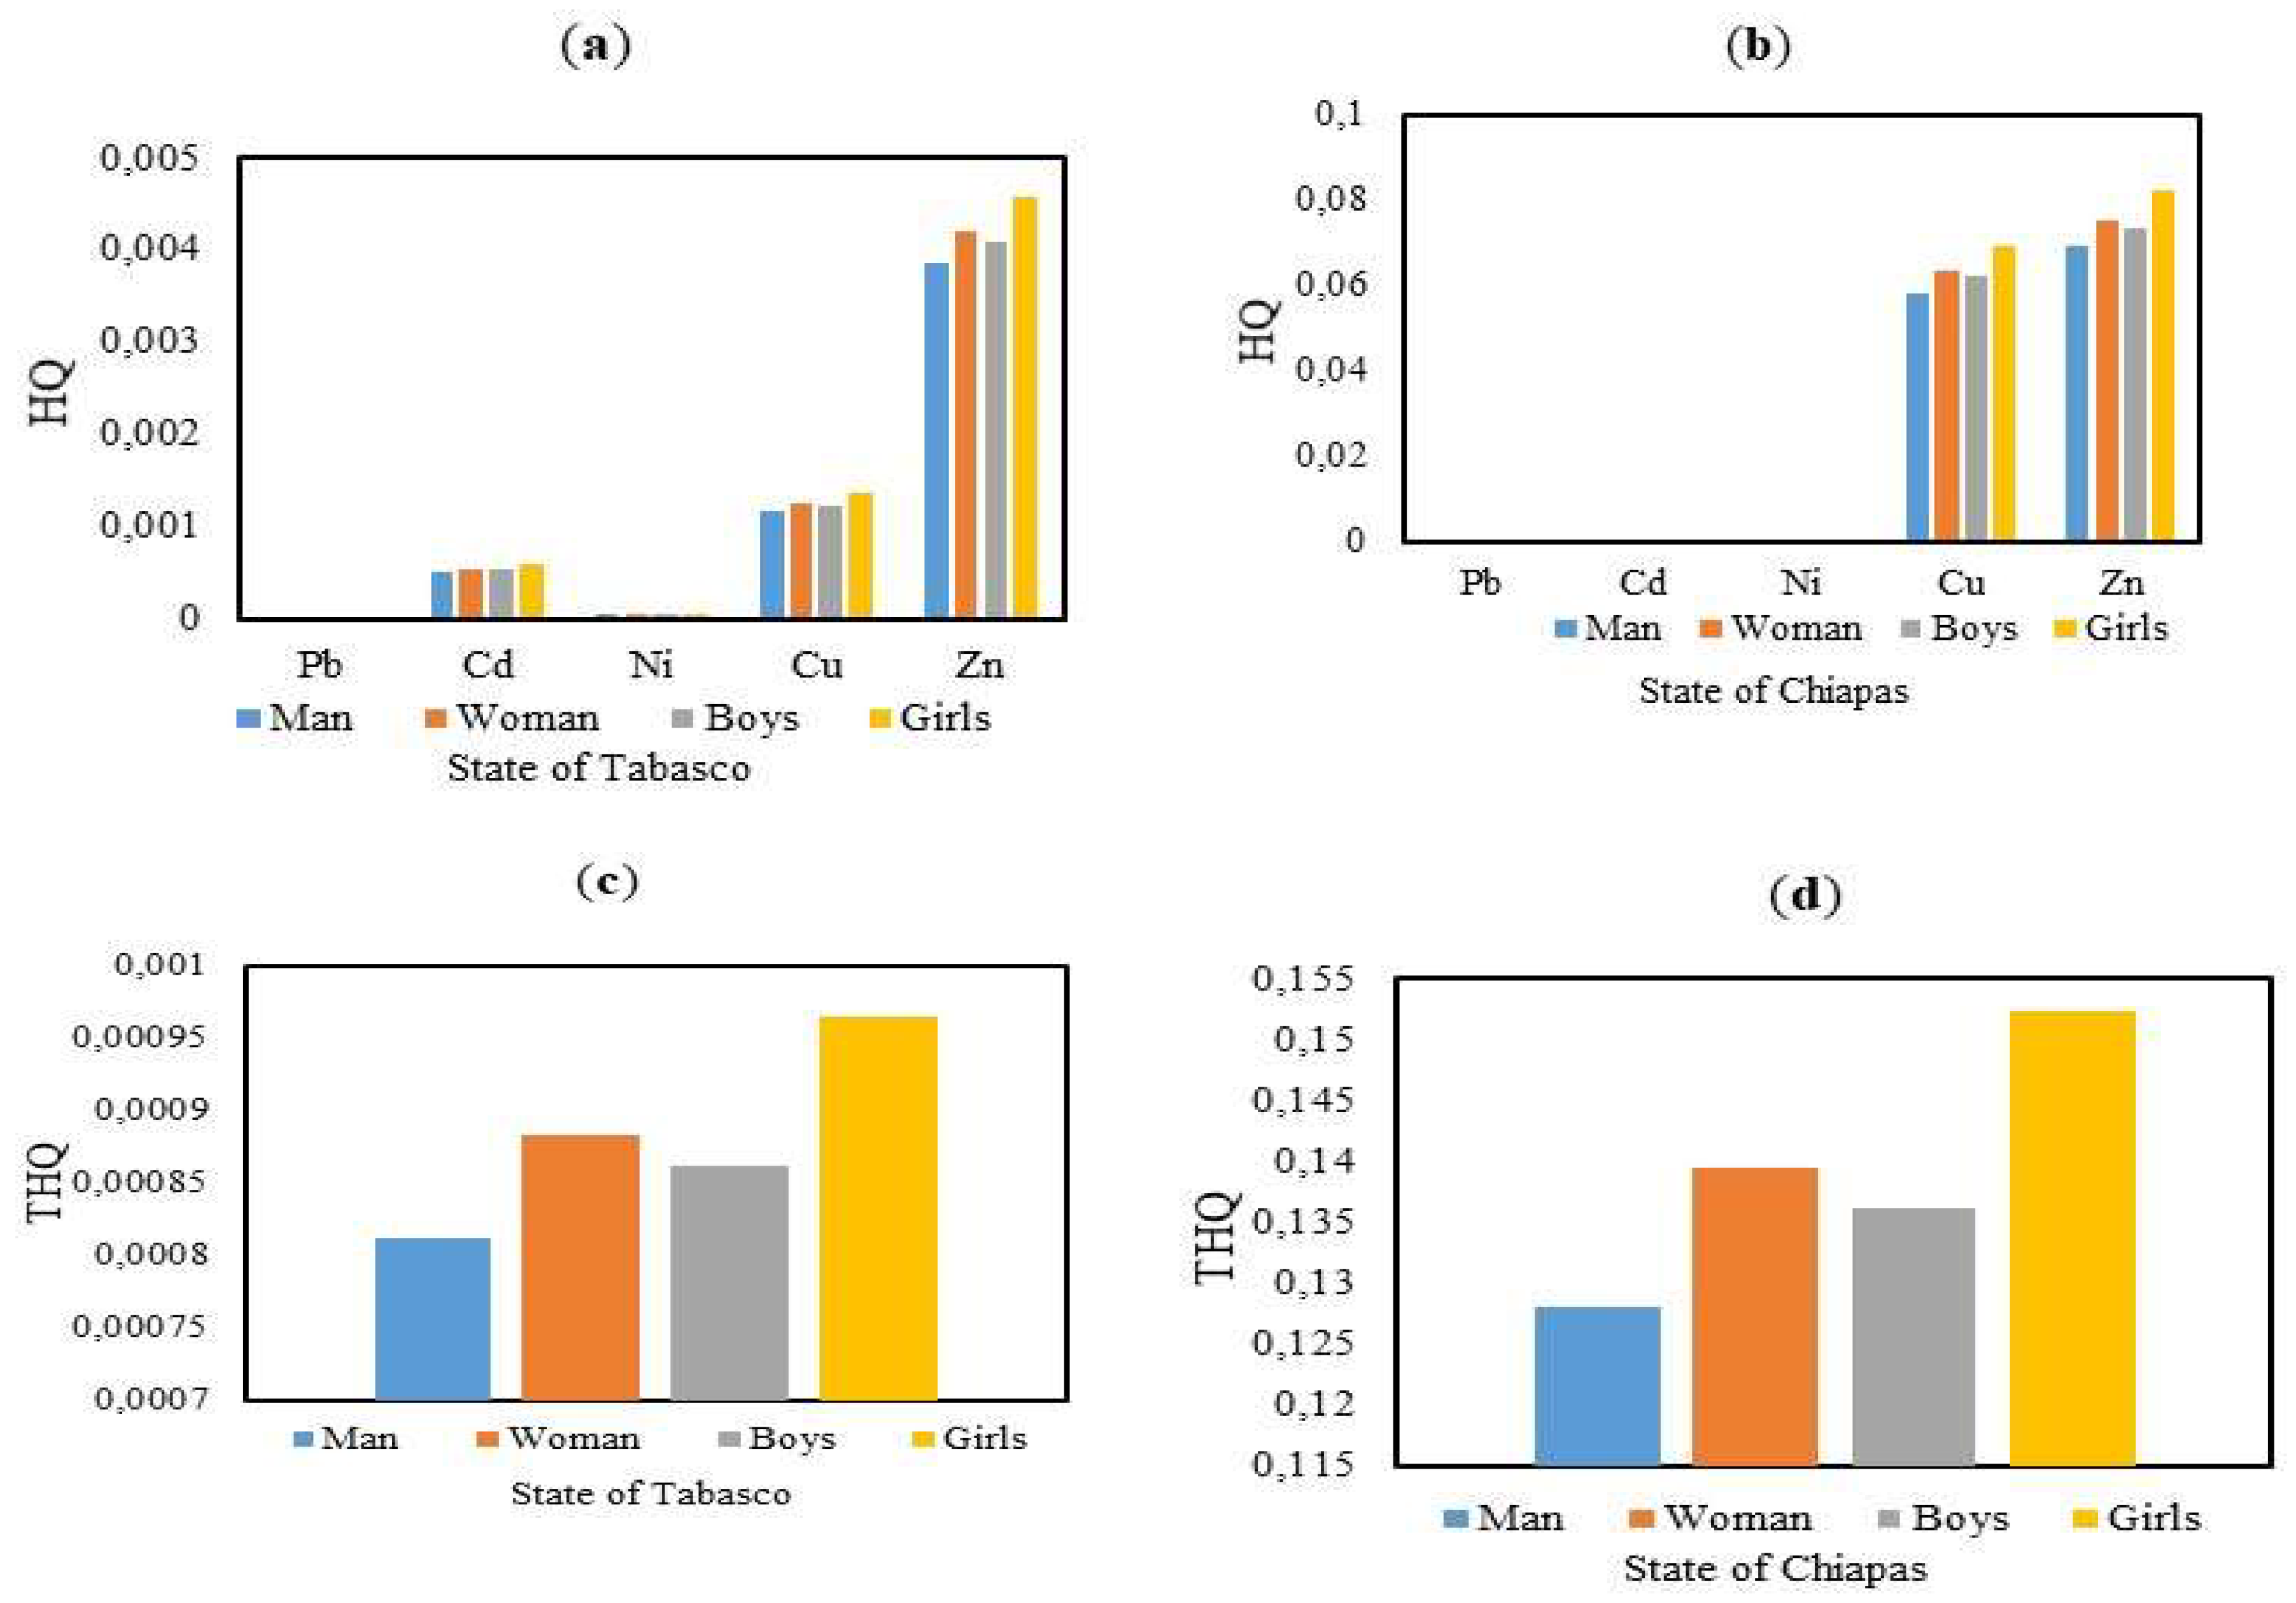
The values of HQ we estimated for the concentrations of the heavy metals lead, cadmium, nickel, copper, and zinc that we determined in cheese samples from Tabasco are shown in Figure 9a, and in Figure 9b for the samples from Chiapas. Zinc, copper, and cadmium were the metals that contributed the most to the HQ values of samples from Tabasco in the order young girls>adult woman>young boys>adult man (Figure 9a), while for cheese samples from Chiapas, zinc and copper were the metals having the highest contribution to the HQ values in the same order as for Tabasco. However, all the THQ values that we estimated were lower than one (Figure 9c and Figure 9d) meaning that there is no risk of developing medical conditions from intake of heavy metals contained in the cheese varieties we analyzed.
In previous studies, Castro et al. (2019) reported values of THQ below one for arsenic in milk samples from the upper Balsas River region in the state of Puebla, Reinholds et al. (2020) found THQ between 0.05 and 0.14 for youngsters, and between 0.03 and 0.09 for adults for the intake of blue cheese consumed by the populations from Denmark, France, Italy, Spain, and the UK. population, and Zafarzadeh et al. (2020) reported THQ values of 1.11, 1.33, and 5.42 for adults and youngsters due to the intake of cadmium-polluted butter from the Gorgan region in Iran, which poses a high health risk for the inhabitants of that geographic area.
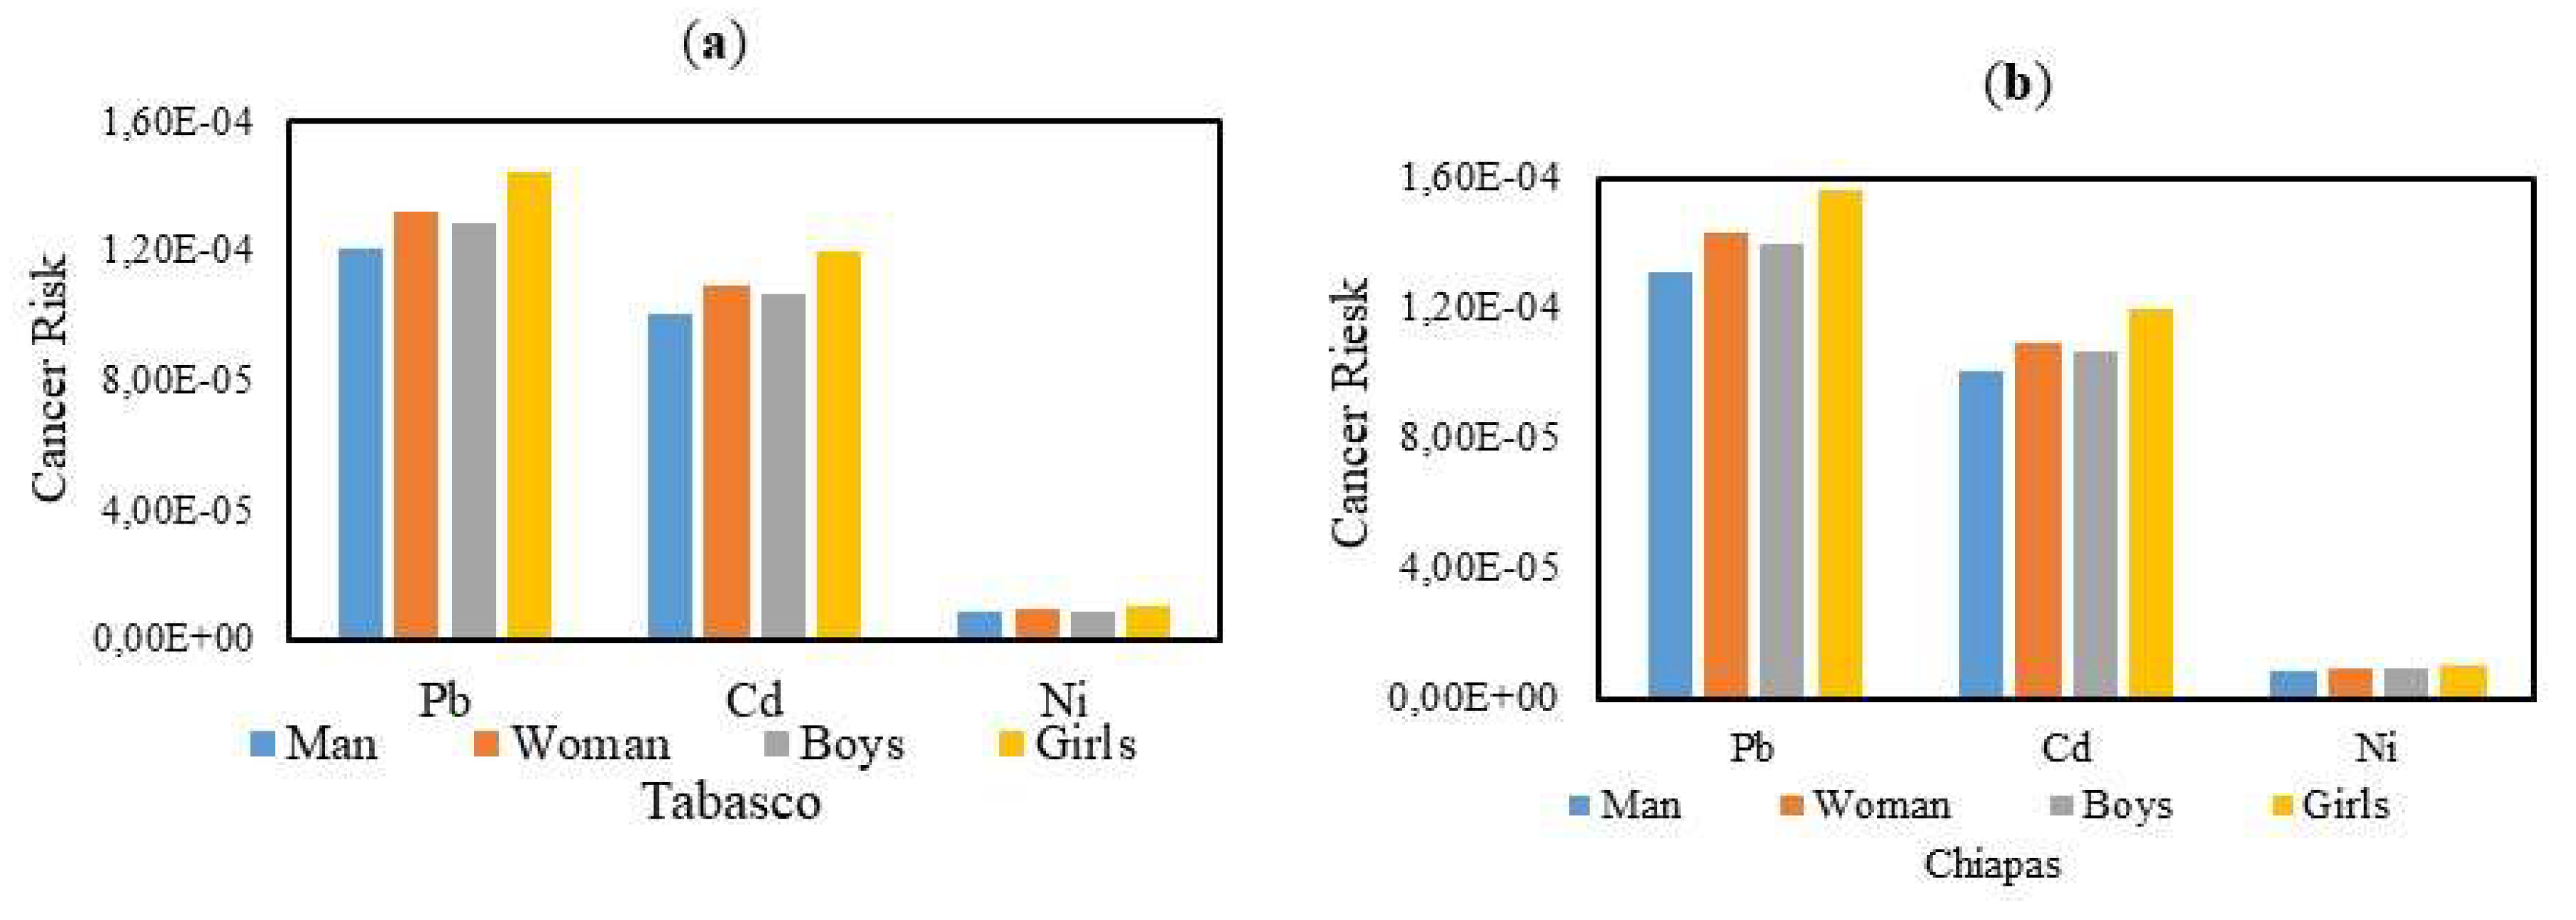
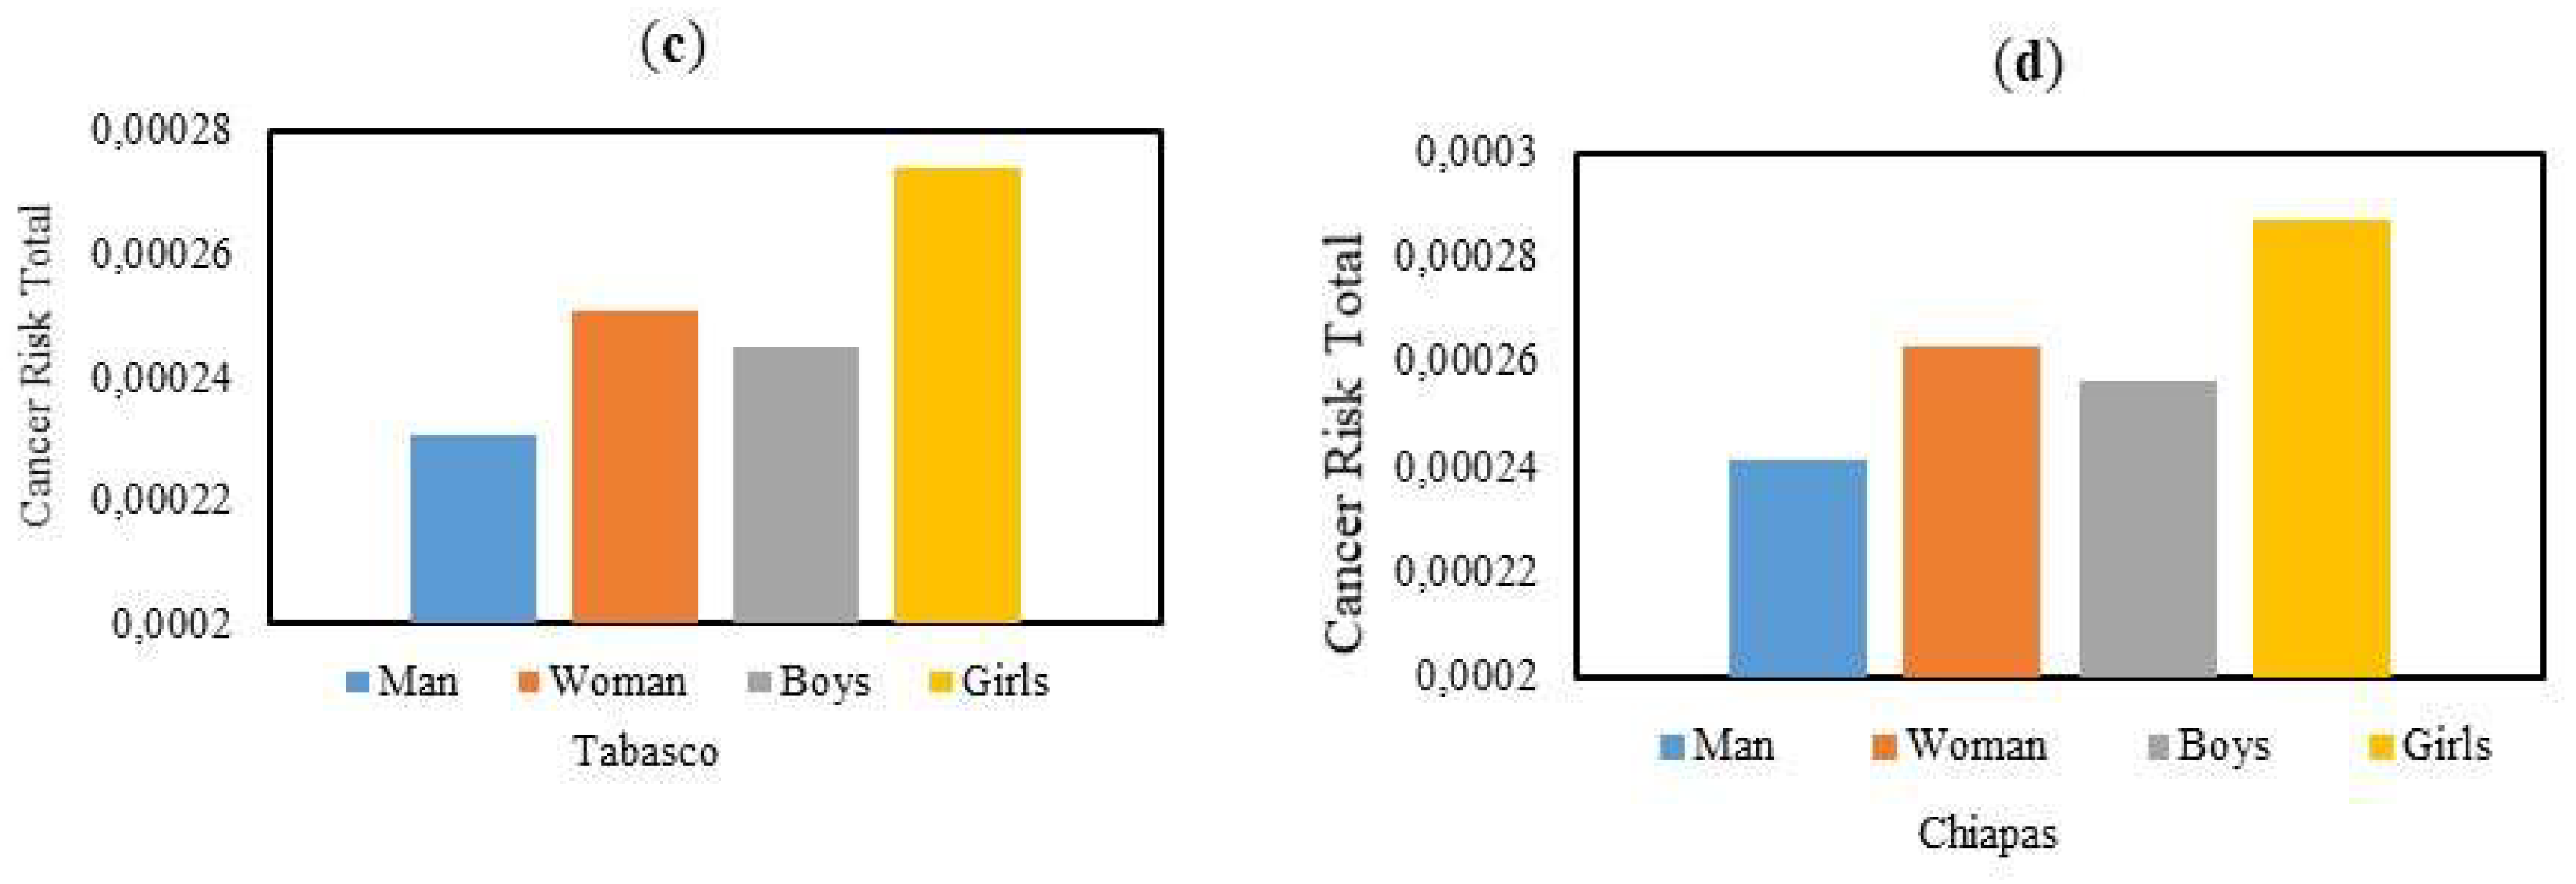
The CR and CRT values we estimated for adults and youngsters are shown in Figure 10a and Figure 10b. In our study, lead and cadmium were the heavy metals that contributed the most to cancer risk, in both states with a higher value for women than for men. The values of CRT were in the decreasing order of young girls>adult woman>young boys>adult man. In general, as seen in Figure 10c and Figure 10d, all the CRT values we estimated were within the range of 10-4–10-6 established by the US-EPA (2002).
Our CRT estimates were lower than the values of 0.0018-0.014 reported by Castro et al. (2019) for children and youngsters in the state of Puebla from the intake of milk containing heavy metals due to contamination of fodder irrigated with the polluted water from the Atoyac, Xochiac, and Xopanac rivers.

4. Conclusions

The contents of Pb, Cd, Ni, Cu, Zn, and Fe in showed no significant differences between cheese samples from the states of Tabasco and Chiapas. The concentrations of Pb, Cd, and Ni that we determined in all cheese samples were below the values established by the Codex Stan Alimentarius (2015) and FAO/WHO (1999). The heavy metals Zn, Cu, and Ni contributed the most to the HQ values. All THQ values were smaller than one, which implies no hazard from the intake of the cheese varieties we analyzed, and were in the descending order young females>adult females>young males>adult males. The heavy metals Pb and Cd contributed the most to the CRT values —which followed the descending order young girls>adult woman>young boys>adult man— that were within the values established by the US-EPA, therefore indicating no cancer risk due to the intake of the analyzed cheeses. Considering the population growth and increased anthropic activities in Tabasco and Chiapas, it is essential to determine the presence in locally made cheeses of other cancerogenic heavy metals like arsenic, mercury, chromium, and vanadium for their incorporation to the estimations of the THQ and CRT values. We attributed the concentrations of Cu, Zn, and Fe in the analyzed cheese samples to the soil types present in Tabasco and Chiapas.

Acknowledgments

We thank the Autonomous University of Carmen for the support given for the development of this work. Likewise, we thank the small producers of artisanal cheeses from the municipalities of Tabasco and Chiapas for providing the cheese samples.

Conflicts of Interest

The authors declare that there are no conflicts of interest.

References

  1. Bakircioglu, D.; Kurtulus, Y.B.; Ucar, G. Determination of some traces metal levels in cheese samples packaged in plastic and tin containers by ICP-OES after dry, wet and microwave digestion. Food Chem. Toxicol. 2010, 49, 202–207. [Google Scholar] [CrossRef] [PubMed]
  2. Benitez, R. A. (2019). Evaluation of microbiological and toxicological quality (heavy metals) in fresh artisan cheese commercialized in Puebla City, Mexico. International Journal of Food Engineering, 5(4), 276-281. [10.18178/ijfe.5.4.
  3. Bermudez, G.M.; Jasan, R.; Plá, R.; Pignata, M.L. Heavy metal and trace element concentrations in wheat grains: Assessment of potential non-carcinogenic health hazard through their consumption. J. Hazard. Mater. 2011, 193, 264–271. [Google Scholar] [CrossRef] [PubMed]
  4. Castro, G. N. P. , Calderón, S. F., Perez, S. M., Castro de Jesús, J., Moreno, R. R., Tamariz, F. J., Perez, S. M., Soní, G. E. (2017). Heavy metals in cow´s milk, cheese produced in areas irrigated with waste water in Puebla, Mexico. Food Additives & Contaminants: Part B, 11(1), 33-36. [10.1080/19393210.2017. 1397. [Google Scholar]
  5. Castro, G. N. P. , Calderón, S. F., Perez, S. M., Soni, G. E., Reyes, C. E. (2019). Health risk due to chronic heavy metal consumption via cow´s milk produced in Puebla, Mexico, in irrigated wastewater areas. Food Additives & Contaminants: Part B, 12(1), 38-44. [10.1080/19393210.2018. 1520. [Google Scholar]
  6. Castro, G. N. P. , Calderón, S. F., Fuentes de María, T. M. T., Silva, M. S. S. González, J. F. E. (2021). Heavy metals in blood, milk and cow´s urine reared in irrigated areas with waste water. Heliyon, 7, 1-6. [10.1016/j.heliyon.2021.e 06693].
  7. etinkaya, A. , Akbaba, G. B., Özçakmak, S., Gülbaz, G. (2016). Mineral and heavy metal content in Camİ Boğazi cheese on Sale in Trabzon, Turkey. GIDA The Journal of Food, 41(5), 317-321. [10.15237/gida.GD 16032]. 1603. [Google Scholar]
  8. Codex Stan Alimentarius. (2015). International Food Standards. World Health Organization, 1-62. www.codexalimentarius.org.
  9. De la Cruz, P. A. , Zavala, C. J., Guerrero, P. A., Salgado, G. S., Lagunés, E. L. C., Gavi, R. F. (2012). Heavy metals in soils cultivated with sugar cane in the Chontalpa, Tabasco. Journal Universidad y Ciencias,F. ( 28(2), 119-–130.
  10. EFSA (European Food Safety Authority, 2013). Scientific Opinion on nutrient requirements and dietary intakes of infants and young children in the European Union. EFSA Panel on Dietetic Products, Nutrition and Allergies (NDA). Eur. Food Saf. Auth. (EFSA) Parma Italy EFSA J., 11, 3408. [CrossRef]
  11. Elbarbary, H.A.; Hamouda, A.F. Variations in some heavy metals’ level during processing of soft cheese. J. Food Meas. Charact. 2013, 7, 194–198. [Google Scholar] [CrossRef]
  12. European Commission (EC). (2001). Setting maximum levels for certain contaminants in food stuffs. Off. J. Eur. Communities, 77, 1–75. [https://europa.eu/en/publication-detail/-/publication/52b2484d-39e0-4aa9-ba19-4b13a887bb1c]. 2484.
  13. Environmental Protection Agency; National Air Toxics Assessment (NATA). 2014 NATA: Technical Support Document. 2014. Available online: [https://www.epa.gov/national-air-toxics-assessment/2014-nata-technicalsupport-document]. 2014.
  14. FAO/WHO. (1999). Joint FAO/WHO foods standards programed. Expert committee on the food additives, summary and conclusions, in: 53rd Meeting, Rome, June1-10. [chrome-extension://efaidnbmnnnibpcajpcglclefindmkaj/http://www.leffingwell.com/Summary%20and%20Conclusions%20of%20the%20Fifty-third%20meeting.pdf].
  15. Fiedler, S.; Siebe, C.; Herre, A.; Roth, B.; Cram, S.; Stahr, K. Contribution of Oil Industry Activities to Environmental Loads of Heavy Metals in the Tabasco Lowlands, Mexico. Water, Air, Soil Pollut. 2009, 197, 35–47. [Google Scholar] [CrossRef]
  16. Ghafari, H.R.; Sobhanardakani, S. Contamination and Health Risks from Heavy Metals (Cd and Pb) and Trace Elements (Cu and Zn) in Dairy Products. Iran. J. Heal. Sci. 2017, 5, 49–57. [Google Scholar] [CrossRef]
  17. González, C. A. F. , Yescas, C., Ortiz, E. A. M., De la Rosa, A. M. A., Hernández, M. A., Vallejo, C. B. (2016). Artisanal Mexican Cheeses. Journal of Dairy Science, 99(5), 3250-3262. [10.3168/jds.2015-10103]. 2015. [Google Scholar]
  18. Gupta, D. K. , Chatterjee, S., Datta, S., Veer, V., Walther, C. (2014). Role of phosphate fertilizers in heavy metal uptake and detoxication of toxic metals. Chemosphere, 108, 134-144. [10.1016/j.chemosphere.2014.01.030].
  19. Izah, S.C.; Chakrabarty, N.; Srivastav, A.L. A Review on Heavy Metal Concentration in Potable Water Sources in Nigeria: Human Health Effects and Mitigating Measures. Water Qual. Expo. Heal. 2016, 8, 285–304. [Google Scholar] [CrossRef]
  20. Jaishankar, M.; Tseten, T.; Anbalagan, N.; Mathew, B.B.; Beeregowda, K.N. Toxicity, mechanism and health effects of some heavy metals. Interdiscip. Toxicol. 2014, 7, 60–72. [Google Scholar] [CrossRef]
  21. Jalili, M. Chemical composition and sensory characteristics of Feta cheese fortified with iron and ascorbic acid. Dairy Sci. Technol. 2016, 96, 579–589. [Google Scholar] [CrossRef]
  22. Kirdar. S. S., Ocak, E., Köse, S. (2013). Mineral and trace metal levels of Akcakatic cheese collected form Mediterranean region-Turkey. Asian Journal of Chemistry, 25(3), 1643-1646. [CrossRef]
  23. Lante, A.; Lomolino, G.; Cagnin, M.; Spettoli, P. Content and characterisation of minerals in milk and in Crescenza and Squacquerone Italian fresh cheeses by ICP-OES. Food Control. 2006, 17, 229–233. [Google Scholar] [CrossRef]
  24. Manríquez, L. , Moreno, A., Tenorio, R. E., Herrera, D. (2000). Guide to world crudes. Four Mexican crude assays update. Oil & Gas Journal, 15, 54-57.
  25. Mendil, D. Mineral and trace metal levels in some cheese collected from Turkey. Food Chem. 2006, 96, 532–537. [Google Scholar] [CrossRef]
  26. Meshref, A.M.S.; Moselhy, W.A.; Hassan, N.E.-H.Y. Heavy metals and trace elements levels in milk and milk products. J. Food Meas. Charact. 2014, 8, 381–388. [Google Scholar] [CrossRef]
  27. Moreno, R. R. , Sanchez, S. P. J., Cámara, M. F., Amparo, L. M. A. (2010). Heavy metal levels in Spanish cheeses: influence of manufacturing conditions. Food Additives and Contaminants: Part B, 3(2), 90-100. [10.1080/19440049.2010.491838]. 4918. [Google Scholar]
  28. Naseri, K. , Salmani, F., Zeinali, M., Zeinali, T. (2021). Health risk assessment of Cd, Cr, Cu, Ni and Pb in the muscle, liver and gizzard of hen’s marketed in East of Iran. Toxicology Reports, 8, 53-59. [CrossRef]
  29. Noël, L.; Chekri, R.; Millour, S.; Vastel, C.; Kadar, A.; Sirot, V.; Leblanc, J.-C.; Guérin, T. Li, Cr, Mn, Co, Ni, Cu, Zn, Se and Mo levels in foodstuffs from the Second French TDS. Food Chem. 2012, 132, 1502–1513. [Google Scholar] [CrossRef] [PubMed]
  30. Nom-243-ssa1-2020. (2010). Official Mexican Standard. Productos y servicios. Leche, Formula láctea y producto lácteo combinado. Especificaciones sanitarias. [http://dof.gob.mx/nota_detalle_popup.php?codigo=5160755]. 5160.
  31. OECD/FAO. Agricultural Outlook 2018–2027.
  32. Olivares, A. V. , Valverde, S. L., Quiroz, R. V., García, R. R, Muñoz, N., Navarro, A. M., Cabrera V. C. (2015). Níquel en alimentos y factores influyentes en sus niveles, ingesta, biodiesponibilidad y toxicidad: una revisión. CyTA-Journal of Food, 13(1), 87-101. [CrossRef]
  33. Olujimi, O. O. , Abubakar, R., Faburoso, E., Sodiya, C. I., Ojo, O. E., Towolawi, A. T. (2018). Levels of heavy metals in local milk and cheese, and phthalate esters in cheese by settled Fulani pastoralists in Ogun and Oyo States, Nigeria. Nigerian Food Journal, 36(1), 12-20. 0: [eISSN 0189-7241], 0189. [Google Scholar]
  34. Orak, H. , Altun, M, Ercag, E. Survey of heavy metals in Turkish white cheese. Italian Journal Food Science, 17, 95–100.
  35. Palma-López, D. J. , Cisneros, D. J., Moreno, C. E., Rincón-Ramírez, J. A. (2007). Suelos de Tabasco: su uso y manejo sustentable. Colegio de Postgraduados-ISPROTAB-Fundacion Produce Tabasco. Villahermosa, Tabasco, México.
  36. Quintanilla, M. M. , Gold, B. G., Zapata, P. O., Rubio, P. J., Quiroz, M. A., Vidal, M. V., Aguirre, M. M., Puch, H. C. (2020). Biological responses of shoal flounder (Syacium gunteri) to toxic environmental pollutants from the southern Gulf of Mexico. Environmental Pollution, 258, 1-13. [10.1016/j.envpol.2019. 1136. [Google Scholar]
  37. Reinholds, I.; Rusko, J.; Pugajeva, I.; Berzina, Z.; Jansons, M.; Kirilina-Gutmane, O.; Tihomirova, K.; Bartkevics, V. The Occurrence and Dietary Exposure Assessment of Mycotoxins, Biogenic Amines, and Heavy Metals in Mould-Ripened Blue Cheeses. Foods 2020, 9, 93. [Google Scholar] [CrossRef] [PubMed]
  38. Rincón, M. C. I. , Hernández, G. J. A., Rincón, R. R., Gutiérrez, M. F. A., Ramírez, V. D. A., González, T.E. (2018). Structure and Diversity of the Bacterial Communities in the Acid and Thermophilic Crater-Lake of the Volcano "El Chichón", Mexico. Geomicrobiology Journal, 36, 1-13. [CrossRef]
  39. Romero, E. D. , Yañez, J. G. S., Simbaña, F. K., Navarrete, H. (2019). Distribution, contents, and health risk assessment of cadmium, lead, and nickel in bananas produced in Ecuador. Foods, 8 (330), 1-11. [10. 3390. [Google Scholar]
  40. Salgado, G. S. , Palma, L. D. J, Zavala, C. J., Córdova, S. S., Castelán, E. M. (2016). Sustainable fertilization program for plantations of citrus in Tabasco, Mexico. Journal Ecosistemas y Recursos Agropecuarios 3(9), 345–356.
  41. Sieba, C. , Cram, S., Herre, A., Fernández B. N. (2005). Distribución de metales pesados en los suelos de la llanura alluvial baja del activo Cinco Presidentes, Tabasco, Mexico. In A. V. Botello, J. Rendón von Osten, G. Gold-Bouchot & C. Agraz-Hernández (Eds.), Golfo de México-Contaminación e Impacto Ambiental, Diagnostico y Tendencias (pp. 385-403). Universidad Autónoma de Campeche-UNAM.
  42. US-EPA. (2002). United States Environmental Protection Agency. Washington (DC): Supplemental Guidance for Developing Soil Screening Levels for Superfund Sites Office of Solid Waste and Emergency Response. [http://rais.ornl.gov/documents/SSG_nonrad_supplemental.pdf.
  43. US-EPA-IRIS. Nickel, soluble salts; CASRN Various. Integrated Risk Information System (IRIS) Chemical Assessment Summary, File First On-Line 09/30/1987. Available online: [https://cfpub.epa.gov/ncea/iris/iris_documents/documents/subst/0271_summary.pdf.
  44. Villanueva, F.S. , Botello, A. V. (2005). Vigilancia y presencia de metales tóxicos en la laguna el Yucateco, Tabasco, México. In: A. V. Botello, J. Rendón-von Osten, G. Gold-Bouchot & C. Agraz-Hernández (Eds.), Golfo de México-Contaminación e Impacto Ambiental, Diagnostico y Tendencias (pp. 407-430). Universidad Autónoma de Campeche-UNAM.
  45. Yüzbaşı, N.; Sezgin, E.; Yıldırım, M.; Yıldırım, Z. Survey of lead, cadmium, iron, copper and zinc in Kasar cheese. Food Addit. Contam. 2003, 20, 464–469. [Google Scholar] [CrossRef] [PubMed]
  46. Zafarzadeh, A.; Bonyadi, Z.; Feyzi, K. Health risk assessment related to cadmium in dairy products in Gorgan, Iran. Int. J. Environ. Anal. Chem. 2020, 102, 4058–4066. [Google Scholar] [CrossRef]
  47. Zhang, F.; Yan, X.; Zeng, C.; Zhang, M.; Shrestha, S.; Devkota, L.P.; Yao, T. Influence of Traffic Activity on Heavy Metal Concentrations of Roadside Farmland Soil in Mountainous Areas. Int. J. Environ. Res. Public Health 2012, 9, 1715–1731. [Google Scholar] [CrossRef] [PubMed]
  48. Ziarati, P. , Shirkhan, F., Mostafidi, M., Tamaskani, Z. M. (2018). An Overview of the Heavy Metal Contamination in Milk and Dairy Products. Acta Scientific Pharmaceutical Sciences 2(7), 8-21. http://www.inegi.org.mx.
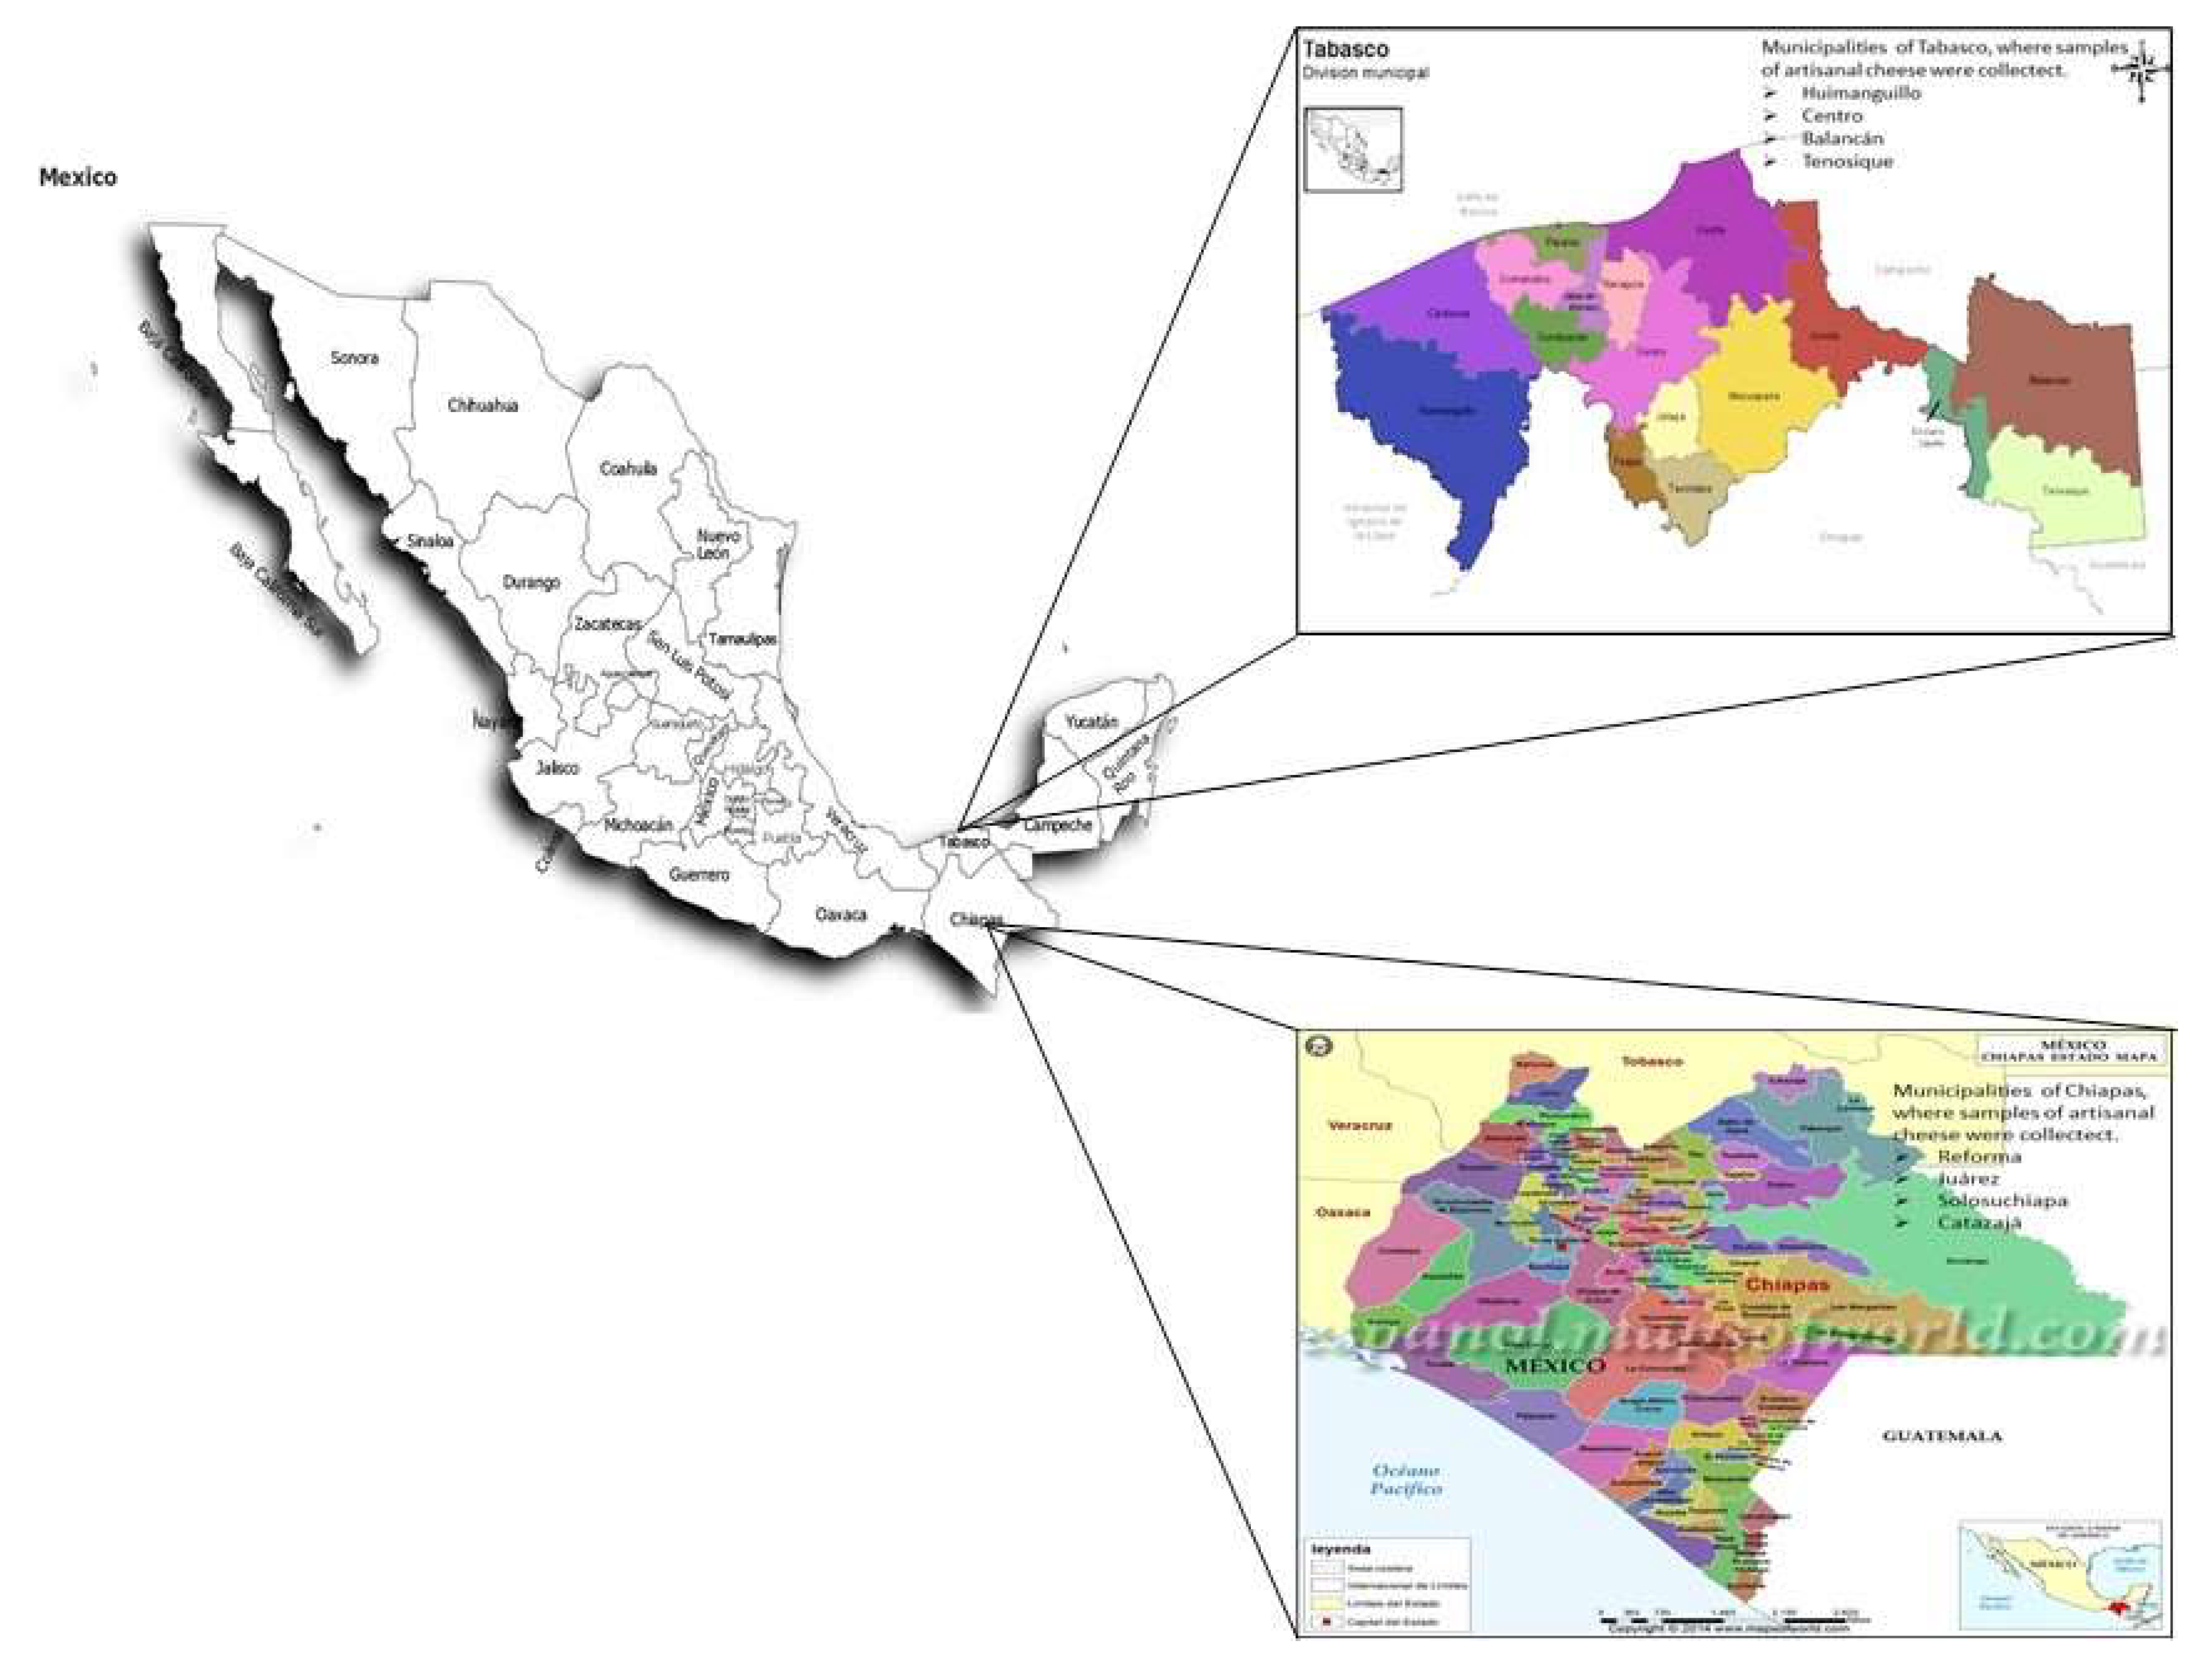
Figure 1. Municipalities of Tabasco and Chiapas, where samples of artisanal cheese were collected.
Preprints 87611 g001
Figure 2. Artisanal cheeses from tabasco and Chiapas: (a) double cream, (b) cream or soup, (c) oaxaca, (d) panela, (e) Cotija, (f) fresco, (g) mozzarella, (h) provolone.
Preprints 87611 g002
Figure 3. Distribution of lead in the different varieties of artisanal cheeses (a), and comparison of lead concentrations between cheeses from Tabasco and Chiapas (b).
Preprints 87611 g003
Figure 4. Distribution of cadmium in the different varieties of artisanal cheeses (a) and comparison of cadmium concentrations between cheeses from Tabasco and Chiapas (b).
Preprints 87611 g004
Figure 5. Distribution of nickel in the different varieties of artisanal cheeses (a), and comparison of nickel concentrations between cheeses from Tabasco and Chiapas (b).
Preprints 87611 g005
Figure 6. Distribution of copper in the different varieties of artisanal cheeses (a), and comparison of copper concentrations between cheeses from Tabasco and Chiapas (b).
Preprints 87611 g006
Figure 7. Distribution of zinc in the different varieties of artisanal cheeses (a), and comparison of zinc concentrations between cheeses from Tabasco and Chiapas (b).
Preprints 87611 g007
Figure 8. Distribution of iron in the different varieties of artisanal cheeses (a), and comparison of iron concentrations between cheeses from Tabasco and Chiapas (b).
Preprints 87611 g008
Figure 9. Values of the risk index and contribution of each metal for adults and youngsters (Figure 9 a, b); values of the total risk index for adults and youngsters (Figure 9 c, d).
Preprints 87611 g009
Figure 10. Values of the cancer risk index and contribution of each metal, for adults and youngsters (a, b); values of the CRT index for adults and youngsters (c, d).
Preprints 87611 g010aPreprints 87611 g010b
Table 1. Oral reference dose (RfD) values and slope factors (Sf) of metal considered to be cancerogeneous.
Heavy metal RfD (mg kg-1)* Sf (mg kg-1 día-1)*
Cu* 0.037 -
Ni* 0.02 0.1
Pb** 0.036 0.0085
Cd** 0.001 0.005
Zn* 0.3 -
*US-EPA (2017)
** Bermúdez et al. (2011).
Table 2. Metal concentrations in mg kg-1 in samples of different varieties of artisan cheeses made in the state of Tabasco, Mexico.
cheese variety Municipality Pb Cd Ni Cu Zn Fe
double cream Tenosique 0.0047 0.0027 0.0002 0.0305 0.0443 62.48
double cream Tenosique 0.0040 0.0021 0.0054 0.0212 0.0204 61.79
oaxaca Tenosique 0.0035 0.0000 0.0024 0.0354 0.1494 58.48
oaxaca Tenosique 0.0047 0.0004 0.0048 0.0059 0.0496 62.41
oaxaca Tenosique 0.0028 0.0001 0.0032 0.0437 0.2443 72.76
oaxaca Balancán 0.0029 0.0015 0.0005 0.0098 0.0823 59.65
cream or soup Balancán 0.0046 0.0031 0.0096 0.0219 0.0532 62.73
double cream Balancán 0.0043 0.0019 0.0037 0.0269 0.1271 68.26
double cream Balancán 0.0057 0.0037 0.0012 0.0129 0.0904 55.97
cream or soup Balancán 0.0078 0.0049 0.0018 0.0304 0.2418 60.04
fresh Balancán 0.0068 0.0037 0.0042 0.0078 0.2785 58.38
oaxaca Balancán 0.0041 0.0001 0.0041 0.0069 0.1554 58.39
cream or soup Centro 0.0092 0.0063 0.0078 0.0402 0.0808 62.39
panela Centro 0.0043 0.0019 0.0004 0.0059 0.1436 58.82
oaxaca Centro 0.0044 0.0031 0.0005 0.0083 0.0499 56.92
oaxaca Centro 0.0036 0.0016 0.0011 0.0102 0.0317 57.67
mozzarella Huimanguillo 0.0035 0.0026 0.0007 0.0112 0.1019 63.58
provolone Huimanguillo 0.0048 0.0001 0.0015 0.0275 0.1653 58.52
fresh Huimanguillo 0.0034 0.0002 0.0033 0.0081 0.2659 68.29
panela Huimanguillo 0.0043 0.0075 0.0019 0.0117 0.2542 56.07
panela Huimanguillo 0.0039 0.0013 0.0009 0.0154 0.2927 56.93
fresh Huimanguillo 0.0005 0.0004 0.0022 0.0098 0.2435 59.46
fresh Huimanguillo 0.0041 0.0002 0.0021 0.0108 0.2447 58.56
panela Huimanguillo 0.0047 0.0021 0.0034 0.0346 0.2231 57.98
double cream Huimanguillo 0.0004 0.0047 0.0048 0.0298 0.0271 58.72
panela Huimanguillo 0.0044 0.0001 0.0038 0.0135 0.2738 56.61
double cream Huimanguillo 0.0038 0.0027 0.0069 0.0356 0.1008 56.18
panela Huimanguillo 0.0031 0.0011 0.0027 0.0093 0.3008 67.77
oaxaca Huimanguillo 0.0043 0.0019 0.0042 0.0136 0.2645 69.53
panela Huimanguillo 0.0039 0.0003 0.0056 0.0115 0.2842 64.21
cream or soup Huimanguillo 0.0063 0.0027 0.0087 0.0219 0.1135 63.98
double cream Huimanguillo 0.0039 0.0035 0.0092 0.0298 0.0413 67.28
panela Huimanguillo 0.0042 0.0009 0.0052 0.0167 0.2348 63.61
fresh Huimanguillo 0.0041 0.0006 0.0034 0.0101 0.2598 63.34
oaxaca Huimanguillo 0.0037 0.0009 0.0023 0.0177 0.1902 62.79
oaxaca Huimanguillo 0.0064 0.0000 0.0015 0.0198 0.2295 62.56
cream or soup Huimanguillo 0.0044 0.0026 0.0092 0.0257 0.0961 63.03
oaxaca Huimanguillo 0.0084 0.0007 0.0039 0.0271 0.2095 61.47
oaxaca Huimanguillo 0.0051 0.0000 0.0049 0.0209 0.1774 62.78
oaxaca Huimanguillo 0.0043 0.0014 0.0044 0.0189 0.1805 63.15
double cream Huimanguillo 0.0052 0.0156 0.0132 0.0378 0.0912 72.08
cream or soup Huimanguillo 0.0125 0.0039 0.0032 0.0279 0.1121 61.77
oaxaca Huimanguillo 0.0049 0.0011 0.0029 0.0088 0.1962 61.63
double cream Huimanguillo 0.0072 0.0084 0.0042 0.0355 0.0708 62.04
average 0.0047±0.002 0.0023±0.002 0.0039±0.004 0.0199 ±0.02 0.1611±0.18 61.84±4.23
maximum 0.0125 0.0056 0.0132 0.0437 0.3008 72.76
minimum 0.0004 0 0.0002 0.0059 0.0204 55.97
Table 3. Metal concentrations in mg kg-1 in samples of different varieties of artisan cheeses made in the state of Chiapas, Mexico.
cheese variety Municipality Pb Cd Ni Cu Zn Fe
double cream Solosuchiapa 0.0029 0.0041 0.0063 0.0177 0.1114 65.34
oaxaca Solosuchiapa 0.0081 0.0000 0.0019 0.0098 0.2669 58.52
panela Solosuchiapa 0.0007 0.0003 0.0012 0.0072 0.3308 60.89
cotija Solosuchiapa 0.0047 0.0051 0.0009 0.0113 0.2047 65.98
panela Solosuchiapa 0.0078 0.0034 0.0017 0.0059 0.1325 63.75
panela Solosuchiapa 0.0067 0.0013 0.0031 0.0154 0.2112 72.94
cotija Solosuchiapa 0.0056 0.0043 0.0043 0.0337 0.1664 63.33
cotija Juárez 0.0047 0.0038 0.0075 0.0283 0.3708 67.89
cotija Juárez 0.0039 0.0037 0.0056 0.0235 0.2157 64.52
cotija Juárez 0.0049 0.0062 0.0037 0.0319 0.2654 62.19
cream or soup Juárez 0.0051 0.0055 0.0091 0.0288 0.0766 70.49
oaxaca Juárez 0.0083 0.0009 0.0016 0.0112 0.1839 57.96
double cream Juárez 0.0069 0.0077 0.0015 0.0267 0.0748 64.86
double cream Juárez 0.0035 0.0044 0.0039 0.0329 0.3699 65.65
oaxaca Juárez 0.0033 0.0017 0.0052 0.0107 0.3145 65.79
oaxaca Juárez 0.0047 0.0033 0.0044 0.0198 0.4369 76.67
oaxaca Catazajá 0.0041 0.0013 0.0038 0.0067 0.2254 70.74
oaxaca Catazajá 0.0003 0.0021 0.0021 0.0138 0.0677 64.91
oaxaca Catazajá 0.0031 0.0027 0.0029 0.0103 0.2691 68.37
double cream Catazajá 0.0075 0.0033 0.0078 0.0303 0.0642 65.87
cream or soup Catazajá 0.0069 0.0031 0.0067 0.0281 0.0742 64.39
double cream Catazajá 0.0084 0.0037 0.0025 0.0259 0.0787 72.33
oaxaca Catazajá 0.0041 0.0011 0.0030 0.0155 0.2228 64.15
double cream Catazajá 0.0069 0.0029 0.0039 0.0281 0.0665 65.94
double cream Catazajá 0.0053 0.0033 0.0046 0.0277 0.0776 64.68
oaxaca Catazajá 0.0008 0.0046 0.0026 0.0117 0.1505 64.02
cotija Catazajá 0.0088 0.0047 0.0079 0.0267 0.2081 72.09
cotija Catazajá 0.0045 0.0032 0.0061 0.0198 0.1735 64.75
cotija Catazajá 0.0081 0.0041 0.0044 0.0319 0.1996 65.82
panela Catazajá 0.0005 0.0007 0.0025 0.0167 0.2697 63.81
cotija Catazajá 0.0041 0.0046 0.0027 0.0337 0.1908 66.58
panela Catazajá 0.0011 0.0002 0.0006 0.0219 0.2364 64.33
panela Catazajá 0.0009 0.0001 0.0019 0.0201 0.2062 67.51
double cream Reforma 0.0067 0.0049 0.0054 0.0354 0.0489 55.82
panela Reforma 0.0022 0.0023 0.0009 0.0285 0.1395 59.86
fresh Reforma 0.0067 0.0011 0.0003 0.0197 0.1879 67.26
double cream Reforma 0.0089 0.0051 0.0058 0.0205 0.0421 57.61
cream or soup Reforma 0.0056 0.0045 0.0041 0.0322 0.1341 58.04
double cream Reforma 0.0073 0.0026 0.0036 0.0167 0.0912 65.87
oaxaca Reforma 0.0062 0.0019 0.0005 0.0139 0.3378 65.83
oaxaca Reforma 0.0033 0.0034 0.0022 0.0112 0.2359 97.41
oaxaca Reforma 0.0056 0.0008 0.0019 0.0209 0.1832 67.61
oaxaca Reforma 0.0063 0.0037 0.0035 0.0223 0.2877 57.62
oaxaca Reforma 0.0034 0.0003 0.0007 0.0202 0.2301 64.13
average 0.0051 ±0.002 0.0023±0.002 0.0031±0.004 0.0202±0.022 0.194 ±0.21 65.76±6.61
maximum 0.0089 0.0077 0.0091 0.0354 0.437 97.41
minimum 0.0003 0.0000 0.0003 0.0059 0.0421 55.82
Disclaimer/Publisher’s Note: The statements, opinions and data contained in all publications are solely those of the individual author(s) and contributor(s) and not of MDPI and/or the editor(s). MDPI and/or the editor(s) disclaim responsibility for any injury to people or property resulting from any ideas, methods, instructions or products referred to in the content.
Copyright: This open access article is published under a Creative Commons CC BY 4.0 license, which permit the free download, distribution, and reuse, provided that the author and preprint are cited in any reuse.
Prerpints.org logo

Preprints.org is a free preprint server supported by MDPI in Basel, Switzerland.

Subscribe

© 2024 MDPI (Basel, Switzerland) unless otherwise stated