Submitted:
09 October 2023
Posted:
10 October 2023
You are already at the latest version
Abstract
In this study, seventeen faceted gem-quality chrysoberyls exhibiting an attractive canary yellow color were investigated by a series of gemological, spectral, and chemical methods. Microscopic observation reveals distinct growth lines and inclusions, including CO2 fluids, carbon, and mineral crystals such as calcite, quartz, sillimanite, and mica, identified by the Raman spectrum. The FTIR spectrum exhibits the 2405 and 2160 cm-1 feature peaks and a 3223 cm-1 peak in all samples, which can be accompanied by the 3112 cm-1 shoulder, 3301, and 3412 and 3432 cm-1 peaks. The UV-Vis spectrum shows a Fe-related peak at 440 nm, along with the 650–660 nm band and the absorption band in the blue zone of the visible light. The chemical results of EDXRF reveal a V-poor, Cr-poor, and Fe-rich feature. The spectral and chemical results could contribute to explaining the origin of the canary yellow color, which originates from the abundant amount of Fe with very little influence from Cr or V.
Keywords:
chrysoberyl
; Raman
; trace elements
; CIELab
1. Introduction
The chrysoberyl crystal lattice is composed of oxygen ions organized in a hexagonal close-packed array (Figure 1), with beryllium and aluminum ions filling the octahedral interstices between them [1,2,3], which gives chrysoberyl a comparatively high Mohs hardness of 8.5, making it one of the hardest gemstones after diamonds, rubies, and sapphires.
Chrysoberyl is a mineral that has been known and used for centuries. It was first described by Swedish mineralogist Axel Frederik Cronstedt in 1758, and the name comes from the Greek words “chrysos” meaning golden, and “beryllos” meaning beryl [4]. He named the mineral “chrysoberyl” in honor of its golden hue.
Certain varieties of chrysoberyl exhibit the chatoyancy, or cat’s eye effect, which is brought on by parallel needle-like inclusions within the crystal structure, usually made of rutile or hematite. Due to the way these imperfections reflect light, a bright line that resembles a cat’s eye appears across the gemstone’s surface [5].
Alexandrite, one of the most well-known types of chrysoberyl, was initially found in the Ural Mountains of Russia in the early 19th century. It was given the name Alexander II after Czar Alexander II, who turned 18 on the day it was founded [6]. Its ability to change color under various lighting conditions—appearing green in daylight and reddish-purple in incandescent light—makes alexandrite highly prized [7]. Currently, alexandrite can be found in many localities, including Russia, Tanzania, Zimbabwe, Brazil as well as Sri Lanka, etc. [5,6,8,9,10]. Recently, a study has demonstrated the originated determination of alexandrite from various localities owing to their important economic value in the gem trade [11].
Chrysoberyl has been used throughout history as a gemstone and for decorative purposes. In ancient times, it was believed to have protective properties and was often worn as an amulet or talisman. Today, it is still highly valued as a gemstone due to its beauty and durability and is often used in high-end jewelry. In this article, the common chrysoberyl refers to chrysoberyl that does not exhibit color changing or chatoyance effect. Even though they share an identical crystalline structure and belong to the same mineral [12], the alexandrite and cat’s eye possess a high reputation and command much higher prices than the common chrysoberyl in the gem trade.
However, the trend of undervaluation of the common chrysoberyl has been turned around as much more chrysoberyl of attractive color has entered the gem market. In recent years, green chrysoberyl has entered the market and gained considerable attention, showing a strong rise in popularity [13]. These green varieties usually exhibit a green hue of medium to high saturation owing to the trace amount of vanadium within the crystalline structure. Meanwhile, the chrysoberyl of yellow color, resembling the canary yellow diamond, also entered the gem market, causing a warming current in the trade. In this study, we applied various methods to investigate a parcel of canary yellow chrysoberyl of 17, aiming to decode the coloration and its geological origin, advancing our understanding of the various chrysoberyl gems.
2. Materials and Methods
In this study, we have selected 17 pieces of faceted gem-quality chrysoberyl material to investigate their gemological, spectral, and chemical features by a variety of methods (Table 1). All the samples are transparent and of good clarity, with the color ranging from greenish yellow to pure yellow of medium to high saturation. The weight ranges from 1.97 to 7.43 carats, and the details of all the samples can be found in Table 1.
The internal inclusion features were observed under a gemological microscope of magnification up to 80X, equipped with various lighting conditions. A Cannon 500D camera was applied to capture the internal features of the chrysoberyl in this article.
All samples were identified using Fourier transform infrared (FTIR) spectroscopy on a TENSOR II FTIR spectrometer furnished with a KBr beam splitter and RT-DLaTGS detector. The spectra were collected between 2000 and 4,000 cm−1 using eight scans at 7.5 kHz and a spectral resolution of 4 cm1. In total, 17 transmission spectra were recorded.
The Horiba Xplora Plus Raman system was used to perform micro-Raman spectroscopy on spinel samples to detect mineral inclusions. The instrument had three distinct lasers with varying wavelengths, including 473 nm, 532 nm, and 783 nm. In this study, each laser was administered to chrysoberyl samples to investigate their reactivity to different lasers. The spectra were obtained in the 100-2,000 cm−1 area with a scanning period of 15 s and 10 scan accumulations. All of the spectra were compared to the RRUFF database (https://rruff.info), and the minerals were recognized as such [14].
Meanwhile, the P.L. spectrum was also collected using the 473nm laser. The photoluminescence (P.L.) spectroscopy was likewise acquired utilizing the three lasers on the Horiba Xplora Plus Raman system. The P.L. spectra were taken in the 500-750 nm band over a 15-s scanning period with 10 scan accumulations.
UV-Vis absorption spectra were recorded using a Gem3000 Ultraviolet-visible (UV-Vis) spectrophotometer in the 200-1000 nm range. Furthermore, the CIE testing was also performed on this machine to obtain the LAB parameters to decode the color variation of the samples and the pattern behind them in this study.
The SYNTHdetect instrument was used to study the luminescence properties of the sample studied, which was originally designed to observe the luminescence behavior of diamonds. The results show that luminescence is a very useful tool for studying diamonds, particularly for distinguishing lab-grown diamonds from their natural counterparts, as previously reported by McGuiness et al. [15]. Time-gated luminescence Imaging technology, which has been employed for diamond identification and colorless cubic zirconia [16,17,18], was the essential principle applied to equipment. Unlike the typical U.V. light box used in gemology, which has a 254 nm shortwave and a 365 nm longwave, the SYNTHdetect has a U.V. light with a wavelength of less than 220 nm, allowing it to activate diverse luminescent phenomena. Generally, we applied the methods mentioned above to explore the spectral, gemological, and chemical features of the canary yellow chrysoberyl in this study.
3. Results and Discussion
3.1. Gemological results
Generally, the samples exhibit attractive color, with yellow as the primary hue, which a tint of greenish secondary hue can accompany. In terms of saturation, low to medium covers all the samples, while all the samples show a bright tone. The medium to high clarity and the high transparency qualify the samples as gem-quality. Even though various inclusions were observed under the microscope, No distinct fluorescents were observed when exposed to 365 nm and 254 nm; however, the 220 nm excited green fluorescence of weak to medium strength. Meanwhile, the chemical features show Fe-rich, V-poor, and Cr-poor, while Sn shows a fluctuating content level. All gemological features are summarized in Table 2.
3.2. Inclusions Observation and Raman Results
The internal world of the chrysoberyl samples in this study turns out to be very rich in inclusions. The typically encountered inclusions can be summarized as growth lines, fluids, carbon, and mineral crystals; each category will be described separately.
3.2.1. Growth lines
As shown in Figure 2, the chrysoberyl samples possess abundant growth lines within their gem host, most of which are straight and condensed lines, while the curved rolling line can also be occasionally observed in one sample. The straight lines exist in three ways. Firstly, they can be filled with short needle-like inclusions orienting in the same direction. Secondly, it appears to be purely long, condensed, and parallel lines; additionally, milky and cloudy textures show along with the growth lines, which can be the main contributor to the cat’s eye effect. However, no distinct chatoyance effect was observed, mainly due to the area of the milky and cloudy texture being too small to make an obvious influence on the gem host. But it is important to point out that the common chrysoberyl and cat’s eye chrysoberyl are the same material that can occur in the same rough. At the same time, whether the finished stone is classified as common chrysoberyl or cat’s eye depends on the cutting and fashion planning.
Furthermore, a V-shape pattern consisting of two sets of straight growth lines in two directions is commonly encountered in the samples studied. V-shape growth line originates from the cyclical twins due to the repeated twining on the {031} plane of the chrysoberyl, consistent with a previous study on chrysoberyl from the New England Placer Deposits, New South Wales, Australia [19]. Meanwhile, a step-like pattern was also seen in one sample, suggesting a growth mechanism.
3.2.2. Fluids
Fluid inclusions are distributed in almost all the samples. The fluid is usually arranged along certain healed fissures, as demonstrated in Figure 3d. A higher magnification may reveal that the fluid is filling the irregular cavity in Figure 3b. Further Raman testing reveals the fluids mainly consist of CO2, showing the feature peaks at 1282 and 1386 cm−1, as shown in Figure 4.
3.2.3. Sillimanite Needles
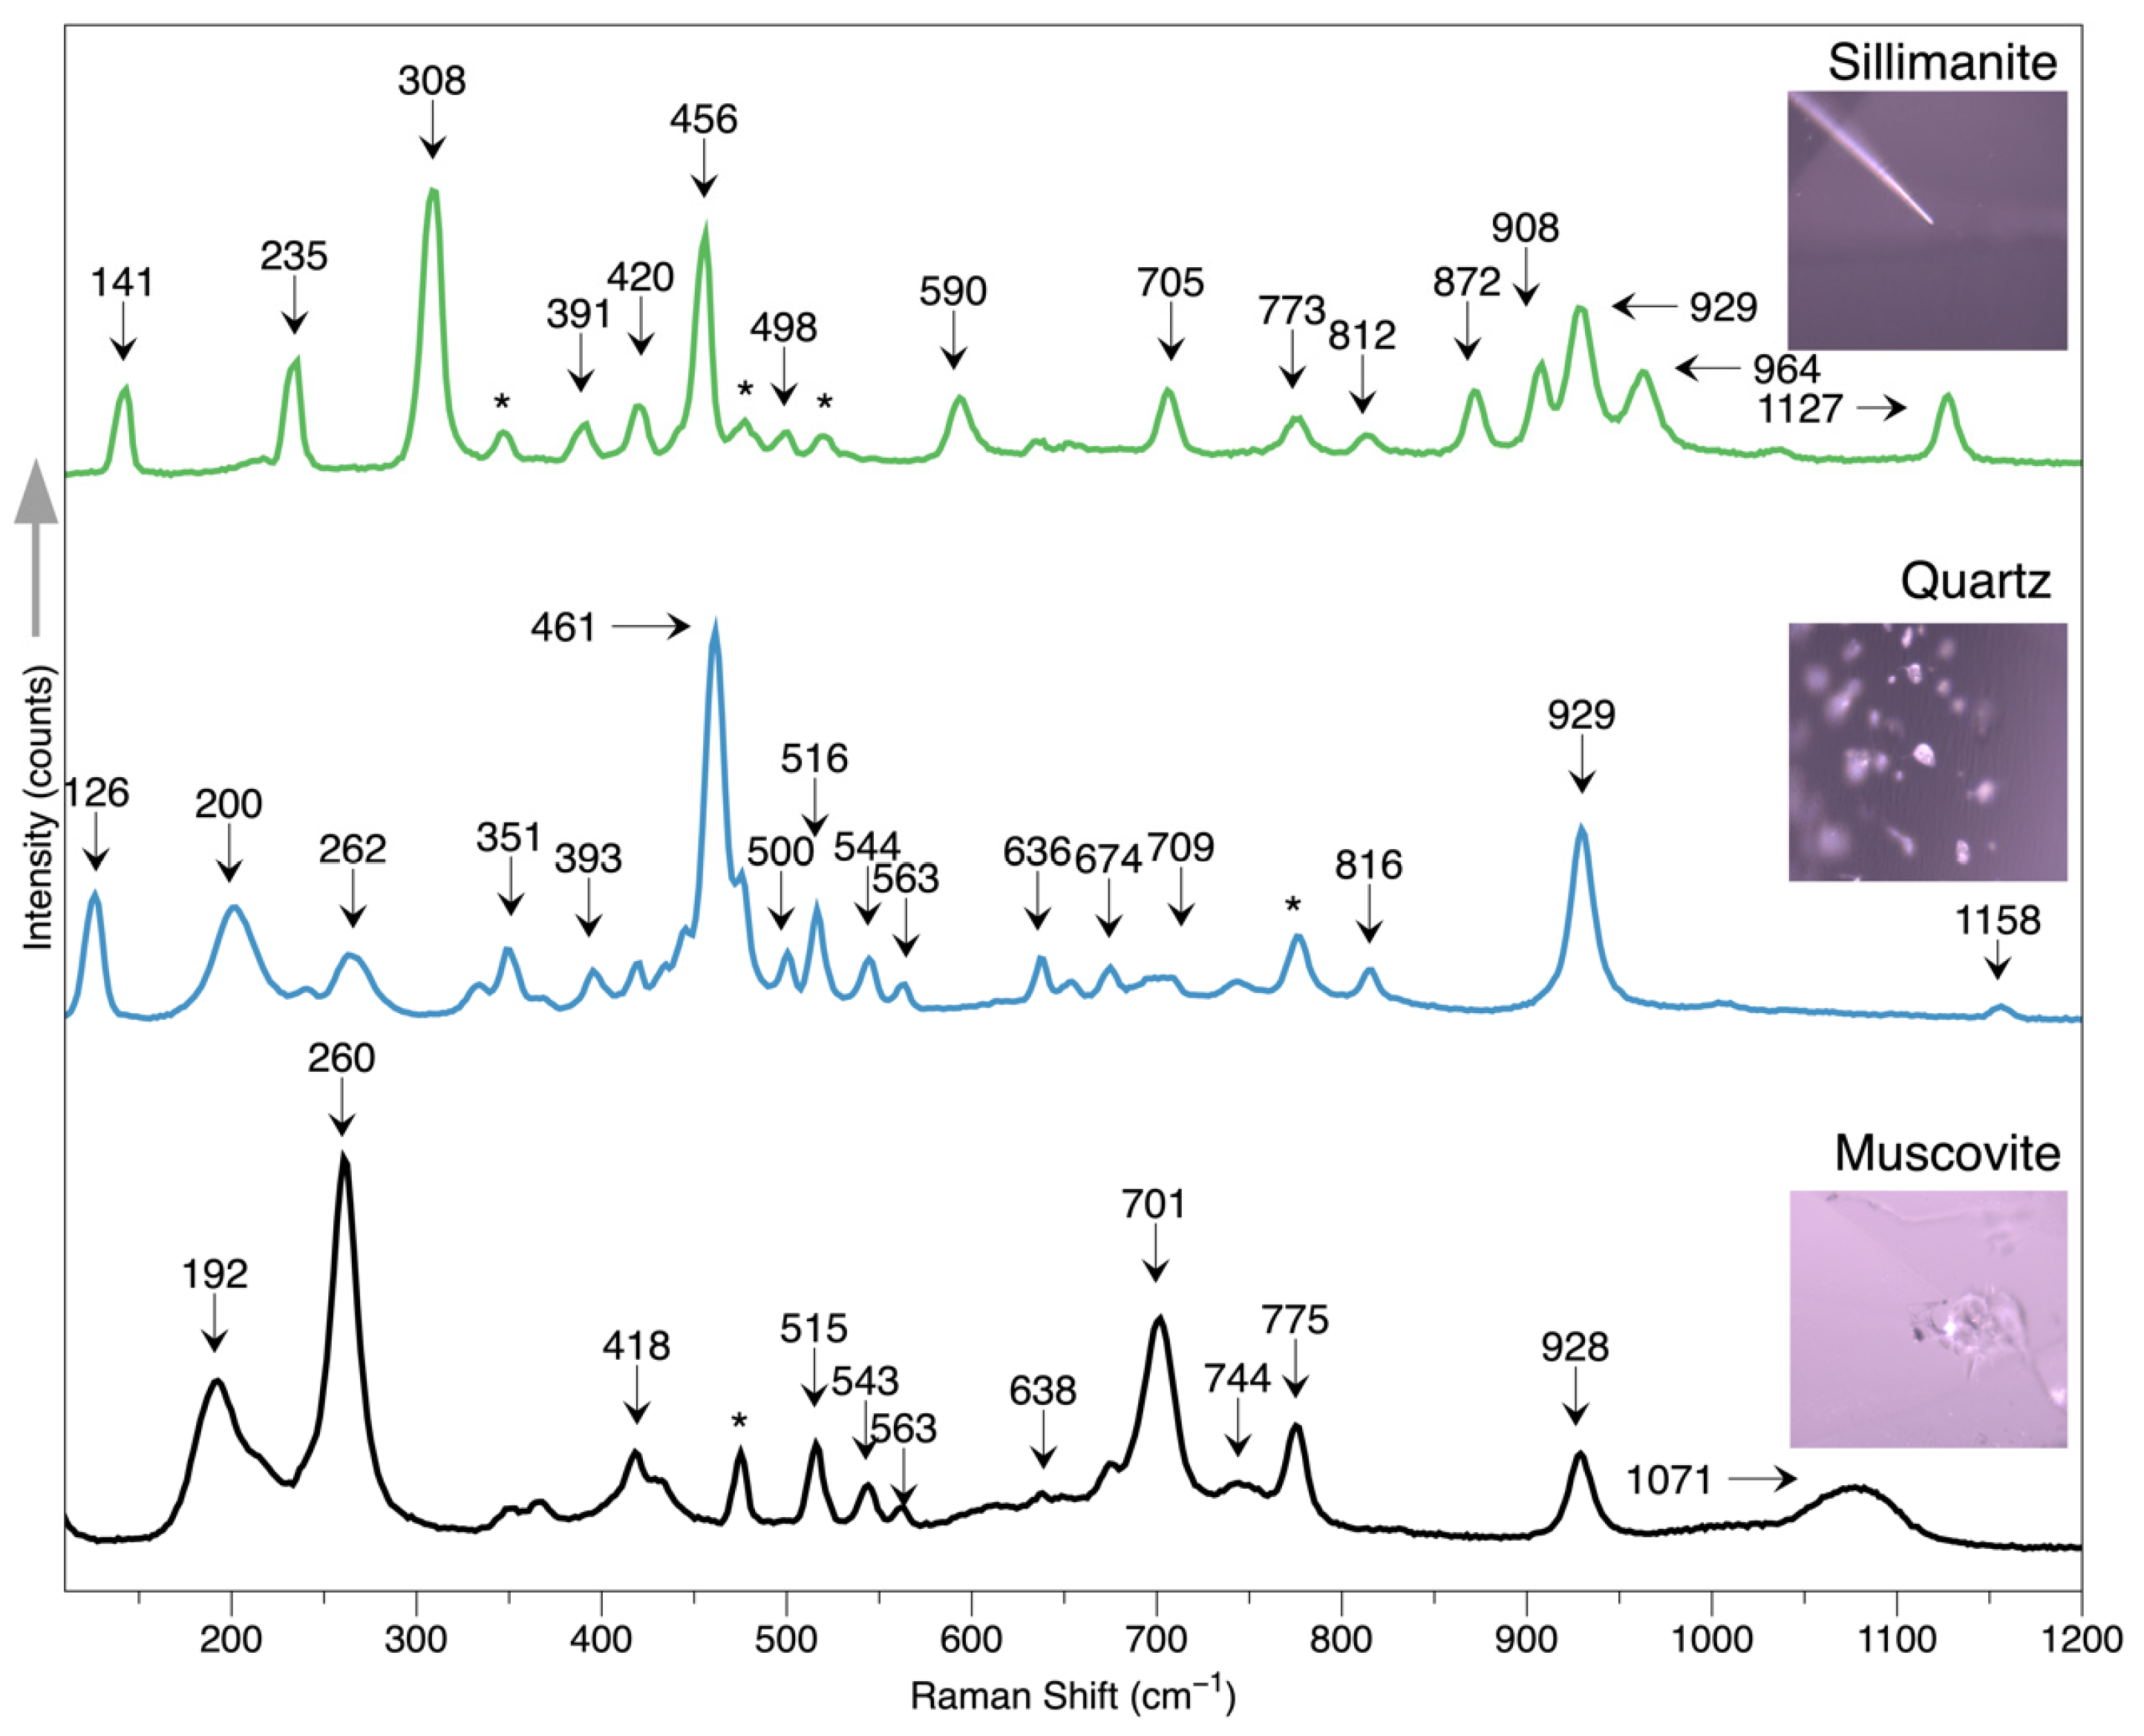
Many long needles are distributed in the samples, and unlike the short needles within the growth lines, these needles are somehow curved and much longer, up to 1-2 mm. They are arranged randomly and show good transparency. Some needles are partially altered by external substances such as iron, showing distinct yellowish and brownish hues, contrasting with the colorless host. Raman spectrum identifies these needles as sillimanite, with feature peaks at 141, 235, 308, 456,590, and 705 cm−1, consistent with those from RRUFF, an online spectrum database.
Figure 5.
Long and transparent sillimanite needles are scattered in the gem host, some of which are somehow partially altered by external substances.
Figure 5.
Long and transparent sillimanite needles are scattered in the gem host, some of which are somehow partially altered by external substances.
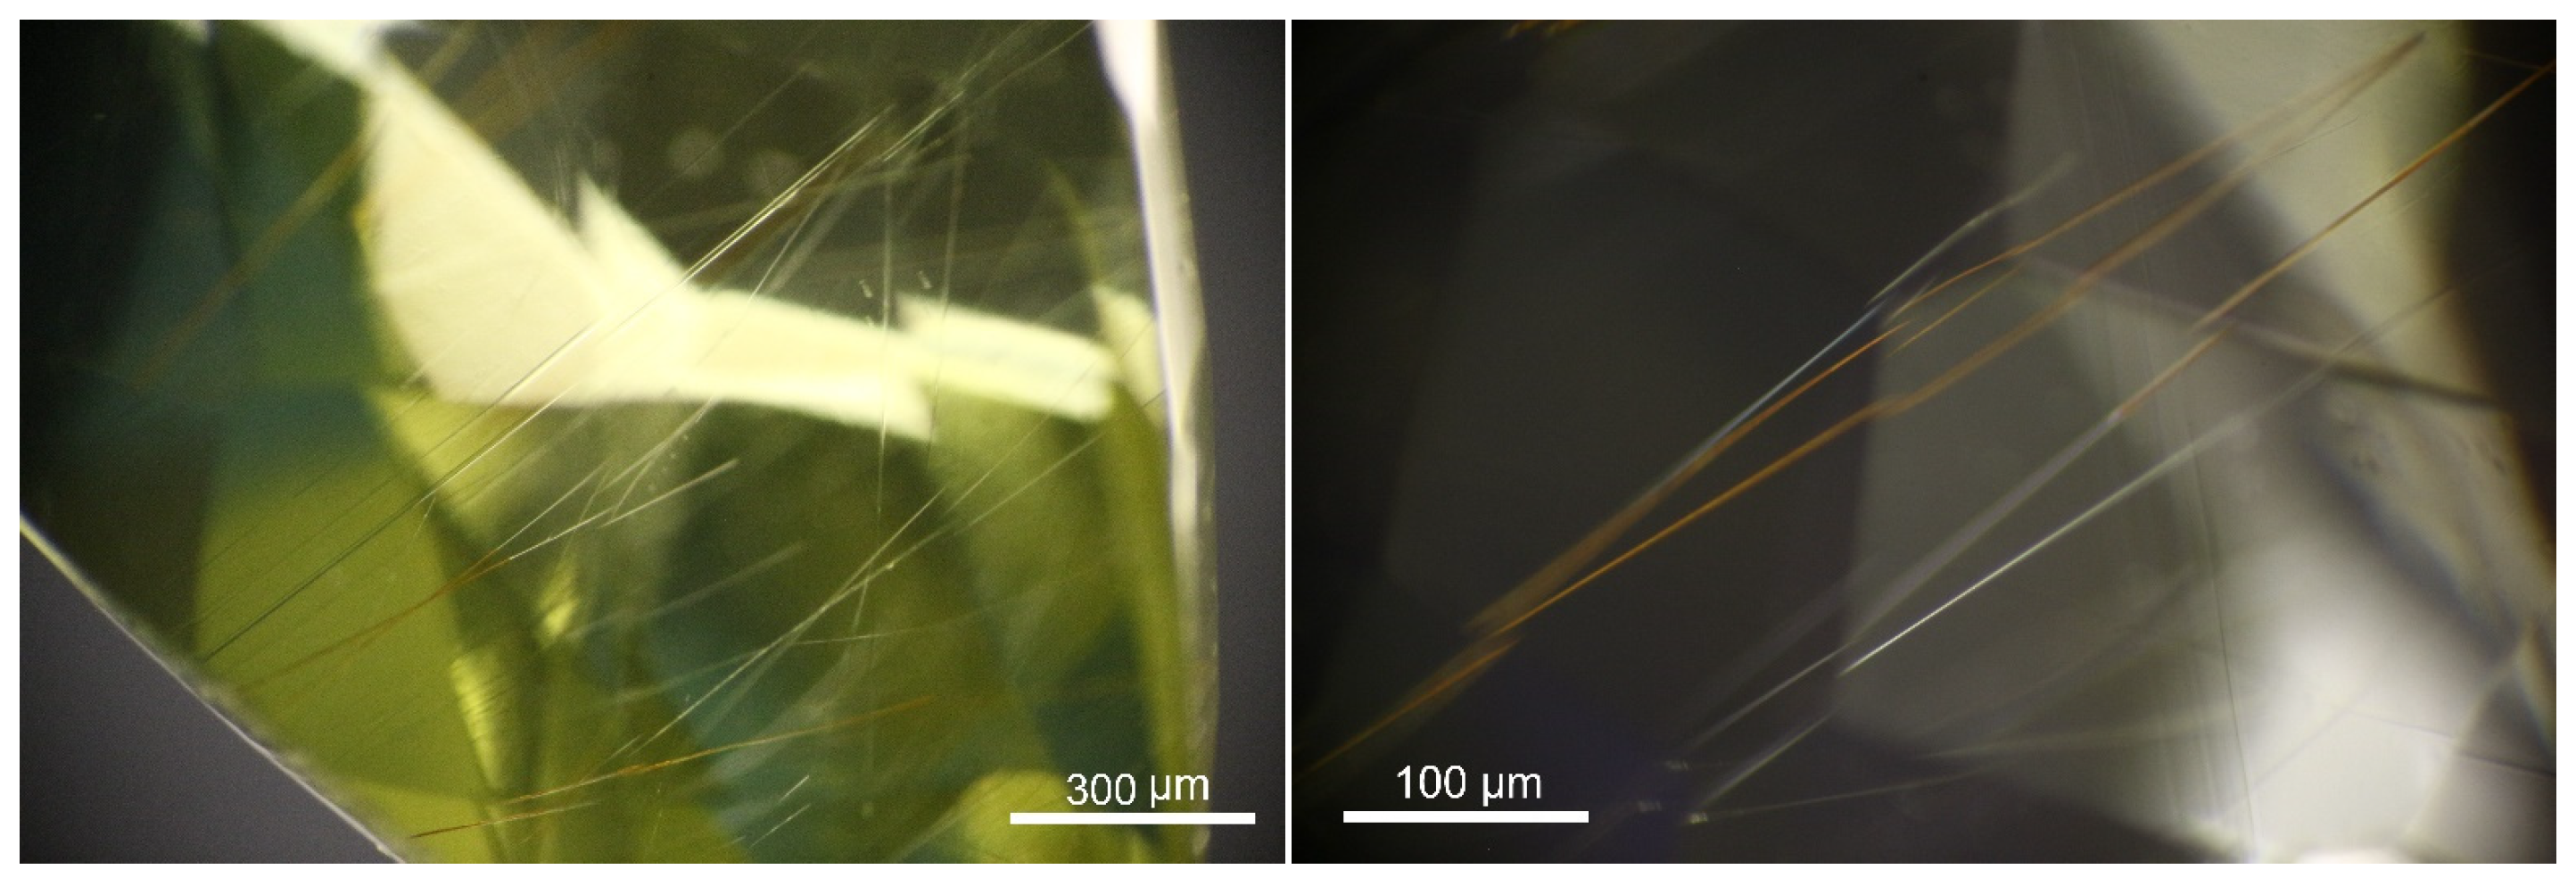
Figure 6.
The Raman spectrum of sillimanite, quartz, and muscovite inclusions within the chrysoberyl host.
Figure 6.
The Raman spectrum of sillimanite, quartz, and muscovite inclusions within the chrysoberyl host.
3.2.4. Quartz and Muscovite
Quartz occurs as an irregular and colorless grain within the chrysoberyl host without any intrinsically crystalline structure. All the quartz grains detected were distributed along the healed fractures, accompanied by mica and fluids, as shown in Figure 7. Such an association may imply the geological origin of the gem host, which will be discussed in the discussion part, along with the chemical data. The Raman spectrum identified the quartz crystal with typical peaks at 126, 200, 461, and 929 cm−1, consistent with those from RRUFF.
Mica grains are also frequently encountered in these samples, usually coming as anhedral and transparent. The mica is also identified as a muscovite variety by the Raman spectrum with reference from the RRUFF online data.
Calcite is one of the most seen carbonate minerals, which can be found in the ruby from marble-hosted sources, such as Mogok in Burma and Vietnam. Calcite can be used as one indicator to distinguish ruby marble hosted (Burman and Vietnam) from the amphibole hosted, mostly in Mozambique and Madagascar. In this study, the calcite inclusions are found as anhedral colorless and transparent crystals, some of which may show rhombohedral morphology owing to their crystallinity. The Raman spectrum results agree with the standard calcite features from RRUFF, with a prominent peak at 1082 cm−1 and peaks at 181, 280, 775, and 929 cm−1.
One opaque plate was observed along the girdle of one sample, exhibiting metallic luster, which shows a prominent band centered at 1583 cm−1, possibly indicating a carbon-related material, graphite. Graphite has been reported in many gemstones, such as sapphire, ruby, and spinel. Since chrysoberyl is an oxide mineral usually occurring with corundum and spinel, it is reasonable to find graphite in chrysoberyl. Furthermore, recent studies present that graphite can be used as one geothermometer to estimate the temperature and pressure during the formation of the gem host [20].
3.2.5. Raman spectrum on the host
Moreover, we have applied three different lasers to the chrysoberyl host in this study to explore their spectral features, including 473, 532, and 785nm. The typical spectrum is demonstrated in Figure 8. All the samples are not oriented along their optical axis; thus, the spectrum should be classified as unoriented. In general, the 930 peak appears at all three lasers as the strongest, while the 636 cm−1 peak appears weak in the 785 nm and strong enough to be a primary peak in the 532 and 473 nm lasers. By comparison, the 239 and 707 cm−1 can only be seen with the 785 nm laser. Accompanied by a series peak in the 300–600 cm−1 range, the 346 peak is prominent in the 785 nm, which is very weak in the 532 nm and nearly none in the 473nm laser. The 930 peaks can be excited by all three lasers, and such a feature agrees with a recent study [21].
This comparison study with three different lasers may help provide a quick guide when using the Raman spectrum to identify the gemstone. The typical feature peak can be a good indicator to tell the results instead of checking the spectrum among the Raman database with thousands of unrelated peaks, giving high efficiency. This result is especially helpful when detecting the chrysoberyl inclusions in other gems; the 930 cm−1 peak can be a very useful key to lead the way to identify the chrysoberyl since most of the mineral Raman spectra are not as clear as the host, and they are usually masked by the host spectrally when the host is strongly fluorescent. And even if the host is inert to the laser, the depth of the inclusion may prohibit a decent view of the inclusion.
3.2.6. FTIR spectrum
Each sample was subjected to the FTIR transmission spectrum test, and 17 spectra were recorded, among which the three representative spectra were displayed in Figure 9. The FTIR features can be described as follows:
- In the 2500-3000cm−1 range, several weak shoulders are presented at 2762, 2840, and 2920, which could also exist in the synthetic material.
- In the 3000 to 3500 cm−1, the 3223 peak present in all samples, which can be accompanied by the 3112 shoulders of various strengths and the 3301 cm−1, along with the 3412 and 3432 cm−1 peaks.
Although chrysoberyl is well-known in the gemological fields, the transmission FTIR spectrum is not sufficiently studied as those of corundum, which is also an oxide mineral, and the gem varieties ruby and sapphire are very popular in the gem trade.
3.2.7. UV-Vis and CIE testing
While all the samples are subjected to the UV-Vis test to explore their coloration, their typical spectra are selected to demonstrate their features in Figure 10. The 440 nm peak is the most prominent in the spectrum, as it is the primary coloration origin, usually along with a doublet peak at ~370 nm and a weak shoulder at 503 nm. The broad and weak band at 650-660 nm may add a subtle hue shift, while the 340nm in the blue range may also result in a color shift. The abovementioned features agree with the previous study [19]. The 440 nm peak can be attributed to a trace of Fe substituting Al within the chrysoberyl crystalline structure.
3.2.8. The CIE Color Test

Table 3.
The CIE color testing result of the seventeen samples in this study.
| No. | L* | a* | b* | c* | h* |
|---|---|---|---|---|---|
| G23001-1 | 50.25 | -5.80 | 14.30 | 15.43 | 112.07 |
| G23001-2 | 32.48 | -3.74 | 9.95 | 10.63 | 110.59 |
| G23001-3 | 43.00 | -2.23 | 12.73 | 12.93 | 99.95 |
| G23001-4 | 49.10 | -2.82 | 11.46 | 11.80 | 103.82 |
| G23001-5 | 43.38 | -1.14 | 5.94 | 6.05 | 100.84 |
| G23001-6 | 47.63 | -3.89 | 11.21 | 11.86 | 109.12 |
| G23001-7 | 54.79 | -6.28 | 12.90 | 14.35 | 115.94 |
| G23001-8 | 54.41 | -6.36 | 15.64 | 16.89 | 112.14 |
| G23001-9 | 41.43 | -1.46 | 9.32 | 9.44 | 98.87 |
| G23001-10 | 42.06 | -0.93 | 6.49 | 6.56 | 98.19 |
| G23001-11 | 67.86 | -6.52 | 19.73 | 20.78 | 108.28 |
| G23001-12 | 34.84 | -3.68 | 16.32 | 16.73 | 102.70 |
| G23001-13 | 83.59 | -9.78 | 30.97 | 32.48 | 107.52 |
| G23001-14 | 78.47 | -10.36 | 24.97 | 27.04 | 112.53 |
| G23001-15 | 59.74 | -7.82 | 30.29 | 31.28 | 104.48 |
| G23001-16 | 67.40 | -6.39 | 30.03 | 30.70 | 102.02 |
| G23001-17 | 60.57 | -4.83 | 19.15 | 19.75 | 104.16 |
| Average | 53.59 | -4.94 | 16.55 | 17.33 | 106.07 |
| Standard Deviation | 14.50 | 2.84 | 8.15 | 8.51 | 5.40 |
In order to establish a norm for color communication, the International Commission on Illumination (CIE) created the L*a*b* color model in 1976. While a* and b* reflect chromaticity with no set numerical boundaries, L* denotes lightness on a scale from zero to one hundred, from black to white. Negative a* indicates green, positive a* indicates red, negative b* symbolizes blue, and positive b* represents yellow.
We applied the CIE testing to all samples, and the results are displayed in Table **, including the L*, a*, b*, c*, and h* accordingly. The L* values range from 34.84 to 83.59, with an average of 53.59, suggesting a medium to bright tone. While the a* value falls into the range of -10.36 to -0.93, indicating a green hue. Meanwhile, the b* value ranges from 6.49 to 30.97, indicating a yellow-dominated hue. The L*, a*, and b* values combine, suggesting the color of the samples studied is yellow with a tint of greenish secondary hue of medium to bright tone, which agrees with the visual observation by the naked eye. The agreement between the L*, a *, and b* values and visual observation proves that the CIELab method could be an excellent tool to further explore the color of gemstones by quantifying the color.
Standard deviation measures the extent to which a set of values is dispersed from the mean. A large standard deviation represents a large difference between most of the values and their mean.
3.2.9. Luminescence and P.L.
Chrysoberyl is not well known for its luminescence properties, except for some alexandrite varieties, colored by Cr or V, exhibiting a distinct color-changing effect and usually red fluorescence under 365 nm U.V. light. Interestingly, the canary yellow chrysoberyl in this study was inert under 365 nm and 254 nm U.V. light; however, it showed green fluorescence detected by the SYNTHdetect machine, and such phenomena have not been reported presently, according to the knowledge of the authors. Meanwhile, the photoluminescence spectra were also performed in all the samples, and the prominent broad band centered at 550 nm was distinct in samples showing strong green fluorescence. In comparison, the 550 nm disappeared, and the 678 and 680 nm arose in samples with weak to inert fluorescence, as shown in Figure 11.
3.2.10. Chemical Results
All the samples have been subjected to chemical tests by EDXRF, and the chemical results are displayed in Table 4, including Ti, V, Cr, Mn, Fe, Ga, and Sn. While vanadium ranges from 60.9 to 133.5 ppm, with an average of 94.08 ppm, chromium falls into the range of 23.6 to 84.5 ppm, with an average value of 62.41 ppm. The V/Cr ratio fluctuates between 1.29 and 2.22, averaging at 1.56. By comparison, the Fe content is extremely high, ranging from 8781 to 19500, averaging at 11295.88 ppm. The standard deviation of the value of each element was also listed in the Table, which could serve as a good indicator of the dispersion from their mean value. Generally, the chemical results of all the samples in this study show similar features: Fe-rich, V-poor, and Cr-poor.
4. Discussion
4.1. LabCIE Analysis
When the a* value decreases, both the value of b* and L* increase, as shown in Figure 12. This means that as the stone becomes more green in color, its yellow and brightness will also increase. Furthermore, the relations between L*, a*, and b* have been exploited regarding a*-L*, a*-b*, and b*-L*, respectively. Linear analysis reveals their relations as follows:
a* = -0.1666L* + 3.9843, R² = 0.7243
b* = 0.4548L* - 7.817, R² = 0.6538
b* = -2.4212a* + 4.5877, R² = 0.7243.
Figure 12 displays the correlation between the three parameters. The a*-L* diagram shows a negative correlation, where the L* increases while the a value decreases. The linear analysis shows a trend line consisting of a* and L* values, giving a formula as a* = -0.1666L* + 3.9843, and the correlation coefficient R² being 0.7243. The b*-L* diagram demonstrates that b* and L* are positively correlated as the b* value increases together with the L* value. The linear analysis resulted in a formula as follows: b* = 0.4548L* - 7.817, R² = 0.6538. Meanwhile, the a*-b* diagram shows that a* negatively correlates with b*, with the linear formula as b* = -2.4212a* + 4.5877, and the correlation coefficient R² = 72.43%.
The linear relations among the a*, b*, and L* can also be plotted in a 3D model, as shown in Figure 13. The close relationship among the three parameters may serve as a good indicator to further exploit the color measurement and advance our understanding of the canary yellow color, which contributes to the popularity of chrysoberyl in the gem trade
4.2. Chemical Feature and Color
V, Cr, and Fe are the main color agents in chrysoberyl. In the samples in this study, V and Cr show a very close correlation, as displayed in Figure 14. Considering the ratio among Fe, V, and Cr, the Fe/Cr, Fe/V, and Fe/(V+Cr) are calculated based on these three element values since they contribute to the color of chrysoberyl accordingly. The linear formula of V vs. Cr shows that as follows:
V = 0.8225 × Cr - 14.98, R2=0.8736
Fe/V =0.4057 × Fe/Cr + 44.202, R2=0.81
The trace amount of V can result in the green hue in the samples, but in a very subtle way, while the Cr is too low to contribute a distinct hue. Through compassion, Fe gives rise to the yellow hue. The contents of V and Cr are at a similar level, but the Fe is much higher than that of V, Cr, or the sum of V and Cr. As listed in Table 4, the Fe/Cr ranges from 131.06 to 417.48, averages 198.79, and the S.D. value is 80.43. The Fe/V ranges from 77.89 to 200.82, with an average value of 124.85 and an SD of 36.26. Additionally, the Fe/(V+Cr) ranges from 46.36 to 129.84, averages 76.23, and the standard deviation is 24.55.
Regarding the standard deviation value, it is interesting to point out that the S.D. of Fe/(Cr+V) is lower than both that of Fe/Cr and Fe/V. V and Cr share chemical features in common, as they both belong to the first transition series. A recent study has revealed the effects of such minute levels of vanadium and/or chromium on somewhat greenish-yellow chrysoberyls from Madagascar and Sri Lanka [27]. So, it is reasonable to take them into consideration as a whole. Based on the content of Fe, V, and Cr, together with their relative ratios, the green component is usually covered by the yellow hue due to abundant Fe. Hence, the sample exhibits yellow as the primary hue, accompanied by a general green hue.
4.3. Inclusions and Geological Implications
The geological occurrence of chrysoberyl has been summarized by previous studies [28,29]. The chrysoberyl deposits can be classified into four categories: melt crystallization, metamorphism, metasomatism, and weathering. The minerals detected in samples in this study include quartz, sillimanite, muscovite, and calcite. The well-formed crystalline habit of sillimanite contracts with the irregular shapes of muscovite and quartz.
According to the previous study [30], before the crystallization of chrysoberyl, it is possible that sillimanite formed due to the consumption of quartz and muscovite following the formula: “Muscovite + quartz + H2O = sillimanite.” The phase diagram proposed by e demonstrates that the granite pegmatite-related chrysoberyl formed at a temperature of 800–900 °C and a pressure of 0.7–0.8 GPa [31,32]. The association minerals suggest the samples in this study originate from the muscovite-quartz-sillimanite-calcite granite pegmatite.
Author Contributions
Writing—original draft, Y.G. and X.L.; writing—review and editing, Y.G. R.T. and T.H..; data curation, Y.G., X.L.and Y.C.; software Y.G and K.L.; methodology, Y.G. X.L. R.T. and B.X. All authors have read and agreed to the published version of the manuscript.
Acknowledgments
Huixin Zhao and Qi Han are thanked for their help during the photography and equipment testing. The authors are very grateful to the reviewers who help improve this article.
Conflicts of Interest
The authors declare no conflict of interest.
References
- Brown, W. (1926). The crystalline structure of chrysoberyl. Proceedings of the Royal Society of London, 110(753), 34-63. [CrossRef]
- Marder, J. M., & Mitchell, T. E. (1982, August 13). The Nature of Precipitates in Cat’s-Eye Chrysoberyl. Proceedings, Annual Meeting, Electron Microscopy Society of America, 40, 556–557. [CrossRef]
- Farrell, E. F., J.H. Fang, and R.E. Newnham. 1963. Refinement of the chrysoberyl structure. American Mineralogist. 48:804-810.
- Cronstedt, A. F. (1758). Försök til Mineralogie, eller Mineral-Rikets Upställning [Attempt at Mineralogy, or an Arrangement of the Mineral Kingdom]. Stockholm: Kungliga Vetenskapsakademien.
- Proctor, K. (1988, April 1). Chrysoberyl and Alexandrite from the Pegmatite Districts of Minas Gerais, Brazil. Gems & Gemology, 24(1), 16–32. [CrossRef]
- Schmetzer K. (2010) Russian Alexandrites. Schweizerbart Science Publishers, Stuttgart, Germany, 141 pp.
- Levine G.B. (2008) Gemology: Alexandrite—It’s magic. Adornment, Vol. 7, No. 2, p. 7.
- Gübelin E.J. (1976) Alexandrite from Lake Manyara, Tanzania. G&G, Vol. 15, No. 7, pp. 203–209.
- Zwaan P.C. (1982) Sri Lanka: The gem island. G&G, Vol.18, No. 2, pp. 62–71. [CrossRef]
- Brown G., Kelly S.M.B. (1984) Alexandrite-chrysoberyl from Zim- babwe. Australian Gemmologist, Vol. 15, No. 8, pp. 275–278.
- Sun, Z., Palke, A.C., Muyal, J., & McMurtry, R. (2017). How to facet gem-quality chrysoberyl: Clues from the relationship between color and pleochroism, with spectroscopic analysis and colorimetric parameters. American Mineralogist, 102, 1747 - 1758. [CrossRef]
- Schmetzer, K., Bernhardt, H. J., & Hainschwang, T. (2011). Measurement and interpretation of growth patterns in chrysoberyl, including alexandrite. The Journal of Gemmology, 32(5), 129–144. [CrossRef]
- Schmetzer, K., Krzemnicki, M. S. , Hainschwang, T. , & Heinz-Jürgen Bernhardt. (2013). Natural and synthetic vanadium-bearing chrysoberyl. The Journal of Gemmology, 33(7/8), 223-238. [CrossRef]
- Lafuente, B., Downs, R. T., Yang, H., & Stone, N. (2016). The power of databases: The RRUFF project. In Highlights in Mineralogical Crystallography (pp. 1-29). Walter de Gruyter GmbH. [CrossRef]
- McGuiness, C.; Wassell, A.M.; Lanigan, P.M.; Lynch, S.A. Separation of Natural Laboratory−Grown Diamond Using Time−Gated Luminescence Imaging. Gems & Gemology. 2020, 56, 220−229. [CrossRef]
- Lanigan, P.M.; Mcguinness, C.; Rendle, M.; Aked, P.A.; Bearcroft, C.G.; Jones, D.C.; Lawson, S.C. Real−Time Detection of Long Lived Near Infrared luminescence from Colourless Cubic Zirconia by Time−Gated Imaging. Minerals. 2020. [CrossRef]
- D’Haenens-Johansson, U.F.; Butler, J.E.; Katrusha, A. Synthesis of Diamonds and Their Identification. Reviews in Mineralogy and Geochemistry. 2022, 88, 689–754. [CrossRef]
- Hardman, M.F.; Eaton−Magaña, S.C.; Breeding, C.M.; Ardon, T.; D’Haenens-Johansson, U.F.S. Evaluating the Defects in CVD Diamonds: A Statistical Approach to Spectroscopy. Diam. Relat. Mater. 2022, 130, 109508. [CrossRef]
- Schmetzer, K., Caucia, F., Gilg, H. A., & Coldham, T. S. (2016, May 1). Chrysoberyl Recovered with Sapphires in the New England Placer Deposits, New South Wales, Australia. Gems & Gemology, 52(1), 18–36. [CrossRef]
- 20. Huang Tiantian, Gao Yujie, Sun Xueying & Han Qi. Raman Spectroscopic Study on Inclusion in Sapphire from Azad-Kashmir. Journal of Gems and Gemology 2022,24(05): 101-108. [CrossRef]
- Rybnikova, O., Bačík, P., Uher, P., Fridrichová, J., Lalinská-Voleková, B., Kubernátová, M., & Hanus, R. (2023, June 21). Characterization of chrysoberyl and its gemmological varieties by Raman spectroscopy. Journal of Raman Spectroscopy, 54(8), 857–870. [CrossRef]
- Leung C.S., Merigoux H., Poirot J.P., Zecchini P. (1983) Sur Pidentification des pierres fines et de synthfese par spectroscopie infrarouge. Rewe de Gemmologie a.f.g., No. 75, pp. 14-15.
- Leung C.S., Merigoux H., Poirot J.P., Zecchini P. (1986) Infrared spectrometry in gemmology. In Morphology and Phase Equilibria of Minerals, Proceedings of the 13th General Meeting of the International Mineralogical Association, Varna 1982, Sofia, Bulgaria, pp. 441-448.
- Stockton, C.M., & Kane, R.E. (1988). The Distinction of Natural from Synthetic Alexandrite by Infrared Spectroscopy. Gems & Gemology, 24, 44-46. [CrossRef]
- Schmetzer, K., Peretti, A., Medenbach, O., & Bernhardt, H. J. (1996, September 1). Russian Flux-Grown Synthetic Alexandrite. Gems & Gemology, 32(3), 186–202. [CrossRef]
- Malsy, A. K., & Armbruster, T. (2012, February 24). Synthetic alexandrite - Growth methods and their analytical fingerprints. European Journal of Mineralogy, 24(1), 153–162. [CrossRef]
- Witthayarat J., Thanasuthipitak P. (2014) Crystal chemistry of coloration in chrysoberyl. Proceedings, 4th International Gem and Jewelry Conference, Chiang Mai, Thailand, pp. 185–187.
- Beurlen, H., Thomas, R., Melgarejo, Silva, J.M., Rhede, D., Soares, D.R., & Silva, M.R. (2013). Chrysoberyl-sillimanite association from the Roncadeira pegmatite, Borborema Province, Brazil: implications for gemstone exploration. Journal of Geosciences, 58, 79-90. [CrossRef]
- Ma Yince, M., Hong Tao, H., Liu keshan., Li Hang., Ma Huadong.,Wang Wei, W., & Xu Xingwang, (2022). Types and genetic mechanism of chrysoberyl deposits. Acta Petrologica Sinica. 38(4):943-962. [CrossRef]
- Thompson, R. N. (1982). Magmatism of the British Tertiary Volcanic Province. , 18(1), 49–107. [CrossRef]
- Grew, E. S. . (1981). Surinamite, taaffeite, and beryllium sapphirine from pegmatites in granulite-facies rocks of Casey bay, Enderby land, Antarctica. American Mineralogist, 66(9), 1022-1033.
- Franz G and Morteani G. 2002. Be Minerals: Synthesis, stability, and occurrence in metamorphic rocks. In: GrewES(ed.).Beryllium: Mineralogy,Petrology,andGeochemistry.Chapter13.Reviewsin Mineralogy and Geochemistry,50:51-589. [CrossRef]
Figure 1.
The crystalline structure of chrysoberyl includes beryllium, aluminum, and oxygen atoms.
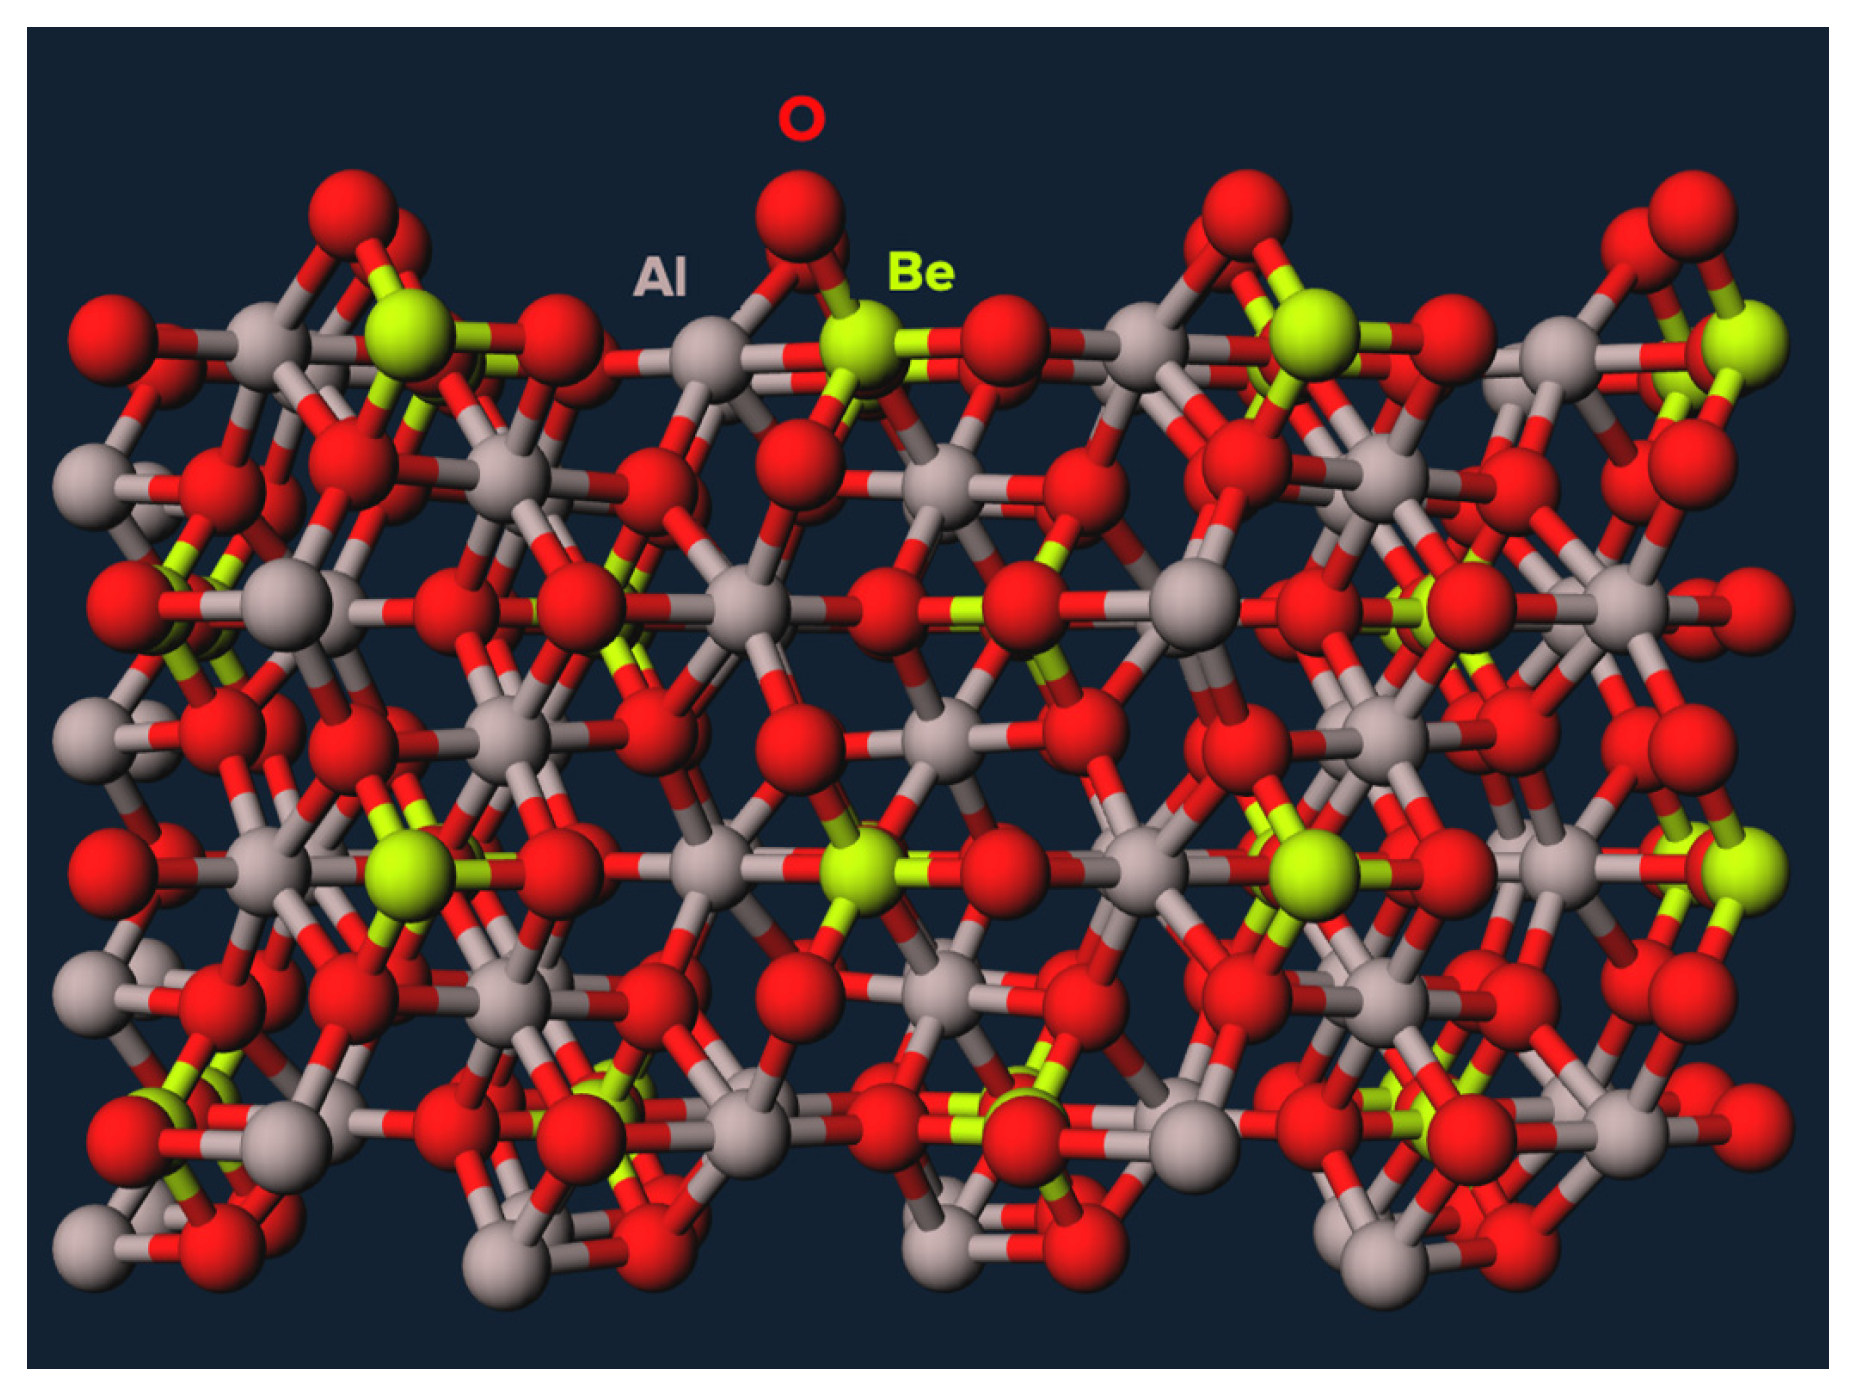
Figure 2.
The typical growth lines encountered in the samples studied. a: needle-like inclusions arranged long the grow lines; b and c: straight lines, with the latter being held by the milky and cloudy texture; d: V-shape pattern due to the cyclical twins; e: step-like pattern. f: curved and rolling pattern.
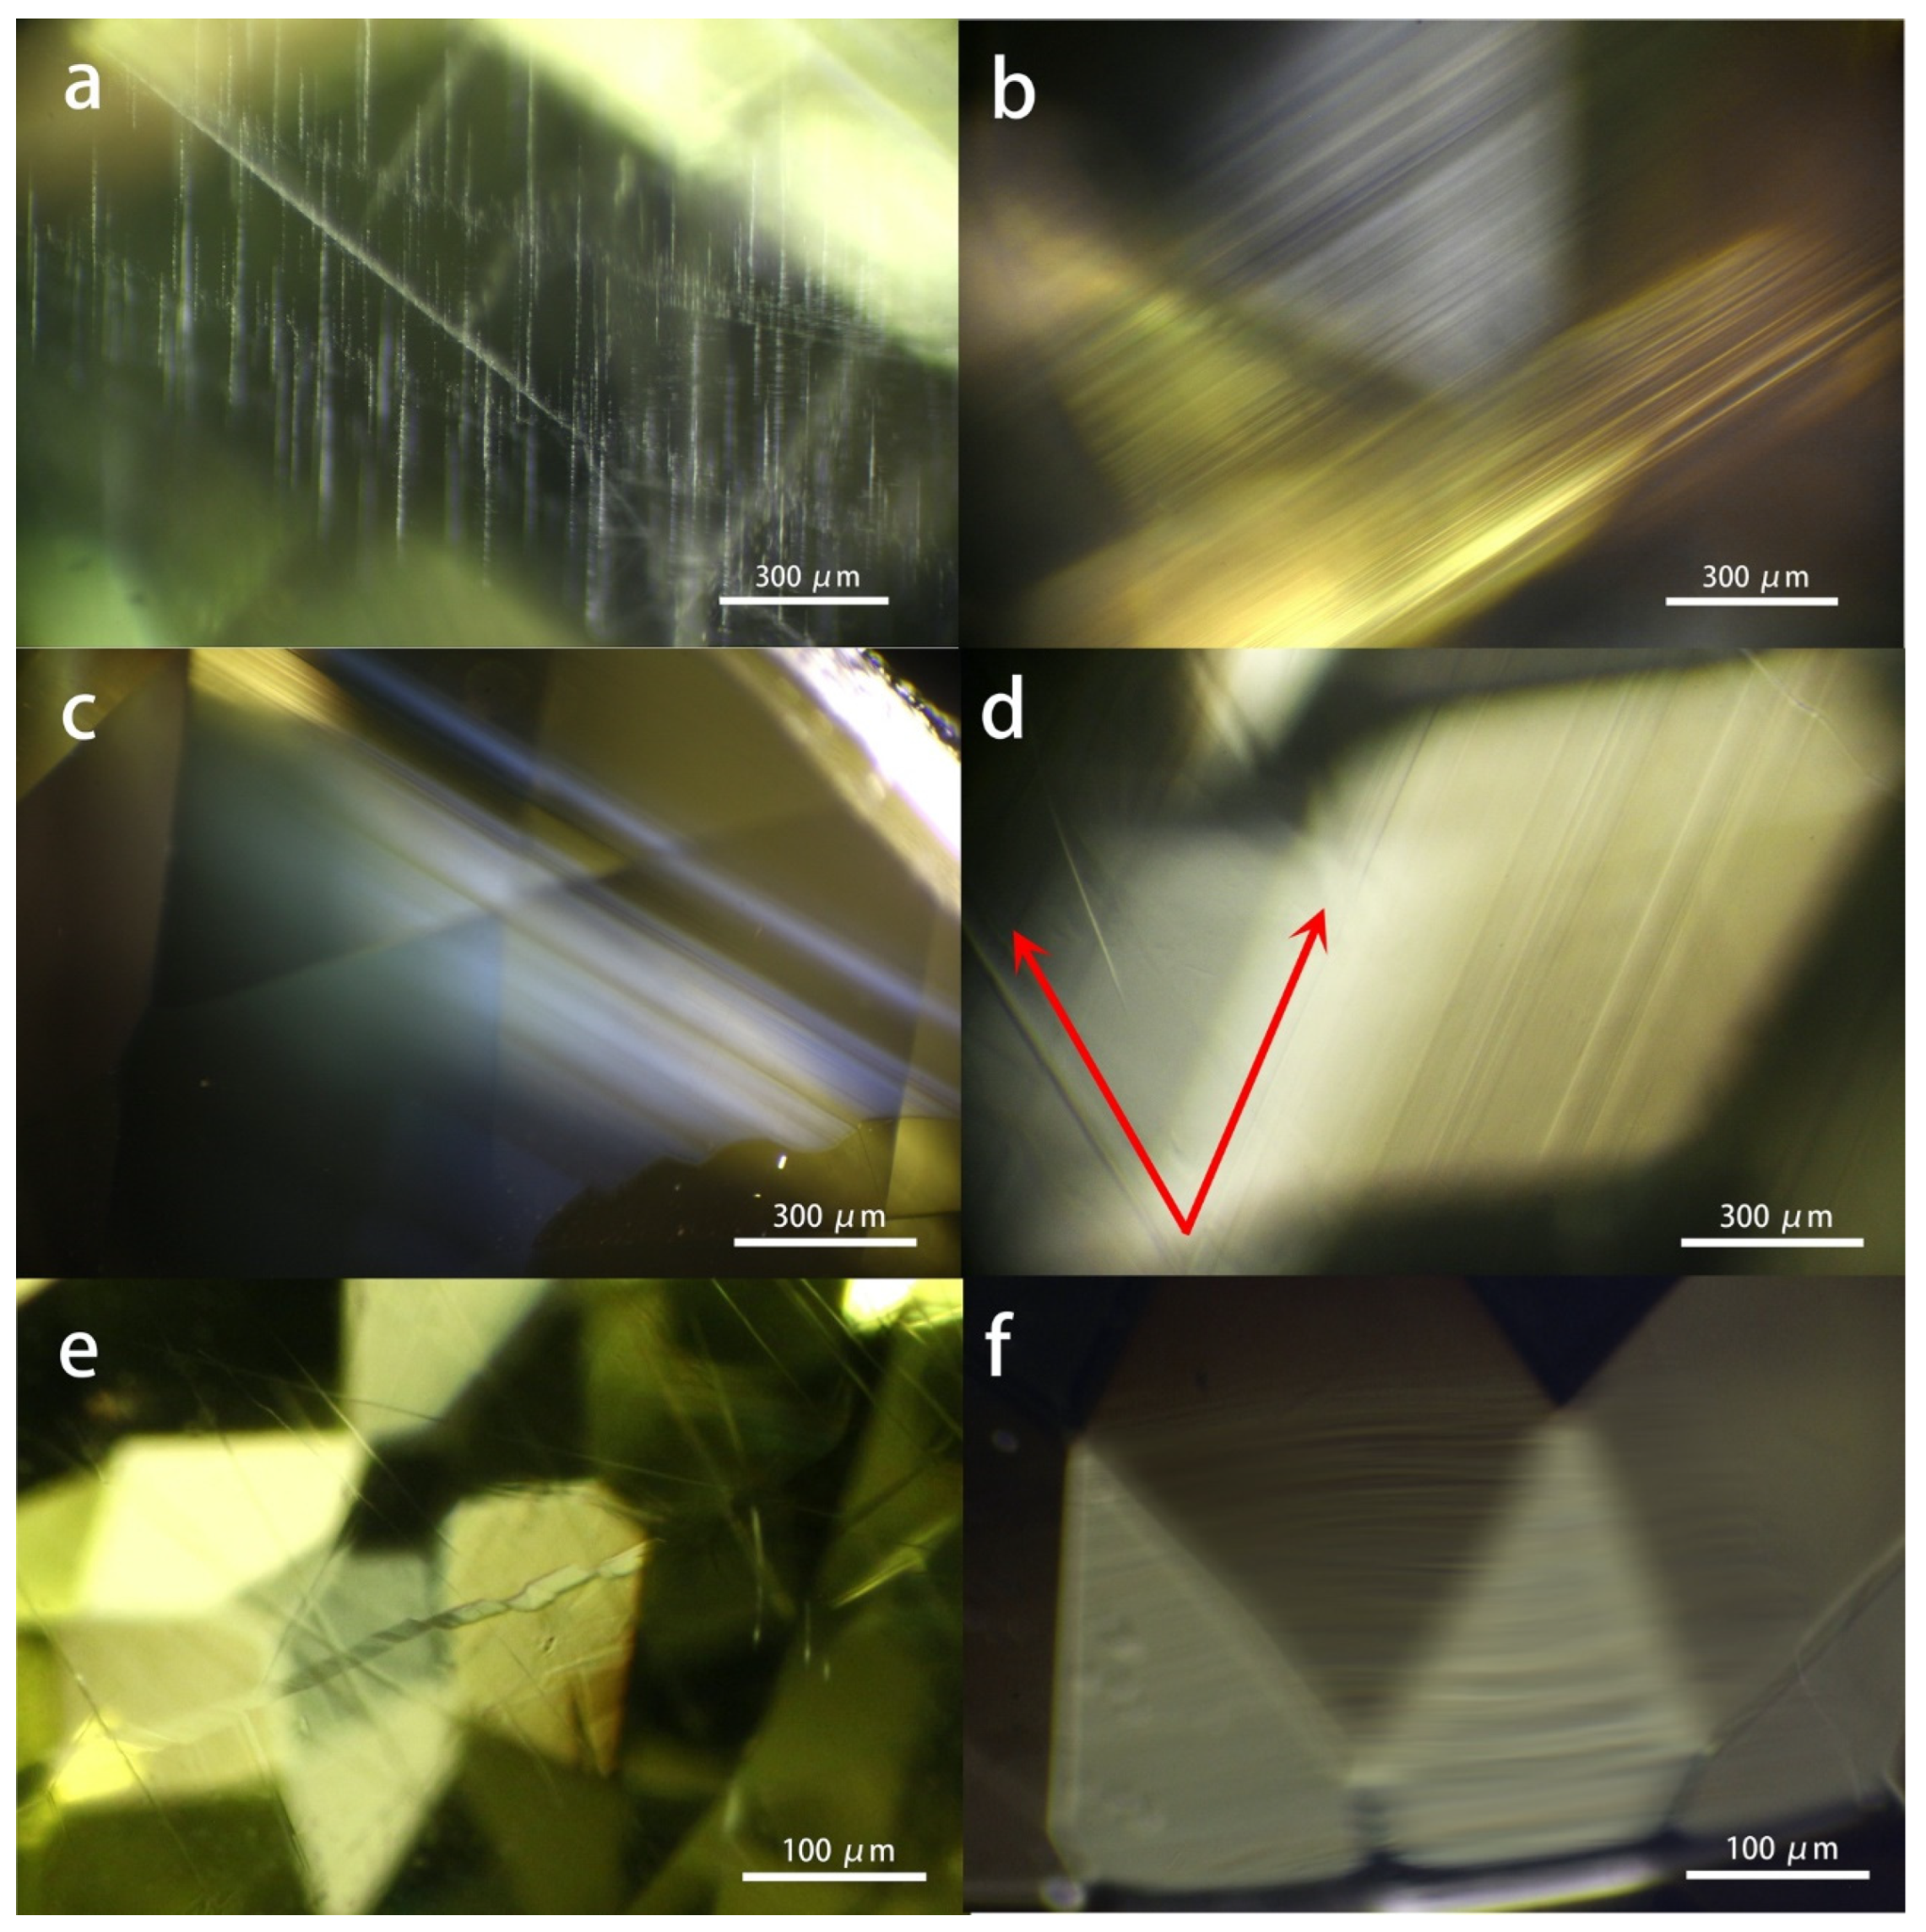
Figure 3.
Fluid inclusions were observed in most of the samples.
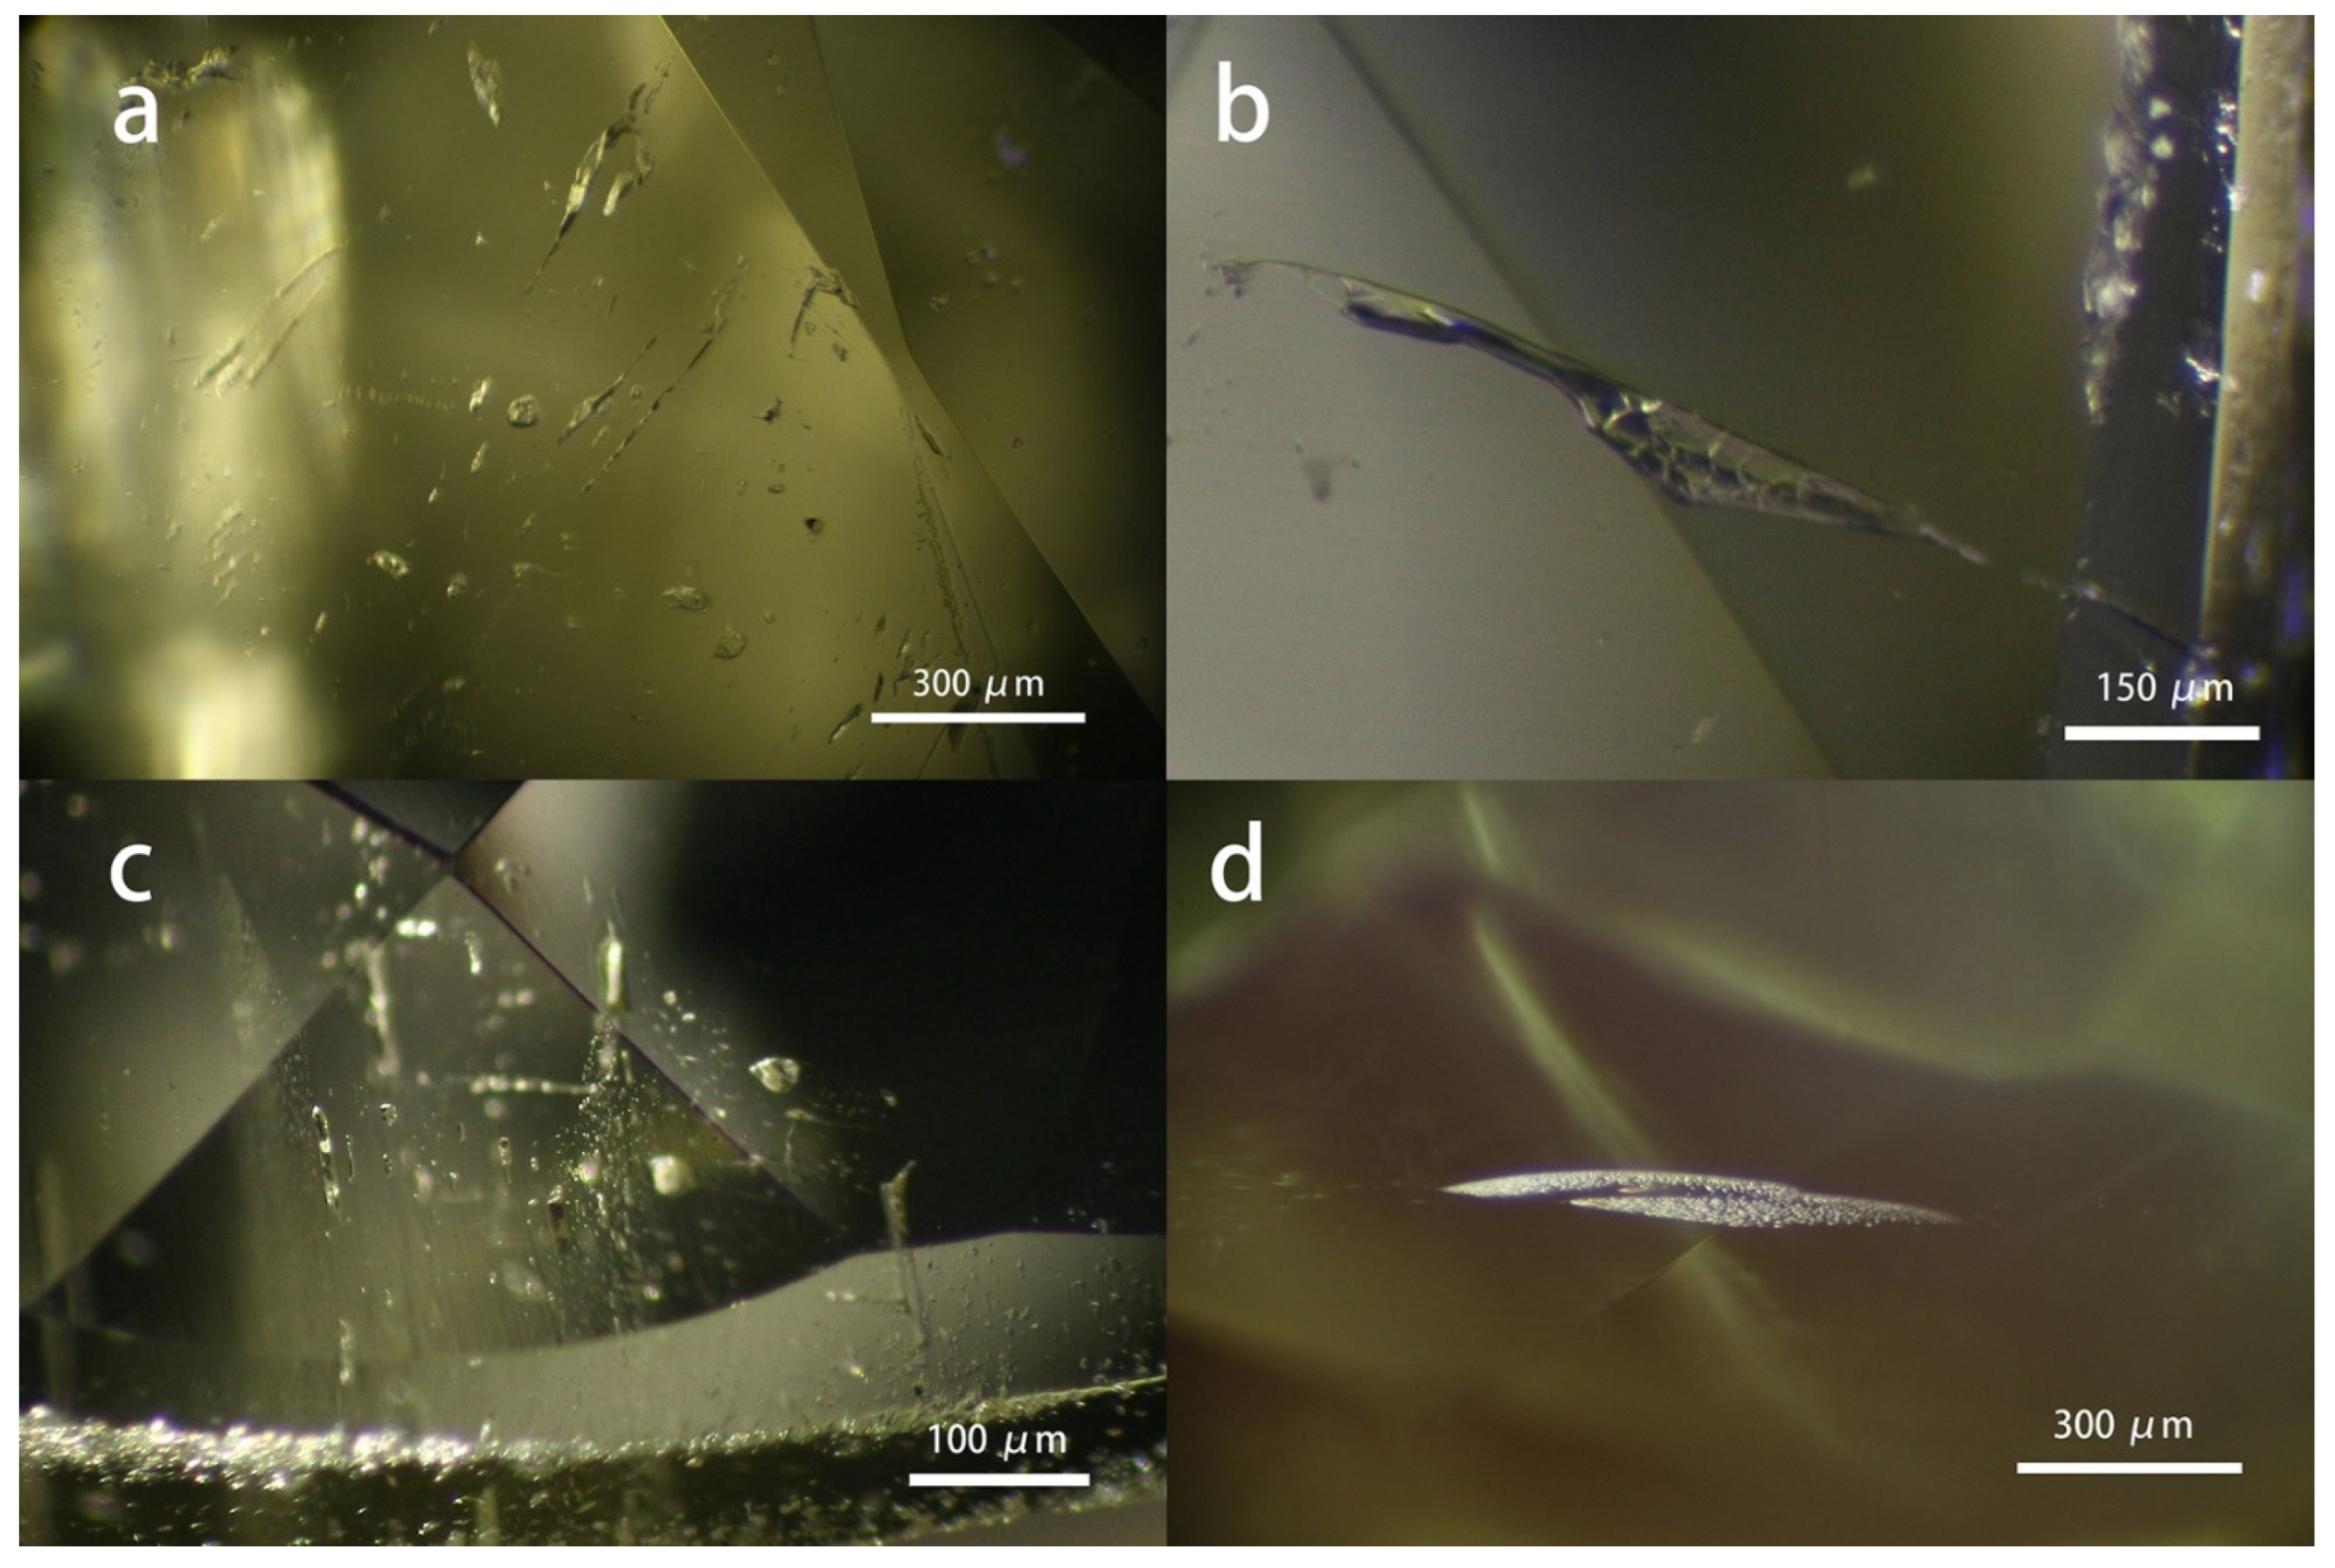
Figure 4.
Calcite crystals, along with amorphous carbon and CO2 within the fluids, are identified by the Raman spectrum.
Figure 4.
Calcite crystals, along with amorphous carbon and CO2 within the fluids, are identified by the Raman spectrum.
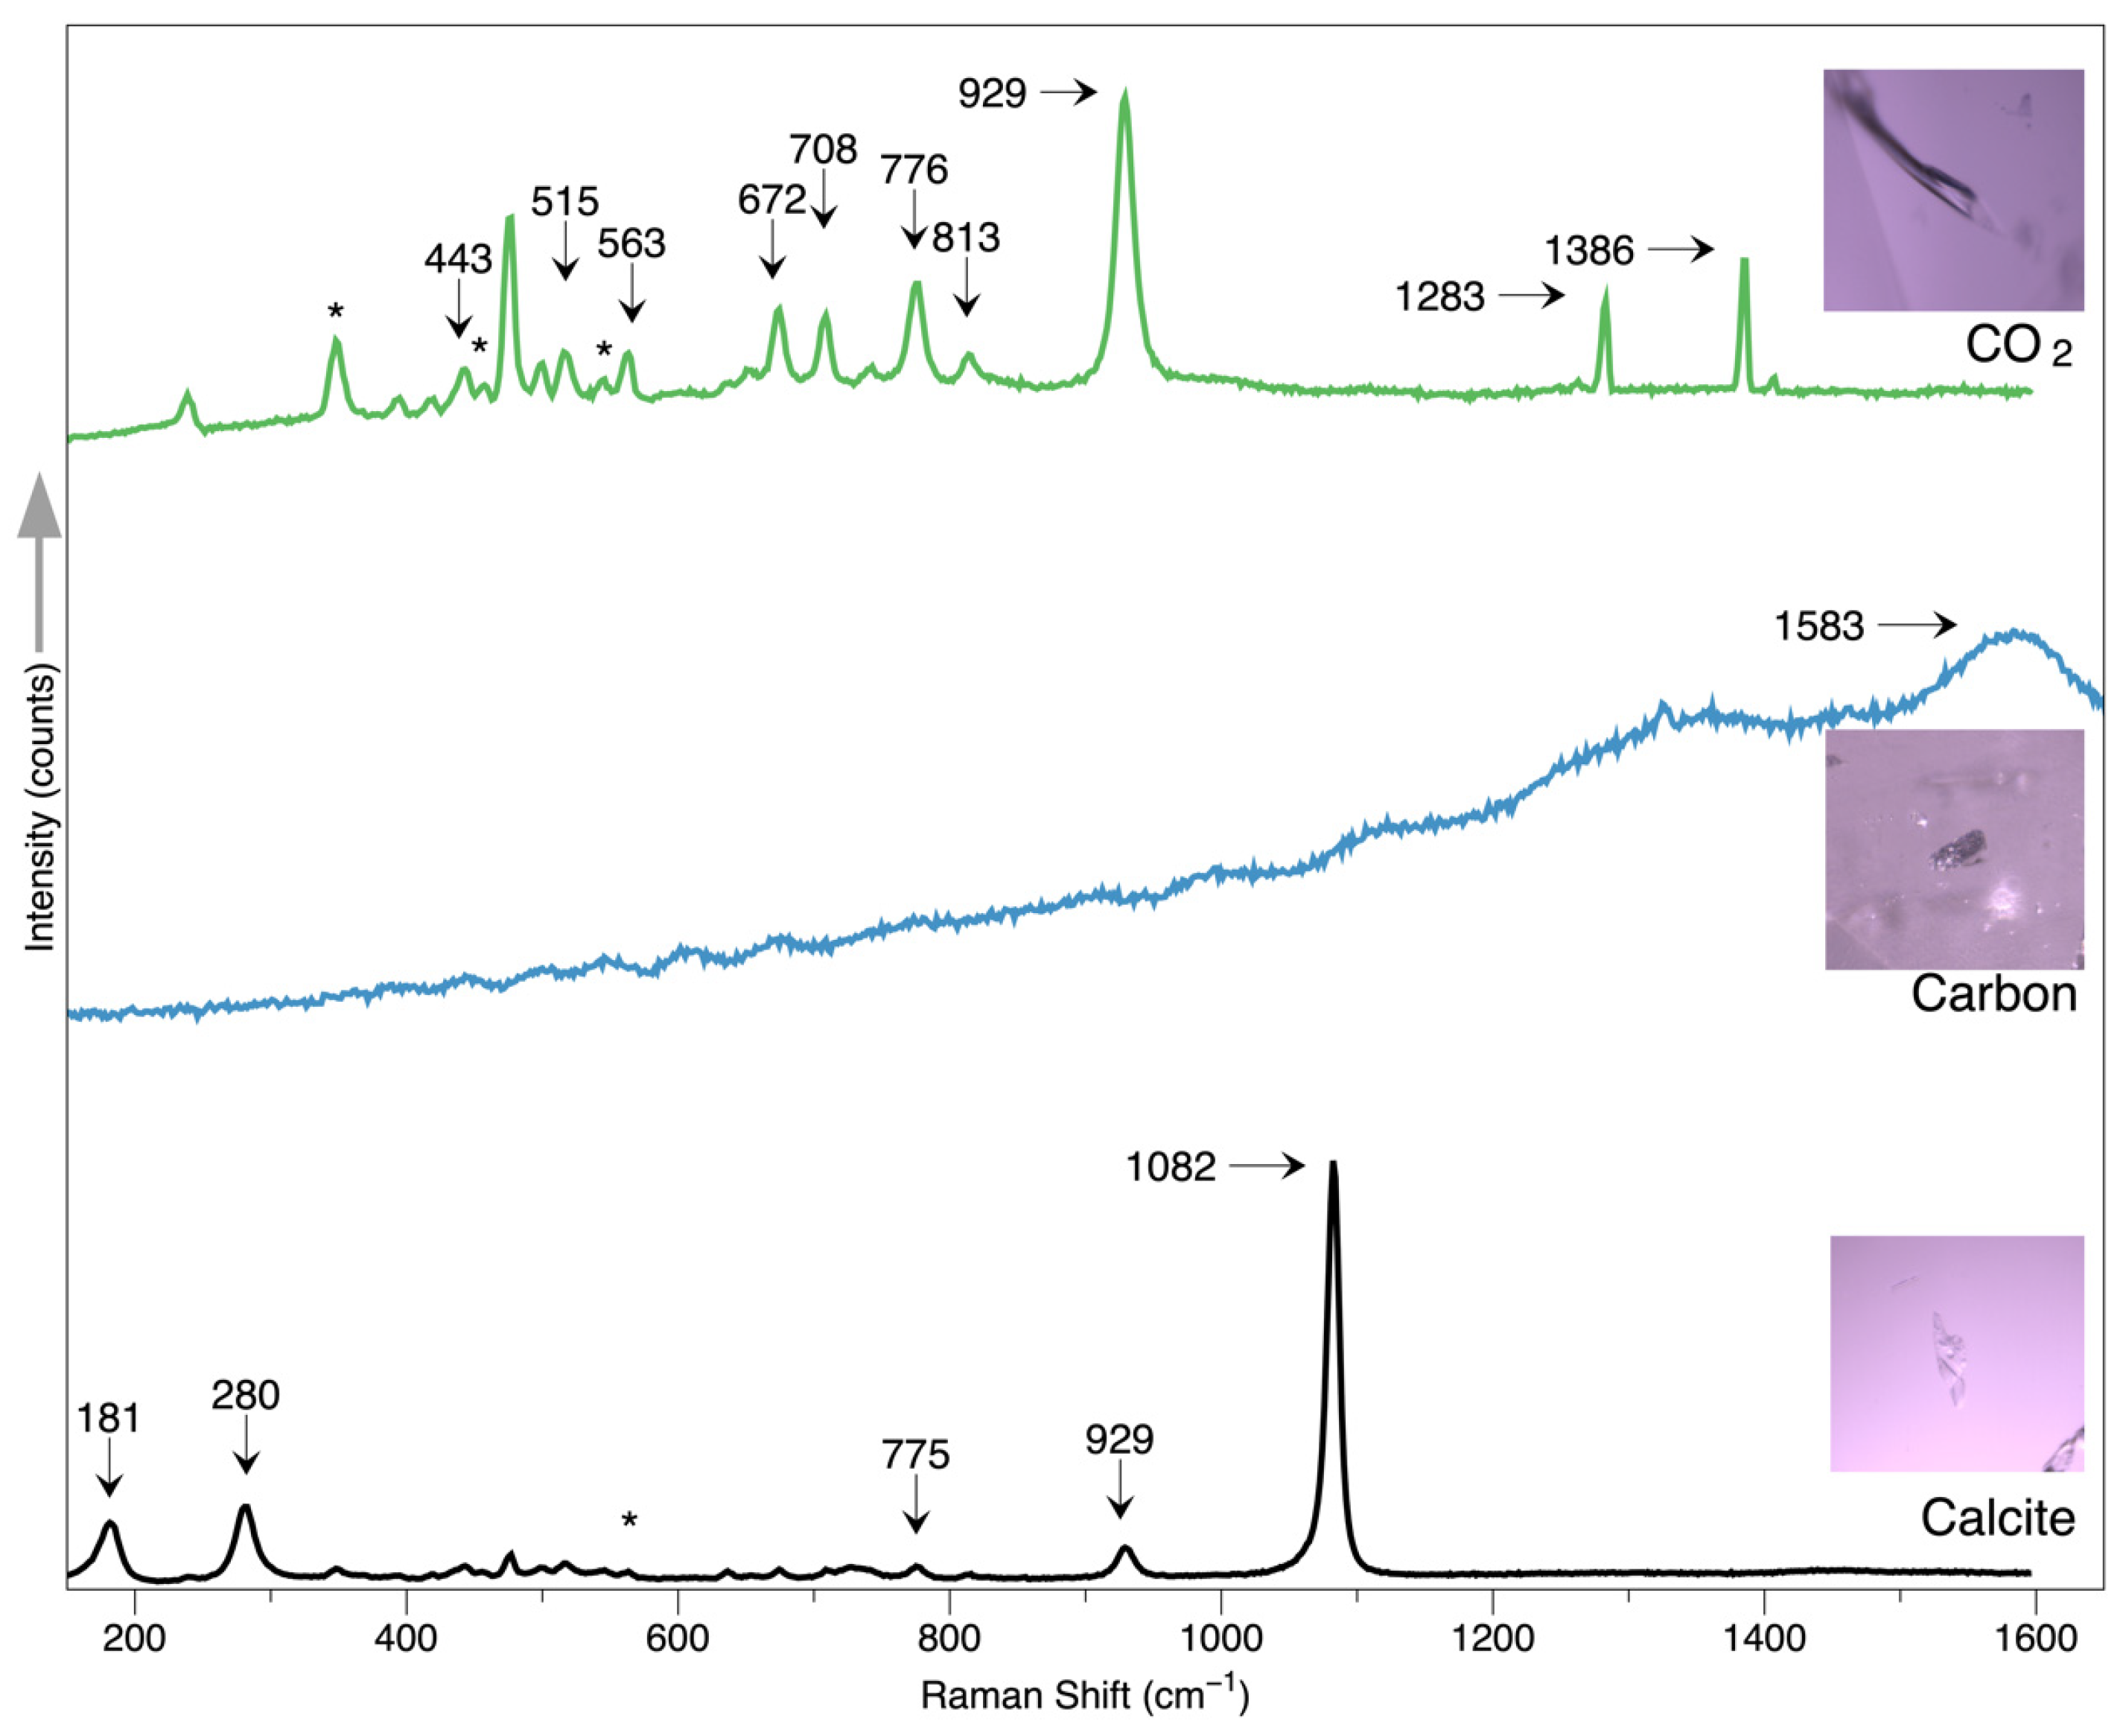
Figure 7.
Several solid inclusions were found in the samples studied, including irregular calcite (Cal), muscovite (Mu), quartz (Qtz), sillimanite (Sil), and carbon.
Figure 7.
Several solid inclusions were found in the samples studied, including irregular calcite (Cal), muscovite (Mu), quartz (Qtz), sillimanite (Sil), and carbon.
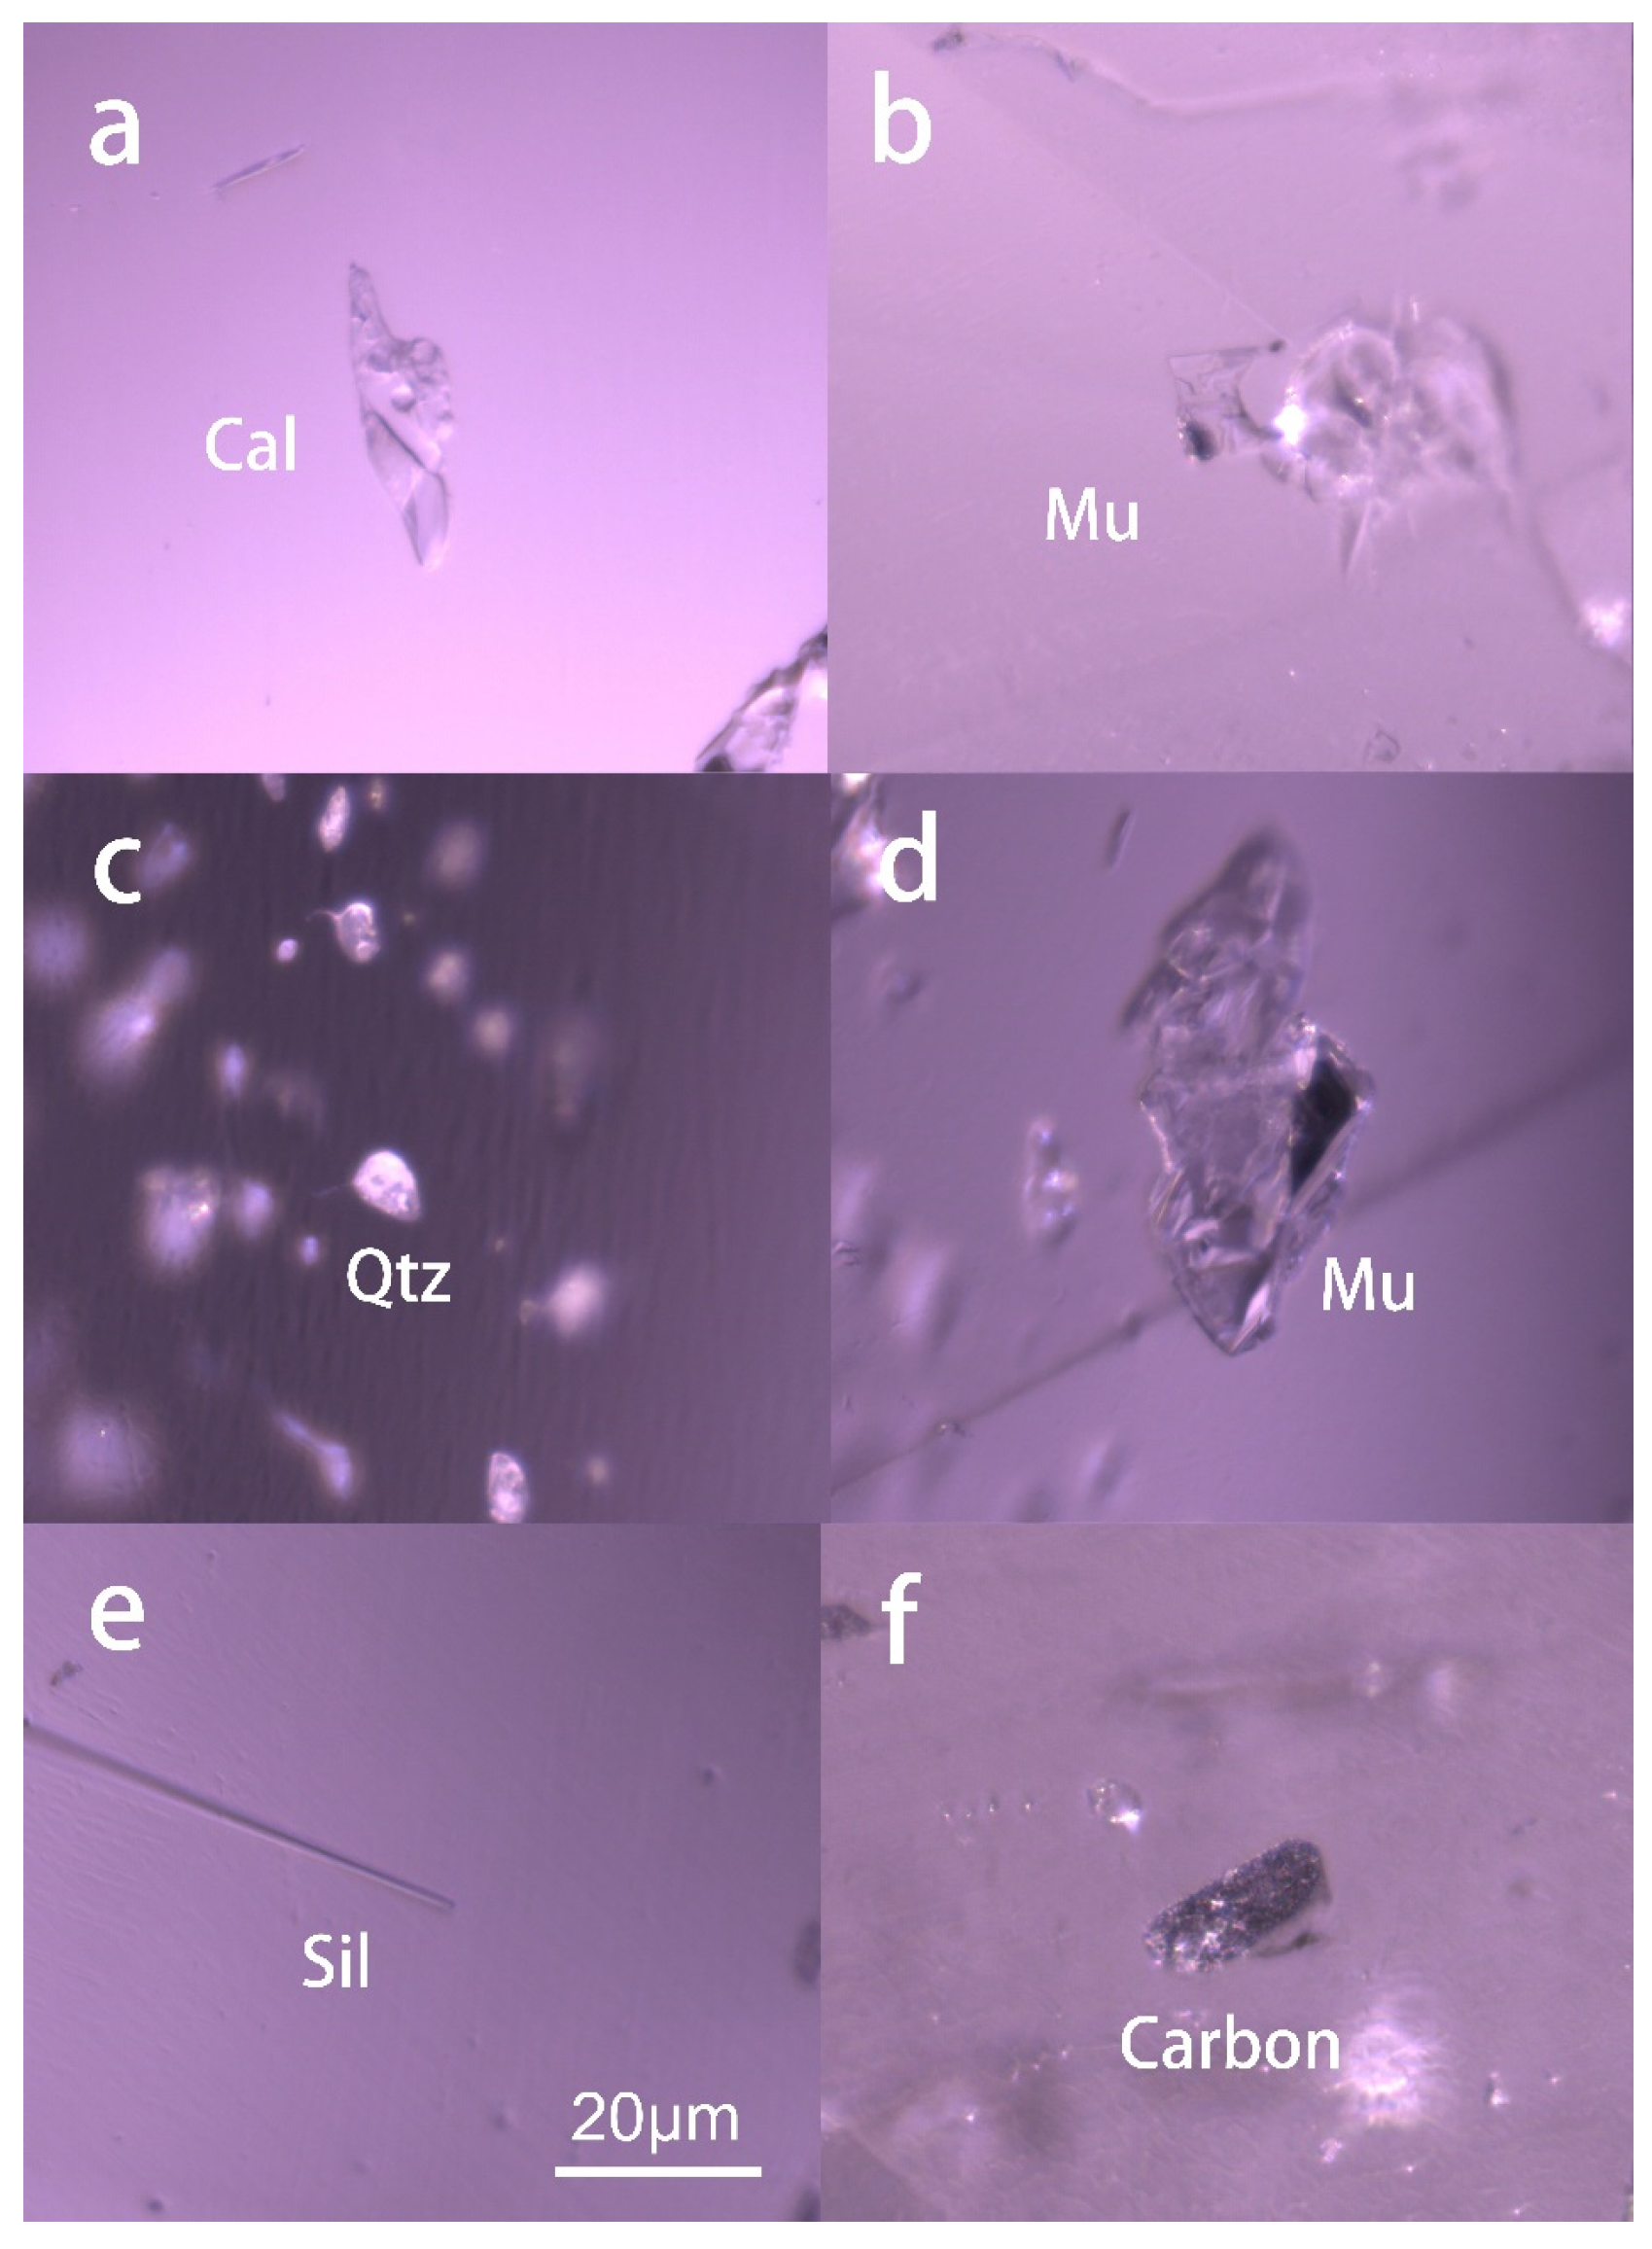
Figure 8.
The Raman spectrum of the chrysoberyl host was tested by three different lasers, 473, 532, and 785nm.
Figure 8.
The Raman spectrum of the chrysoberyl host was tested by three different lasers, 473, 532, and 785nm.
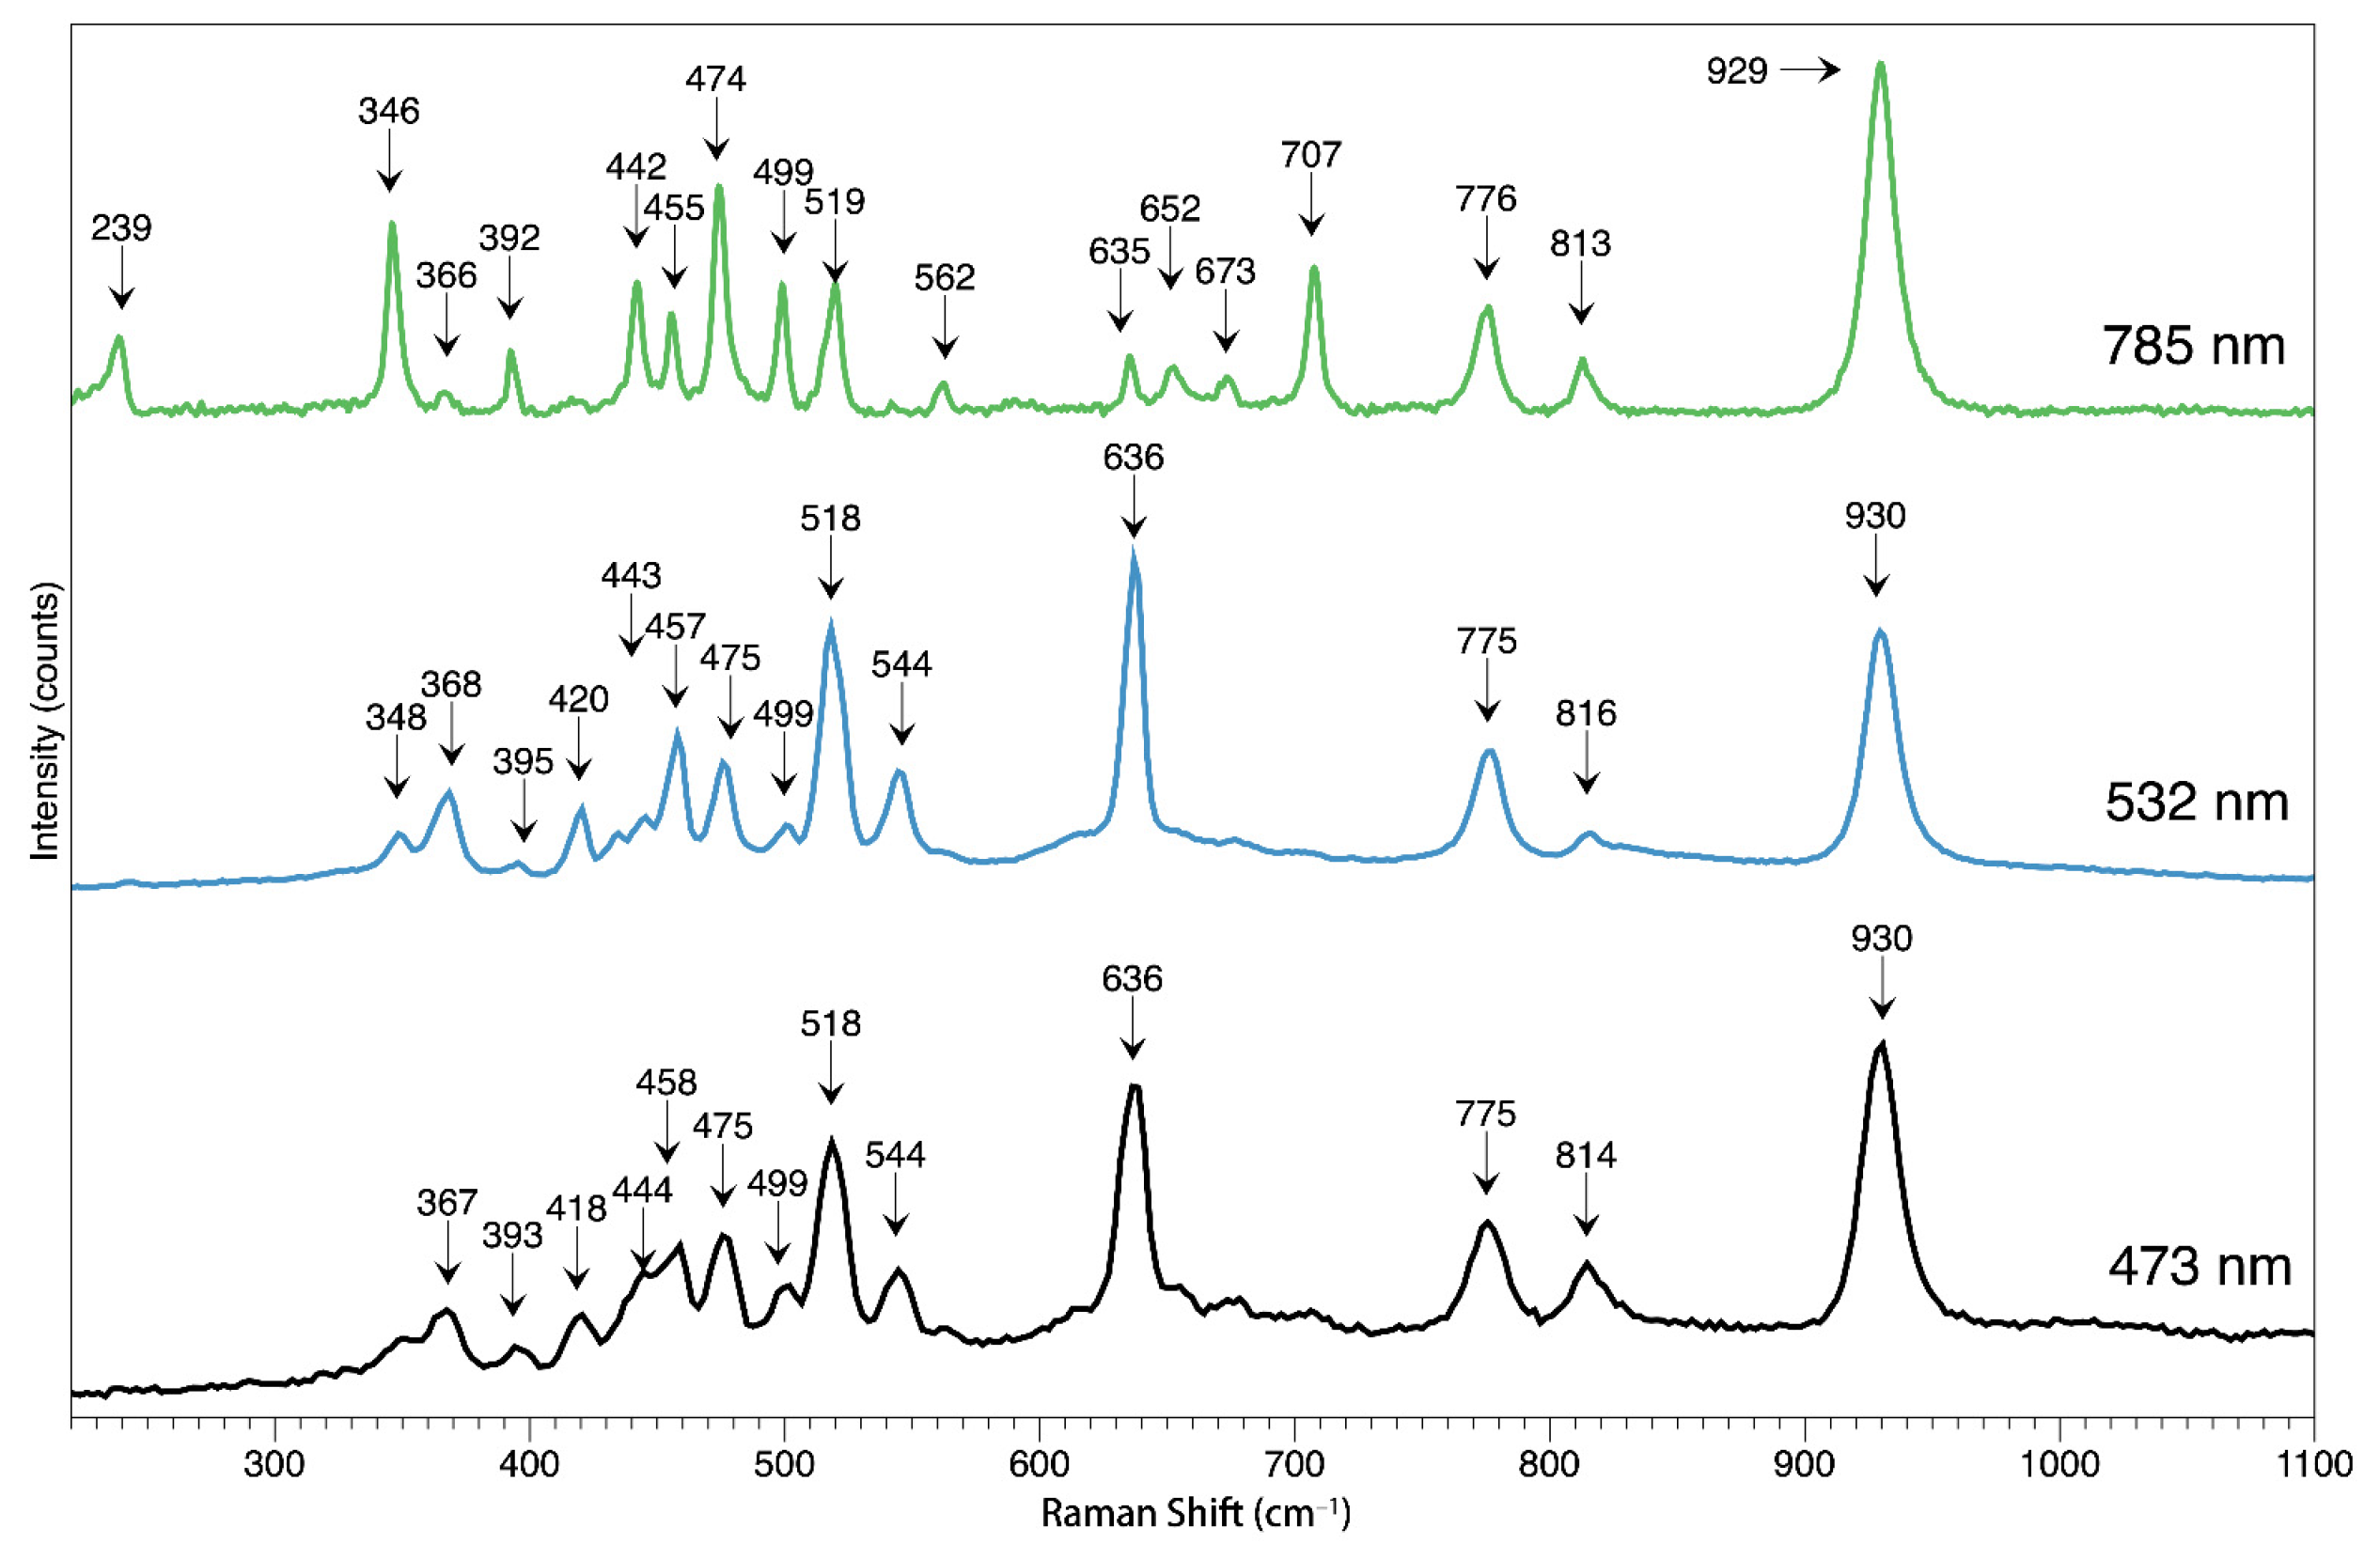
Figure 9.
The transmission FTIT spectrum of the chrysoberyl in this study.
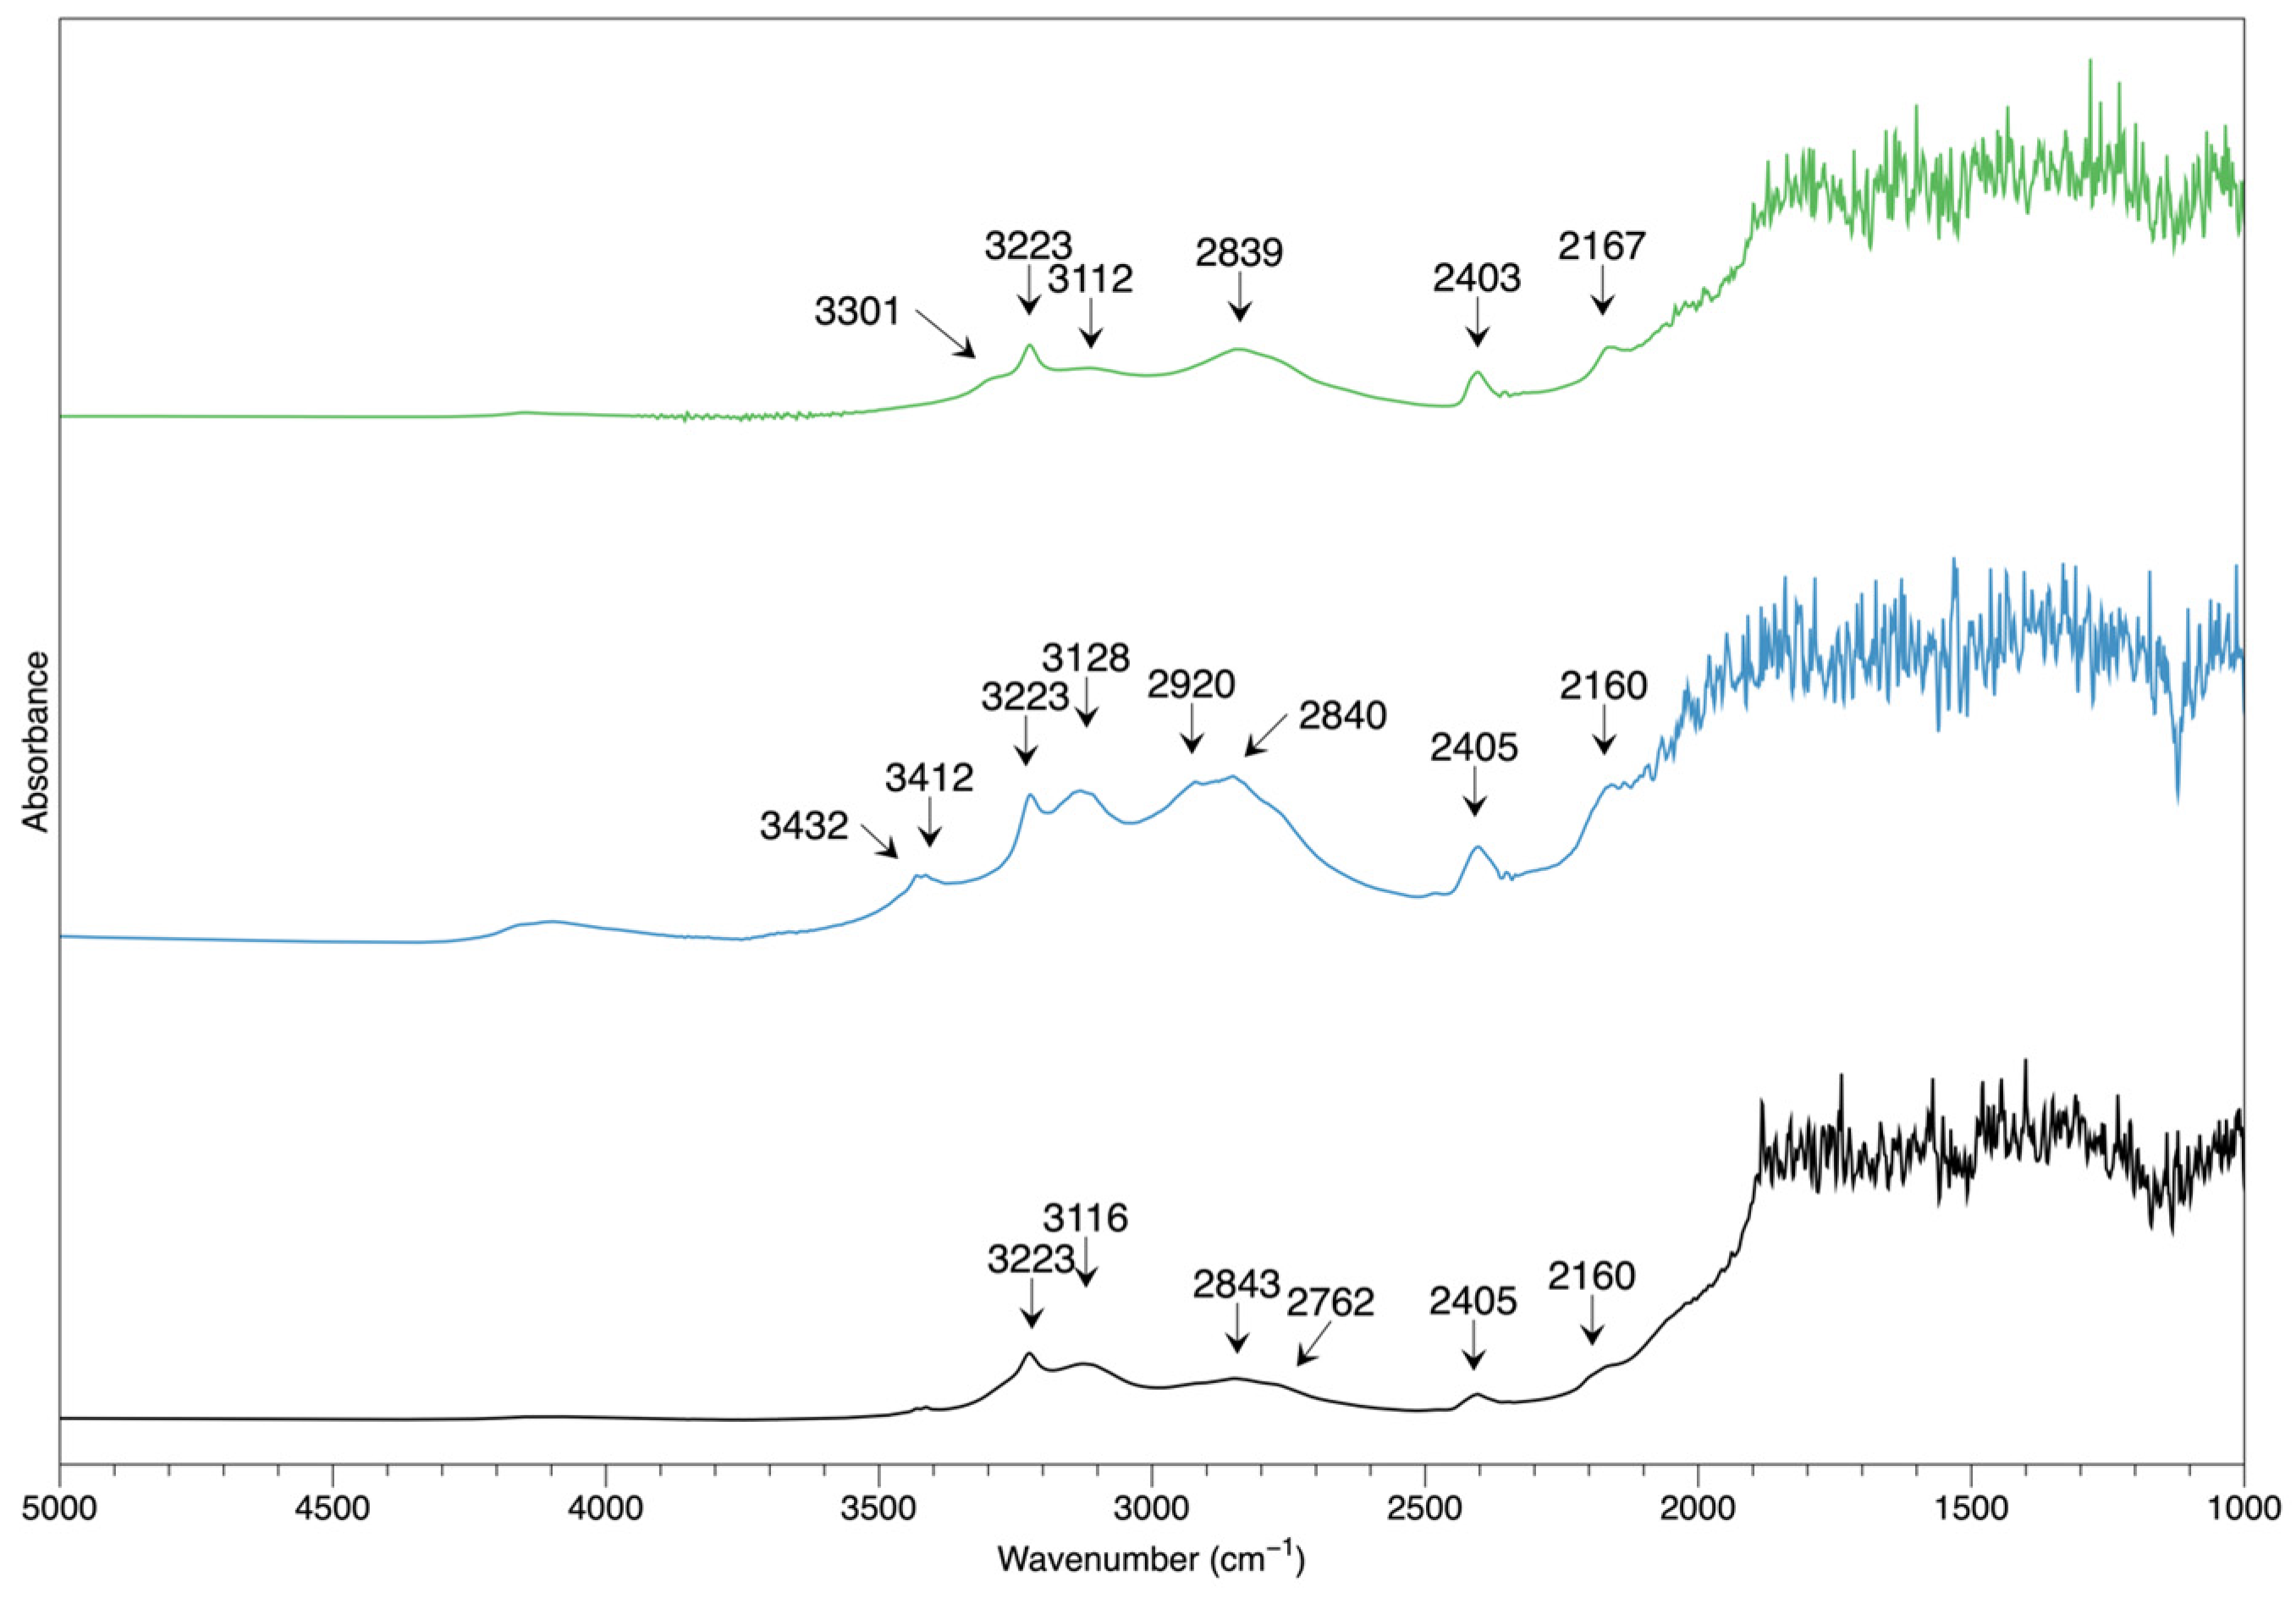
Figure 10.
The UV-Vis spectrum of the chrysoberyl samples in this study.
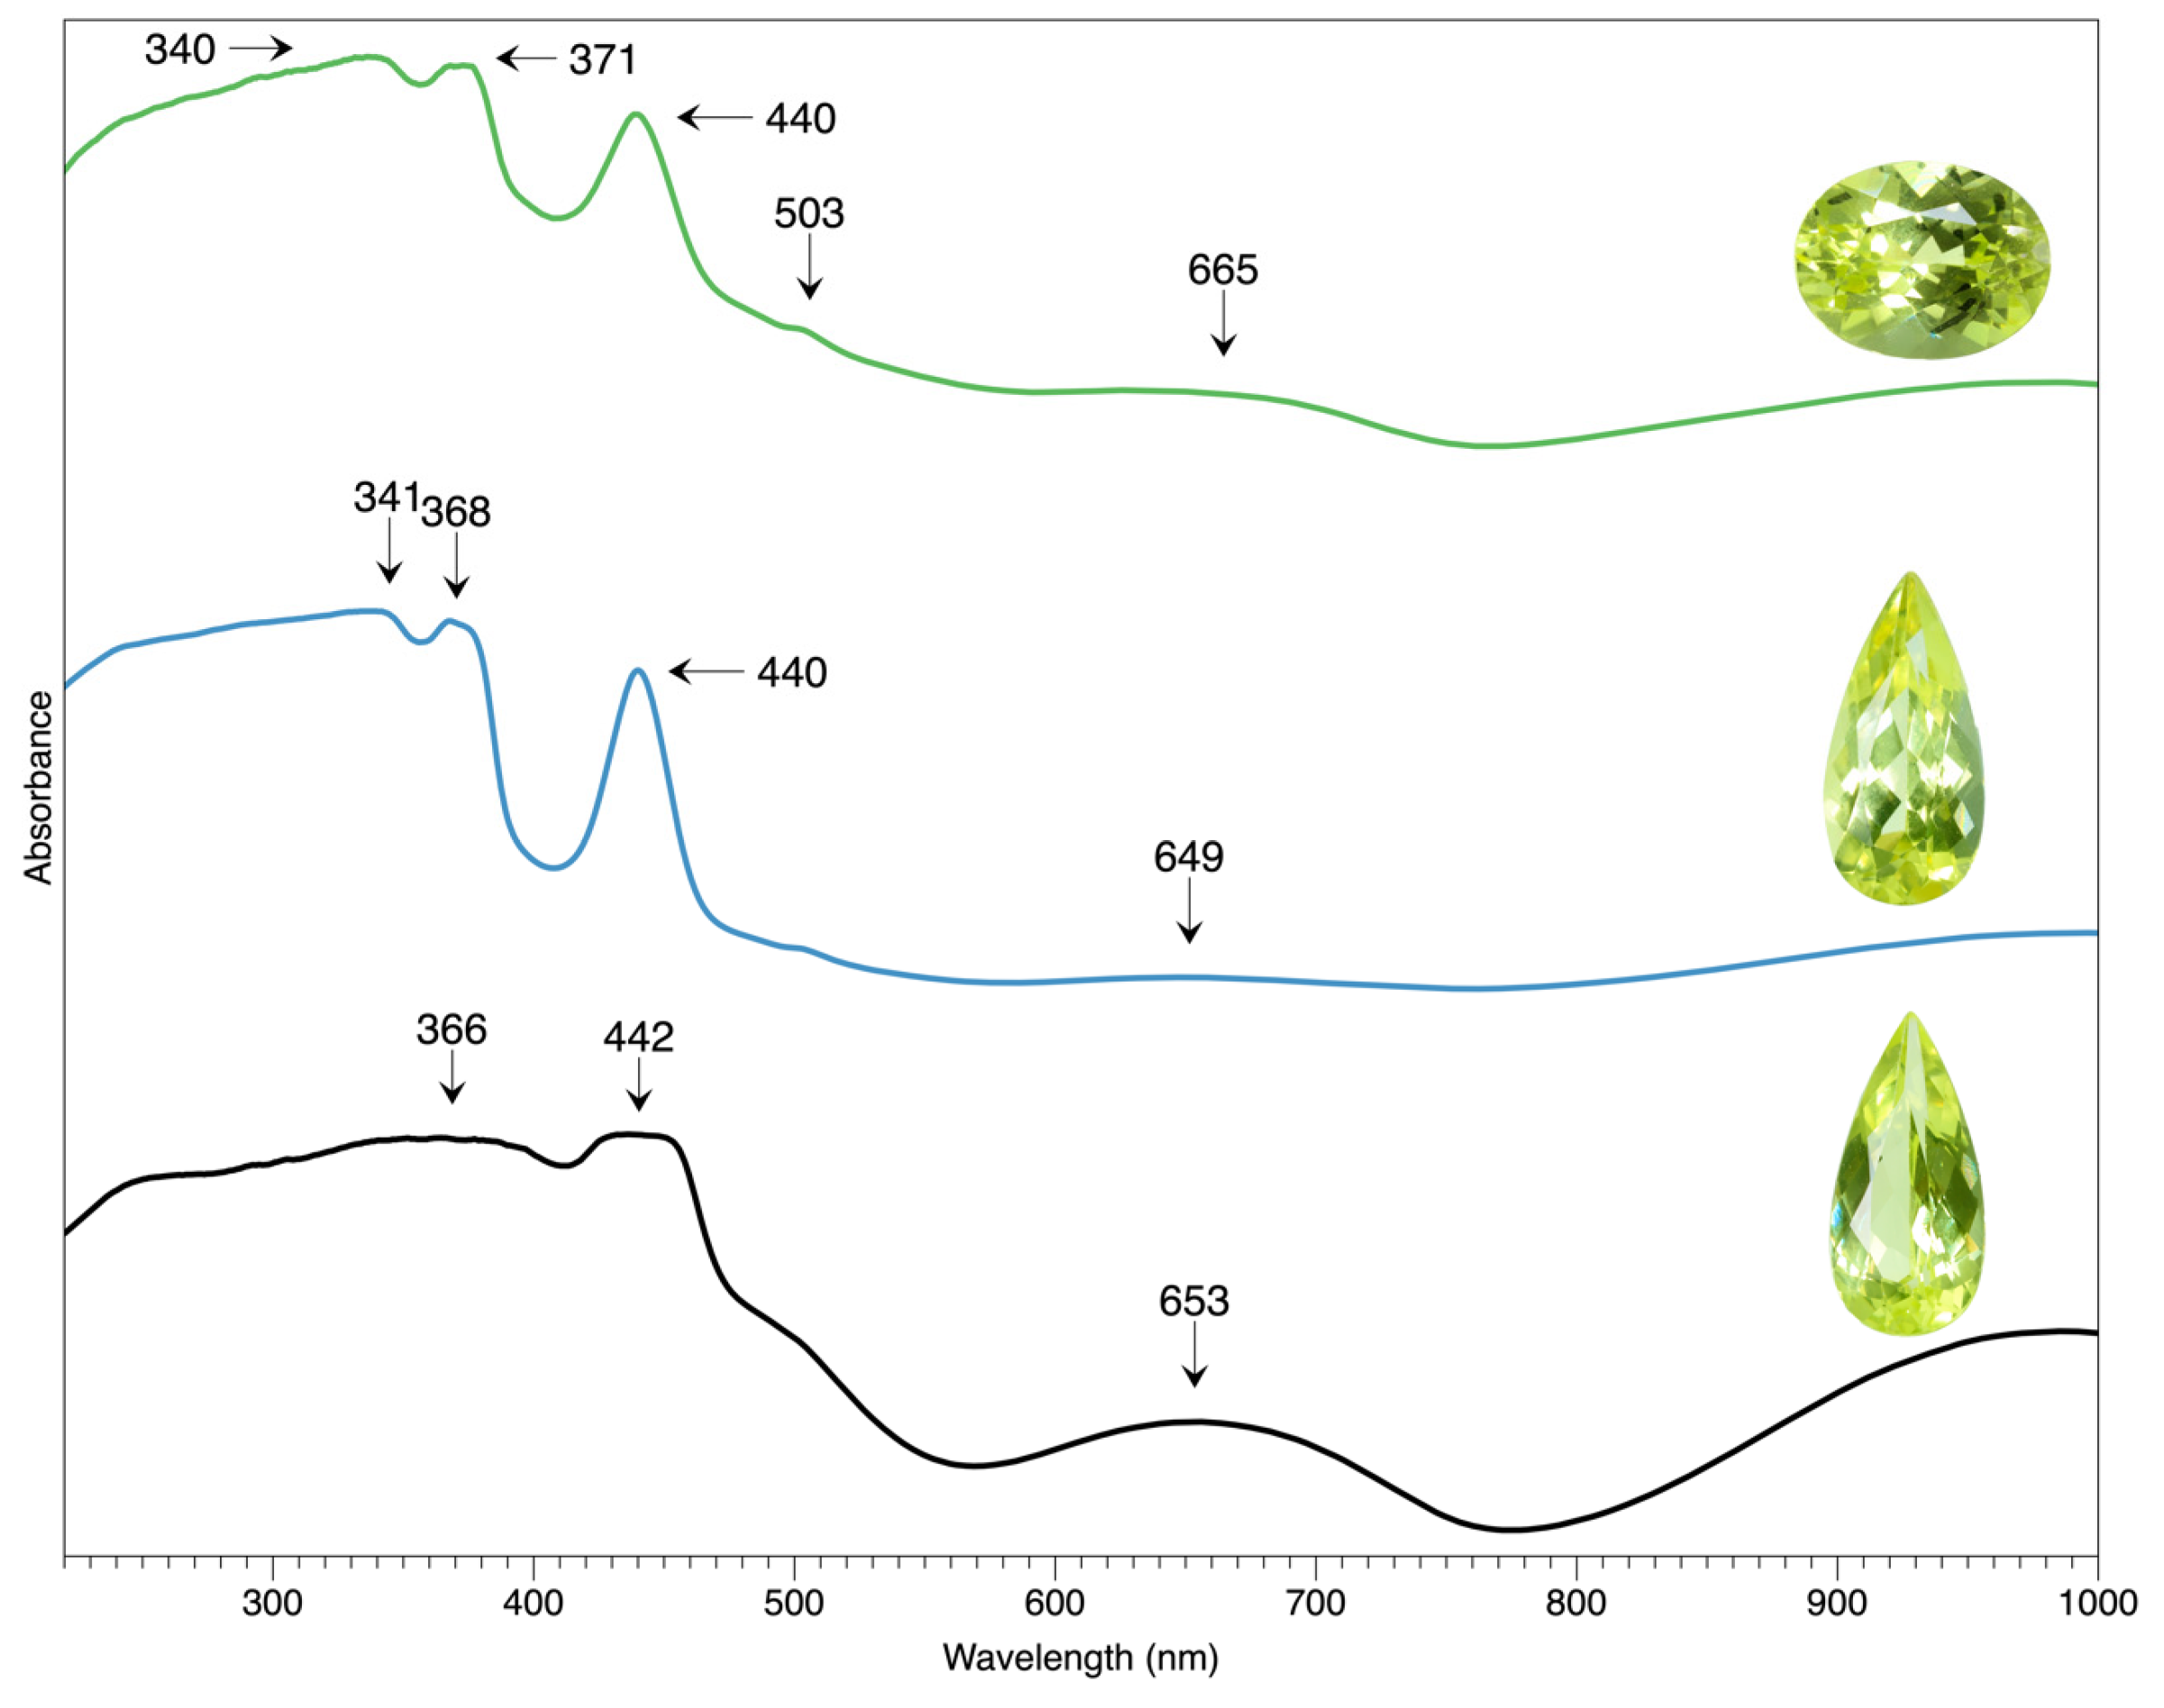
Figure 11.
The P.L. spectrum of chrysoberyl in this study can be classified into two patterns: a broad band at 550 nm or two sharp peaks at 678 and 680 nm.
Figure 11.
The P.L. spectrum of chrysoberyl in this study can be classified into two patterns: a broad band at 550 nm or two sharp peaks at 678 and 680 nm.
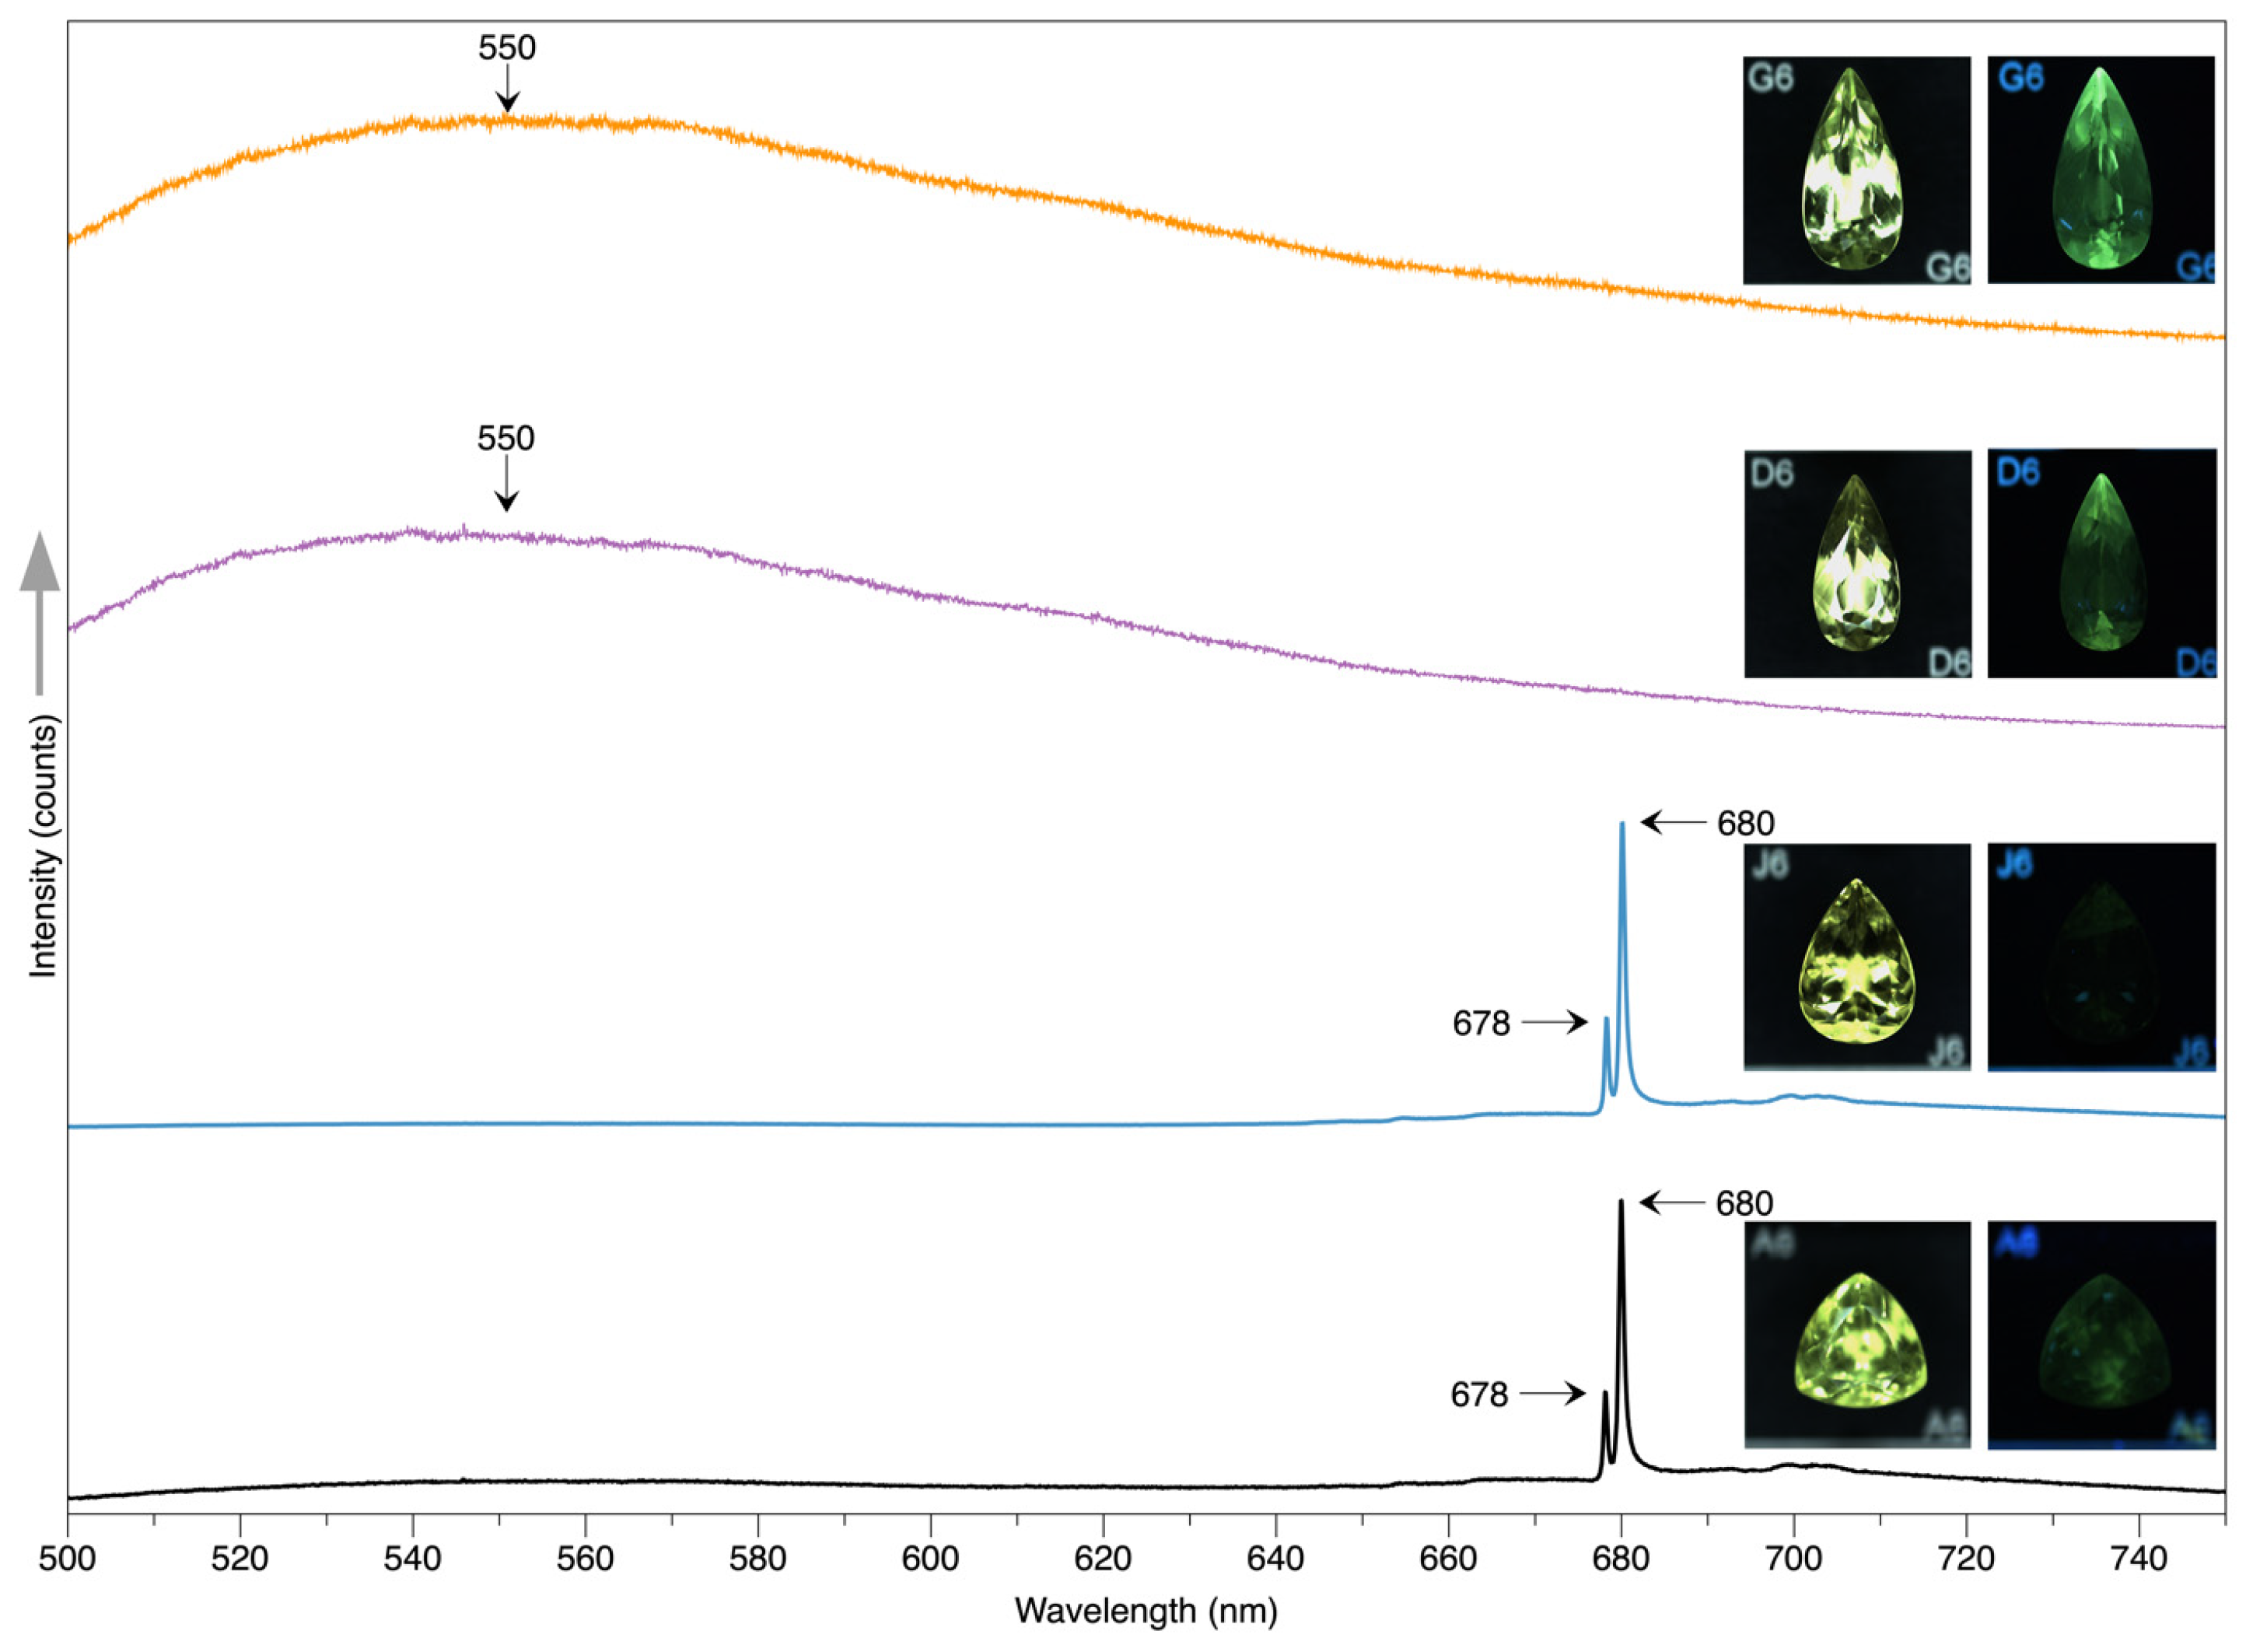
Figure 13.
The 3D plotting of CIE data regarding L, a*, and b*.

Figure 14.
The plotting of V versus Cr(a) and Fe/V versus Fe/Cr(b).
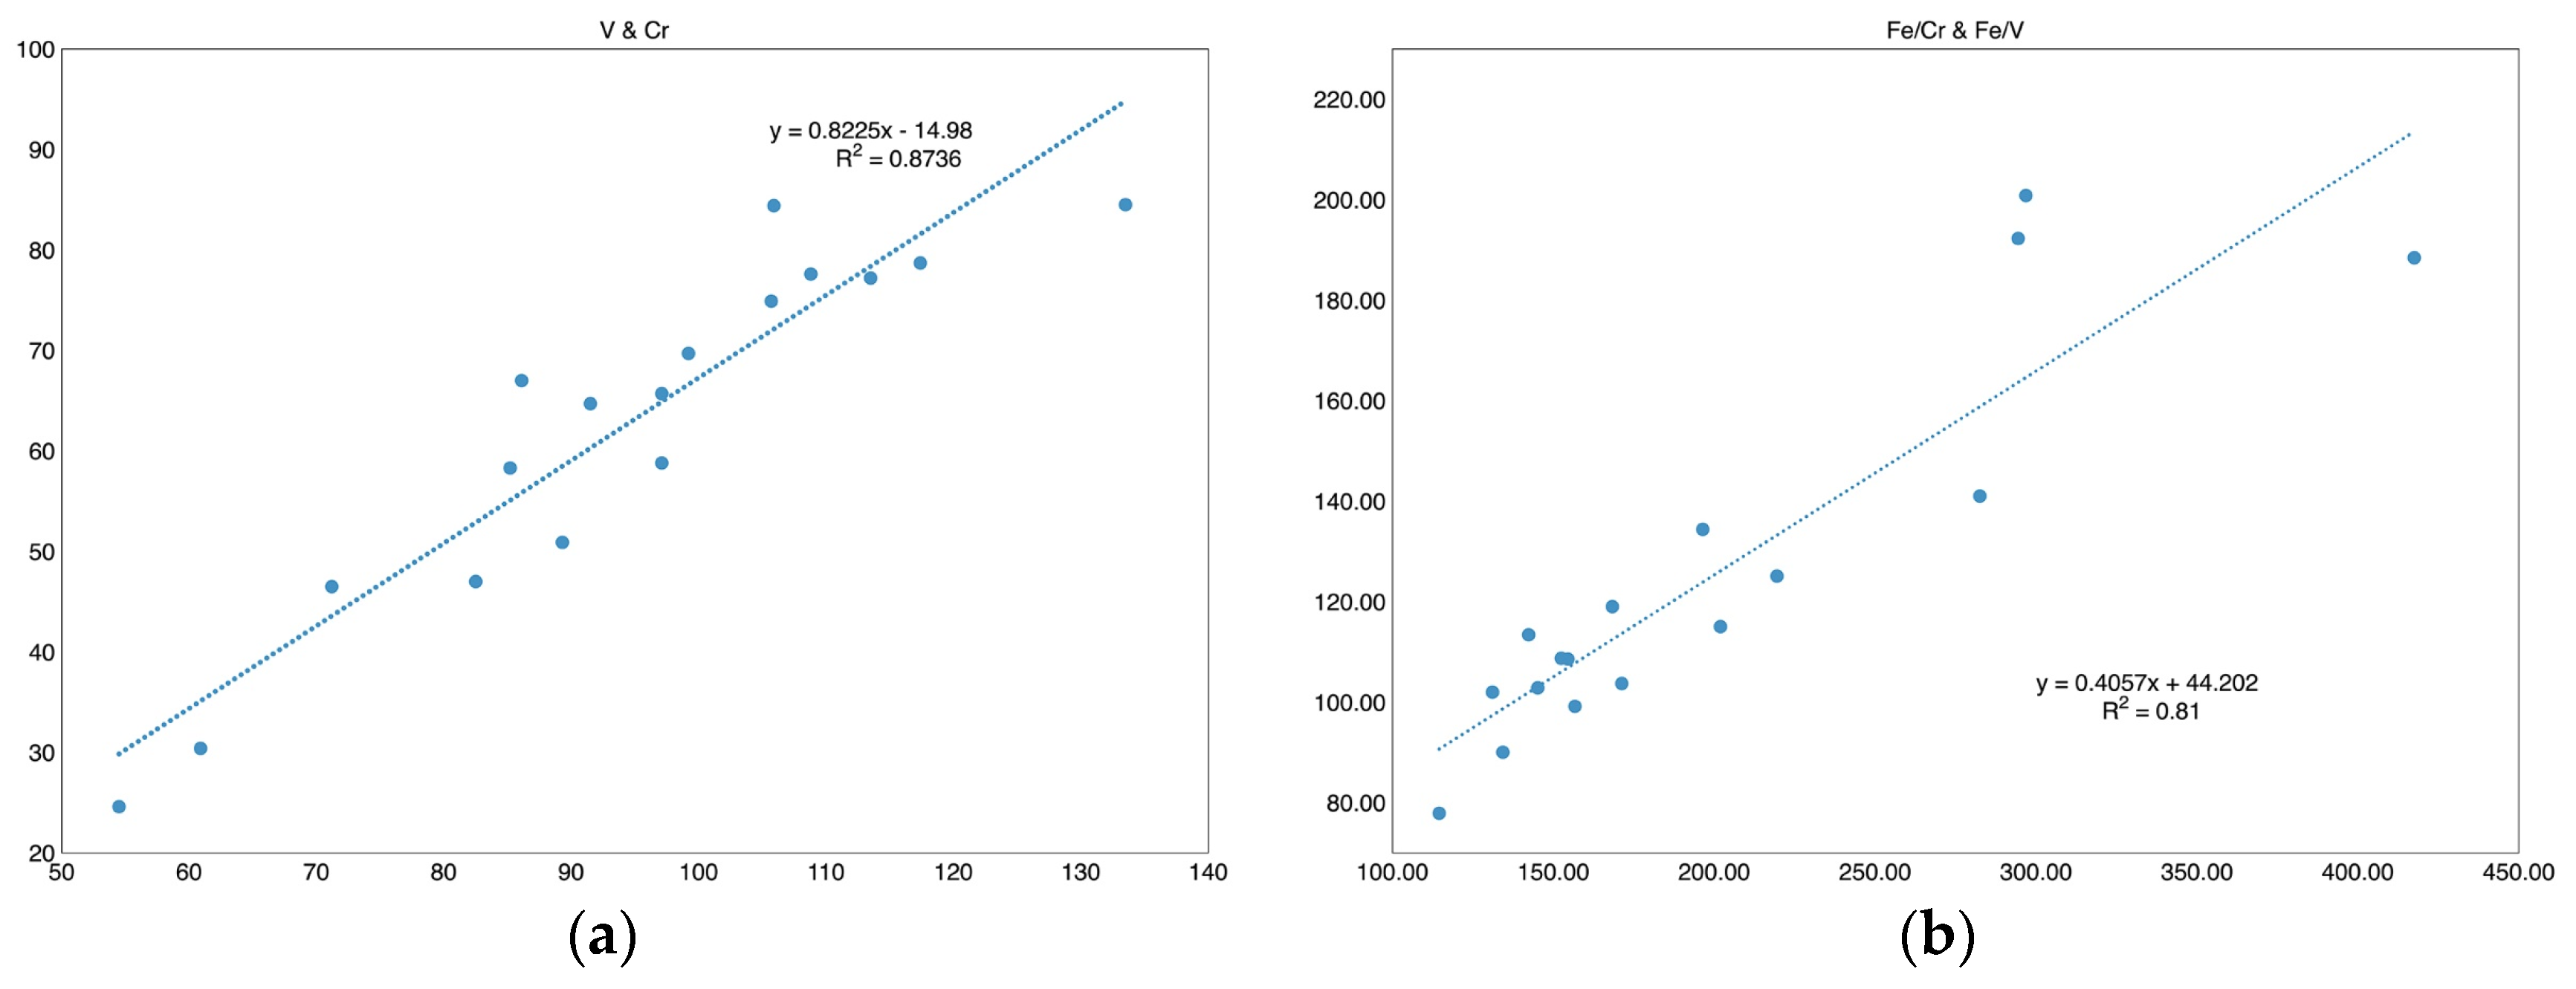
Table 1.
The basic information of the seventeen chrysoberyl samples in this study.
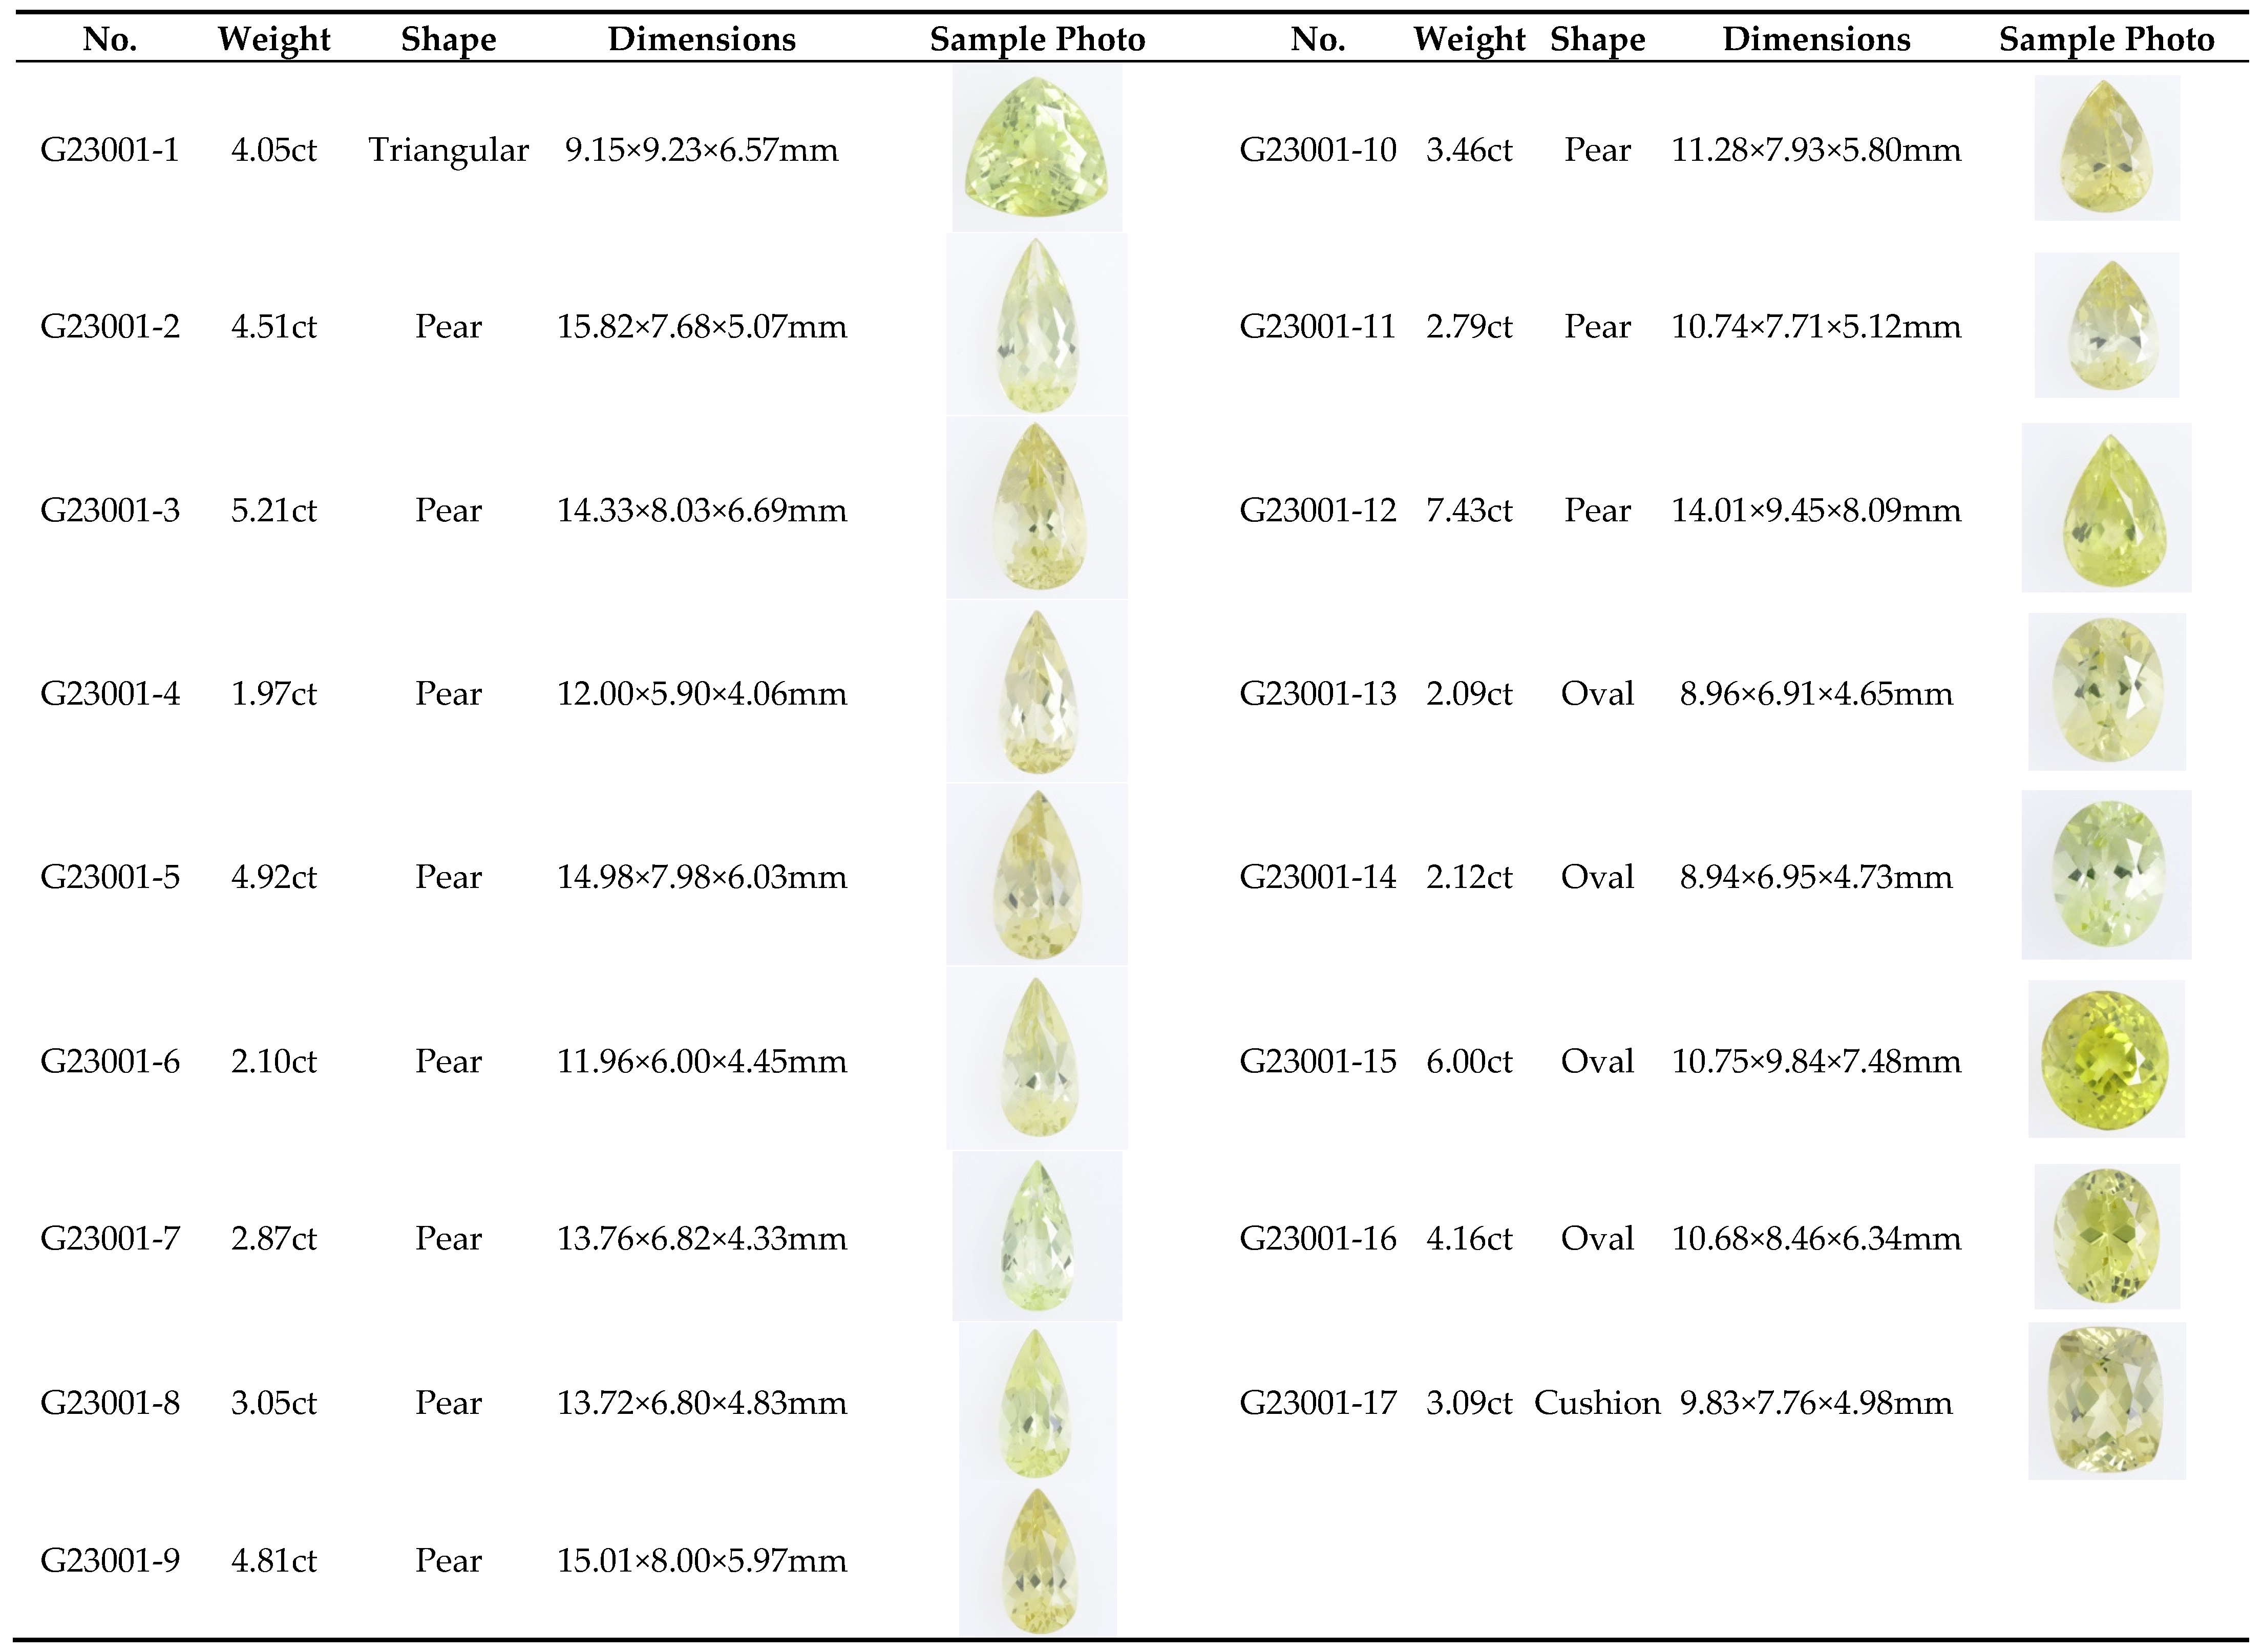 |
Table 2.
Gemological properties of chrysoberyl samples in this study.
| Weight | 1.97ct to 7.43 ct |
|---|---|
| Color | Yellow is the primary hue, accompanied by a tint of greenish secondary hue, with low to medium saturation |
| Clarity | Medium to high clarity |
| Refractive index | 1.743-1.751, birefringence: 0.008 |
| Optical character | Biaxial positive |
| Fluorescence | Inert under 365nm, exhibiting green fluorescence of various strengths under the 220nm |
| Internal features | 1. fluids 2. Straight growth lines 3. minerals inclusions, muscovite, sillimanite, and quartz 4. Carbon-related substances, CO2, carbon, and calcite |
| Chemical features | Rich in Fe, a trace of V and Cr, Sn of various levels |
Table 4.
The chemical composition of the canary yellow chrysoberyl in this study detected EDXRF.
| No. | Ti | V | Cr | Mn | Fe | Ga | Sn | Fe/Cr | Fe/V | Fe/(V+Cr) | V/Cr |
|---|---|---|---|---|---|---|---|---|---|---|---|
| G23001-1 | 744 | 133.5 | 84.5 | 24.7 | 13240 | 2070 | 814 | 156.69 | 99.18 | 60.73 | 1.58 |
| G23001-2 | 121 | 86.1 | 67 | 24.3 | 8781 | 2093 | 781.5 | 131.06 | 101.99 | 57.35 | 1.29 |
| G23001-3 | 177.5 | 113.5 | 77.2 | 26.1 | 8841 | 2689 | 51 | 114.52 | 77.89 | 46.36 | 1.47 |
| G23001-4 | 245.4 | 82.5 | 47 | 30.4 | 9490 | 2625 | 55.6 | 201.91 | 115.03 | 73.28 | 1.76 |
| G23001-5 | 221 | 60.9 | 30.4 | 28 | 8588 | 1989 | 83.3 | 282.50 | 141.02 | 94.06 | 2.00 |
| G23001-6 | 220.7 | 54.5 | 24.6 | 26.7 | 10270 | 1908 | 145 | 417.48 | 188.44 | 129.84 | 2.22 |
| G23001-7 | 543.9 | 97.1 | 58.8 | bdl1 | 10070 | 1956 | 560.4 | 171.26 | 103.71 | 64.59 | 1.65 |
| G23001-8 | 216.2 | 89.3 | 50.9 | bdl1 | 11170 | 2975 | 3461 | 219.45 | 125.08 | 79.67 | 1.75 |
| G23001-9 | 266.9 | 105.7 | 74.9 | 27.9 | 10870 | 3115 | 563.3 | 145.13 | 102.84 | 60.19 | 1.41 |
| G23001-10 | 113.9 | 105.9 | 84.4 | 25.1 | 12010 | 3703 | 519.8 | 142.30 | 113.41 | 63.11 | 1.25 |
| G23001-11 | 310.3 | 99.2 | 69.7 | bdl1 | 10770 | 1722 | 130 | 154.52 | 108.57 | 63.77 | 1.42 |
| G23001-12 | 227 | 85.2 | 58.3 | bdl1 | 11450 | 1379 | 1260 | 196.40 | 134.39 | 79.79 | 1.46 |
| G23001-13 | 58.6 | 91.5 | 64.7 | 24.1 | 10890 | 3272 | 175.5 | 168.32 | 119.02 | 69.72 | 1.41 |
| G23001-14 | 108.6 | 117.4 | 78.7 | bdl1 | 10570 | 2880 | 309.7 | 134.31 | 90.03 | 53.90 | 1.49 |
| G23001-15 | 509.6 | 97.1 | 65.7 | bdl1 | 19500 | 1802 | 2500 | 296.80 | 200.82 | 119.78 | 1.48 |
| G23001-16 | 1251 | 71.2 | 46.5 | bdl1 | 13690 | 2288 | 320.4 | 294.41 | 192.28 | 116.31 | 1.53 |
| G23001-17 | 612.8 | 108.8 | 77.6 | bdl1 | 11830 | 2378 | 567.8 | 152.45 | 108.73 | 63.47 | 1.40 |
| Average | 349.91 | 94.08 | 62.41 | 26.37 | 11295.88 | 2402.59 | 723.42 | 198.79 | 124.85 | 76.23 | 1.56 |
| SD2 | 302.71 | 20.17 | 17.75 | 2.10 | 2553.23 | 629.91 | 925.22 | 80.43 | 36.26 | 24.55 | 0.25 |
1bdl= below the detection limit. 2SD=Standard deviation.
Disclaimer/Publisher’s Note: The statements, opinions and data contained in all publications are solely those of the individual author(s) and contributor(s) and not of MDPI and/or the editor(s). MDPI and/or the editor(s) disclaim responsibility for any injury to people or property resulting from any ideas, methods, instructions or products referred to in the content. |
© 2023 by the authors. Licensee MDPI, Basel, Switzerland. This article is an open access article distributed under the terms and conditions of the Creative Commons Attribution (CC BY) license (http://creativecommons.org/licenses/by/4.0/).
Copyright: This open access article is published under a Creative Commons CC BY 4.0 license, which permit the free download, distribution, and reuse, provided that the author and preprint are cited in any reuse.


