1. Introduction
According to the World Economic Forum, 90% of global trade relies on merchant vessels for transportation via the sea. In 2022, Statista Research Department’s previous research revealed that the world merchant fleet consists of 58590 vessels of all types and sizes, like bulkers, tankers, containerships, refer, RoRo, chemicals, LPG, and LNG. Considering the particularities of operation and the environment, we could compare a ship with many specialized factories, each dependent on the other, to produce a final product. This product is the safe transportation of goods from loading to the discharging port within a specified time frame.
The vessels consist of dozens of complex machineries; their maintenance is of paramount importance. Failure in one of these machines could delay the vessel’s estimated arrival time or, even worse, jeopardize the safety of the vessel and its crew, having potentially negative implications for the environment. To keep the vessels fully functional and seaworthy, the shipping industry, mandated by the International Maritime Organization (IMO) that has established and enforced the International Safety Management Code (ISM), applies corrective and proactive maintenance to all rotating machinery.
In proactive maintenance, each piece of machinery in a predetermined calendar or operating period is immobilized and inspected, while major parts are proactively replaced regardless of their actual condition. This entails the risk that the proactively replaced parts may still be functional, meaning that their replacement has resulted in unnecessary waste of resources and money. Besides, it is still possible for a machine to break down before its scheduled maintenance, and therefore, unscheduled repair works must be executed as soon as possible. It is perceived that for proactive maintenance to be properly applied, vessels must always procure and curry spare parts for all major machinery. This leads to increased overall maintenance costs and the commitment of significant financial resources for procuring and storing the spare parts.
With the development of technology over time, new maintenance methods based on the real condition of the machinery have appeared and are gradually, though still slow, being applied in the marine industry. The advent of the 4th industrial revolution era and the Internet of Things (IoT) have contributed to this, as it provides the possibility of “intelligent” interconnection of “smart” devices with the ultimate purpose of making measurements and collecting operating parameters. It also provides the analysis of these data with modern tools and methods, such as Artificial Intelligence (AI). The ultimate aim is to draw useful conclusions about the machinery’s operational status and finally, to implement predictive maintenance (PDM) based on these conclusions.
Rolling element bearings are the dominant components in all rotating machinery and their failures remain the leading cause of machinery breakdown. Likewise, vibration monitoring is one of the leading techniques for rotating machinery condition detection and diagnostics. Vibration footprints can reveal faults like imbalance, misalignment, bearing failure, etc.
In this paper, we analyze how computer and data technology, and more specifically Convolutional Neural Networks (CNNs), which are part of Deep Learning (DL) and Artificial Intelligence (AI), can contribute to rotating machinery predictive maintenance (PDM). To this end, we propose a simple, 1D Convolutional Neural Network that is trained with raw vibration data from Case Western Reserve University (CWRU) Bearing Data Center. Then, the proposed network is fed with new, unknown raw vibration signals to check whether it succeeds in detecting and categorizing the status of the ball bearings.
The paper is organized as follows:
Section 2 presents some of the most interesting researches based on recent literature review.
Section 3 provides a concise overview of the two primary machinery maintenance methods commonly employed in the shipping industry: preventive maintenance and predictive maintenance. In
Section 4, the principles of the CNNs are presented.
Section 5 analyzes the proposed CNN and presents the training, evaluation, and, subsequently, the testing data set and results of the network’s response. Finally, conclusions and directions for further research are drawn in
Section 6.
2. Literature review
Nowadays, there is an increasing research interest in applying artificial intelligence techniques for fault diagnosis. Souza et al. [
1] proposed the application of Convolutional Neural Networks for developing a prognostic maintenance model that detects and classifies faults in machines with rotating parts and provides recommendations on when maintenance actions should be taken. The proposed model demonstrated high accuracy in the classification of failures using the MaFaulDa database. The proposed method showed a great potential for application in the diagnosis and classification of failures of rotating machines in industrial environments with different severity levels, even with the usage of only one vibration sensor and features.
Han et al. [
2] proposed a combination of Genetic Algorithms (GAs) and Neural Networks (NNs) for diagnosing faults in induction motors based on feature recognition using motor vibration. The GA was employed as a feature selection and classifier optimization tool. The proposed system performance was evaluated on a real test. It was proved that the proposed system has high effectiveness, compact structure and is promising for real applications.
Tama et al. [
3] presented the advantages and disadvantages of applying deep learning in the predictive maintenance of rotating machinery. Based on a thorough review, they conducted an in-depth analysis of 59 studies on fault diagnosis methods based on vibration signals. In their work, they investigated a series of deep learning algorithms such as CNN, DBN, RNN, GNN (generative NN) and GNN (Graphic NN) providing insights into the latest techniques for fault diagnosis.
Zang et al [
4] proposed a modified convolutional network called Convolution Neural Networks with Training Interference (TICNN) to address the fault diagnosis problem. TICNN works directly on raw vibration signals without any time-consuming hand-crafted feature extraction process. The model has been proved able to achieve pretty high accuracy in a noisy environment. It can also achieve high accuracy when the working load is changed.
Abdeljaber et al. [
5] presented a one-dimensional convolutional network for the detection, classification, and assessment of the severity of ball bearings faults. The proposed network was trained and then tested on scenarios involving multiple faults in the ball bearings simultaneously. In this way, the authors demonstrated the accuracy and validity that simple one-dimensional convolutional networks can achieve without requiring significant computational power and extensive datasets for training. The experimental results demonstrated that the proposed approach can achieve a high level of accuracy for damage detection, localization, and quantification.
Zhao et al. [
6] performed a comprehensive evaluation of four deep learning models, including multi-layer perception (MLP), auto-encoder (AE), convolutional neural network (CNN) and recurrent neural network (RNN). They utilized nine publicly available datasets containing vibration measurements from ball bearings and evaluated their ability to draw meaningful conclusions based on the included data. This work focuses on evaluating DL-based intelligent diagnosis algorithms from different perspectives and providing benchmark accuracy (a lower bound) to avoid useless improvement.
Kiranyaz et al. [
7] presented in their study a comprehensive review of the general architecture and principles of 1D CNNs along with their major engineering and biomedical applications, especially focused on the recent progress in this field. It has already become apparent that AI will further assist or perhaps even replace humans on those complex tasks that require a high level of expertise and training, such as medical operations, health monitoring and diagnosis, taxonomy and even higher education.
3. Maintenance strategies
The Industrial Revolution, which took place in the mid-18th century, ushered in significant advancements in the industry that have greatly influenced the shaping of society up to the present day. In today’s modern era, society has embraced an increasingly consumerist lifestyle, leading to an unprecedented growing demand for production worldwide. However, the challenges of meeting this demand have become apparent as machinery breakdowns; thus, unexpected production line disruptions contribute to increased downtime and hinder the productivity and profitability of companies. As a result, the concept of machinery maintenance has gained prominence in sectors such as construction, production and transportation. Regardless of its specific type, the ultimate objective of effective maintenance is to enhance working conditions and optimize machinery performance.
Machinery breakdowns and interruptions in production have a significant and increasingly swift economic impact. The process of mechanization followed by automation in production is a progression with no turning back. It was only in 1962 when the term Reliability Centered Maintenance (RCM) was introduced, and in 1970, when Japan emphasized the concept of Total Productive Maintenance (TPM) [
8]. These developments highlight the growing recognition of the importance of maintenance strategies in optimizing reliability and productivity in industrial settings. According to Coanda et al. [
9], the lifetime of a product includes five stages: conception of the idea, defining the objectives, realization, use and disposal/recycling. It is evident that the middle phase involving the use of the product should last longer; therefore, the product itself must be maintained in a manner that ensures optimal performance throughout its entire lifespan.
Figure 1 illustrates the above.
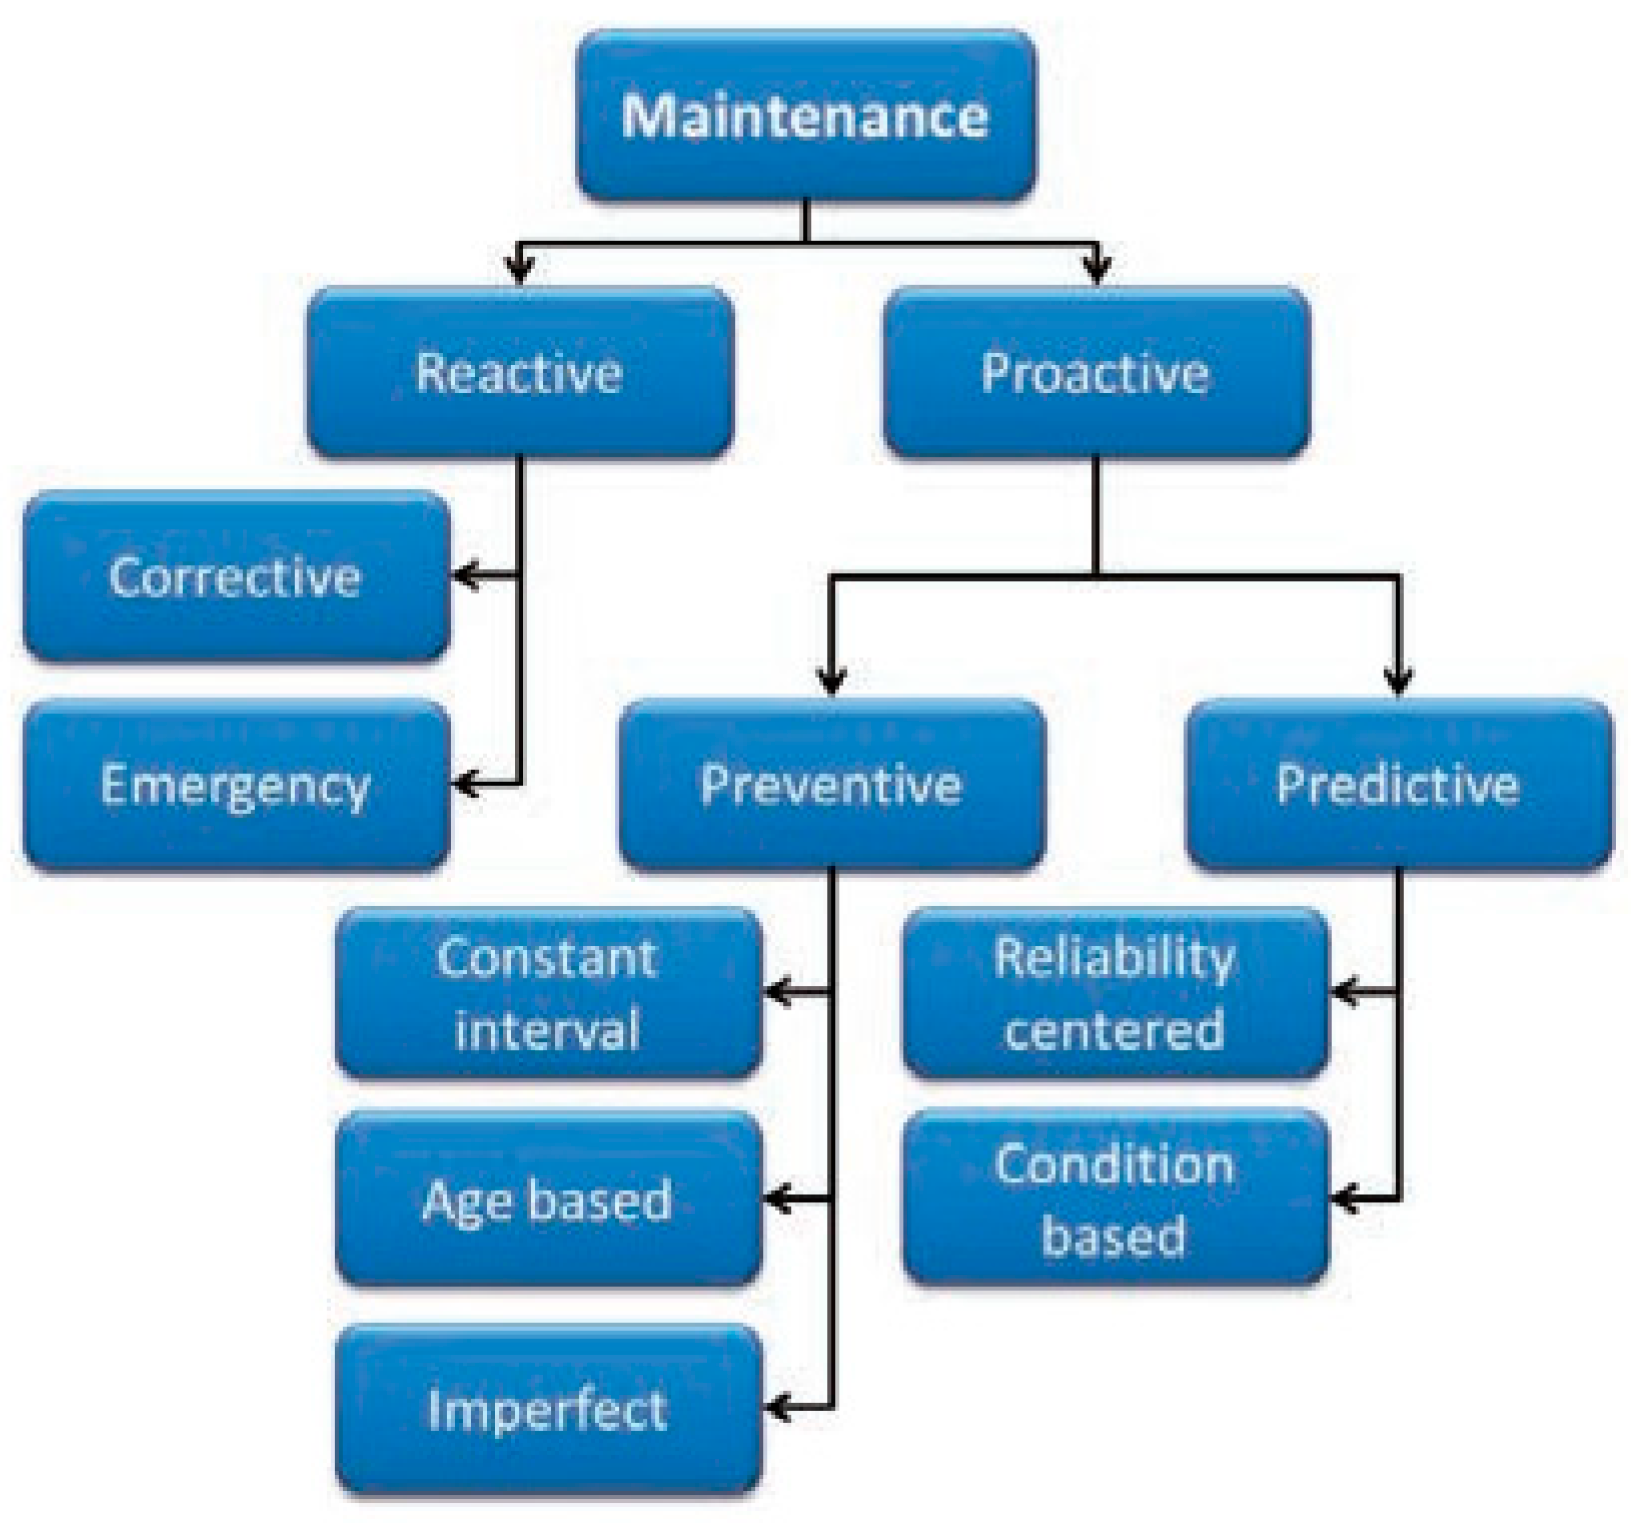
Although the ultimate purpose of maintenance is the same, keeping a machinery or production line to its optimal operation condition, its philosophy depends on the production area to be applied, but also on the mentality of the stakeholders. As determined by the EN 13306 standard [
10], maintenance is divided into two major categories, reactive and proactive; each one is divided in more subcategories.
Figure 2 illustrates the maintenance philosophies according to Konrad et al. [
11].
2.1. Reactive maintenance
Reactive Maintenance is applied after the consequences of a machinery breakdown or production line immobilization has occurred. It can be categorized into two types: Corrective and Emergency Maintenance. Corrective is the first maintenance strategy ever applied and the most straightforward. It follows the Run to Failure approach, where no interventions are made until the machinery fails. Once the machinery breaks down, the faulty parts are repaired or replaced and the machinery is brought back into operation. This method is applicable, without unpleasant implications, when the defective machine does not affect the production or the demand far outweighs the production or the profit margin is so large that the cost of repair is negligible.
2.2. Proactive maintenance
On the other hand, Proactive Maintenance refers to a preventive approach that focuses on identifying and addressing potential issues before they result in machinery breakdowns or production line disruptions. It aims to minimize unexpected downtime and optimize the overall performance and reliability of the equipment. Proactive maintenance encompasses two various strategies: Preventive and Predictive maintenance.
2.2.1. Preventive maintenance
Preventive maintenance first appeared in the end of the 1800s, when the evolution of the industry was beginning to unfold, and machines are becoming increasingly complex and demanding. Henry Ford in his first manual instructions referred to the preventive maintenance: “Frequently inspect the running gear. See that no unnecessary play exists in either front or rear wheels and that all bolts and nuts are tight. Make a practice of taking care of every repair or adjustment as soon as its necessity is discovered. This attention requires but little time and may avoid delay or possible accident on the road.” [
12].
The EN 13360 standard defines that preventive maintenance is performed at predetermined time intervals or other measurement units of use, without prior knowledge of the state of the machine, with the sole purpose of reducing failure or degrading the functional state of a system, component or machine [
10]. One of the main objectives of preventive maintenance is to reduce the rate, but also the frequency of failures [
13]. In practice, preventive maintenance is implemented using two approaches: practical experience and predetermined time intervals. The practical experience approach relies on the knowledge gained from past failures or mistakes to determine when and how each machine should be inspected and repaired. On the other hand, predetermined time intervals are based on calendar days or the actual operating hours of the machine, as defined by the manufacturer. These intervals serve as guidelines for maintenance activities and ensure that the machines are regularly inspected and repaired as needed.
One key benefit of preventive maintenance is that, with only a few exceptions, it minimizes operational issues by proactively conducting maintenance, replacing worn parts, and assessing the machine’s condition before problems arise. In contrast, relying solely on time-based maintenance can lead to tasks being performed either too early or too late, resulting in premature part replacements when they still have a significant remaining lifespan.
2.2.2. Predictive maintenance
Predictive maintenance is defined as: “Condition-based maintenance carried out following a forecast derived from repeated analysis or known characteristics and evaluation of the significant parameters of the degradation of the item¨ [
10]. It is part of the proactive maintenance strategy that utilizes data analysis, machine learning and condition monitoring techniques to predict and prevent equipment failures or breakdowns. It involves using sensors and monitoring tools to collect real-time data on the performance, health and condition of machinery or assets. By analyzing this data, predictive maintenance algorithms can detect patterns, identify anomalies, and predict when maintenance is required. This approach aims to optimize maintenance schedules, reduce unplanned downtime and minimize unnecessary maintenance tasks. By addressing potential issues before they lead to failures, predictive maintenance helps towards improving operational efficiency, extend equipment lifespan and reduce maintenance costs. The authors in [
14] state that 99% of the time, before the occurrence of any equipment failure, specific signs, conditions, or indicators manifest themselves.
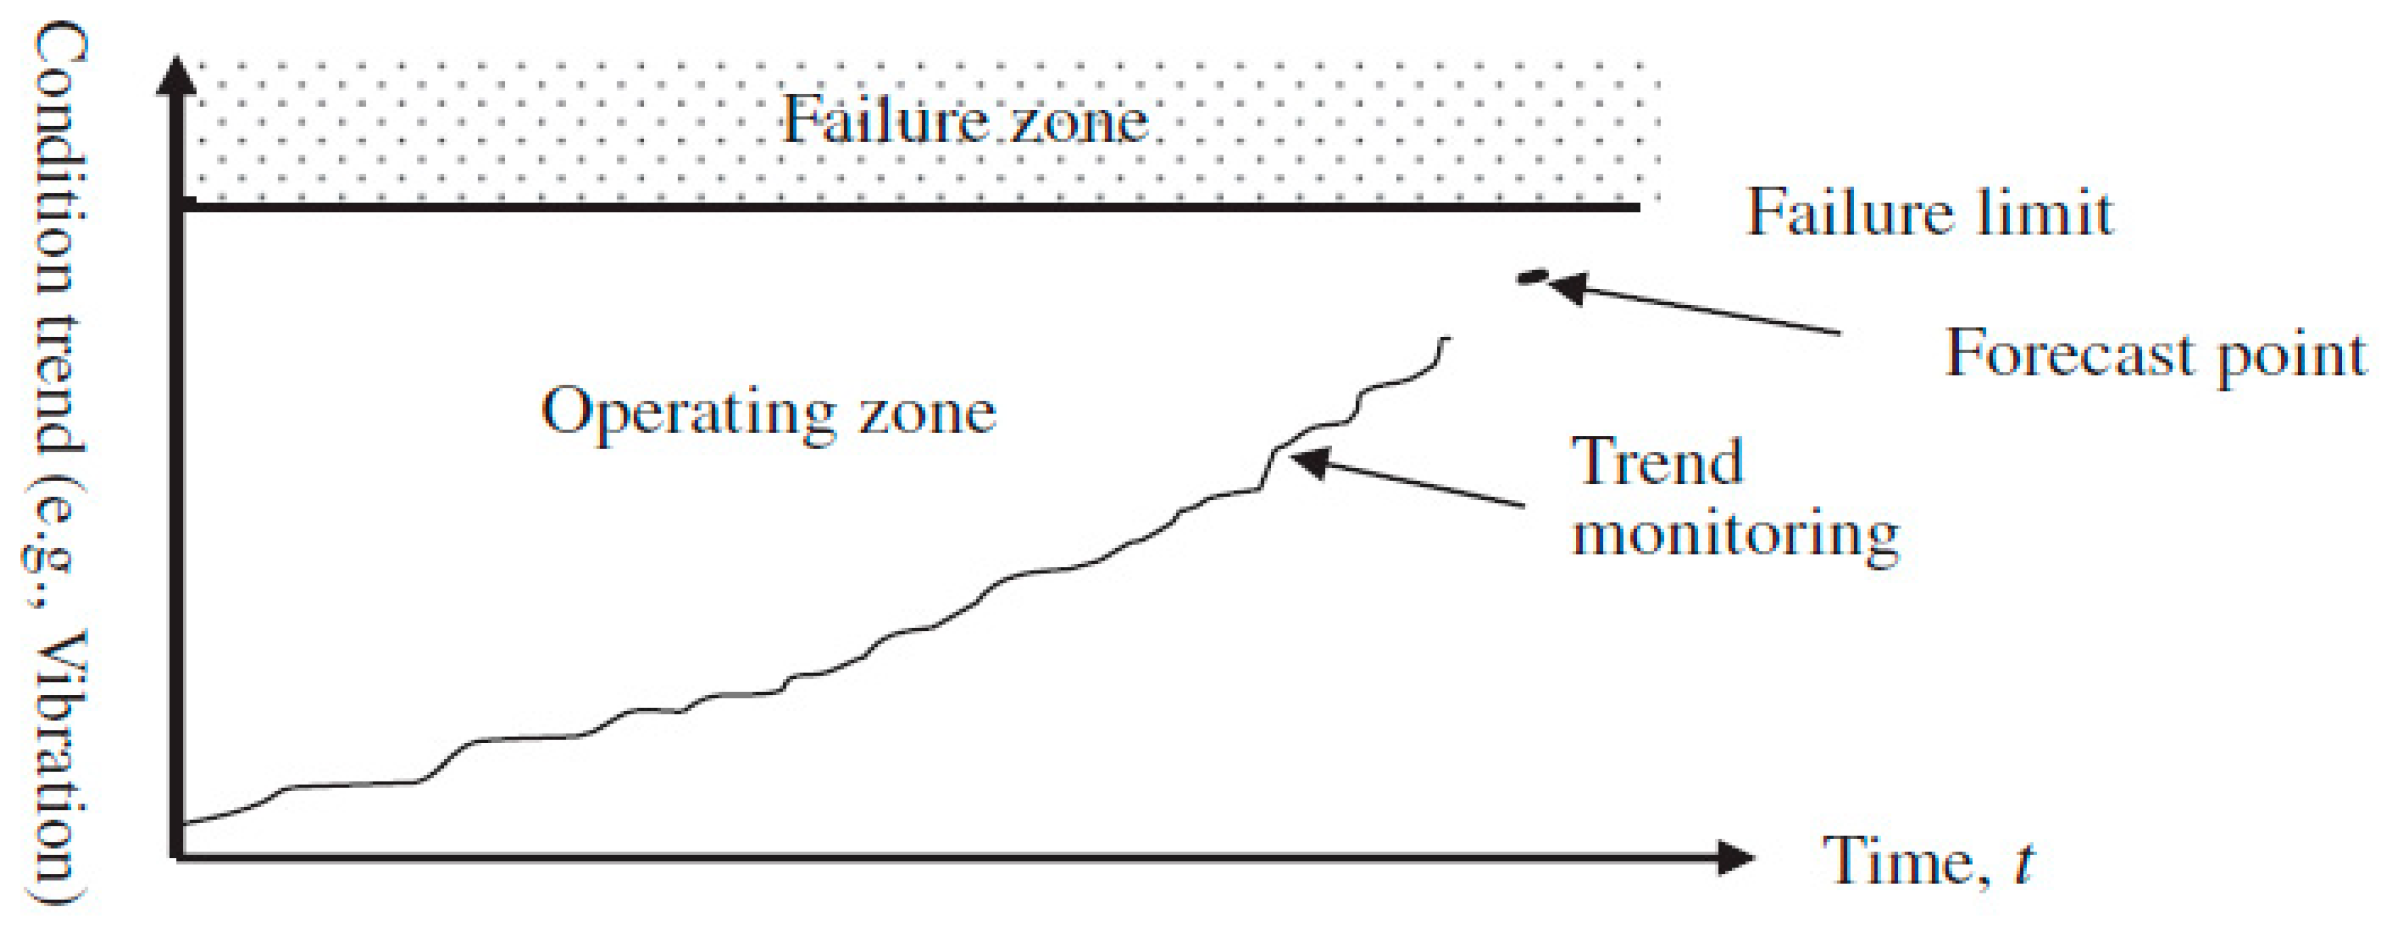
Another advantage of predictive maintenance is that it can be applied while the machine is in operation and, relying on data analysis, it is possible to analyze the data even in a state of rest when the machine is not functioning. Predictive maintenance can be divided into two basic categories: detection, where data is analyzed to identify the existence of a fault or the potential future occurrence of a breakdown, and prediction, where data is analyzed to forecast/estimate when a fault may occur and, therefore, calculate the remaining useful life (URL) of the machine. The above is graphically illustrated in
Figure 3Error! Reference source not found..
4. Convolutional Neural Networks-An overview
Convolutional Neural Networks are a type of Deep Learning architecture specifically designed for processing grid-like data, such as images or sequential data. They are considered as a special MultiLayer Perceptron (MLP) topology network, consisting of some filter stages and one classification stage. CNNs are inspired by the organization and functioning of the visual cortex in the human brain, which allows them to effectively extract and learn hierarchical representations of complex patterns in data. They have revolutionized the field of computer vision and have been successfully applied to various tasks, including image classification, object detection and image generation.
An artificial neural network architecture was first proposed in the late 1980s that would allow computers to recognize images. The first convolutional neural network named LeNet was developed in 1994 and it was capable of recognizing handwritten graphic characters and applying back-propagation training. In [
15]
, a new convolutional model, LeNet5, is trained to recognize handwritten characters using the NIST database utilizing the gradient descent method. In the same year, more than 10% of the bank checks in the USA were processed using this technology [
16].
CNNs have been at the forefront of Deep Learning. Researchers are constantly coming up with new ideas with improved characteristics and performances of networks. Some of the most well-known CNNs are Google Net (2013), VGG (2015), ResNeXT(2017), and EfficientNet 1303(2020).
Figure 4 illustrates an example of a common Convolutional Neural Network architecture.
4.1. The CNN architecture
The CNNs mainly consist of three types of layers: convolutional layers, pooling layers and fully connected layers.
4.1.1. Convolutional layer
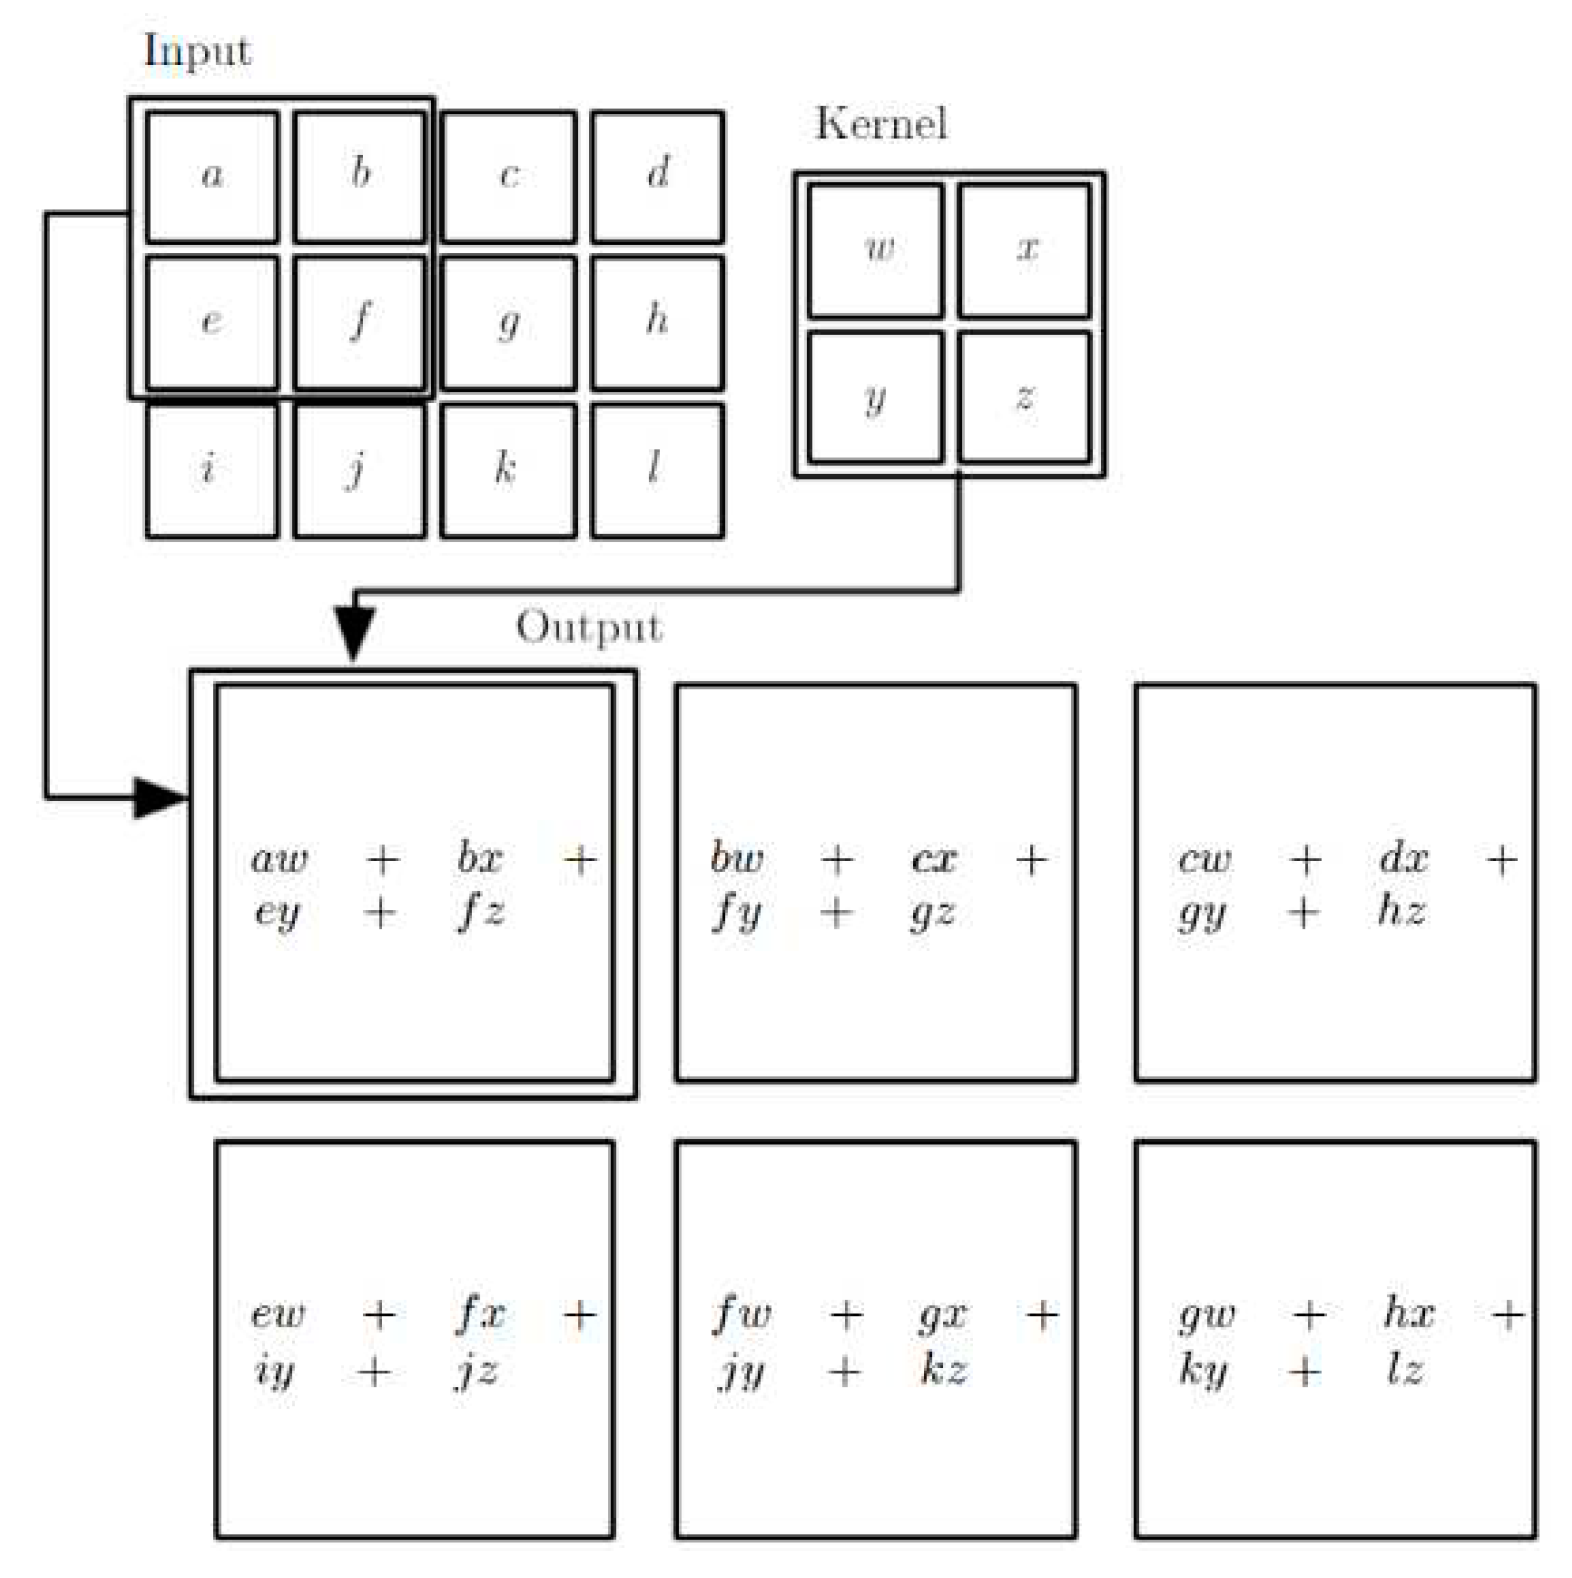
The convolutional layer is the fundamental component of the CNN architecture and it is responsible for feature extraction. Convolution is a specialized type of linear operation used for feature extraction, by applying a set of learnable arrays of numbers (also known as kernels) to the input data, which is also an array of numbers (called tensor). The kernel scans the entire input data by performing convolution operations, which involve element-wise multiplication and summation, where the product is a value in the corresponding position of the output tensor, called a feature map. This procedure is repeated applying multiple kernels to form an arbitrary number of feature maps that represent different characteristics of the input tensors. Each filter captures specific local patterns or features in the input data, such as edges or textures. The convolution is described from the below equation (1), while
Figure 5 illustrates the mathematical operation of convolution [
18].
where:
, is the output of convolution layer l-1 and the input of layer l, through features map i,
, is the jth features map of layer l-1
, the transfer function (RELU, sigmoid, etc.)
, the input tensors
, the weight that connects the ith feature of layer l-1, with the jth feature of layer l
is the layer l-1 bias
Finally, the symbol represents the convolution operation.
4.1.2. Pooling layer
The pooling layer always follows a convolutional layer. It is mainly used to provide a down-sampling operation that reduces the in-plane spatial dimensions of the feature maps. Similar to the convolutional layers, a kernel is applied in local regions of the layer input replacing them with a summarized representation. The most commonly used pooling operation is the max pooling, which extracts the maximum value within a defined window. Retaining the maximum value, max pooling keeps the most prominent features present in the region, while discarding less relevant information. Another type of pooling operation, less frequently used, is the average pooling. Average pooling computes the average value within a predefined region. In cases where the average intensity or value across a region is worthier than the max value, average pooling can be more effective.
The pooling layers operation helps to preserve the most salient information while reducing the computational complexity of the overall network. They also contribute to translation invariance, enabling the network to recognize patterns regardless of their precise spatial location in the input data.
4.1.3. Fully connected layer
Fully connected layers, also known as dense layers, are the last layers of the network, where all neurons of one layer are interconnected with the neurons of the next. Fully connected layers are responsible for making final predictions and classification based on the extracted features of the convolutional layers. The number of fully connected layers depends on the depth of classification. In most cases where a multi-class classification is required, fully connected layers utilize a hot encoder and softmax function that normalizes the output real values of the previous layers to target the class probabilities between 0 and 1, while the sum of all probabilities is 1.
4.2. The CNN training
The ultimate goal of CNNs is to effectively categorize an image or a data time series into a specific type, acting on detection, regression or classification. To achieve that, CNNs have parameters that must be calculated during the training process. CNNs utilize supervised learning to optimize their internal parameters, weights, and biases by minimizing a loss function that measures the discrepancy between predicted and true labels. This process, known as backpropagation, involves optimization algorithms, such as gradient descent, which updates the network’s parameters and then propagates the error back through the network layers. This process allows the network to learn and recognize relevant patterns or features at different spatial locations in the input data. The training process iterates until a stopping criterion is met. The most commonly used criteria are a maximum number of epochs or observing diminishing returns in the validation set performance.
One of the most challenging goals the network training must achieve is to balance the results between over and underfitting. Overfitting is the status where the network performs well on the training data but poorly on new, unknown data, while underfitting lacks in capturing the underlying patterns in the input data. To mitigate over- and under- fitting, regularization techniques such as the dropout function can be applied to the kernels of the convolutional and pooling layers. The dropout function deactivates (sets to zero) randomly a specific percentage of neurons during each training iteration; thus, it must be used sparingly.
5. The experimental results from the proposed CNN
As mentioned in the previous sections, CNNs are designed to exclusively operate on 2D data such as images and videos. To feed a CNN network with 1D data, like voice and data series, weather forecast data, vibration measurements, traffic flow and electrocardiogram signals [
19], different techniques, like reshaping, have been utilized to transform the 1D signal into a 2D representation [
5]. However, the 2D CNN networks, especially the ones developed with deep architecture, having more than 1 M (usually above 10 M) parameters, exhibit a high computational complexity [
7]. To settle this drawback, researchers have developed and introduced the 1D Convolutional Neural Networks. 1D CNNs, leveraging 1-D kernels, can operate directly with 1D data, like time series. They have been proved to be more effective when extracting the features from a fixed-length segment in the whole data set, where the position of the feature does not matter [
19]. Moreover, they have displayed a superior, fast and accurate behavior in real time data monitoring applications, while having a “shallow” architecture they can be trained and operated utilizing low computational requirements.
In this section, we present a 1D Convolutional Neural Network architecture and assess its adherence to the previously outlined requirements. Our initial step involves training the proposed model using the Case Western Reserve University (CWRU) Bearing Data Center and evaluating its performance. Subsequently, the model is fed with new, previously unseen vibration data to determine whether the network is able to successfully identify the condition of the ball bearings and classify any potential faults.
5.1. The experimental setup
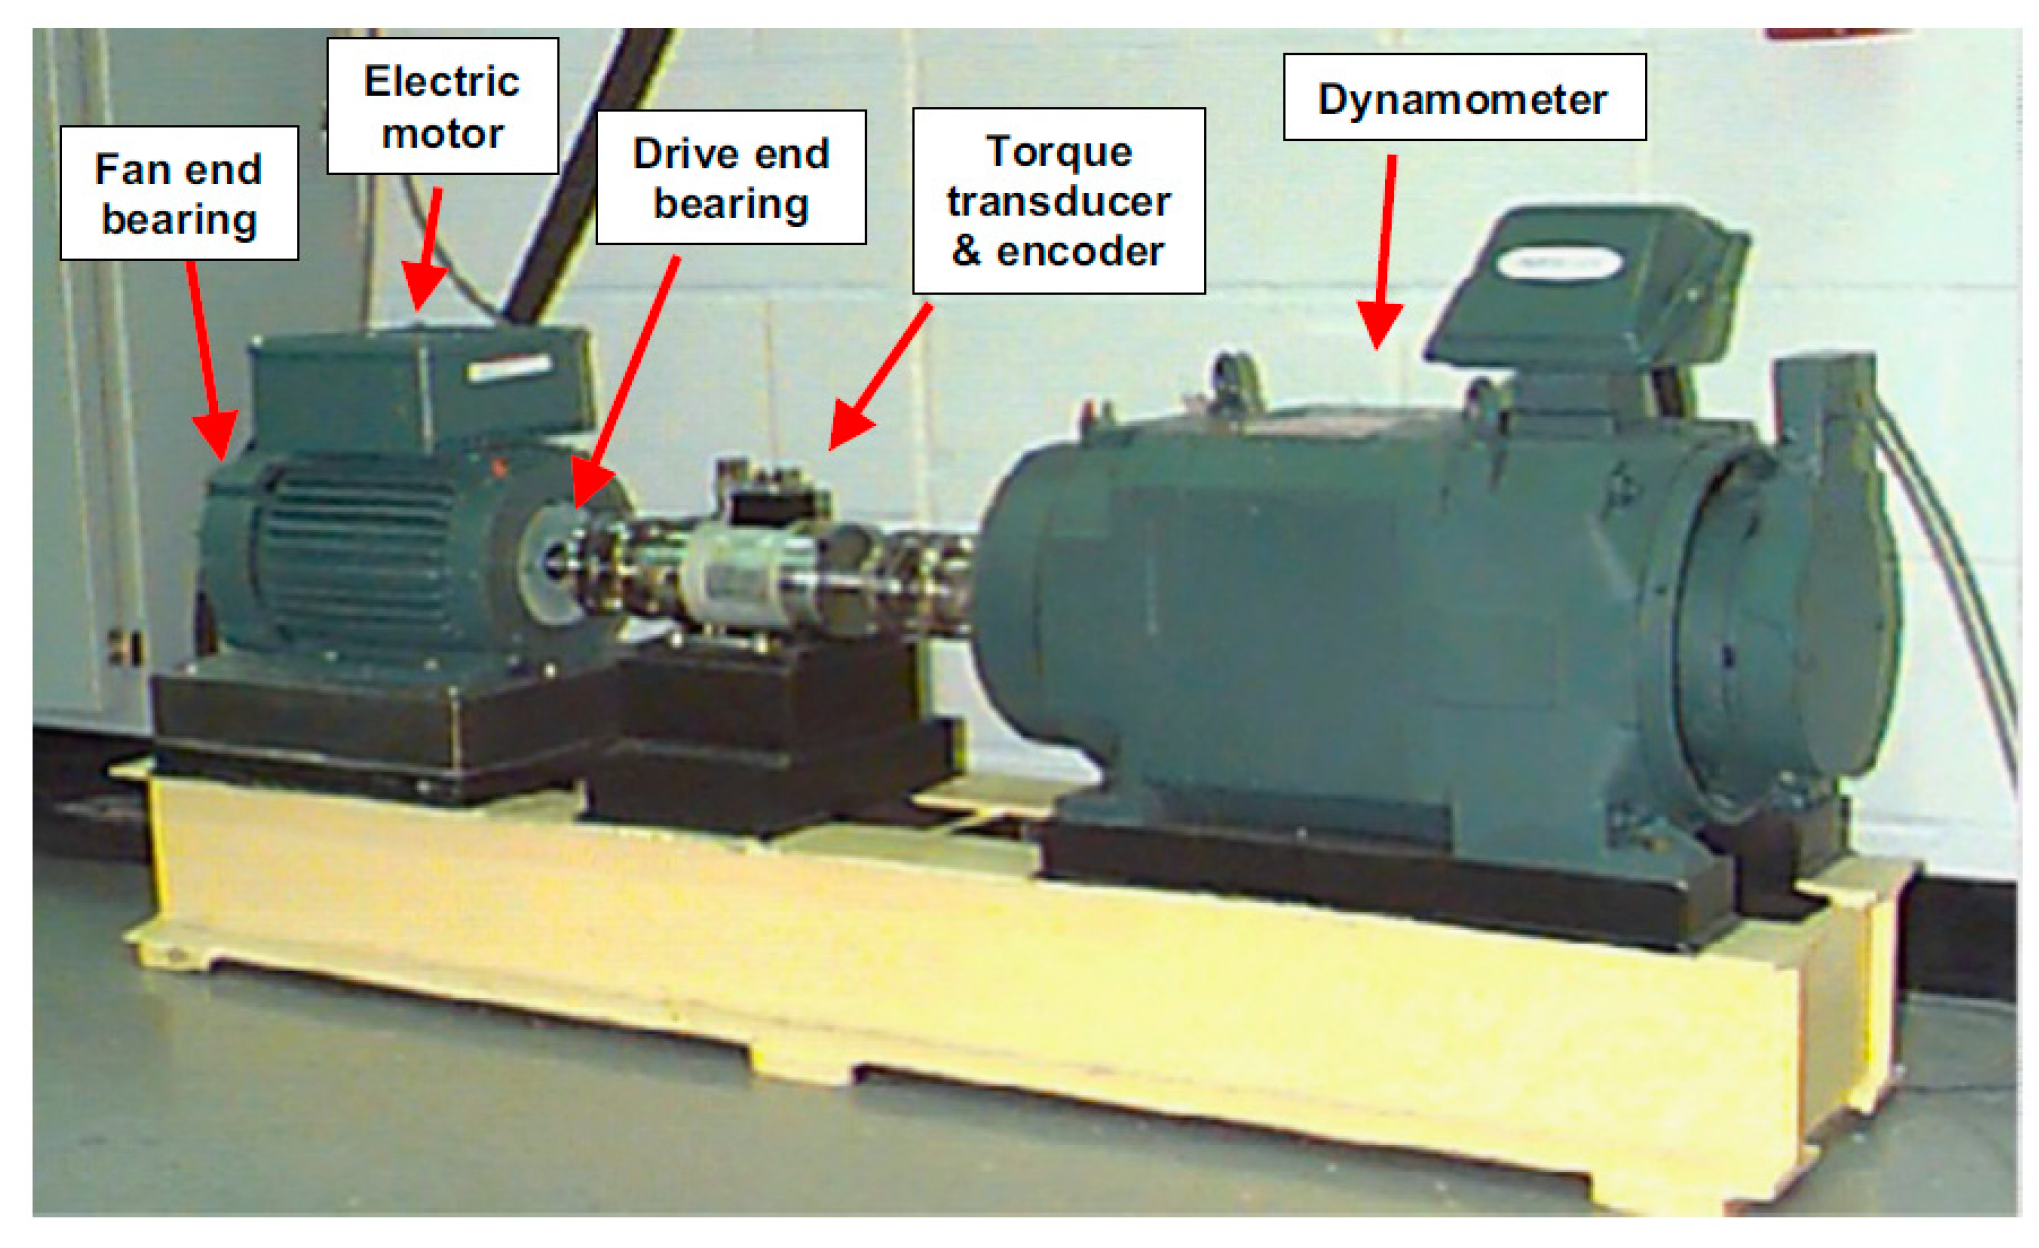
The basic structure of the laboratory model used by CWRU for capturing vibration measurements is shown in
Figure 6.
It consists of an electric motor 2Hp, a torque transducer for measuring the motor torque, and a dynamometer for load simulation. The ball bearings measured and used in the tests, support the motor shaft from both the load side (DE) and the motor fan side (NDE). Damages ranging from 0.18 to 0.71mm (7 - 40 mils) were induced in the balls as well as in the inner and outer raceways of the ball bearings using electromagnetic induction. The ball bearings used were the 6205-2RS JEM deep groove for the DE and the 6203-2RS JEM deep groove for the NDE, both from SKF.
The vibration measurements were carried out using accelerometers placed vertically (in the radial plane) on both the DE and NDE of the motor. The measurements were sampled at 12 and 48 kHz. A total of 161 Matlab data files were generated, grouped into four categories: 48 kHz No fault, 48 kHz DE faults, 12 kHz DE faults, and 12 kHz NDE faults. It is worth noting that for this particular dataset the concept of “load” has no significant meaning in vibration measurements since it originates from an electromagnetic mechanism and not from actual load, such as a gearbox or a fan, which would convert the motor torque into radial load on the ball bearings. Here, the imposed load mainly affects the motor speed, which decreases by almost 4% at maximum load [
20]. Additionally, for damages to the outer raceway, there are three measurements labeled @3, @6, and @12. This indicates the relative position of the measurement with respect to the position of the ball bearing. Measurements of the outer raceway were conducted in three directions as the potential point of damage is fixed (it does not rotate with the ball bearing) and therefore has a direct impact on the vibration response of the motor-ball bearing system.
5.1. The CWRU Data Set
As described above the CWRU data set consists of 161 files, each one including 65 to 450 thousand data rows. For our model we used the 48KHz sampling data – DE measuring data for motor loads 0 and 1 Hp and all the available ball bearing conditions (no fault, inner race, out race@3H, out race@6H, out race@9H, Base Support), with induced fault size 7,14 and 21mils. Finally, the utilized data set consists of Matlab 27 files, that are transformed and combined to a .csv file.
The created data set was then split in half. 50% of the data, approximately 2.2 million data, was used for the training and evaluation of the model, while the other 50% was fed in the network as “new”, “unseen” measurements. The research aims to check whether the proposed network will manage to determine if the network can successfully identify and classify the condition of the ball bearings by analyzing the DE raw vibration signals.
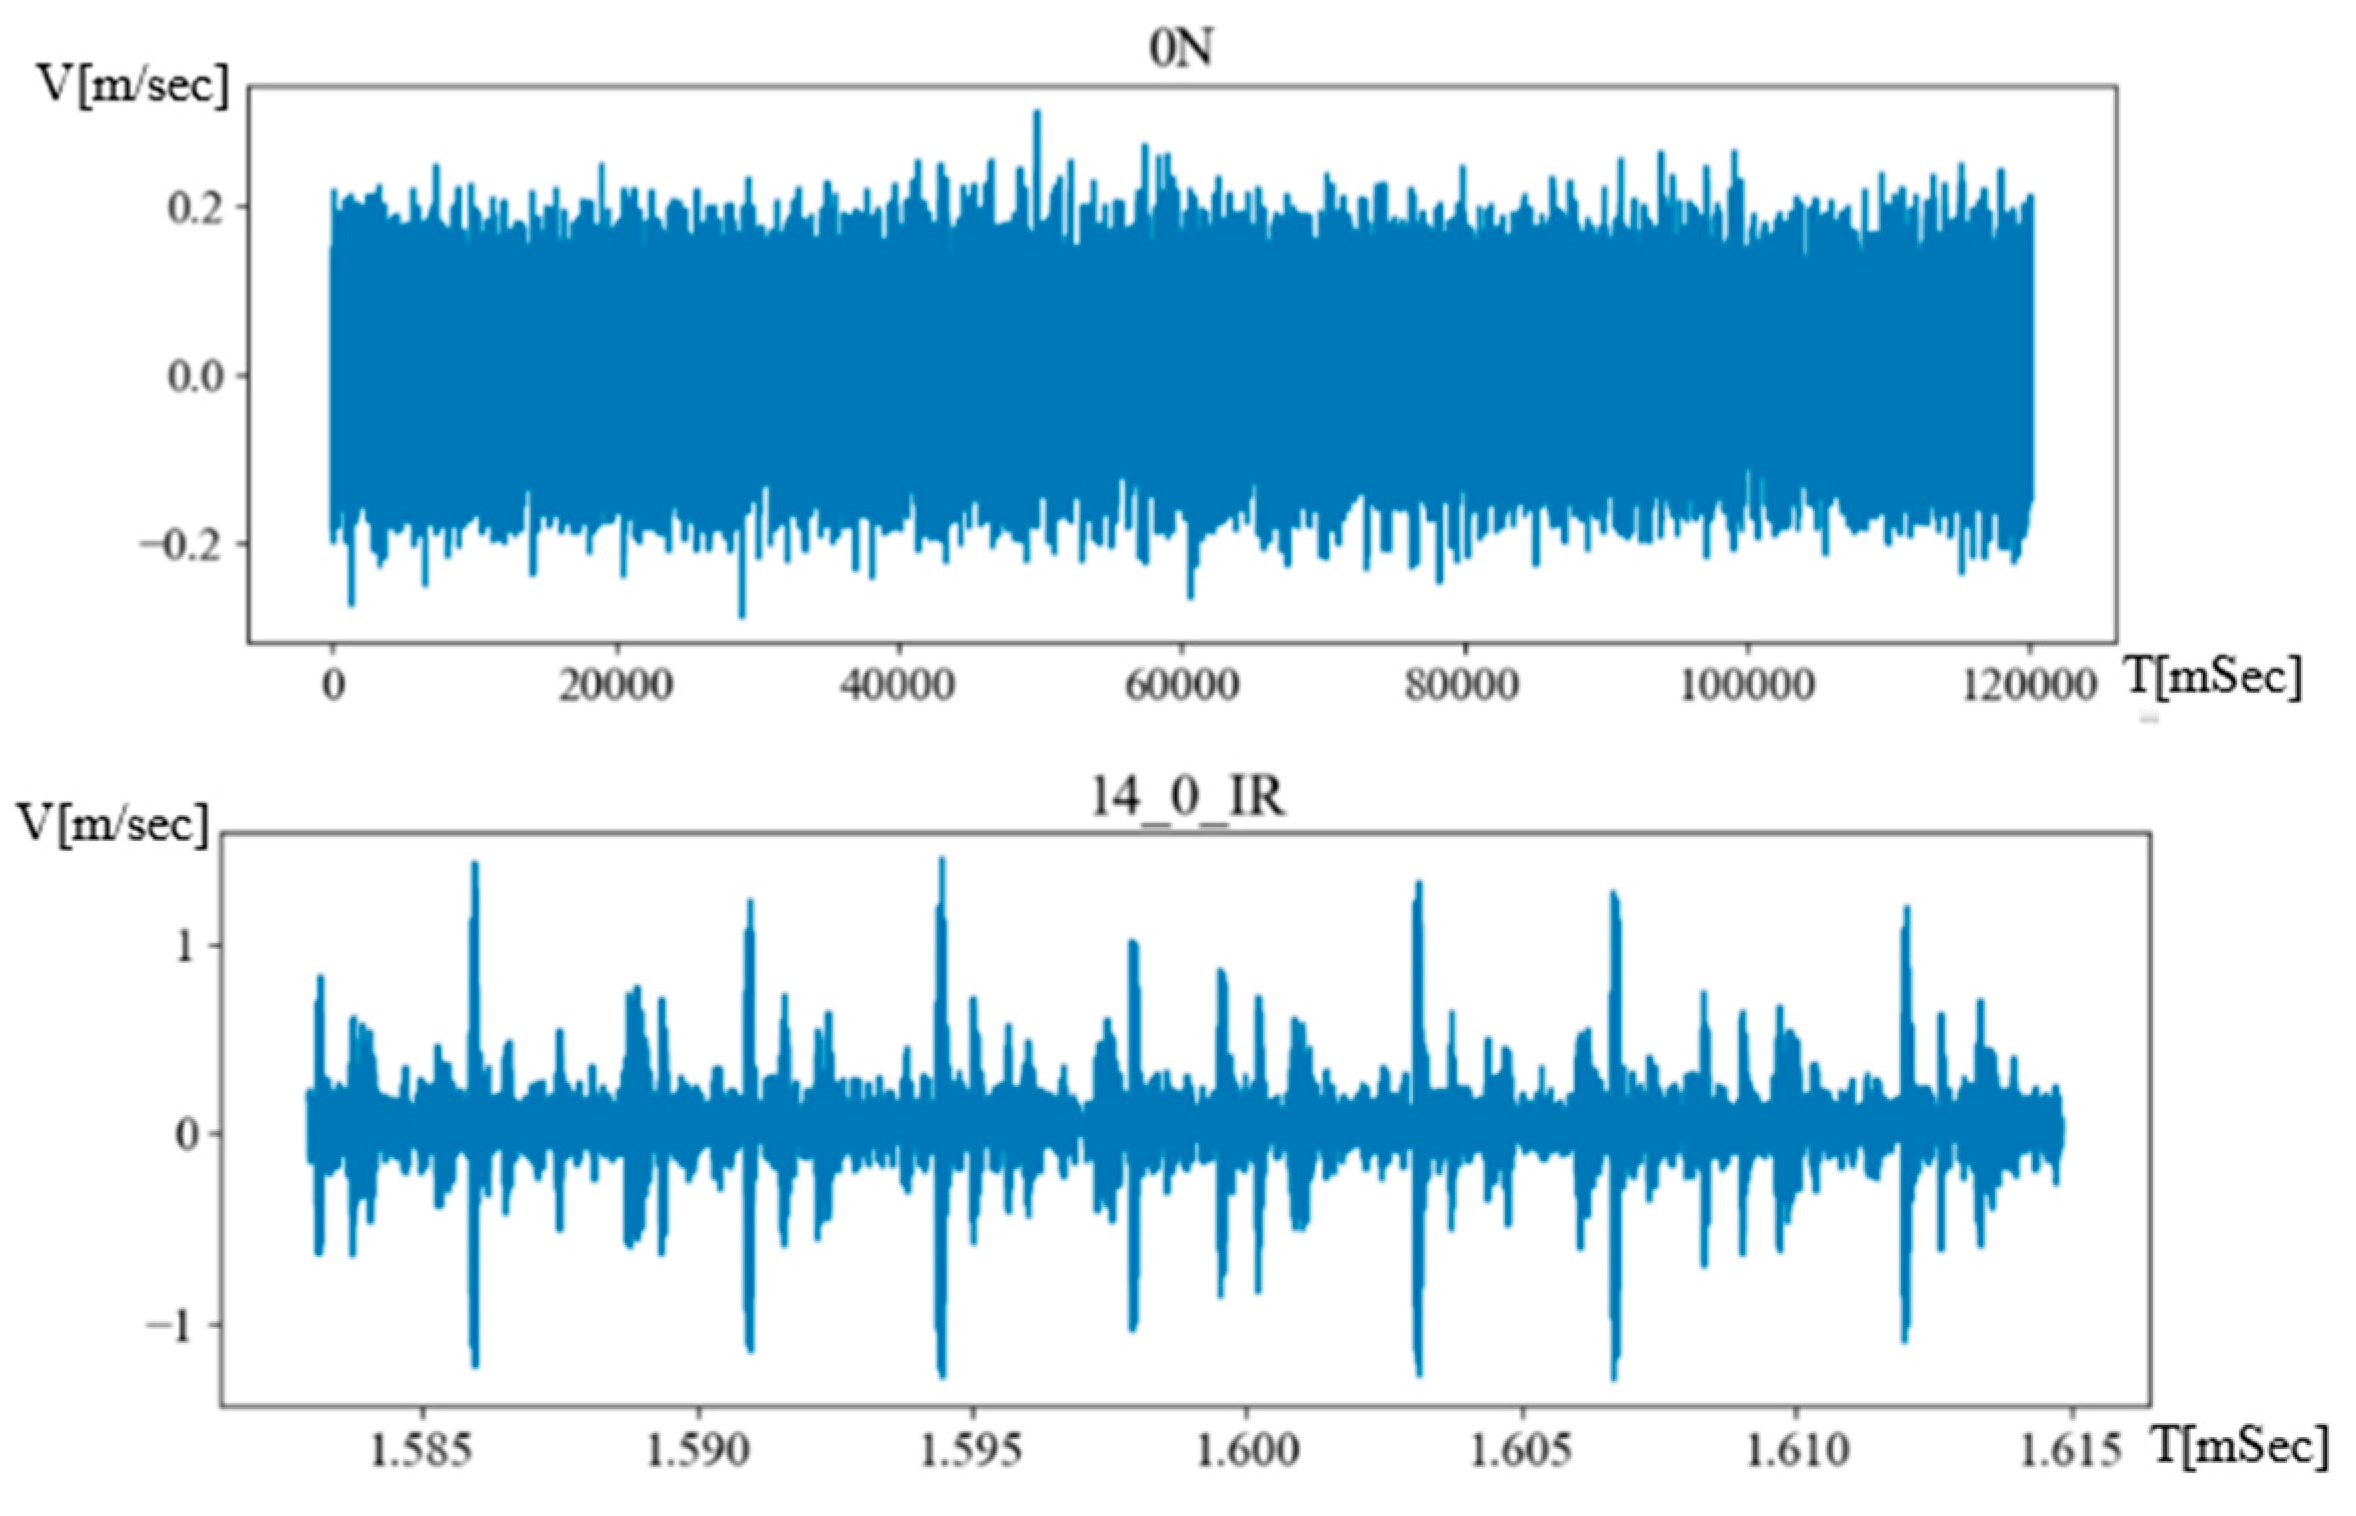
Figure 7 illustrates the graphical representation of the raw vibration data for a ball bearing operation without damage and load, as well as the footprint of a ball bearing with 14mils damage in the inner raceway for 0Hp load. The figure was generated from Python, printing the specific part of the dataset.
Likewise,
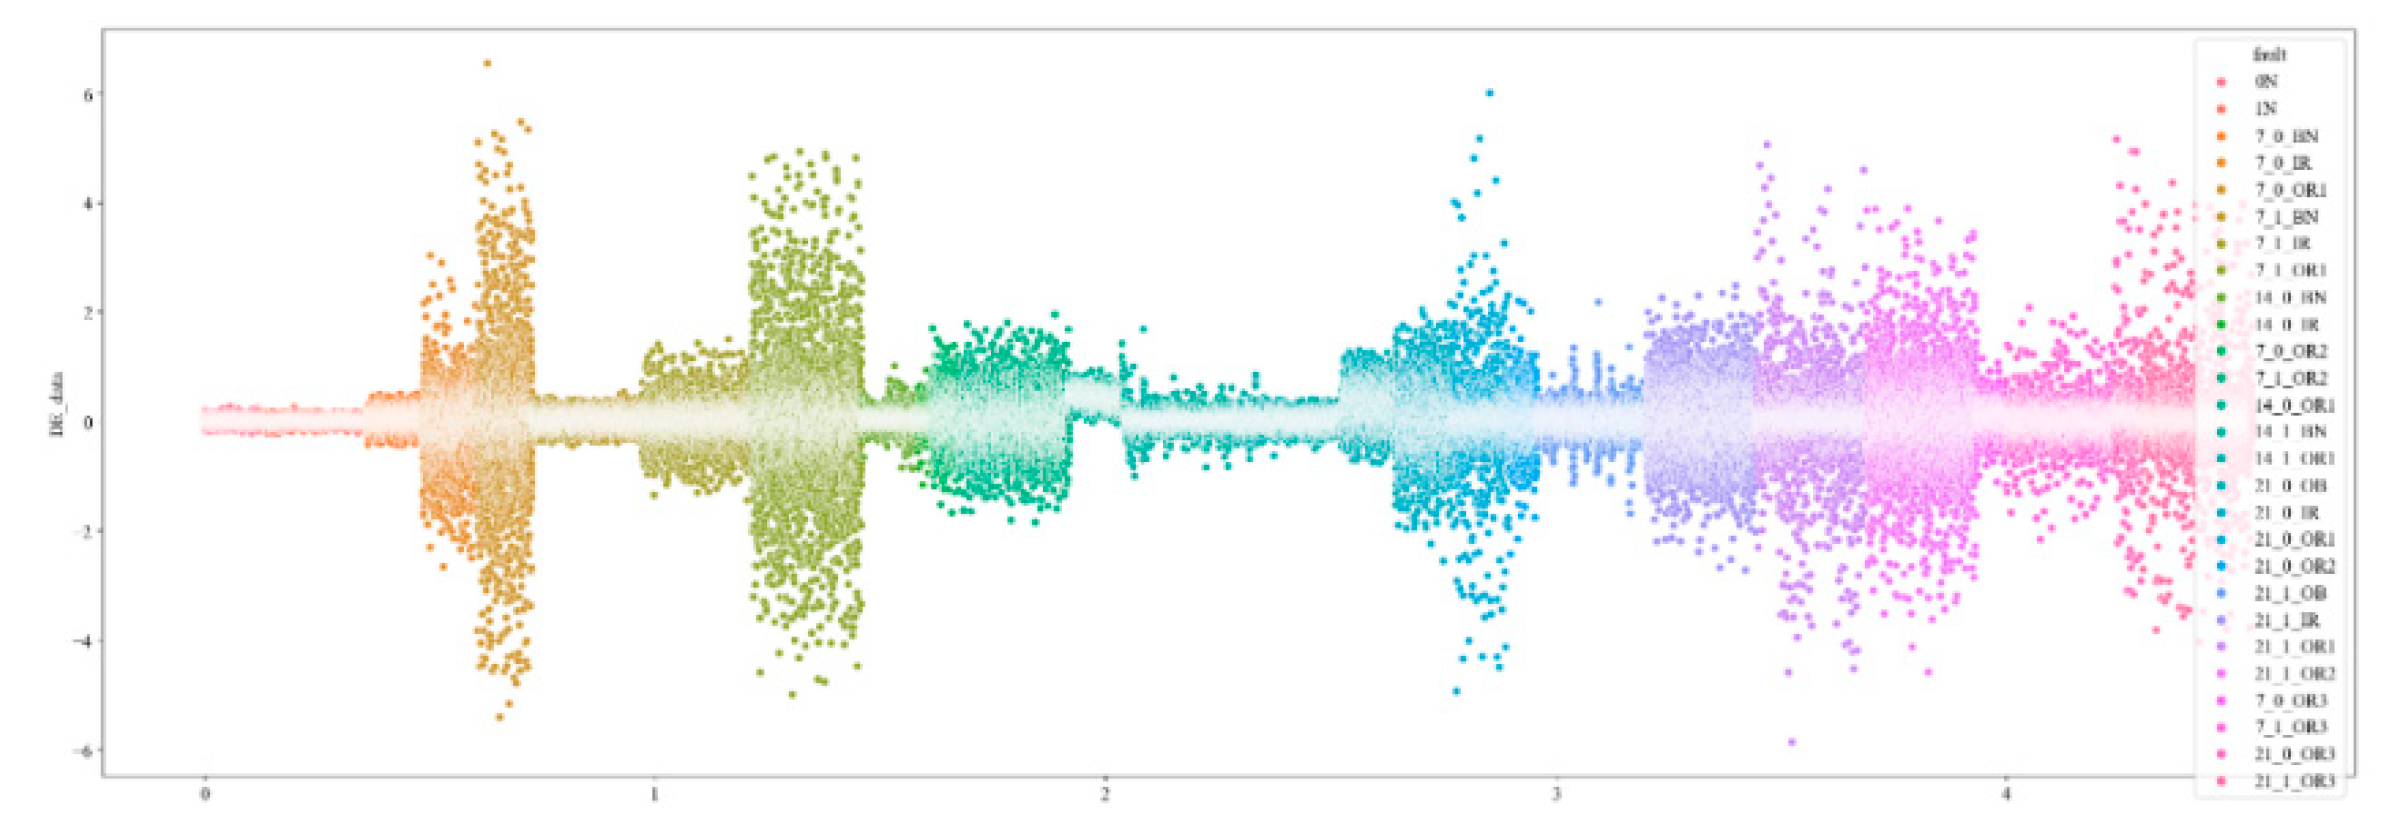
Figure 8 illustrates a scatter plot of data type about the vibration amplitude for the previously described dataset generated by Python. It can be easily determined that the measurements resulting from the operation of the undamaged ball bearings (N) have the smallest amplitude, while those describing damage to the outer raceway (OR) have the largest measurement amplitude.
5.3. The designed architecture
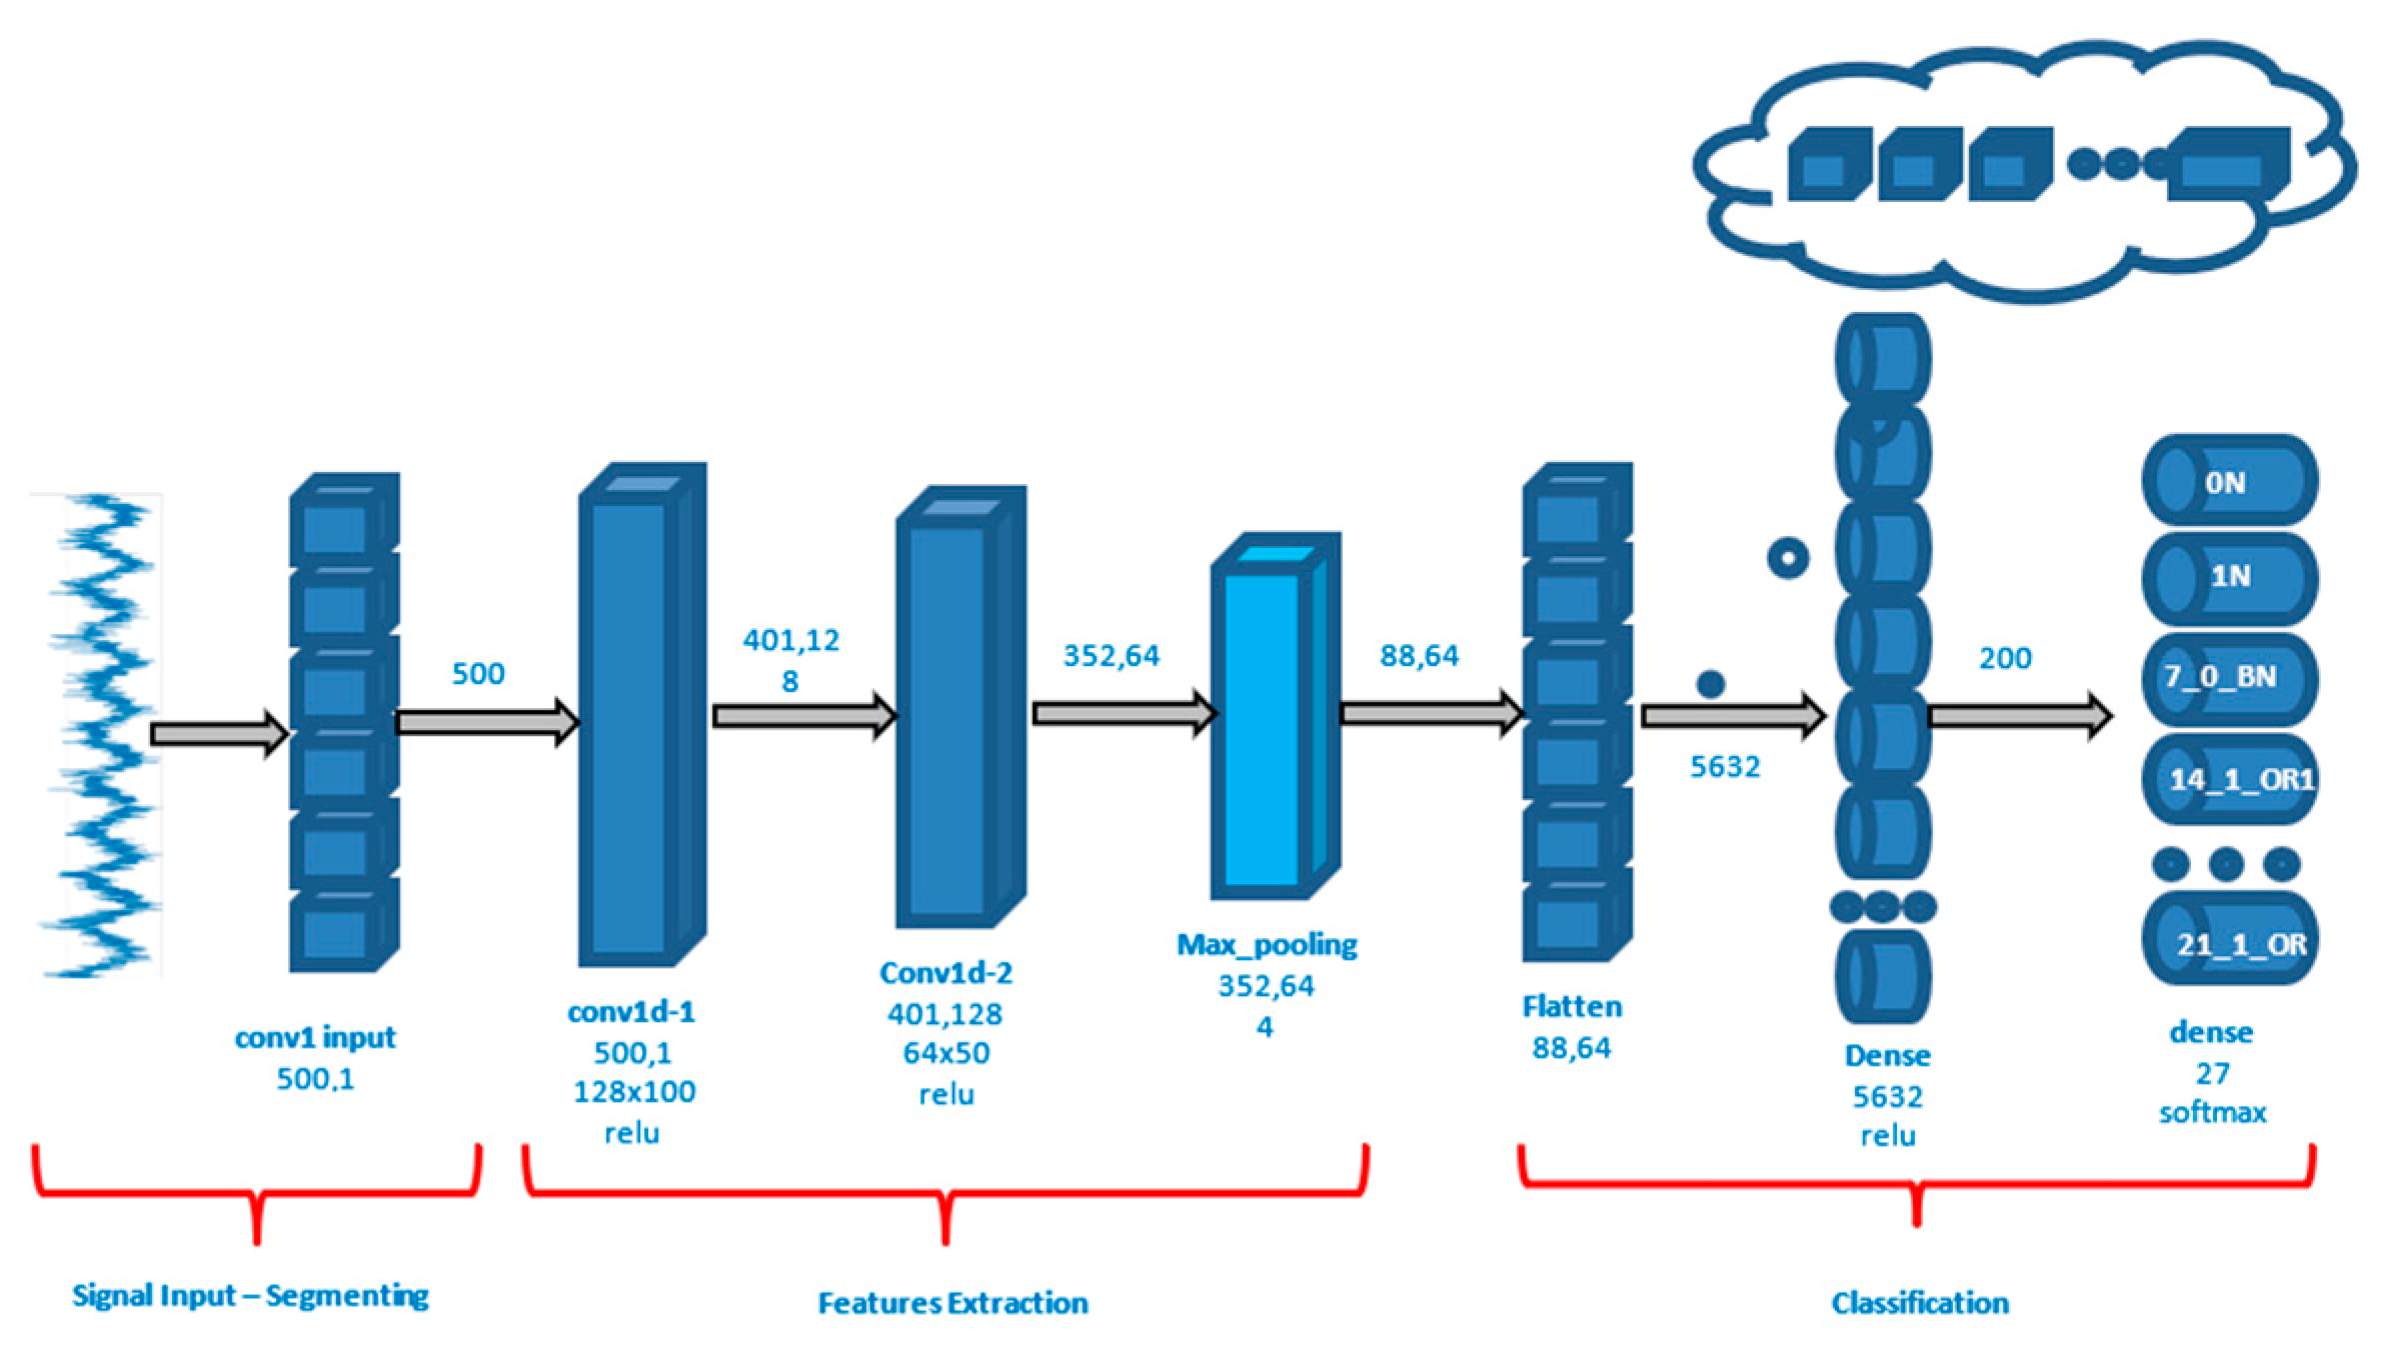
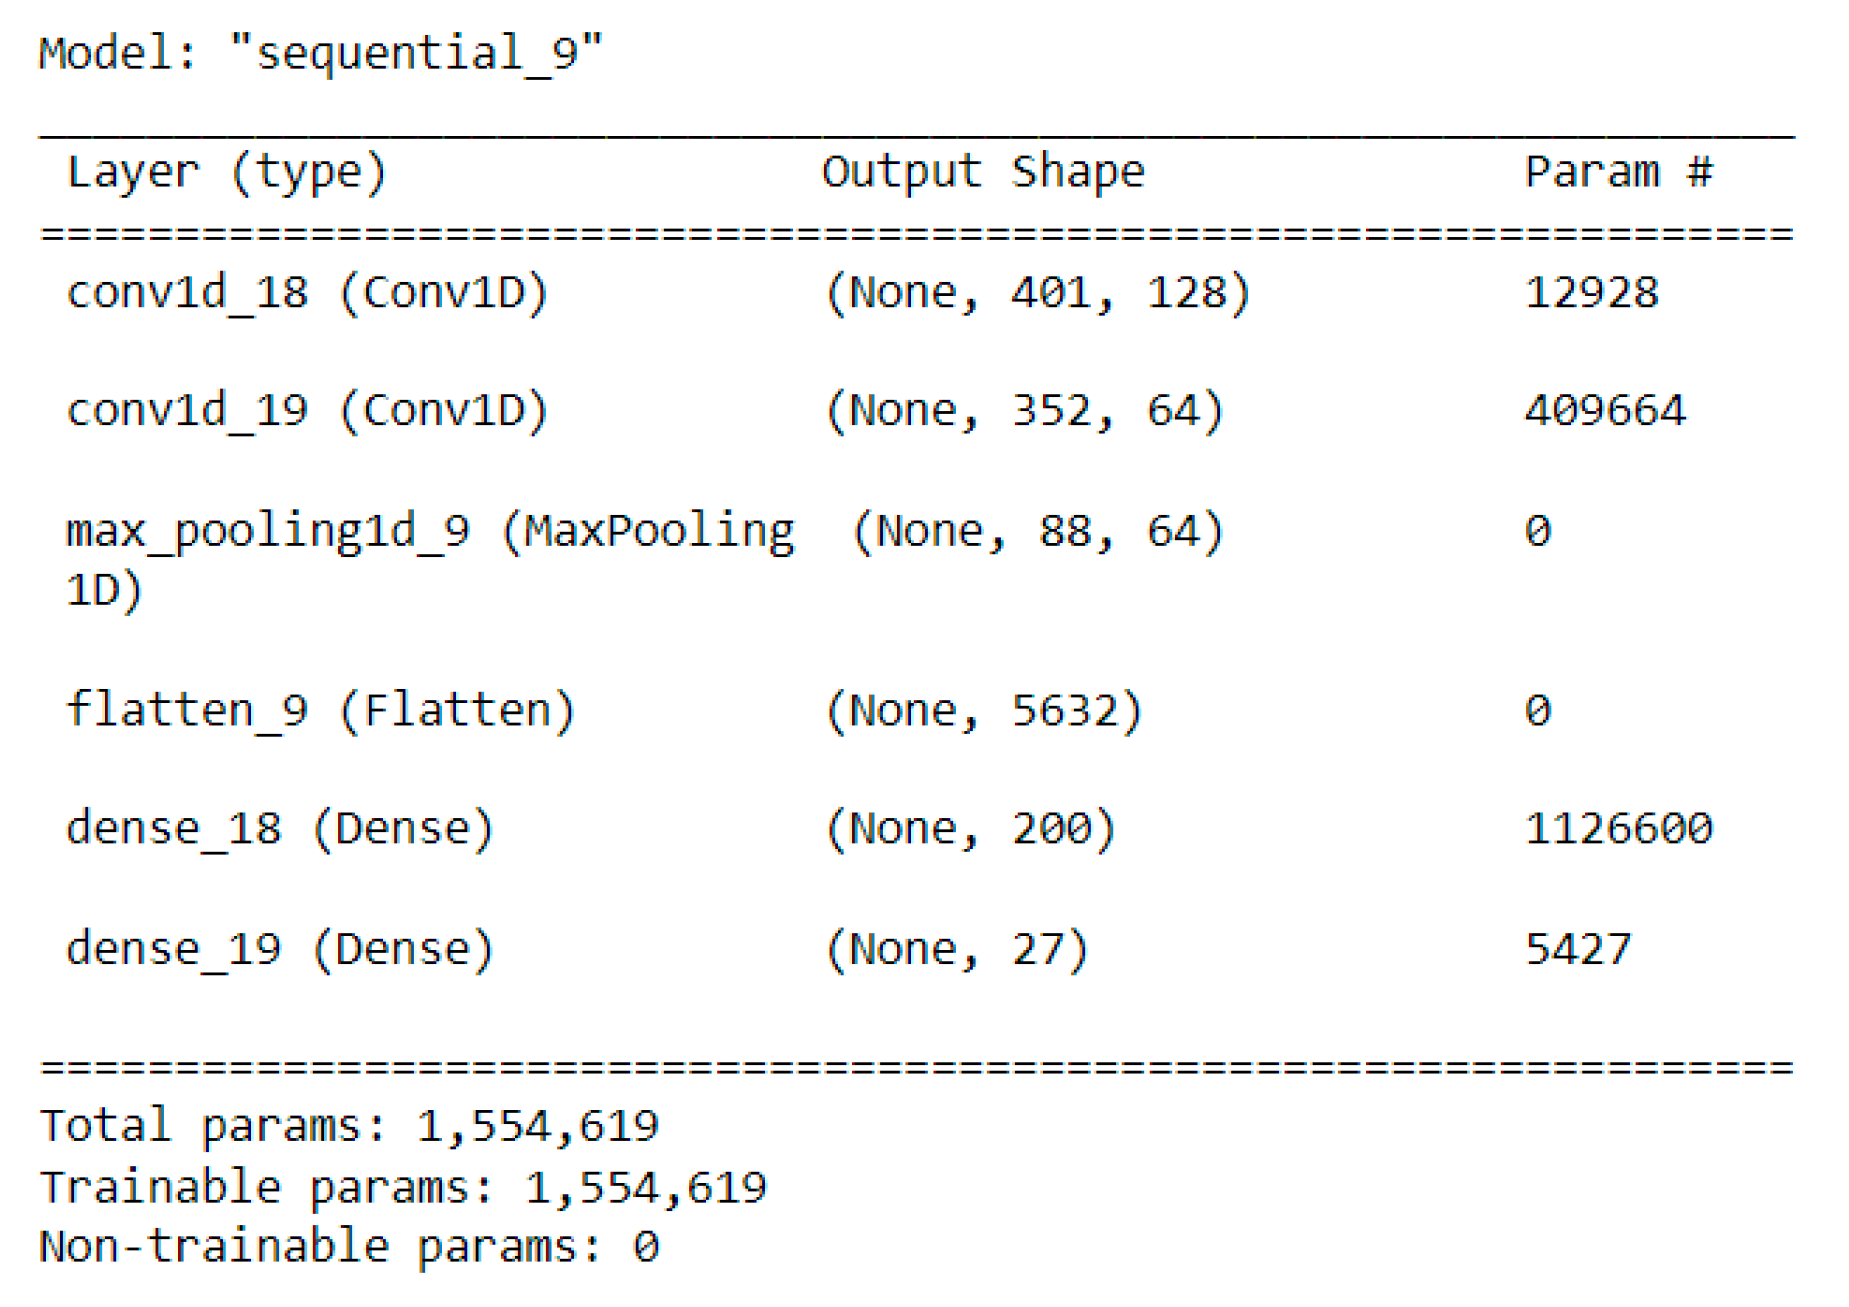
To conclude to the optimum network architecture, we performed multiple tests with different module combinations. Finally, we culminated to the architecture illustrated in
Figure 9. The proposed network is quite simple and consists of the data input layer, two convolutional layers using the RELU activation function, and one max pooling layer. In the output we can find a flatten and two dense layers. The first dense layer consists of 200 neurons, while the second, and last one, involves 27 neurons each one representing one of the ball bearing condition classes.
Table 1 illustrates the shape and the training parameters for each layer, while the total training parameters of the network are 1,554,619.
5.4 The evaluation results
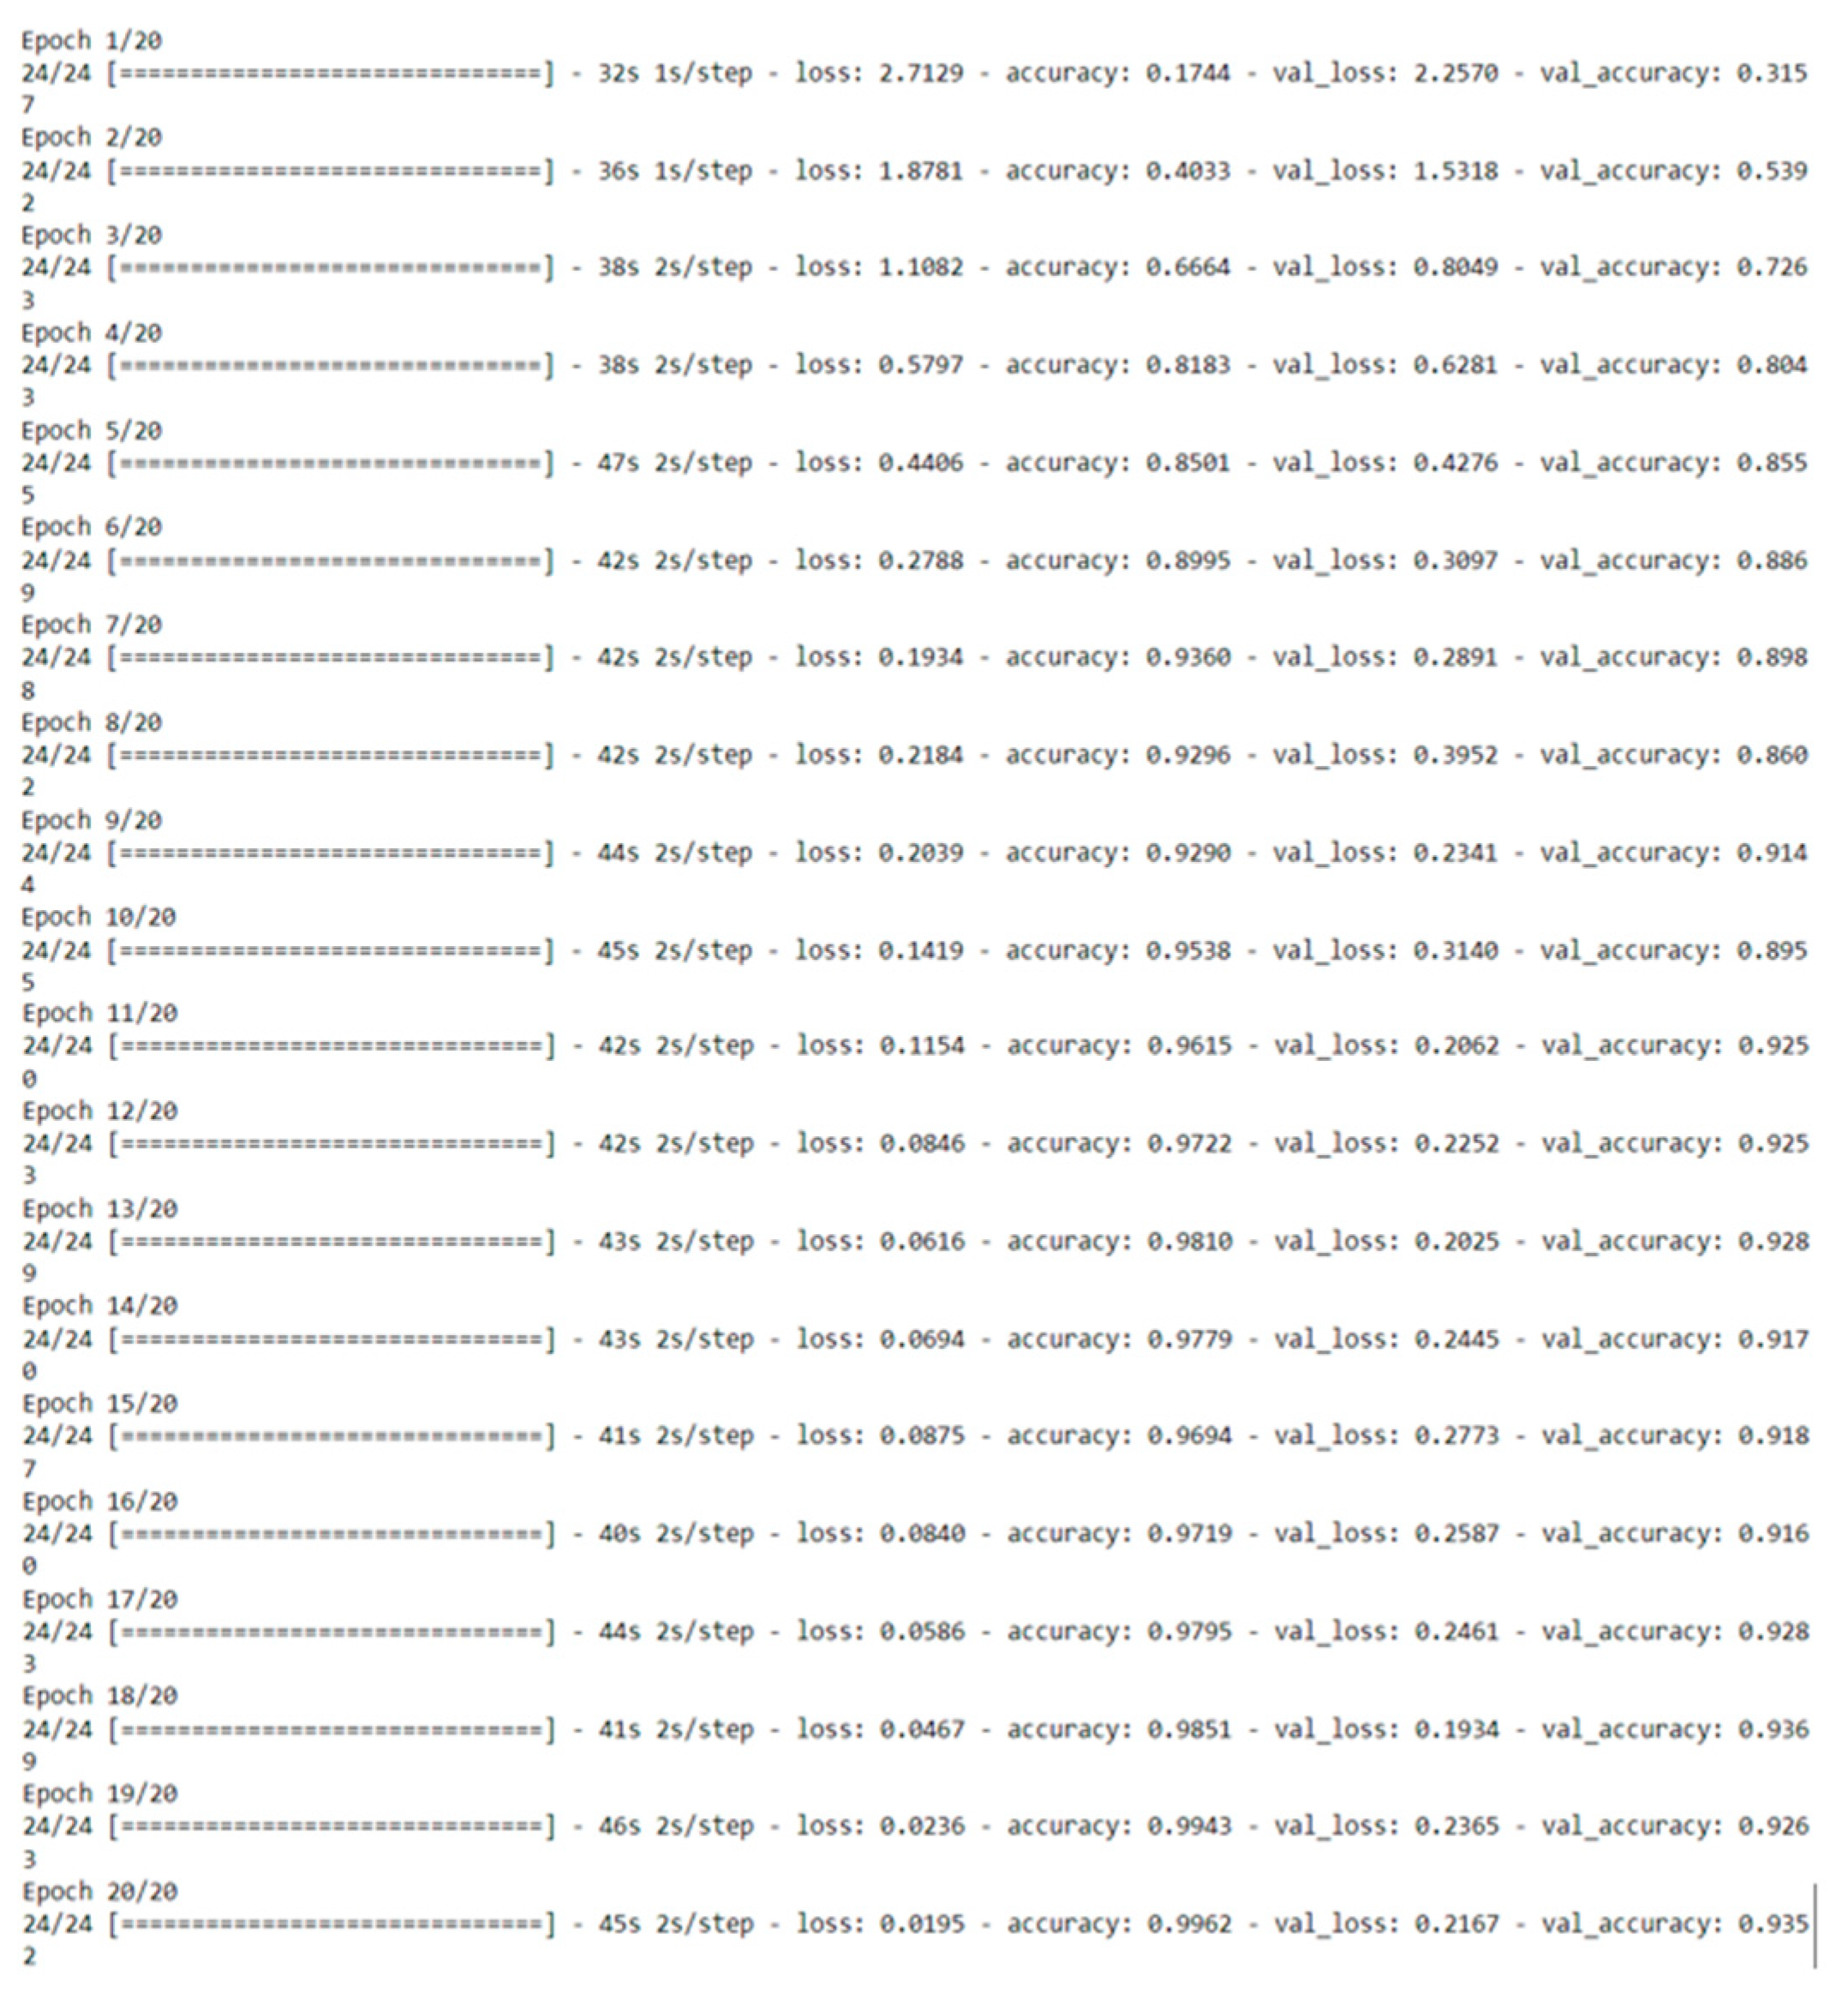
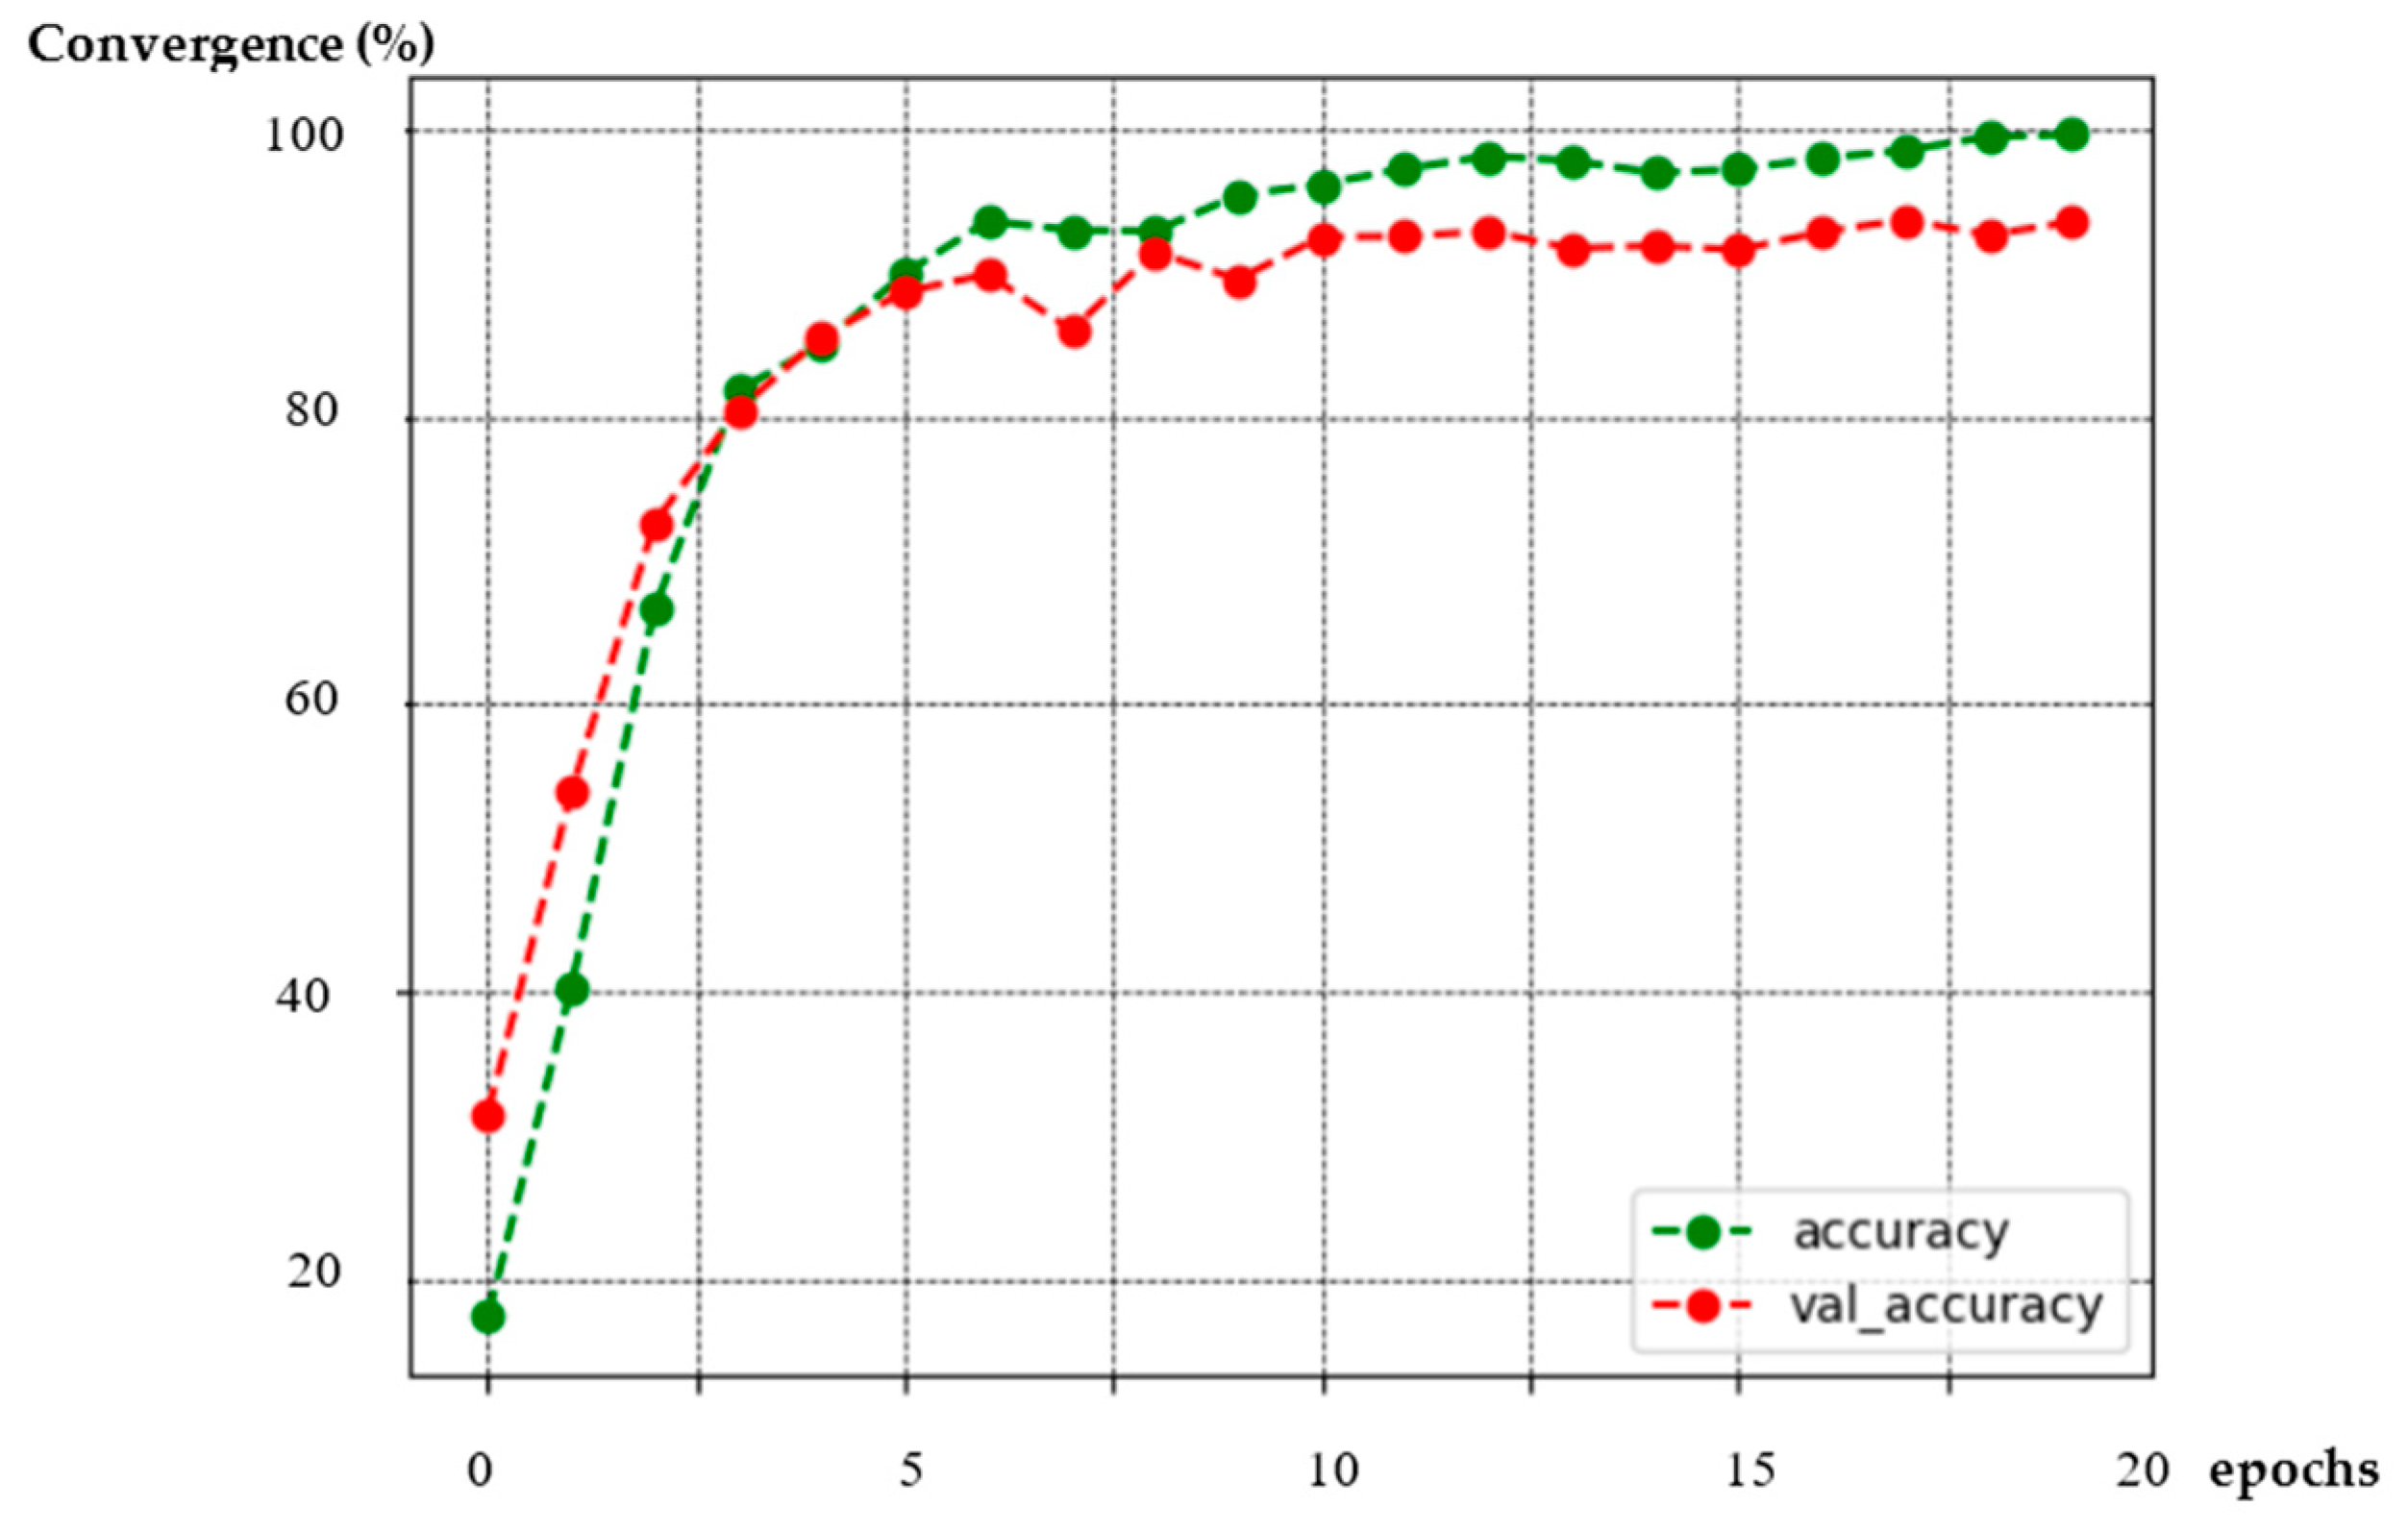
In the previous subsection, we discussed the training process of the network using a portion (50%) of the CWRU dataset. To ensure accurate evaluation, we further divided the dataset into a 70/30 ratio for training and evaluation purposes. Through rigorous testing, we determined that the optimal results were achieved with a batch size of 300 and a total of 20 epochs. The entire training process took less than 14 minutes. During training, the model exhibited a remarkable accuracy of 99.62%. However, during the evaluation phase, the accuracy slightly decreased to 93.52%. The progress of each epoch is visually depicted in
Figure 10, while
Figure 11 provides insights into the training and evaluation process towards the number of epochs
. Considering the success of the network for determining the condition and categorizing specific ball bearing faults, is worth mentioning that the proposed CNN model was developed, trained, and tested on a conventional laptop equipped with an 11
th generation i7 CPU, without the assistance of GPT technology or any other enhanced process and memory capabilities.
Continuing further, the remaining 50% portion of the CWRU dataset was utilized to test the network. As previously mentioned, our objective is to evaluate the feasibility and accuracy of the proposed network in categorizing new, unseen data. By conducting this testing phase, the aim is to validate the model’s performance on previously unencountered data samples. These measurements are segmented using the same window size and stride. As observed in
Table 2, different amounts of data and measurements are utilized in each test, all of which are significantly smaller than the dataset used to train the network. The data ranged from a minimum of 2000 to a maximum of 15000 measurements, whereas the network was trained on 4,544,767 measurements. To evaluate the network’s performance, we employed the inverse encoder process, comparing the network’s predictions with the actual state of the spherical bearing. The results are presented in
Table 2.
From the aforementioned figure, several observations can be made:
The network demonstrates an overall response ranging from 78.8% to 100%, with the exception of detecting signals 14_0_BN and 21_0_IR.
For signals 14_0_BN and 21_0_IR, the network’s response is 25% and 20%, respectively. It is worth noting that the incorrect predictions are not related to the type of damage but rather to the load. The network misinterprets a 0 Hp sample as 1 Hp. Nonetheless, this is not considered an error since the network successfully recognizes the type of fault.
Remarkably, the network achieves a 100% accuracy in distinguishing between damage and non-damage. This is particularly surprising considering the simplicity of the network and the circumstances under which it was tested and trained within the context of a thesis.
As previously mentioned, the data used for testing the model consists of measurements ranging from 2000 to 15000, corresponding to signals of 44 to 330 milliseconds at a 45kHz sampling rate. It is important to note that these measurements are relatively small compared to real-world scenarios where measurements of several seconds are typically used. This further highlights the network’s success in its response.
6. Conclusions
This study focused on the predictive maintenance of rotating machinery. Throughout the research, the main focus is on the importance of proper machine operation for safe navigation and ship management, as well as the implications that a malfunction can have on performance, ultimately impacting the profits of the ship-owning company, the safety of seafarers and environmental protection. The selection of maintenance approaches (corrective, predictive, prognostic, etc.) depends on various factors, but the primary objective remains reducing the machinery breakdowns, minimizing downtime, optimizing machine performance and ultimately lowering maintenance costs. Finally, we conclude that the implementation of predictive maintenance has many advantages compared to preventive or corrective maintenance. Moreover, when combined with artificial intelligence and deep learning, it enables the detection of faults at an early stage, before they cause damage to the monitored machine.
In this paper, a model based on a Convolutional Neural Network is introduced. This model is trained using the CWRU vibration dataset gathered from accelerometers positioned on the DE and NDE of a 2Hp engine under laboratory conditions. The network proposed in this study demonstrated favorable performance in classifying specific faults, with accuracy ranging from 20% to 100%. Analyzing further the network’s results in cases where its response was low, such as in the data for 14_0_BN and 21_0_IR, we observed that the network succeeds in classifying the type of fault but rather the different load between 0 and 1Hp or the different defect size of 7, 14, and 21 mils. Therefore, when the faults are grouped only based on their type, BN, IR, OR, and N, without considering the size or load applied to the motor shaft, the network’s response is considered to be consistently above 90%.
As the training and testing of the network are conducted using data collected in a laboratory environment (CWRU dataset), the author’s intention is to continue the research and, at a later stage, test the proposed network on real vibration data collected from machined controlling and reliquefying the vapors of vessels carrying liquified natural gas (LNG carriers). This endeavor poses a challenge due to the implementation of preventive maintenance measures, which aim to assure the optimal performance of these machines and minimize the occurrence of substantial damages. Therefore, there is ample data available when the machines are operating correctly, but very limited or nearly nonexistent data prior to the occurrence of a fault.
Since only few studies focus on developing machine learning or deep learning models for calculating the Remaining Useful Life (RUL), the author’s purpose and intention is to expand the proposed network beyond fault detection and prediction, aiming to also estimate the remaining useful life of the specific machine.
Author Contributions
Conceptualization, S.A.; methodology, S.A.; software, S.A.; validation, P.Z., A.C. and M.P.; formal analysis, S.A. and P.Z.; investigation, S.A. and P.Z.; resources, S.A.; data curation, S.A.; writing—original draft preparation, S.A. and P.Z.; writing—review and editing, S.A., P.Z. and A.C.; visualization, A.C. and M.P.; supervision, A.C. and M.P. All authors have read and agreed to the published version of the manuscript
Funding
“This research received no external funding”
Data Availability Statement
Data sharing not applicable.
Conflicts of Interest
The authors declare no conflict of interest.
References
- Souza, R.M.; Nascimento, E.G.S.; Miranda, U.A.; Silva, W.J.D.; Lepikson, H.A. Deep learning for diagnosis and classification of faults in industrial rotating machinery. Comput Ind Eng 2021, 153, 1–12. [Google Scholar] [CrossRef]
- Han, T.; Yang, B.-S.; Yin, Z.-J. Feature-based fault diagnosis system of induction motors using vibration signal. J Qual Maint Eng 2007, 13(2), 163–175. [Google Scholar] [CrossRef]
- Bayu, A.T.; Vania, M.; ·Lee, S.; Lim, S. Recent advances in the application of deep learning for fault diagnosis of rotating machinery using vibration signals. Artif Intell Rev 2023, 56, 4667–4709. [Google Scholar]
- Zhang, W.; Li, C.; Peng, G.; Chen, Y.; Zhang, Z. A deep convolutional neural network with new training methods for bearing fault diagnosis under noisy environment and different working load. Mech Syst Signal Pr 2018, 100, 439–453. [Google Scholar] [CrossRef]
- Abdeljaber, O.; Sassi, S.; Avci, O.; Kiranyaz, S.; Aly Ibrahim, A.; Gabbouj, M. Fault Detection and Severity Identification of Ball Bearings by Online Condition Monitoring. IEEE T Ind Electron 2019, 66, 8136–8147. [Google Scholar] [CrossRef]
- Zhao, Z.; Li, F.; Wu, J.; Sun, C.; Wang, S.; Yan, R.; Chen, X. Deep learning algorithms for rotating machinery intelligent diagnosis: An open source benchmark study, ISA T 2020, 107, 224-255. 107.
- Kiranyaz, S.; Avci, O.; Abdeljaber, O.; Ince, T.; Gabbouj, M.; Inman, D.J. 1D convolutional neural networks and applications: A survey. Mech Syst Signal Process 2021, 151, 1–21. [Google Scholar] [CrossRef]
- Mushiri, T.; Mbohwa, C. Machinery Maintenance Yesterday, Today and Tomorrow in the Manufacturing Sector. Proceedings of the World Congress on Engineering Vol II, WCE 2015, London, U.K., 1 - 3 July 2015. 3 July.
- Coanda, P.; Avram, M.; Constantin, V. A state of the art of predictive maintenance techniques, OP Conference Series: Materials Science and Engineering 997, Iași, Romania, 4-5 June 2020. 5 June.
- EN 13306:2010, Maintenance Terminology. European Standard. CEN (European Committee for Standardization), Brussels, 2010.
- Konrad, E.; Schnürmacher, C.; Adolphy, S.; Stark, R. Proactive maintenance as success factor for use-oriented Product-Service Systems. Procedia CIRP 2017, 64, 330–335. [Google Scholar]
- Poór, P.; Ženíšek, D.; Basl, J. Historical Overview of Maintenance Management Strategies: Development from Breakdown Maintenance to Predictive Maintenance in Accordance with Four Industrial Revolutions. Proceedings of the International Conference on Industrial Engineering and Operations Management Pilsen, Czech Republic, 23-26 July 2019. 26 July.
- Ahmad, R.; Kamaruddin, S. An overview of time-based and condition-based maintenance in industrial application. Comput Ind Eng 2012, 63, 135–149. [Google Scholar] [CrossRef]
- Bloch, H.P.; Geitner, F.K. Machinery Failure Analysis and Troubleshooting, Gulf Publishing Company, 1983.
- Lecun, Y.; Bottou, L.; Bengio, Y.; Haffner, P. Gradient Based Learning Applied to Document Recognition, Proceedings of the IEEE 1998, 86(11), 2278-2324.
- Yann LeCun: An Early AI Prophet https://www.historyofdatascience.com/yann-lecun/.
- Kolar, D.; Lisjak, D.; Payak, M.; Pavkovic, D. Fault Diagnosis of Rotary Machines Using Deep Convolutional Neural Network withWide Three Axis Vibration Signal Input, Sensors 2020, 20, 4017.
- Goodfellow, I.; Bengio, Y.; Courville, A. Deep Learning, The MIT Press, ISBN 9780262035613, 2016.
- Li, Z.; Liu, F.; Yang, W.; Peng, S.; Zhou, J. A Survey of Convolutional Neural Networks: Analysis, Applications, and Prospects, IEEE Transactions on neural networks and learning systems 2022, 33(12), 6999-7019.
- Smith, W.A.; Randal, R.B. Rolling element bearing diagnostics using the Case Western Reserve University data: A benchmark study. Mech Syst Signal Process 2015, 64–65, 100–131. [Google Scholar] [CrossRef]
|
Disclaimer/Publisher’s Note: The statements, opinions and data contained in all publications are solely those of the individual author(s) and contributor(s) and not of MDPI and/or the editor(s). MDPI and/or the editor(s) disclaim responsibility for any injury to people or property resulting from any ideas, methods, instructions or products referred to in the content. |
© 2023 by the authors. Licensee MDPI, Basel, Switzerland. This article is an open access article distributed under the terms and conditions of the Creative Commons Attribution (CC BY) license (http://creativecommons.org/licenses/by/4.0/).

