Submitted:
06 October 2023
Posted:
10 October 2023
You are already at the latest version
Abstract
Wearable devices have become ubiquitous, collecting rich temporal data that offers valuable insights into human activities, health monitoring, and behavior analysis. Leveraging this data, researchers have developed innovative approaches to classify and predict time-based patterns and events in human life. Time-based techniques allow the capture of intricate temporal dependencies, which is the nature of the data coming from wearable devices. This paper focuses on predicting well-being factors, such as stress, anxiety, positive and negative affect, on the Tesserae dataset collected from office workers. We examine the performance of different methodologies, including deep learning architectures, LSTM, ensemble techniques, Random Forest (RF) and XGBoost and compare their performances for time-based and non-time-based versions. In time-based versions, we investigate the effect of previous records of well-being factors on the upcoming ones. The overall results show that time-based LSTM performs the best among conventional (non-time-based) RF, XGBoost, and LSTM. The performance even increases when we consider a more extended previous period, in this case, 3 past-days rather than 1 past-day to predict the next day. Furthermore, we explore the corresponding biomarkers for each well-being factor using feature ranking. The obtained rankings are compatible with the psychological literature. In this work, we validated them based on device measurements rather than subjective survey responses.
Keywords:
deep learning
; LSTM
; regression
; ensemble learning
; random forest
; XGBoost
; wearable devices
; well-being
; digital health
; pervasive health
; digital biomarkers
1. Introduction
Wearables, such as smartwatches, fitness trackers, and biosensors, have gained popularity due to their ability to continuously monitor various physiological signals and capture temporal patterns in real time. This wealth of temporal data provides valuable insights into human activities, health monitoring, and behaviour analysis and opens up new possibilities for personalized, context-aware applications that can continuously monitor and classify temporal patterns to support various domains, including healthcare, fitness, and productivity enhancement.
Human well-being monitoring and prediction [1] is one of the example application areas focusing on an individual’s overall state of physical, mental, and social health, reflecting their sense of contentment, happiness, and fulfilment in life. World Health Organization (WHO) defines a well-being index (WHO-5) [2] with 5 factors based on the answers given to the following questions: `I have felt cheerful and in a good spirit’, `Calm and relaxed’, `Active and vigorous’, `Woke up fresh and rested’, `Daily life interests me’. The answers range from `All of the time’ to `At no time’ with six possible inputs.
In recent years, there has been a growing interest in leveraging wearable devices to monitor and predict individuals’ well-being and mental health in the literature [3,4,5,6]. This trend has emerged as a response to the increasing awareness of the importance of mental health in modern society and the growing data size collected by wearables. Traditional machine learning algorithms, such as logistic regression, decision trees, and ensemble methods, have been extensively utilized in classifying or predicting well-being using data collected from wearables and questionaries. However, the time aspect of the temporal data, in other words, how previous data impact future well-being levels, is often overlooked in related studies. Wearables offer a unique opportunity to collect longitudinal data, enabling a deeper understanding of how stress, anxiety, and emotional states fluctuate over time [7,8]. Time-based prediction techniques, when combined with wearable devices, can offer a unique opportunity to capture and analyze temporal patterns. This integrated approach can provide valuable insights into individuals’ emotional states over time, facilitating early detection and timely interventions for improved mental well-being.
In addition, deep learning architectures have emerged as powerful tools for time-based prediction problems. Recurrent Neural Networks (RNNs), and convolutional neural networks (CNNs), have gained attraction in well-being research [9,10,11,12,13,14]. RNNs, particularly LSTM variants, have demonstrated their ability to capture long-term dependencies and temporal dynamics in well-being-related data, while CNNs extract hierarchical features from wearable sensor data, enabling more accurate prediction. Furthermore, the combination of deep learning architectures with wearable devices has led to the development of hybrid models that leverage both wearable sensor data and contextual information. These models incorporate multi-modal inputs, such as physiological signals, accelerometer/activity data, and contextual features like time of day, location, social interactions, and self-reported mood states. By fusing multiple data sources that may have an impact on individual’s well-being levels, the model’s performance can be improved.
Besides deep learning algorithms, ensemble methods are also powerful tools. Ensemble models combine multiple base classifiers to make predictions, leveraging the strengths of different models and reducing the impact of individual model weaknesses. Techniques like Bagging, Boosting, and Random Forests have been successfully employed in time-based classification tasks, yielding improved performance and robustness.
In this study, specifically, we focus on workplace well-being prediction using the Tesserae dataset [15], which was collected over an extended period of time from office workers. The primary objective is to predict the stress, anxiety, and positive and negative affect levels by analyzing the impact of past measurements on their well-being. There is also the sleep factor in the definition of the well-being index based on the WHO-5 well-being questionnaire [2]. Although the sleep response was recorded in the dataset, once we applied the same preprocessing steps to compare each target value’s results fairly, we were left with limited amount of data due to the lack of intersection in missing values in parameter space and target value, i.e., sleep which is collected three to four times in a week even though they are classified in daily surveys. Thus, we could not include this fifth factor in the study.
Given the fact that the dataset is a time stream, we conducted experiments using prediction algorithms, namely Random Forest (RF), XGBoost as example ensemble algorithms and LSTM as an example deep learning algorithm, in their conventional versions as well as in time-based versions. Time-based versions use the concept of time lags to consider the time aspect of the data. In order to create the time-based versions, each data point is associated with previous time steps (i.e., days) to incorporate historical information. We aimed to observe the impact of previous, such as daily, weekly and longer periods, well-being factors on the upcoming ones. We focus on the following research questions (RQ) in our study:
- RQ1: What are the underlying factors (biomarkers) of well-being for workers considering four main parameters: stress, anxiety, positive and negative affect?
- RQ2: Are these biomarkers compatible with conventional psychological studies?
- RQ3: Do time-based versions of the conventional algorithms help to improve prediction performances?
The rest of the paper is organized as follows: Section 2 explores literature related to wearables and well-being monitoring. In Section 3, we explain the details of the dataset, the data construction step for our analysis, the data preprocessing step before analysis, and details of the target values, i.e., stress, anxiety, positive and negative affect. In Section 4, we provide obtained results with feature ranking, modality ranking, and performance details with an interpretation, discussion, and comparison to the related studies, and we finish with Section 5 as a conclusion.
2. Related Work
Well-being, a multidimensional concept encompassing various facets of emotional and psychological health, has become a focal point of research [1,5,16,17,18] and early health intervention by continuous monitoring [19,20]. Within the spectrum of well-being, stress, anxiety, positive affect, and negative affect play pivotal roles in determining an individual’s mental and emotional state [21,22]. Stress and anxiety can significantly impact one’s overall well-being, and understanding and managing these factors are essential for promoting mental health [21,23,24].
Studies have explored the integration of wearable sensors, such as heart rate monitors, electrodermal activity sensors, accelerometers, and even Bluetooth beacons, to capture physiological and behavioral signals associated with stress and emotional well-being [25,26]. These sensors provide non-intrusive and continuous data streams that offer insights into individuals’ emotional experiences and their positive and negative affect.
Nevertheless, the most studied factor is the stress in the literature [27,28,29,30,31,32,33]. In recent years, stress prediction and assessment have witnessed a surge in innovative research aimed at harnessing diverse data sources and cutting-edge machine-learning techniques. These efforts have collectively contributed to a deeper understanding of stress patterns across different contexts and data modalities, paving the way for more effective stress management strategies.
Investigating the feasibility of stress prediction based on behavioral data, researchers have delved into smartphone activity as a potential stress indicator [28]. Leveraging machine learning algorithms, this study dissects smartphone behaviors to uncover stress-indicative patterns, thereby contributing to a deeper understanding of stress dynamics in the digital age. By focusing on digital behavior, the study presents a unique perspective on stress prediction, emphasizing the significance of smartphone interactions in capturing stress-related cues.
Wearable technology emerges as another avenue for stress prediction. Employing physiological sensors, studies have endeavored to predict and visualize work-related stress through wearable sensing [29]. Heart rate and skin conductance are monitored to develop models that provide real-time insights into stress levels, thus empowering individuals and organizations with tools for effective stress management. By focusing on physiological markers, this research offers a unique approach to stress prediction, emphasizing the importance of wearable technology in monitoring and mitigating stress.
Moreover, the analysis of physiological signals has yielded significant strides in stress detection under real-life conditions [30]. By scrutinizing heart rate variability and electrodermal activity, researchers provide valuable insights into physiological stress markers, enhancing our understanding of stress dynamics in natural environments. This study’s focus on physiological markers in real-life settings offers a nuanced perspective on stress detection, providing insights into stress responses beyond controlled environments.
Mobile sensing has also paved the way for predicting stressful life events by analyzing sensor data such as location and physical activity [31]. This novel approach enhances our comprehension of stress-inducing contexts and contributes to users’ overall well-being by identifying potential stress triggers. This approach shifts the focus from immediate stress levels to predicting stress-inducing situations, highlighting the potential of preemptive interventions.
Intriguingly, multimodal approaches have been explored by combining speech and wearable sensor data for stress detection [32]. By integrating speech features and physiological signals, researchers have showcased the potential of using multiple data sources to achieve more accurate stress prediction models. The study’s emphasis on combining speech and physiological data offers a comprehensive approach to stress detection, leveraging multiple modalities to enhance prediction outcomes.
Comprehensive stress and sleep prediction strategies have incorporated physiological signals and smartphone data [33,34]. The fusion of heart rate variability, accelerometer data, and self-reported stress levels yields enhanced accuracy, demonstrating the potential of amalgamating diverse data sources for holistic stress assessment. This research stands out for its comprehensive integration of physiological signals and smartphone data, offering a multifaceted perspective on stress prediction [33]. In [34], the approach of combining wearables and phone sensors enables for more accurate sleep detection by leveraging the benefits of both streams: combining wearable movement detection with mobile phone technology usage detection is employed. They showed that the combination of phone activity and wearables may produce better models of self-reported sleep than either stream alone on the Tesserae dataset.
There are also recent studies focusing on monitoring and predicting stress levels at the workplace. In a recent study [27], researchers developed a mobile app to collect a comprehensive dataset from 30 workers over 8 weeks. The app prompted users to complete a questionnaire three times daily, assessing stress, sleep quality, work abandonment, energy levels, and mood states. Unlike other studies, this research did not involve recording sensor, speech, or camera data. Instead, the focus was solely on self-reported questionnaire responses.
One intriguing avenue of exploration is the utilization of surrounding stress-related data for predicting individual stress levels. Researchers have introduced a groundbreaking approach that capitalizes on personal and social stress-related data to achieve remarkable prediction accuracy [33]. It unveils the contagious nature of stress, shedding light on how one’s focus can influence those around them. Unlike traditional stress prediction methods, which primarily rely on individual data, this study sheds light on the influence of surrounding stress, emphasizing the interconnectedness of stress levels within a social context at the workplace. In our study, by considering all measurements coming from different we are inherently dealing with surroundings by considering all measurements coming from different people. By this aspect, we may say that we are focusing on the well-being of the workplace rather than the individuals. In addition, their model approach encounters the time-based aspect of the dataset, likewise our study. However, besides stress, we explore other factors of well-being and extract the biomarkers of these factors utilizing an extensive dataset.
These studies underscore the richness and variety of approaches in stress prediction research. By leveraging different data modalities, advanced analytics, and machine learning techniques, researchers aim to predict stress levels accurately and provide valuable insights into the intricate interplay of stress dynamics across workplaces, digital platforms, educational settings, and daily life. The cumulative efforts in this field contribute to a more profound comprehension of stress patterns and offer potential avenues for effective stress management and well-being enhancement. Building upon previous research in stress and well-being prediction utilizing wearable, mobile, ambient, and machine learning technologies [32,33], our paper aims to address the challenges and potential areas for further investigation.
In this study, we deal with temporal patterns and dependencies within the data using methods such as RF, XGBoost, and LSTM. Based on past data, these algorithms can effectively predict stress levels, anxiety states, and variations in positive and negative affect. Importantly, these algorithms’ lagged (time-based) versions, incorporating various time windows, have shown promise in capturing nuanced temporal trends.
We have three main questions in Section 1. To the best of our knowledge, none of the well-being studies considered these four factors simultaneously. Furthermore, there is no time-based method application using the current dataset. Considering the intrinsic aspect of data collection and the nature of the states, we show that temporal dependencies have an effect. Even though RF was reported to be the most performing algorithm [32,35,36] in this dataset’s scope, we are also exploring the performance with XGBoost and LSTM alongside RF. In addition, in our previous study [36], we extracted highly related biomarkers only for the classification of the stress variable. In this study, we expand by adding three more well-being factors in a prediction context rather than classification.
Ultimately, this research aims to advance the field of time-based classification, particularly in the context of workplace well-being prediction. By addressing challenges, exploring novel methodologies, and leveraging wearable technology, we strive to contribute to developing intelligent systems that can effectively analyze and interpret temporal data for personalized applications in the workplace.
3. Background and Methodology for Well-being Prediction
3.1. Motivation
Time-based approaches can be used in well-being detection and management by leveraging physiological and contextual data collected over time. The data streams provide rich information that can be leveraged to develop accurate and personalized stress, anxiety, and mood prediction models.
Considering the mentioned research questions in Section 1, we aim to answer the effect of time-based algorithms compared to their conventional versions and extract the related biomarkers (RQ1 and RQ3). In prediction tasks, the data format can significantly impact the modeling approach and the insights gained. Two primary data formats, time-based and conventional predictions, offer distinct characteristics and utility.
Time-series data is organized chronologically, where each observation is tied to a specific timestamp. This format introduces a crucial temporal dimension, capturing how the studied phenomenon evolves. Notable characteristics include the temporal sequencing of data points; time lags and dependencies necessitating feature selection, and the option to aggregate data over different time intervals. These features allow for modelling temporal patterns and dependencies, making time-based prediction particularly valuable in scenarios where understanding how variables change over time is essential, such as stock price forecasting, weather prediction, or user behavior analysis.
Conversely, the usual prediction data format lacks an inherent temporal component, treating each observation as independent and disregarding the order of data points. Key characteristics include the independence of observations, a focus on feature engineering that primarily considers static attributes, and the use of cross-sectional analysis, which provides a snapshot of the data at a particular time. This format is for scenarios where the sequence of observations is irrelevant or temporal aspects hold no significance in the predictive modelling process. It is often employed in areas like classification tasks and static attribute-based predictions.
3.2. Definitions of the Utilized Well-being Factors:
In this study, we are concentrating on four core factors of well-being: stress, anxiety, and positive and negative affect. To be more concrete about the background of these factors, we provide descriptions in the following:
Stress
Stress is a psychological and physiological response to challenging situations or perceived threats. It often includes feelings of tension, pressure, or unease and can manifest as both mental and physical symptoms. Stress is a natural response to various life events, but excessive or chronic stress can have negative effects on one’s mental and physical well-being. As stress is a complex response, it can be influenced by a wide range of factors such as environmental (work, living conditions), psycho-social (life events, everyday challenges, lack of social relationships), biological (genetics, physical health, neurobiology), psychological (personality traits such as perfectionism, cognitive factors, resilience), lifestyle (diet and nutrition, physical activity, sleep patterns, substance use) and cultural-societal (beliefs-expectations, discrimination, social Inequality) factors.
Anxiety
Anxiety is a persistent state of excessive worry, fear, or apprehension about future events or situations. It is characterized by heightened alertness and a sense of unease. Anxiety can be a normal response to stressors, but when it becomes overwhelming, intrusive, or impairs daily functioning, it may indicate an anxiety disorder. Anxiety disorders include various conditions, such as generalized anxiety disorder (GAD), social anxiety disorder, and panic disorder.
Positive Affect
Positive affect refers to the experience of positive emotions, such as joy, happiness, enthusiasm, and contentment. Understanding and measuring positive affect is essential for assessing well-being and mental health. It represents the spectrum of pleasant feelings and moods that individuals may encounter in their daily lives. Positive affect is pivotal in enhancing one’s emotional state, contributing to an overall sense of happiness, and promoting psychological resilience.
Negative Affect
Negative affect refers to the experience of negative emotions, such as sadness, anger, fear, and disgust. It encompasses a range of distressing feelings and emotional states that can impact one’s mood and overall well-being. Understanding and measuring negative affect is essential for assessing emotional health and psychological distress. Negative affect can be a normal response to adverse events, but persistent or severe negative affect may indicate underlying emotional or mental health issues.
In modern society, concerns surrounding stress and anxiety have gained prominence, impacting individuals’ well-being, productivity, and overall quality of life. Detecting and managing these conditions have become increasingly crucial, leading to a growing interest in utilizing time-based classification techniques in conjunction with wearable devices.
3.3. Dataset
Tesserae Dataset 1 [15] is used in this work. It is gathered to track office workers’ psychological and physical qualities over a year to determine their performance at work. It includes information from 757 individuals. Both a smartphone and a Garmin watch are utilized to gather data.
An activity tracking app was used to collect data from the phones. Throughout the investigation, each participant had a Garmin watch. Its battery life is five to seven days. Additionally, Bluetooth beacons have been utilized to gather details about the location, including home or work. They also gathered verbal data from social networking sites like Facebook and LinkedIn, which were inaccessible to us, as a supplement to the non-verbal measurements made by the equipment.
The data-collection campaign has been approved as a research project by the University of Notre Dame, and participants have been asked to sign a consent form. The participants were given a variety of questionnaires to complete in order to gather real-world data. These questionnaires include stress, exercise, sleep, mood, IQ, and job performance. Participants completed all of the survey questions for each kind at the start of the trial. It is mentioned that it takes around an hour to complete. Additionally, there are daily survey questions that provide an overview of each measurement type, where the used well-being factors within the scope of this study, are indicated with a star sign. The overall score of each questionnaire corresponds to one column in the daily survey scores file. Thus, filling it every day only takes a few minutes. In addition, they gathered data with a questionnaire and a follow-up survey. They were inaccessible to us, though. As a result, the questionnaires are divided into the following four sections; initial ground truth, daily surveys, exit survey and follow-up survey. The exit battery and the follow-up survey were not provided to us, yet their parameter space has been given in detail in [36]. We identify the utilized ground truth questionnaires in the scope of this study in Table 1 with a star. As we already found that personality parameters increase the recognition performance and they were found as the most important parameters for our target variables [36], we included them in our parameter space. The rest of the surveys are utilized for the target variables, as shown in Table 1: PANAS for positive and negative affect, omnibus anxiety question for anxiety, omnibus stress question for stress. The detailed versions of the contents of these surveys are presented in [36]. Although this data is gathered over a year, it is stated that only 56 days of daily survey data is collected 2. Thus, in the scope of this study, as we are dealing with data coming from surveys for the target variables, we are actually working on almost two months duration of data.
3.4. Data Pre-processing
We made our analysis on a daily basis. We have features coming from the user’s activity, stress, sleep, heart rate (HR) via a Garmin watch, and phone activity via phone agents, location via Bluetooth beacons.
Even though the data was collected from 757 participants, only 727 participants’ data were available in the shared dataset. Furthermore, although it is stated that 56 days of the daily survey is collected, we observed 61 daily survey answers from some participants. The dataset was provided in separate files. To construct our dataset, we merged the required files according to ParticipantID and Timestamp. We obtained daily wearable data as input and ground truth data as a target for each well-being factor for each participant. We considered the data from participants that only have ground truth responses, i.e., responses to the daily surveys. After constructing the data file, we have 36294 instances from all participants. In the final version of the data, we have 269 columns where 15 of them are the ground truth. Here, 15 columns coming from the ground truth are: survey name, stress, anxiety, sleep, positive affect, negative affect, extraversion, agreeableness, conscientiousness, neuroticism, openness, total phone activity duration, survey sent time, survey start time, survey finish time. We removed the unnecessary columns such as name, start, and end date of surveys before running factor-specific algorithms, i.e., we excluded other well-being factors columns while concentrating on one specific, such as stress. We already reported the importance of personality attributes in stress classification in our previous work [36], and we employed these parameters in our input space. These parameters include extraversion, agreeableness, conscientiousness, neuroticism, and openness. The rest of the input columns from the other modalities are not given here since their volume is quite large. The input columns can be reached from [36], Table 3.
We examined missing values among the independent, i.e., input, variables. Some attributes were never collected from some participants. Thus, an imputation could not be applied to these attributes. Among them, if there is a lack of many participants’ data, their removal by row leads to a high decrease in our dataset. Instead, we deleted those columns. These are act (activity) still, light mean, garmin hr (heart rate) min, garmin hr max, garmin hr median, garmin hr mean, garmin hr std, ave (average) hr at work, ave hr at desk, ave hr at desk, ave hr not at work, call in num (number), call in duration, call out num, call out duration, call miss num, and their derivatives according to time episodes. However, when we have data columns with missing values at the person level, we imputed them by applying the mean operation for each participant.
We proceeded with the same preprocessing steps for each target factor and got the same parameter space. In the end, we have 194 columns with input and target parameters and around 31700 rows due to changes of missing values in the target column. More precisely, it is 31772 for stress, 31731 for anxiety, 31703 for positive affect and 31702 for negative affect. To give an idea about the dataset, we present some columns with their corresponding values and participant’s id in Table 2 for positive affect target variable.
3.5. Creation of Lagged (Time-based) Dataset
Time-based prediction techniques combined with deep learning architectures, ensemble techniques, and multimodal data fusion are powerful methods on temporal data. By leveraging wearables and exploring synergies with emerging technologies, the field of time-based classification is poised to make further strides in accurately analyzing and interpreting temporal data.
When dealing with time-series data in healthcare, it is essential to consider temporal dependencies and trends. The traditional version of the indicated algorithms (RF, XGBoost) may not capture these aspects effectively, as it doesn’t inherently account for the sequential nature of time-series data. This is why we created lagged versions of the dataset. Also, even though LSTM considers the time aspect inherently, its lagged version, often referred to as Time-Lagged LSTM, extends the capabilities of traditional LSTMs by explicitly incorporating lagged features into the model. They excel at capturing complex temporal relationships and can provide valuable insights for time-series analysis in healthcare.
A lagged version introduces the concept of time lags to consider the time aspect in the data. It involves the creation of lagged versions of the features, where each data point is associated with previous time steps to incorporate historical information. This approach can significantly enhance the predictive performance, especially when dealing with time-series data. The model better understands how data evolves over time, making it a valuable tool for time-sensitive healthcare applications.
To explain this concept, consider an employee with a certain level of well-being (W) in terms of stress, anxiety, positive and negative affect separately (either one of them depending on the scenario) during a certain period t are the following:
where represents the well-being parameter value W over a period t, on a range of 1 to 5 for stress and anxiety, 5 to 25 for positive and negative affect. are the individual measurements of the well-being parameter W at different time points within the time window. Thus ∈ or depending on the scenario of well-being, and n is the size of the time window, indicating the number of past measurements considered in the measurements of well-being parameters. In this study, we employed as look-back (n) sizes to consider daily, weekly, fortnightly, and monthly results. Additionally, we wanted to observe the change between daily and weekly performances, so we also employed a 3 day look-back roughly to state half of the week. We could have considered longer periods, such as yearly and seasonal periods. However, as we have only 56 days of data, these approaches are not applicable due to the dataset constraints.
3.6. Prediction Algorithms
3.6.1. Random Forest
RF is an ensemble learning method that combines multiple decision trees to make more accurate predictions or classifications. It is particularly effective for various tasks, including regression and classification. It works by creating a multitude of decision trees during training. Each tree is constructed based on a random subset of the dataset (bootstrapping), and at each node, a random subset of features is considered. This randomness helps in reducing overfitting and improving generalization. During prediction, each tree provides an output (class label or numerical value), and the final prediction is determined by averaging (for regression) or taking a majority vote (for classification) of these individual tree outputs.
3.6.2. XGBoost
XGBoost, short for Extreme Gradient Boosting, is another robust machine learning algorithm commonly used in various domains, including healthcare. Again, it is an ensemble learning technique that combines the predictions of multiple decision trees to achieve high predictive accuracy. XGBoost is known for its efficiency, scalability, and ability to handle various data types, making it a popular choice for predictive modelling tasks.
In the healthcare domain, XGBoost can be used for disease diagnosis, patient risk stratification, and medical image analysis. It excels in capturing complex patterns and relationships within healthcare data.
3.6.3. Long-Short Term Memory
LSTM is a recurrent neural network (RNN) architecture that handles sequential data. It is well-suited for time-series analysis, natural language processing, and other applications. LSTMs are known for their ability to capture long-range dependencies in sequences while avoiding the vanishing gradient problem, which can hinder the training of traditional RNNs. LSTM models can be used in healthcare for patient monitoring, disease prediction, medical image analysis, and more. They excel in scenarios where the order and temporal relationships between data points are critical.
4. Performance of Well-being Factors Prediction
4.1. Implementation details
We employed traditional RF, XGBoost, LSTM, and their lagged versions as prediction/regression models. We used the Random Forest (RF) algorithm in our analyses because it is an ensemble method and performs better among the other used methods in literature in this domain [4], XGBoost as it is indicated to perform better compared to deep learning techniques and even better once combined with deep learning compared to alone version [37] and LSTM as it considers time aspects of data inherently. We also have their lagged versions for days look-back to consider the contribution of past data points and days look-up to understand up to how many days we can reach reasonable errors and which one’s performance is better.
To be fair in comparisons, as the parameter space is is similar (in Section 3.4 the total number of instances per target value was given) and only the target column changes for each scenario specific to different well-being targets, we employed the same preprocessing steps for dataset and hyper-parameter values for the applied algorithms. After hyper-parameter optimization, we found that in scikit-learn n_estimators 1000, criterion , min_sample_split 2, min_samples_leaf 1, max_features combination reveal the best performance for RF, 50 layered LSTM with epochs 50 and batch_size 72, and for XGBoost colsample_bytree , gamma , max_depth 3, min_child_weight , reg_alpha , reg_lambda , n_estimators 20.
We employed and train and test dataset sizes, respectively, as in [36]. However, in this study, we also considered a person’s ID information for splitting even though it is not personalized yet. When we split the dataset sharply to obtain and , it corresponded to splitting one person’s data, some parts in the training set and some in the test. To solve this issue, we assigned 443 person’s data in the training set and 100 person’s data in the test set to reach roughly and splitting.
The experiments are performed on macOS, a 2.7 GHz 4-core i7 processor with 16 DDR3 RAM using the Google Colab platform and Python scripts.
4.2. Biomarkers of Well-being Factors
Before examining the performance of time-based versus non-time-based predictions, we extracted the most effective parameters, i.e., biomarkers, on the target well-being factors. We employed Random Forest for feature importance. For each target variable, top 20 features are presented in Figure 1; corresponding subfigures are as follows: for stress (a), for anxiety (b), for positive affect (c) and negative affect (d). As these explain the health-related components, in literature, they are called digital biomarkers [38]. By doing this, we aim to answer RQ1, mentioned in Section 1. In our previous study [36], concentrating on a stress classification task, we have already found that stress has two overwhelming biomarkers: anxiety and negative affection. This was also the case in this prediction study. As these two factors are also our target variables in the scope of this work, we excluded the other examined factors while targeting one from the set of well-being factors. That is why they are not listed in the most important biomarkers lists.
Similar to the results presented in the stress classification study in [36], the personality factors, which are extraversion, agreeableness, conscientiousness, neuroticism and openness are all found among the most important factors, almost always in the top 5 again (Figure 1) in this study, for all target variables in a separate manner for a regression problem. Besides the personality attributes, we notice that some others, such as sleep-related parameters, including bedtime and wake-up time, are the common attributes in all factors. Similarly, the number of stress samples, highly active seconds, and activity stress seconds are also common parameters. In addition, phone unlock duration, which comes from phone activity, is common in three target factors, i.e. stress, anxiety and negative affect.
As we are dealing with multiple types of inputs, i.e., biomarkers, coming from different modalities, i.e. measurements from different devices (phone, smartwatch) and personality surveys, we wanted to understand the importance of the modalities to shed light for future studies decide on what types of data should be collected to predict the well-being factors. The modalities are phone activity, personality surveys, and the ones coming from the Garmin watch: sleep, stress, daily (this includes a summary of daily recordings, such as distance in meters), activity and heart rate.
We rank the biomarkers according to their corresponding modality set. Since we have extracted the most important 20 features, rankings are from 20 to 1, 20 as the most important one. We sum the rankings of the biomarkers when computing the importance of the modality they belong to. For example, bed_time, sleep_duration, wakeup_time biomarkers are under the sleep modality from the watch. If these were found among the most important 20 features, we sum their ranking values for the sleep modality.
In Figure 2, we provide the rankings of the biomarkers according to their modalities from the phone, the wearable watch (Garmin) and surveys (personality). We observed a similar ranking as personality, phone activity, sleep, daily activity for each target factor. The rest of the rankings are as follows activity for stress; activity, heart rate for anxiety; heart rate, stress, activity for positive affect; activity, stress, heart rate for negative affect (Figure 2). Even though we are dealing with a regression problem in this study, we observe a similar modality ranking as stress classification with resolved class imbalance cases [36]. In addition, this ranking is the same for each target variable, which shows the transitivity of these modalities across targets.
Besides wearable and phone devices’ various measurements, to relate with the psychology literature in answering our second research question (RQ2), we focus on the parameters coming from sleep, stress, heart rate, and activity modalities. Please note that contrary to target variables from daily survey data, these parameters come from the device measurements. This is why we encounter stress sample numbers among the important features for stress targets. Observing these parameters on the parameter space validates device measurements with the subjective values.
It is observed that sleep and activity occur commonly among all target important variables. In literature, it is stated that there is a strong relationship between sleep and stress [39,40,41], sleep and anxiety [23,42,43], sleep and mood (positive and negative affect) [44]. In addition, it is found that sleep patterns are among the most important health-related factors [45]. Our study also validates these results (Figure 2) by having sleep in the upper ranking of importance compared to activity, stress, and heart rate for each one of the target variables.
In [24,46], researchers found that there is a relation between physical activity, anxiety, and stress. It is stated that with the increase of physical activity levels, there is less subsequent stress and negative affect, as well as more positive affect [47]. In our results, activity-related parameters are found towards the end of the importance rankings in Figure 1, yet the results shown are the most important among the whole parameter space. Thus, again, the results aligned with the psychological literature.
Interestingly, most of the stress-related factors were found to be important for positive and negative affect. In literature [48,49], it is reported that perceived stress level is associated with positive and negative affects reactivity to the current events while trait anxiety moderated reactivity of agitation. Also, it is stated that the intensity and duration are important for their relationship. This finding also overlaps with our findings.
In conclusion, with this study, we provide the most important physiological parameters which align with the existing studies in literature from the psychological perspective.
4.3. Conventional vs Time-based Prediction Performances
In well-being, four key factors available in this dataset provide insights into an individual’s psychological state. Stress and anxiety, rated on a scale from 1 to 5, encompass the emotional responses to challenges and worries. Stress levels indicate the intensity of pressures and challenges experienced, while anxiety reflects the degree of unease and fear. On the positive side, positive affect, rated from 5 to 25, measures the abundance of positive emotions, indicating the extent of happiness and enthusiasm. Conversely, negative affect, also rated from 5 to 25, gauges the presence of negative emotions, portraying the degree of distress and unhappiness. These measures collectively offer a comprehensive view of an individual’s emotional state and overall well-being, from coping with stress and anxiety to experiencing positive and negative emotions.
As stated earlier, we are using RF, XGBoost, and LSTM algorithms and their lagged variations in this study. This section will refer to them as conventional and time-based versions to facilitate the understanding. The performances of the algorithms are measured in terms of mean absolute error (MAE) to be able to account for negative errors properly. The reason behind the choice of MAE comes from the observation of model’s under-prediction, as one may observe in Figure 3. Thus, there is no sign difference which suits the usage of MAE as an error metric.
The results are presented in Table 3. When we look at the results of the conventional versions of the algorithms, we see that RF and XGBoost results are closer, but LSTM is better since it captures the time aspect in the data intriguingly. On the other hand, we observed that XGBoost performs far better in terms of running time compared to RF. RF is a versatile algorithm often used in predictive modelling tasks. We used RF to predict outcomes based on historical data. However, RF may not capture temporal dependencies and patterns as effectively as time-based models. It performed reasonably well but didn’t outperform other models in capturing time-related factors. LSTM is a deep learning model designed for sequential data. We applied LSTM to capture intricate time dependencies, which can be highly effective for time series forecasting.
In lagged (time-based) versions of data, we considered different time windows (1 day, 3 days, 7 days, 15 days, and 30 days look-back) and allowed for lookahead predictions (1 day, 3 days, and 7 days lookup) involved incorporating historical data. However, in order not to present an overwhelming table, we provided only some combinations of look-back and lookup parameter space.
When we compare conventional and time-based versions, we observe a clear improvement in the performances with the time-based version regardless of the algorithm. The best-performing configuration for time-based versions belong to LSTM. Particularly 3-day look-back and 1-day lookup likely excelled because the combination effectively captures recent trends while considering the influence of the previous days. This configuration balanced short-term adaptability with longer-term patterns, providing the most accurate results for almost all target variables. We observed better results with 15-day look-back only for the stress target. We interpret it as the intriguing aspect of the data; it may represent the stressful period of work while collecting the dataset. However, we are not fully sure about this since we do not have ground-truth recordings for this issue, or in other words daily lives of the participants.
Even though LSTM was found to be the best-performing one, its results are very close to XGBoost, and its results are even better in some cases (e.g. 15 look-back - 1 lookup). However, XGBoost’s execution time is shorter than LSTM’s in all cases. Furthermore, as the data ranges for positive and negative affect are different and wider compared to stress and anxiety, we observe higher error values for them.
To compare our findings with the literature where time-based techniques were utilized in other datasets [33], we see that they employed daily and weekly resolutions. They employed different models such as LogR, DT and ADA on different kinds of features, yet they also concluded an increase in performances from daily to weekly transition. More precisely, for the stress prediction study case, they achieved a nearly and F-score on their data and the StudentLife dataset correspondingly. These performances increased to in their data case and in StudentLife.
To show the differences between predictions (forecasts) and ground truth target values, we present detailed prediction visualization for XGBoost for 7 days look-back predictions in detail in Figure 3 for stress, anxiety, positive affect and negative affect. In these figures, the commonly observed pattern is that the predicted values are lower than the original values. Thus, models under-predict the values, but the patterns are being captured. Please note that these results do not represent the personal level results, rather they indicate overall daily predictions collected from different people over almost two months.
In conclusion, we found that time-based versions of the applied algorithms perform better than conventional ones in this study’s scope, which answers our third question (RQ3). The best performing one is LSTM, with a 3-day look-back and a 1-day lookup for almost all target variables.
5. Conclusion
In this study, we focused on the prediction of well-being factors, namely stress, anxiety, and positive and negative affect, using the Tesserae dataset collected from office workers. We focused on three research questions related to digital biomarkers affecting these factors (RQ1), their alignment with conventional psychology literature (RQ2) and time-based performances of applied methods (RQ3).
We found similar modality rankings for each target variable. Even though we are working on prediction problems rather than classification, these findings align with the one-factor stress classification results after imputing missing values [36].
In addition, we validated our findings by examining conventional psychology literature where there is no wearable device usage. We found that device-measured modalities aligned with the paper-based studies. Furthermore, we found that we achieve better prediction performances when we consider the time aspect of the data. In particular, LSTM performs the best compared to other ensemble algorithms.
There are also limitations of this study that we want to enhance in further studies. We are constantly working on the available data points by excluding missing ones. Since this amount is vast, their imputation might help to improve precision and may lead to better performances. Also, even though we considered person-based splitting during the train-test split, we did not consider a personalized approach during the analysis. In the future, we are planning to integrate the personalization aspect into the analysis.
Author Contributions
Conceptualization, Berrenur Saylam and Özlem Durmaz İncel; Methodology, Berrenur Saylam and Özlem Durmaz İncel; Validation, Özlem Durmaz İncel; Formal analysis, Berrenur Saylam; Investigation, Berrenur Saylam; Writing – original draft, Berrenur Saylam; Writing – review & editing, Berrenur Saylam and Özlem Durmaz İncel; Supervision, Özlem Durmaz İncel.
Acknowledgments
Tübitak Bideb 2211-A academic reward is gratefully acknowledged. We want to thank all the contributors of the datasets used in this study for providing the data for research purposes. This work is supported by the Turkish Directorate of Strategy and Budget under the TAM Project number 2007K12-873 and by the Bogazici University Research Fund, project number: 19301p.
References
- Alhejaili, R.; Alomainy, A. The Use of Wearable Technology in Providing Assistive Solutions for Mental Well-Being. Sensors 2023, 23, 7378. [Google Scholar] [CrossRef] [PubMed]
- Topp, C.W.; Østergaard, S.D.; Søndergaard, S.; Bech, P. The WHO-5 Well-Being Index: a systematic review of the literature. Psychotherapy and psychosomatics 2015, 84, 167–176. [Google Scholar] [CrossRef]
- Wang, R.; Chen, F.; Chen, Z.; Li, T.; Harari, G.; Tignor, S.; Zhou, X.; Ben-Zeev, D.; Campbell, A.T. StudentLife: assessing mental health, academic performance and behavioral trends of college students using smartphones. Proceedings of the 2014 ACM international joint conference on pervasive and ubiquitous computing, 2014, pp. 3–14. [CrossRef]
- Taelman, J.; Vandeput, S.; Spaepen, A.; Van Huffel, S. Influence of mental stress on heart rate and heart rate variability. 4th European Conference of the International Federation for Medical and Biological Engineering: ECIFMBE 2008 Antwerp, Belgium. Springer, 2009, pp. 1366–1369. 23–27 November. [CrossRef]
- Trmčić, B.R.; Labus, A.; Mitrović, S.; Buha, V.; Stanojević, G. Internet of things in E-health: an application of wearables in prevention and well-being. In Wearable Technologies: Concepts, Methodologies, Tools, and Applications; IGI global, 2018; pp. 880–885. [Google Scholar]
- Cannard, C.; Wahbeh, H.; Delorme, A. Electroencephalography correlates of well-being using a low-cost wearable system. Frontiers in Human Neuroscience 2021, 15, 745135. [Google Scholar] [CrossRef] [PubMed]
- Neto, M.; Carvalho, V.S.; Chambel, M.J.; Manuel, S.; Miguel, J.P.; de Fátima Reis, M. Work-family conflict and employee well-being over time. Journal of occupational and environmental medicine 2016, 58, 429–435. [Google Scholar] [CrossRef] [PubMed]
- Gupta, S.; Goel, L.; Singh, A.; Agarwal, A.K.; Singh, R.K. TOXGB: Teamwork Optimization Based XGBoost model for early identification of post-traumatic stress disorder. Cognitive Neurodynamics 2022, 16, 833–846. [Google Scholar] [CrossRef] [PubMed]
- Sathishkumar, B.; Saranya, T.; Srishuwetha, A.; Thirumalini, S. Stress Detection using RNN Algorithm. 2023 8th International Conference on Communication and Electronics Systems (ICCES). IEEE, 2023, pp. 877–811. [CrossRef]
- Raksha, M.; Suresh, K.; Anusha, D. To Identify Patient Psychological Impacts based on Enhanced Recurrent Neural Network Technique. 2022 3rd International Conference on Electronics and Sustainable Communication Systems (ICESC). IEEE, 2022, pp. 979–986. [CrossRef]
- Gupta, M.V.; Vaikole, S.; Oza, A.D.; Patel, A.; Burduhos-Nergis, D.P.; Burduhos-Nergis, D.D. Audio-Visual Stress Classification Using Cascaded RNN-LSTM Networks. Bioengineering 2022, 9, 510. [Google Scholar] [CrossRef]
- Madhusanka, B.; Ramadass, S. Implicit intention communication for activities of daily living of elder/disabled people to improve well-being. In IoT in Healthcare and Ambient Assisted Living; 2021; pp. 325–342. [Google Scholar] [CrossRef]
- Sathyanarayana, A.; Joty, S.; Fernandez-Luque, L.; Ofli, F.; Srivastava, J.; Elmagarmid, A.; Arora, T.; Taheri, S.; others. Sleep quality prediction from wearable data using deep learning. JMIR mHealth and uHealth 2016, 4, e6562. [Google Scholar]
- Kilic, O.; Saylam, B.; Durmaz Incel, O. Sleep Quality Prediction from Wearables using Convolution Neural Networks and Ensemble Learning. Proceedings of the 2023 8th International Conference on Machine Learning Technologies, 2023, pp. 116–120. [CrossRef]
- Mattingly, S.M.; Gregg, J.M.; Audia, P.; Bayraktaroglu, A.E.; Campbell, A.T.; Chawla, N.V.; Das Swain, V.; De Choudhury, M.; D’Mello, S.K.; Dey, A.K.; others. The tesserae project: Large-scale, longitudinal, in situ, multimodal sensing of information workers. Extended Abstracts of the 2019 CHI Conference on Human Factors in Computing Systems, 2019, pp. 1–8. [CrossRef]
- Tikkanen, H.; Heinonen, K.; Ravald, A. Smart wearable technologies as resources for consumer agency in well-being. Journal of Interactive Marketing 2023, 58, 136–150. [Google Scholar] [CrossRef]
- Zehrung, R.; Huang, L.; Lee, B.; Choe, E.K. Investigating Opportunities to Support Kids’ Agency and Well-being: A Review of Kids’ Wearables. arXiv 2021, arXiv:2104.05979 2021. [Google Scholar]
- Andrushevich, A.; Biallas, M.; Kistler, R.; Eusebi, L.; Ronai, J.; Valla, M. Towards smart working spaces with enhanced well-being and safety of elderly staff. 2017 Global Internet of Things Summit (GIoTS). IEEE, 2017, pp. 1–6. [CrossRef]
- Smith, E.N.; Santoro, E.; Moraveji, N.; Susi, M.; Crum, A.J. Integrating wearables in stress management interventions: Promising evidence from a randomized trial. International Journal of Stress Management 2020, 27, 172. [Google Scholar] [CrossRef]
- Arora, A.; Chakraborty, P.; Bhatia, M. Intervention of wearables and smartphones in real time monitoring of sleep and behavioral health: an assessment using adaptive neuro-fuzzy technique. Arabian Journal for Science and Engineering 2021, 47, 1999–2024. [Google Scholar] [CrossRef]
- Kaur, T.; Ranjan, P.; Chakrawarty, A.; Kasi, K.; Berry, P.; Suryansh, S.; Mazumder, A.; Khan, M.; Upadhyay, A.D.; Kaloiya, G.; others. Association of sociodemographic parameters with depression, anxiety, stress, sleep quality, psychological trauma, mental well-being, and resilience during the second wave of COVID-19 pandemic: a cross-sectional survey from India. Cureus 2021, 13.
- Wunsch, K.; Kasten, N.; Fuchs, R. The effect of physical activity on sleep quality, well-being, and affect in academic stress periods. Nature and science of sleep 2017, 117–126. [Google Scholar] [CrossRef] [PubMed]
- Mellman, T.A. Sleep and anxiety disorders. Psychiatric Clinics 2006, 29, 1047–1058. [Google Scholar] [CrossRef] [PubMed]
- Taylor, A.H. Physical activity, anxiety, and stress. In Physical activity and psychological well-being; 2003; pp. 22–52. [Google Scholar]
- Doherty, S.T.; Lemieux, C.J.; Canally, C. Tracking human activity and well-being in natural environments using wearable sensors and experience sampling. Social science & medicine 2014, 106, 83–92. [Google Scholar]
- Hänsel, K. Wearable and ambient sensing for well-being and emotional awareness in the smart workplace. Proceedings of the 2016 ACM International Joint Conference on Pervasive and Ubiquitous Computing: Adjunct, 2016, pp. 411–416. [CrossRef]
- Hosseini, S.; Gottumukkala, R.; Katragadda, S.; Bhupatiraju, R.T.; Ashkar, Z.; Borst, C.W.; Cochran, K. A multimodal sensor dataset for continuous stress detection of nurses in a hospital. Scientific Data 2022, 9, 255. [Google Scholar] [CrossRef] [PubMed]
- Martinez, G.J.; Grover, T.; Mattingly, S.M.; Mark, G.; D’Mello, S.; Aledavood, T.; Akbar, F.; Robles-Granda, P.; Striegel, A. Alignment between heart rate variability from fitness trackers and perceived stress: Perspectives from a large-scale in situ longitudinal study of information workers. JMIR human factors 2022, 9, e33754. [Google Scholar] [CrossRef] [PubMed]
- Sükei, E.; Norbury, A.; Perez-Rodriguez, M.M.; Olmos, P.M.; Artés, A. Predicting emotional states using behavioral markers derived from passively sensed data: data-driven machine learning approach. JMIR mHealth and uHealth 2021, 9, e24465. [Google Scholar] [CrossRef]
- Nepal, S.; Martinez, G.J.; Mirjafari, S.; Saha, K.; Swain, V.D.; Xu, X.; Audia, P.G.; De Choudhury, M.; Dey, A.K.; Striegel, A. ; others. A Survey of Passive Sensing in the Workplace. arXiv 2022, arXiv:2201.03074 2022. [Google Scholar]
- Aledavood, T.; Kivimäki, I.; Lehmann, S.; Saramäki, J. Quantifying daily rhythms with non-negative matrix factorization applied to mobile phone data. Scientific reports 2022, 12, 5544. [Google Scholar] [CrossRef]
- Booth, B.M.; Vrzakova, H.; Mattingly, S.M.; Martinez, G.J.; Faust, L.; D’Mello, S.K. Toward robust stress prediction in the age of wearables: Modeling perceived stress in a longitudinal study with information workers. IEEE Transactions on Affective Computing 2022, 13, 2201–2217. [Google Scholar] [CrossRef]
- Muñoz, S.; Iglesias, C.Á.; Mayora, O.; Osmani, V. Prediction of stress levels in the workplace using surrounding stress. Information Processing & Management 2022, 59, 103064. [Google Scholar]
- Martinez, G.J.; Mattingly, S.M.; Young, J.; Faust, L.; Dey, A.K.; Campbell, A.T.; De Choudhury, M.; Mirjafari, S.; Nepal, S.K.; Robles-Granda, P.; others. Improved sleep detection through the fusion of phone agent and wearable data streams. 2020 IEEE International Conference on Pervasive Computing and Communications Workshops (PerCom Workshops). IEEE, 2020, pp. 1–6. [CrossRef]
- Robles-Granda, P.; Lin, S.; Wu, X.; Martinez, G.J.; Mattingly, S.M.; Moskal, E.; Striegel, A.; Chawla, N.V.; D’Mello, S.; Gregg, J.; others. Jointly predicting job performance, personality, cognitive ability, affect, and well-being. IEEE Computational Intelligence Magazine 2021, 16, 46–61. [Google Scholar] [CrossRef]
- Saylam, B.; Durmaz İncel, Ö. Extracting Digital Biomarkers for Unobtrusive Stress State Screening from Multimodal Wearable Data. In International Conference on Intelligent Edge Processing in the IoT era; Springer, 2022; pp. 130–151. [Google Scholar]
- Shwartz-Ziv, R.; Armon, A. Tabular data: Deep learning is not all you need. Information Fusion 2022, 81, 84–90. [Google Scholar] [CrossRef]
- Vasudevan, S.; Saha, A.; Tarver, M.E.; Patel, B. Digital biomarkers: convergence of digital health technologies and biomarkers. NPJ digital medicine 2022, 5, 36. [Google Scholar] [CrossRef] [PubMed]
- Marcusson-Clavertz, D.; Sliwinski, M.J.; Buxton, O.M.; Kim, J.; Almeida, D.M.; Smyth, J.M. Relationships between daily stress responses in everyday life and nightly sleep. Journal of behavioral medicine 2022, 45, 518–532. [Google Scholar] [CrossRef] [PubMed]
- Martire, V.L.; Caruso, D.; Palagini, L.; Zoccoli, G.; Bastianini, S. Stress & sleep: A relationship lasting a lifetime. Neuroscience & Biobehavioral Reviews 2020, 117, 65–77. [Google Scholar]
- Partinen, M. Sleep disorders and stress. Journal of Psychosomatic Research 1994. [Google Scholar] [CrossRef] [PubMed]
- Rosa, R.R.; Bonnet, M.H.; Kramer, M. The relationship of sleep and anxiety in anxious subjects. Biological Psychology 1983, 16, 119–126. [Google Scholar] [CrossRef]
- Alfano, C.A.; Zakem, A.H.; Costa, N.M.; Taylor, L.K.; Weems, C.F. Sleep problems and their relation to cognitive factors, anxiety, and depressive symptoms in children and adolescents. Depression and anxiety 2009, 26, 503–512. [Google Scholar] [CrossRef] [PubMed]
- Steptoe, A.; O’Donnell, K.; Marmot, M.; Wardle, J. Positive affect, psychological well-being, and good sleep. Journal of psychosomatic research 2008, 64, 409–415. [Google Scholar] [CrossRef] [PubMed]
- Gedam, S.; Paul, S. A review on mental stress detection using wearable sensors and machine learning techniques. IEEE Access 2021, 9, 84045–84066. [Google Scholar] [CrossRef]
- Wijndaele, K.; Matton, L.; Duvigneaud, N.; Lefevre, J.; De Bourdeaudhuij, I.; Duquet, W.; Thomis, M.; Philippaerts, R.M. Association between leisure time physical activity and stress, social support and coping: A cluster-analytical approach. Psychology of Sport and Exercise 2007, 8, 425–440. [Google Scholar] [CrossRef]
- Schultchen, D.; Reichenberger, J.; Mittl, T.; Weh, T.R.; Smyth, J.M.; Blechert, J.; Pollatos, O. Bidirectional relationship of stress and affect with physical activity and healthy eating. British journal of health psychology 2019, 24, 315–333. [Google Scholar] [CrossRef]
- Stone, A.A.; Neale, J.M.; Shiftman, S. Daily assessments of stress and coping and their association with mood. Annals of Behavioral Medicine 1993, 15, 8–16. [Google Scholar]
- van Eck, M.; Nicolson, N.A.; Berkhof, J. Effects of stressful daily events on mood states: relationship to global perceived stress. Journal of personality and social psychology 1998, 75, 1572. [Google Scholar] [CrossRef]
Figure 1.
The most important features per target (a) Stress (b) Anxiety (c) Positive Affect (d) Negative Affect
Figure 1.
The most important features per target (a) Stress (b) Anxiety (c) Positive Affect (d) Negative Affect
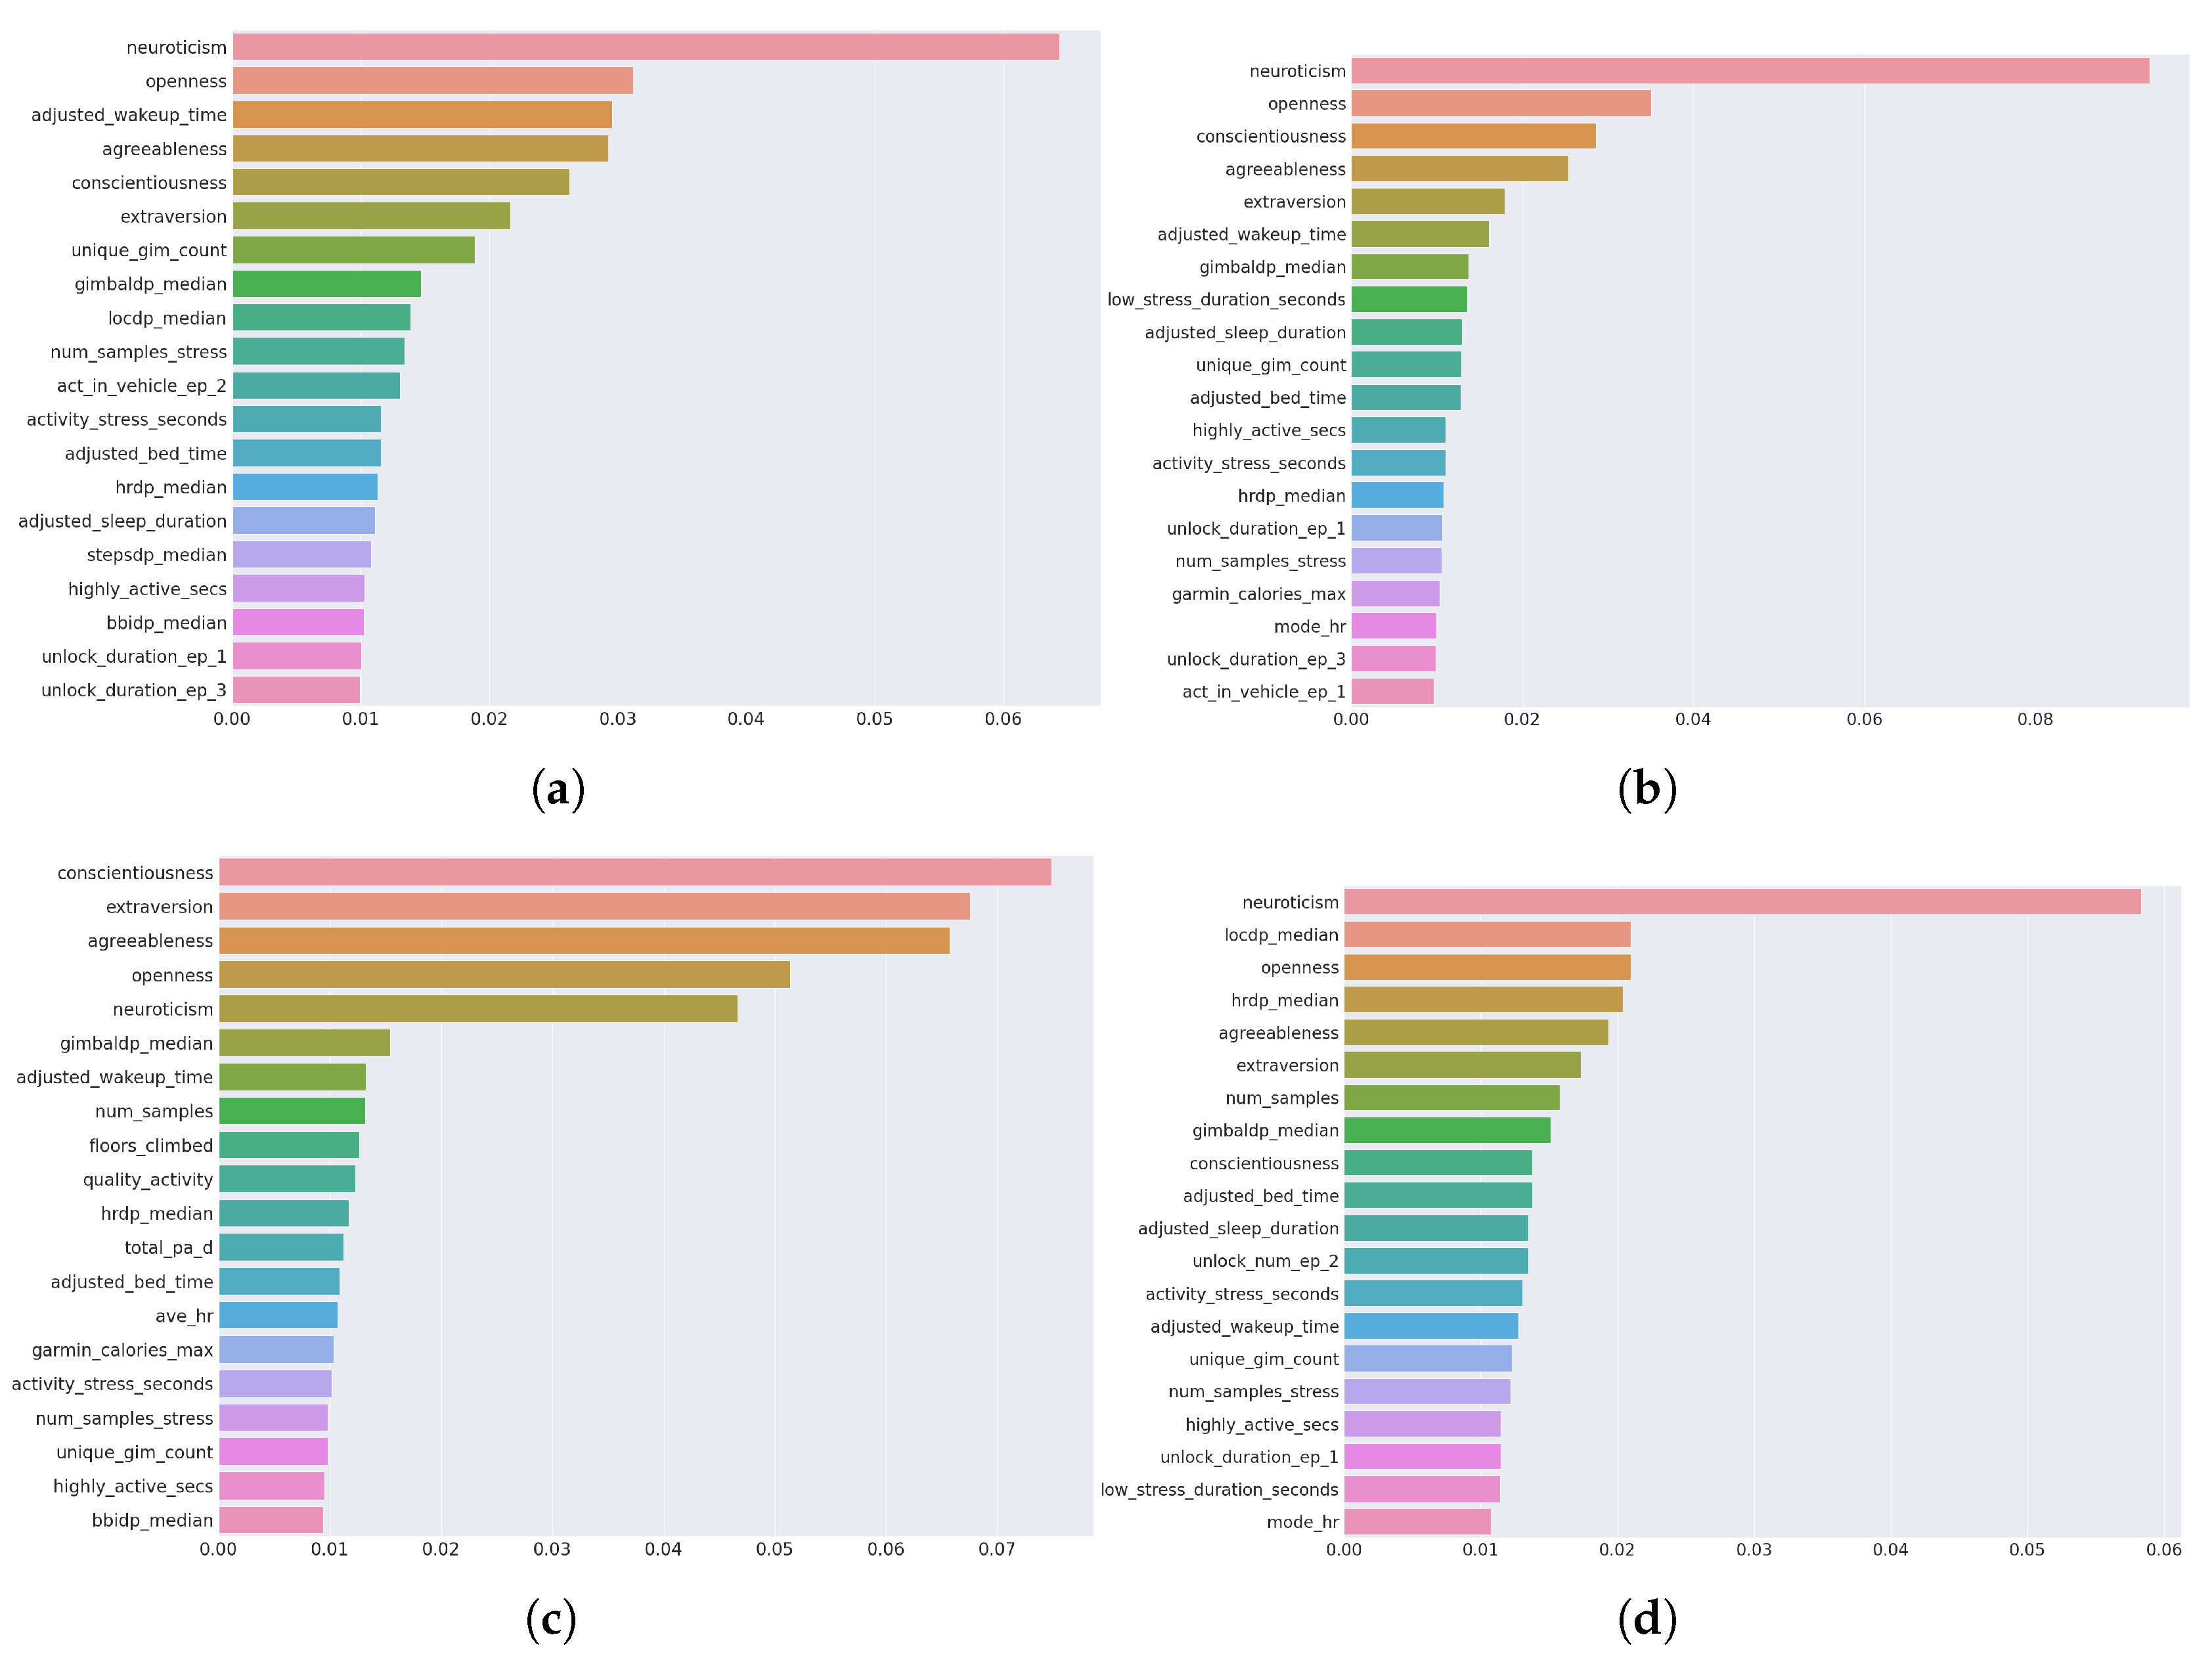
Figure 2.
Modality rankings
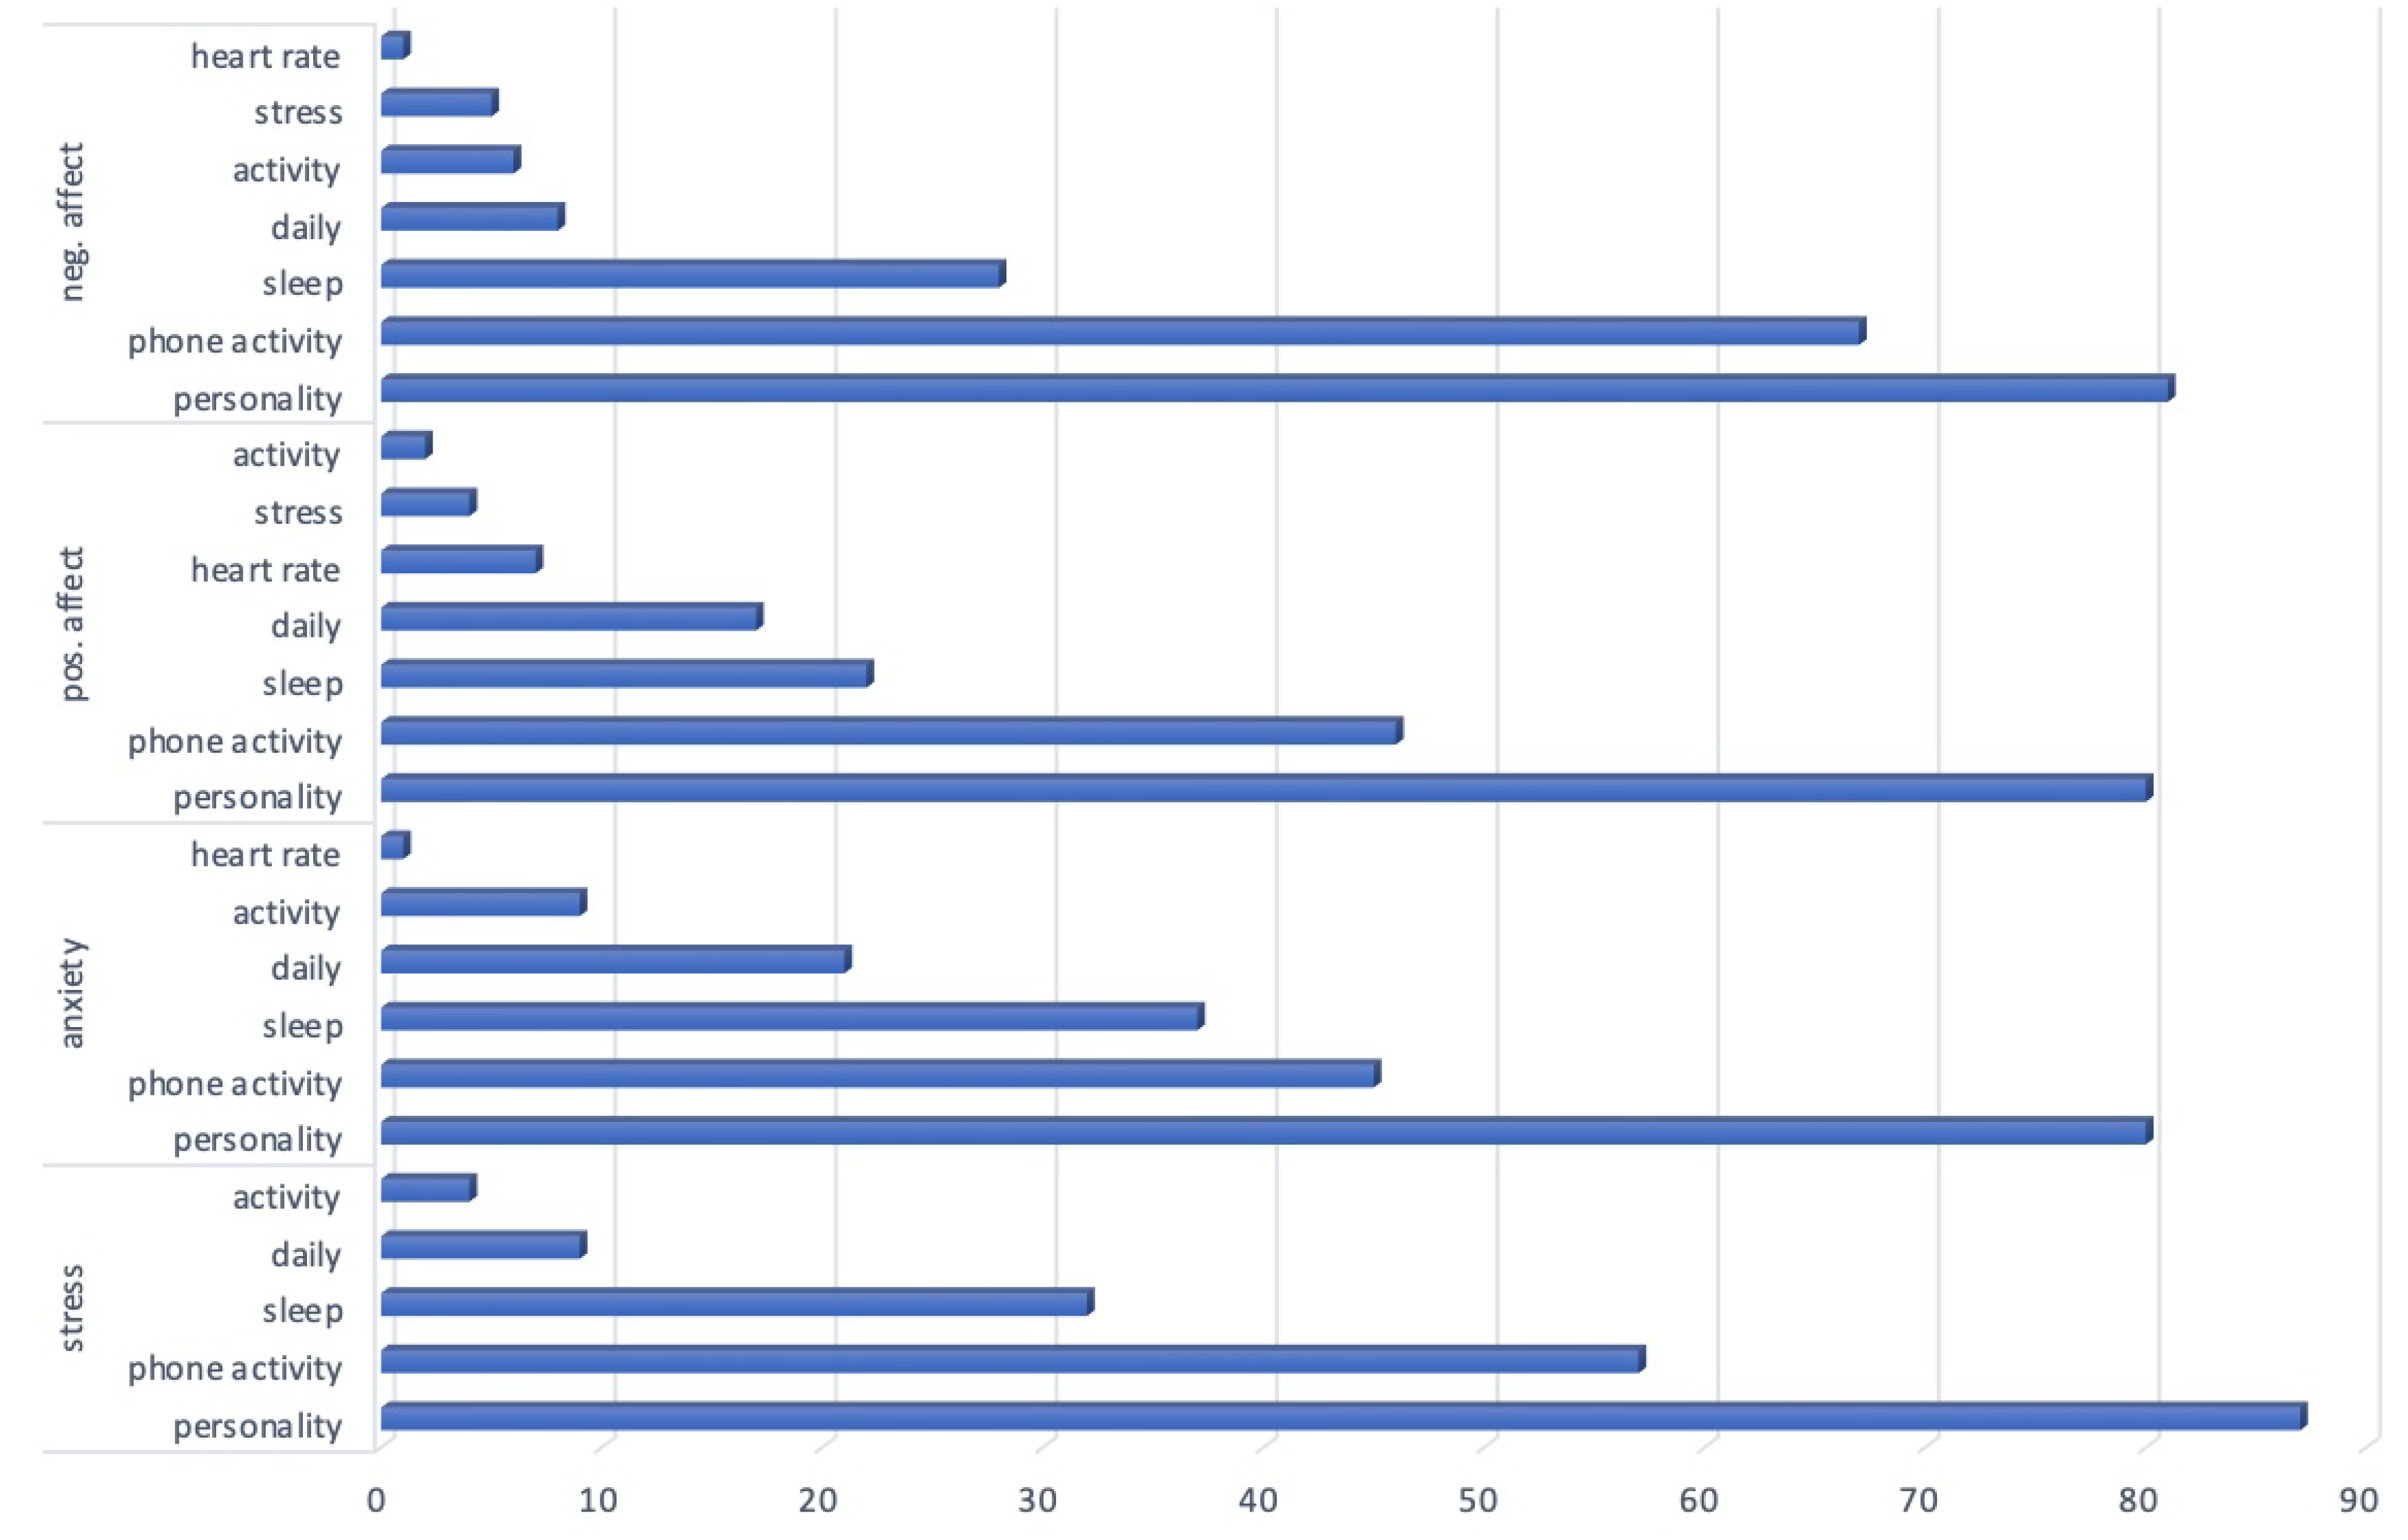
Figure 3.
Forecast visuals with XGBoost 7 days prior (a) Stress (b) Anxiety (c) Positive Affect (d) Negative Affect
Figure 3.
Forecast visuals with XGBoost 7 days prior (a) Stress (b) Anxiety (c) Positive Affect (d) Negative Affect
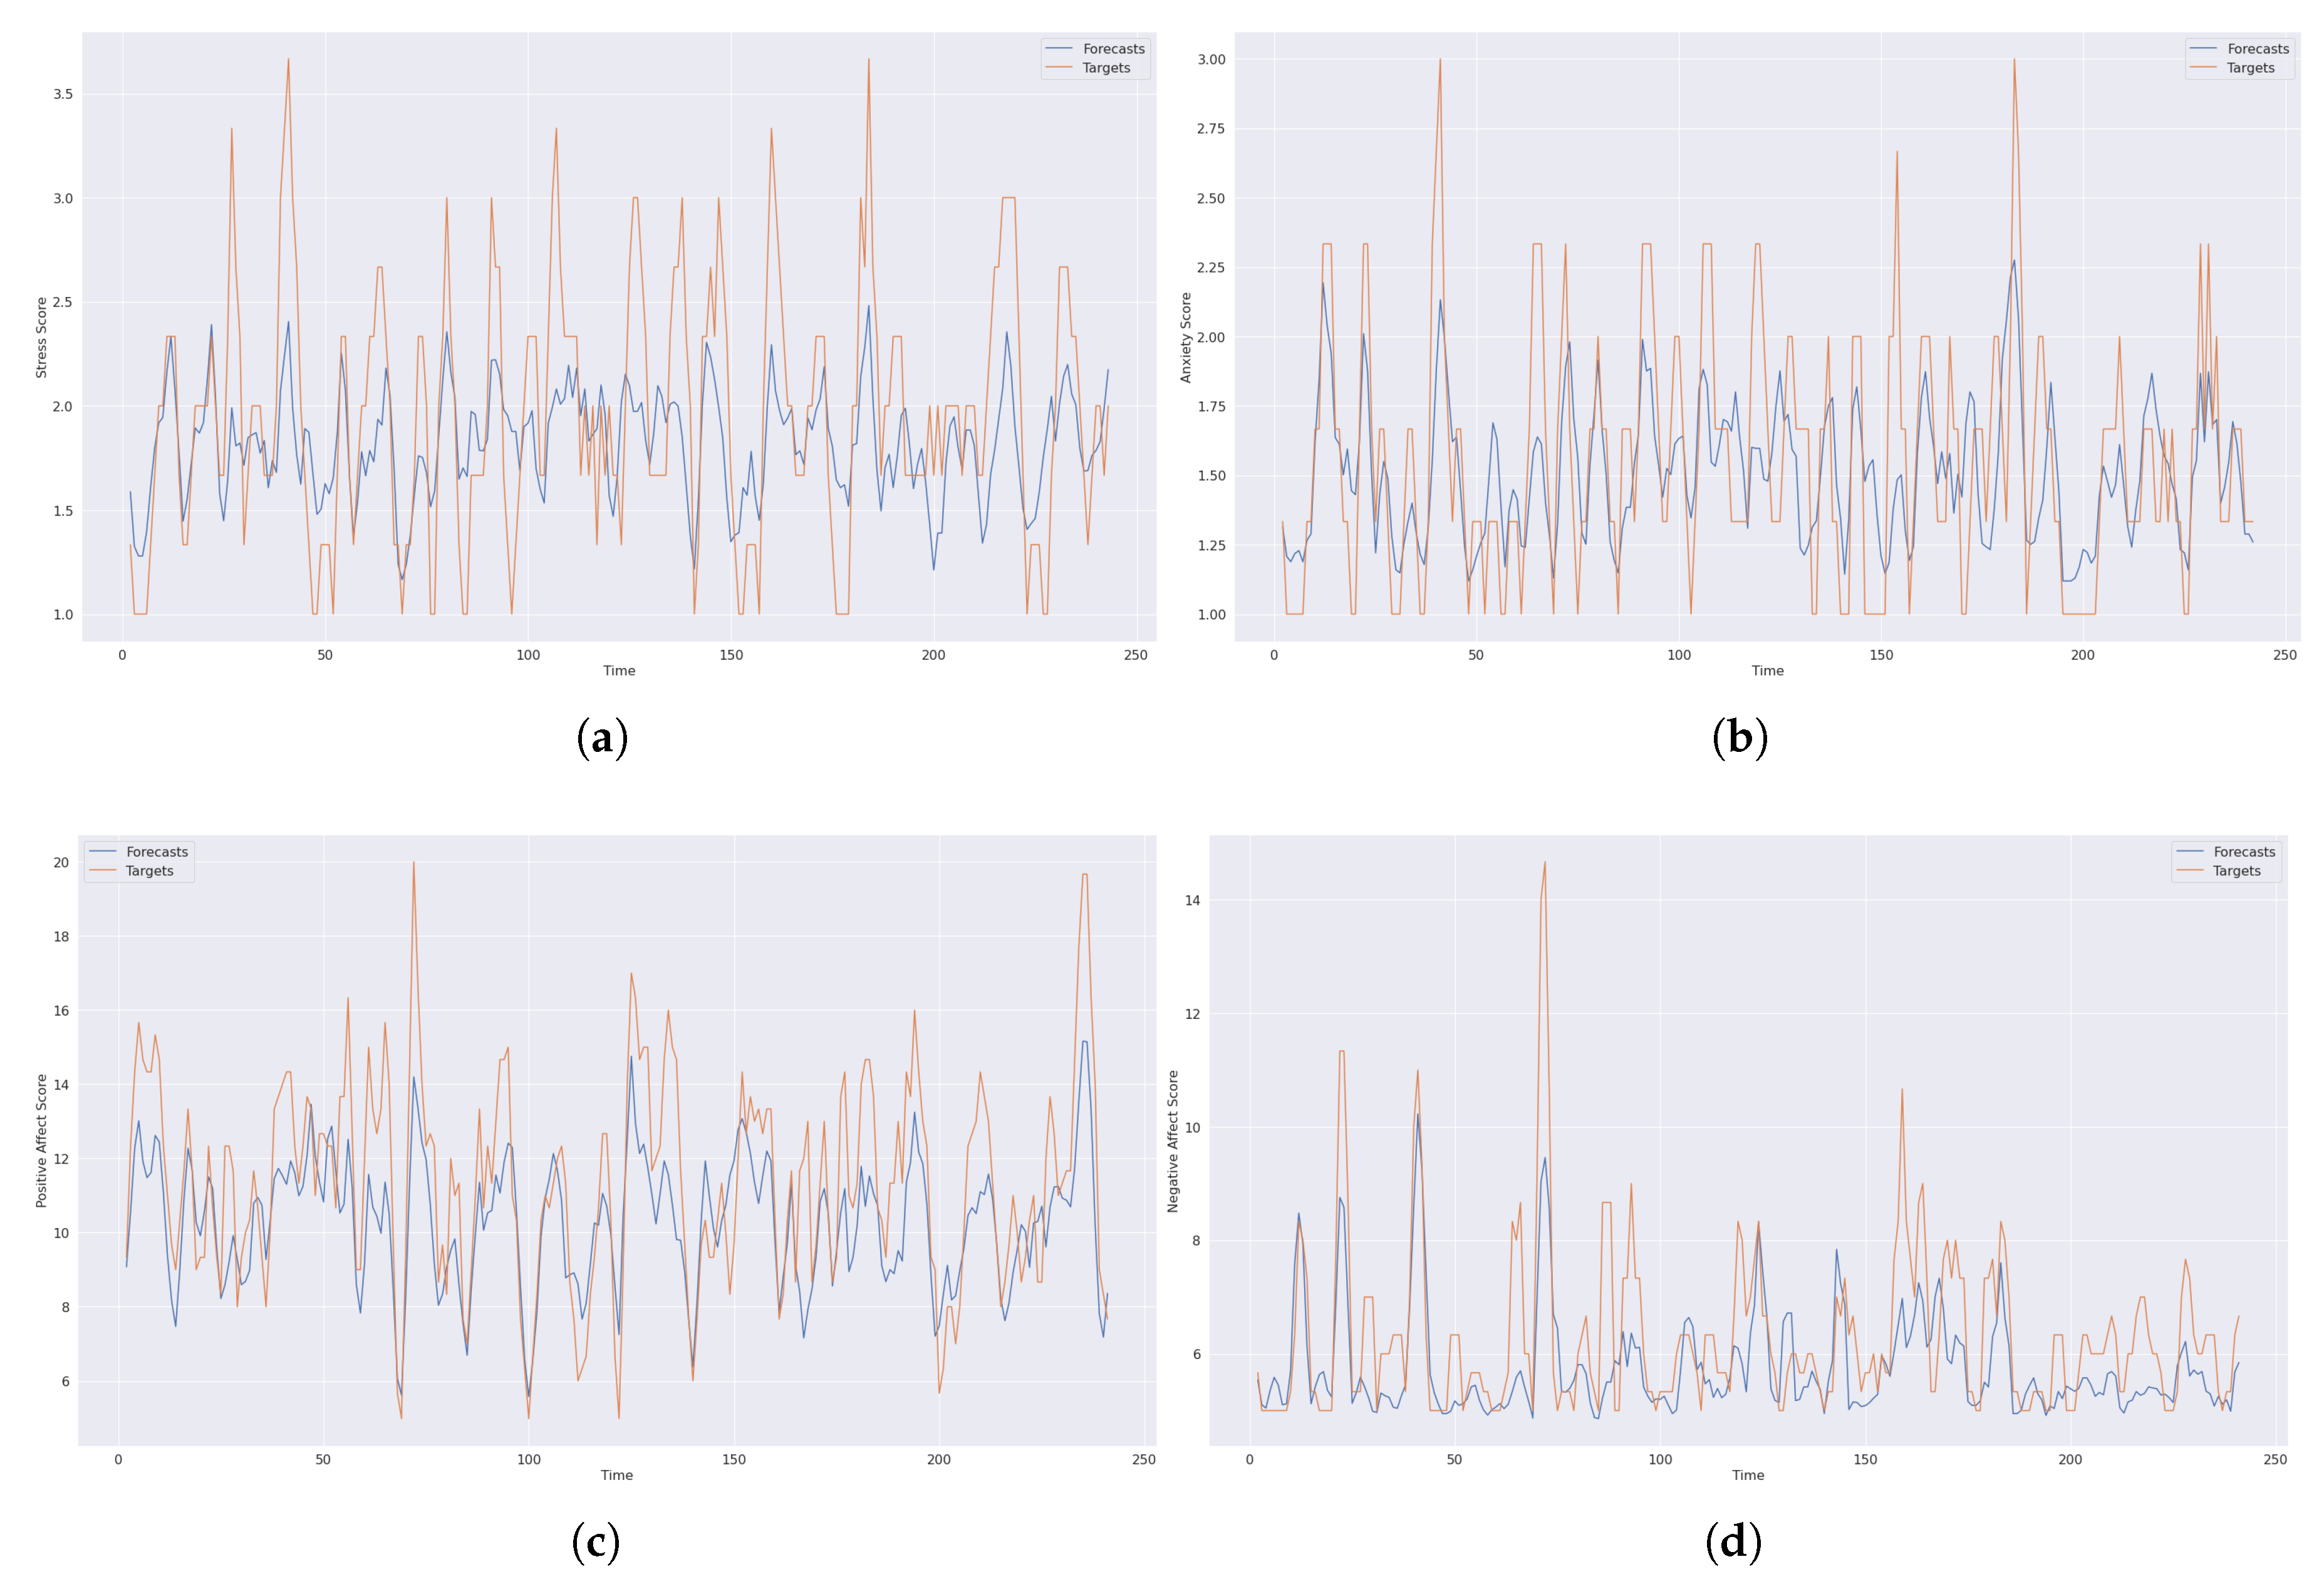

Table 1.
Details of the daily questionnaires
| Questionnaires | Content |
|---|---|
| Daily Surveys | Big Five Inventory (BFI)*: Extroversion, Agreeableness, Conscientiousness, Neuroticism, Openness, Positive and Negative Affect Schedule (PANAS)*, Omnibus Anxiety Question*, MITRE Omnibus Stress Question*, MITRE Physical Activity Assessment MITRE Sleep Assessment |
Table 2.
A snapshot of the data for positive affect
| ID | Timestamp | active secs | ... | resting hr | steps | stress duration seconds | ... | positive affect |
|---|---|---|---|---|---|---|---|---|
| 4188a14d4edd8eb1cac1a146d9f88aee | 2018-02-21 | 2417 | ... | 57.0 | 6634 | 34560.0 | ... | 14 |
| 4188a14d4edd8eb1cac1a146d9f88aee | 2018-02-22 | 2557 | ... | 55.0 | 6008 | 21960.0 | ... | 14 |
| 4188a14d4edd8eb1cac1a146d9f88aee | 2018-02-23 | 5849 | ... | 55.0 | 9008 | 26880.0 | ... | 15 |
| ... | .. | ... | ... | ... | ... | ... | ... | ... |
| 4188a14d4edd8eb1cac1a146d9f88aee | 2018-04-27 | 3595 | ... | 72.0 | 4837 | 12240.0 | ... | 15 |
| ... | ... | ... | ... | ... | ... | ... | ... | |
| c30291318f6d680bd65666c183f6bb5e | 2018-01-11 | 4988 | ... | 57.0 | 10550 | 19020.0 | ... | 11 |
| ... | .. | ... | ... | ... | ... | ... | ... | ... |
| c30291318f6d680bd65666c183f6bb5e | 2018-03-13 | 5109 | ... | 50.0 | 11002 | 46140.0 | ... | 9 |
Table 3.
Prediction performances in terms of MAE
| Type | Method | Stress | Anxiety | Positive Affect | Negative Affect |
|---|---|---|---|---|---|
| Conventional | Random Forest (RF) | 0.6702 | 0.6508 | 3.2955 | 2.2088 |
| XGBoost | 0.6910 | 0.6316 | 3.4269 | 1.7874 | |
| LSTM | 0.6443 | 0.6445 | 3.2325 | 1.5121 | |
| Time-Based | RF (1 day look back-1 day lookup) | 0.5922 | 0.4700 | 2.4881 | 1.4999 |
| XGBoost (1 day look back-1 day lookup) | 0.6319 | 0.4745 | 2.4947 | 1.4304 | |
| LSTM (1 day look back-1 day lookup) | 0.5377 | 0.3897 | 2.5075 | 1.3841 | |
| RF (3 days look back-1 day lookup) | 0.5907 | 0.4628 | 2.2741 | 1.3118 | |
| XGBoost (3 days look back-1 day lookup) | 0.5952 | 0.4653 | 2.1851 | 1.2466 | |
| LSTM (3 days look back-1 day lookup) | 0.5394 | 0.3729 | 2.1387 | 1.0574 | |
| RF (7 days look back-1 day lookup) | 0.5808 | 0.4575 | 2.3130 | 1.2717 | |
| XGBoost (7 days look back-1 day lookup) | 0.5791 | 0.4527 | 2.2623 | 1.0866 | |
| LSTM (7 days look back-1 day lookup) | 0.5111 | 0.3846 | 2.1923 | 1.0522 | |
| XGBoost (15 days look back-1 day lookup) | 0.6327 | 0.5736 | 2.4947 | 1.2982 | |
| LSTM (15 days look back-1 day lookup) | 0.4718 | 0.4752 | 2.3795 | 1.3159 | |
| XGBoost (30 days look back-1 day lookup) | 0.6518 | 0.6025 | 2.1583 | 1.3630 | |
| LSTM (30 days look back-1 day lookup) | 0.5004 | 0.4804 | 2.3929 | 1.4011 | |
| RF (3 days look back-3 days lookup) | 0.5950 | 0.5239 | 2.5205 | 1.3992 | |
| XGBoost (3 days look back-3 days lookup) | 0.6078 | 0.5356 | 2.3898 | 1.3983 | |
| LSTM (3 days look back-3 days lookup) | 0.5547 | 0.4600 | 2.3425 | 1.2564 | |
| RF (7 days look back-3 days lookup) | 0.6324 | 0.5605 | 2.6482 | 1.4781 | |
| XGBoost (7 days look back-3 days lookup) | 0.6122 | 0.5386 | 2.5328 | 1.4341 | |
| LSTM (7 days look back-3 days lookup) | 0.5480 | 0.4805 | 2.6318 | 1.2277 | |
| XGBoost (15 days look back-3 days lookup) | 0.6371 | 0.5754 | 2.3931 | 1.5495 | |
| LSTM (15 days look back-3 days lookup) | 0.5470 | 0.4931 | 2.6475 | 1.3904 | |
| XGBoost (30 days look back-3 days lookup) | 0.6542 | 0.6067 | 2.4716 | 1.6104 | |
| LSTM (30 days look back-3 days lookup) | 0.5576 | 0.5046 | 2.8832 | 1.3621 | |
| XGBoost (7 days look back-7 days lookup) | 0.6203 | 0.5450 | 2.5584 | 1.4378 | |
| LSTM (7 days look back-7 days lookup) | 0.5947 | 0.5023 | 2.6342 | 1.3411 | |
| XGBoost (15 days look back-7 days lookup) | 0.6396 | 0.5846 | 2.5653 | 1.5649 | |
| LSTM (15 days look back-7 days lookup) | 0.6018 | 0.5322 | 2.8423 | 1.5316 | |
| XGBoost (30 days look back-7 days lookup) | 0.6548 | 0.6125 | 2.5487 | 1.6158 | |
| LSTM (30 days look back-7 days lookup) | 0.5802 | 0.5106 | 2.9486 | 1.4353 |
Disclaimer/Publisher’s Note: The statements, opinions and data contained in all publications are solely those of the individual author(s) and contributor(s) and not of MDPI and/or the editor(s). MDPI and/or the editor(s) disclaim responsibility for any injury to people or property resulting from any ideas, methods, instructions or products referred to in the content. |
© 2023 by the authors. Licensee MDPI, Basel, Switzerland. This article is an open access article distributed under the terms and conditions of the Creative Commons Attribution (CC BY) license (http://creativecommons.org/licenses/by/4.0/).
Copyright: This open access article is published under a Creative Commons CC BY 4.0 license, which permit the free download, distribution, and reuse, provided that the author and preprint are cited in any reuse.


