Submitted:
08 October 2023
Posted:
09 October 2023
You are already at the latest version
Abstract
The anthropogenic deterioration of aquatic ecosystems affects water resources due to agricultural malpractices, pollution from domestic septic tanks, recreational activities, and poor watershed management, among others. This study examines the management of Las Curias Reservoir (176,974 m2), San Juan, Puerto Rico, post the 2016 arrival of the invasive aquatic fern Salvinia molesta. In December 2019, a community-led initiative introduced the Cyrtobagous salviniae weevil, an effective biological control agent for S. molesta, and commenced a mechanical removal campaign using an aquatic harvester. Limnological sampling (September 2019 to March 2022) and drone flights were employed to measure physicochemical and floating plant cover changes, respectively, in the reservoir. Monitoring of weevils in the reservoir demonstrated a rapid establishment and dispersal, which resulted in visible damage including browning of plants and eventually sinking of entire mats. By January 29, 2021, 71% (125,652 m2) of the reservoir surface was covered by salvinia. In 2022, the reservoir recorded an average dissolved oxygen concentration of 2.38 mg/L -1 (± 0.021, n = 144), the highest in the study period and indicative of ecosystem recovery. After three years of control efforts, dissolved oxygen, pH, and specific conductance returned to levels recorded prior to Salvinia molesta introduction. This ecosystem recovery, a first in Puerto Rico, could be attributed to an early use of mechanical control and a long-term impact of biological control.
Keywords:
biological control
; Cyrtobagous salviniae
; giant salvinia
; gis
; limnology
; water quality
1. Introduction
Altered aquatic ecosystems are prone to invasions of invasive species [1]. For example, the construction of dams and the subsequent urban developments, increase loads of wastewaters to both lentic and lotic ecosystems, causing drastic shifts in trophic structure, food web complexity, and the displacement of natives by invasive species [2,3,4]. Once non-native species become established, important ecosystems services including clean and abundant water, recreation, flood mitigation is soon compromised, and management initiatives are required to recover ecosystem services. Management of non-native species in aquatic ecosystems involves the use mechanical, chemical, or biological controls [5,6]. Of these options, chemical controls are more restricted, particularly in water bodies used for water supply, therefore mechanical and biological controls are normally preferred.
The exotic aquatic fern, Salvinia molesta (Salviniaceae) [7], also known as giant salvinia (hereby after referred to as salvinia), is one of the most invasive aquatic weeds in the United States and globally [8,9]. It is native to southern Brazil, Argentina, and Uruguay but has been introduced in tropical and subtropical areas around the world [10,11]. In 2013, salvinia was listed among the 100 most harmful invasive alien species in the world by the Species Survival Commission (SSC) of the International Union for Conservation of Nature (IUCN) [8]. Salvinia has a rapid growth rate and propagates through fragmentation, thus allowing it to easily disperse and colonize new habitats [12]. Under ideal conditions, the plant has the ability to form extensive layers of vegetation across the surface of lakes, ponds, reservoirs, and swamps [13,14]. The expansion of salvinia in water bodies can limit the growth of native species, and reduce light penetration and dissolved oxygen below the mats, affecting water quality and ecosystem structure and services [15,16,17]. According to [11] rapid rates of nutrient uptake combined with relatively slow rates of decomposition, enable salvinia to tie up nutrients that could be used by other primary producers that contribute to complex food chains.
In 2015, salvinia, initially introduced to Puerto Rico through commercial trade, was detected in the Las Curias reservoir in suburban San Juan, Puerto Rico, and is now spreading to other water bodies [18]. Hurricane Maria in 2017 [19] accelerated the spread of salvinia in Las Curias, probably due to eutrophication after an increase in nutrient-rich sewage discharges associated with septic tanks [20]. By July 2019, salvinia mats completely covered the reservoir limiting all economic and ecological services [20]. Since December 2019, a community-driven strategy, in collaboration with the University of Puerto Rico at Rio Piedras (UPR-RP), Louisiana State University (LSU), and local and federal agencies, was initiated at Las Curias reservoir to develop a management strategy for salvinia. The strategy involved the use of biological and mechanical control methods. The biological control component involved the introduction of the salvinia weevil, Cyrtobagous salviniae [21] a host-specific herbivore that has been released in United States, South Africa, Australia, and Asia [10]. Management of salvinia using the weevil has resulted in successful control of the plant in tropical and subtropical regions globally [12,22]. Due to the massive public outcry in San Juan, managers used mechanical removal with volunteers and eventually the acquisition of an aquatic weed harvester. The use of harvesters is considered a short-term strategy and of limited use due to the ability of salvinia to double its mass in matter of days [22].
The overarching goal of this study was to document the changes in salvinia coverage and physicochemical responses of Las Curias reservoir during the salvinia control project. The specific objectives were to measure the temporal changes in surface coverage by salvinia, quantify the ecological quality of the reservoir, and establish a relationship among water quality and salvinia coverage. Reservoir baseline conditions before the control project showed that complete coverage of salvinia resulted in poor water quality including reduced oxygen levels, lower light penetration, and reduced pH [20]. We predicted that a reduction in salvinia coverage would accelerate the increment of epilimnetic water temperature, dissolved oxygen, pH, and specific conductance, while also enhancing water transparency. Similarly, in regions below the epilimnion, we anticipated a gradual increase in specific conductance, temperature, and pH over time, aligning with the reduction in plant coverage. As far as the biological control agent introduced, we predicted that the tropical climate of this region would allow a rapid population growth of the weevil and subsequent salvinia control. We also predicted that the combined effects of the biological and mechanical controls would speed up the reduction in salvinia coverage in the reservoir.
2. Materials and Methods
2.1. Site description
Las Curias reservoir is in the Cupey ward of San Juan, Puerto Rico (N18.34169; W66.04828). Hydrologically, it is connected to the Rio Piedras Watershed and to the San Juan Bay Estuary as demonstrated in Figure 1. The reservoir has a nominal capacity of ~1,381,000 m3 (maximum of ~1,757,000 m3) and a surface area of 19.2 ha [23]. The population of the Cupey ward is 32,833 people (4,375.7 people per square mile) [24]. The reservoir basin lacks a public sewage collection system, thus septic tanks are used for household wastewater disposal. The drainage basin of the reservoir is approximately 2.85 km2 and land use consists of evergreen forest (43%), grassland (36%), developed (12%), open water (5%), and open space (4%) [23,25]. Mean annual rainfall in the watershed is approximately 1,632 mm, with the rainy season occurring from July to October, and mean annual temperature for San Juan and Río Piedras is 25.9°C and 25.7°C, respectively [26].
Following introduction of the weevils in September 2019, environmental variables were sampled periodically to quantify changes in salvinia cover and quality, weevil density, and water quality through September 2022. In addition to biological control, an aquatic harvester was brought to the reservoir in October 2019 for mechanical extraction of salvinia, thus both the mechanical and biological control efforts occurred simultaneously. The aquatic harvester (2017 Weedoo TC Diesel with Quick-Change Skimmer Bucket) was operated on average for four days per week from arrival until October 2020 when the salvinia mat was too thin to collect. Extracted salvinia was piled near the dam and morning-glory spillway and allowed to sink by its own weight when intertwined with other plants.
2.2. Salvinia performance
Four flights with an unmanned aerial system (hereafter referred to as drone) estimated percent salvinia cover in Las Curias. Flights occurred during July 2019, March 2020, January 2021, and August 2022. The flight plan included two flight lines passing over the study area, north-south direction, and west-east direction. The flight line consisted of 80% photo overlap and 70% flight line overlap at an altitude of about 65 meters. We employed Esri software to transform drone-captured imagery of Las Curias reservoir surface coverage into maps and to produce a detailed representation of the study area. [27,28,29].
To characterize the physical condition of the salvinia, mat thickness and normalized difference vegetative index (NDVI) were sampled. Mat thickness was determined in October 2021 at 15 locations using a plastic tray (0.3 × 0.4 m), with a string, marked in 1 cm increments, attached to the center of the tray. The tray was slid under the salvinia mat, then was lifted to measure the thickness. The percentage green of salvinia was estimated visually by placing a quadrant (0.35 × 0.21 × 0.17 m; [L x W x H]; area = 0.0735 m2) in the mat. The normalized difference vegetative index (NDVI) was determined using a handheld Trimble GreenSeeker® (Trimble Agriculture Company, Sunnyvale, CA, USA). The GreenSeeker was held ~1 m above the mat surface and then swept sideways across the salvinia mat for ~1 m. Feeding damage to salvinia by weevils (present or absent) and the number of buds with damage were also documented.
2.3. Weevil introduction and densities
During September 2019, ~1,000 adult weevils were transported from LSU in Baton Rouge, LA, to the UPR-RP. Upon arrival in the laboratory, weevils were transferred to fresh salvinia collected from Las Curias then transported to the reservoir and placed in a protected area (Figure 1, initial inoculation arm D). Weevils were first released in six floating fine meshed cages filled with salvinia. This was conducted to increase the likelihood of weevils encountering one another and thus increase the probability of reproduction. After two months, browning of salvinia in the cages indicated the presence of larvae. At this time, half of the salvinia in the cages were removed and placed within the mat outside of the cages. Fresh salvinia from the lake was placed back in the cages to promote further reproduction. This was repeated for six months until the cages degraded, and weevils naturally escaped to nearby locations.
In June 2020, weevil establishment was assessed by measuring densities within arm D. In December 2020, weevils had exceeded the density of ~40 adults per kg of wet salvinia recommended for transfer [30,31]. Salvinia infested with weevils was transported from the inoculation site to arms A, B, C, and E (Figure 1). Salvinia samples were collected from the sampling stations on various dates between 2020 and 2022. These samples were used to quantify weevil densities across the different stations and sampling dates. These samples were used to quantify weevil densities across the different stations and sampling dates. The specific sampling dates were 6 June 2020, 7 and 20 December 2020, 17 and 21 May 2021, 10 October 2021, and 18 February 2022. During each monitoring event approximately 500 grams of salvinia were collected near the sampling stations using a dip net. This amount of salvinia was collected to remove as few weevils as possible from the lake while still being able to determine density changes. Samples were placed in resealable plastic bags then transported to the laboratory for Berlese funnel extraction. The wet mass of each salvinia sample was recorded prior to being placed inside the Berlese funnels [32]. Salvinia was placed in the funnels for 48 hours, and escaping adults and larvae were collected in 95% ethanol, then counted.
2.4. Water quality
Physicochemical water quality parameters were collected from two stations during 19 sampling occasions from September 2019 to September 2022 (Figure 1). A Hydrolab MS5 Multiprobe sonde measured specific conductance (µS cm-2), dissolved oxygen (DO; mg L-1), pH (s.u), and temperature (°C) at fixed depths intervals in the water column. The instrument was calibrated before each sampling event to ensure the accuracy of the measurements. Due to a sensor malfunction, no specific conductance data was collected during the December 2020 and March 2021 sampling events. A Secchi disk was used to measure water transparency and to estimate the depth of the photic zone. Additionally, an Onset UA-002-08 HOBO Pendant Data Logger rain gauge was installed to continuously track rainfall over the study period.
2.5. Statistical analysis
To assess the internal reservoir dynamics, physicochemical water quality parameters were analyzed among years within a water column depth zone (epilimnion, thermocline, hypolimnion). The location of the zones was determined by observing in situ variations in specific conductance for each sampling date. While the epilimnion was generally found in the upper two meters and the hypolimnion below six meters with a thermocline in between, for the analyses, we defined the epilimnion zone as 0-2 m depth, the thermocline as 3-5 m, and the hypolimnion as > 5 m. We combined data from both stations for statistical analyses. R and Python statistical software [33,34,35] where used for statistical analyses. Linear models were developed to examine the differences in specific conductance and temperature between depth zones, years, and the interaction of depth zone with year. A linear model was examined for differences in dissolved oxygen in the epilimnion between years, but no statistical analyzes were calculated for the thermocline or hypolimnion due to the overabundance of zero values. A Gamma-distribution, log-link function generalized linear model (GLM) examined for differences in pH between depth zones, years, and the interaction of depth zone with year. Secchi depth from both stations were combined to calculate the mean depth of photic zone as an index of ecosystem recovery.
3. Results
3.1. Salvinia performance
In summer 2019, salvinia covered the entire reservoir at 100% (192,000 m2; Figure 2a and Figure 3a). Aquatic and terrestrial plants such as Rhynchospora holoschoenoides, Mikania sp., Pistia stratiotes, Hydrocotyle sp., colonized the large salvinia mat, growing amongst the floating plant material (Figure 2a). It was not practical to distinguish among plants on the surface, thus we defined any visible coverage as salvinia since it was the base for other plants. In March 2020, biological and mechanical control methods had been in place for approximately six months and salvinia coverage was ~1.2-times less with an estimated coverage of 83% (159,360 m2; Figure 3b). Salvinia coverage was ~2.9-times less in January 2021, to approximately 71% coverage (136,320 m2), with the plant being concentrated in the arms of the reservoir (Figure 3c). As part of the mechanical control strategy, vegetative islands R. holoschoenoides growing on top of decomposing salvinia were pushed to the bottom of station E during summer 2022. Salvinia coverage was further reduced by ~4.9-times to 6% (11,520 m2) in August 2022 (Figure 3d). A field survey in October 2021 showed mean wet weight of salvinia extracted from the quadrant was 165.6 g (± 113.40 [±SE], n = 15), and the mean dry weight was 9.3 g (± 6.87, n = 15). Mat thickness was 1.3 cm (± 0.88, n = 15), mean percent green was 40% (± 25.57, n = 15), and mean NDVI was 0.51 (± 0.05, n = 15). As the percent of open water increased, salvinia sunk decreasing the depth of the sampling station 1 from 19 m in September 2019 to 7 m in September 2021, suggesting a buildup of about 12 meters of biomass on the reservoir bottom.
3.2. Weevil performance
Periodic monitoring of weevil densities was conducted from initial release through July 2022 (Figure 4). In June 2020, initial surveys found that 49 of 189 buds sampled from arm D had visible feeding scars, and mean weevil density was 19.2 (SE = 11.7) adults per kg of wet salvinia. In December 2020, 198 of 1,364 buds inspected between stations B and C showed visible damage, while the overall mean weevil density for the month was 58.1 (SE =19.69). After this date, weevils were transported and released to other arms in the reservoir. Approximately five months after transport, weevils had established at each of the release sites (Figure 4), and mean weevil density across all arms was 43.1 (SE = 14.2). Due to management efforts, salvinia in the reservoir was reduced and the previous weevil sampling locations no longer had floating vegetation. In October 2021, salvinia cover had been reduced to only three arms, and 69 out of 150 inspected buds had weevil damage with a mean density of 68.62SE = 7.87) weevils per kg in the reservoir. By July 2022, only two arms contained salvinia at a mean density of 53 (SE = 19) weevils per kg, and sampling ceased as salvinia cover was < 5%.
3.3. Water quality
Specific conductance differed by depth zones (f = 34.18, df = 2, p < 0.001), years (f = 64.79, df = 3, p < 0.001), and their interaction (f = 4.38, df = 6, p < 0.001; Table 1). In 2019, the epilimnion and hypolimnion specific conductance (178-226 uS cm-1) was about 1.42 times less than in subsequent years (283-344 uS cm-1). The 2021 thermocline specific conductance surpassed the other years by at least 1.10 times. Overall, specific conductance rose from 2019 to 2022, with minor declines after rain events in February and September 2022 (Figure 5a).
Dissolved oxygen (DO) in the epilimnion rose over three years post-management actions (Table 1; Figure 5b). Rain in August 2020 and September 2022 notably reduced DO, whereas February 2022 rain boosted it. Yearly DO variations were significant (f = 11.504, df = 3, p-value < 0.001), with 2022's mean (5.36 mg/L; SE = 0.36) surpassing prior years. From summer 2020, DO penetrated the thermocline, yet 78% of readings were below 1 mg L-1, and all hypolimnion measurements fell beneath this due to decomposing salvinia.
pH rose across all water layers (Table 1; Figure 5c). Depth zone, year, and their interaction influenced pH levels significantly. In 2022, the epilimnion and hypolimnion pH increased by at least 1.12-times and 1.05-times, respectively, from earlier years. Thermocline pH in 2021 was 1.06-times greater than its predecessors, and 1.05-times that in 2022.
Las Curias displayed marked thermal stratification, peaking at a 5-6°C gradient in September 2020 (Figure 5d). This gradient shrank to 1°C during winter (December 2021-January 2022). Significant rainfall, like February 2022's 240 mm in three days (Figure 6), mixed waters, disrupting stratification. Temperature differed based on depth zones, years, and their interplay (Table 1). Epilimnion's 2019 mean temperature was 1.07-times cooler than subsequent years. Thermocline temperatures in 2019 lagged 2020 and 2021 by at least 1.07-times but dropped 1.15-times from 2021 to 2022. 2021 hypolimnion temperatures surged by 1.11-times compared to 2019 or 2020.
As shown in Figure 6, light penetration in the reservoir, as measured by the Secchi depth, generally improved over the study period. This improvement is consistent with the previously discussed reduction in salvinia coverage. In 2019, the average Secchi depth was a mere 0.1 m, but by August 2022, it had increased significantly to a maximum of 2.23 m. Particularly, the Secchi depth exhibited declines after notable rain events, such as those in July 2020 and September 2022. Storm Isaias, which transpired from July 29 to 31, 2020, led to rain accumulations of 152.4to 254 mm [36]. Similarly, Hurricane Fiona, from September 18 to 21, 2022, resulted in rainfalls of 202 to 380 mm [37]. These events likely caused the observed reductions in Secchi depth due to increases in suspended sediment loads.
4. Discussion
The proliferation of invasive species can reduce ecosystem stability via shifting environmental conditions, often displacing native taxa, reducing biodiversity, and requiring costly management efforts to control the invader and restore ecological conditions [36,37,38]. Mitigating effects from invasive species is a daunting task and determining when a system has completely recovered can be challenging as well. Environmental variables may respond unproportionally to control efforts, potentially taking years or decades until natural state conditions return [39,40]. Therefore, knowledge about how different aspects of the environment rebound following control could be beneficial for setting realistic restoration goals [41]. Spatially isolated invasions provide a practical system for tracking the recovery of environmental quality as localized management efforts could be more impactful, and the lack of colonist sources will limit reinvasion following initial control. In this study, we quantified recovery in a tropical lentic ecosystem following the implementation of biological and mechanical control efforts to remove an invasive aquatic species. We found that environmental variables recovered differently and the degree to which variables recovered varied throughout the water column. As we predicted, the warm temperatures and longer growing season of Puerto Rico allowed the weevil to establish, grow, and ultimately control salvinia. This success is similar to biological control programs implemented in tropical and subtropical re-gions of United States, South Africa, Senegal, and
Australia [17,42,43,44,45,46]. The air temperatures of Las Curias fluctuate between 23 and 30°C during winter and summer, respectively; matching near perfect conditions for the weevil’s adult feeding, dispersal (flight and walking), reproduction (mating, oviposition), and larval development [47,48,49,50]. Additionally, anthropogenic, and internal nutrient sources to the reservoir [20,23] most likely resulted in salvinia with a high nitrogen concentration in the buds, which has been known to increase weevil reproduction [47]. We speculate that these factors led to an optimal scenario not only for population growth of weevils but also their rapid dispersal and colonization of salvinia across the entire reservoir (Figure 4). Salvinia damage by the weevil was noticeable at different scales from reduction of NDVI, feeding holes of leaves, yellowing and browning of plants, to sinking of entire floating mats. Our quadrat data on salvinia density showed a drastic reduction in growth rates of the plant following the release of the weevil. This makes us wonder about a weevil density at which there is a point of no recovery of salvinia, or a putatively tipping point where the damage is so severe that salvinia collapsed and sunk. Future studies should aim to understand the relationship among weevil densities, nutrient load, and growth rates of salvinia [17]. Finally, sampling towards the end of the project (2022) revealed that weevils did not extirpate salvinia from the reservoir, but rather weevils and salvinia reached an equilibrium at lower densities. We can speculate that this ideal equilibrium of the salvinia-weevil system could be easily altered by external disturbances, and therefore should be monitored.
Water quality variables were in various stages of recovery following salvinia control. Specific conductance increased following the sinking of salvinia, and the highest values were recorded in the hypolimnion, representing plant decomposition on the lake bottom and probable nutrient release from the sediment [51,52]. Mean specific conductance in the reservoir ranged from 250 – 280 μS cm-2 from 2014 – 2017 [20], and specific conductance in the epilimnion at the end of the study (mean = 291 μS cm-2; SE = 3.85) was near pre-salvinia invasion levels. In the four years prior to salvinia invasion, mean pH in the reservoir ranged from 7.2 - 7.9 [20]. After the control efforts, pH in the epilimnion (mean = 7.73; SE = 0.05) and thermocline (mean = 7.22; SE = 0.04) have returned to pre-invasion conditions, while the hypolimnion remains slightly acidic (mean = 6.96; SE = 0.05), suggesting salvinia plant matter remains on the lake bottom. Salvinia prefers a slightly acidic environment [53] and creates these conditions when covering large portions of the water surface. Mean dissolved oxygen ranged from 4.03 – 6.86 mg L-1 in the years prior to salvinia invasion [20]. By September 2022, dissolved oxygen in the epilimnion returned to pre-invasion levels and was permeating into the thermocline, while the hypolimnion remains anoxic. The recovery of pH and DO in the epilimnion following three years of management efforts displays the resiliency of ecosystems to return to a natural state once the disturbance is removed, however, more time is needed to recover water quality through the entire waterbody. The lack of DO and the acidification of deeper depths creates conditions for sedimentary nutrient release and internal loading of phosphorus [54,55]. Nutrients released from decomposing litter can contribute to future eutrophication and proliferation of aquatic invasives in the reservoir [56].
We predicted that the reduction in salvinia coverage would accelerate the rise in epilimnetic water temperature, dissolved oxygen, pH, and specific conductance, subsequently improving water transparency. This prediction was contextualized by the significant salvinia biomass estimated at 3,449 metric tons in 2019 [20], a substantial portion of which eventually settled at the bottom of the reservoir. By October 2021, data revealed a 20.7 cm reduction in the thickness of the salvinia mat, a 27% decrease in the percent green, and a 0.02 diminution in NDVI, relative to the 2019 measurements [20]. The aftermath of such biomass accumulation impacted the reservoir's oxygen levels, particularly below the epilimnion, where dissolved oxygen was virtually absent, being consumed faster than it could be replenished owing to decomposition processes. This led to a scenario where, due to the rapid oxygen depletion in the hypolimnion, microbial respiration transitioned to anaerobic pathways, fostering redox stratification (i.e., the water column became stratified in terms of the distribution and speciation of redox-sensitive elements) [57,58]. During our observations, dense black mats of decomposing salvinia surfaced after initially sinking, propelled by gas production. It is probable that the salvinia decomposed anaerobically at the bottom, but upon rising to the surface, continued to decompose aerobically. Decomposition of salvinia in anaerobic conditions results in the release of carbon dioxide and methane [59,60]. The input of organic carbon, such as plant matter, to anaerobic sediments significantly augments methane production in reservoirs, turning any system with anoxic conditions and high sedimentation rates into potential methane emitters [61]. Given the volume of sunk biomass and the relatively slow decomposition rate of salvinia tissue, Las Curias could potentially be a source of methane emissions.
The pronounced thermal stratification observed in Las Curias on most sampling dates was atypical for Puerto Rican reservoirs, as indicated by Gustavo Martinez (personal communication) [62]. The warm waters of tropical lakes are less viscous than their temperate counterparts and, therefore, more susceptible to mixing due to winds and surface cooling by rain [63]. Thus, seasonal changes in precipitation and thermal regimes in tropical lakes are important driving factors for stratification and mixing [64,65]. The absence of strong seasonal temperature fluctuations precludes seasonal convective overturn as a mechanism to transport oxygen into the deep waters [66]. Complex vertical profiles were also documented in the La Plata reservoir in Puerto Rico, due to the combination of stratification plus inflow created by the sinking of turbid and oxygenated storm runoff within this tropical reservoir [67]. Mixing patterns through the reservoir are influenced by the depth at which water is released from the dam. Since Las Curias is not used as a municipal water source anymore, vertical mixing is entirely driven by environmental conditions. When a high density of salvinia was present, the hypolimnion appeared at four meters depth having a maximum thickness of 15 meters near the dam. Las Curias was stratified most of the year, with anoxia conditions throughout the hypolimnion. Temperature decreases were observed in the entire water column in December 2020, and February 2022 and September 2022 (Figure 5d), indicating that mixing events occurred in Las Curias when the reservoir had less than 10% biomass cover. Drops in temperature in the water column may be representative of mixing events and the direct effect of controlling and removing salvinia from the water surface.
Our results corroborated our prediction that the combination of mechanical and biological control led to a rapid reduction of salvinia coverage. By late 2020, the weed harvester was no longer needed since the salvinia growth was nil and weevil damage was widespread. Weevil densities were routinely above 40 individuals per kg from December 2020 through the end of the study, suggesting that biological control reached an equilibrium at lower weed densities where additional control measures are no longer needed [68].As salvinia decreased, water quality began to recover with general increases in specific conductance, DO in the epilimnion, pH, water temperature, and light penetration. Tracking the recovery of water quality following salvinia is not well documented in the tropical literature, and this case study provides a great opportunity to quantify recovery after removal. Monitoring should continue to track the recovery of the system and protect against future invasions. To secure the access to salvinia weevils, we recommend establishing populations in other locations in Puerto Rico infested with salvinia. Disturbance events in the reservoir could result in the localized extinction of the weevil, and if salvinia were to recolonize additional weevils could be collected from other release locations. As salvinia coverage decreased, water quality began to recover with general increases in specific conductance, DO in the epilimnion, pH, water temperature, and light penetration. Massive salvinia biomass accumulation on the reservoir bottom, along with internal nutrient loading through organic matter decomposition and sedimentary release, cultivates ideal conditions for the re-invasion of other aquatic plants or the onset of algal blooms. Establishing a long-term monitoring program for Las Curias is critical to track the recovery of the system and protect against future invasions.
Author Contributions
Conceptualization, X.A.G.L., J.R.O.Z., R.D., A.C.J., and C.F.W.; Methodology, X.A.G.L., J.R.O.Z., R.D., A.C.J., and C.F.W.; Software, A.C.J., M.A.R.L., H.A.M.R. (ArcGIS Pro and Drone2Map), X.A.G.L. (ArcGIS Pro, Python, R), and C.F.W. (R); Validation, X.A.G.L., J.R.O.Z., R.D., and C.F.W.; Formal Analysis, X.A.G.L., J.R.O.Z., R.D., A.C.J., and C.F.W.; Investigation, X.A.G.L., J.R.O.Z., R.D., and C.F.W.; Resources, J.R.O.Z., R.D., and A.C.J.; Data Curation, X.A.G.L., C.F.W., M.A.R.L., and H.A.M.R.; Writing—Original Draft Preparation, X.A.G.L.; Writing—Review and Editing, J.R.O.Z., R.D., and C.F.W.; Visualization, X.A.G.L., C.F.W., M.A.R.L., H.A.M.R., and A.C.J.; Supervision, J.R.O.Z., R.D., and A.C.J.; Project Administration, J.R.O.Z., R.D., and A.C.J.; Funding Acquisition, J.R.O.Z., R.D., and A.C.J. All authors have read and agreed to the published version of the manuscript.
Funding
This research was funded by the United States Department of Agriculture, Animal and Plant Health Inspection Service (USDA-APHIS) under grant number P21PPQFO000C542, as well as by the UPR-RP Center for Applied Tropical Ecology (CATEC) through the National Science Foundation, HRD grant number #1736093. The funders had no role in the study design, data collection and analysis, decision to publish, or preparation of the manuscript.
Data Availability Statement
All data is available from the corresponding author upon request.
Acknowledgments
We express our heartfelt gratitude to the dedicated individuals from the UPR-RP. From the Graduate School of Planning, Moisés Abdel-Rahman López and Hernán A. Morales Ramírez provided significant expertise in monitoring the Las Curias biomass through drones and GIS assessment. The Department of Environmental Sciences was notably represented by Taissae Sanchez Medina, Sherliemarie Nieves Chevere, Alondra D. Carrion Selles, Julian Collazo Fillafañe, and Marylene Fox, all of whom made invaluable fieldwork and laboratory contributions. Special acknowledgment goes to Professor Emeritus Dr. Jess K. Zimmerman, also from the Department of Environmental Sciences, for his valued insights and mentorship throughout the manuscript preparation process. We also thank Professor Dr. Gustavo Martinez and the UPR-RP Agricultural Experimental Station team for their collaboration and insights. Beyond UPR-RP, we are grateful for the support from the LSU research assistants, including Giovana Matos Franco, Leslie Aviles, Carlos Wiggins, Matthew Berry, and Korey Pham, who played pivotal roles in weevil rearing and monitoring. Finally, our thanks are directed to Wanda García from the Department of Natural and Environmental Resources of Puerto Rico. We also appreciate Manuel Godinez, Luis Crespo, and the members of the Las Curias community for their unwavering support, ensuring aquatic transportation and access to reservoir areas for research purposes.
Conflicts of Interest
The authors declare no conflict of interest. The funders had no role in the design of the study; in the collection, analyses, or interpretation of data; in the writing of the manuscript; or in the decision to publish the results.
References
- Johnson, P.T.; Olden, J.D.; Zanden, M.J.V. Dam invaders: impoundments facilitate biological invasions into freshwaters. Front. Ecol. Environ. 2008, 6, 357–363. [Google Scholar] [CrossRef]
- Havel, J.E.; Lee, C.E.; Vander Zanden, M.J. Do Reservoirs Facilitate Invasions into Landscapes? BioScience 2005, 55(6), 518–525. [Google Scholar] [CrossRef]
- Havel, J.E.; Kovalenko, K.E.; Thomaz, S.M.; Amalfitano, S.; Kats, L.B. Aquatic invasive species: challenges for the future. Hydrobiologia 2015, 750, 147–170. [Google Scholar] [CrossRef] [PubMed]
- Zhu, B.; Fitzgerald, D.G.; Mayer, C.M.; Rudstam, L.G.; Mills, E.L. Alteration of Ecosystem Function by Zebra Mussels in Oneida Lake: Impacts on Submerged Macrophytes. Ecosystems 2006, 9, 1017–1028. [Google Scholar] [CrossRef]
- Tasker, A. V. USDA Demonstration Project: Giant Salvinia (Toledo Bend Reservoir and Surrounding Areas in Louisiana and Eastern Texas. Environmental Assessment, 01); U.S. Department of Agriculture, 2001. 20 March.
- Jayan, P. R.; Sathyanathan, N. Aquatic Weed Classification, Environmental Effects and the Management Technologies for Its Effective Control in Kerala, India. International Journal of Agricultural and Biological Engineering 2012, 5(1), 76–91. [Google Scholar]
- Mitchell, D.S. The Kariba Weed: Salvinia Molesta. Brittonia 1972, 24(3), 228–231. [Google Scholar]
- Luque, G.M.; Bellard, C.; Bertelsmeier, C.; Bonnaud, E.; Genovesi, P.; Simberloff, D.; Courchamp, F. The 100th of the world’s worst invasive alien species. Biol. Invasions 2013, 16, 981–985. [Google Scholar] [CrossRef]
- Díaz, R. ; Johnson, S; Mudge, C; Russell, A. The Biology and Ecology of the Salvinia Weevil: A Biological Control Agent for the Management of Giant Salvinia.; 3474; Louisiana State University Agricultural Center, 2015.
- Forno, I.; Harley, K. The occurrence of Salvinia molesta in Brazil. Aquat. Bot. 1979, 6, 185–187. [Google Scholar] [CrossRef]
- McFarland, D. G.; Nelson, L. S.; Grodowitz, M. J.; Smart, R. M.; Owens, C. S. Salvinia Molesta D. S. Mitchell (Giant Salvinia) in the United States: A Review of Species Ecology and Approaches to Management.; ERDC/EL SR-04-2; U.S. Army Engineer Research and Development Center, Environmental Laboratory; Lewisville Aquatic Ecosystem Research Facility, 2004; p 40.
- Julien, M.H.; Hill, M.P.; Tipping, P.W. Salvinia Molesta DS Mitchell (Salviniaceae). In Weed biological control with arthropods in the tropics.; Muniappan, R., Ed.; Cambridge University Press: Cambridge, 2009. [Google Scholar]
- Finlayson, C. Growth rates of Salvinia molesta in Lake Moondarra, Mount Isa, Australia. Aquat. Bot. 1984, 18, 257–262. [Google Scholar] [CrossRef]
- Room, P.M.; Thomas, P.A. Nitrogen, Phosphorus and Potassium in Salvinia Molesta Mitchell in the Field: Effects of Weather, Insect Damage, Fertilizers and Age. Aquatic Botany 1986, 1, 213–232. [Google Scholar] [CrossRef]
- Motitsoe, S.N.; Coetzee, J.A.; Hill, J.M.; Hill, M.P. Biological Control of Salvinia molesta (D.S. Mitchell) Drives Aquatic Ecosystem Recovery. Diversity 2020, 12, 204. [Google Scholar] [CrossRef]
- Wahl, C.; Kaller, M.; Diaz, R. Invasion of floating fern alters freshwater macroinvertebrate community structure with implications for bottom-up processes. Hydrobiologia 2021, 848, 2523–2537. [Google Scholar] [CrossRef]
- Woodley, S.E.; Wahl, C. F.; Tryforos, A.; Díaz, R. Biological Control of Invasive Floating Fern Leads to Rapid Recovery of Ecological Functions in Coastal Freshwater Wetlands in Louisiana. Journal of Aquatic Plant Management 2023, 61. [Google Scholar]
- Thayer, D.D.; Pfingsten, I.A.; Jacono, C.C.; Richerson, M.M.; Howard, V. Salvinia Molesta Mitchell: U.S. Geological Survey, Nonindigenous Aquatic Species Database.; U.S. Geological Survey (USGS): Gainesville, FL, 2018. [Google Scholar]
- Pasch, R. J.; Penny, A. B.; Berg, R. National Hurricane Center Tropical Cyclone Report: Hurricane Maria (AL152017), 16-; National Oceanic And Atmospheric Administration and the National Weather Service, 2023; pp 1–48. https://www.nhc.noaa.gov/data/tcr/AL152017_Maria.pdf. 30 September.
- Wahl, C.; Diaz, R.; Ortiz-Zayas, J. Assessing Salvinia molesta impact on environmental conditions in an urban lake: case study of Lago Las Curias, Puerto Rico. Aquat. Invasions 2020, 15, 562–577. [Google Scholar] [CrossRef]
- Calder, A.A.; Sands, D.P.A. A NEW BRAZILIAN CYRTOBAGOUS HUSTACHE (COLEOPTERA: CURCULIONIDAE) INTRODUCED INTO AUSTRALIA TO CONTROL SALVINIA. Aust. J. Èntomol. 1985, 24, 57–64. [Google Scholar] [CrossRef]
- Coetzee, J.A.; Hill, M.P. Salvinia molesta D. Mitch. (Salviniaceae): impact and control. CAB Rev. Perspect. Agric. Veter- Sci. Nutr. Nat. Resour. [CrossRef]
- Tetra Tech. Las Curias Reservoir Lake Watershed Characterization.; Fairfax, VA, 2018; p 22.
- U.S. Census Bureau. American Community Survey 5-Year Estimates. Retrieved from Census Reporter Profile Page for Cupey Barrio, San Juan Municipio, PR; U.S. Census Bureau. 2021. Available online: https://censusreporter.org/profiles/06000US7212722847-cupey-barrio-san-juan-municipio-pr/ (accessed on 3 March 2023).
- Department of Natural and Environmental Resources (DRNA). Puerto Rico Water Resources Inventory.; Water Plan Office, Puerto Rico: Department of Natural and Environmental Resources (DRNA), 2004. [Google Scholar]
- Lugo, A. E.; Ramos, O.; Rodriguez, C. The Río Piedras Watershed and Its Surrounding Environment.; US Department of Agriculture, Forest Service, International Institute of Tropical Forestry, 2011; p 46.
- ArcGIS Pro, 2020. https://www.esri.com/arcgis-blog/products/arcgis-pro/announcements/whats-new-in-arcgis-pro-2-5/.
- ArcGIS Pro, 2022.
- Drone2Map, 2021. https://www.esri.com/en-us/arcgis/products/arcgis-drone2map/overview?rmedium=www_esri_com_EtoF&rsource=https%3A%2F%2Fwww.esri.com%2Fen-us%2Farcgis%2Fproducts%2Fdrone2map%2Foverview.
- Ireland, P.; Knutson, A.; Gregory, L. Rearing the Salvinia Weevil in Outdoor Tanks at Caddo Lake, Texas. In A guide to mass rearing the salvinia weevil for biological control of giant salvinia.; Knutson, A., Nachtrieb, J., Eds.; Texas A&M AgriLife Extension Service, Special Publication ESP-475, 2012; pp 25–36.
- Wahl, C.F.; Diaz, R. Winter and spring conditions determine the production of the salvinia weevil mass rearing programme. Biocontrol Sci. Technol. 2020, 30, 569–580. [Google Scholar] [CrossRef]
- Nachtrieb, J.G. Rearing the Salvinia Weevil for Biological Control of Giant Salvinia at the U.S. Army Corps of Engineers Lewisville Aquatic Ecosystem Research Facility. In A guide to mass rearing the Salvinia weevil for biological control of giant Salvinia.; Knutson, A., Nachtrieb, J., Eds.; Texas A&M AgriLife Extension Service, Special Publication, 2012; pp 13–24.
- R Core Team. R: A Language and Environment for Statistical Computing., 2023.
- R Core Team. R, 2023. https://www.r-project.org/.
- Python, 2023. https://www.python.org/downloads/release/python-31012/.
- Crooks, J.A. Characterizing ecosystem-level consequences of biological invasions: the role of ecosystem engineers. Oikos 2002, 97, 153–166. [Google Scholar] [CrossRef]
- Bozec, Y.; Alvarez-Filip, L.; Mumby, P.J. The dynamics of architectural complexity on coral reefs under climate change. Glob. Chang. Biol. 2014, 21, 223–235. [Google Scholar] [CrossRef]
- Linders, T.E.W.; Schaffner, U.; Eschen, R.; Abebe, A.; Choge, S.K.; Nigatu, L.; Mbaabu, P.R.; Shiferaw, H.; Allan, E. Direct and indirect effects of invasive species: Biodiversity loss is a major mechanism by which an invasive tree affects ecosystem functioning. J. Ecol. 2019, 107, 2660–2672. [Google Scholar] [CrossRef]
- Jones, H.P.; Schmitz, O.J. Rapid Recovery of Damaged Ecosystems. PLOS ONE 2009, 4, e5653. [Google Scholar] [CrossRef]
- Tanentzap, A.J.; Burrows, L.E.; Lee, W.G.; Nugent, G.; Maxwell, J.M.; Coomes, D.A. Landscape-level vegetation recovery from herbivory: progress after four decades of invasive red deer control. J. Appl. Ecol. 2009, 46, 1064–1072. [Google Scholar] [CrossRef]
- Prior, K.M.; Adams, D.C.; Klepzig, K.D.; Hulcr, J. When does invasive species removal lead to ecological recovery? Implications for management success. Biol. Invasions 2018, 20, 267–283. [Google Scholar] [CrossRef]
- Martin, G.; Coetzee, J.; Weyl, P.; Parkinson, M.; Hill, M. Biological control of Salvinia molesta in South Africa revisited. Biol. Control. 2018, 125, 74–80. [Google Scholar] [CrossRef]
- Pieterse, A. H.; Kettunen, M.; Diouf, S.; Ndao, I.; Sarr, K.; Tarvainen, A.; Hellsten, S. Effective Biological Control of Salvinia Molesta in the Senegal River by Means of the Weevil Cyrtobagous Salviniae. AMBIO: A Journal of the Human Environment 2003, 32 (7), 458–462.
- Sullivan, P.R.; Postle, L.A.; Julien, M. Biological control of Salvinia molesta by Cyrtobagous salviniae in temperate Australia. Biol. Control. 2011, 57, 222–228. [Google Scholar] [CrossRef]
- Room, P.M.; Harley, K.L.S.; Forno, T.W.; Sands, D.P.A. Successful Biological Control of the Floating Weed Salvinia. Nature 1981, 294, 78–80. [Google Scholar] [CrossRef]
- Tipping, P.W.; Martin, M.R.; Center, T.D.; Davern, T.M. Suppression of Salvinia molesta Mitchell in Texas and Louisiana by Cyrtobagous salviniae Calder and Sands. Aquat. Bot. 2008, 88, 196–202. [Google Scholar] [CrossRef]
- Forno, I.W.; Sands, D.P.A.; Sexton, W. Distribution, biology and host specificity of Cyrtobagous singularis Hustache (Coleoptera: Curculionidae) for the biological control of Salvinia molesta. Bull. Èntomol. Res. 1983, 73, 85–95. [Google Scholar] [CrossRef]
- Micinski, S.; Fitzpatrick, B.J.; Ferro, M.L.; Johnson, S.J.; Johnson, B.; Williams, S. Flight Activity of Cyrtobagous Salvinia Calder and Sands in Louisiana. Southwestern Entomologist 2016, 41(2), 313–320. [Google Scholar] [CrossRef]
- Sands, D.P.A.; Schotz, M.; Bourne, A.S. THE FEEDING CHARACTERISTICS AND DEVELOPMENT OF LARVAE OF A SALVINIA WEEVIL CYRTOBAGOUS SP. Èntomol. Exp. et Appl. 1983, 34, 291–296. [Google Scholar] [CrossRef]
- Wahl, C.; Diaz, R.; Kaller, M. Optimising Berlese funnel extraction for population estimates of adult Cyrtobagous salviniae from Salvinia molesta. Biocontrol Sci. Technol. 2022, 32, 1–16. [Google Scholar] [CrossRef]
- Masifwa, WF.; Okello, W.; Ochieng, H.; Ganda, E. Phosphorus Release from Decomposing Water Hyacinth and Effects of Decomposition on Water Quality. Uganda Journal of Agricultural Sciences 2004, 9, 389–395. [Google Scholar]
- Wu, Y.; Wen, Y.; Zhou, J.; Wu, Y. Phosphorus release from lake sediments: Effects of pH, temperature and dissolved oxygen. KSCE J. Civ. Eng. 2013, 18, 323–329. [Google Scholar] [CrossRef]
- Cary, P.R.; Weerts, P.G. Growth of Salvinia molesta as affected by water temperature and nutrition. III. Nitrogen-phosphorus interactions and effect of pH. Aquat. Bot. 1984, 19, 171–182. [Google Scholar] [CrossRef]
- Hupfer, M.; Lewandowski, J. Oxygen Controls the Phosphorus Release from Lake Sediments–a Long-lasting Paradigm in Limnology. International Review of Hydrobiology 2008, 93 (4–5), 415–432. [CrossRef]
- Sondergaard, M.; Jensen, P.J.; Jeppesen, E. Retention and Internal Loading of Phosphorus in Shallow, Eutrophic Lakes. Sci. World J. 2001, 1, 427–442. [Google Scholar] [CrossRef] [PubMed]
- Frodge, J.D.; Thomas, G.L.; Pauley, G.B. Sediment Phosphorus Loading Beneath Dense Canopies of Aquatic Macrophytes. Lake Reserv. Manag. 1991, 7, 61–71. [Google Scholar] [CrossRef]
- Hutchinson, G. E. A Treatise on Limnology: Geography, Physics and Chemistry.; Wiley, 1957.
- Buffle, J.; Stumm, W. General Chemistry of Aquatic Systems. In Chemical and Biological Regulation of Aquatic Systems; Buffle, J., De Vitre, R.R., Eds.; CRC, 1994; pp 1–42.
- Bianchini, I.; da Cunha-Santino, M.B. CH4 and CO2 from Decomposition of Salvinia auriculata Aublet, a Macrophyte with High Invasive Potential. Wetlands 2016, 36, 557–564. [Google Scholar] [CrossRef]
- O'Sullivan, C.; Rounsefell, B.; Grinham, A.; Clarke, W.; Udy, J. Anaerobic digestion of harvested aquatic weeds: water hyacinth (Eichhornia crassipes), cabomba (Cabomba Caroliniana) and salvinia (Salvinia molesta). Ecol. Eng. 2010, 36, 1459–1468. [Google Scholar] [CrossRef]
- Grasset, C.; Mendonça, R.; Saucedo, G.V.; Bastviken, D.; Roland, F.; Sobek, S. Large but variable methane production in anoxic freshwater sediment upon addition of allochthonous and autochthonous organic matter. Limnol. Oceanogr. 2018, 63, 1488–1501. [Google Scholar] [CrossRef]
- Quiñones-Márquez, F. Limnology of Lago Loiza, Puerto Rico; U.S. Geological Survey (USGS), 1980; Vol. 79.
- Lewis Jr, W. M. The Thermal Regime of Lake Lanao (Philippines) and Its Theoretical Implications for Tropical Lakes 1. Limnology and Oceanography 1973, 18(2), 200–217. [Google Scholar] [CrossRef]
- Lewis Jr, W. M. Temperature, Heat, and Mixing in Lake Valencia, Venezuela. Limnology and Oceanography 1983, 28(2), 273–286. [Google Scholar] [CrossRef]
- MacIntyre, S.; Melack, J.M. Vertical and Horizontal Transport in Lakes: Linking Littoral, Benthic, and Pelagic Habitats. J. North Am. Benthol. Soc. 1995, 14, 599–615. [Google Scholar] [CrossRef]
- Crowe, S.A.; O’neill, A.H.; Katsev, S.; Hehanussa, P.; Haffner, G.D.; Sundby, B.; Mucci, A.; Fowle, D.A. The biogeochemistry of tropical lakes: A case study from Lake Matano, Indonesia. Limnol. Oceanogr. 2008, 53, 319–331. [Google Scholar] [CrossRef]
- Fan, J.; Morris, G. L. Reservoir Sedimentation Handbook: Design and Management of Dams, Reservoirs, and Watersheds for Sustainable Use; McGraw-Hill, 1998.
- Briese, D.T. Classical Biological Control. In Australian weed management systems; 2000; Vol. 2, pp 161-192.
Figure 1.
This hierarchical map illustrates the Las Curias Reservoir situated in Cupey, San Juan, Puerto Rico, encompassed by distinct geographical contexts: the island of Puerto Rico, the Río Piedras, and the Las Curias Watershed. The focused view highlights the designated weevil release sites and water quality stations within the limits of the reservoir.
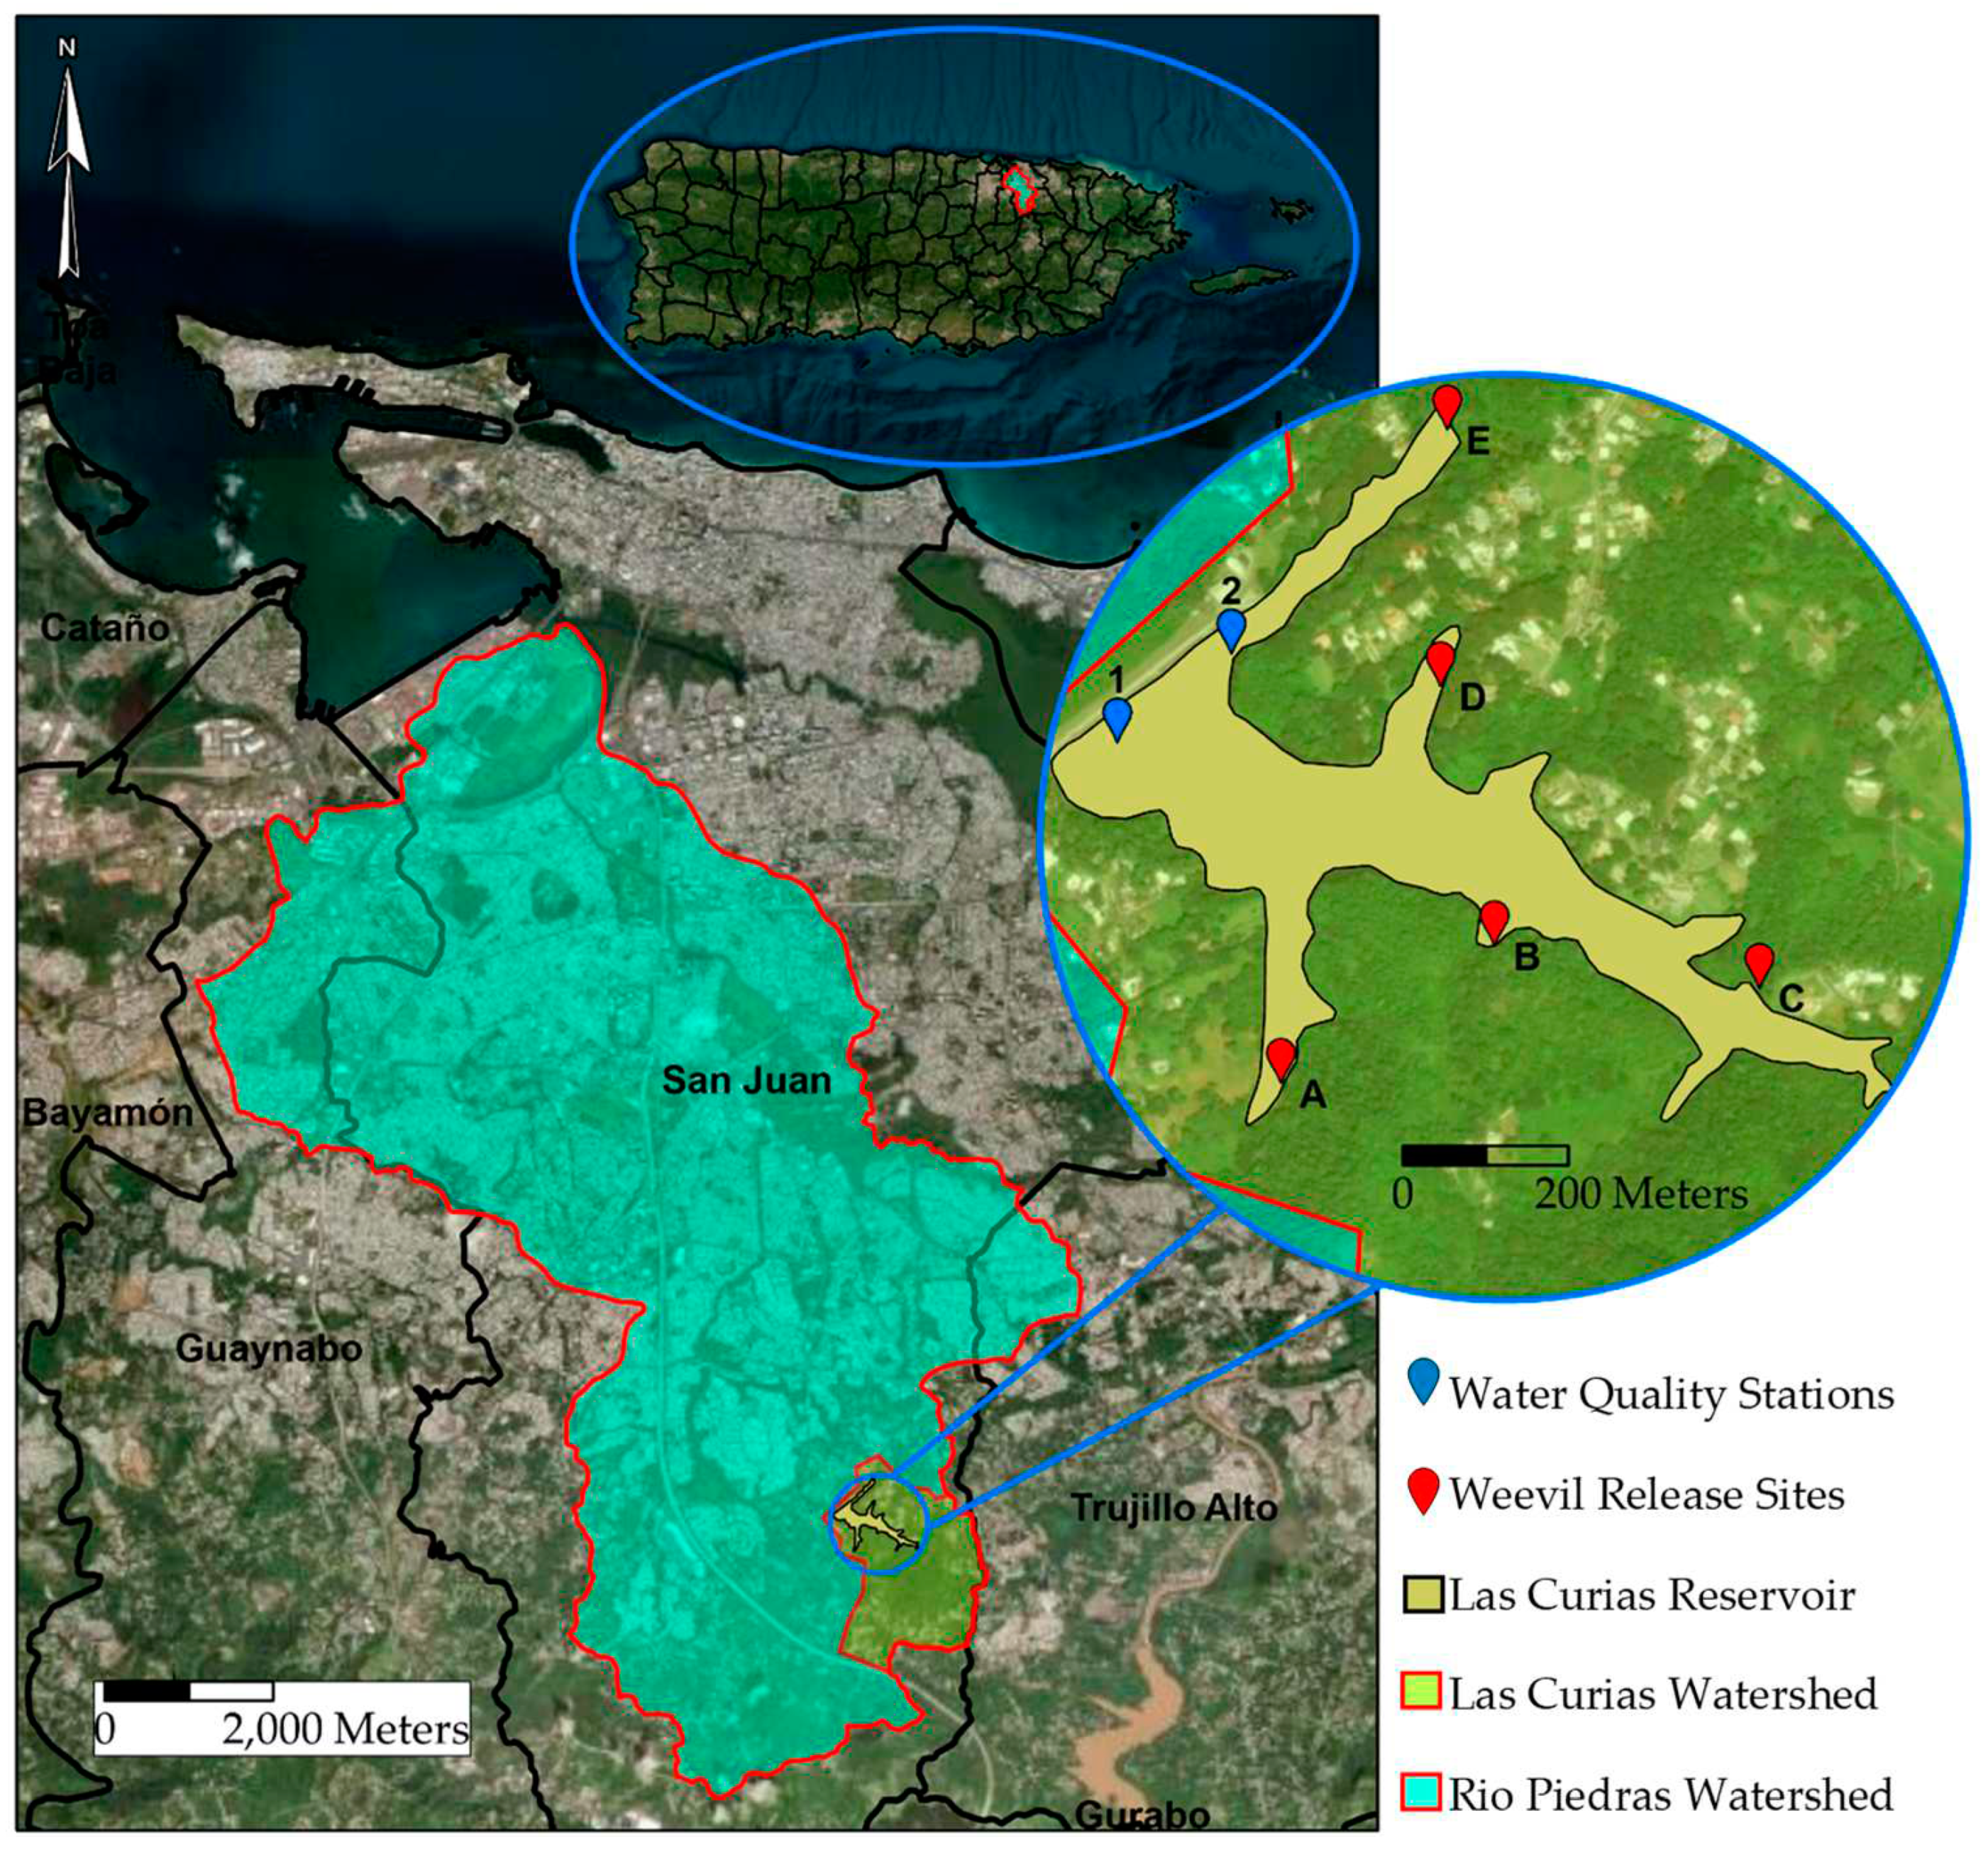
Figure 2.
Aerial imagery captured by drone reveals the variations in plant coverage within Las Curias Reservoir, Puerto Rico, between September 2019 (A, above) and October 2021 (B, below). These comparative visuals underline the evolution of vegetative cover, providing a distinct perspective on the salvinia removal efforts over the study period.
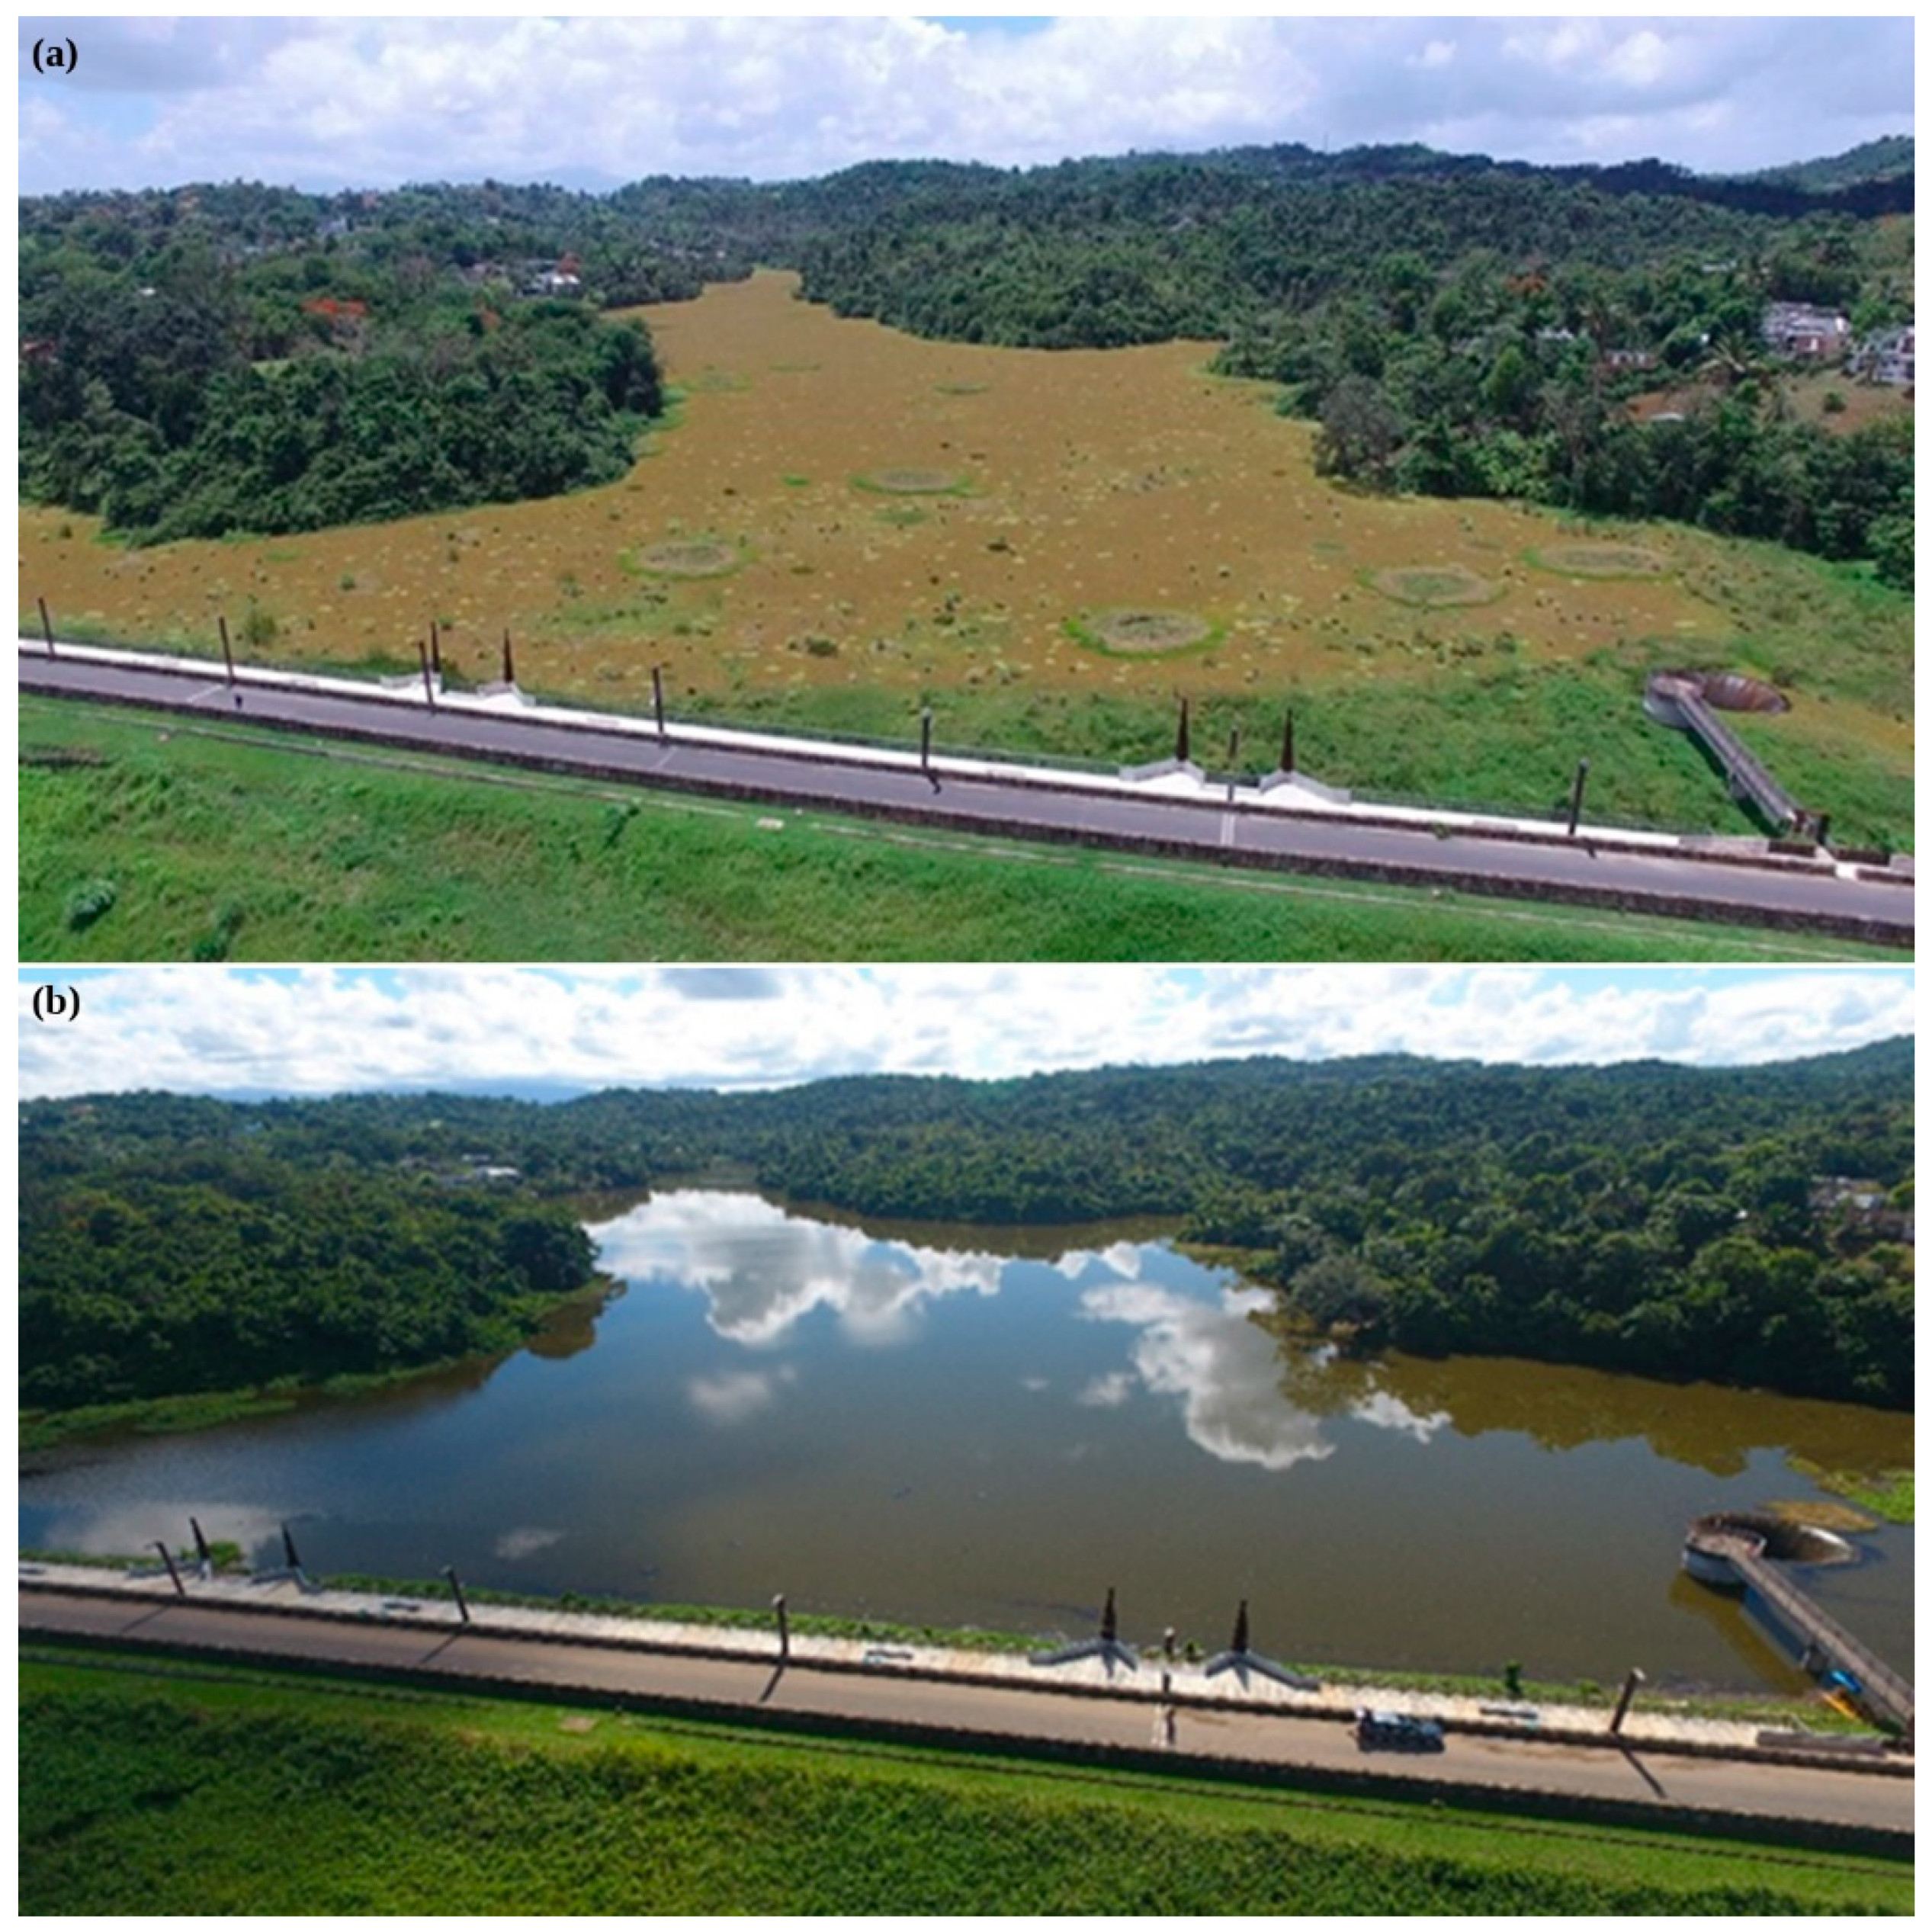
Figure 3.
Evolution of salvinia biomass coverage in Las Curias Reservoir, depicted through maps from July 2019 (baseline), March 2020, January 2021, and August 2022. Green areas represent biomass percentages, while blue indicates water free of biomass.
Figure 3.
Evolution of salvinia biomass coverage in Las Curias Reservoir, depicted through maps from July 2019 (baseline), March 2020, January 2021, and August 2022. Green areas represent biomass percentages, while blue indicates water free of biomass.
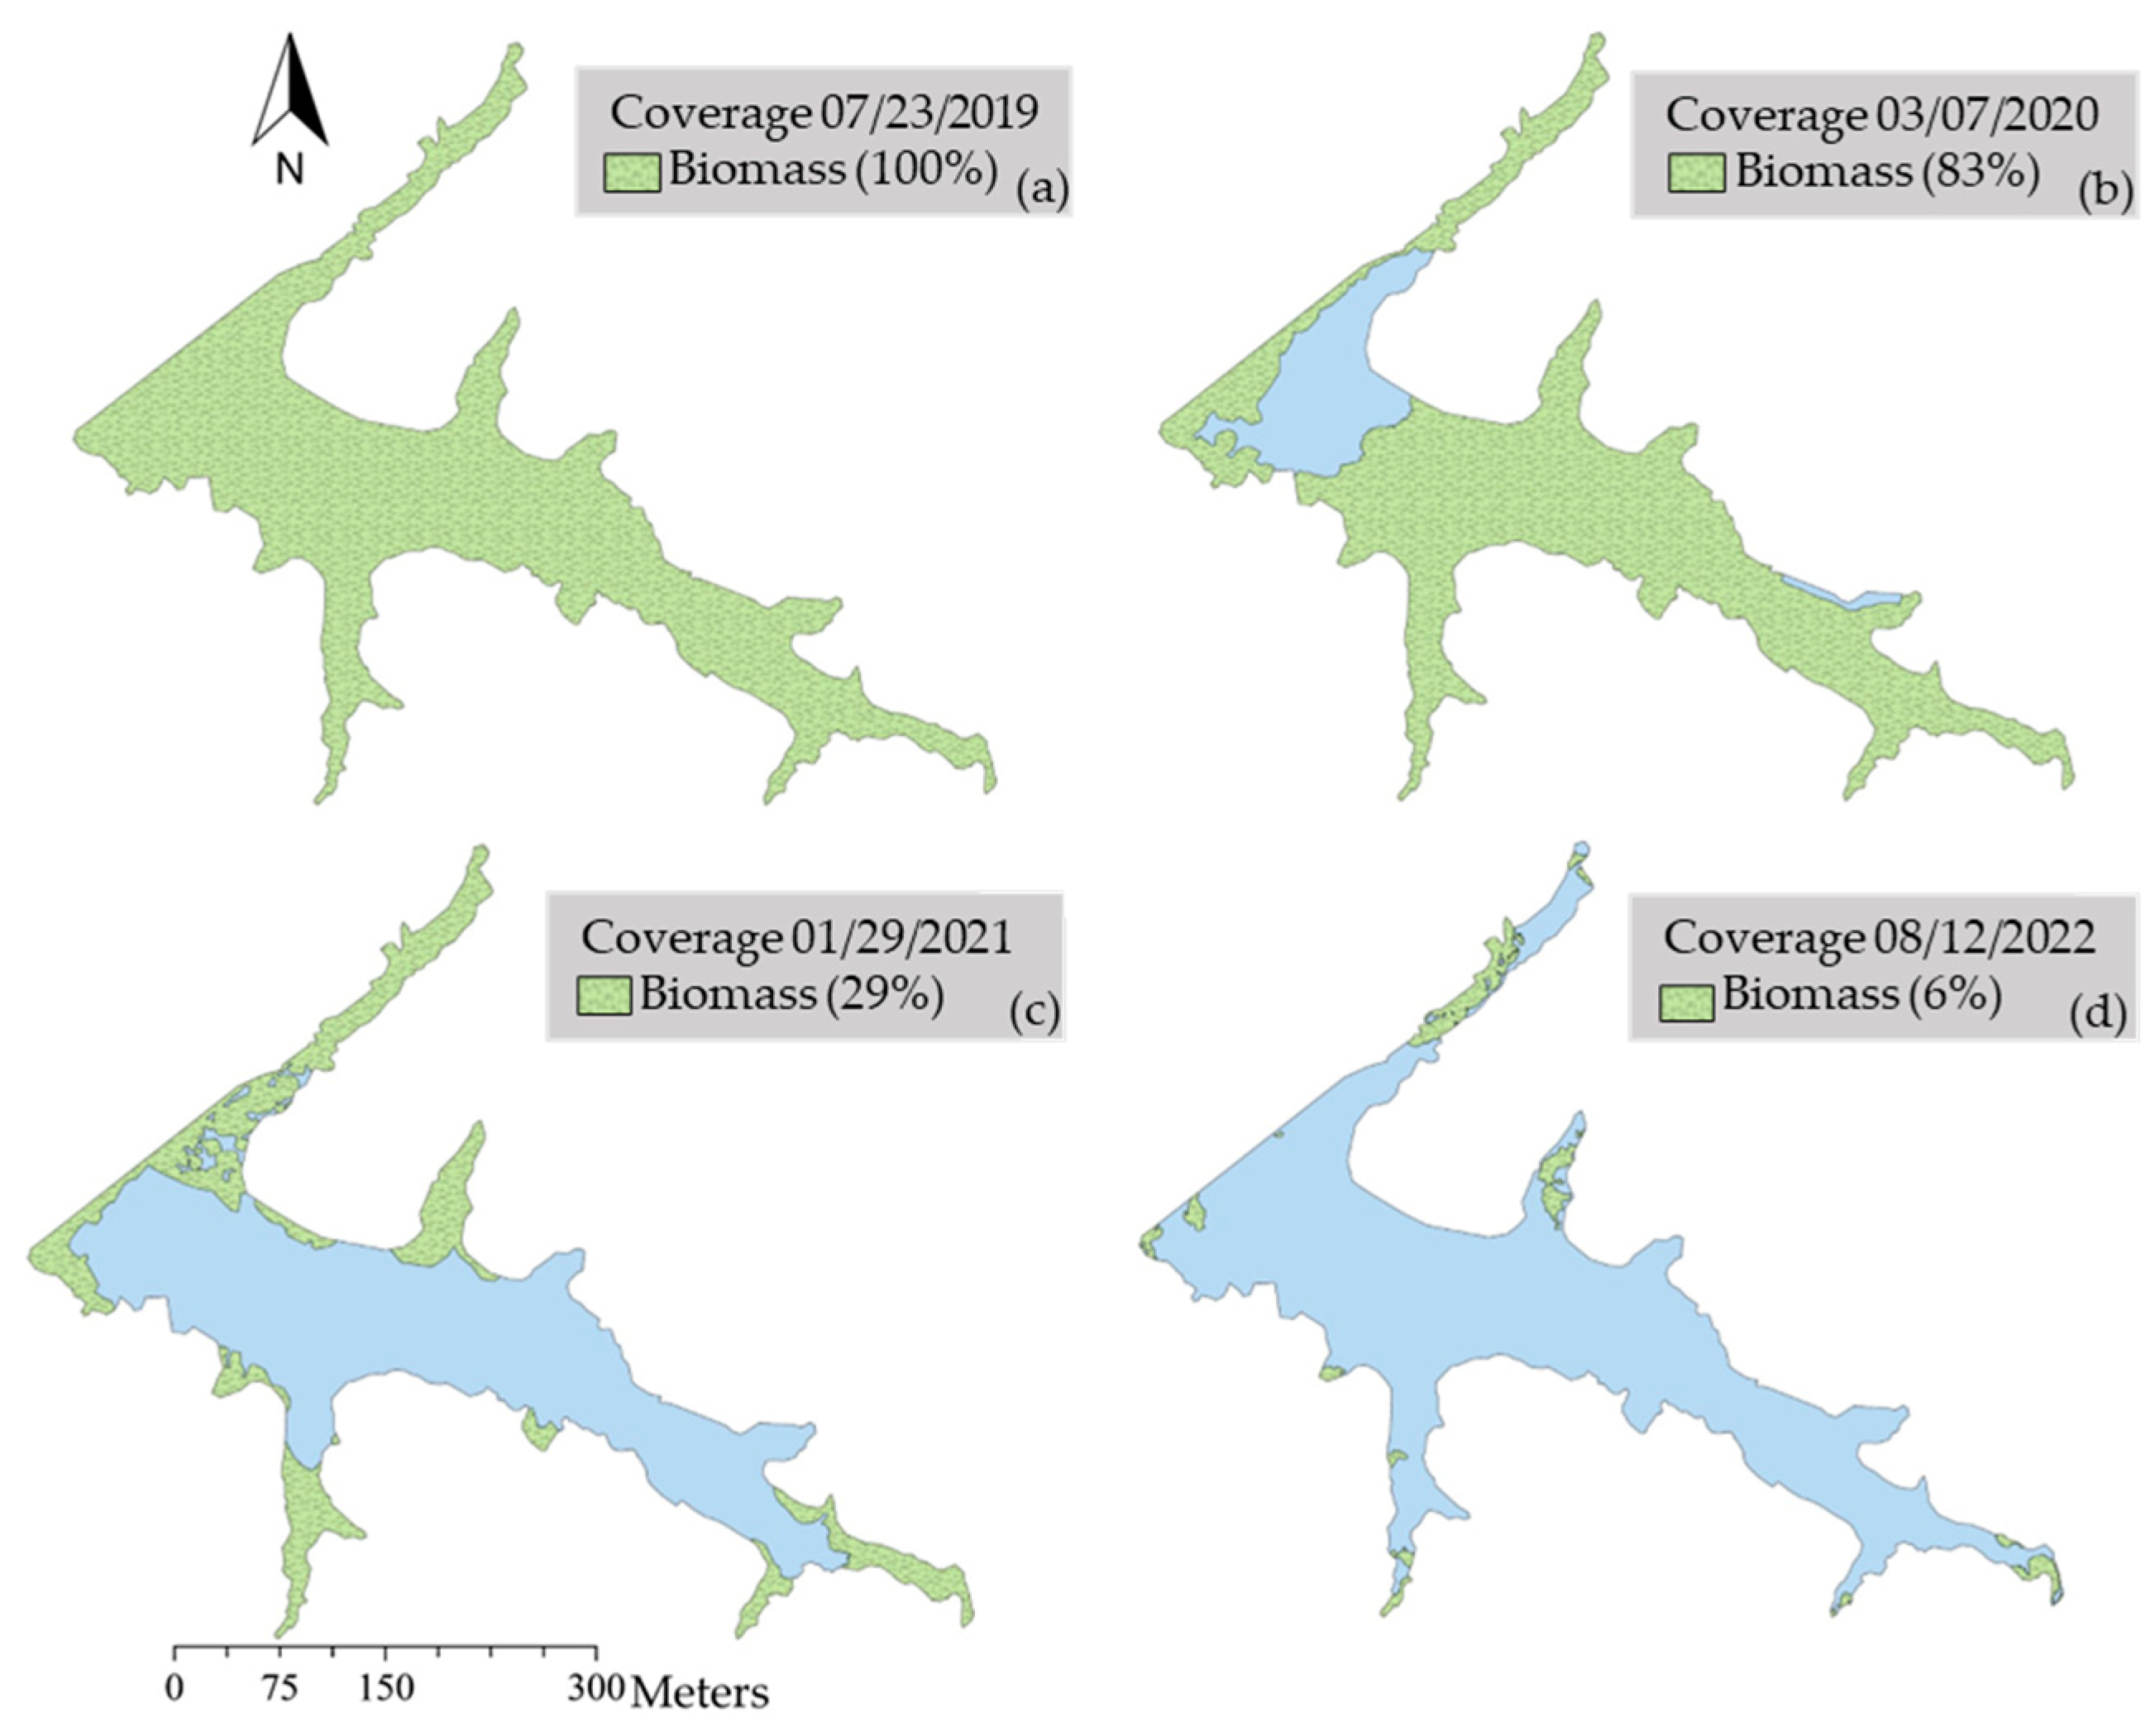
Figure 4.
Depiction of C. salviniae (weevil) adult and larval densities along with salvinia coverage in Las Curias Reservoir from July 2019 through August 2022. The graph presents specific months where drone flights and weevil density monitoring were conducted. The gray scatter plot line donates salvinia surface coverage. Solid colored bars represent mean densities of C. salviniae adults per kg of wet salvinia across stations, while solid bars with dots represent the same for larvae. Whiskers indicate the associated standard error. A softly outlined rectangle group data collected within the same month.
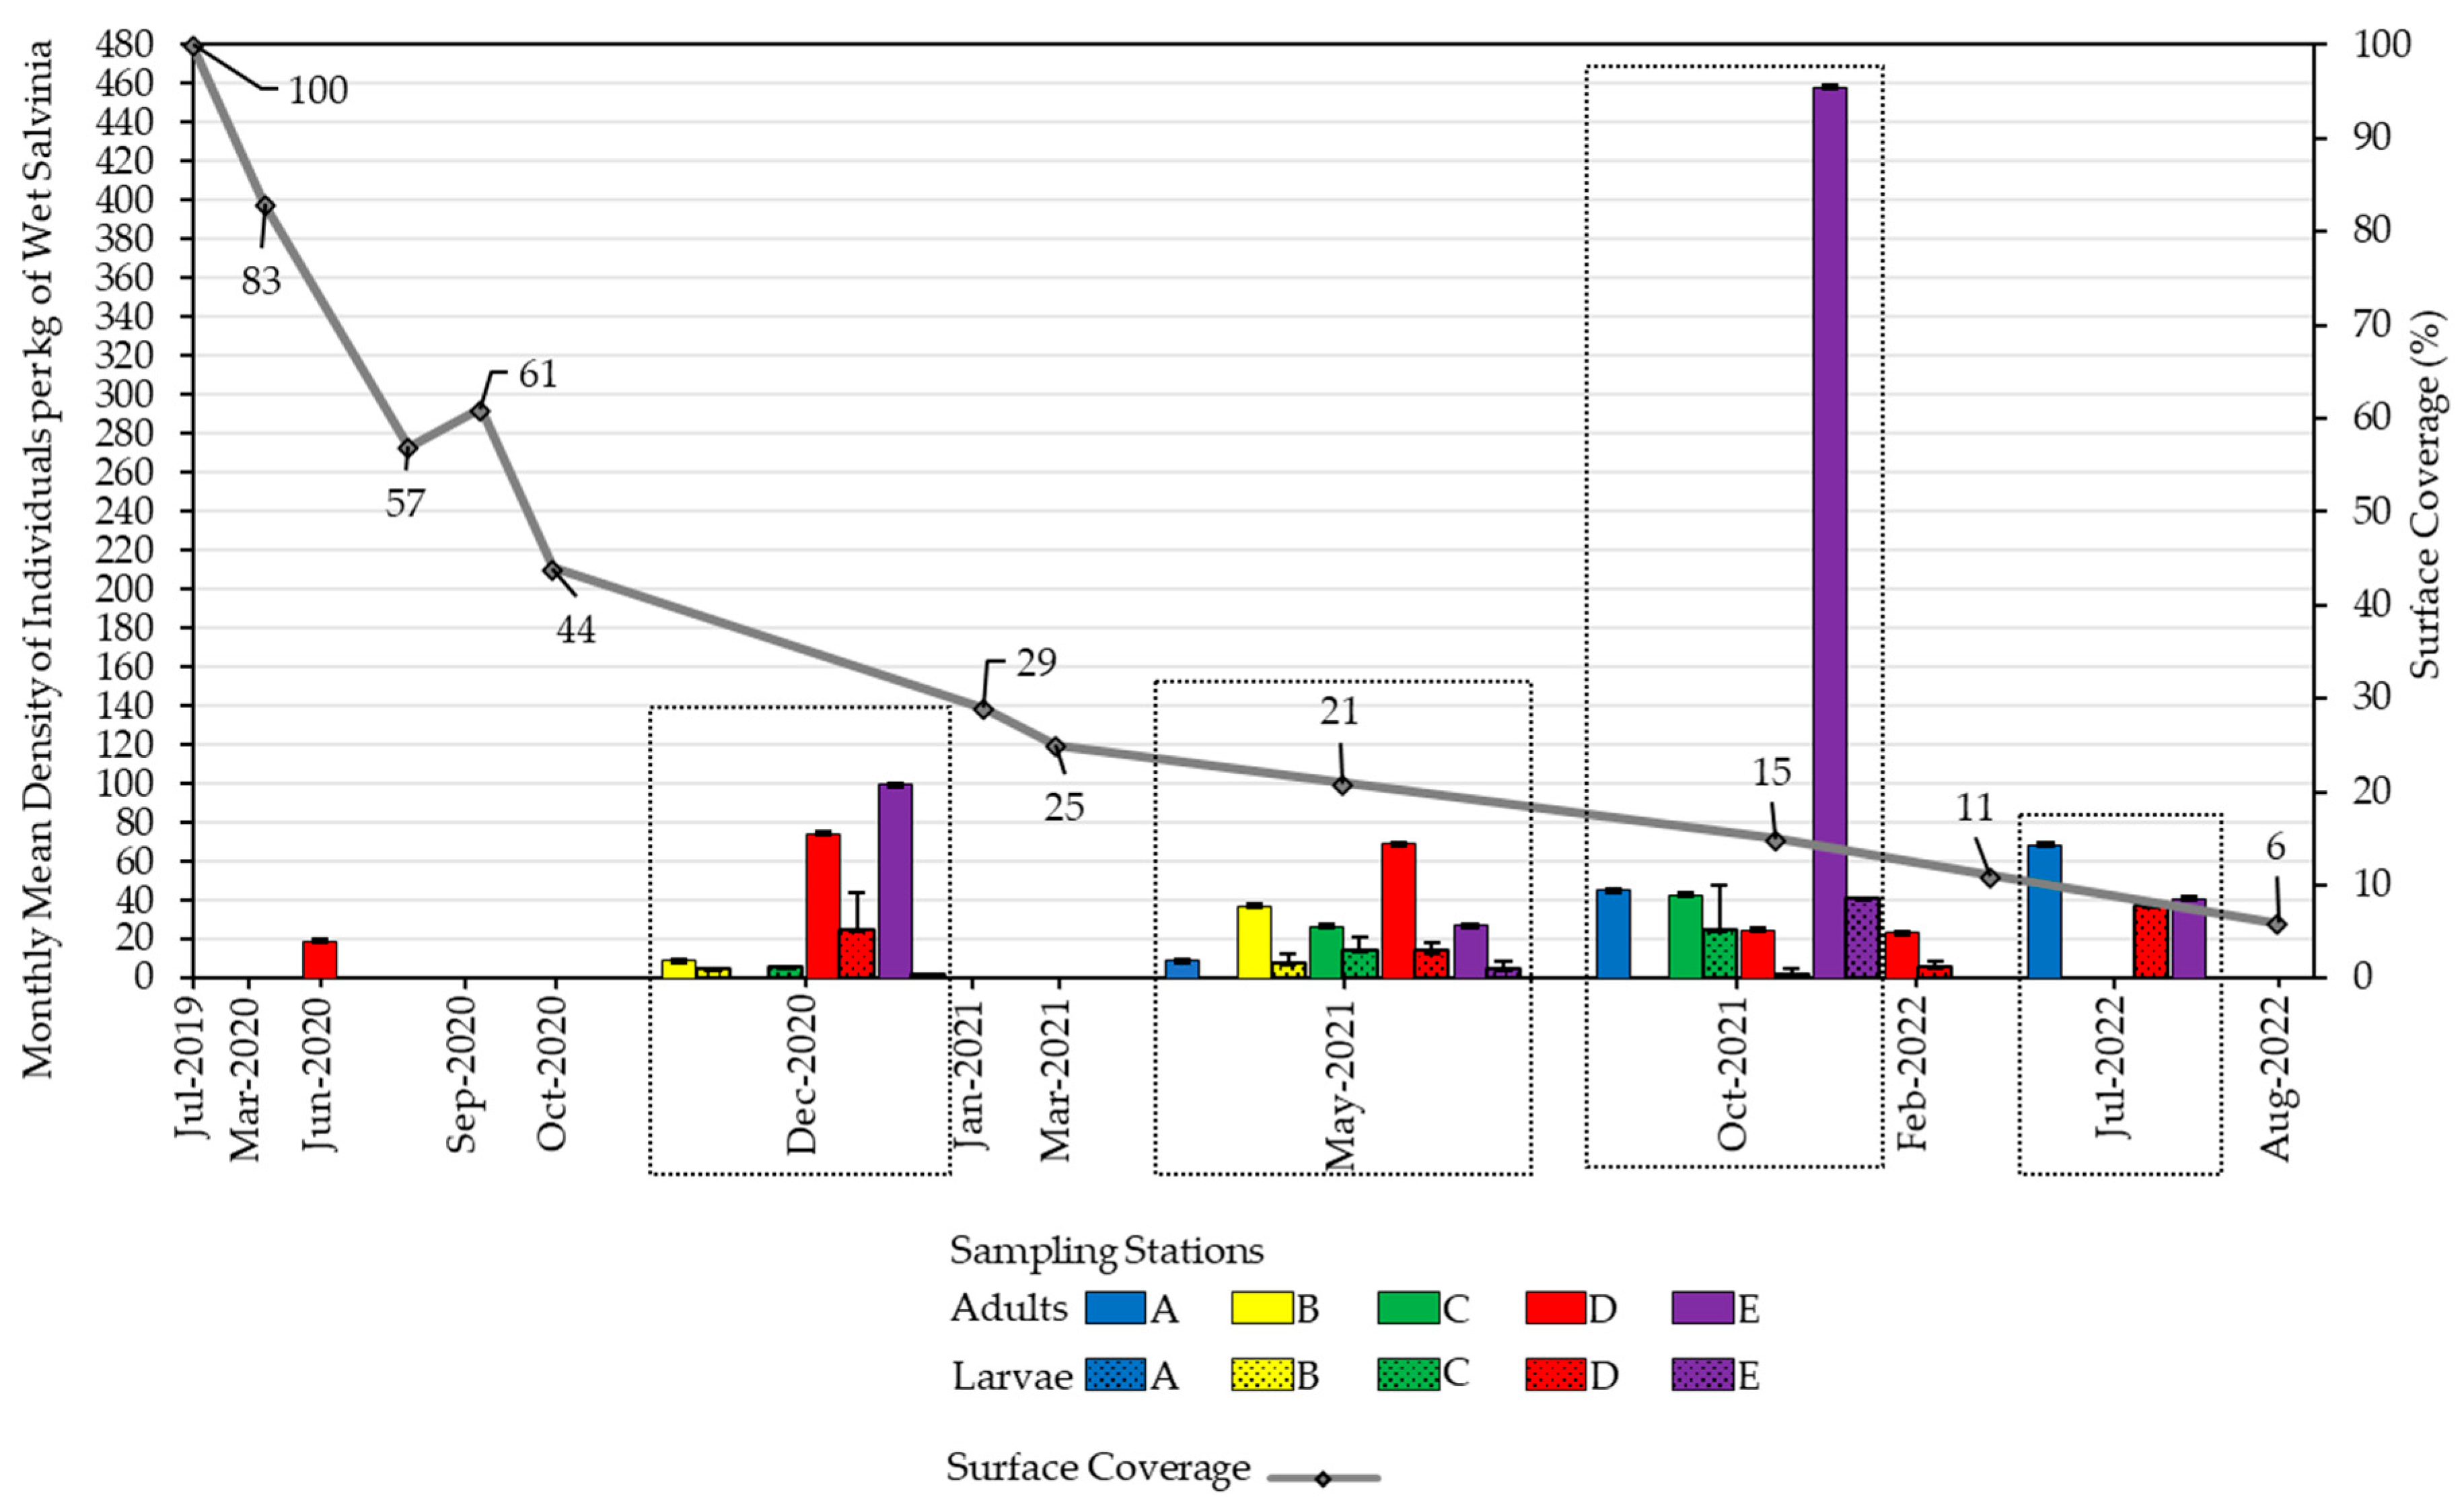
Figure 5.
Water quality trends in Las Curias Reservoir from September 2019 to September 2022. Panels show (a) specific conductance, (b) dissolved oxygen, (c) pH, and (d) temperature. Data, grouped by depth zones (epilimnion ≤ 2 m, thermocline 3–5 m, hypolimnion > 5 m), combines all sampling stations. Points depict mean value with standard error bars.
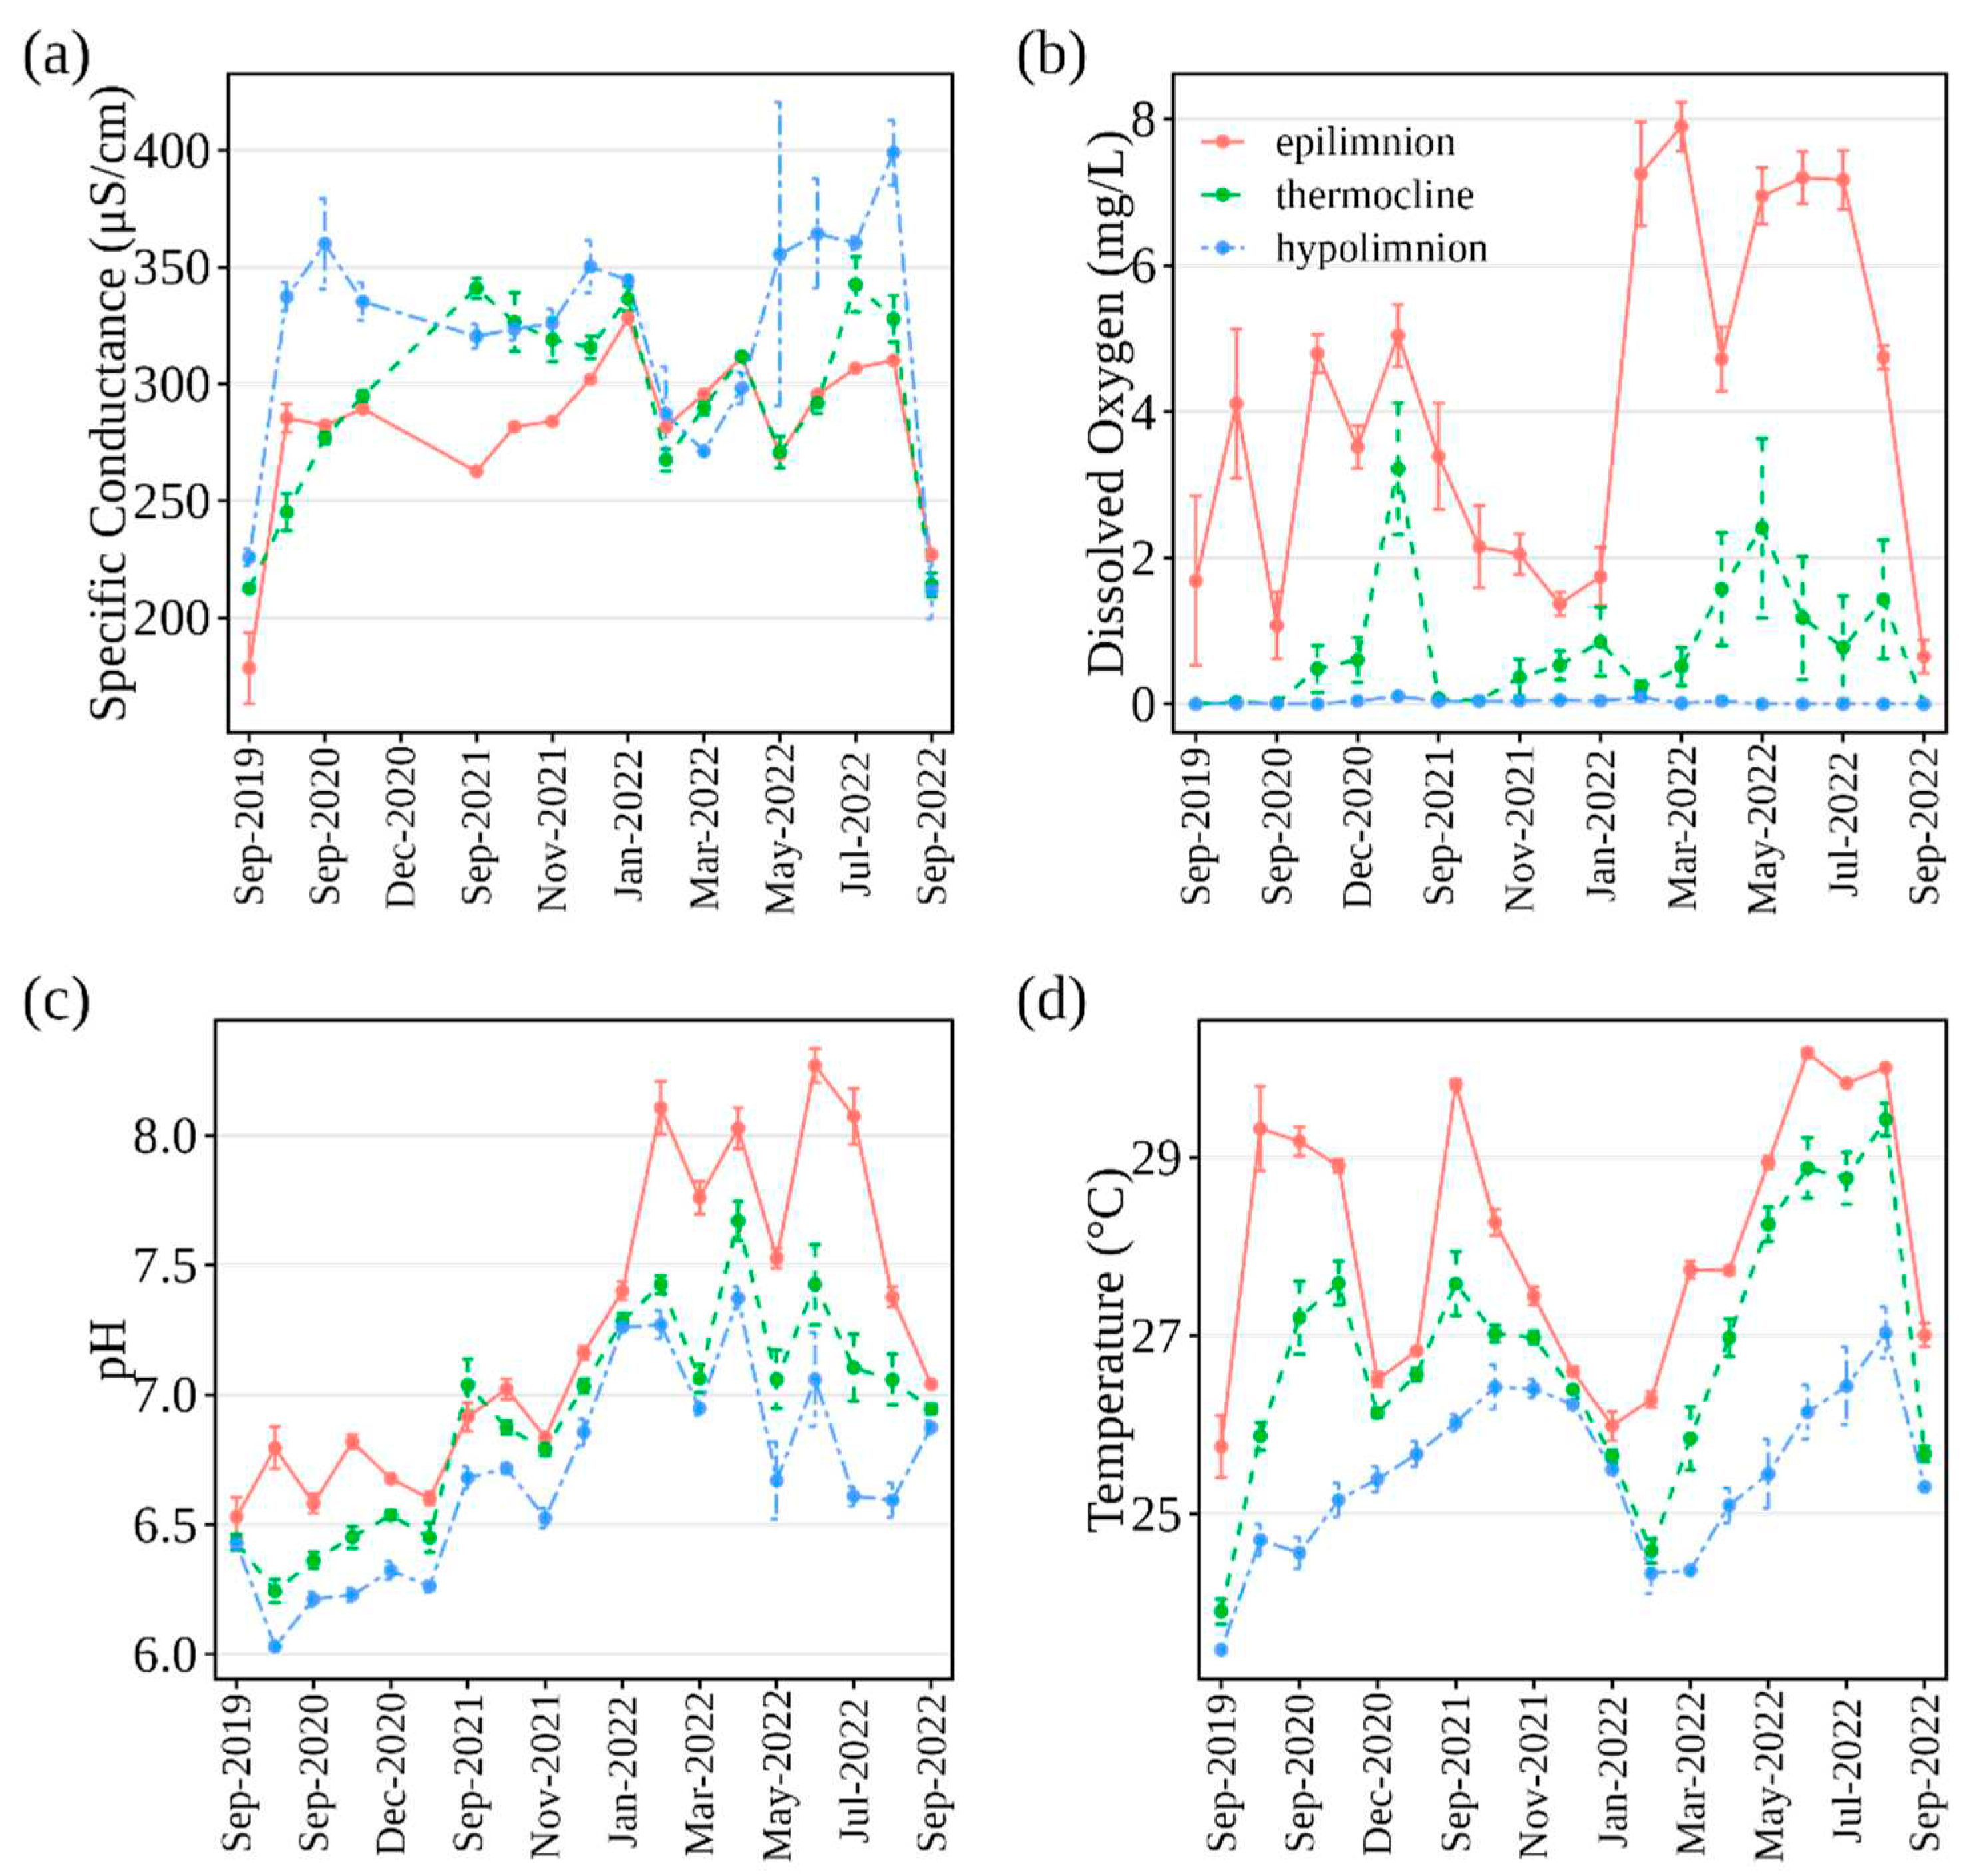
Figure 6.
Variations in Secchi depth (m) and cumulative rainfall (mm) at Las Curias Reservoir from July 2019 to September 2022. Points depict mean Secchi depth with standard error bars. Rainfall data from July 2019 to November 2021 are sourced from the National Oceanic and Atmospheric Administration (NOAA), while measurements from December 2021 to September 2022 are based on readings from a rain gauge near the Las Curias dam. Noteworthy atmospheric events, such as Tropical Storm Isaias in July 2020 and Hurricane Fiona in September 2022, are highlighted in green, emphasizing their significant influence on rainfall totals.
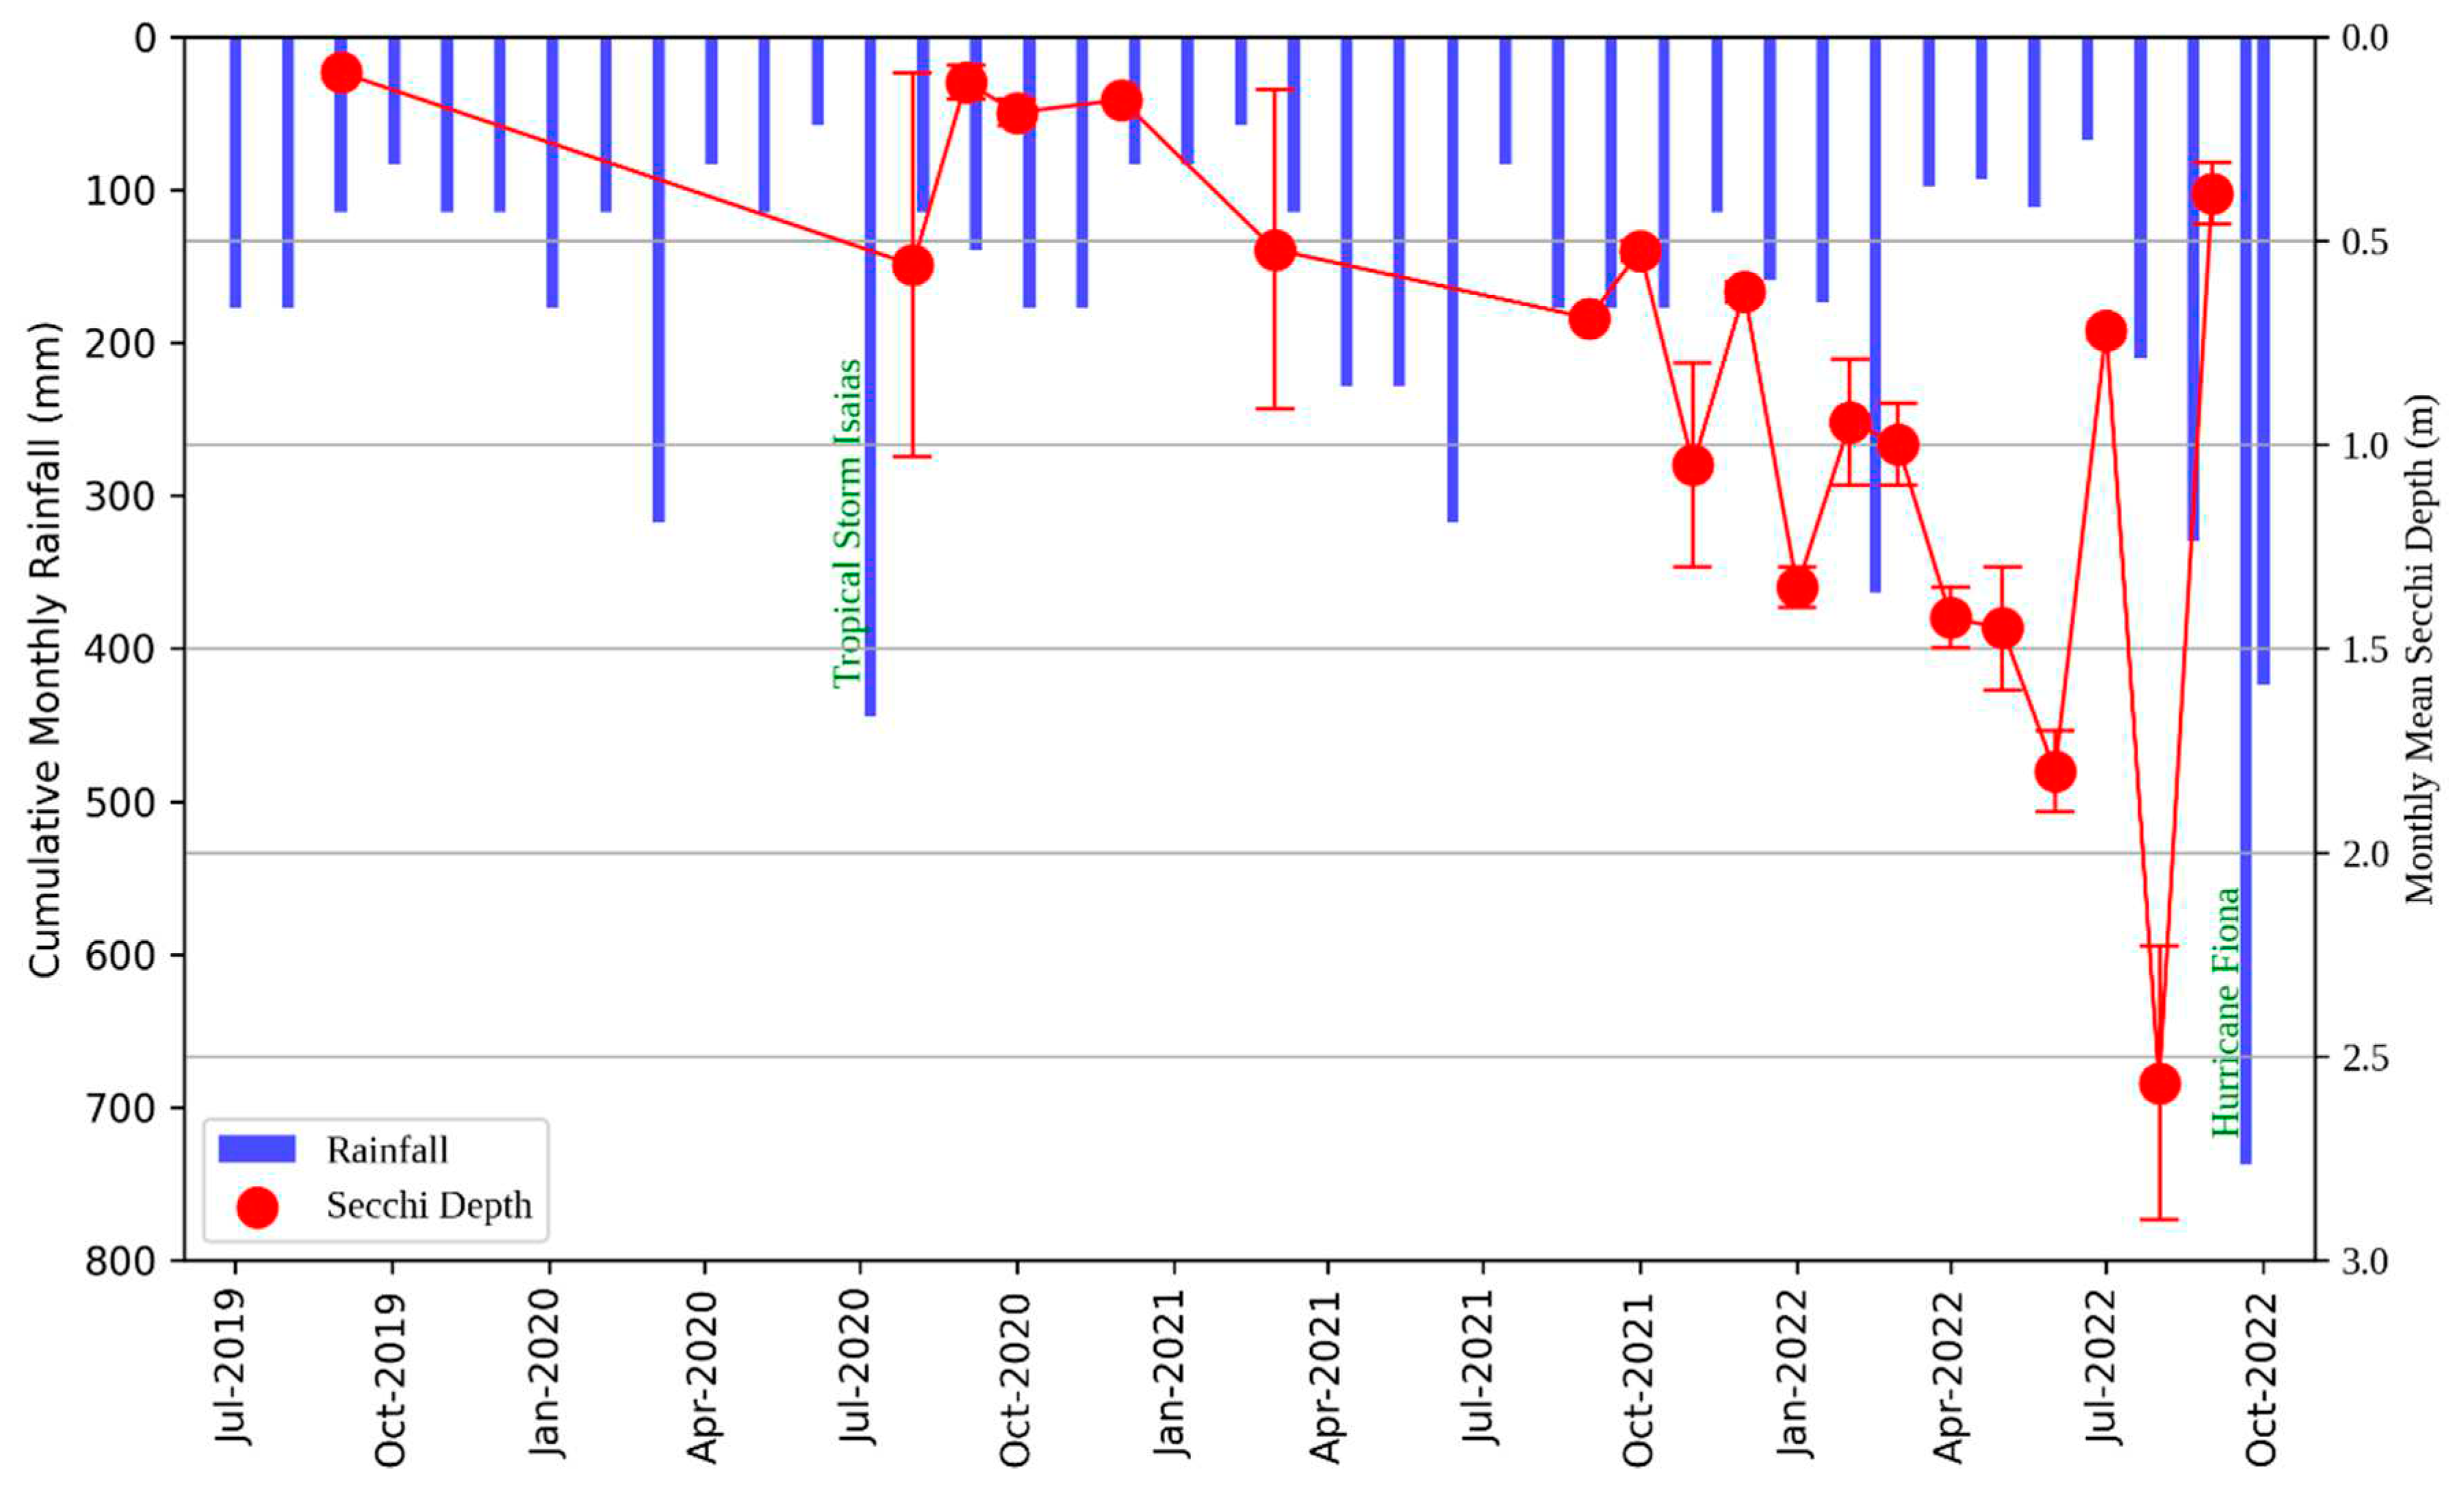

Table 1.
Mean values (± SE) of water quality variables recorded in Las Curias Reservoir, from October 2019 to September 2022. Data represents the combined results from two sampling stations. Control practices were initiated in October 2019. Depth zones are categorized as: epilimnion (0-2 m depth), thermocline (3-5 m depth), and hypolimnion (> 5 m depth).
| Depth Zone | Year | Water Cspecific conductance (μS/cm) | Dissolved Oxygen (mg/L) | pH (s.u.) | Temperature (°C) | ||||
|---|---|---|---|---|---|---|---|---|---|
| N | Mean (± SE) | N | Mean (± SE) | N | Mean (± SE) | N | Mean (± SE) | ||
| Epilimnion | 2019 | 6 | 178.36 (± 15.35)a | 6 | 1.69 (± 1.15)a | 6 | 6.53 (±0.07)a | 6 | 25.75 (±0.24)a |
| 2020 | 18 | 285.72 (± 1.98)b | 24 | 3.37 (± 0.40)a | 24 | 6.71 (±0.02)a | 24 | 28.47 (±0.26)b | |
| 2021 | 24 | 282.60 (± 2.93)b | 30 | 2.80 (±0.31)a | 30 | 6.90 (±0.03)a | 30 | 27.79 (±0.22)b | |
| 2022 | 54 | 291.79 (± 3.85)b | 54 | 5.36 (±0.36)b | 54 | 7.73 (±0.05)b | 54 | 28.18 (±0.21)b | |
| Thermocline | 2019 | 6 | 212.55 (± 0.37)b | 6 | 0.00 (±0.00) | 6 | 6.43 (±0.03)a | 6 | 23.90 (±0.13)a |
| 2020 | 18 | 272.42 (± 5.67)b | 24 | 0.25 (±0.11) | 24 | 6.39 (±0.02)a | 24 | 26.69 (±0.19)b | |
| 2021 | 24 | 325.51 (± 4.45)c | 30 | 0.84 (±0.28) | 30 | 6.83 (±0.04)b | 30 | 27.09 (±0.24)b | |
| 2022 | 53 | 295.25 (± 5.73)b | 53 | 0.96 (±0.22) | 53 | 7.22 (±0.04)c | 53 | 23.47 (±0.01)a | |
| Hypolimnion | 2019 | 17 | 225.85 (± 3.76)a | 17 | 0.00 (±0.00) | 17 | 6.42 (±0.01)a | 17 | 23.47 (±0.01)a |
| 2020 | 27 | 344.33 (± 7.28)b | 36 | 0.13 (±0.00) | 36 | 6.18 (±0.02)a | 36 | 24.92 (±0.10)b | |
| 2021 | 17 | 331.03 (± 4.80)b | 24 | 0.06 (±0.01) | 24 | 6.57 (±0.04)ab | 24 | 26.07 (±0.08)c | |
| 2022 | 37 | 322.09 (± 11.83)b | 37 | 0.02 (±0.01) | 37 | 6.96 (±0.05)b | 37 | 25.46 (±0.17)bc | |
Note: "N" denotes the number of observations for each year and depth zone. Statistical differences within a depth zone across years are indicated by superscript letters; for instance, values marked with "a" are significantly different from those marked with "b", and so forth.
Disclaimer/Publisher’s Note: The statements, opinions and data contained in all publications are solely those of the individual author(s) and contributor(s) and not of MDPI and/or the editor(s). MDPI and/or the editor(s) disclaim responsibility for any injury to people or property resulting from any ideas, methods, instructions or products referred to in the content. |
© 2023 by the authors. Licensee MDPI, Basel, Switzerland. This article is an open access article distributed under the terms and conditions of the Creative Commons Attribution (CC BY) license (https://creativecommons.org/licenses/by/4.0/).
Copyright: This open access article is published under a Creative Commons CC BY 4.0 license, which permit the free download, distribution, and reuse, provided that the author and preprint are cited in any reuse.


