Submitted:
04 October 2023
Posted:
06 October 2023
You are already at the latest version
Abstract
Background: This study aimed to contribute to the standardization of elastography by comparing stiffness values obtained from ultrasound elastography (US-E) and magnetic resonance elastography (MR-E) of the testicular parenchyma in healthy subjects. Methods: A total of 22 healthy volunteers (44 testes) were included in this study. Of the 26 cases analyzed, four were excluded from the study due to the exclusion criteria. The testicular parenchyma of the included patients was evaluated using MR-E and Shear-Wave Ultrasound Elastography (SW-E) examinations. Pearson's correlation test was used to calculate the correlation between age and stiffness values, testicular volumes and stiffness values, and stiffness values from both examinations. Results: The mean US-E stiffness of the right testes was 5.560 ± 3.1 kPa and the mean US-E stiffness of the left testes was 5.361 ± 2.9 kPa. The mean MR-E stiffness of the right testes was 6960.11 ± 460 Pa and the mean MR-E stiffness of the left testes was 6560.19 ± 310 Pa. There was no significant correlation between US-E and MR-E stiffness values (p=0.096). There was also no significant statistical correlation between US-E and MR-E stiffness values and testicular volumes (p=0.17 and p=0.093). Conclusions: No statistical correlation was found between the stiffness values obtained by SW-E and those obtained by MR-E in the normal testicular parenchyma. Additionally, no conclusive relationship between stiffness levels, age, or testicular volume was discovered.
Keywords:
elastography
; magnetic resonance
; stiffness
; testis
1. Introduction
Ultrasonography (USG) is the most sensitive and specific examination method for the testes. However, it is limited to evaluating the surrounding vascular structures and arteries supplying the testicular parenchyma with Doppler, roughly observing the intrarenchymal structures on a greyscale, and providing objective data on the testicular parenchyma only for easily visible peripheral and intrarenchymal mass lesions and apparent vascular abnormalities.
Although normal radiological findings are detected on greyscale USG and color Doppler examination of the testicular parenchyma in a small number of patients presenting with infertility, obvious abnormalities in the testicular parenchyma, its size and volume, and pathological conditions other than varicocele are uncommon radiological findings in infertility [1].
It is not possible to detect more micro-level abnormalities in the testicular parenchyma on greyscale USG examination, except for space-occupying lesions in the parenchyma or point calcifications, known as microlithiasis and inflammatory processes. However, varicocele, atrophy, and parenchymal grayscale abnormalities have not been detected in many patients with infertility. As the testis is not a suitable organ for biopsy, hardness remains a measurable parenchyma parameter [2].
Elastography is a sonographic imaging technique that provides qualitative and/or quantitative information regarding tissue stiffness. It is based on the degree of deformation of the analyzed lesion compared with the surrounding tissue. Images are obtained in color tones from red to blue, or vice versa, and from soft to hard, depending on the tissue stiffness. This color map provides both relative and qualitative data. SW-E is a newly developed real-time sonographic imaging technique that provides quantitative information (in N/m2 or kPa) on the elasticity of soft tissues by sending transverse waves to the examined tissue [1,2].
Elastography has been used as an additional examination to grey scale and Doppler in recent years because it provides additional diagnostic parameters while remaining faithful to the basic principles of ultrasonography. However, the procedure is operator dependent, and a wide range of unstandardized data has been presented in the literature. Therefore, the idea of standardizing this examination by comparing it with MR-E, which works with a similar logic but with different physical laws, has emerged. These comparison and standardization studies have been carried out extensively on liver imaging, in which elastography is extensively used.
2. Materials and Methods
Our study was conducted in the Radiology Department of BHT Clinic Istanbul Tema Hospital, with the approval and permission of the Academic Board and Ethics Committee of Istanbul Nişantaşı University (meeting number 2023/33-12).
A total of 26 healthy volunteers were examined using US-E and MR-E with permission from the university and hospital in August 2023. Our exclusion criterion was the presence of a herniated scrotal and/or epididymal abnormality on USG and/or MR. Four cases were excluded from the study due to microlithiasis in the testis, cysts in the epididymis, incidental and asymptomatic small testicular size (atrophy or hypoplasia), and hydrocele. Thus, 22 cases (44 testes) were evaluated in the present study. The obtained data were comparatively evaluated. SW-E and MR-E examinations were evaluated by two radiologists with more than 10 years of experience in scrotal USG and MR and more than 2 years of experience in elastography.
2.1. USG SW-E device, technique, assessment, data collection and outcomes
The study was conducted using a General Electric (GE) brand Logic S8 model (2019) USG device with elastography software, utilizing a 9 MHz linear transducer with elastography hardware (Figure 1).
Ultrasonographic examination was performed with the patient in the supine position and the penis was positioned on the abdomen with a blanket covering it, ensuring that it was removed from the examination area.
Light pressure was applied to measure the three dimensions of each testis while in the supine posture. Testicular volume was estimated by the USG machine using the following method, based on comparable earlier investigations: Volume of testis = width × length × height × 0.523, expressed in mililiters (ml) [3,4].
After completing the greyscale USG test, the radiologist initiated the SW-E examination. Two-dimensional SW-E was performed with the patient in a supine resting state. The probe was held as steady as possible during the SW-E evaluation to minimize artifacts and inaccurate measurements. The right window displays the elastography image, whereas the left window displays the simultaneous grayscale image (Figure 2). Elastographic examinations were conducted with minimal compression for at least 5 seconds to reduce motion artifacts. ROIs (regions of interest) were placed to measure a round area of 0.1 cm2 in the central part of the normal testicular parenchyma, as it is known that measurements become more standardized in this region, and the area becomes smaller in SW-E [4,5]
The ROI area (0.1 cm2 was our study's most optimum measurable standard (Figure 2). Quantitative data mean (Emean) was obtained in kPa from the normal testicular parenchyma. In our study, the US-E images saved in our PACS archive and the measurements made during the procedure were retrospectively reviewed. The measured values were obtained in kPa units in the US-E. However, to compare them statistically with the values in Pa units in MR-E, they were multiplied by 1000 to obtain the Pa value equivalents.
Real-time US-E measurements were performed during the examination and evaluated by transferring the data to the closed-circuit Clear Canvas Picture Archiving and Communication Systems (PACS) module in our hospital. Data from both examinations were collected and documented.
2.2. MR and MR-E protocols assessment, data collection and outcomes
All MR-E examinations were conducted on a 3 Tesla General Electric Signa Architect MRI scanner with commercially available software and hardware (GE Healthcare, Waukesha, WI, and Resoundant Inc., Rochester, MN) [6,7].
Technically, there are two non-standard extra hardware apparatuses in the MR device: a special device called a "passive driver" (Figure 3) and another device called an "active driver" (Figure 4) for elastography [7].
The subjects were positioned supine, head first, with a body AIR coil centered at the level of the region of interest 6. Mechanical shear waves at 60 Hz were generated by using an active driver system outside the MRI room. A rigid passive driver secured against the anterior wall of the pelvis was used to transmit mechanical vibrations from the active transducer to the body (Figure 5). A rigid driver is the standard device used in the FDA-cleared commercially available implementation of MR-E technology. An experienced MRI technologist performed the MR-E examinations in this study.
The propagating shear waves were imaged using a motion-sensitized imaging sequence. An (Spin-Echo echo planar imaging (SE-EPI) sequence was used to acquire axial wave images with the following parameters: repetition time (ms)/echo time (ms), 50/23; continuous sinusoidal vibration, 60 Hz; field of view, 32–42 cm; matrix size, 256 × 64; flip angle, 30°; section thickness, 10 mm; four evenly spaced phase offsets; and four pairs of 60-Hz trapezoidal motion-encoding gradients with zeroth and first moment nulling along the through-plane direction. All processing steps were applied automatically, without manual intervention, to yield quantitative images of tissue shear stiffness in kilopascals. The MR elastographic images were interpreted by staff radiologists in the Department of Radiology.
MR-E images were processed using commercially available MR-Touch software (GE Healthcare, Waukesha, WI, and Resoundant Inc., Rochester, MN, USA) to generate magnitude, phase, and wave maps (Figure 6) [6,7]. Six relative-stiffness images were reconstructed for each slice location. The resulting data were measured using ROIs in the muscle on anatomical T1 images and copied onto MR-E stiffness maps to measure the stiffness values (or elastograms) in the Pascals.
2.3. Statistical analysis
The MR-E and US-E mean stiffness values were statistically analyzed in the Pascals. The US-E and MR-E data were compared using the analysis of variance test, and chi-square and binary comparisons were performed using Student's t-test. Pearson's correlation test was used to calculate the correlation between age and stiffness values, testicular volumes and stiffness values, and stiffness values from both examinations. Statistical analysis was performed using SPSS v.23.0 (IBM Corp., Armonk, NY, USA). Two-tailed values of p < 0.05 were considered statistically significant.
3. Results
The youngest patient was 23 years old, and the oldest patient was 48 years old, with a mean age of 36.2 ± 11 years (Table 1). When analyzing the right testicular volumes of our patients, the largest value was 15 ml, and the smallest value was 12 ml. The mean right testicular volume was 13.4 ± 3.1 ml. When analyzing the volumes of the left testes, the largest volume was 15.2 ml, and the smallest was 11 ml. The mean left testicular volume was 13.6 ± 3.2 ml (Table 2). No significant correlation was observed between age and testicular volume (Table 3).
When analyzing US-E stiffness values, the smallest stiffness value for the right testis, 4.216 kPa for the highest stiffness value was 7.312 kPa, and the mean stiffness value was 5.560 ± 3.1 kPa. For the left testis, the smallest and highest stiffness values were 4.324 kPa, 6.914 kPa, and 5.361 ± 2.9 kPa (Table 4).
Because MR-E stiffness values were given by the MR device in Pascal (Pa) units, data were collected in this unit. When analyzing the MR-E values, it was observed that the smallest stiffness value for the right testis was 5302.12 Pa, the highest stiffness value was 9211 Pa, and the mean stiffness value was 6960 ± 460 Pa. For the left testis, the smallest stiffness value was 5562 Pa, the highest stiffness value was 8913 Pa, and the average stiffness value was 6560 ± 310 Pa (Table 5).
In the statistical correlation analysis performed between the testicular volume obtained from USG and the USG-E stiffness values and the stiffness values measured by MR-E, the p-values were 0.17 and 0.093, respectively, and were found to be greater than 0.05, respectively (Table 6). This indicates that there were no statistically significant differences between the parameters.
When statistically correlating the US-E and MR-E stiffness values of the cases, no significant correlation was found between the values (Table 7).
4. Discussion
Numerous studies have been conducted on different normal distributions of testicular volume for different age groups [8]. When analyzing the testicular volumes of our patients, we observed that they were within the normal range for adults. This is because we included subjects from the normal population in the study. All of our patients were in the young and early middle age groups. When comparing age and testicular volume, no significant statistical correlation was found, which is consistent with most other data in the literature [9,10,11,12,13].
SW-E is a relatively novel, reliable, and non-invasive imaging technique that provides data on histopathological alterations in many tissues. It offers valuable quantitative assessment of tissue stiffness and is extremely helpful in assessing parenchymal diseases. SW-E has been used in very few comparative investigations of the impact of varicocele on testicular parenchyma [14,15].
When analyzing the US-E stiffness values, it was observed that they were similar to those in the literature. Most studies in the literature, especially in adults, aim to identify conditions that do not cause significant abnormalities in the testicular parenchyma on grayscale USG examination, especially varicocele. Although our number of cases and, therefore, our sample size was small, our similar stiffness value findings with the literature revealed that most pathologies that do not give significant findings in the testicular parenchyma on greyscale USG do not give significant findings on SW-E.
No significant difference was found in the statistical analysis of the volume obtained by ultrasonographic calculation by measuring three dimensions compared to US-E and MR-E. This result is consistent with data in the literature [13].
The MR device provided the MR-E stiffness values in the pascals. Currently, MR-E is mostly used for the liver, and researchers who use this examination also use the Pascal unit. The MR-E devices and software were calibrated to provide stiffness values in the Pascals.
The use of MR of the testis in the literature is mostly for the purpose of creating a multiparametric examination for recognizing malignant lesions [16]. Although the use of US-E for testes is considerable in the literature, the same is not the case for MR-E. We did not find any MR-E studies of the testes in the literature. The MR-E component of our study is a preliminary study. This may be criticized because it may produce meaningless results for statistical sampling and power analysis. However, since MR-E is a test whose standards are not fully established, except for liver fibrosis, only pioneering studies can contribute to the literature. Similarly, there is only one study in the literature on the spleen, consisting of 16 patients [17].
In the statistical comparative analysis of the data obtained for each testicle, there was no significant correlation between US-E and MR-E findings (p=0.096). This nonsignificant correlation may be due to several factors and limitations. One of the most important of these factors is that the current MR-E modality is not standardized enough to perform testicular examination.
Limitations
The lack of data on the MR-E examination of the testes in the literature constitutes our most significant limitation. Another limitation is the small number of patients. Another limitation is that we performed MR-E measurements from the whole parenchyma and US-E measurements from a single location.
5. Conclusions
In our study, we compared the MR-E and US-E stiffness values of normal testicular parenchyma but did not find a statistically significant correlation between the two values. In addition, no significant correlation was found between stiffness values and age and testicular volume. The lack of a significant correlation may be attributed to the limitations and absence of standardized application standards for MR-E in testicular examinations. Further research with more patients under more standardized conditions is needed to confirm this result. Despite the small number of patients, our study is significant, as it pioneers the literature on this subject.
Author Contributions
Conceptualization, L.K. and S.P.; methodology, investigation, analysis, writing-review and editing. Both of them have read and agreed to the published version of the manuscript.
Funding
This study did not receive financial support.
Institutional Review Board Statement
The approval and permission of the Academic Board and Ethics Committee of Istanbul Nişantaşı University decision no 2023/33-12, in August 2023 was obtained, and informed consent in accordance with the Declaration of Helsinki.
Informed Consent Statement
Informed consent was obtained from all subjects involved in the study.
Data Availability Statement
The raw data are available upon request from the corresponding author.
Conflicts of Interest
The authors declare that they have no conflicts of interest.
References
- Gat, Y.; Bachar, G.N.; Zukerman, Z.; Belenky, A.; Gornish, M. Varicocele: a bilateral disease. Fertil. Steril. 2004, 81, 424–429. [Google Scholar] [CrossRef] [PubMed]
- Monpeyssen H, Tramalloni J, Poirée S, Hélénon O, Correas JM. Elastography of the thyroid. Diagn Interv Imaging. 2013; 945: 535-544. [CrossRef]
- Erdogan, H.; Durmaz, M.S.; Arslan, S.; Durmaz, F.G.; Cebeci, H.; Ergun, O.; Karaagac, S.S. Shear Wave Elastography Evaluation of Testes in Patients With Varicocele. Ultrasound Q. 2019, 36, 64–68. [Google Scholar] [CrossRef] [PubMed]
- Turna, O.; Aybar, M.D. Testicular stiffness in varicocele: evaluation with shear wave elastography. Ultrasonography 2020, 39, 350–355. [Google Scholar] [CrossRef] [PubMed]
- Yüzkan, S.; Çilengir, A.H. Shear wave elastography for assessment of testicular stiffness in patients with varicocele: A prospective comparative study. J. Med Ultrasound 2022, 30, 277–281. [Google Scholar] [CrossRef] [PubMed]
- Yin, M.; Talwalkar, J.A.; Glaser, K.J.; Manduca, A.; Grimm, R.C.; Rossman, P.J.; Fidler, J.L.; Ehman, R.L. Assessment of Hepatic Fibrosis With Magnetic Resonance Elastography. Clin. Gastroenterol. Hepatol. 2007, 5, 1207–1213. [Google Scholar] [CrossRef] [PubMed]
- Venkatesh SK, Yin M, Ehman RL. Magnetic resonance elastography of liver: technique, analysis, and clinical applications. J Magn Reson Imaging. 2013; 373:544-555. [CrossRef]
- Kohler, F.P. On the Etiology of Varicocele. J. Urol. 1967, 97, 741–742. [Google Scholar] [CrossRef] [PubMed]
- Robbins SL, Kumar V, Cotran R. Basic pathology. Philadelphia: International Publishing; 2017.
- Vogt M, Ermert H. Development and evaluation of a highraphy – a feasibility study in vivo. Ultrasound Med Biol 2002; 28: 475–482.
- Rafaelsen SR, Vagn-Hansen C, Sørensen T, Lindebjerg J, Pløen J, Jakobsen A. Ultrasound elastography in patients with rectal cancer treated with chemoradiation. Eur J Radiol. 2013; 82: 913-917. [CrossRef]
- Hamarat, M.B.; Dönmez, M.I.; Sezgin, T.; Ünlü, M.Z.; Kocaoğlu, C.; Özkent, M.S.; Keçeli, A.M. Testicular volume loss in the long-term follow-up after surgical detorsion of the testis. Pediatr. Surg. Int. 2022, 38, 907–911. [Google Scholar] [CrossRef] [PubMed]
- Beşler, M.S.; Gökhan, M.B.; Ölçücüoğlu, E.; Özdemir, F.A.E. Shear wave elastography for the evaluation of testicular salvage after testicular torsion. Andrologia 2022, 54, e14565. [Google Scholar] [CrossRef] [PubMed]
- Yang, Z.-L.; Ke, Z.-C.; Li, S.-L.; Zhou, W.; Zhou, G.-L.; Yin, J.-C.; Jiang, J.-H.; Li, J.-Q.; Xie, J.-J. [Ultrasound measurement of the testis volume of 0-14 years old Chinese boys]. . 2020, 26, 1083–1086. [Google Scholar] [PubMed]
- Wei, Y.; Yu, C.; Zhou, Y.; Zhao, T.; Lin, T.; He, D.; Wu, S.-D.; Wei, G.-H. Testicular hypertrophy as predictor of contralateral nonpalpable testis among Chinese boys: An 18-year retrospective study. 2020, 27, 456–463. [CrossRef]
- Mathur M, Spektor M. MR Imaging of the Testicular and Extratesticular Tumors: When Do We Need? Magn Reson Imaging Clin N Am. 2019; 27:151-171.
- Mannelli, L.; Godfrey, E.; Joubert, I.; Patterson, A.J.; Graves, M.J.; Gallagher, F.A.; Lomas, D.J. MR Elastography: Spleen Stiffness Measurements in Healthy Volunteers—Preliminary Experience. Am. J. Roentgenol. 2010, 195, 387–392. [Google Scholar] [CrossRef] [PubMed]
Figure 1.
Touch panel and button panel of GE Logic S8 brand/model USG device with elastography software (elastography button is circled in red on the right) and a 9 Mhz linear probe with hardware elastography features (shown from two different directions on the left).
Figure 1.
Touch panel and button panel of GE Logic S8 brand/model USG device with elastography software (elastography button is circled in red on the right) and a 9 Mhz linear probe with hardware elastography features (shown from two different directions on the left).
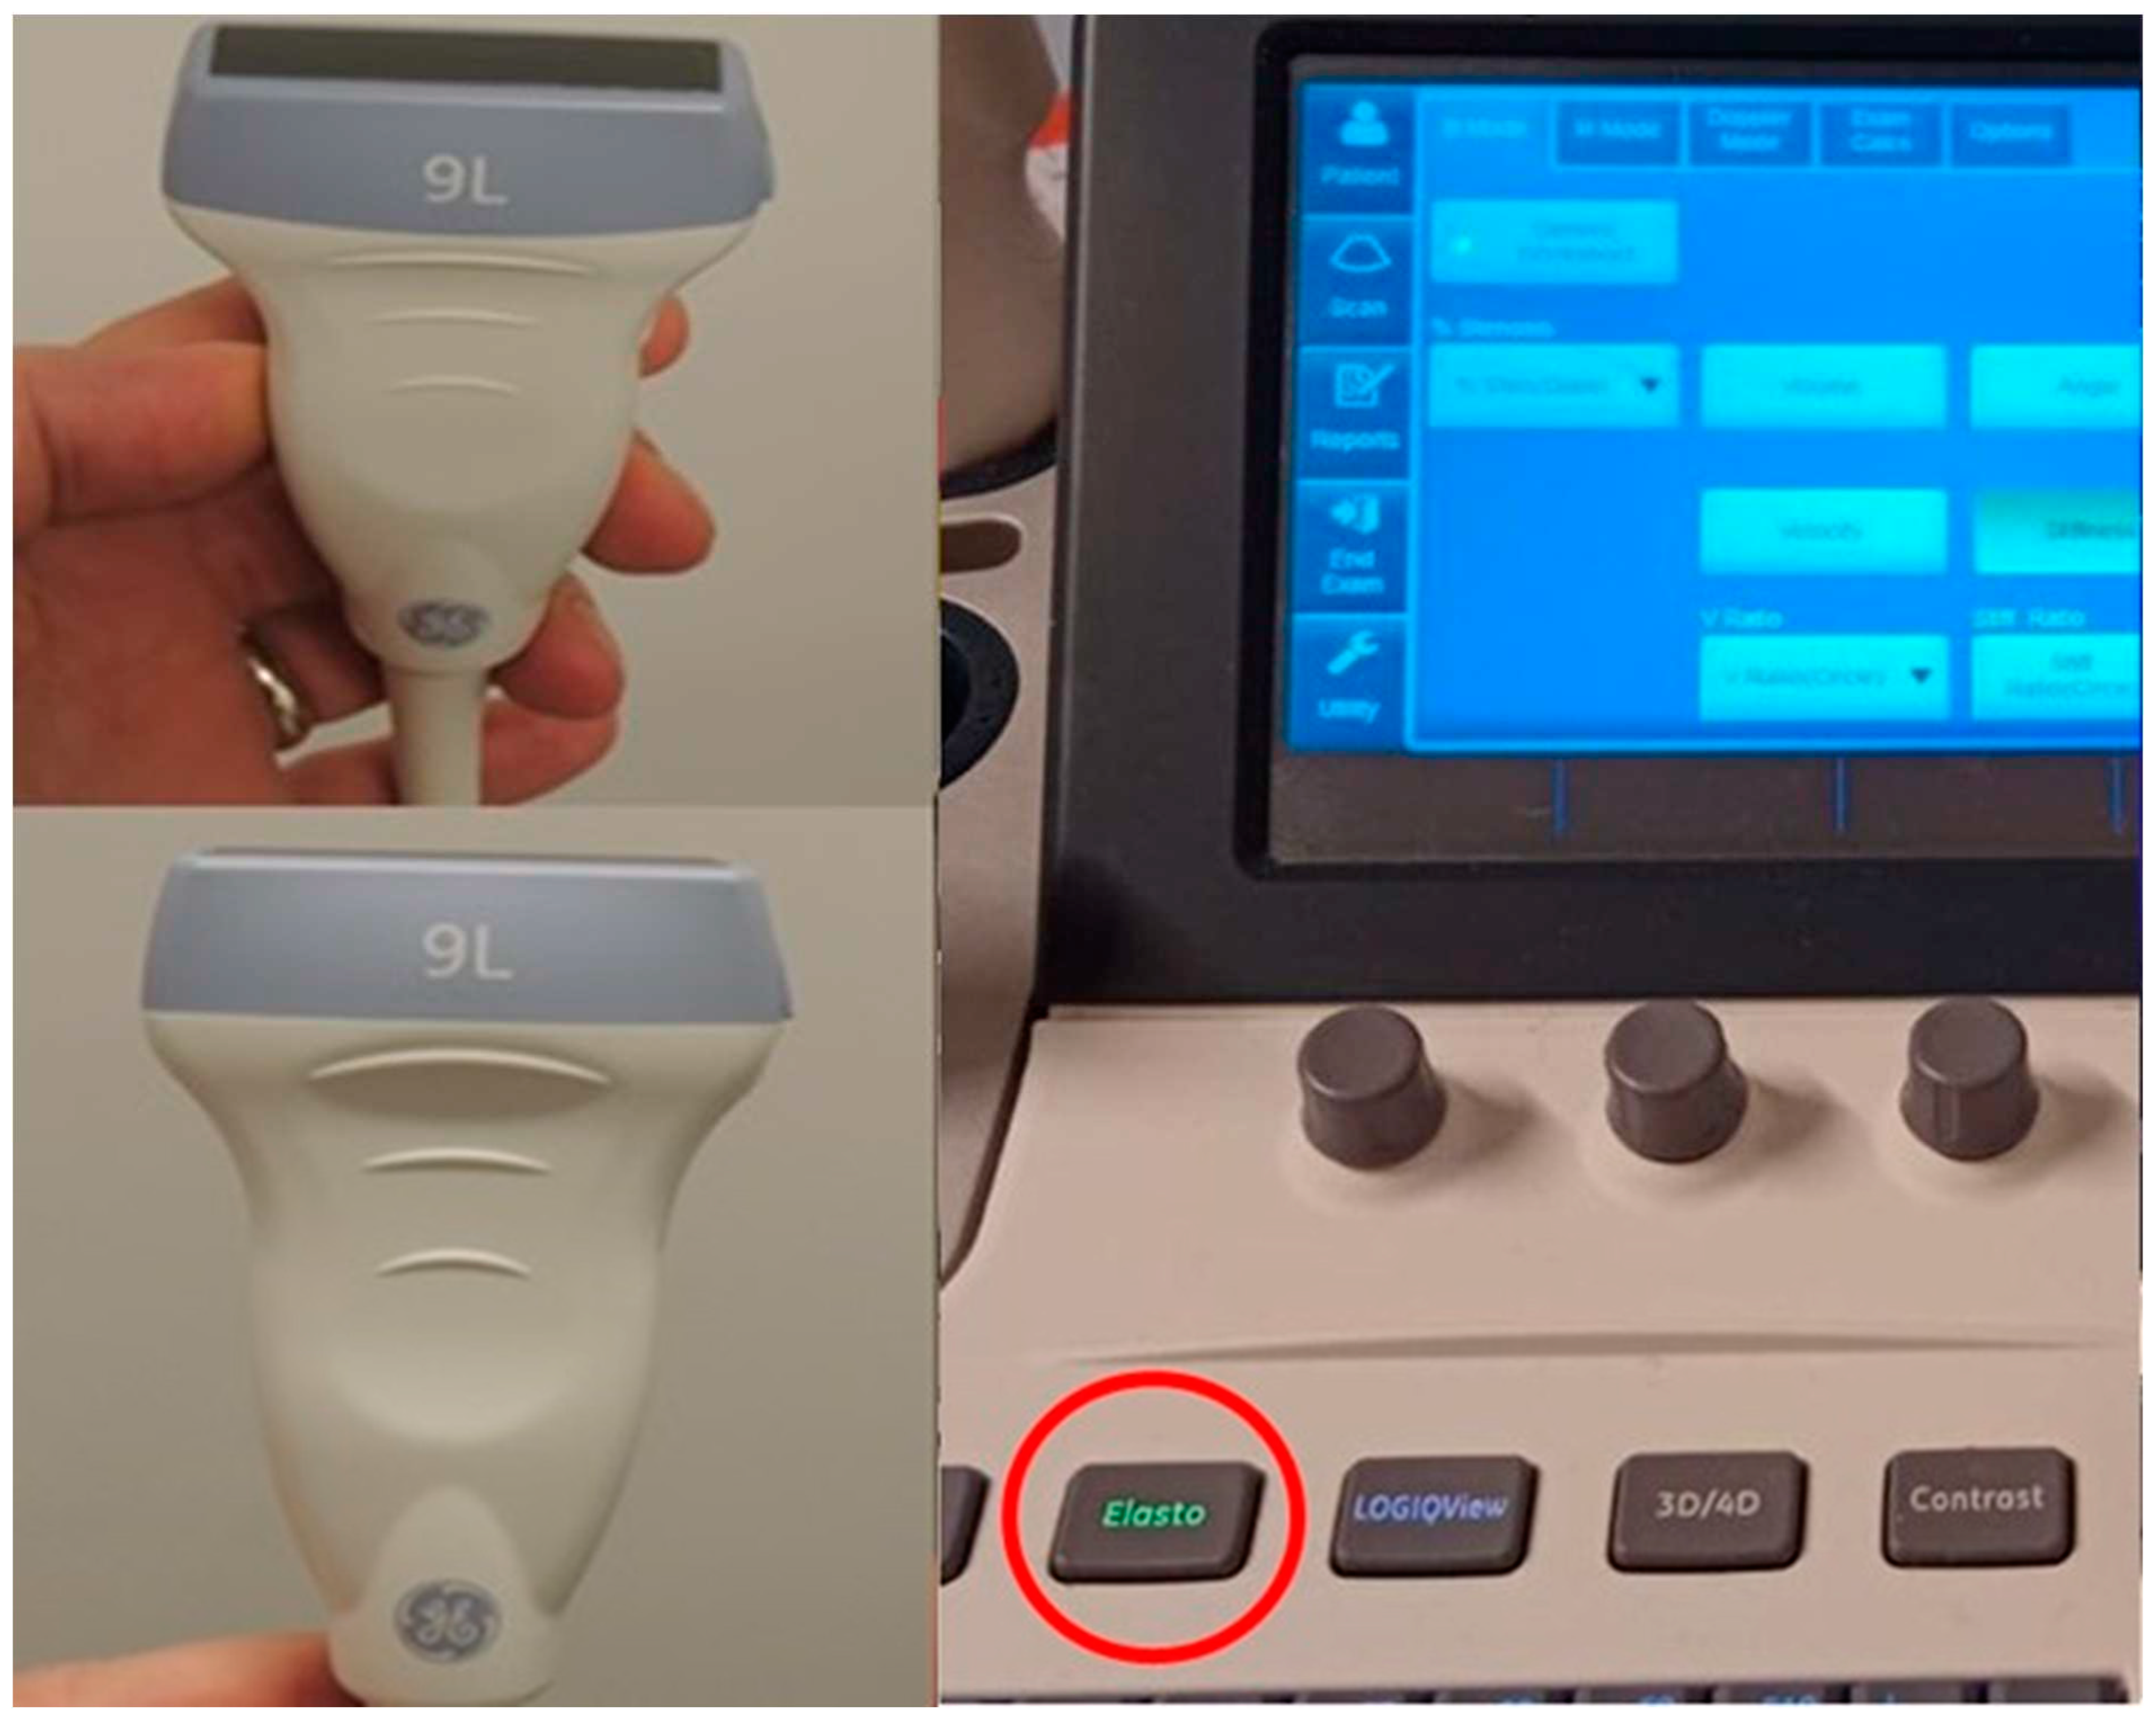
Figure 2.
SW-E: Elastography image in the right window and simultaneous greyscale image in the left window. In the image on the right, a 0.1 cm2 ROI area (area surrounded by yellow dots numbered 1) was measured from the central part of the testis within the colored blue elastogram window. In the lower left corner of the image, there are measurement values in units of kPa.
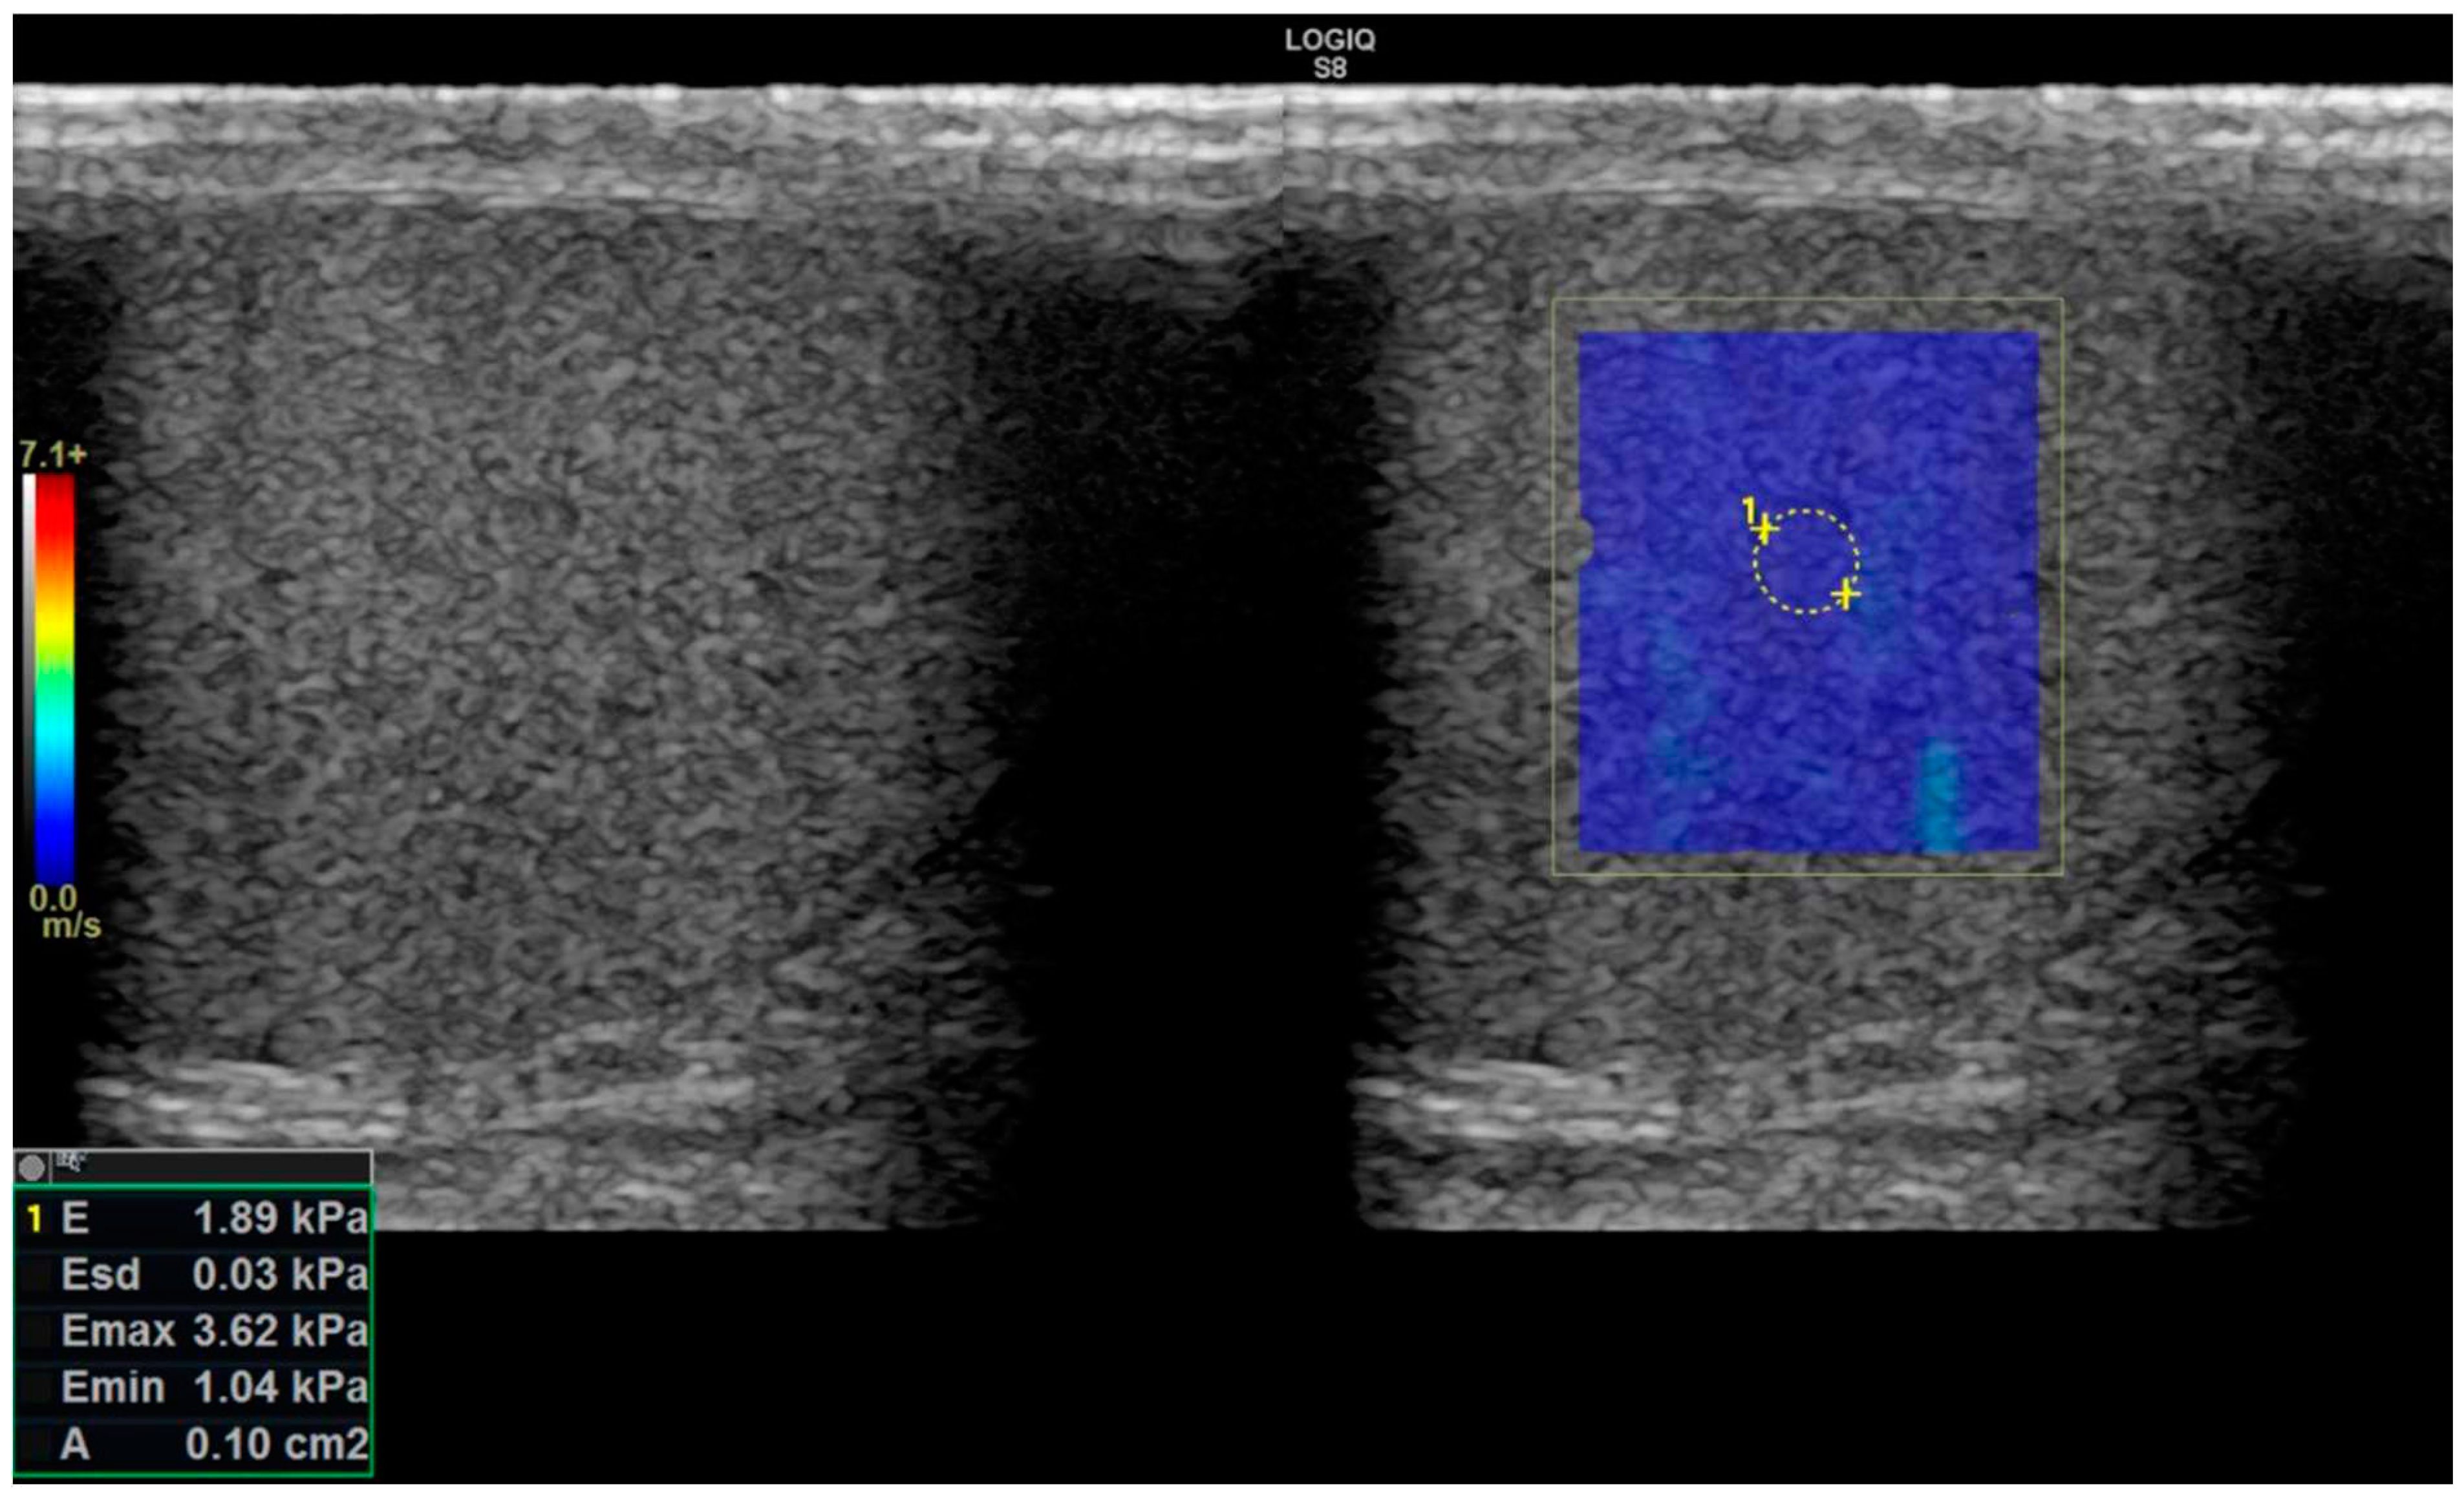
Figure 3.
The apparatus called "passive driver,” which is one of the extra equipment for MR-E examination, is shown from the back(left), front(centrum), and side(right) in three images from left to right.
Figure 3.
The apparatus called "passive driver,” which is one of the extra equipment for MR-E examination, is shown from the back(left), front(centrum), and side(right) in three images from left to right.
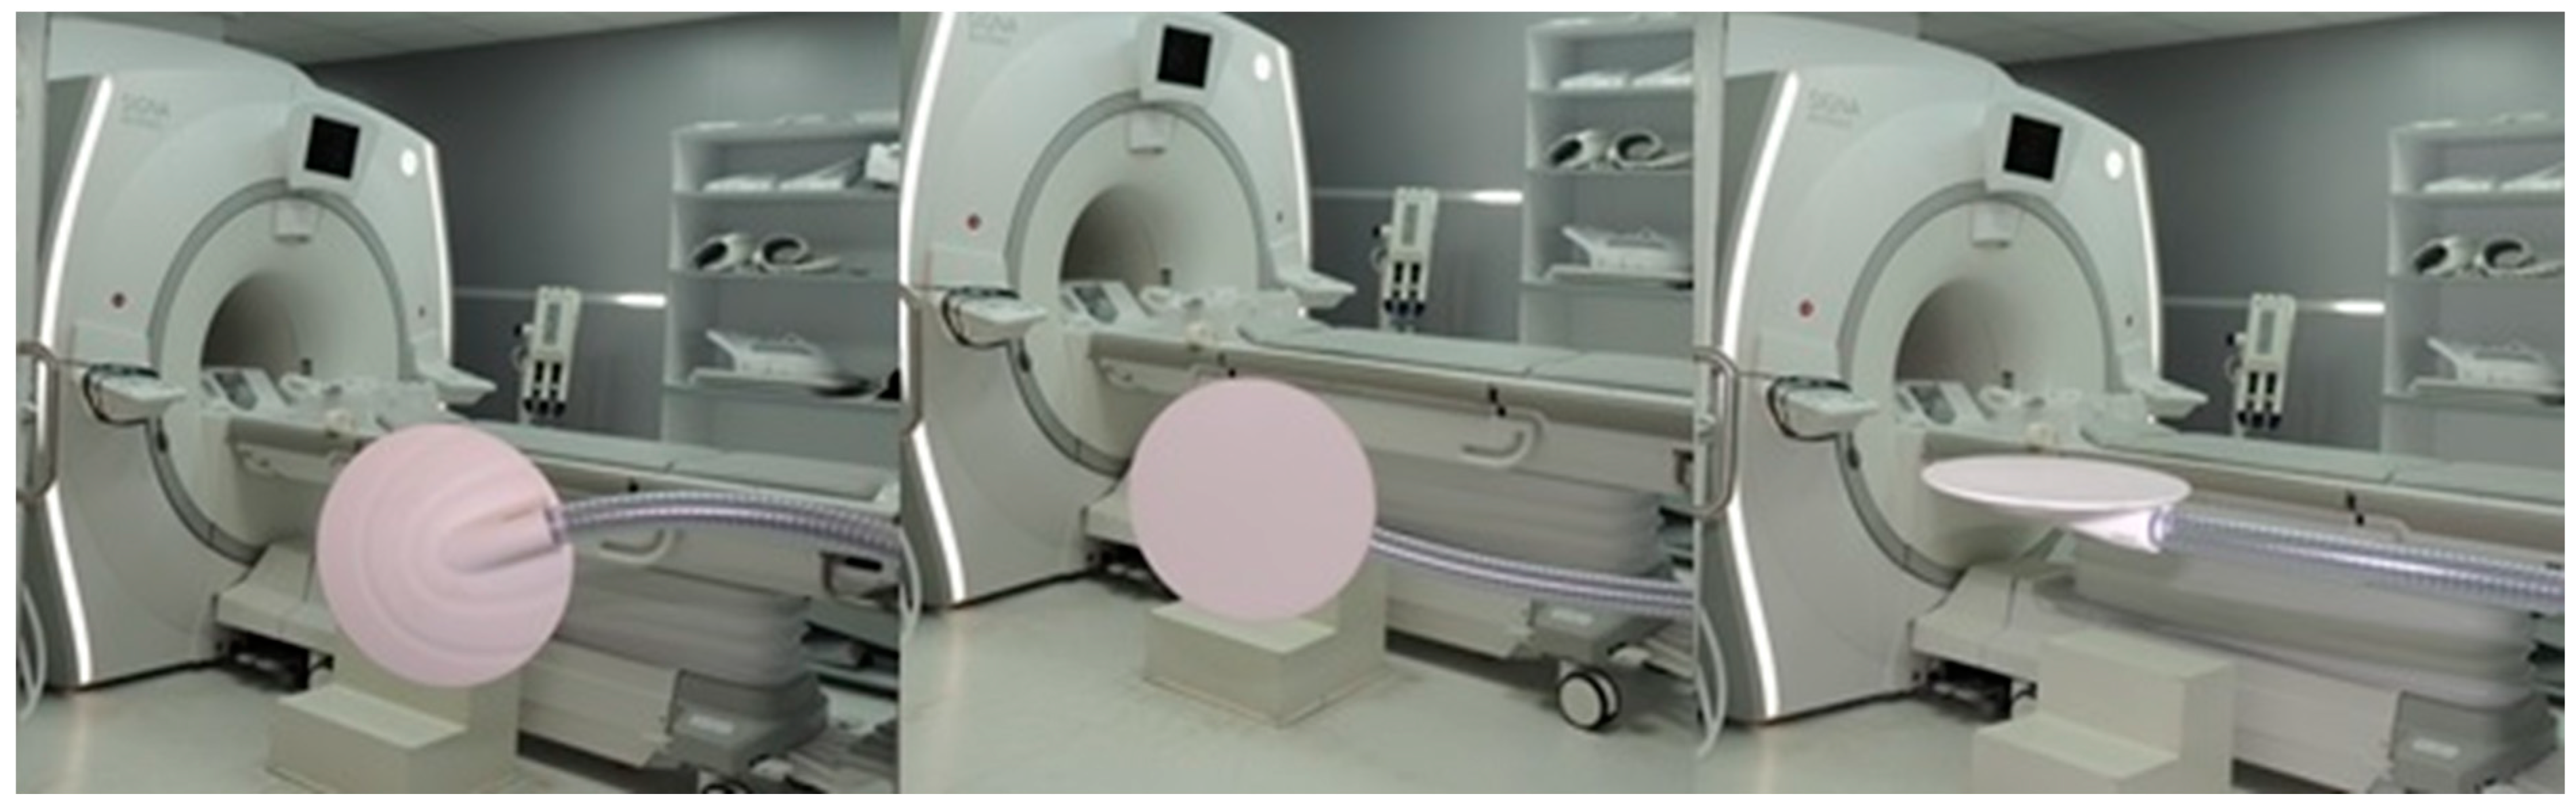
Figure 4.
The so-called "active driver", which is an additional component of the MR-E examination, is shown.
Figure 4.
The so-called "active driver", which is an additional component of the MR-E examination, is shown.
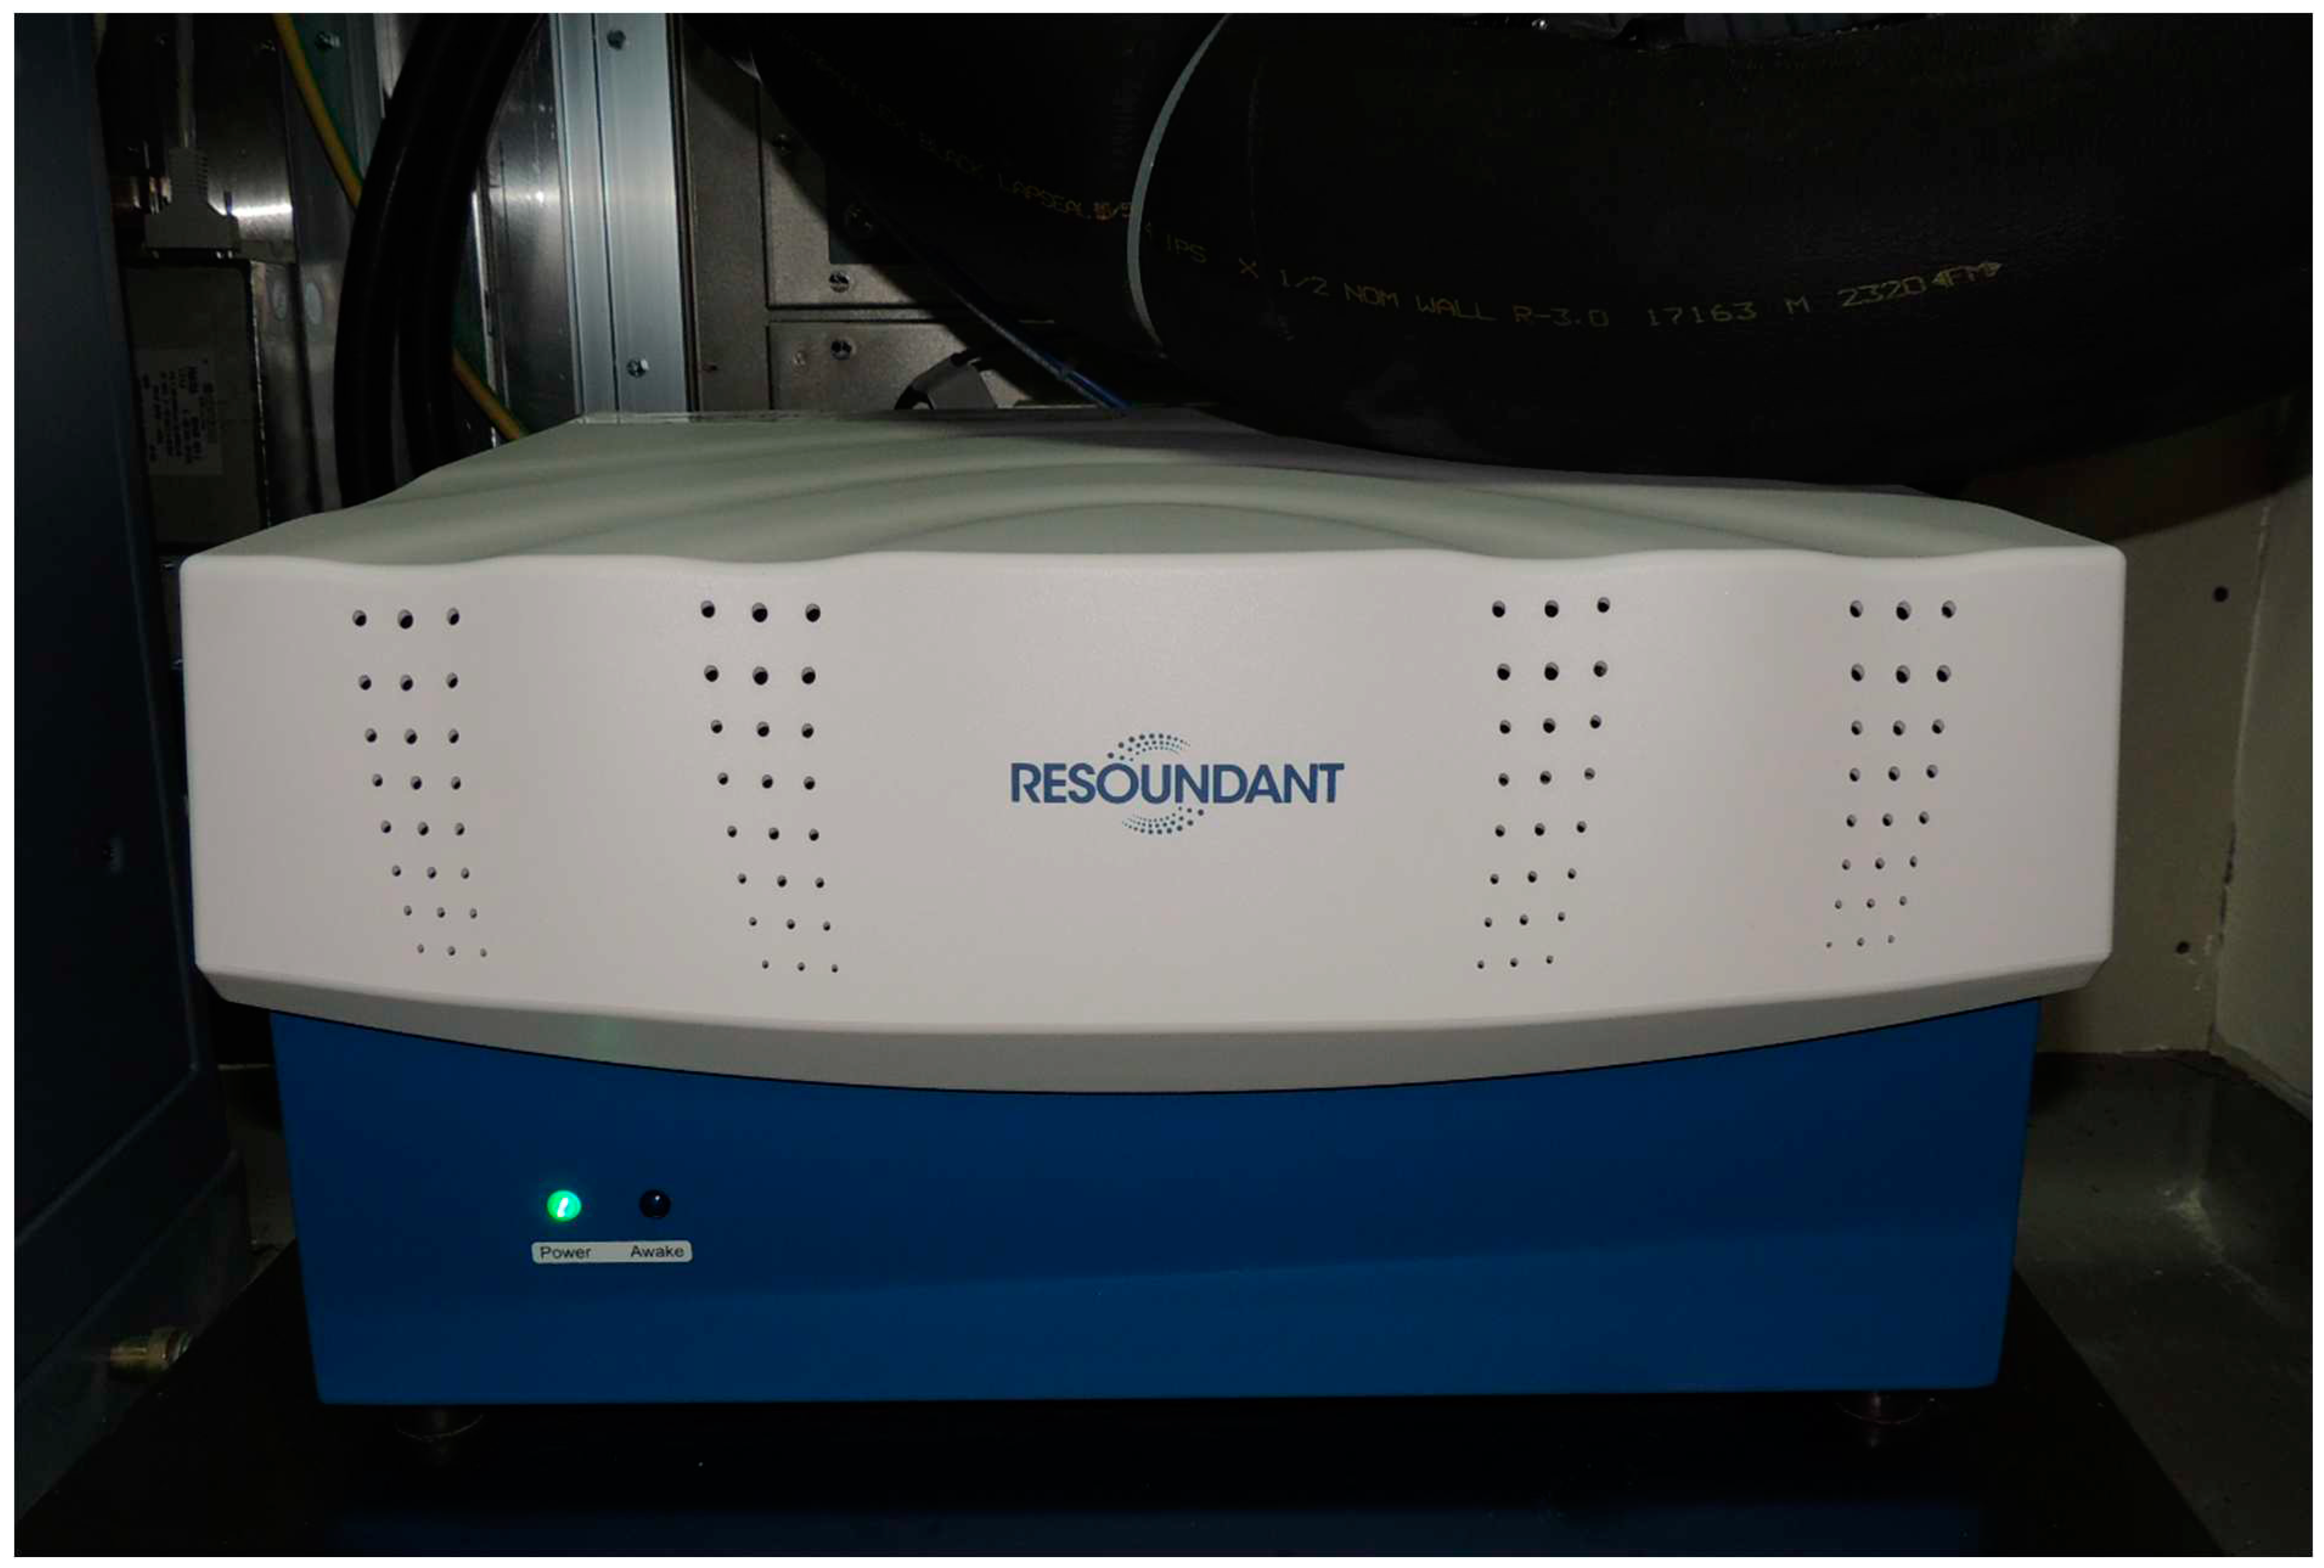
Figure 5.
In the leftmost picture, the passive driver device shown in Figure 2 is observed in the suprapubic region. In the central picture, it is fixed with a coil, and in the rightmost picture, it is observed with a coil placed on it.
Figure 5.
In the leftmost picture, the passive driver device shown in Figure 2 is observed in the suprapubic region. In the central picture, it is fixed with a coil, and in the rightmost picture, it is observed with a coil placed on it.
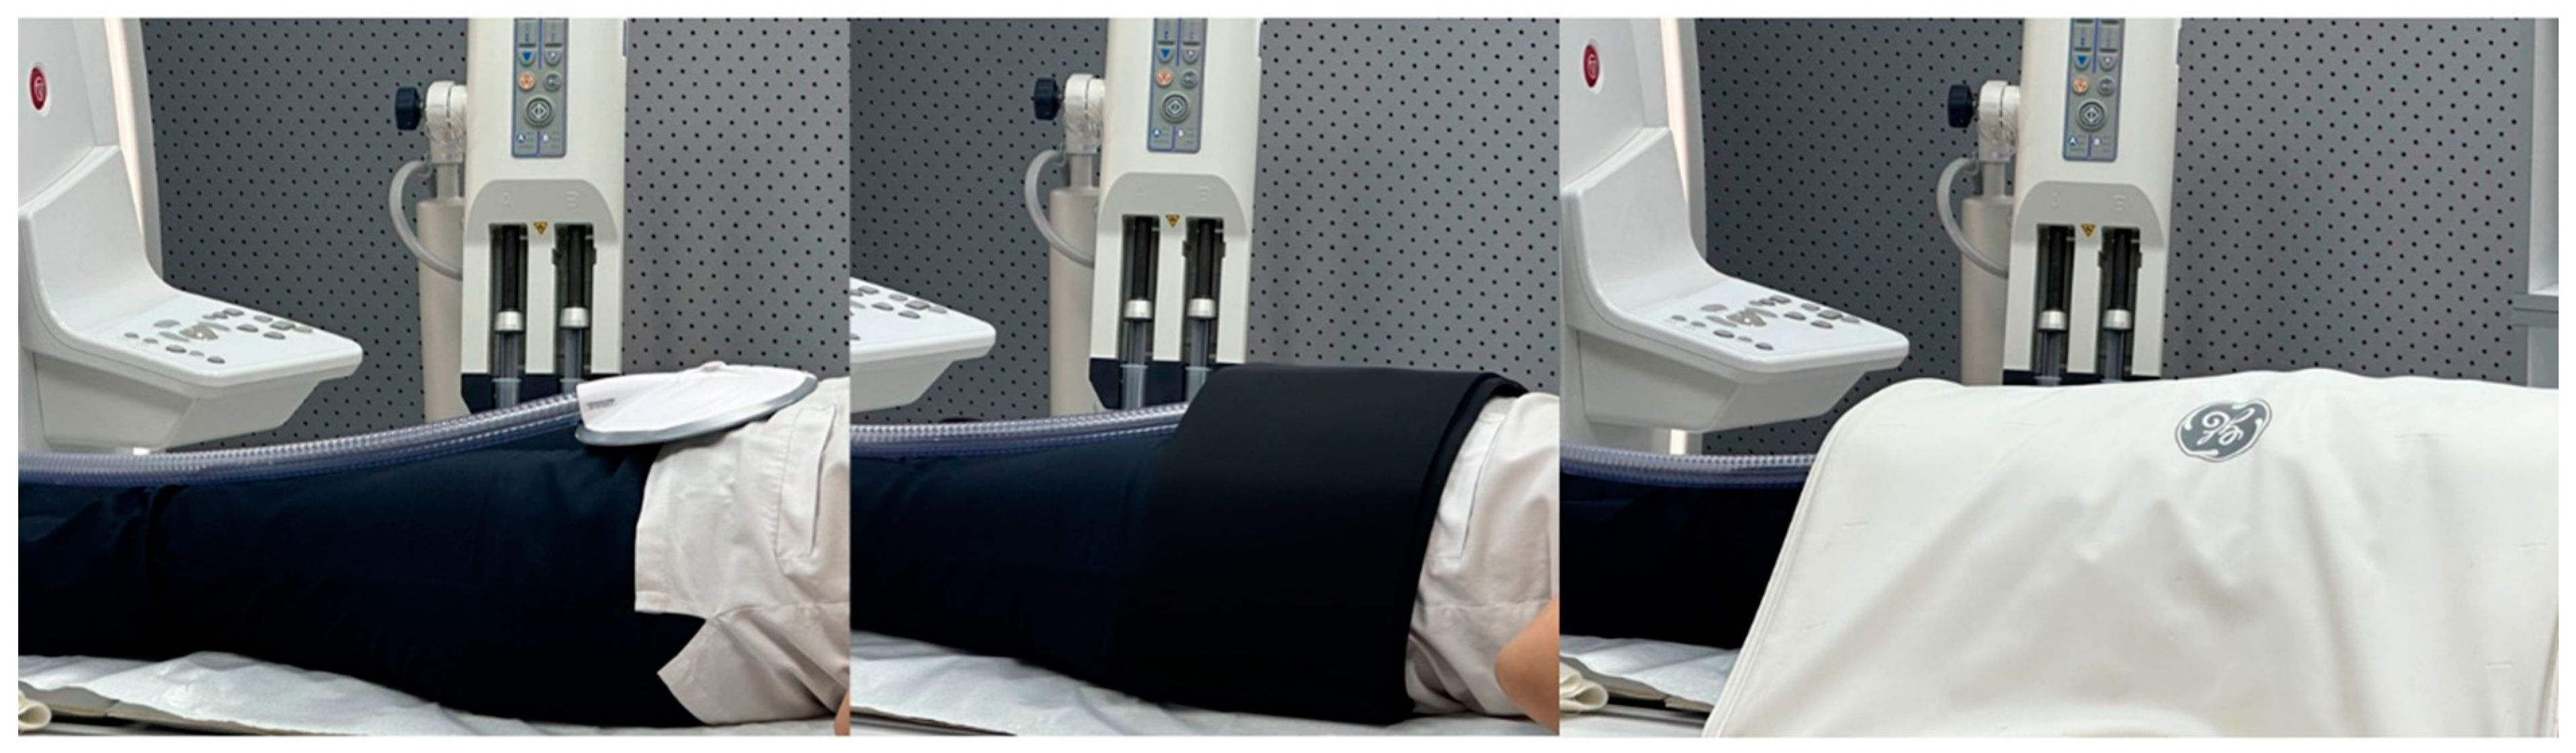
Figure 6.
In the top row, the leftmost image (A) is the axial spin-echo T2 sequence image, middle image (B) is the elastography dynamic pressure color map, and rightmost image (C) is the wave image. The leftmost image (D) is the stiffness color map and the middle image (E) is the elastography fusion image. In the rightmost image (F), the right testicular parenchyma was surrounded by a yellow line border and the left testicular parenchyma was surrounded by a blue line border, and measurements were made in Pa units from all of these areas of both testicular parenchymas over the fusion image.
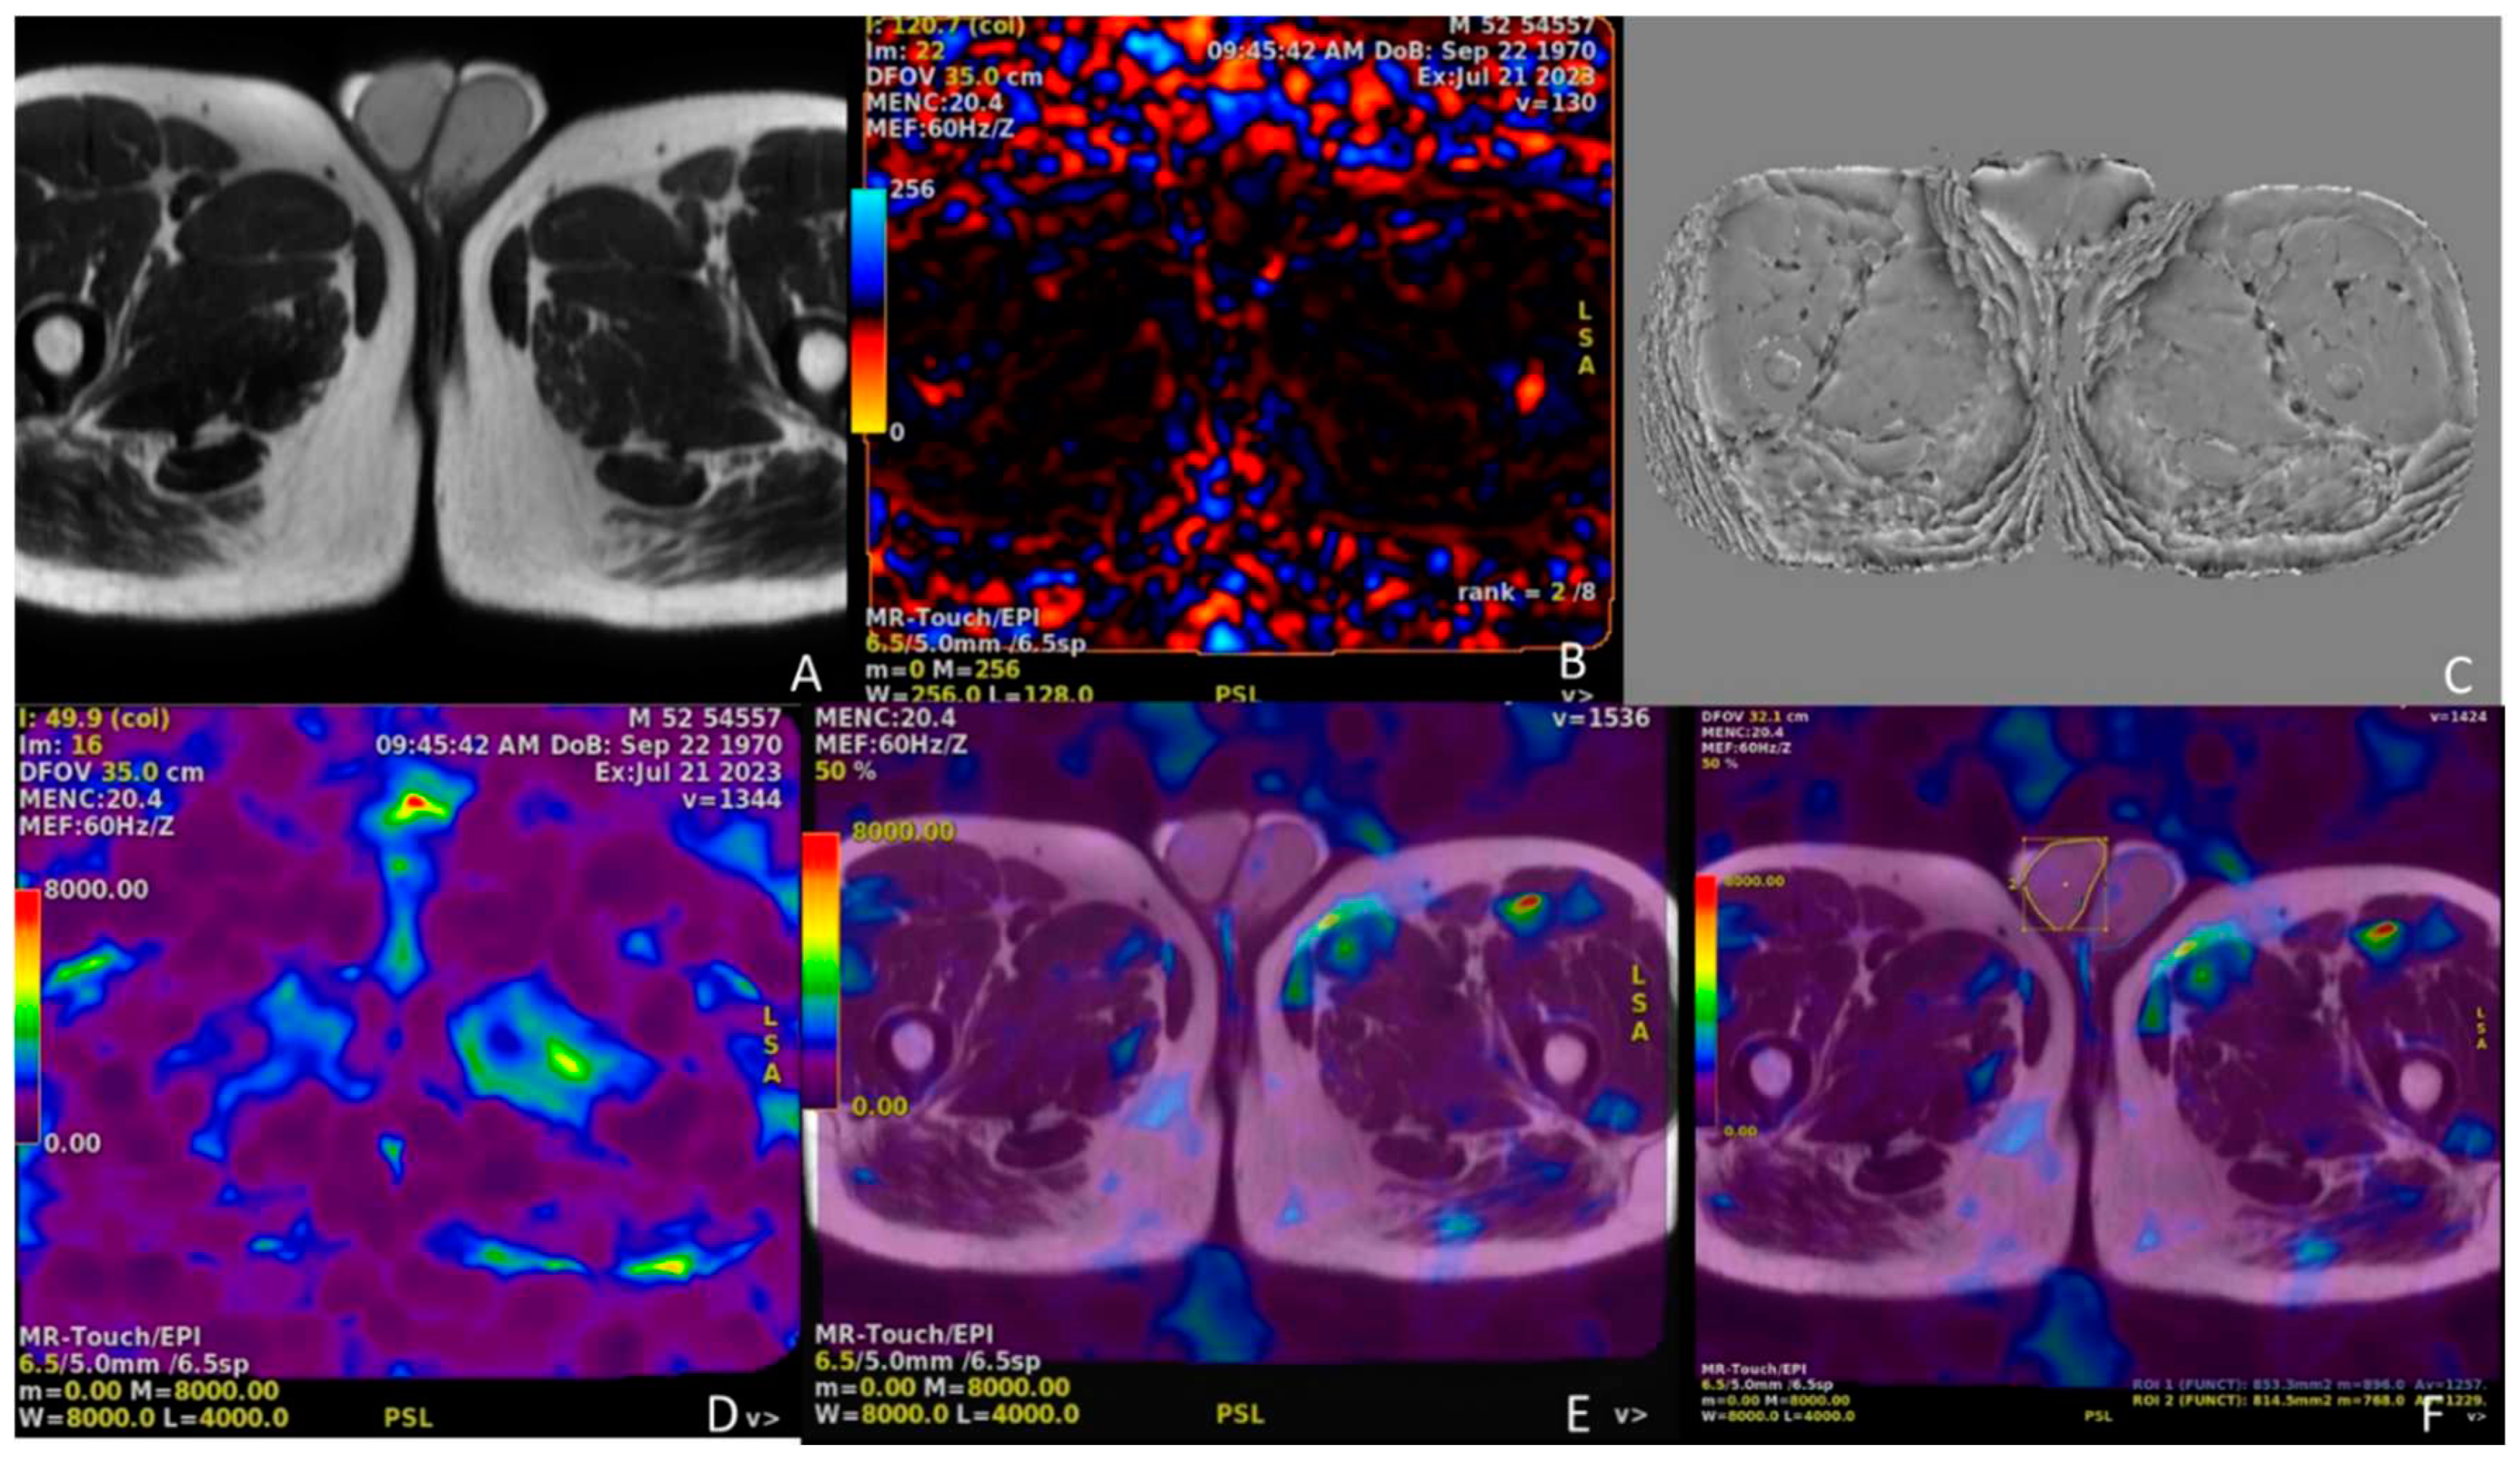

Table 1.
Table showing the age distribution of our patients age(years).
| Min. | 23 |
| Max. | 48 |
| Mean ±sd | 36.2 ± 11 |
| (Max.: maximum age Min.: minimum age, sd: standart deviation) | |
Table 2.
Smallest, largest and mean volumes of both testes volume(ml).
| Right | Left | |
| Min. | 12 | 11 |
| Max. | 15 | 15.2 |
| Mean ±sd | 13.4 ± 3.1 | 13.6 ± 3.2 |
| (Max.: maximum volume, Min.: minimum volume, sd: standart deviation) | ||
Table 3.
Table showing the relationship between testicular volume and age.
| Mean age ± sd: 36.2 ± 11 | Mean right testis volume±sd Mean left testis volume±sd | |
| 13.4 ± 3.1 p=0.083 |
13.6 ± 3.2 p=0.27 |
|
| (p: Pearson’s correlation coefficient p value, sd: standart deviation) | ||
Table 4.
US-E stiffness values (kPa).
| Right | Left | |
| Min. | 4.216 | 4.324 |
| Max. | 7.312 | 6.914 |
| Mean±sd | 5.560 ± 3.1 | 5.361 ± 2.9 |
| (kPa:kilopascal, Max.:maximum US-E stiffness, Min.:minimum US-E stiffness, sd: standart deviation) | ||
Table 5.
MR-E stiffness values (Pa).
| Right | Left | |
| Min. | 5302.12 | 5562.23 |
| Max. | 9211.10 | 8913.22 |
| Mean ±sd | 6960.11 ± 460 | 6560.19 ± 310 |
| (Max.:maximum MR-E stiffness, Min.:minimum MR-E stiffness, Pa:Pascal sd: standart deviation) | ||
Table 6.
Binary comparison between USG volume versus US-E stiffness and MR-E stiffness.
| USG volume (ml) |
US-E stiffness (kPa) p=0.17 |
MR-E stiffness (Pa) p=0.093 |
| (p: Pearson’s correlation coefficient p value) | ||
Table 7.
Binary comparison of each mean US-E stiffness and MR-E stiffness values four each testis.
| Device | Mean stiffness value |
| US-EMR-E | 5.431 Pa6763.44 Pa |
| p=0.096 | |
| (p: Pearson’s correlation coefficient p value) | |
Disclaimer/Publisher’s Note: The statements, opinions and data contained in all publications are solely those of the individual author(s) and contributor(s) and not of MDPI and/or the editor(s). MDPI and/or the editor(s) disclaim responsibility for any injury to people or property resulting from any ideas, methods, instructions or products referred to in the content. |
© 2023 by the authors. Licensee MDPI, Basel, Switzerland. This article is an open access article distributed under the terms and conditions of the Creative Commons Attribution (CC BY) license (https://creativecommons.org/licenses/by/4.0/).
Copyright: This open access article is published under a Creative Commons CC BY 4.0 license, which permit the free download, distribution, and reuse, provided that the author and preprint are cited in any reuse.


