
Submitted:
05 October 2023
Posted:
06 October 2023
You are already at the latest version
Abstract
This paper aims to measure the effects of delisting on stock returns for Vietnam stock market. The study employs a sample of 118 stocks that were compulsorily delisted from the market between January 2011 and December 2021. Using an event study methodology, the empirical findings confirm that the delisting has negative effects on stock returns in the Vietnam stock market. Specifically, results derived from tests show that the average abnormal return of delisted stocks continuously declines during three trading days following the announcement of delisting. Moreover, it is found that the differences in cumulative abnormal returns between post-delisting and pre-delisting periods are significantly negative for all tracking periods. Apart from the negative effect of delisting on stock abnormal returns, we also find that the impact of delisting on stock returns for smaller companies is greater than bigger companies.
Keywords:
Delisting
; stock returns
; Vietnam stock market
1. Introduction
Delisting, which is the removal of a listed stock from a stock exchange, has become a common phenomenon and has received increasing attention from both academics and practitioners during the past some decades. Delisting can be voluntary or compulsory (Park et al., 2018). A voluntary delisting is initiated by a listed company based on the cost-benefit analysis of keeping stocks listed on a stock exchange. However, a compulsory delisting occurs when a stock violates regulations and failing to meet financial standards of a stock exchange. According to Park et al. (2014), compulsory delisting is one of the worst consequences for shareholders’ wealth. Therefore, the effects of delisting on stock returns could depend on the type of delisting. In fact, some studies documented that voluntary delisting has no impact on stock returns (Sun et al., 2002; Liu, 2004; Pfister and von Wyss, 2010). On the other hand, some studies found the negative effects of compulsory delisting on abnormal returns (Meera et al., 2000; Chandy et al., 2004; You et al., 2012; Pour and Lasfer, 2013; Park et al., 2018; Fidanza, 2022).
Vietnam stock market comprises two stock exchanges, the Ho Chi Minh Stock Exchange (HOSE) and the Hanoi Stock Exhange (HNX). The HOSE, the first and largest stock exchange in Vietnam, was officially launched on July 28th 2000 while the HNX was established on March 8th 2005. Initially, the growth in the number of listed companies on the market was slow. In fact, only 32 companies with a total market capitalization of VND 7,390 billion (USD 326.4 million) were listed on the HOSE for the period from 2000 to 2005. However, the market has experienced rapid growth in the number of listed companies during the 2006-2021 period. By the end of 2021, a total of 404 companies with a total market capitalization of VND 5,838,100 billion (USD 257.9 billion) were listed on the HOSE, and 345 companies with a total market capitalization of VND 510,027 billion (USD 22.5 billion) floated their stocks on the HNX.
Along with the development of the market, an outstanding issue arose in the market of stock delistings. The list of delisted firms has been prolonged and most of delisted cases are compulsory due to continuous losses and violating the requirement of transparency. In fact, up to the end of 2021, there were 171 firms delisted from Vietnam stock market (Viet Nam Securities Depository and Clearing Corporation’s website, www.vds.vn, accessed on 30 June 2022). Although the effect of delisting on stock returns has been investigated in many stock markets, including both developed and developing markets, to our best knowledge, no study on this effect has been found for frontier markets. Therefore, this study fills this gap in literature by determining the effect of compulsory delisting on stock returns for Vietnam stock market, a frontier market. This study provides unique insights for the literature covering the effect of compulsory delisting on stock returns in a frontier market because Vietnam stock market has been characterized by dominated small individual investors and a low level of information transparency (Nguyen et al. 2022; Truong et al. 2022). These characteristics of the market could make investors have irrational reactions to delisting announcements. Therefore, it is expected that the effect of delisting on stock returns is more pronounced on the Vietnam stock market.
The paper proceeds as follows. Section 2 reviews related theories and empirical literature. Section 3 provides an overview of Vietnam stock market and its regulations on delisting. Section 4 summarizes the data and methodology employed in the study. Section 5 discusses the empirical findings. Finally, conclusions are presented in Section 6.
2. Literature Review
The timeline of literature on stock delisting started with the initial research for the US markets with a substantial number of studies examining delisting and this topic has continued to be examined for US stocks. Subsequently, researchers started examining delisting in international markets. The examination of different international markets is important to juxtapose against research for the US markets because each international market has different insider trading and short selling rules as well as different levels of informational efficiency across these markets. In addition, delistings can be broken into two general categories, voluntary and involuntary. The voluntary delistings may not contain substantial information. However involuntary delistings may convey substantial information about the future of the delisted firm.
Early papers included Sanger and Peterson (1990) who examined price changes for NYSE stocks and documented an 8.5% loss in shareholder wealth on the announcement date. They attributed this loss in value to liquidity issues as these stocks moved off the NYSE and into the over-the-counter market generally tracked on the pink sheets. In addition, Shumway (1997) examined the delisting bias in CRSP returns while subsequent research by Shumway and Warther (1999) studied the delisting bias in CRSP data’s impact on the size effect. At the time, CRSP returns omitted companies delisted in a given year. This was important to understand because CRSP data was relied on by both many market participants and researchers at the time of this study. Depending on the topic, it is critical for future research to control for potential survivorship bias for returns found in CRSP. The author found that delisting for bankruptcy and other negative reasons were surprises not anticipated by market participants. And, more importantly, they found that the correct delisting returns were not easily tracked for most stocks with very limited trading information on the Pink Sheets for many companies. Shumway and Warther (1999) found that after controlling for delisting, the size effect widely documented for NASDAQ listed companies vanishes.
Chandy et al (2004) chose the Nasdaq to study delisted stocks on the NMS specifically looking at changes in market value and liquidity. They found a significant increase in bid-ask spreads as well as decreased trading volume after the delisting. Overall, very similar to prior research on the NYSE by Sanger and Peterson (1990), the authors found a significant negative reaction for market returns after the delisting. The authors concluded that delisting increases the cost of capital and hurts liquidity.
Macey et al. (2008) focused on the NYSE to examine the economic reasons for delistings and the implications and legal rules around the delistings. Importantly, they found that approximately 50% of delistings were voluntary. Overall, for involuntary delistings they found very large costs associated with delisting. Percent spreads tripled and volatility doubled for their sample.
Eisdorfer (2008) looked at essentially all publicly traded delistings for the US markets by examining a broader cross-section of markets across the NYSE, AMEX and Nasdaq. The author examined momentum profits for short sellers of delisting firms. The results indicated that 40% of momentum profits were generated from delisted stock returns. Bankruptcies were the primary driver of these profits allowing traders to take advantage of the substantial declines spawned by the bankruptcy process. On the other hand, delistings from mergers only had a minor effect on momentum profits. The author also found that the ex-ante probability of bankruptcy created a stronger effect and profit opportunity for short sellers.
Liu and Stow (2005) took a unique approach to control for the difficulty of tracking delisted firms post delisting. The authors, however, examined only voluntary delistings on returns by looking at US companies that cross-listed in Japan and subsequently delisted from the Japanese market. The authors found no significant price changes after delisting for these cross-listed stocks but they found gradual price drops over time. Subsequently, along a similar vein of research, You et al. (2012) examined US stocks cross-listed on European exchanges. The authors examined the impact of delisting on the price, risk and liquidity of the delisted firms. They found a positive effect on the US companies price when they were initially cross-listed on a European exchange while as anticipated, observing a negative effect at these firms upon their delisting.
Recently, the effects of involuntary delisting from the NASDAQ on delisted firms was examine by Li et al. (2023). They documented a decline in liquidity, access to capital markets, investment and performance of delisted firms. However, they showed that these declines were not predominantly due to delisting. Li et al. (2023) indicated that the decline in daily trading volume and equity issuance of delisted firms only occurred for those having their stocks being actively traded prior to delisting.
For the international arena, Meera et al. (2000) and Sun et al (2002) examined the Malaysia and Singapore markets for the impact of delistings under different scenarios on market returns. Meera et al. (2002) documented a significant loss of delisted firms that were originally cross-listed on both the Malaysian and Singapore markets. Sun et al. (2002), on the other hand, looked at mass delistings for groups of companies where there is no firm specific information. They found that if there was no information conveyed by the delisting no abnormal returns were generated.
Pfister and von Wyss (2010) studies the return and volume effects of delisting from the primary exchange for the company for stocks delisted from the SIX Swiss Exchange, Deutsche Borse and the Tokyo Stock Exchange. First, the authors use standard event study methodology to examine the impact of the delisting. Interestingly, the authors find a limited impact around the delisting announcement or around the actual delisting date. However, they do find negative returns preceding the initial announcement. They also found that volume tended to increase at the announcement and effective delisting dates.
Pour and Lasfer (2013) examines London Stock Exchange delistings to identify the reasons for and the market valuation of voluntary delistings. The authors find that the sample of firms examined were likely to have become listed to rebalance firm leverage ratios instead of growth opportunities. For this group of companies, on average leverage remained high with firms no raising substantial equity. And, insider ownership was very high during the listing period. Results indicate that profitability, growth opportunities and volume fell markedly surrounding the delisting process. The authors also find that delisted firms on average had negative pre and post event returns after controlling for possible agency and liquidity effects as well as asymmetric information. The results indicate that the sample firms delisted voluntarily when find no benefit from the initial listing. As a group, the decision to list significantly impacted shareholder wealth and these firms probably should have avoiding listing in the first place. They also generate negative pre-event and announcement date excess returns. These results hold even after controlling for agency, asymmetric information, and liquidity effects, and suggest that firms delist voluntarily when they fail to benefit from listing. Overall, these firms destroyed shareholder value and they should not have come to the market.
Park et al. (2014) looked at involuntary delisting for the Korea and examined informed trading effects across domestic individual retail investors, domestic institutional traders and foreign investors. They found abnormal returns for short sellers of 80% to 90% for firms involuntarily delisted. In addition, liquidity drops substantially. There were clear differences in trading strategies across the different investor groups. Domestic individual investors were net buyers prior to the delisting announcement while domestic institutional traders and foreign investors were net sellers. They also documented that large shareholder block ownership declined over 30% over the two years prior to the delisting indicating that informed investors had identified the potential losses that may be generated by these companies and started adjusting their holdings down.
Park et al. (2018) looked at the wealth effects of involuntary delistings for Japanese stocks. Similar to Park et al. (2014) the authors examined the influence of what they called “insider opportunism” surrounding a delisting as well as corporate governance structures, liquidity and the legal environment for these involuntary delistings. To document insider opportunism, they examined ownership changes by insiders prior to the delistings. The authors results expose the disruption and low liquidity surrounding the delisting. Interestingly, they found only small insider ownership changes of around a 2% to 3% drop in insider ownership. The Japanese markets are uniquely different from the US markets both for their insider trading legal differences as well as the Keiretsu ownership structure of Japanese firms where large banks often make substantial investments in the firms with whom they have business relationships. The authors find that higher insider bank ownership contributed to less price decline prior to the delistings but a much greater drop after the delistings for their sample of firms.
Huynh and Smith (2017), similar to previous research in the US markets on momentum trading profits, studied momentum effects of delistings for the Australian market. The momentum strategy success depended on the nature of the delisted stock. The found large stocks have momentum profits even after controlling for delisting. More recently, Fidanza (2022) looked at the wealth effects of delisted firms on European exchanges using an event student methodology and also examined operating performance for these firms after their delisting. The authors found a bump in pre-delisting prices while observing price declines following the announcements. Interestingly, they found that operating performance showed no significant change post delisting.
Overall, for the U.S. and international markets, the research indicates a clear negative impact of returns for involuntary delistings especially surrounding firm bankruptcy. However, for voluntary delistings and mergers there is generally little to no impact on returns surrounding the delisting process.
3. Overview of Vietnam stock market and regulations on delisting in Vietnam
Vietnam stock market consists of two stock exchanges, Ho Chi Minh Stock Exchange (HOSE) and Hanoi Stock Exhange (HNX). Launched on 28 July 2000, the HOSE is the first and largest stock exchange in Vietnam. According to the Decree No. 58/2012/ND-CP dated 20 July 2012, only firms with a minimum equity of VND 120 billion (about USD 5.3 million) are licensed to list their stocks on the HOSE, while a minimum equity is required for listing stocks on HNX is only VND 30 billion (USD 1.3 million). At the first trading session, only two stocks with a total market capitalization of VND 444 billion (USD 19.4 million) were traded on the HOSE. The growth in the number of listed companies on the market was slow in the beginning. In fact, at the end of 2001, only 11 companies listed their stocks on the market. Despite this slow initial growth, over the last two decades the HOSE experienced rapid growth as a larger number of enterprises went public. By the end of 2021, there are 749 companies listed their stocks on the market, including 404 compnies on the HOSE and 345 companies on the HNX. In addition, the market size, measured by the capitalization-to-GDP ratio, has rather small in the 2000-2005 period, but it has remarkably increased during the period from 2006 to 2021. In fact, the market’s capitalization-to-GDP ratio reachs to 75,6% at the end of 2021 compared with 0.2% and 0.9% at the end of 2000 and 2005, respectively. Although Vietnam stock market has considerably increased in number of listed companies and capitalization during the past two decades, it has been still classified in the frontier markets group according to the MSCI (Morgan Stanley Capital International)’s market classification.
Regarding stock delisting, according to the Vietnamese Law on Securities, stocks could be delisted from a stock exchange either voluntary or compulsory. A voluntary delisting is decided by a listed company based on the cost-benefit analysis of keeping stocks listed. On the other hand, a compulsory delisting occurs when a stock violates regulations and failing to meet financial standards. Specifically, a stock is compulsorily delisted from a stock exchange if it falls in one of the following cases:
- -
- The listed company is cancelled according to a notification from the State Securities Commission (SSC) of Vietnam;
- -
- The listed company suspends its main business and production activities for at least one year;
- -
- The listed company has its registration certificate or operational license revoked;
- -
- The listed company’s shares are not traded at a stock exchange for one year;
- -
- The company’s stocks are not put into trading within 90 days from the date on which a listing is approved by a stock exchange;
- -
- The listed company incurs losses in three consecutive years or total accumulated losses exceed the contributed charter capital, or the equity is negative in the the latest audited annual;
- -
- The listed company ceases to exist as a result of a reorganization, dissolution or bankruptcy;
- -
- The auditing company refuse to audit or refuse to provide an opinon on latest annual financial statements of the listed company or have an exceptional opinion for the annual financial statements of three consecutive years;
- -
- The listed company violates the deadline for annual financial statements submission for three consecutive years;
- -
- The SSC or the stock exchange discovers that the listed company uses fraudulent documents in the application for listing;
- -
- The listed company’s main business lines are suspended or banned;
- -
- The listed company does not fullfil requirements for listing as a result of merger or split or other restructuring of the companies;
- -
- The listed company violates seriously the obligation of information dislosure or fails to complete its financial obligations to the stock exchange.
4. Data and Methodology
4.1. Data
This study employs a sample of 118 stocks that were compulsorily delisted from Vietnam stock market for the period from October 2011 to December 2021. It is important to note that the first company, which was delisted from the market, was on 10th October 2011. To serve for the event study, daily price data on stocks and market index are collected for 10 trading days before and after the announcement date of delisting. The data were obtained from the website of the HOSE (www.hsx.vn, accessed on 30th June 2022) and the HNX (www.hnx.vn, accessed on 30 June 2022). Then, the daily continuously compounded returns for stocks and market are calculated by the following equation:
where,
Rt : Stock/market returns at trading day t;
Pt: Stock prices/market index at trading day t;
Pt-1: Stock prices/market index at trading day t-1.
4.2. Research Methodology
To investigate the effects of delisting on stock returns in Vietnam stock market, this study employs the event study methodology that has been widely used in the financial literature (Liu and Stow, 2005; Truong et al., 2006; You et al. 2012; Fidanza, 2022). In this study, the event date is defined as the announcement date of delisting and the event window includes 10 pre-event days and 10 post-event days (-10, +10). To employ the event study methodology, first, abnormal returns (AR) are calculated for each stock by using the market adjusted model as follows:
where,
ARit: Abnormal return of stock i for trading day t;
Rit: Stock return of stock i for trading day t;
Rmt: Market return for trading day t;
Then, average abnormal returns (AAR) for each trading day of the event window are computed by using the following equation:
Subsequently, the average cumulative abnormal returns (ACAR) are calculated for each tracking period (k) by using the equation:
Finally, both parametric t-test and nonparametric signed-rank test are applied to test for statistically significance of the differences in abnormal return between pre and post-delisting periods. It is expected that the delisting has negative effects on stock returns. In other words, the abnormal return of stocks in the post-delisting periods is lower than their own returns in the pre-delisting.
Given a negative effect on abnormal returns as a result of delisting, the literature documents that difference would arise due to difference in size of companies (Fama and French, 1993; Shumway and Warther, 1999; Huynh and Smith, 2017). Therefore, in the next step we divide our data into two groups, bigger firms and smaller firms, based on their capitalization in delisting announcement date. Firms with capitalization above the median of the sample are referred to as bigger firms; otherwise they belong to the second group of smaller firms. The difference effects of delisting on abnormal returns between two groups are also tested as the same procedure mentioned above.
5. Empirical Results
5.1. Descriptive statistics of AR of delisted stocks
The descriptive statistics of abnormal returns for single days around delisting announcement are presented in Table 1. It is obeserved that the mean AR is negative for all single days around announcement dates of delisting, except T-6 and T-7. For the post-delisting announcement period, the largest and smallest negative mean AR are found for T+3 (-0.0134) and T+9 (-0.0004) respectively. Moreover, Figure 1 shows that the mean AR tends to decrease for the period from T-7 to T-1 and drop sharely during the period from T+1 to T+3. In addition, the descriptive statistics of ACAR shown in Table 2 indicate that the mean ACAR is negative for all studied periods following announcement dates of delisting, ranging from -0.0124 [+1,+3] to -0.0070 [+1,+9].

Table 1.
Descriptive statistics of AR of delisted stocks around announcement dates.
| Trading days | Observations | Minimum | Mean | Maximum | Standard deviation |
|---|---|---|---|---|---|
| - Pre-delisting announcement | |||||
| T-10 | 118 | -0.0505 | -0.0015 | 0.0354 | 0.0158 |
| T-9 | 118 | -0.0482 | -0.0015 | 0.0414 | 0.0176 |
| T-8 | 118 | -0.0958 | -0.0016 | 0.0543 | 0.0200 |
| T-7 | 118 | -0.0606 | 0.0034 | 0.0522 | 0.0173 |
| T-6 | 118 | -0.0516 | 0.0005 | 0.0534 | 0.0186 |
| T-5 | 118 | -0.0545 | -0.0027 | 0.0527 | 0.0208 |
| T-4 | 118 | -0.0452 | -0.0002 | 0.0506 | 0.0186 |
| T-3 | 118 | -0.1283 | -0.0021 | 0.0654 | 0.0216 |
| T-2 | 118 | -0.0631 | -0.0005 | 0.0387 | 0.0176 |
| T-1 | 118 | -0.0507 | -0.0045 | 0.0427 | 0.0164 |
| T0 | 118 | -0.0581 | -0.0046 | 0.0327 | 0.0188 |
| - Post-delisting announcement | |||||
| T+1 | 118 | -0.1069 | -0.0121 | 0.0401 | 0.0227 |
| T+2 | 118 | -0.0785 | -0.0128 | 0.0815 | 0.0236 |
| T+3 | 118 | -0.1759 | -0.0134 | 0.0634 | 0.0268 |
| T+4 | 118 | -0.0547 | -0.0043 | 0.1381 | 0.0309 |
| T+5 | 118 | -0.0592 | -0.0094 | 0.0632 | 0.0236 |
| T+6 | 118 | -0.0915 | -0.0074 | 0.0447 | 0.0250 |
| T+7 | 118 | -0.0796 | -0.0047 | 0.1729 | 0.0339 |
| T+8 | 118 | -0.0610 | -0.0026 | 0.0603 | 0.0237 |
| T+9 | 118 | -0.0467 | -0.0004 | 0.1053 | 0.0284 |
| T+10 | 118 | -0.0787 | -0.0095 | 0.0598 | 0.0256 |
Note: T0 is the announcement date of delisting.
Figure 1.
Average AR of stocks around announcement dates of delisting.
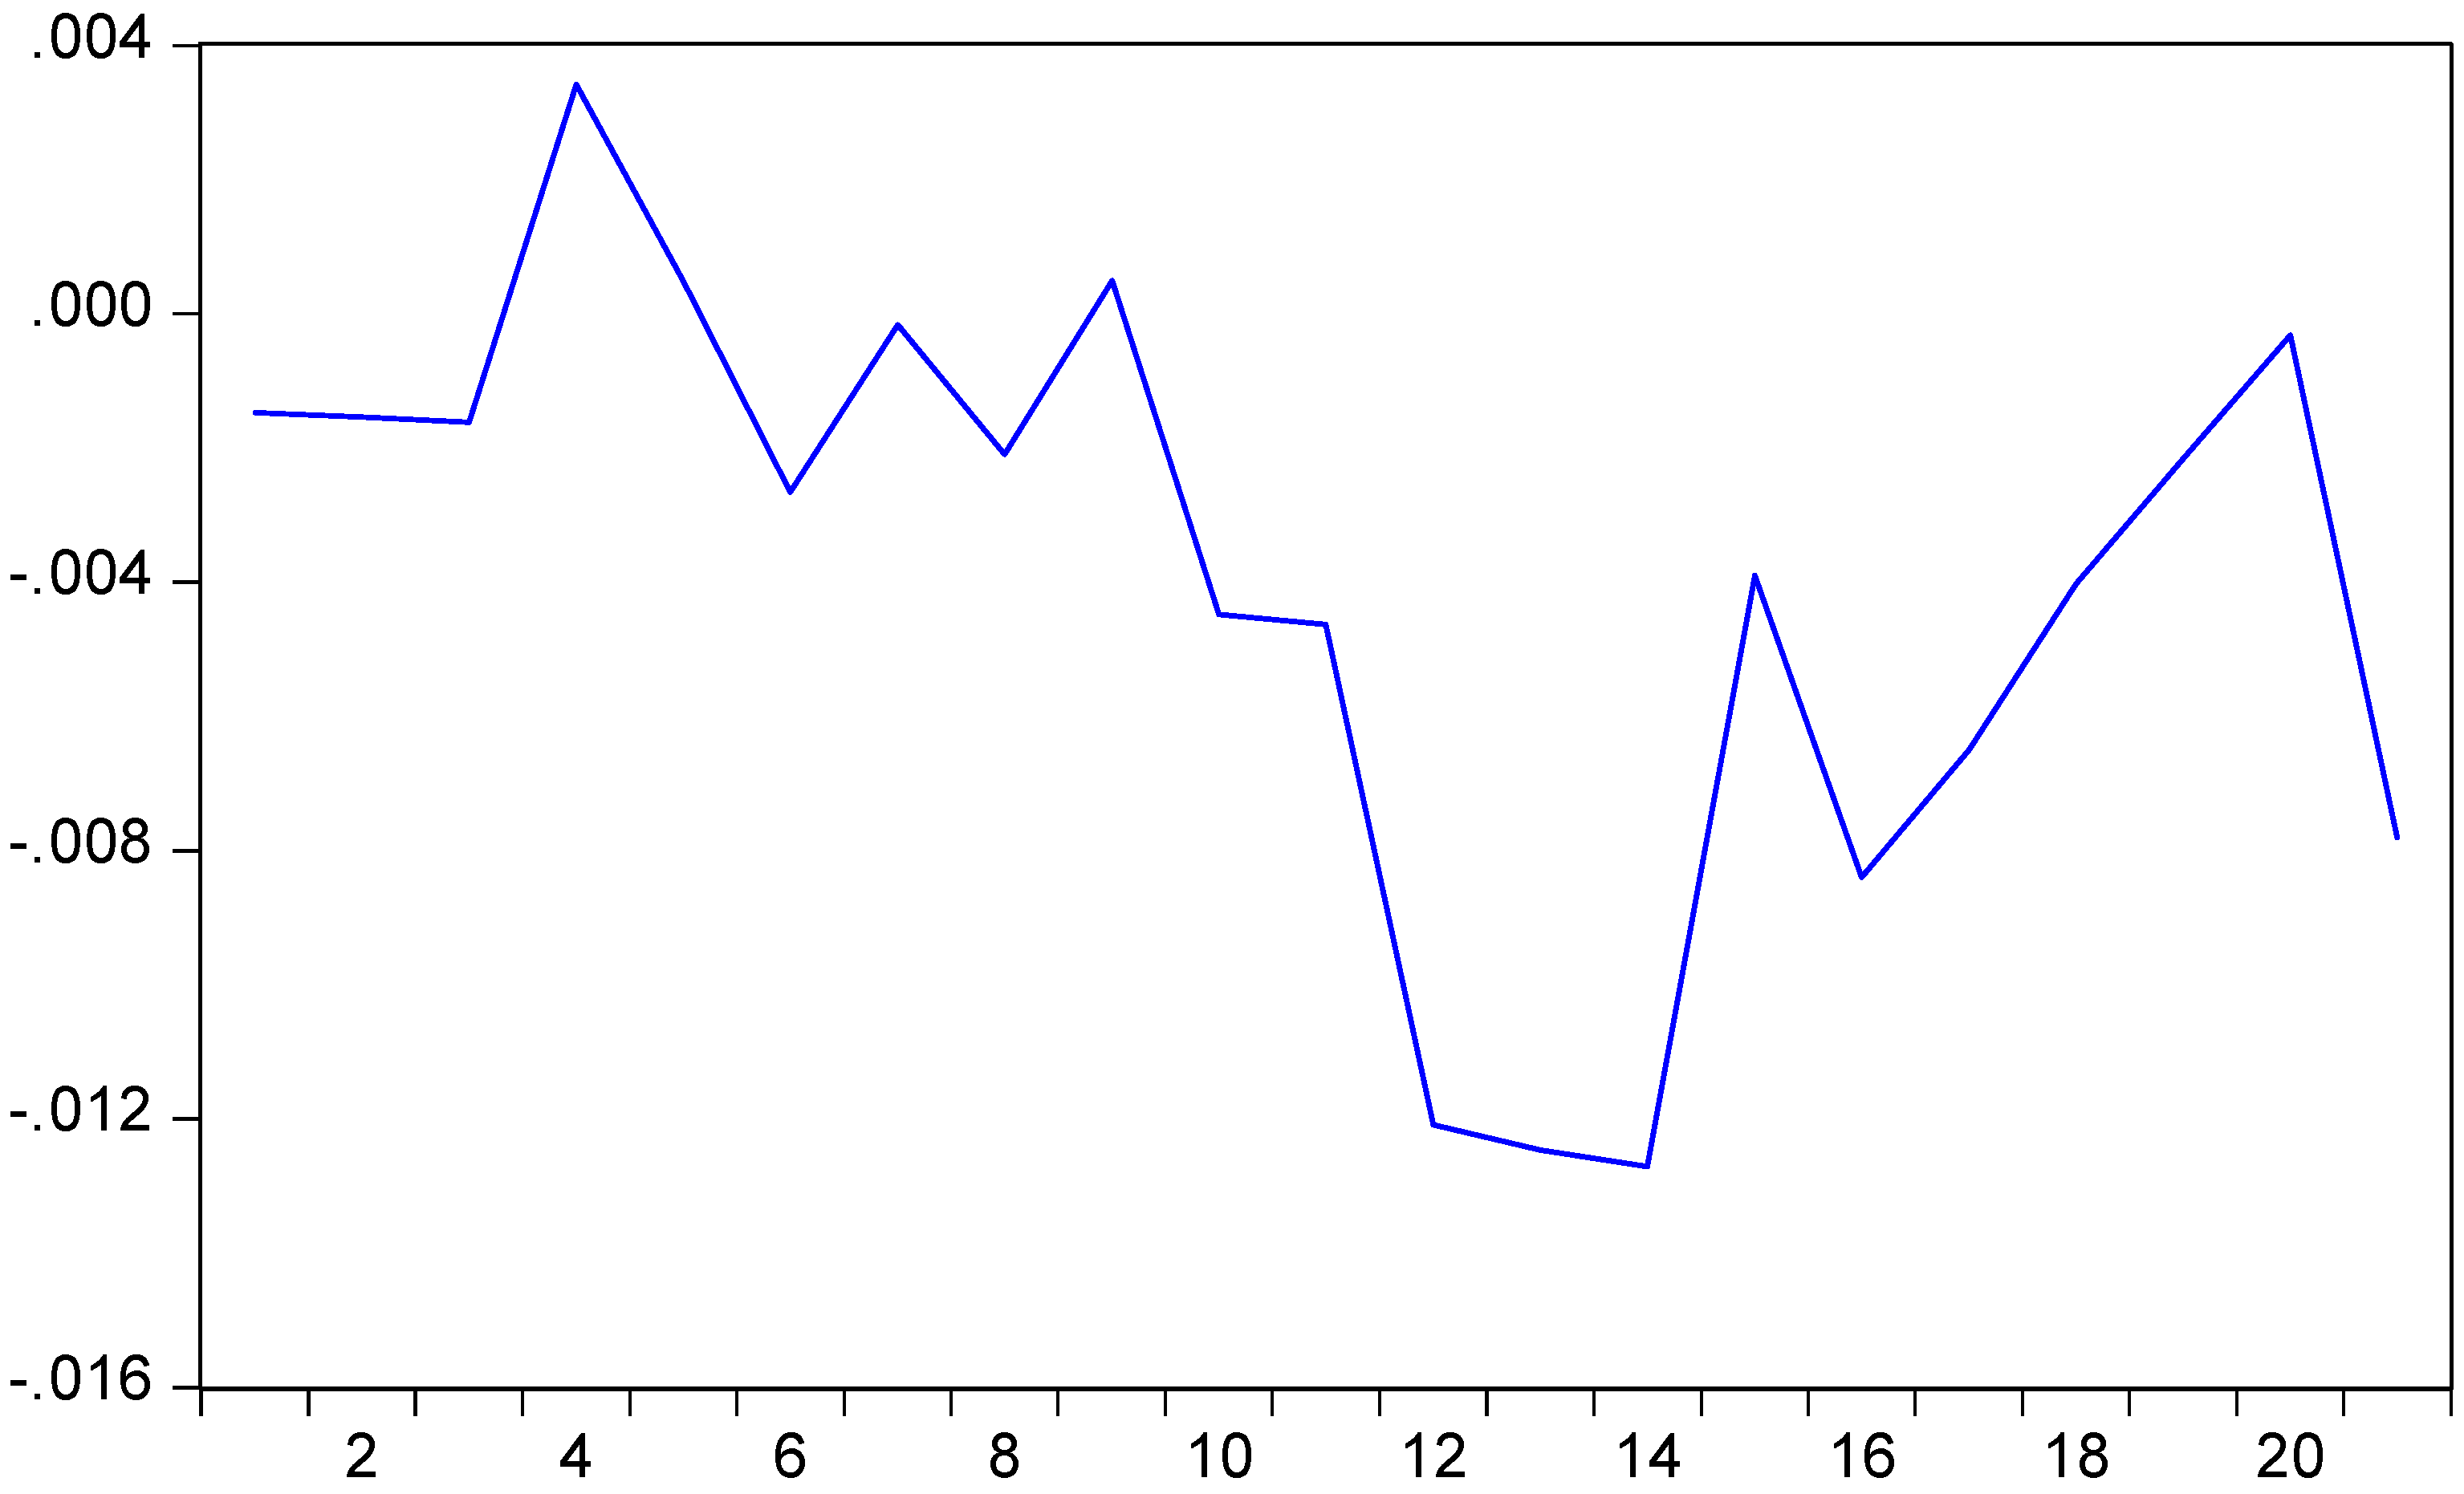
Table 2.
Descriptive statistics of ACAR of delisted stocks for studied periods.
| Periods | Observations | Minimum | Mean | Maximum | Standard deviation |
|---|---|---|---|---|---|
| - Pre-delisting announcement periods | |||||
| [-1, -2] | 118 | -0.0746 | -0.0028 | 0.0685 | 0.0195 |
| [-1, -3] | 118 | -0.0731 | -0.0032 | 0.0562 | 0.0157 |
| [-1, -4] | 118 | -0.0733 | -0.0027 | 0.0414 | 0.0149 |
| [-1, -5] | 118 | -0.0586 | -0.0030 | 0.0395 | 0.0135 |
| [-1, -6] | 118 | -0.0523 | -0.0022 | 0.0442 | 0.0123 |
| [-1, -7] | 118 | -0.0536 | -0.0012 | 0.0477 | 0.0118 |
| [-1, -8] | 118 | -0.0549 | -0.0013 | 0.0491 | 0.0110 |
| [-1, -9] | 118 | -0.0425 | -0.0011 | 0.0518 | 0.0103 |
| [-1, -10] | 118 | -0.0340 | -0.0010 | 0.0537 | 0.0102 |
| - Post-delisting announcement periods | |||||
| [+1, +2] | 118 | -0.0728 | -0.0123 | 0.0312 | 0.0181 |
| [+1, +3] | 118 | -0.0804 | -0.0124 | 0.0267 | 0.0162 |
| [+1, +4] | 118 | -0.0453 | -0.0103 | 0.0338 | 0.0144 |
| [+1, +5] | 118 | -0.0478 | -0.0099 | 0.0341 | 0.0140 |
| [+1, +6] | 118 | -0.0413 | -0.0093 | 0.0339 | 0.0132 |
| [+1, +7] | 118 | -0.0468 | -0.0086 | 0.0348 | 0.0129 |
| [+1, +8] | 118 | -0.0413 | -0.0078 | 0.0371 | 0.0122 |
| [+1, +9] | 118 | -0.0311 | -0.0070 | 0.0355 | 0.0113 |
| [+1, +10] | 118 | -0.0342 | -0.0070 | 0.0319 | 0.0110 |
5.2. The effects of delisting announcement on stock returns
Based on the sample of 118 delisted stocks, the parametric and non-parametric tests are conducted to measure the effects of delisting on stock returns in Vietnam stock market. The empirical results derived from these tests are reported in Table 3 and Table 4. Specifically, Table 3 shows that the mean AR of delisted stocks is negative and statistically different from zero at the one percent level for T+1, T+2, T+3, T+5, T+6 and T+10. In addition, it is found from Table 3 that the average AR of delisted stocks for the first three trading days following the announcement of delisting are lower than the first trading day before the announcement of delisting. Specifically the mean AR for T+1 and T+2 is lower than T-1 by 0.76% and 0.83% at the 1% level of significance respectively.
Furthermore, the results presented in Table 4 reveals that the mean ACAR of delisted stocks is negative and statistically different from zero at the one percent level for all studied period following the announcement of delisting. In addition, a comparison of ACAR between pre- and post-delisting periods indicates that the differences in mean (median) ACAR are negative and statistically significant difference from zero at the one percent level for all studied periods. The difference is largest for the period [+1, +2] and tend to be decrease for the remaining periods.
In summary, based on these findings, it can be concluded that the delisting has negative effects on stock returns in Vietnam stock market. The findings are in line with previous empirical results of Meera et al. (2000), Chandy et al. (2004), You et al. (2012), Pour and Lasfer (2013), Park et al. (2018), Fidanza (2022). This evidence implies that investors can earn abnormal returns by establishing the trading strategies on the basis of delisting information. Specifically, the proposed trading strategy is that investors should sell stocks immediately information about delisting released and buy them back at the third day following the announcement of delisting, and then sell them again at T+9. It is important to note that current transactions costs for stock trading on Vietnam stock market are about 0.20% (Truong et al., 2023). Therefore, by using this trading strategy, investors can earn about 1,78% in return.
With the negative effect of delisting on stock returns, it is expected that difference would arise due to difference in size of companies. Therefore, in the next step we split the data into two groups, bigger firms and smaller firms, based on their capitalization in delisting announcement date. Firms with capitalization above the median of the sample are referred to as bigger firms; otherwise they belong to the second group of smaller firms. The results derived from tests for the difference effects of delisting on stock returns between two groups are presented in Table 5. It is observed that the delisting has a negative effect on returns of two groups for all tracking periods following the announcement of delisting. However, the effect for each group is different. Specifically, the negative effect of delisting on returns of smaller firms are greater than for bigger firms. For instance, the outcome of our comparison shows that the differences in mean ACAR for smaller firms are -0.0162 [+1,+2] and -0.0151 [+1,+3] as compared to -0.0028 [+1,+2] and -0.0038 [+1,+3] for the larger firms.
Table 3.
Summary of results from tests for AR of trading days following the announcement of delisting.
Table 3.
Summary of results from tests for AR of trading days following the announcement of delisting.
| Trading day | Observations | Mean (median) |
Trading days | Mean (median) |
Differences in mean (median) between two trading days | t-statistic for difference in mean between two trading days | z-statistic for difference in median between two trading days |
|---|---|---|---|---|---|---|---|
| T-1 | 118 | -0.0045 (-0.0013) |
T+1 | -0.0121*** (-0.0048) |
-0.0076 (-0.0035) |
2.95*** |
2.62*** |
| T-1 | 118 | -0.0045 (-0.0013) |
T+2 | -0.0128*** (-0.0090) |
-0.0083 (-0.0077) |
3.13*** |
3.76*** |
| T-1 | 118 | -0.0045 (-0.0013) |
T+3 | -0.0134*** (-0.0080) |
-0.0089 (-0.0067) |
3.06*** |
3.31*** |
| T-1 | 118 | -0.0045 (-0.0013) |
T+4 | -0.0043 (-0.0034) |
0.0002 (-0.0021) |
0.07 |
1.29 |
| T-1 | 118 | -0.0045 (-0.0013) |
T+5 | -0.0094*** (-0.0064) |
-0.0049 (-0.0051) |
1.84 |
2.26** |
| T-1 | 118 | -0.0045 (-0.0013) |
T+6 | -0.0074*** (-0.0059) |
-0.0029 (-0.0046) |
1.05 |
1.66 |
| T-1 | 118 | -0.0045 (-0.0013) |
T+7 | -0.0047 (-0.0027) |
-0.0002 (-0.0014) |
0.06 |
0.94 |
| T-1 | 118 | -0.0045 (-0.0013) |
T+8 | -0.0026 (-0.0003) |
0.0019 (0.0010) |
0.70 |
0.77 |
| T-1 | 118 | -0.0045 (-0.0013) |
T+9 | -0.0004 (-0.0014) |
0.0041 (-0.0001) |
1.32 |
0.26 |
| T-1 | 118 | -0.0045 (-0.0013) |
T+10 | -0.0095*** (-0.0040) |
-0.0050 (-0.0027) |
1.74 |
1.75 |
***, and ** denote significance at 1% and 5% levels respectively.
Table 4.
Summary of results from tests for ACAR of studied periods following the announcement date of delisting.
Table 4.
Summary of results from tests for ACAR of studied periods following the announcement date of delisting.
| Pre-delisting periods | Observations | Mean (median) | Post-delisting periods | Mean (median) | Differences in mean (median) between two periods | t-statistic for difference in mean between two periods | z-statistic for difference in median between two periods |
|---|---|---|---|---|---|---|---|
| [-1, -2] | 118 | -0.0028 (-0.0002) |
[+1, +2] | -0.0123** (-0.0101) |
-0.0095 (-0.0099) |
-3.86*** |
4.57*** |
| [-1, -3] | 118 | -0.0032** (-0.0013) |
[+1, +3] | -0.0124*** (-0.0115) |
-0.0092 (-0.0102) |
-4.43*** |
4.84*** |
| [-1, -4] | 118 | -0.0027* (-0.0013) |
[+1, +4] | -0.0103*** (-0.0094) |
-0.0076 (-0.0081) |
-3.99*** |
4.53*** |
| [-1, -5] | 118 | -0.0030** (-0.0016) |
[+1, +5] | -0.0099*** (-0.0089) |
-0.0069 (-0.0073) |
-3.84*** | 4.20*** |
| [-1, -6] | 118 | -0.0022* (-0.0009) |
[+1, +6] | -0.0093*** (-0.0069) |
-0.0071 (-0.0060) |
-4.33*** | 4.72*** |
| [-1, -7] | 118 | -0.0012 (-0.0007) |
[+1, +7] | -0.0086*** (-0.0070) |
-0.0074 (-0.0063) |
-4.59*** |
4.93*** |
| [-1, -8] | 118 | -0.0013 (-0.0006) |
[+1, +8] | -0.0078*** (-0.0060) |
-0.0065 (-0.0054) |
-4.31*** |
4.78*** |
| [-1, -9] | 118 | -0.0011 (-0.0009) |
[+1, +9] | -0.0070*** (-0.0048) |
-0.0059 (-0.0039) |
-4.16*** |
4.26*** |
| [-1, -10] | 118 | -0.0010 (-0.0009) |
[+1, +10] | -0.0070*** (-0.0053) |
-0.0060 (-0.0044) |
-4.34*** |
4.20*** |
***, ** and * denote significance at 1%, 5% and 10% levels respectively.
Table 5.
Summary of results from tests for differences in ACAR between larger and smaller firms.
| Bigger firms | Smaller firms | Differences in mean (median) between two groups | t-statistic (z-statistic) for difference in mean (median) between two groups | ||||||||
|---|---|---|---|---|---|---|---|---|---|---|---|
| Pre-delisting periods | Mean (median) | Post-delisting periods | Mean (median) | Differences in mean (median) between two periods | Pre-delisting periods | Mean (median) | Post-delisting periods | Mean (median) | Differences in mean (median) between two periods | ||
| [-1] | -0.0067 (-0.0016) |
[+1] | -0.0066 (-0.0004) |
0.0001 (0.0012) |
[-1] | -0.0058 (-0.0022) |
[+1] | -0.0176 (-0.0127) |
-0.0118 (-0.0105) |
0.0119 (0.0093) |
1.97* (1.91)* |
| [-1,-2] | -0.0033 (-0.0014) |
[+1,+2] | -0.0061 (-0.0031) |
-0.0028 (-0.0017) |
[-1,-2] | -0.0022 ( 0.0020) |
[+1,+2] | -0.0184 (-0.0177) |
-0.0162 (-0.0157) |
0.0134 (0.0140) |
3.05*** (3.12)*** |
| [-1 -3] | -0.0030 (-0.0013) |
[+1,+3] | -0.0063 (-0.0030) |
-0.0033 (-0.0017) |
[-1,-3] | -0.0034 (-0.0010) |
[+1,+3] | -0.0185 (-0.0185) |
-0.0151 (-0.0175) |
0.0118 (0.0158) |
3.09*** (3.58)*** |
| [-1,-4] | -0.0013 (-0.0016) |
[+1,+4] | -0.0041 (-0.0038) |
-0.0028 (-0.0022) |
[-1,-4] | -0.0040 (-0.0006) |
[+1,+4] | -0.0165 (-0.0174) |
-0.0125 (-0.0168) |
0.0097 (0.0146) |
2.77*** (3.02)*** |
| [-1,-5] | -0.0014 (-0.0017) |
[+1,+5] | -0.0043 (-0.0027) |
-0.0029 (-0.0010) |
[-1,-5] | -0.0046 (-0.0013) |
[+1,+5] | -0.0155 (-0.0169) |
-0.0109 (-0.0156) |
0.0080 (0.0146) |
2.37** (2.66)*** |
| [-1,-6] | -0.0004 (-0.0011) |
[+1,+6] | -0.0043 (-0.0035) |
-0.0039 (-0.0024) |
[-1,-6] | -0.0040 (-0.0008) |
[+1,+6] | -0.0144 (-0.0161) |
-0.0104 (-0.0153) |
0.0065 (0.0129) |
2.17** (2.60)*** |
| [-1,-7] | 0.0010 (-0.0008) |
[+1,+7] | -0.0033 (-0.0022) |
-0.0043 (-0.0014) |
[-1,-7] | -0.0034 (-0.0006) |
[+1,+7] | -0.0139 (-0.0131) |
-0.0105 (-0.0125) |
0.0062 (0.0111) |
2.11** (2.27)** |
| [-1,-8] | 0.0005 (-0.0001) |
[+1,+8] | -0.0029 (-0.0026) |
-0.0034 (-0.0025) |
[-1,-8] | -0.0030 (-0.0012) |
[+1,+8] | -0.0127 (-0.0118) |
-0.0097 (-0.0106) |
0.0063 (0.0081) |
2.21** (2.83)*** |
| [-1,-9] | 0.0009 (-0.0004) |
[+1,+9] | -0.0024 (-0.0013) |
-0.0033 (-0.0009) |
[-1,-9] | -0.0031 (-0.0021) |
[+1,+9] | -0.0115 (-0.0133) |
-0.0084 (-0.0112) |
0.0051 (0.0103) |
1.92* (2.68)*** |
| [-1,-10] | 0.0009 (-0.0007) |
[+1,+10] | -0.0025 (-0.0013) |
-0.0034 (-0.0006) |
[-1,-10] | -0.0029 (-0.0022) |
[+1,+10] | -0.0116 (-0.0105) |
-0.0088 (-0.0083) |
0.0054 (0.0077) |
1.97* (2.71)*** |
***, **, and * denote significance at 1% , 5% and 10% levels respectively.
6. Conclusions
This study empirically investigates the effects of delisting on stock returns for Vietnam stock market. Using the event study approach, the results derived from both parametric and non-parametric tests consistently confirm that the delisting has negative effects on stock returns in Vietnam stock market. Specifically, AR of stocks is negative for all single days following announcement dates of delisting. In addition, it is found that average AR of delisted stocks for the first three trading days following the announcement of delisting are lower than the first trading day before the announcement of delisting. Moreover, the mean ACAR of delisted stocks is negative for all studied period following the announcement of delisting. Besides, a comparison of ACAR between pre- and post-delisting periods reveals that the differences in mean ACAR are negative for all studied periods. Given a negative effect on abnormal returns as a result of delisting, we also find that the negative effect of delisting on returns of smaller firms are greater than for bigger firms.
References
- Chandy P.R., S. K. Sarkar, and N. Tripathy. 2004, Empirical evidence on the effects of delisting from the national market system. Journal of Economics and Finance, 28(1): 46-55. https://doi.org/10.1007/BF02761454. [CrossRef]
- Eisdorfer, A. 2008. Delisted firms and momentum profits. Journal of Financial Markets, 11: 160-179. https://doi.org/10.1016/j.finmar.2007.12.001. [CrossRef]
- Fama, E. F., and K. R. French. 1993. Common risk factors in the returns on stocks and bonds. Journal of Financial Economics, 33(1): 3-56. https://doi:10.1016/0304-405x(93)90023-5. [CrossRef]
- Fidanza, B. 2022. Common stock delisting: An empirical analysis of firms performance. International Business Research, 15(7): 50-64. https://doi.org/10.5539/ibr.v15n7p50. [CrossRef]
- Huynh, T. D., and D. R. Smith. 2017. Delisted stocks and momentum: Evidence from a new Australian dataset. Australian Journal of Management. 42(1): 140-160. https://doi: 10.1177/0312896214565118. [CrossRef]
- Li, M., K. Liu, and X. Zhu. 2023. The effects of NASDAQ delisting on firm performance. Research in International Business and Finance. https://doi.org/10.1016/j.ribaf.2023.102101. [CrossRef]
- Liu, S., and J. D. Stow. 2005. The shareholder wealth effects of voluntary foreign delistings: an empirical analysis. Applied Financial Economics Letters, 1: 199-204. https://doi.org/10.1080/17446540500117818. [CrossRef]
- Macey, J., M. O’Hara, and D. Pompilio. 2008. Down and out in the stock market: The law and economics of the delisting process. Journal of Law and Economics, 51(4): 683-713. https://doi.org/10.1086/593386. [CrossRef]
- Meera, A. K., N. Tripathy, and M. R. Redfearn. 2000. Wealth and liquidity effects of stock delistings: empirical evidence from the stock exchanges of Singapore and Malaysia. Applied Financial Economics, 10: 199-206. https://doi.org/10.1080/096031000331842. [CrossRef]
- Nguyen, T. K. A., D. L. Truong, and H. S. Friday. Expiration-day effects of index futures in a frontier market: The case of Ho Chi Minh Stock Exchange. International Journal of Financial Studies, 10(1): 1-12. https://doi.org/10.3390/ijfs10010003. [CrossRef]
- Park, Jinwoo, Posang Lee and Yun W. Park. 2014 Information effect of involuntary delisting and informed trading. Pacific-Basin Finance Journal, 30: 251-269. https://doi.org/10.1016/j.pacfin.2014.10.006. [CrossRef]
- Park, J., K. Shiroshita, N. Sun, and Y. W. Park. 2018. Involuntary delisting in the Japanese stock market. Managerial Finance, 44(9): 1155-1171. https://doi.org/10.1108/MF-04-2017-0126. [CrossRef]
- Pfister, M., and R. von Wyss. 2010. Delistings of secondary listings: price and volume effects. Financial Markets and Portfolio Management. 24: 395-418. https://doi.org/10.1007/s11408-010-0141-y. [CrossRef]
- Pour, E. K., and M. Lasfer. 2013. Why do companies delist voluntarily from the stock market? Journal of Banking & Finance, 37: 4850-4860. https://doi.org/10.1016/j.jbankfin.2013.08.022. [CrossRef]
- Sanger, G. C., and J. D. Peterson. 1990. An empirical analysis of common stock delistings. The Journal of Financial and Quantitative Analysis, 25(2): 261-272. https://doi.org/10.2307/2330828. [CrossRef]
- Shumway, T. 1997. The delisting bias in CRSP data. The Journal of Finance, 52(1): 327-340. https://doi.org/10.2307/2329566. [CrossRef]
- Shumway, T., and V. A. Warther. 1999. The delisting bias in CRSP’s NASDAQ data and its implications for the size effect. The Journal of Finance, 54(6): 2361-2379. https://doi.org/10.1111/0022-1082.00192. [CrossRef]
- Sun, Q., Y.-K. Tang, and W. H. S. Tong. 2002. The impacts of mass delisting: Evidence from Singapore and Malaysia. Pacific-Basin Finance Journal, 10: 333-351. https://doi.org/10.1016/S0927-538X(02)00050-1. [CrossRef]
- Truong, L. D., T. X. Le, and H. S. Friday. 2022. The influence of information transparency and disclosure on the value of listed companies: Evidence from Vietnam. Journal of Risk and Financial Management 15(8): 1-14. https://doi.org/10.3390/ jrfm15080345. [CrossRef]
- Truong, D. L., G. Lanjouw, and R. Lensink. 2006. The impact of privatization on firm performance in a transition economy: The case of Vietnam. Economics of Transition, 14(2): 349-389. https://doi:10.1111/j.1468-0351.2006.00251.x. [CrossRef]
- Truong, D. L., G. N. Cao, H. S. Friday, and N. T. Doan. 2023. Overreaction in a Frontier Market: Evidence from the Ho Chi Minh Stock Exchange. International Journal of Financial Studies, 11: 1-12. https://doi.org/10.3390/ijfs11020058. [CrossRef]
- You, L., A. M. Parhizgari, and S. Srivastava. 2012. Cross-listing and subsequent delisting in foreign markets. Journal of Empirical Finance, 19(2): 200-216. https://doi.org/10.1016/j.jempfin.2011.11.005. [CrossRef]
Disclaimer/Publisher’s Note: The statements, opinions and data contained in all publications are solely those of the individual author(s) and contributor(s) and not of MDPI and/or the editor(s). MDPI and/or the editor(s) disclaim responsibility for any injury to people or property resulting from any ideas, methods, instructions or products referred to in the content. |
© 2023 by the authors. Licensee MDPI, Basel, Switzerland. This article is an open access article distributed under the terms and conditions of the Creative Commons Attribution (CC BY) license (http://creativecommons.org/licenses/by/4.0/).
Copyright: This open access article is published under a Creative Commons CC BY 4.0 license, which permit the free download, distribution, and reuse, provided that the author and preprint are cited in any reuse.


