

Submitted:
06 October 2023
Posted:
06 October 2023
You are already at the latest version
Abstract
Background: The proportion of dietary protein may play a key role in the development of obesity in children and adolescents. Methods: Cross-sectional data of 4,336 children and adolescents from the National Health and Nutrition Survey (NHANES) during 2011 to March 2020 were analyzed. Multivariate logistic regression analysis was used to estimate odds ratios (OR) and 95% confidence intervals, and restriction cubic spline was uesd to explore nonlinear relationships of dietary protein energy supply ratio and obesity in children and adolescents. Results:In the adjusted logistic regression model, for every 1% increase in dietary protein energy ratio in children and adolescents, the increased risk of obesity was 4% (OR=1.04,95%CI:1.01-1.08). The restrictive cubic spline showed a nonlinear relationship between dietary protein energy ratio and obesity in children aged 6-11 years (P <0.05). The dietary protein energy supply ratio was included in the logistic regression model after converting to quartiles into categorical variables. The adjusted OR of children aged 6-11 years was 2.08 (95%CI:1.34, 3.23,P <0.01) for the highest quartile of dietary protein energy supply ratio compared with the lowest quartile. Conclusion: In American children, dietary protein energy supply ratios was positively correlated with obesity, independent of individual characteristics and energy.
Keywords:
Protein energy supply ratio
; Overweight/obesity
; Children
; Adolescents
; NHANES
1. Introduction
Over the past 40 years, obesity in children and adolescents has increased at an alarming rate and becoming a rising public health concern [1]. According to the World Obesity Federation's estimation in 2019, it is projected that by 2025, there will be 206 million children with obesity and adolescents aged 5 to 19[2]. In the United States, as of 2016, 18.4% of children aged 2 to 19 with obesity, and 5.2% were severely obese[3]. At present, the prevalence of obesity in young children is on the rise[4]. Obesity has been defined as a disease that impairs multiple systems, severely affects a child's intellectual, behavioral, psychological, and sexual development and can be lifelong[5,6]. Therefore, it is essential to identify risk factors associated with childhood and adolescent obesity.
The causes of obesity in children and adolescents include complex interactions such as genetic predisposition, environmental factors, and lifestyle[7]. Current treatments for obesity include diet therapy, increased physical activity, drug interventions, and bariatric surgery[8]. Dietary therapy has received more and more attention in recent years.There are evidences indicate that the proportion of dietary protein may play a key role in the development of obesity in children and adolescents[9].An earlier study reported that a diet with high protein energy supply ratio can help to lose more weight and fat[10]. However, several epidemiological investigations have presented evidence that children with obesity have a higher protein intake than normal-weight children[11,12,13].However, current research on the relationship between dietary protein intake and obesity in children and adolescents remains controversial.
The present study aimed to use NHANES data to assess the relationship between protein energy supply ratio and the risk of obesity in American children and adolescents. The goal was to provide a scientifically reliable basis for children and adolescents to make recommendations for the prevention and control of obesity, as well as to develop dietary guidelines.
2. METHODS
2.1. Study Participants
The National Health and Nutrition Examination Survey (NHANES) cross-sectional data from March 2011 to 2020 has been used in this study. NHANES used a a sophisticated, stratified and multi-stage probability sampling procedure to collect data NHANES combines home interviews and physical examinations, including face-to-face 24-hour diet review interviews at mobile screening centers (MECs); After 3 to 10 days, a second 24-hour dietary recall data was collected by phone. The survey was maintained and administered by the National Bureau of Statistics Center for Health Statistics (NCHS) and the U.S. Centers for Disease Control and Prevention (CDC), and a detailed description of the study design was previously published. We included adolescents aged 6 to 19 years with complete and reliable data on two-day dietary intakes. Participants with lack of nutritional data or unreliability, relevant body measurements and missing physical activity data were further excluded from the analysis, with a total of 4336 participants included in the analysis. A detailed flowchart of this study is shown in Figure 1.
2.2. Exposure and Outcome Variables
NHANES uses 24-hour dietary recall (24 hours) to obtain dietary information. With the help of a surrogate, up to two 24-hour dietary recollections were collected each for children aged 6 to 11 and participants aged 12 or older. The 24-hour diet recall was carried out personally (first) and by telephone (second) by a trained interviewer. Each participant or surrogate was requested to recall all food and beverages consumed in the preceding 24 hours (midnight to midnight). For each participant, the daily intake of nutrients from food/beverages and dietary supplements was calculated using the USDA Dietary Study and NHANES Dietary Supplement Calculations' Dietary and Nutrition Database, respectively[14]. A food frequency questionnaire assessed Each participant's intake of three energy-producing nutrients (protein, fat, carbohydrate). Dietary protein intake (grams per day) is the primary exposure of interest. The following formula calculate the protein energy supply ratio:
PThe height and weight of participants are measured by trained health technicians at the Mobile Screening Centre (MEC). Participants were also asked to provide blood samples at the MEC to measure blood glucose and lipid-related biochemical markers. Body mass index was calculated by dividing body weight in kilograms by height in square meters. According to the 2000 Centers for Disease Control and Prevention (CDC) Growth Map, NHANES determined the BMI (BMI) categories for children and adolescents aged 6-19 years. It classified them into four tiers: underweight (BMI < 5th percentile), normal weight (5≤th BMI <85th percentile), overweight (85th ≤BMI <95th percentile), and obesity (BMI ≥95th percentile).
2.3. Covariates
Demographic characteristics were obtained through questionnaires, including gender, age (years), household income to poverty ratio (PIR), and ethnicity (Mexican American, other Hispanic, non-Hispanic white, non-Hispanic black, non-Hispanic Asian, or other race). Continuous variables such as total dietary energy intake were calculated from dietary recall data. Dietary energy (kcal/d), dietary fat intake (g/d), and carbohydrate intake (g/d) were all looked as potential confounding/mediators of the energy-obesity association.
PIR is calculated as household income relative to the Department of Health and Human Services poverty guidelines and is classified as ≤130% or 130% >[15]. At MEC, physical activity is self-reported through a questionnaire about the typical weekly activity. Recommended physical activity is defined as 150 minutes or more per week of moderate intensity, 75 minutes or more per week of vigorous-intensity, or an equivalent combination; moderate intensity, 10 to 149 minutes per week of moderate intensity, 5 to 74 minutes of intense intensity, or equivalent combination; Low, neither recommended nor moderately active[16].
Use the rEI:pER method proposed by previous researchers[17], the misreporting of EI is evaluated from the ratio of reported EI(rEI) to predicted energy requirement (pER). The pER is calculated according to the age, sex and weight-specific equations published in the American Dietary Reference Intake. To identify the unreasonable rEI, we calculated the ±1.4SD cut-off value (rEI/pER× 100) of rEI as a percentage of pER by the method proposed by Huang et al[17]. If the pecentage of rEI/pER is outside ±1.4SD, it is considered that rEI may not be credible. We excluded 1092 children and 9 adolescents according to this standard in the sensitivity analysis.
2.4. Statistical analysis
To illustrate complex survey designs, we used NHANES sample weights of 9.3 years from 2011 to March 2020 (constructed from dietary sample weights on day 2) to account for unequal sampling probabilities, non-responses, non-coverage, and sample designs. We performed a descriptive analysis of the entire sample as well as the level of dietary protein energy supply ratio. Participants were divided into two age groups: children aged 6 to 11 and adolescents aged 12 to 19. Results are expressed as a weighted average (Mean(SD))or weighted percentage (%) of baseline characteristics and anthropometric values, with sample size n being the unweighted number of people sampled. For the continuous variable analysis, the t-test (normal distribution) and Kruskal-Wallis (skewed distribution) tests were used. The Chi-square test and Fisher's exact test were used for association between categorical variables. We used multiple logistic regression to assess its association with obesity with the estimated protein energy supply ratio (continuous) as the primary exposure variable. Furthermore, we also used a restrictive cubic spline, modeled by nodes at the 5th, 35th, 65th, and 95th percentiles to flexibly assess the relationship between the protein energy supply ratio and the obesity risk.
To solve the fitting nonlinear problem, we calculated the values of the quartiles ((Q4), Q3, Q2 and Q1) of the estimated protein energy supply ratio in the middle values of each quartile (87.5th, 62.5th, 37.5th and 12.5th) respectively. Then, by comparing the risk of the 87.5th, 62.5th and 37.5th percentiles with the risk of the 12.5th percentile, we use the β coefficient of the protein energy supply ratio from the Logistic regression model to estimate the adjusted Qdds Ratio (OR).
For multivariate logistic regression analysis, we adjusted for age, sex, and ethnicity (Model 1). In Model 2, we adjusted the household income to poverty ratio based on Model 1. In Model 3, serum total cholesterol and HDL concentrations were further adjusted, and triglycerides, LDL, glycosylated hemoglobin, and fasting blood glucose concentrations were adjusted on this basis for adolescents. In Model 4, we adjust total energy intake and physical activity. In the additional sensitivity analysis, we examined the relationship between the dietary protein energy supply ratio and obesity of participants with reasonable EI by excluding participants with unreasonable EI based on the above rEI: pER method.
All statistical analyses are in version R 4.2.3. All tests were bilateral, and a P<0.05 was considered statistically significant.
3. RESULT
3.1. Baseline of the study population
According to the inclusion-exclusion criteria, a total of 10,745 participants aged 6-19 years with dietary NHANES data from 2011 to March 2020 constituted the initial sample in this study. This study excluded individuals with insufficient household income to poverty ratio, height, weight, BMI, dietary surveys, total cholesterol, triglycerides, lipoprotein and insulin, and activity data. Finally, 4,336 participants (2194 men and 2141 women) were included in our analysis. The specific inclusion process is shown in Figure 1.
Of the included participants, 36.4% of children and adolescents were overweight/obesity; children aged 6 to 11 accounted for 67.5% of participants, and 32.5% were adolescents aged 12 to 19 years, 51.8% were boys, 48.2% were girls; Non-Hispanic White accounted for the most, 52.1%, and Non-Hispanic Asians accounted for the least, 4.3%. In physical measurements, the adolescent population had a higher baseline weight, height, and BMI than the children's group (P<0.001). The carbohydrate intake and energy supply ratio of adolescents were lower compared with children (P=0.007; P<0.001), while the energy supply ratio of protein (P<0.001) and fat (P=0.048) was significantly higher. In addition, the proportion of high-intensity exercise in children and adolescents was higher than that of moderate- and low-intensity exercise (P<0.001). Table 1.
3.2. Univariate analysis of overweight / obesity among the participants
In this study, we considered several factors that may be associated with overweight/obesity. Univariate analysis showed that BMI levels varied significantly among different ethnic children and adolescents (P <0.01). There are typically significant differences in BMI classification between children with other PIR (P<0.01). Children (P=0.011) and adolescents (P=0.049) were associated with differences in activity intensity and body weight. Among the macronutrient energy supply ratios, the average protein energy supply ratio was the highest among overweight children (P<0.01), the average carbohydrate-to-energy ratio was significantly higher in lean/normal weight children (P<0.01), and the average fat-to-energy ratio was the highest in overweight children (P=0.032). The average carbohydrate energy ratio among the adolescents was significantly higher in the lean/normal weight group (P=0.045), and the average fat energy supply ratio was the highest in the population with obesity (P=0.022). Furthermore, in the adolescent group, no significant difference was observed in the dietary protein energy supply ratio between normal weight and participants with overweight / obesiyt (P=0.812). Table 2.
3.3. The relationship between protein energy supply ratio and overweight/obesity
Table 3 summarizes the relationship between the estimated daily dietary protein energy supply ratio (continuous variable) and overweight/obesity in children and adolescents. A slight positive correlation exists between the dietary protein energy supply ratio and the risk of obesity in children and adolescents aged 6-19 (OR = 1.04 (1.01-1.07), P <0.01). After age stratification, only the children group had significant differences. In unadjusted analysis, the odds ratio of protein energy supply ratio to overweight/obesity in children aged 6-11 years is 1.08(95%CI:1.04,1.13). After adjusting for age, sex, race, PIR, blood sugar or blood lipid, total dietary energy and physical activity, the OR value and significance of the population aged 6-19 (OR = 1.04 (95%CI: 1.01, 1.08), P = 0.01) and children aged 6-11 (OR = 1.08(95% CI:1.04,1.08) did not change significantly. Table 3
We identified possible nonlinear conditions by establishing restrictive cubic spline and showed that dietary protein energy supply ratio and obesity were linear in both adjusted and unadjusted covariates in the adolescent population of 6-19 years (P_nonlinear=0.599). In 6-11 year children, dietary protein energy supply ratio and obesity were nonlinear (P_nonlinear=0.0.047); the nonlinear relationship became more significant after adjusting for covariates (P_nonlinear=0.0.031). (Figure 2).
In order to present the odds ratio (OR) in quartiles, we classified the dietary protein energy supply ratio according to quartiles, and calculated the estimated dietary protein energy supply ratio of the median of each quartile respectively. Then, we estimate the adjusted OR by comparing the 87.5th, 62.5th and 37.5th percentiles risks with those of the 12.5th percentile. In the highest quartile of dietary protein energy supply compared with the lowest quartile, the OR for overweight/obesity in the 6-19-year-old population was 1.64(95%CI:1.18,2.28),(P<0.01).For children aged 6-11 years, the OR value was 2.08(95%CI:1.40,3.08) (P<0.01). After adjusting for the relevant covariates, the positive association between dietary protein energy supply ratio and overweight/obesity remained significant in both the 6-19 age group (OR=1.65(95%CI:1.15,2.38),P<0.01) and the 6-11 age group (OR=2.08(95%CI:1.34,3.23),P<0.01). Consistent with the previous analysis, there was no statistical significance in the youth population aged 12-19 years in all models studied.Interestingly, in all age groups, compared with the third quartile (Q3) and the lowest quartile (Q1), the OR value of overweight/obesity was not significant (P>0.05).Table 4.
After excluding potential false positives, similar results were observed in sensitivity analysis. (Table S1).
4. Discussion
This study used a nationally representative survey in the United States, NHANES 2011-March 2020, to explore the relationship between protein energy supply ratio in children and adolescents and overweight and obesity. This study divided the sample by age into children (6-11 years) and adolescents (12-19 years).
According to this study's findings, the body measurements, baseline weight, height and BMI of adolescents were higher than those of children, which may be due to the second growth spurt period in 12-19 years old, also known as an adolescent growth spurt, when height and weight increase rapidly. A comparison of macronutrient intake preferences in children and adolescents has not been found in other studies and is innovatively reported in this paper.
We found that overweight and obesity were not uniform in children and adolescents, and there were racial differences in obesity among children and adolescents, similar to previous studies [4,18]. Among children, children from middle- and high-income families are less likely to be obesity than those from low-income families, a finding consistent with previous studies[19,20]. Recent empirical evidence suggests that low-income children with low social status can be exposed to obesity-causing environments, such as food insecurity[21] and poor diet[22].
This study also found an association between activity intensity and weight differences in children and adolescents, as activity has long been recognized as a critical intervention for overweight/obesity[23]. In addition, the children with obesity in this study had a higher protein energy supply ratio, which contradicts other research suggesting that a high-protein diet may reduce weight in the context of energy restriction[24,25].Research evidence that animal protein intake is positively correlated with obesity may explain our findings[26]. Besides,there is some literature on the leading to obesity on low-carbohydrate diets[27]. Children with obesity and adolescents have a relatively high proportion of fat energy supply[28,29].These evidences suggests that the effect of macronutrient intake levels on childhood and adolescent obesity needs further study.
We focused on the relationship between protein energy supply ratio and obesity in children and adolescents. We found that before and after adjusting for demographics and potential confounders, protein energy supply ratio were associated with a higher prevalence of obesity in children. Although there was no difference in energy intake, the effect of the protein energy supply ratio on BMI was significant, even after adjusting for confounders. In the unadjusted analysis, the protein energy supply ratio increased the odds of being overweight and obesity in children. However, the correlation is no longer significant when individual characteristics are changed. One possible explanation for this is that overweight obesity depends to a large extent on an individual's demographic characteristics, such as age, sex, ethnicity, and PIR[30]. Therefore, after adjusting for individual factors, the difference becomes smaller. Obesity is associated with dyslipidemia[31], which includes serum total cholesterol and HDL concentrations. Therefore, it can partially explain the increase in correlation after further adjustment of serum total cholesterol and HDL concentrations. In univariate studies, total energy intake did not differ statistically in different populations, while physical activity may affect both protein intake and obesity, and eating behavior is interfered with by physical activity, often focusing more on food and nutritional choices[32]. These can explain the association between the protein energy supply ratio and obesity after adjusting for partial total energy intake and physical activity.
In addition, we determined the non-linear relationship between dietary protein energy supply ratio and overweight/obesity in children aged 6-11 years by using unrestricted cubic splines.As can be seen from the spline plot, the curve becomes parallel to the horizontal axis at the protein energy supply ratio near the median level, with an OR value of 1.Consistent with this, in the Logistic regression model after the conversion of quartiles, only the third quartile (Q3) containing the median has no significant OR value compared with the lowest quartile (Q1).This suggests that maintaining a moderate level of dietary protein does not have an impact on obesity in children.However, high or low levels of dietary protein supply ratio were positively associated with the development of obesity.
There are some limitations to this study: first, causality cannot be established due to the design of the cross-sectional study. Secondly, the 24-hour dietary recall method makes it challenging to ascertain whether the diets under evaluation accurately reflect the typical eating habits of the respondents.Furthermore, we did not find a relationship between dietary protein energy supply ratio and obesity among adolescents aged 12-19. This may be attributed to a smaller sample size within this age group that aligns with our study, as well as the substantial individual variations present in individuals transitioning from adolescence to adulthood, making it challenging to accurately estimate their group characteristics based on existing data.
5. Conclusions
In summary, we found that a higher dietary protein energy supply ratio, rather than a lower one, was associated with obesity risk in children aged 6-11 years in the United States.However, among U.S. adolescents aged 12 to 19 years, the protein energy supply ratio was not significantly associated with obesity.More researches are needed in children, particularly prospective studies of estimating protein species intake through 24-hour urine collection to determine the causal relationship between protein species and obesity.
Supplementary Materials
The following supporting information can be downloaded at the website of this paper posted on Preprints.org.
Author Contributions
Conceptualisation, F.Z.; methodology, Z.Y.L. and J.W., formal analysis, Y.Y.X. and Shuqun Cheng ; writing—original draft preparation, X.J.J. and L.X.Z. ; writing—review and editing , A.K. and J.W. ; visualization; Z.Y.L.; supervision, Z.Z.,C.C.Z. and J.F.Q.All authors have read and agreed to the published version of the manuscript.
Funding
This research was supported by National Natural Science Foundation of China (81703187, 81602820, 81903358); Natural Science Foundation of Chongqing (cstc2020jcyj-msxmX0192); Science and Technology Research Program of Chongqing Municipal Education Commission (KJQN201800434, KJQN201900419, KJQN201900421). Research Program of Basic Research and Frontier Technology of Chongqing Yuzhong district (20200105). Z.Z. and C.C. were both the Young talent of Bayu scholar.
Institutional Review Board Statement
The study was conducted in accordance with the Declaration of Helsinki and approved by the NCHS Ethics Review Board.
Informed Consent Statement
Informed consent was obtained from all subjects involved in the study.
Data Availability Statement
The data used in this study can be queried and downloaded from https://www.cdc.gov/nchs/nhanes.
Acknowlegments
Not applicable.
Conflicts of Interest
The authors declare no conflict of interest.
References
- Jebeile, H.; Kelly, A.S.; O'Malley, G.; Baur, L.A. Obesity in children and adolescents: epidemiology, causes, assessment, and management. Lancet Diabetes Endocrinol 2022, 10, 351–365. [Google Scholar] [CrossRef]
- Feng, Y.; Liu, T.; Xu, S.; Ren, Y.; Ge, Y.; Yin, L.; Pu, Y.; Liang, G. The role of N6-methyladenosine methylation in environmental exposure-induced health damage. Environmental Science and Pollution Research 2022, 29, 69153–69175. [Google Scholar] [CrossRef] [PubMed]
- Skinner, A.C.; Ravanbakht, S.N.; Skelton, J.A.; Perrin, E.M.; Armstrong, S.C. Prevalence of Obesity and Severe Obesity in US Children, 1999-2016. Pediatrics 2018, 141. [Google Scholar] [CrossRef] [PubMed]
- Tsoi, M.F.; Li, H.L.; Feng, Q.; Cheung, C.L.; Cheung, T.T.; Cheung, B.M.Y. Prevalence of Childhood Obesity in the United States in 1999-2018: A 20-Year Analysis. Obes Facts 2022, 15, 560–569. [Google Scholar] [CrossRef] [PubMed]
- Horesh, A.; Tsur, A.M.; Bardugo, A.; Twig, G. Adolescent and Childhood Obesity and Excess Morbidity and Mortality in Young Adulthood-a Systematic Review. Curr Obes Rep 2021, 10, 301–310. [Google Scholar] [CrossRef]
- Bendor, C.D.; Bardugo, A.; Pinhas-Hamiel, O.; Afek, A.; Twig, G. Cardiovascular morbidity, diabetes and cancer risk among children and adolescents with severe obesity. Cardiovasc Diabetol 2020, 19, 79. [Google Scholar] [CrossRef]
- Lee, E.Y.; Yoon, K.-H. Epidemic obesity in children and adolescents: risk factors and prevention. Frontiers of Medicine 2018, 12, 658–666. [Google Scholar] [CrossRef]
- Steinbeck, K.S.; Lister, N.B.; Gow, M.L.; Baur, L.A. Treatment of adolescent obesity. Nat Rev Endocrinol 2018, 14, 331–344. [Google Scholar] [CrossRef]
- Freuer, D.; Meisinger, C.; Linseisen, J. Causal relationship between dietary macronutrient composition and anthropometric measures: A bidirectional two-sample Mendelian randomization analysis. Clinical Nutrition 2021, 40, 4120–4131. [Google Scholar] [CrossRef]
- Liu, J.; Wang, J.; Tsang, D.C.W.; Xiao, T.; Chen, Y.; Hou, L. Emerging Thallium Pollution in China and Source Tracing by Thallium Isotopes. Environmental Science & Technology 2018, 52, 11977–11979. [Google Scholar] [CrossRef]
- Del Mar Bibiloni, M.; Tur, J.A.; Morandi, A.; Tommasi, M.; Tomasselli, F.; Maffeis, C. Protein Intake as a Risk Factor of Overweight/Obesity in 8- to 12-Year-Old Children. Medicine (Baltimore) 2015, 94, e2408. [Google Scholar] [CrossRef] [PubMed]
- Grandjean, P.; Landrigan, P.J. Neurobehavioural effects of developmental toxicity. The Lancet Neurology 2014, 13, 330–338. [Google Scholar] [CrossRef]
- Jen, V.; Braun, K.V.E.; Karagounis, L.G.; Nguyen, A.N.; Jaddoe, V.W.V.; Schoufour, J.D.; Franco, O.H.; Voortman, T. Longitudinal association of dietary protein intake in infancy and adiposity throughout childhood. Clinical Nutrition 2019, 38, 1296–1302. [Google Scholar] [CrossRef] [PubMed]
- Zhao, L.; Ogden, C.L.; Yang, Q.; Jackson, S.L.; Loria, C.M.; Galuska, D.A.; Wiltz, J.L.; Merritt, R.; Cogswell, M.E. Association of Usual Sodium Intake with Obesity Among US Children and Adolescents, NHANES 2009-2016. Obesity (Silver Spring) 2021, 29, 587–594. [Google Scholar] [CrossRef]
- Tang, W.; Zhan, W.; Wei, M.; Chen, Q. Associations Between Different Dietary Vitamins and the Risk of Obesity in Children and Adolescents: A Machine Learning Approach. Front Endocrinol (Lausanne) 2021, 12, 816975. [Google Scholar] [CrossRef]
- Cogswell, M.E.; Loria, C.M.; Terry, A.L.; Zhao, L.; Wang, C.Y.; Chen, T.C.; Wright, J.D.; Pfeiffer, C.M.; Merritt, R.; Moy, C.S. , et al. Estimated 24-Hour Urinary Sodium and Potassium Excretion in US Adults. JAMA 2018, 319, 1209–1220. [Google Scholar] [CrossRef]
- Huang, T.T.; Roberts, S.B.; Howarth, N.C.; McCrory, M.A. Effect of screening out implausible energy intake reports on relationships between diet and BMI. Obes Res 2005, 13, 1205–1217. [Google Scholar] [CrossRef]
- Ogden, C.L.; Carroll, M.D.; Kit, B.K.; Flegal, K.M. Prevalence of childhood and adult obesity in the United States, 2011-2012. JAMA 2014, 311, 806–814. [Google Scholar] [CrossRef]
- Weaver, R.G.; Brazendale, K.; Hunt, E.; Sarzynski, M.A.; Beets, M.W.; White, K. Disparities in childhood overweight and obesity by income in the United States: an epidemiological examination using three nationally representative datasets. Int J Obes (Lond) 2019, 43, 1210–1222. [Google Scholar] [CrossRef]
- Yusuf, S.; Joseph, P.; Rangarajan, S.; Islam, S.; Mente, A.; Hystad, P.; Brauer, M.; Kutty, V.R.; Gupta, R.; Wielgosz, A. , et al. Modifiable risk factors, cardiovascular disease, and mortality in 155 722 individuals from 21 high-income, middle-income, and low-income countries (PURE): a prospective cohort study. Lancet 2020, 395, 795–808. [Google Scholar] [CrossRef] [PubMed]
- Fleming, M.A.; Kane, W.J.; Meneveau, M.O.; Ballantyne, C.C.; Levin, D.E. Food Insecurity and Obesity in US Adolescents: A Population-Based Analysis. Child Obes 2021, 17, 110–115. [Google Scholar] [CrossRef] [PubMed]
- Kay, M.C.; Silver, H.J.; Yin, H.S.; Flower, K.B.; Rothman, R.L.; Sanders, L.M.; Delamater, A.M.; Perrin, E.M. Assessing Diet Quality in a Racially and Ethnically Diverse Cohort of Low-income Toddlers. J Pediatr Gastroenterol Nutr 2020, 71, 679–685. [Google Scholar] [CrossRef] [PubMed]
- Dixon, B.N.; Ugwoaba, U.A.; Brockmann, A.N.; Ross, K.M. Associations between the built environment and dietary intake, physical activity, and obesity: A scoping review of reviews. Obes Rev 2021, 22, e13171. [Google Scholar] [CrossRef] [PubMed]
- Magkos, F. The role of dietary protein in obesity. Rev Endocr Metab Disord 2020, 21, 329–340. [Google Scholar] [CrossRef]
- Ferre, N.; Luque, V.; Closa-Monasterolo, R.; Zaragoza-Jordana, M.; Gispert-Llaurado, M.; Grote, V.; Koletzko, B.; Escribano, J. Association of Protein Intake during the Second Year of Life with Weight Gain-Related Outcomes in Childhood: A Systematic Review. Nutrients 2021, 13. [Google Scholar] [CrossRef]
- Segovia-Siapco, G.; Khayef, G.; Pribis, P.; Oda, K.; Haddad, E.; Sabate, J. Animal Protein Intake Is Associated with General Adiposity in Adolescents: The Teen Food and Development Study. Nutrients 2019, 12. [Google Scholar] [CrossRef]
- Mobbs, C.V.; Mastaitis, J.; Yen, K.; Schwartz, J.; Mohan, V.; Poplawski, M.; Isoda, F. Low-carbohydrate diets cause obesity, low-carbohydrate diets reverse obesity: a metabolic mechanism resolving the paradox. Appetite 2007, 48, 135–138. [Google Scholar] [CrossRef]
- Cao, Y.J.; Wang, H.J.; Zhang, B.; Qi, S.F.; Mi, Y.J.; Pan, X.B.; Wang, C.; Tian, Q.B. Associations of fat and carbohydrate intake with becoming overweight and obese: an 11-year longitudinal cohort study. Br J Nutr 2020, 124, 715–728. [Google Scholar] [CrossRef]
- Liu, W.; Zhou, H.; Wang, H.; Zhang, Q.; Zhang, R.; Willard, B.; Liu, C.; Kang, Z.; Li, X.; Li, X. IL-1R-IRAKM-Slc25a1 signaling axis reprograms lipogenesis in adipocytes to promote diet-induced obesity in mice. Nat Commun 2022, 13, 2748. [Google Scholar] [CrossRef] [PubMed]
- Lister, N.B.; Baur, L.A.; Felix, J.F.; Hill, A.J.; Marcus, C.; Reinehr, T.; Summerbell, C.; Wabitsch, M. Child and adolescent obesity. Nat Rev Dis Primers 2023, 9, 24. [Google Scholar] [CrossRef]
- Vekic, J.; Zeljkovic, A.; Stefanovic, A.; Jelic-Ivanovic, Z.; Spasojevic-Kalimanovska, V. Obesity and dyslipidemia. Metabolism 2019, 92, 71–81. [Google Scholar] [CrossRef] [PubMed]
- Carraca, E.V.; Rodrigues, B.; Teixeira, D.S. A Motivational Pathway Linking Physical Activity to Body-Related Eating Cues. J Nutr Educ Behav 2020, 52, 1001–1007. [Google Scholar] [CrossRef] [PubMed]
Figure 1.
Flow chart of inclusion and exclusion criteria for the study sample.
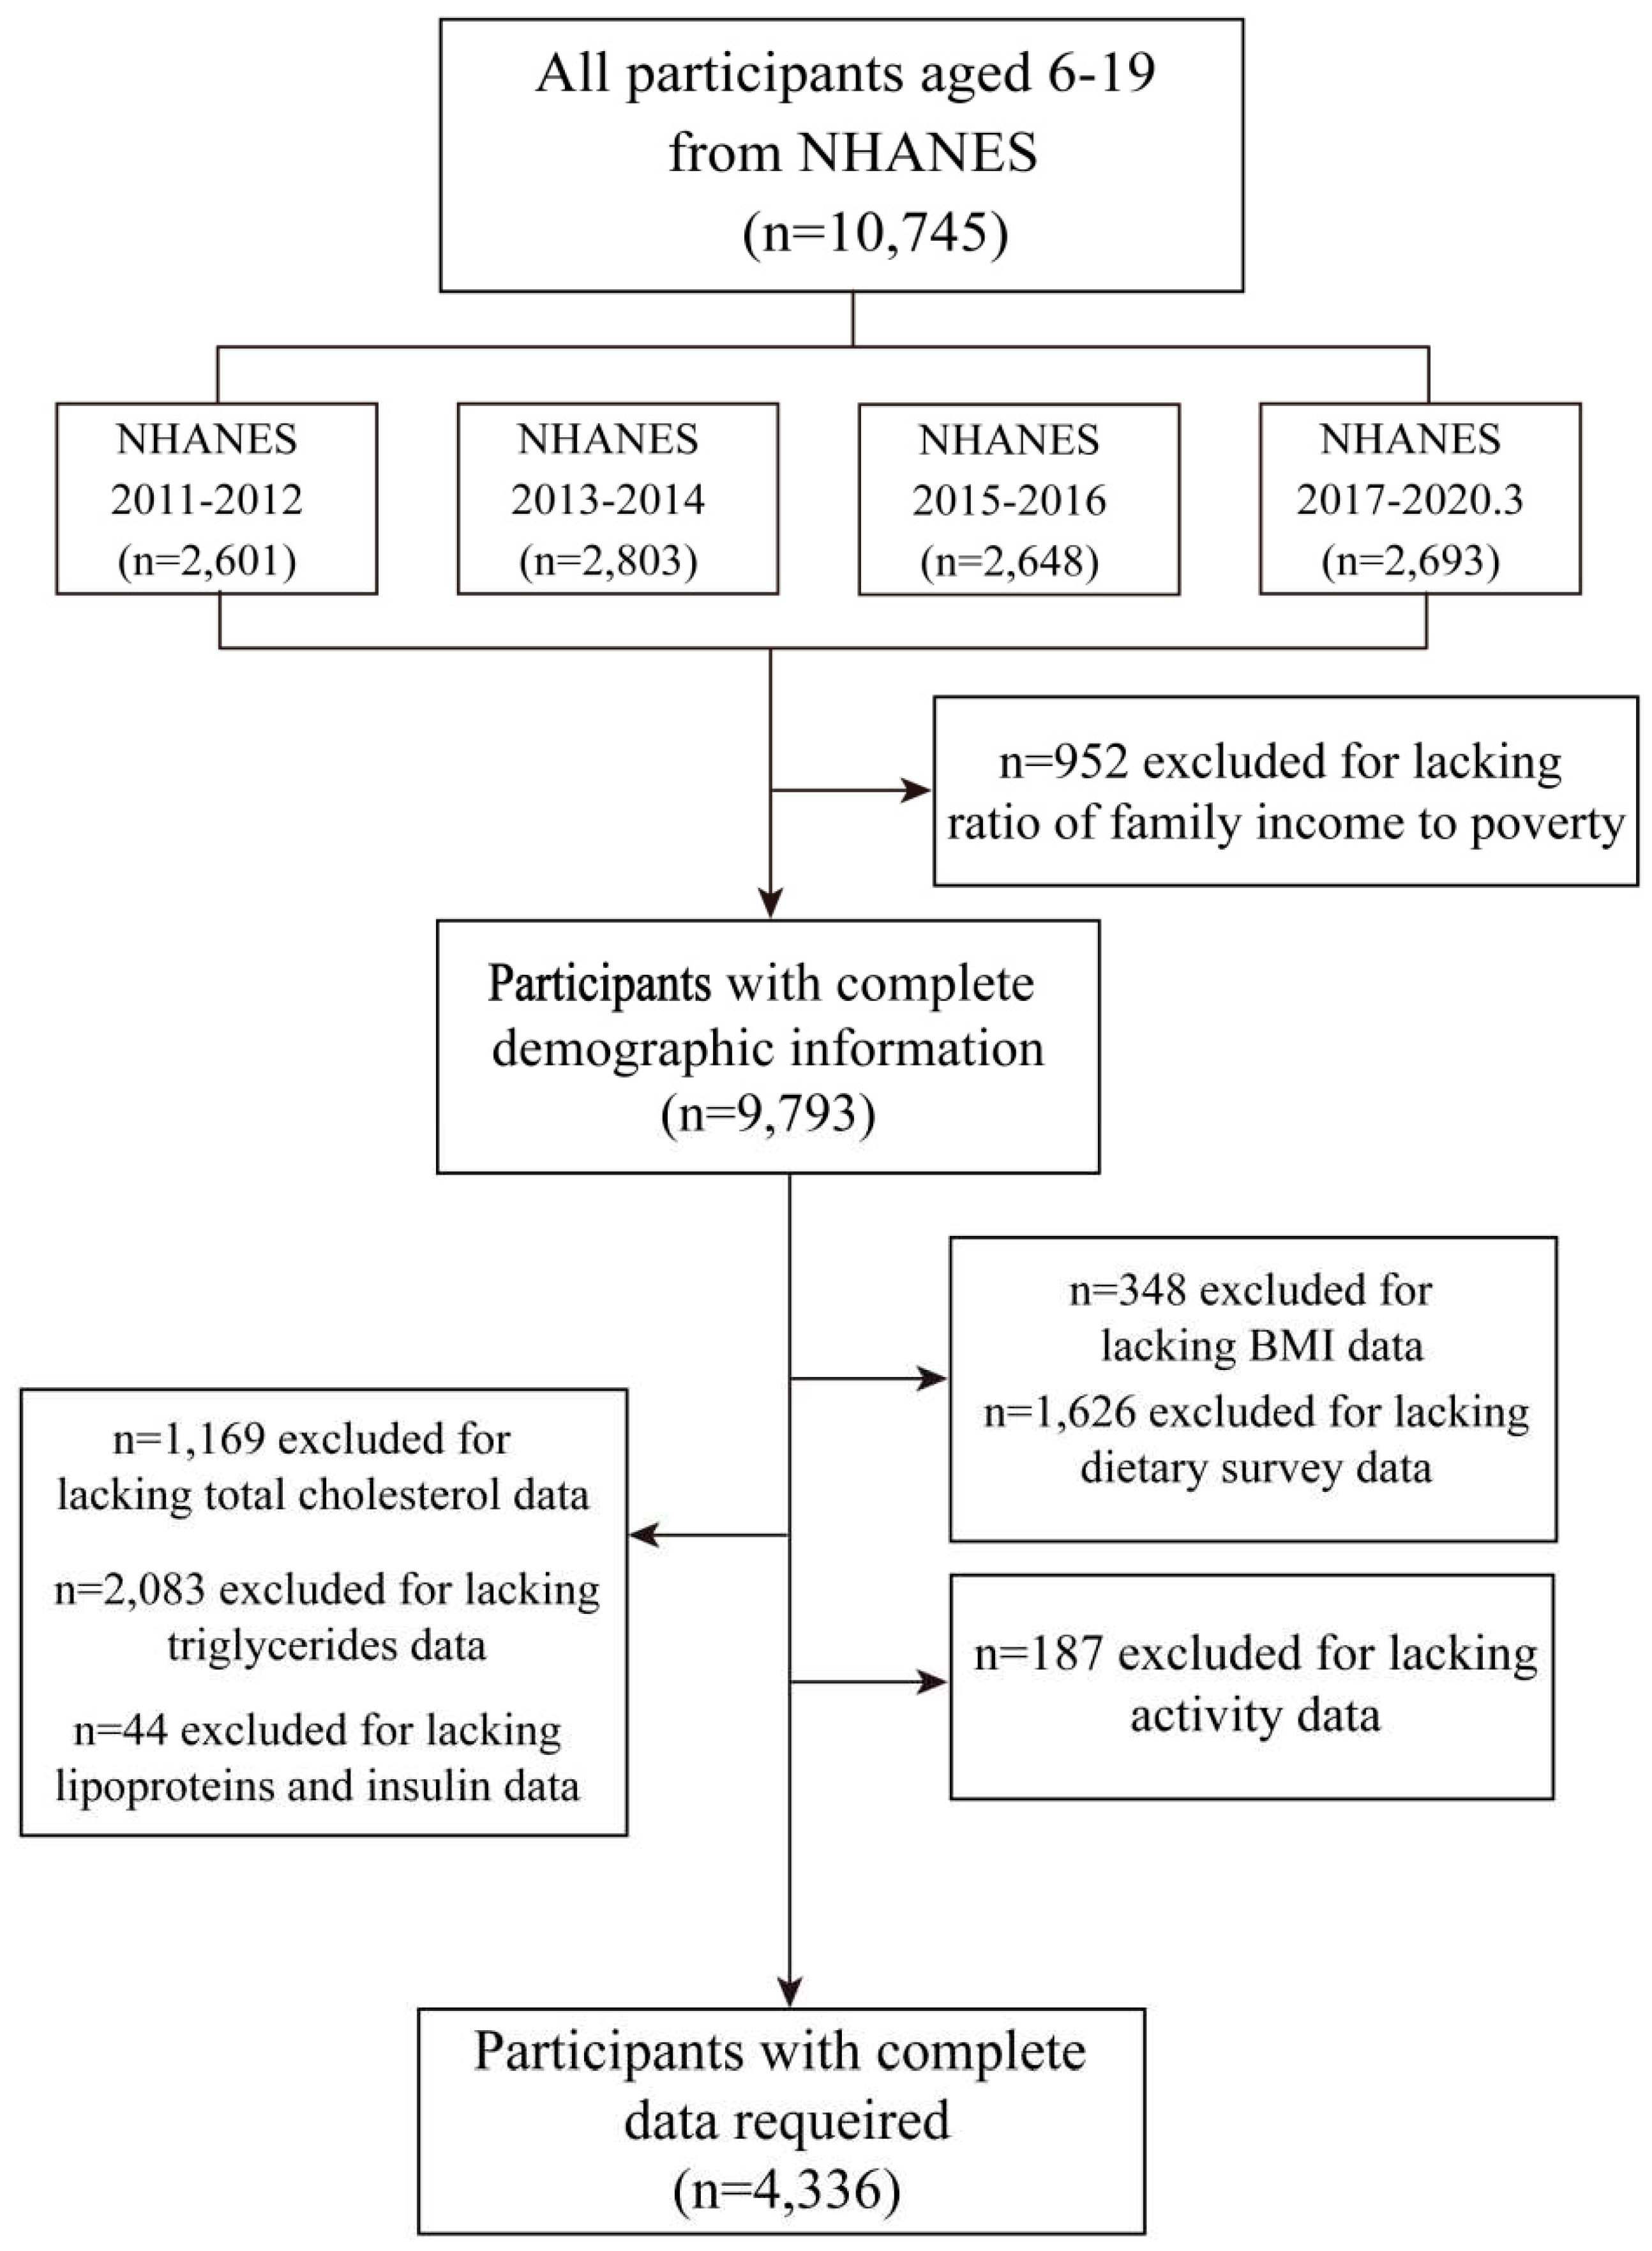
Figure 2.
Association of dietary protein and obesity in the restricted cubic spline model. Use the median dietary protein energy supply ratio (6-19 years:14.92%; 6-11 years:14.17) as reference.Adjusted P_nonlinear is the value after the adjusted age, gender, ethnicity, household income-to-poverty ratio(RIP),the concentration of serum total cholesterol and high-density lipoprotein,total energy intake and physical activity.
Figure 2.
Association of dietary protein and obesity in the restricted cubic spline model. Use the median dietary protein energy supply ratio (6-19 years:14.92%; 6-11 years:14.17) as reference.Adjusted P_nonlinear is the value after the adjusted age, gender, ethnicity, household income-to-poverty ratio(RIP),the concentration of serum total cholesterol and high-density lipoprotein,total energy intake and physical activity.
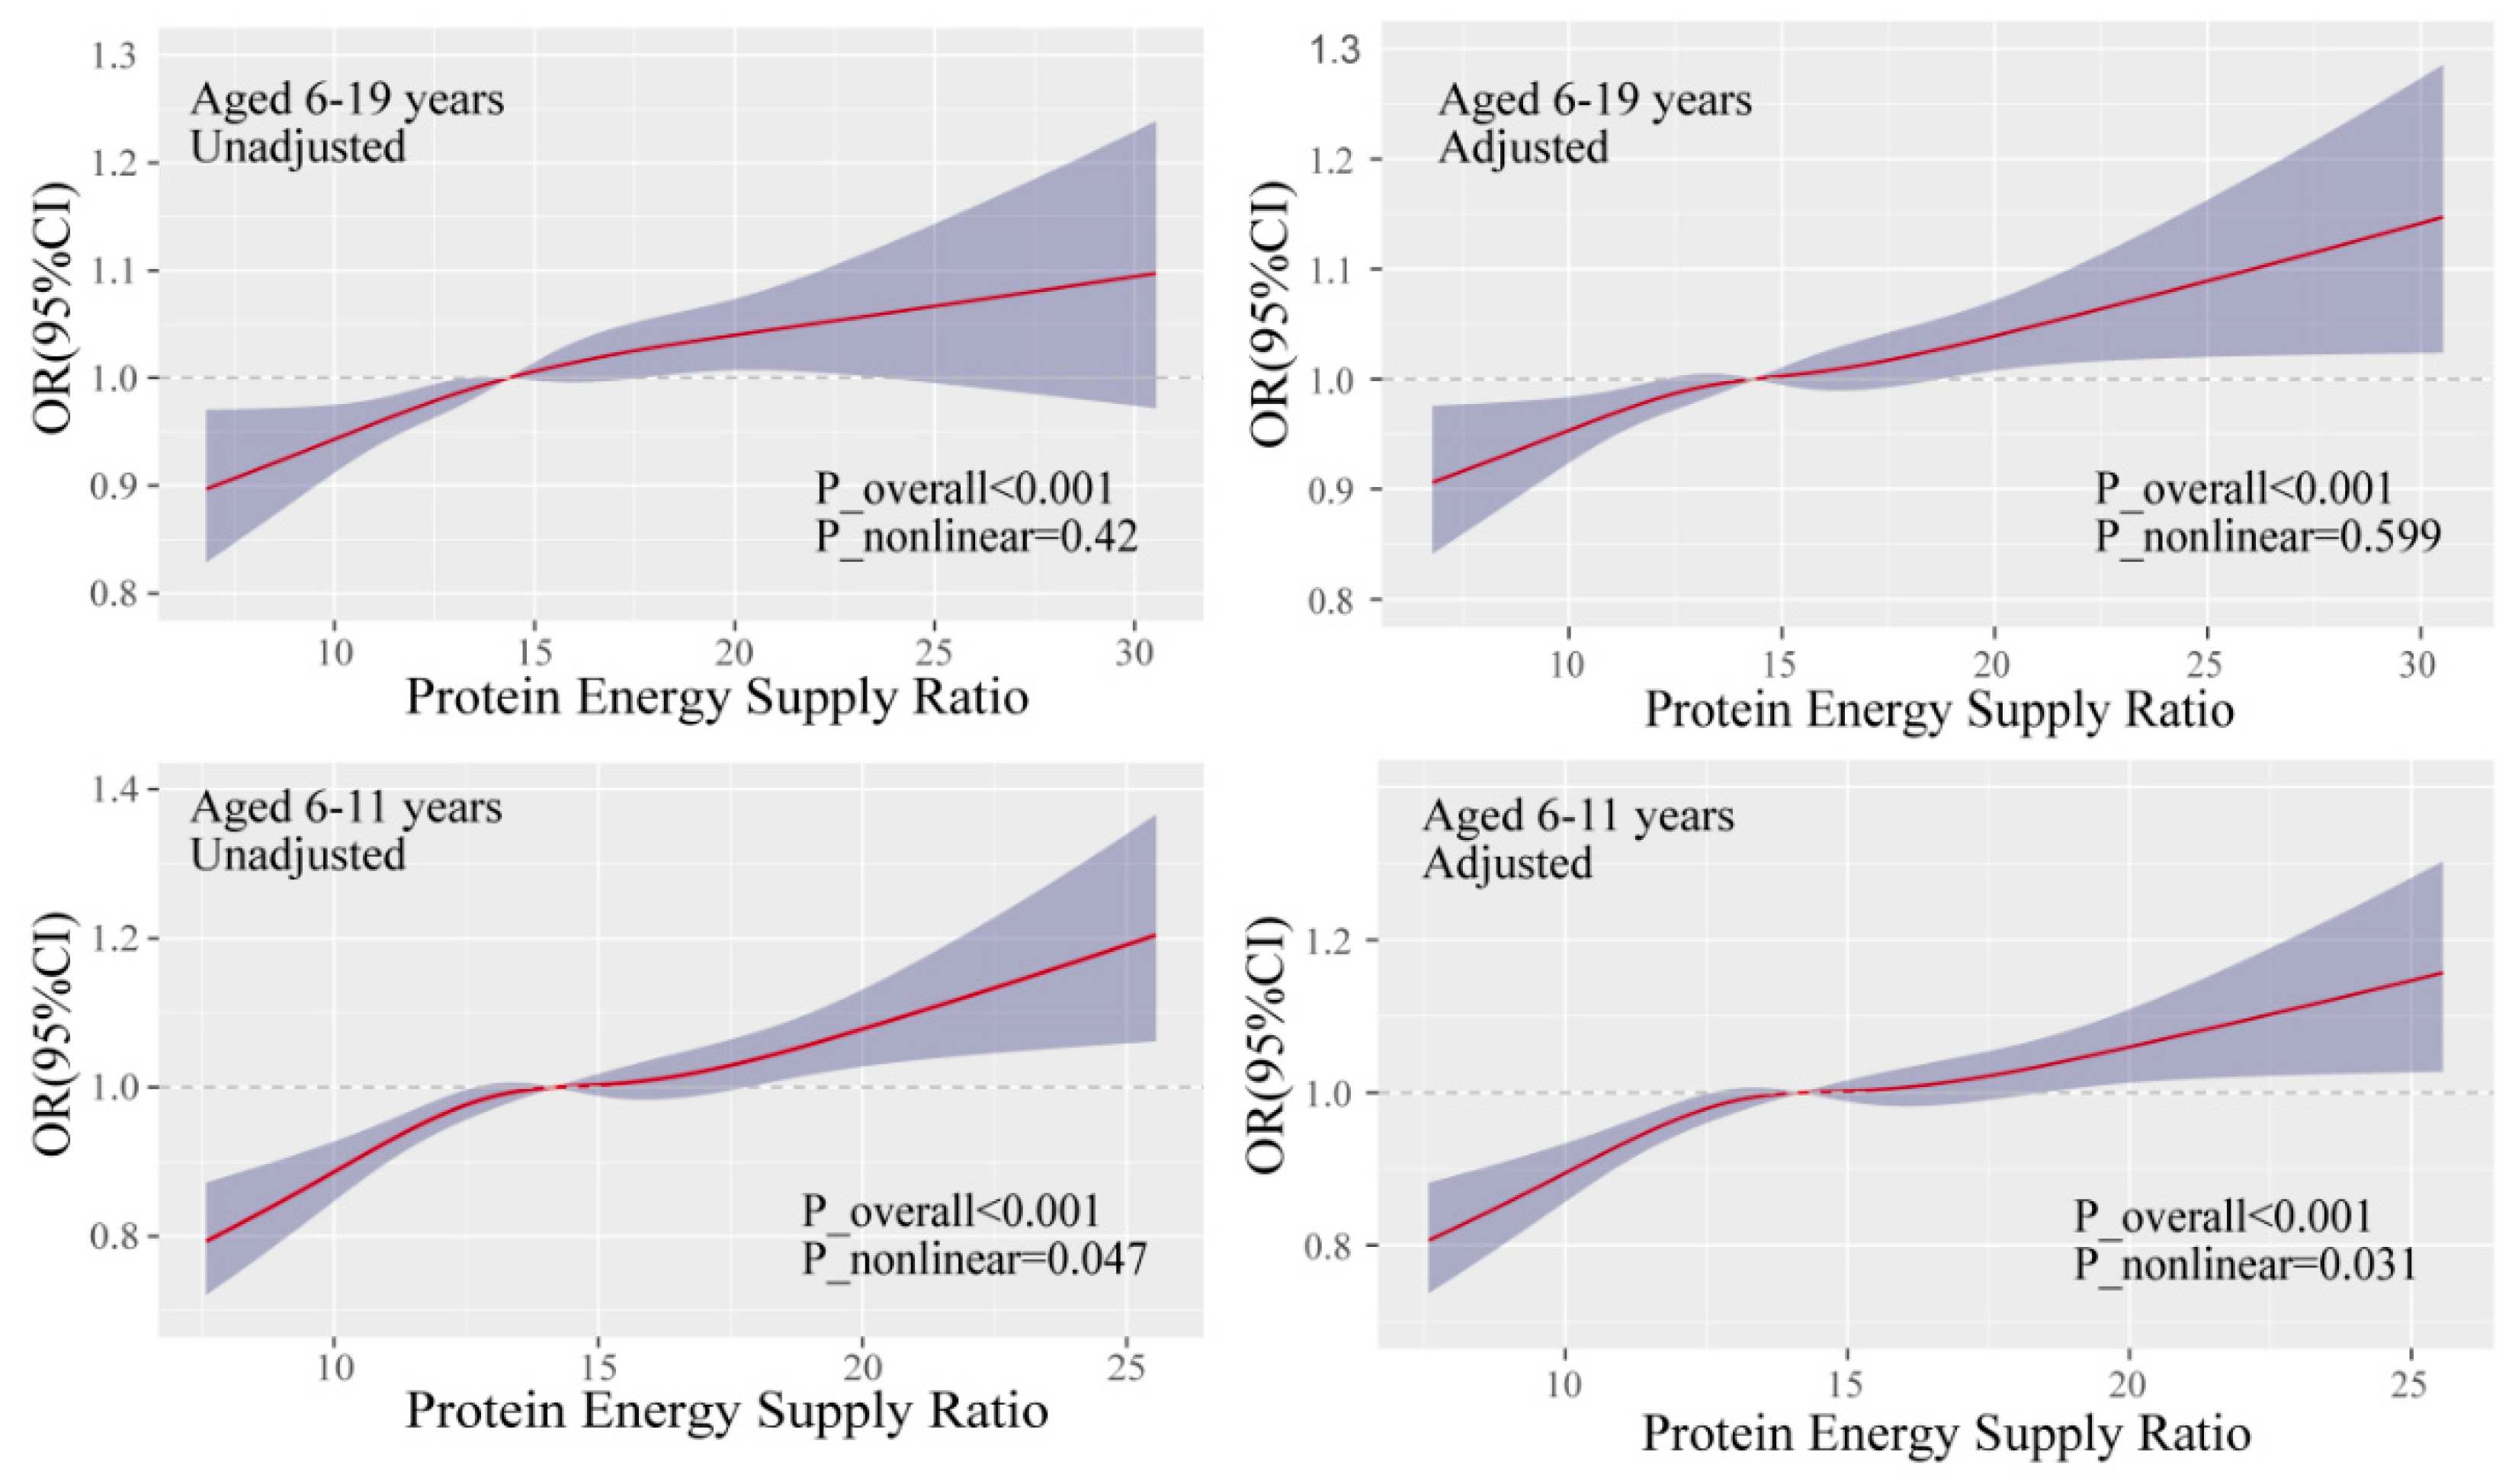

Table 1.
Baseline characteristics of US children and adolescents aged 6 to 19 years, NHANES 2011-2020.
Table 1.
Baseline characteristics of US children and adolescents aged 6 to 19 years, NHANES 2011-2020.
| Characteristic | Age group (y) | P_value | ||
|---|---|---|---|---|
| Overall | 6-11 | 12-19 | ||
| N(n,%) | 4336 | 2927(67.5) | 1409(32.5) | |
| Age (median [IQR]) | 10 [8, 13] | 9 [7, 10] | 15 [13, 17] | <0.001 |
| Sex (n,%) | ||||
| Male | 2194 (51.8) | 1475 (52.7) | 719 (50.0) | 0.392 |
| Female | 2141 (48.2) | 1452 (47.3) | 690 (50.0) | |
| Ethnicity(n,%) | ||||
| Mexican American | 898 (17.1) | 605 (16.7) | 293 (17.8) | 0.338 |
| Other Hispanic | 422 ( 7.5) | 298 ( 7.9) | 124 ( 6.6) | |
| Non-Hispanic White | 1222 (52.1) | 810 (51.1) | 412 (54.1) | |
| Non-Hispanic Black | 1122 (13.4) | 779 (13.8) | 343 (12.6) | |
| Non-Hispanic Asian | 364 ( 4.3) | 212 (4.2) | 152( 4.6) | |
| Other Race | 308 ( 5.6) | 223 ( 6.2) | 85 ( 4.4) | |
| RIP(n,%) | ||||
| ≤130% | 1928 (35.2) | 1341 (35.7) | 587 (34.0) | 0.542 |
| >130% | 2408(64.8) | 1586 (64.3) | 822(66.0) | |
| Body measure | ||||
| Weight (median [IQR]) | 40.20 [29.00, 57.70] | 32.70 [26.00, 41.40] | 62.90 [51.60, 77.40] | <0.001 |
| Height (median [IQR]) | 144.20 [130.90, 160.00] | 134.90 [126.21, 144.40] | 165.21 [158.20, 172.70] | <0.001 |
| BMI(median [IQR]) | 19.10 [16.40, 23.00] | 17.50 [15.80, 20.80] | 22.60 [19.60, 27.00] | <0.001 |
| BMI status (n,%) | ||||
| Underweight | 116 ( 3.5) | 79 ( 3.7) | 37 ( 3.0) | 0.582 |
| Normal weight | 2540 (60.1) | 1749 (59.6) | 791 (61.1) | |
| Overweighta | 716 (16.0) | 485 (16.8) | 231 (14.5) | |
| Obesea | 955 (20.4) | 614 (19.9) | 341 (21.4) | |
| Dietary intake | ||||
| Energy (median [IQR]) | 1831.00 [1495.83, 2251.58] | 1846.52 [1532.92, 2209.74] | 1775.00 [1419.64, 2334.62] | 0.172 |
| Protein (median [IQR]) | 65.20 [50.64, 82.74] | 65.02 [51.50, 80.30] | 66.72 [48.55, 87.93] | 0.199 |
| Protein supply ratio (median [IQR]) | 14.30 [12.21, 16.43] | 14.00 [12.13, 15.95] | 14.73 [12.52, 17.11] | <0.001 |
| Carbohydrate (median [IQR]) |
239.41 [194.21, 295.91] | 244.27 [198.71, 293.97] | 227.82 [177.47, 298.86] | 0.007 |
| Carbohydrat supply ratio (median [IQR]) | 52.28 [47.70, 56.77] | 52.95 [48.66, 57.02] | 50.61 [46.05, 56.31] | <0.001 |
| Fat (median [IQR]) | 69.20 [53.06, 88.66] | 69.14 [54.38, 88.22] | 69.97 [50.16, 90.83] | 0.553 |
| Fat supply ratio (median [IQR]) |
34.28 [30.63, 37.94] | 34.00 [30.58, 37.65] | 35.00 [30.79, 38.55] | 0.048 |
| Activity (n,%) | ||||
| Recommended | 3640 (85.1) | 2629(90.8) | 1011(73.8) | <0.001 |
| Intermediate | 539 (11.9) | 197 ( 6.4) | 342(22.9) | |
| Low | 157 ( 3.0) | 101 ( 2.8) | 56 ( 3.3) | |
aAccording to the 2000 Centers for Disease Control and Prevention Growth Chart, overweight/obesity is defined as a BMI of the same age and sex at or above the 85th percentile.
Table 2.
Univariate analysis of BMI-related factors in the US population aged 6 to 19 years,NHANES 2011-2020.
Table 2.
Univariate analysis of BMI-related factors in the US population aged 6 to 19 years,NHANES 2011-2020.
| Aged 6-11 years | Aged 12-19 years | |||||||||
|---|---|---|---|---|---|---|---|---|---|---|
| Overall | Under/Normal weight | Overweighta | Obesea | P | Overall | Under/Normal weight | Overweighta | Obesea | P | |
| n | 2927 | 1828 | 485 | 614 | 1409 | 828 | 231 | 341 | ||
| Sex (n,%) | ||||||||||
| Male | 1475 (52.7) | 932 (51.1) | 237 (54.5) | 306 (56.4) | 0.314 | 719 (50.0) | 429 (51.6) | 112 (45.5) | 172 (47.4) | 0.532 |
| Female | 1452 (47.3) | 896 (48.9) | 248 (45.5) | 308 (43.6) | 690 (50.0) | 399 (48.4) | 119 (54.5) | 169 (52.6) | ||
| Ethnicity(n,%) | ||||||||||
| Mexican American |
605 (16.7) | 314 (13.4) | 123 (17.9) | 168 (26.3) | <0.001 | 293 (17.8) | 148 (13.6) | 62 (24.3) | 83 (26.3) | <0.001 |
| Other Hispanic | 298 (7.9) | 167 (6.7) | 57 (10.6) | 74 (9.6) | 124 (6.6) | 75 (6.0) | 16 (4.4) | 33 (10.0) | ||
| Non-Hispanic White | 810 (51.1) | 550 (54.9) | 127 (48.5) | 133 (41.2) | 412 (54.1) | 257 (61.3) | 68 (44.3) | 82 (38.3) | ||
| Non-Hispanic Black | 779 (13.8) | 476 (13.7) | 125 (14.2) | 178 (14.1) | 343 (12.6) | 188 (10.8) | 53 (15.9) | 101 (16.3) | ||
| Non-Hispanic Asian | 212 ( 4.2) | 169 ( 5.1) | 26 (3.7) | 17 (1.6) | 152 (4.6) | 115 (5.8) | 12 (1.3) | 23 (2.8) | ||
| Other Race | 223 (6.2) | 152 (6.2) | 27 (5.1) | 44 (7.2) | 85 (4.4) | 45 (2.6) | 20 (9.8) | 19 (6.3) | ||
| RIP(n,%) | ||||||||||
| ≤130% | 1341 (35.7) | 795 (32.0) | 231 (40.0) | 315 (43.7) | 0.003 | 587 (34.0) | 322 (31.1) | 97 (38.5) | 166 (40.9) | 0.099 |
| >130% | 1586 (64.3) | 1033 (68.0) | 254 (60.0) | 299 (56.3) | 822 (66.0) | 506 (68.9) | 134 (61.5) | 175 (59.1) | ||
| Dietary intake | ||||||||||
| Energy (median [IQR]) |
1846.5 [1532.9, 2209.7] |
1858.6 [1534.0, 2197.0] |
1833.0 [1555.6, 2266.2] |
1846.7 [1514.6, 2244.1] |
>0.99 | 1775.0 [1419.6, 2334.62] |
1827.4 [1461.5, 2415.7] |
1751.8 [1346.4, 2252.7] |
1687.2 [1236.5, 2185.8] |
0.141 |
| Protein supply ratio (median [IQR]) |
14.00 [12.13, 15.95] |
13.82 [11.73, 15.62] |
14.51 [12.68, 16.81] |
14.27 [12.53, 16.34] |
0.001 | 14.73 [12.52, 17.11] |
14.75 [12.52, 17.21] |
15.01 [12.30, 17.84] |
14.67 [12.60, 16.50] |
0.812 |
| Carbohydrat supply ratio (median [IQR]) |
52.95 [48.66, 57.02] |
53.58 [49.35, 57.36] |
51.71 [48.07, 55.97] |
51.53 [47.10, 56.21] |
<0.001 | 50.61 [46.05, 56.31] |
50.98 [46.70, 56.29] |
49.96 [44.76, 54.92] |
49.73 [44.94, 56.56] |
0.045 |
| Fat supply ratio (median [IQR]) |
34.00 [30.58, 37.65] |
33.70 [30.33, 37.37] |
34.49 [30.65, 38.33] |
34.42 [31.24, 38.44] |
0.032 | 35.00 [30.79, 38.55] |
34.35 [30.40, 37.93] |
35.11 [31.30, 38.23] |
36.09 [31.06, 40.29] |
0.022 |
| Activity (n,%) | ||||||||||
| Recommended | 2629 (90.8) | 1666 (92.0) | 440 (90.8) | 523 (86.7) | 0.011 | 1011 (73.8) | 598 (75.8) | 173 (77.7) | 233 (64.3) | 0.049 |
| Intermediate | 197 (6.4) | 107 (5.2) | 34 (8.0) | 56 (9.2) | 342 (22.9) | 205 (21.8) | 49 (18.8) | 86 (29.5) | ||
| Low | 101 (2.8) | 55 (2.8) | 11 (1.2) | 35 (4.2) | 56 (3.3) | 25 (2.4) | 9 (3.6) | 22 (6.2) | ||
aAccording to the 2000 Centers for Disease Control and Prevention Growth Chart, overweight/obesity is defined as a BMI of the same age and sex at or above the 85th percentile.
Table 3.
Relationship between dietary protein energy supply ratio (continuous variable) and obesity risk in children and adolescents after adjusting for different confounding factors.
Table 3.
Relationship between dietary protein energy supply ratio (continuous variable) and obesity risk in children and adolescents after adjusting for different confounding factors.
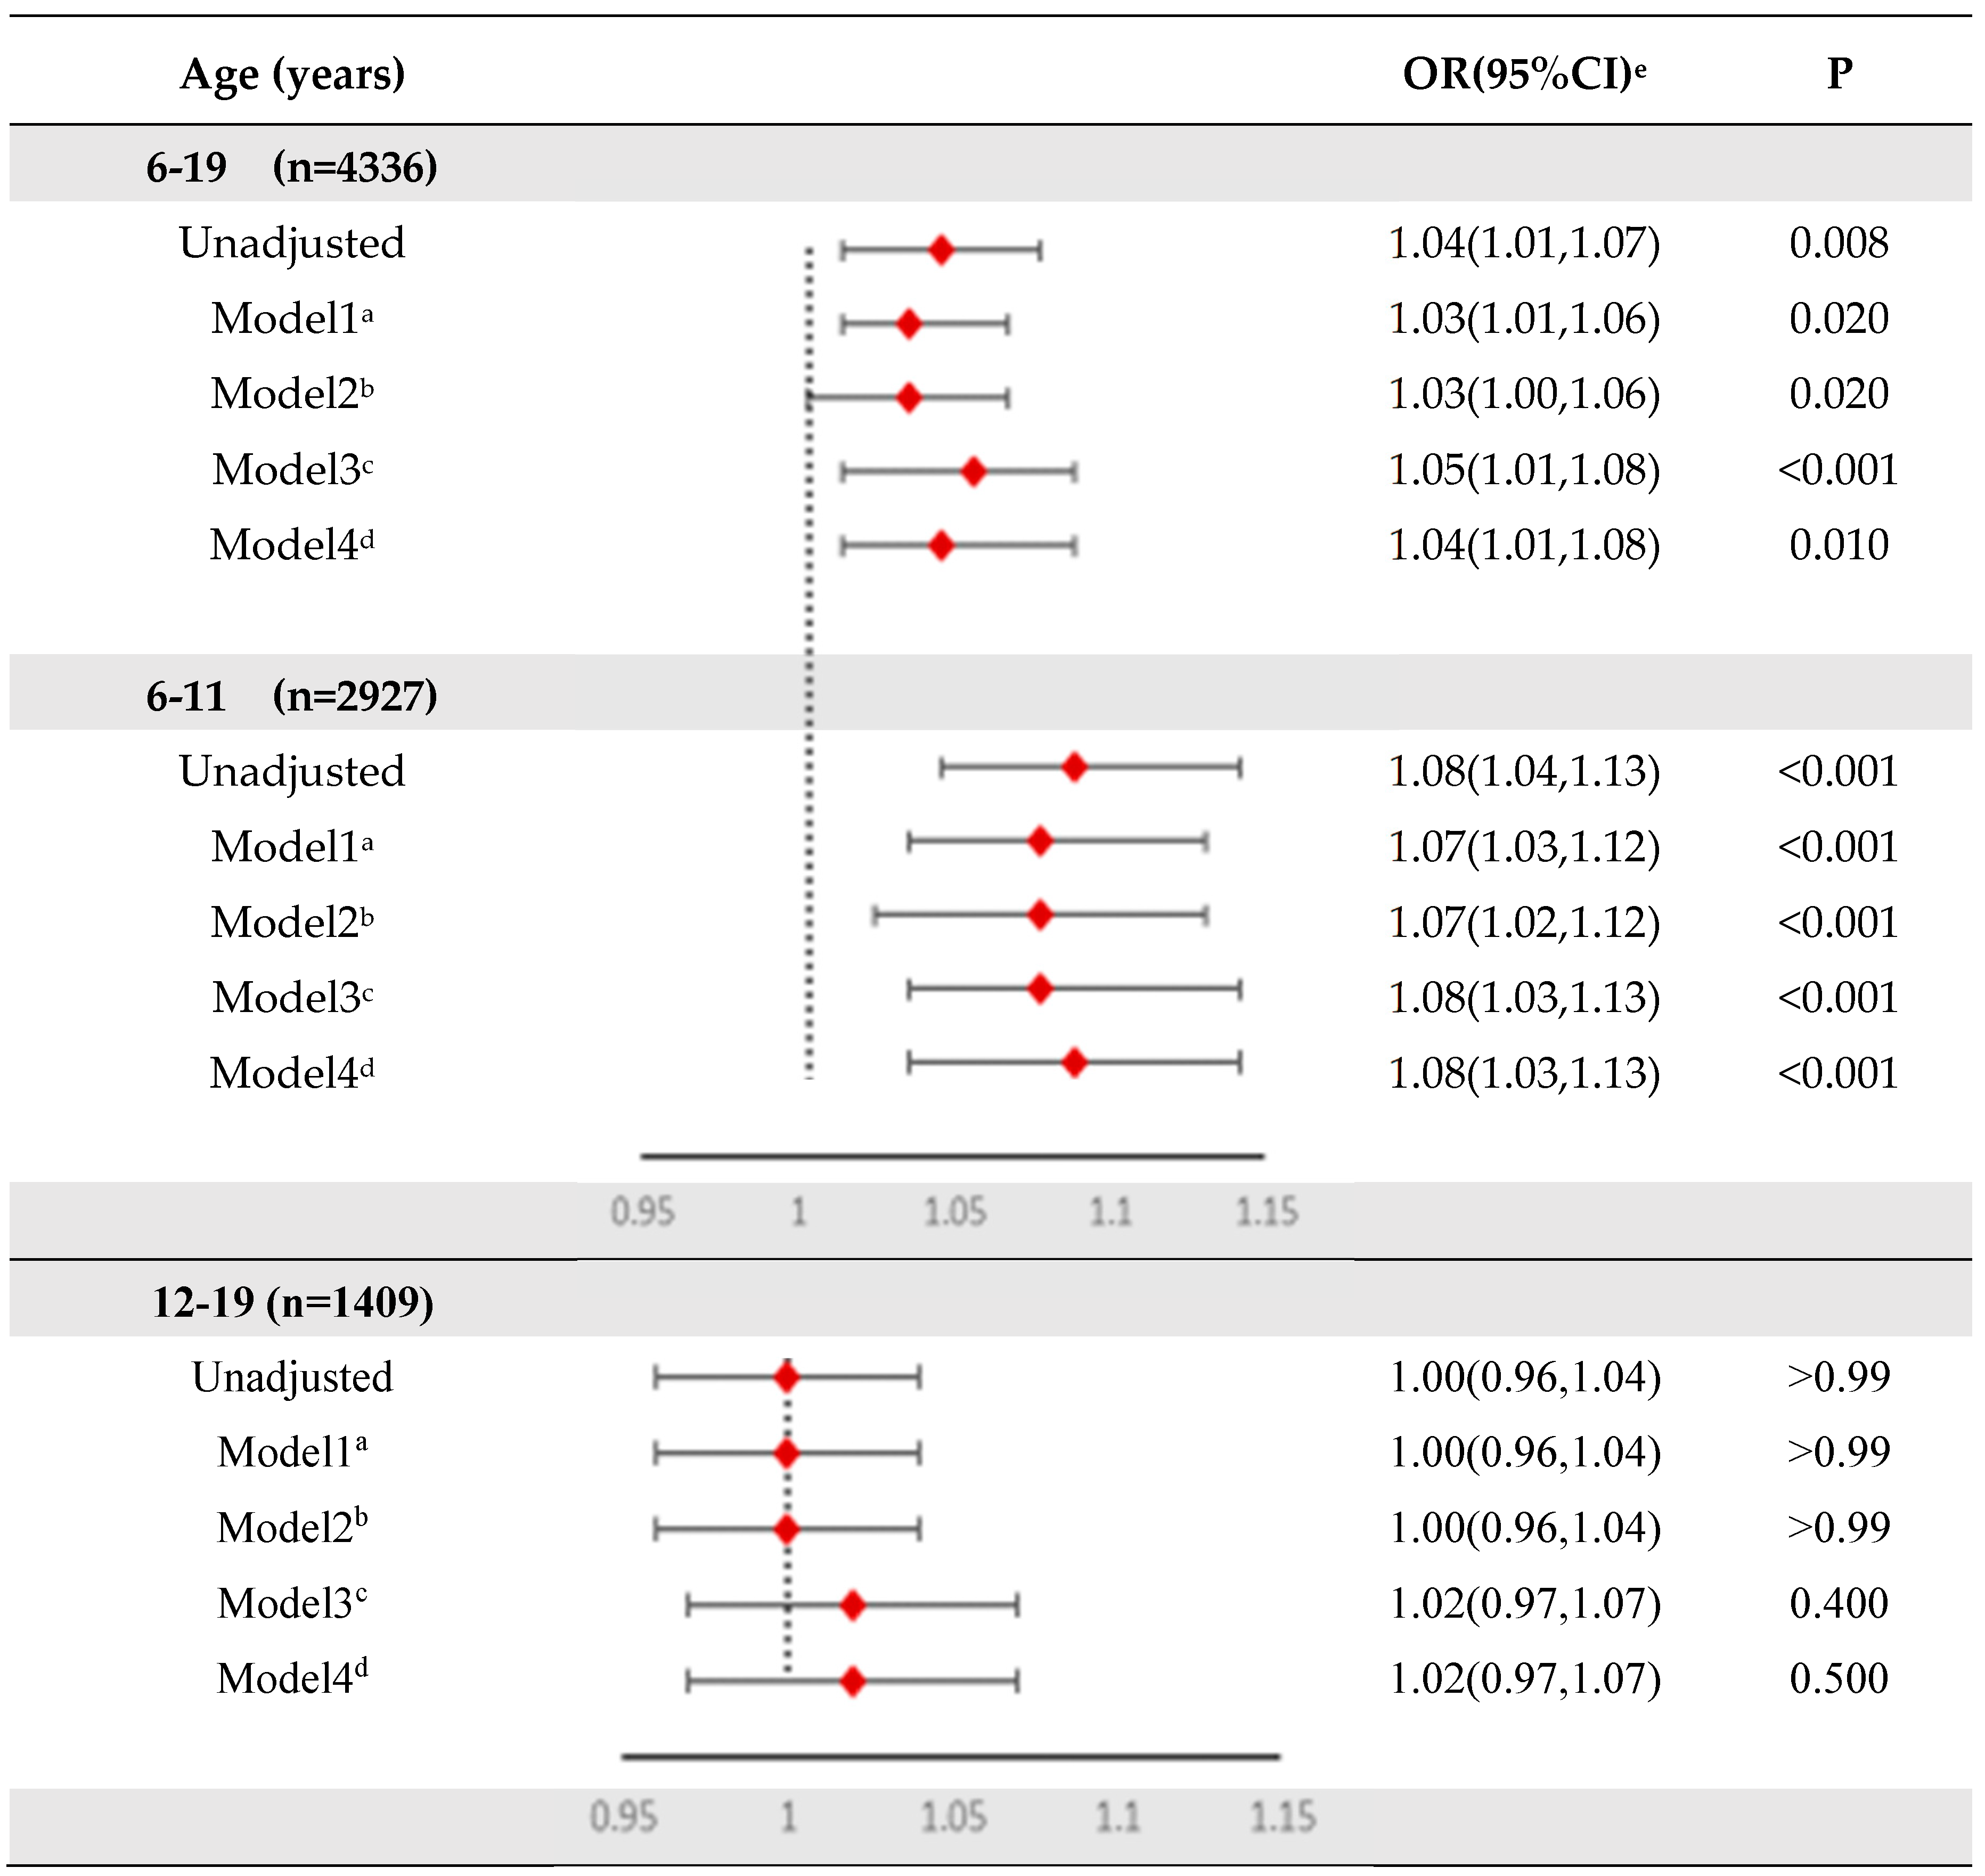 |
aModel 1, adjusted for age, gender, ethnicity; bModel 2, adjusted for model 1 plus household income-to-poverty ratio; cModel 3, according to model 2 plus the concentration of serum total cholesterol and high-density lipoprotein, for adolescents, the concentration of triglycerides, low-density lipoprotein, glycosylated hemoglobin and fasting blood glucose was adjusted on this basis; dModel 4, adjusted for Model 3 plus total energy intake and physical activity. eOR, odds ratio.CI = Confidence Interval.
Table 4.
Logistic Analysis of Protein Supply Ratio and Overweight/Obesity in Children and Adolescents in the United States,NHANES 2011-2020.
Table 4.
Logistic Analysis of Protein Supply Ratio and Overweight/Obesity in Children and Adolescents in the United States,NHANES 2011-2020.
| Quartile of estimated energy supply ratio of dietary protein | ||||||||
|---|---|---|---|---|---|---|---|---|
| Q1 | Q2 | Q3 | Q4 | |||||
| Age (years) | OR(95%CI)e | P | OR(95%CI)e | P | OR(95%CI)e | P | P_trend | |
| 6-19 (n=4336) | 1279 | 1213 | 1089 | 755 | ||||
| Unadjusted | Ref | 1.43(1.01,2.03) | 0.042 | 1.17(0.88,1.55) | 0.300 | 1.64(1.18,2.28) | 0.004 | 0.011 |
| Model1a | Ref | 1.41(1.00,2.00) | 0.050 | 1.10(0.82,1.48) | 0.500 | 1.54(1.11,2.14) | 0.011 | 0.035 |
| Model2b | Ref | 1.40(0.99,1.98) | 0.057 | 1.09(0.81,1.47) | 0.600 | 1.53(1.10,2.14) | 0.012 | 0.039 |
| Model3c | Ref | 1.46(1.01,2.11) | 0.047 | 1.14(0.81,1.61) | 0.400 | 1.69(1.18,2.41) | 0.005 | 0.016 |
| Model4d | Ref | 1.46(1.02,2.10) | 0.040 | 1.13(0.80,1.59) | 0.500 | 1.65(1.15,2.38) | 0.007 | 0.024 |
| 6-11 (n=2927) | 901 | 853 | 746 | 427 | ||||
| Unadjusted | Ref | 1.65(1.04,2.60) | 0.033 | 1.28(0.87,1.88) | 0.200 | 2.08(1.40,3.08) | <0.001 | 0.002 |
| Model1a | Ref | 1.62(1.03,2.57) | 0.038 | 1.19(0.81,1.75) | 0.400 | 1.94(1.30,2.88) | <0.001 | 0.008 |
| Model2b | Ref | 1.60(1.01,2.54) | 0.045 | 1.17(0.79,1.72) | 0.400 | 1.90(1.27,2.86) | 0.002 | 0.011 |
| Model3c | Ref | 1.71(1.08,2.70) | 0.023 | 1.28(0.85,1.95) | 0.200 | 2.05(1.33,3.17) | 0.002 | <0.001 |
| Model4d | Ref | 1.70(1.07,2.70) | 0.025 | 1.29(0.85,1.98) | 0.200 | 2.08(1.34,3.23) | 0.002 | <0.001 |
| 12-19(n=1409) | 374 | 358 | 341 | 327 | ||||
| Unadjusted | Ref | 1.34(0.88,2.05) | 0.200 | 0.96(0.64,1.42) | 0.800 | 1.14(0.68,1.92) | 0.600 | >0.99 |
| Model1a | Ref | 1.34(0.88,2.05) | 0.200 | 0.96(0.64,1.42) | 0.800 | 1.14(0.68,1.92) | 0.600 | >0.99 |
| Model2b | Ref | 1.41(0.89,2.23) | 0.140 | 0.99(0.68,1.44) | >0.99 | 1.17(0.69,1.97) | 0.600 | >0.99 |
| Model3c | Ref | 1.42(0.85,2.37) | 0.200 | 0.92(0.60,1.42) | 0.700 | 1.41(0.79,2.52) | 0.200 | 0.600 |
| Model4d | Ref | 1.42(0.83,2.42) | 0.200 | 0.89(0.57,1.41) | 0.600 | 1.30(0.75,2.25) | 0.300 | 0.700 |
aModel 1, adjusted for age, gender, ethnicity; bModel 2, adjusted for model 1 plus household income-to-poverty ratio; cModel 3, according to model 2 plus the concentration of serum total cholesterol and high-density lipoprotein, for adolescents, the concentration of triglycerides, low-density lipoprotein, glycosylated hemoglobin and fasting blood glucose was adjusted on this basis; dModel 4, adjusted for Model 3 plus total energy intake and physical activity. eOR, odds ratio.CI = Confidence Interval.
Disclaimer/Publisher’s Note: The statements, opinions and data contained in all publications are solely those of the individual author(s) and contributor(s) and not of MDPI and/or the editor(s). MDPI and/or the editor(s) disclaim responsibility for any injury to people or property resulting from any ideas, methods, instructions or products referred to in the content. |
© 2023 by the authors. Licensee MDPI, Basel, Switzerland. This article is an open access article distributed under the terms and conditions of the Creative Commons Attribution (CC BY) license (https://creativecommons.org/licenses/by/4.0/).
Copyright: This open access article is published under a Creative Commons CC BY 4.0 license, which permit the free download, distribution, and reuse, provided that the author and preprint are cited in any reuse.