Submitted:
05 October 2023
Posted:
05 October 2023
You are already at the latest version
Abstract
Non-exhaust fine particles such as tires and brakes emitted from vehicles have a significant impact
on air pollution and human harm, and regulations on emissions are being discussed in earnest,
starting with the introduction of brake wear particles emission standards in Euro 7. Various indoor
and outdoor experiments were conducted, such as analysis of the amount of wear on tires and
brakes, and analysis of the physical and chemical properties of fine particles, as fundamental data
for the introduction of emission standards and the development of low wear tires and brakes to
meet regulations. Recently, international standardized indoor experimental methods for brakes
have been announced, and indoor and outdoor experimental methods for tires have been
continuously studied to develop international standardized methods. In particular, tire-break-road
wear particles are usually mixed with each other in the non-exhaust particles from a vehicle driving
on real roads, and in-depth research is being performed on the accurate classification and
characteristic analysis. In this study, the characteristics of the volatile organic components (VOCs)
and marker substances for tire and tire-road wear fine particles were analyzed. A system capable
of measuring non-exhaust wear fine particles was installed on the vehicle, and samples were
collected from the vehicle running on the two different driving conditions, various constant speeds
in the proving ground road and real driving roads. The VOCs contained in tires and tire-road-wear
particles (TRWPs) under the specific temperature conditions with a thermogravimetric analyzergas chromatography/mass analysis (TGA-GC/MS). In addition, the correlations between VOCs
and tire rubber components were analyzed through marker analysis using pyrolysis-gas
chromatography/mass analysis (GC/MS). In VOCs, n-Hexane, n-Dodecane, and 1-Butene were
measured relatively much in both constant-speed and real-drive tests. In addition, marker
substances of synthetic rubber and natural rubber were not detected in the collected background
fine particles.
Keywords:
Tire particles
; Brake particles
; Volatile organic components
; Markers
; Rubber
1. Introduction
Non-exhaust wear particles from vehicles are mainly caused by friction between the pad and disk of the brake and between the tire and the road, and non-exhaust wear particles collected in the atmosphere contain various materials such as brake pads, disks, tire treads, and road materials. In particular, heavy tire-road wear particles (TRWPs) tends to accumulate on the road and side of the road as the vehicle moves, whereas light particles are flowing into the atmosphere and float, and then the movement of particles is stabilized and accumulated on the road and side of the road. These suspended or accumulated particles permeate the soil or flow into rivers or seas due to rain or road cleaning. Therefore, TRWPs are known to have a great influence on the atmosphere, soil, and aquatic environment [1,2,3,4]. Various studies have been conducted to identify the life cycle and cycle-specific mechanisms of TRWPs [2,3,5,6,7,8]. In particular, various studies have been conducted in indoor and outdoor experiments, such as tire wear characteristics and wear particle characteristics. These outdoor experiments mainly focus on vehicle and driving characteristics, tire wear, shape and size of wear particles, characteristics with concern of wear particle size, marker analysis, physicochemical composition, contribution to atmospheric particulate matter (PM), natural impact, and human toxicity. The need to regulate the emission of TRWPs along with PM contained in automobile exhaust gases is being discussed worldwide due to air pollution and human health. Accordingly, a detailed investigation is required to accurately analyze the physicochemical properties of TRWPs, accurate emission measurement, and proportion of TRWPs in the atmosphere along with brake wear particles.
Tires are generally made of rubber, fillers, oils, additives, and vulcanizers. Natural rubber (NR) and styrene-butadiene rubber (SBR) account for approximately from 40% to 60% of tires. Fillers with carbon black as the main ingredient charge from 20% to 35% [9]. Marker analysis is mainly used to analyze tire particles or TRWPs in the atmosphere to understand the physical and chemical properties of tires, and to evaluate the ratio of TRWP in particulate matter (PM) sampled in the atmosphere. Vinylcyclohexene, dipentene, styrene, and butadiene are usually used in this analysis [1,6]. The TRWPs in the atmosphere were also analyzed as polycyclic aromatic hydrocarbons (PAHs), volatile organic components, and heavy metals [10,11,12,13].
In the previous studies on the properties of TRWPs, the characteristics of tire particles and PM in the atmosphere have been reported with thermal gravimetric analysis (TGA), differential scanning calorimetry (DSC), and pyrolysis-gas chromatography/mass spectrometry (GC/MS) [1,14,15,16]. In the contributions of tire particles (TP) and TRWP in PM10 shows 0.23–1.24% and 0.45–2.48%, respectively [1].
In this study, VOCs in tires and the TRWPS emitted from a vehicle driving were measured with a TGA-GC/MS, and analyzed below the maximum temperature at which the temperature of the tire surface rises while the vehicle is driving. A system for collecting TRWPs between driving was developed and mounted on a vehicle, and carried out on a proving ground road and on the road developed to measure real driving emissions from small passenger vehicles. A line for collecting background fine particles was also installed in the system to distinguish between the collected TRWPs and fine particles in the atmosphere. TRWPs obtained from the constant speed driving condition were collected on the proving ground roads, and TRWPs were also collected from a vehicle driving at the time of the least traffic to minimize external effects in the real driving condition. Background fine particles and TRWPs were collected by dividing particle diameters into PM2.5 and PM10. TGA-GC/MS was used to measure VOCs from tires, collected background fine particles, and TRWPs, and 52 types of ozone precursors were used for this purpose. In addition, pyrolizer-GC/MS was used to analyze the correlation between VOCs and rubber components that manufacture tire with measuring the distribution of marker substances called vinylcyclohexene (trace material of SBR) and dipentene (trace material of NR).
2. Materials and Methods
Several small cropped samples are cut from new tires and from tires in use for the vehicle driving on real roads to make samples in the form of fine particles, as presented in Figure 1. The small pieces of tire were immersed in liquid nitrogen and pulverized to form fine particles with a liquid nitrogen cooling method [17,18]. For the aspect ratio and the load index of tires used in this study, the aspect ratio defined as the cross-sectional height divided by the cross-sectional width and multiplied by 100, is in the range of 40 to 80 and the load index defined as the weight the tire can support safely, ranged from 75 to 110, respectively. The tread depth of tires ranged from 1.02 to 7.75 mm.
The vehicle was equipped with two sampling ports, the one was in the back-side of the front left wheel for capturing tire road wear particles and the other was in the front-side of the front right wheel for background particles, as shown in Figure 2. These two different sampling positions allowed to investigate the chemical analysis of two different particle samples, TRWPs caused by friction between tire and road surface and fine particles already suspended in the environment. The TRWPs and background particles running through each suction port pass through each tunnel and were separated and collected through the sampling lines installed to measure by particle size. The sampling air with particles was introduced from the sample tunnel into the sampling line of a constant volume sampler of 0.29 m3/min, and was iso-dynamically controlled with the pump. In particular, particles of different sizes, PM2.5 and PM10, were collected separately by cyclones installed in the sampling line. TRWPs passing through each size selected cyclone were collected in PTFE filters with size of OD 47 mm ID 46.2 mm ID and quartz filters of the same size as the PTFE filter, the same as the background particles were collected.
Table 1 presents the specifications of the vehicle equipped with a system collecting TRWPs and background particles in real road driving test, including manufacturer, vehicle type, the curb weight of vehicle and the weight of vehicle fully equipped with experiment instrument, engine displacement, the specification of wheel and tire applied in the vehicle, and the max. power and torque.
Figure 3 depicts the aerial photograph of two test roads, a proving ground road (A) and a real driving road (B), for the TRWPs measurement. The proving ground road complies with the ISO10844-2021 standard for measuring sound emissions from vehicles. The driving test distance between two points, ① and ②, is around 500 m, and the road grade is almost zero, i.e., flat road, and no curve exists. Before the experiment starts, all tires were cleaned and dried to carry out an accurate chemical analysis of the sampled particles. The vehicle drove up to 30 km/h and maintained at this velocity, and the vehicle velocity decreased slowly, and then stopped at the end of the test road without braking. The TRWPs and background particles were sampled at the vehicle velocity of 30 km/h and this process was repeated for 6 hours. Two different velocities of 40 km/h and 50 km/h were performed in the same manner as in 30 km/h. The 60 km/h case was also carried out for around 2 hours, because the tire wear can be effectively measured in a relatively short driving period. The total mileage in each case was 151.7km for 30km/h, 184.9km for 40km/h, 203.3km for 50km/h, and 75.1km for 60km/h, respectively.
For the real driving TRWPs emissions, the characteristics of emissions is significantly dependent of road types such as uphill, flatland, and downhill, as well as driving conditions such as driving distance, vehicle speed, and driving time. Furthermore, the average velocity affecting the TRWPs characteristics is also depending on the conditions of road traffic and pavement. Based on the geographical analysis, the RDE route shows that there exist hills and overpasses from 13 km to 16 km, followed by a short rising and falling road in the region from 10.5 km to 11 km, while the peaks in the region of 18-25 km can be due to several overpasses and hill roads [19].
Figure 4 presents the photograph of the experimental instrument for chemical analysis of tire particles, TRWPs and background particles. A thermogravimetric analyzer (STA PT1600, Linseis GmbH, German) measures the temporal variation of a sample mass subjected to a specified temperature profile. The change in sample mass can be attributed to either chemical reaction with reactants, or evaporation in an inert gas environment. In TGA calibration, two standard weights, 50 mg and 1 g, were used to calibrate the microbalance, while the temperature calibration was carried out with Curie temperature standard materials in the heating mode. Calibration samples were loaded into the TGA pan, and then exposed to an elevated temperature profile of 10 °C/min in a nitrogen gas environment to measure Curie point temperatures. The measured temperatures were corrected to 323.59 °C and 415.34 °C, respectively.
A GC/MS (GB/BenchTOF-Select, Markes, England) is calibrated in two procedures, such as inspection of air and water background and mass calibration. The air-to-water background ratio is used to determine the leakage tightness of the mass spectrometer and its suitability to examine the sample. For systems without leakage, the molar mass of water (i.e., 18 g/mol) must have a higher than the molar mass of nitrogen (i.e., 28 g/mol) and the molar mass of oxygen (i.e., 32 g/mol) background. The ratio of N2 to O2 in the ambient air and the ratio of H2O to protonated H2O shall be 4:1 and 9:1, respectively. Automatic mass calibration uses PFTBA, where algorithms to find peaks must find all mass peaks within approximately 1 amu of the initial stage. PFTBA, a liquid calibration vapor, was introduced into the ion source, and the defined mass peak of the calibration material selected in the flight time spectrum was identified to calculate the coefficient for the flight time/mass conversion. The coefficient and flight time are used as default values for measurements in future experiments.
The temperature-programmable experiments were performed with a TGA. First, the TGA was used to measure the instantaneous mass and the rate of mass loss of tire particles, TRWPs and background particles subjected to the specific temperature program in a nitrogen environment. Second, the volatile component dissolved from particles were measured with a Gas chromatography connected with a mass spectrometer (GC-MS), respectively.
The samples were exposed to nitrogen environment in heating mode with temperature gradient of 10°C/min, then maintained at an isothermal temperature of 50 °C for 1 hour, and then ramped at the same temperature gradient to 100 °C, then maintained for 1hour. After then, the temperature was raised at the rate of 10 °C/min to 200 °C and maintained isothermally for 1 hour at this temperature in the nitrogen environment. It is known that when a vehicle runs on real road at the max. speed, the temperature of friction area between tires and roads can be up to 200 °C. During the heating period, the mass of sample was lost due to the evaporation of volatile organic compounds (VOCs) contained in the sample particles. The mass loss of the samples and the VOCs dissolved from the samples were analyzed in each isothermal condition.
In general, ozone in the atmosphere is known to be harmful to the human health, such as destroying cells of living organisms and degrading the function of the respiratory system when exposed to high concentration for a long time [20,21]. Furthermore, VOCs in the atmosphere has a significant influence on this ozone production [22,23]. In this study, a mixed gas containing 52 kinds of ozone precursors with a purity of 99.999% (Restek, USA), ranging from light molecular weight (C2) to heavy molecular weight (C12), were used to determine VOCs dissolved from tires. The basic information such as formula and molecular weight on these chemical species in listed in Table 2.
Figure 5 shows the photograph of pyrolyzer (Pyrolyzer-3030D, Frontier Lab, Fukusima, Japan) connected with GC/MS (Agilent 5975B, Agilent, Santa Clara, CA, USA) for analyzing vinylcyclohexene and dipentene in the particle samples of tire, TRWPs and background. The calibration of pyrolyzer-GC/MS was performed with peaks for the three different isotope mass ions using perfluorotributylamine (PFTBA). The peaks for the mass ions of 69, 219, and 502 m/z are examined with perfluorotributylamine (PFTBA), and the three different ranges of 70–69, 220–219, and 503–502 m/z were scanned with peaks for the isotope mass ions of 70, 220, and 503 m/z. Furthermore, the two different ratios between 69 and 219 m/z and between 69 and 502 m/z were measured to confirm to be higher than a certain value. The calibration was carried out with analyzing the proportions of the precursors of 69, 219, and 502 m/z and the two different ratios, between 18 and 69 m/z and between 28 and 69 m/z. The precision and accuracy were 0.03–0.3 ppb and 0.5–10.1%, with the linearity of 0.992~0.996 in the calibration curves.
A quantitative pyrolysis–GC/MS protocol based on the ISO/TS 20593 method (ISO/TS 20593, 2017) was used to analyze the markers in the rubber of tire, TRWPs and background particles. In this study, styrene-butadiene-rubber (SBR) and natural rubber (NR) were thermally decomposed into the polymers, and vinylcyclohexene (a tracing material of SBR) and dipentene (a tracing material of NR) were measured with GC/MS.
3. Results
Table 3 represents the chemical species of volatile organic component dissolved from tire particle samples subjected to three different temperature conditions in a nitrogen environment. The mass of tire particle samples was reduced by 0.77 mg, which corresponds to the VOCs dissolved from the tire sample. The VOCs was introduced into the GC/MS to analyze the chemical components. Of the 52 ozone precursors, 8 kinds of precursors, 2-Methylpentane, n-Hexane, 3-Methylhexane, n-Heptane, Methylcyclohexane, Toluene, n-Octane and Cyclohexane, were not detected in the tire samples.
In the temperature condition of 50 ℃, the largest amount of n-Propylbenzene was measured at 33.91 ppb, followed by n-Dodecane, p-Diethylbenzene, n-Nonane and o-Ethyltoluene, and the others were measured at 3 ppb or less. For 100 ℃, n-Propylbenzene was dissolved the most as in the condition of 50 ℃, n-Dodecane and p-Diethylbenzene were measured the next most, and the others was below 3 ppb. For 200 ℃, n-Propylbenzene was measured in smaller amounts in the cases of 50 and 100, while 1-Butene was measured the most, 18.82 ppb, followed by 2-Methylhexane and Isopropylbenzene.
Table 4 shows the mass of initial sample and VOCs dissolved from tire particle samples obtained from a vehicle running at 30 km/h on the proving ground, which is subjected to 200 ℃ for 1 hour in a nitrogen environment. The tire wear particles emitted during road driving were characterized at a maximum durability temperature of 200 °C, considering that the temperature of the friction area between the tire and road increased up to a certain temperature depending on the driving conditions. The samples were exposed to nitrogen environment in heating mode with temperature gradient of 10°C/min, then maintained at an isothermal temperature of 200 °C for 1 hour. The mass of tire particle samples was reduced by 0.314 mg for the background PM10, 0.403 mg for the TRWP PM10, 0338 mg for the background PM2.5 and 0.658 mg for the TRWP PM2.5, which were corresponding to the VOCs dissolved from the particles sample. For the ratio of the VOCs compared to the initial sample in mass, the background particles and TRWPs were similar around 1.7% in PM10, whereas the TRWPs were higher than the background particles.
Table 5 presents the chemical components measured in PM10 and PM2.5 among TRWPs and background particles obtained from a vehicle running at 30 km/h on the proving ground. For PM10, various kinds of ozone precursors, 16 species for the background particles and 15 species for the TRWPs, were measured in the VOCs flowing into the GC/MS from the TGA. As shown in this table, cis-2-Butene was not measured for both background particles and TRWPs, and n-Decane was detected only for TRWPs. In addition, m-Ethyltoluene and 1,3,5-Trimethylbenzene were measured in background particles, but not in TRWPs. For the VOCs from TRWPs, the largest amount of n-Hexane was measured at 4.76 ppb, followed by n-Dodecane and 1-Butene, and the others were measured at 1 ppb or less. For PM2.5, 16 species for the background and 11 species for the TRWPs were measured, respectively. Two species, n-Pentane and 1,3,5-Trimethylbenzene, were not detected for both background particles and TRWPs, whereas, cis-2-Butene, Benzene, Ethylbenzene, o-Xylene and m-Ethyltoluene were not measured in TRWPs. Furthermore, n-Hexane was dissolved the most, n-Dodecane was measured the next most, and the others was below 1 ppb in the VOCs from TRWPs.
To further understand the characteristics of each VOCs component in TRWPs and background particles, the amount of rubber, one of main caused of VOCs in tires, was investigated in background particles and TRWPs, as shown in Table 6. The mass of vinylcyclohexene and dipentene, which are well-known as the marker species of SBR and NR used in manufacturing tires, respectively, were measured from the samples of background particles and TRWPs with pyrolyzer-GC/MS. For the driving case of 30 km/h, the markers species of rubber were not detected in background particles, while it was measured in TRWPs, consequently, it seems that no rubber exists in the background particles.
Table 7 presents the mass of initial sample and VOCs dissolved from tire particle samples obtained from a vehicle running at 40 km/h, 50 km/h and 60 km/h on the proving ground, which is subjected to 200 ℃ for 1 hour in a nitrogen environment. Note that each experiment was performed in the same procedure as for particles collected at a vehicle velocity of 30 km/h. The ratio of the VOCs compared to the initial sample in mass were the range of 1.2 % and 1.5%. The chemical analysis of these VOCs was summarized in Table 8, Table 9 and Table 10.
The chemical components measured in PM10 and PM2.5 among TRWPs and background particles obtained from a vehicle running at 40 km/h on the proving ground, as presented in Table 8. For PM10, 30 species for the background particles and 19 species for the TRWPs, were measured in the VOCs from the particle samples. Propylene, Isobutane, cis-2-Butene, n-Pentane, cis-2-Pentene, 2-Methylpentane, 3-Methylpentane, Methylcyclopentane, Styrene, n-Nonane and p-Ethyltoluene were measured only in background particles. For the VOCs from TRWPs, the largest amount of n-Hexane was measured at 6.29 ppb, followed by n-Dodecane, 1-Butene, m,p-Xylene and 1,2,4-Trimethylbenzene, and the others were measured at 1 ppb or less. 11 species for the background and 13 species for the TRWPs were measured in VOCs emitted from PM2.5, respectively. Two species, n-Butane and Isopentane, were only detected for TRWPs. For PM2.5 of TRWPs, n-Hexane was dissolved the most, n-Dodecane and 1-Butene were measured the next most, and the others was below 1 ppb.
Table 9 represents the chemical components measured in PM10 and PM2.5 among TRWPs and background particles obtained from a vehicle running at 50 km/h on the proving ground. For PM10, 11 species for the background particles and 17 species for the TRWPs, were measured in the VOCs. 6 species such as n-Butane, Isopentane, n-Pentane, m-Ethyltoluene, 1,3,5-Trimethylbenzene and 1,2,3-Trimethylbenzene were measured only in TRWPs. For the VOCs from TRWPs, the largest amount of n-Dodecane was measured at 3.71 ppb, followed by n-Hexane, 1-Butene, m,p-Xylene, and the others were measured at 1 ppb or less. For PM2.5, 15 species for the background and 14 species for the TRWPs were detected in VOCs, respectively. One species, 1,3,5-Trimethylbenzene, was not measured in TRWPs. For PM2.5 of TRWPs, n-Hexane was dissolved the most, n-Dodecane and 1-Butene were measured the next most, and the others was below 1 ppb, which was quite similar in the cases of 30 km/h and 40 km/h.
Table 10 presents the chemical components measured in PM10 and PM2.5 among TRWPs and background particles obtained from a vehicle running at 60 km/h on the proving ground. For PM10, 7 species for the background particles and 13 species for the TRWPs, were measured in the VOCs, respectively. As shown in this table, n-Decane and 1,2,3-Trimethylbenzene were not measured for both background particles and TRWPs, and n-Butane, Isopentane, n-Pentane, Benzene, n-Heptane and o-Xylene were detected only for TRWPs. For the VOCs from TRWPs, the largest amount of n-Hexane was measured at 4.09 ppb, followed by n-Dodecane and 1-Butene, and the others were measured at 1 ppb or less. For PM2.5, 14 species for the background and 18 species for the TRWPs were measured, respectively. In addition, n-Butane was not detected for both background particles and TRWPs, whereas, Isopentane, n-Pentane, n-Heptane, o-Xylene, n-Decane and 1,2,3-Trimethylbenzene were not measured in TRWPs. For PM2.5 of TRWPs, n-Dodecane was dissolved the most, n-Hexane and 1-Butene were measured the next most, and the others was below 1 ppb.
To better understand experimental results in the different condition, the amount of rubber was investigated in background particles and TRWPs in a manner similar to the procedure at a vehicle velocity of 30 km/h. Table 11 presents the mass for two different tire markers, vinylcyclohexene and dipentene, for PM10 and PM2.5 among TRWPs and background particles obtained from a vehicle driving at running at 40 km/h, 50 km/h and 60 km/h on the proving ground on the proving ground. Similar to the result of 30 km/h, in all cases markers were not present in the background particles, but are present in the TRWPs.
Table 12 shows the mass of initial sample and VOCs dissolved from tire particle samples obtained from a vehicle running on the real road, which is subjected to 200 ℃ for 1 hour in a nitrogen environment. The mass of tire particle samples was reduced by 0.06 mg for the background PM10, 0.06 mg for TRWP PM10, 0.09 mg for the background PM2.5 and 0.08 mg for the TRWP PM2.5, corresponding to the VOCs from the particles sample. The ratio of the VOCs compared to the initial sample in mass was around 0.4% in both PM10 and PM2.5 for the background particles and TRWPs.
Table 13 presents the chemical components measured in PM10 and PM2.5 among TRWPs and background particles obtained from a vehicle running on the real road. For PM10, 24 species for the background particles and 28 species for the TRWPs, were measured in the VOCs from the particle samples. cis-2-Butene, 3-Methylpentane, cis-2-Butene, n-Pentane, cis-2-Pentene, 2-Methylpentane, o-Ethyltoluene and m-Diethylbenzene were measured only in TRWPs. For the VOCs from TRWPs, the largest amount of n-Hexane was measured at 13.4 ppb, followed by n-Dodecane and Toluene, and the others were measured at 2 ppb or less. For the VOCs from PM2.5, 23 species for the background and 34 species for the TRWPs were measured, respectively. 11 species such as Propylene, Isobutane, cis-2-Butene, 2-Methylhexane, 3-Methylhexane, Styrene, n-Nonane, Isopropylbenzene, p-Ethyltoluene, 1,3,5-Trimethylbenzene, o-Ethyltoluene and m-Diethylbenzene, were only measured in TRWPs. For PM2.5 of TRWPs, n-Hexane was dissolved the most, n-Dodecane was measured the next most, and the others was below 2 ppb.
The amount of rubber in the particle samples obtained the real driving condition was also was investigated in background particles and TRWPs in a manner similar to the constant velocity cases. Table 14 presents the mass for two different tire markers, vinylcyclohexene and dipentene, for PM10 and PM2.5 among TRWPs and background particles obtained from a vehicle driving on the real road. Unlike the experimental results described earlier, the marker of SBR, vinylcyclohexene, was measured only in the PM10 of TRWPs, but were not present in the background particles. Furthermore, no markers were present in PM2.5 of the background particles and TRWPs.
4. Conclusions
In this study, the volatile organic components (ozone precursors) and markers (vinylcyclohexene and dipentene) were measured with the TGA-GC/MC analysis and the pyrolyzer-GC/MS analysis for the tire, the TRWPs and background particles. In particular, the TRWPs and background particles were obtained from a vehicle driving on the proving ground road and the real road. The chemical species of volatile organic component (VOC) emitted from the various particle samples exposed to nitrogen environment with the programmed temperature profile in the TGA was investigated by analyzing the concentrations of each species with the GC/MS connected in the TGA. Furthermore, the amount of vinylcyclohexene and dipentene,the marker species of rubber and one of main caused of VOCs in tires, was investigated in the particle samples with the pyrolyzer-GC/MS to further understand the characteristics of VOCs. The results provide accurate experimental data for the distribution of VOCs and markers in tire and in the background particles and TRWPs.
Among the VOCs in the TRWPs collected from a vehicle running on the roads, the proving ground road and the real road, n-Hexane, n-Dodecane and 1-Butene wee observed to be relatively high in most experimental conditions, and other species were measured to be relatively low. In particular, the species of VOCs of PM2.5 in the TRWPs collected from the constant speed driving tended to increase as the vehicle velocity increased, while those of PM 10 tended to increase to 40 km/h and then decrease. In the range of 30 km/h and 50 km/h in vehicle velocity, PM10 has more VOCs species than PM2.5, whereas at 60 km/h, PM10 has the opposite tendency. Furthermore, in real driving, the species of VOCs in TRWPs were measured significantly more than that of constant speed driving. With the marker species analysis, VOCs of background particles can be attributed to be derived from other components used in a tire or other pollutants such as vehicle exhaust emissions rather than rubber components in a tire.
Author Contributions
Conceptualization, S. M. and Y. L.; Investigation, S. M., J. K. and Y.J.; Methodology, H.C. and J. K.; Formal analysis, S. M., Y. L., S. K. and H.C.; Writing original draft, S. M. and H. C. The authors performed the study together and then analyzed its findings. The paper was written together. All authors have read and agreed to the published version of the manuscript.
Funding
This work is supported by the Transportation Pollution Research Center, National Institute of Environmental Research in the Republic of Korea. (Grant No. NIER-2022-01-01-026) and Y.L. and J. L. acknowledges for their full support in the framework of this work.
Data Availability Statemenet
Not applicable.
Conflicts of Interest
The authors declare that they have no known competing financial interests and personal relationships that could have appeared to influence the work reported in this paper.
References
- Panko, J.M.; Hitchcock, K.M.; Fuller, G.W.; Green, D. Evaluation of tire wear contribution to PM2.5 in urban environments. Atmos 2019, 10, 99. [CrossRef]
- Sommer, F.; Dietze, V.; Baum, A.; Sauer, J.; Gilge, S.; Maschowski, C.; Gieré, R. Tire abrasion as a major source of microplastics in the environment. Aerosol Air Qual. Res 2018, 18, 2014–2028. [CrossRef]
- Wagner, S.; Hüffer, T.; Klockner, P.; Wehrhahn, M.; Thofmann, H.; Reemtsma, T. Tire wear particles in the aquatic environment - A review on generation, analysis, occurrence, fate and effects. Water Res 2018, 139, 83–100. [CrossRef]
- Redondo-Hasselerharm, P.E.; de Ruijter, V.N.; Mintenig, S.M.; Verschoor, A.; Koelmans, A.A. Ingestion and chronic effects of car tire tread particles on freshwater benthic macroinvertebrates. Envrion. Sci. Technol 2018, 52, 13986−13994. [CrossRef]
- Panko, J.; Kreider, M.; Unice, K. Chapter 7 - Review of tire wear emissions: A review of tire emission measurement studies: Identification of gaps and future needs. In: Amato F (ed) Non-exhaust emissions; Academic Press, London 2018, 147–160.
- Unice, K.M.; Kreider, M.L.; Panko, J.M. Use of a deuterated internal standard with pyrolysis-GC/MS dimeric marker analysis to quantify tire tread particles in the environment. Int. J. Environ. Res. Public Health 2012, 9, 4033–4055. [CrossRef]
- Kreider, M.L.; Unice, K.M.; Panko, J.M. Human health risk assessment of tire and road wear particles (TRWP) in air. Hum. Ecol. Risk Assess 2020, 26, 2567–2585. [CrossRef]
- Piscitello, A.; Bianco, C.; Casasso, A.; Sethi, R. Non-exhaust traffic emissions: Sources, characterization, and mitigation measures. Sci. Total Environ 2021, 766, 144440. [CrossRef]
- European Tyre & Rubber Manufacture's Association (ETRMA). Scientific report on tyre and road wear particles, TRWP, in the aquatic environment 2019.
- Aatmeeyata, S.M. Polycyclic aromatic hydrocarbons, elemental and organic carbon emissions from tire-wear. Sci. Total Environ 2010, 408, 4563–4568. [CrossRef]
- Boonyatumanond, R.; Murakami, M.; Wattayakorn, G.; Togo, A.; Takada, H. Sources of polycyclic aromatic hydrocarbons (PAHs) in street dust in a tropical Asian mega-city, Bangkok, Thailand. Sci. Total Environ 2007, 384, 420–432. [CrossRef]
- Luhana, L.; Sokhi, R.; Warner, L.; Mao, H.; Boulter, P.; McCra, L.; Wright, J.; Osborn, D. Characterisation of exhaust particulate emissions from road vehicles (PARTICULATES Project). Measurement of non-exhaust particulate matter (Deliverable 8), European Commission, 2004.
- Adachia, K.; Tainosho,Y. Characterization of heavy metal particles embedded in tire dust. Environ. Int 2004, 30, 1009–1017.
- Miguel, G.S.; Aguado, J.; Serrano, D.P.; Escola, J.M. Thermal and catalytic conversion of used tyre rubber and its polymeric constituents using Py-GC/MS. Appl. Catal. B: Environ 2006, 64, 209–219. [CrossRef]
- Gueissaz, L.; Massonnet, G. Study on the discrimination of tires using chemical profiles obtained by Py-GC/MS. J. Anal. Appl. Pyrolysis 2017, 124, 704–718. [CrossRef]
- Panko, J.M.; Chu, J.; Kreider, M.L; Unice, K.M. Measurement of airborne concentrations of tire and road wear particles in urban and rural areas of France, Japan, and the United States. Atmos Environ 2013, 72, 192-199. [CrossRef]
- Zheng, S.J.; Liao, M.C.; Chen, Y.; Brook, M.A. Dissolving used rubber tires. Green Chem 2020, 22, 94-102. [CrossRef]
- Gadd, j.; Kennedy, P. Preliminary examination of organic compounds present in tyres, brake pads and road bitumen in new zealand. Ministry of Transport New Zealand. 2003.
- Chong, H. S.; Park, Y. H.; Kwon, S. I.; Hong, Y. D. Analysis of real driving gaseous emissions from light-duty diesel vehicles. Transp Res D Transp Environ 2018, 65, 485–499. [CrossRef]
- Nattaporn P.; Characteristics and impact of VOCs on ozone formation potential in a petrochemical industrial area, Thailand. Atmos 2022, 13, 732.
- Kristie L. E.; Climate change, tropospheric ozone and particulate matter, and health impacts Environ Health Per-spect 2008, 116, 1449-1455.
- Bowei L.; Characterizations of volatile organic compounds (VOCs) from vehicular emissions at roadside environment: The first comprehensive study in Northwestern China. Atmos Environ 2017, 161, 1-12.
- Jian S.; Urban VOC profiles, possible sources, and its role in ozone formation for a summer campaign over Xi’an, China. Environ Sci Pollut Res 2019, 26, 27769-27782.
Figure 1.
New and used tires for light duty vehicles, and tiny tire samples made from the cropped tire tread samples.
Figure 1.
New and used tires for light duty vehicles, and tiny tire samples made from the cropped tire tread samples.
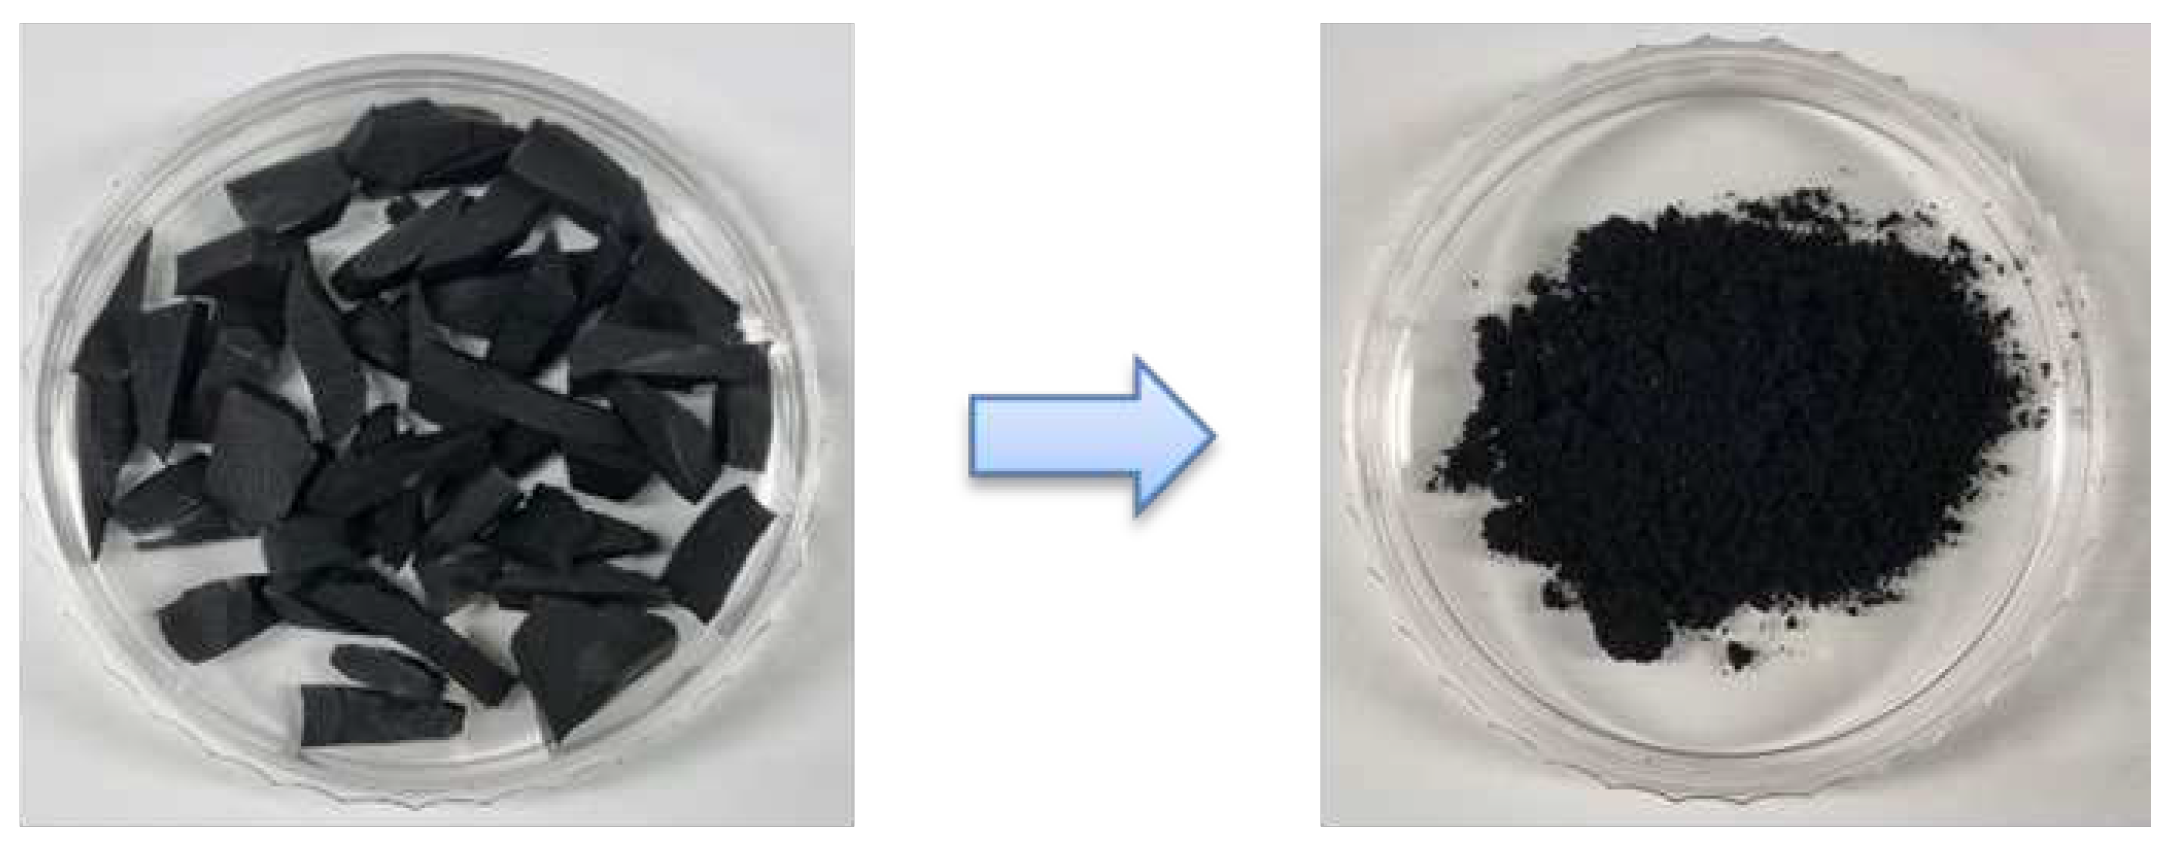
Figure 2.
Photograph of the vehicle equipped with a system for measuring tire-road wear particles (TRWP). The TRWP and background sampling positions were placed in the back-side of the front left wheel and the front-side of the front right wheel for background, respectively.
Figure 2.
Photograph of the vehicle equipped with a system for measuring tire-road wear particles (TRWP). The TRWP and background sampling positions were placed in the back-side of the front left wheel and the front-side of the front right wheel for background, respectively.

Figure 3.
The aerial photograph of two test roads, a proving ground road (A) and a real driving road (B), for the TRWPs measurement (http://map.google.com).
Figure 3.
The aerial photograph of two test roads, a proving ground road (A) and a real driving road (B), for the TRWPs measurement (http://map.google.com).
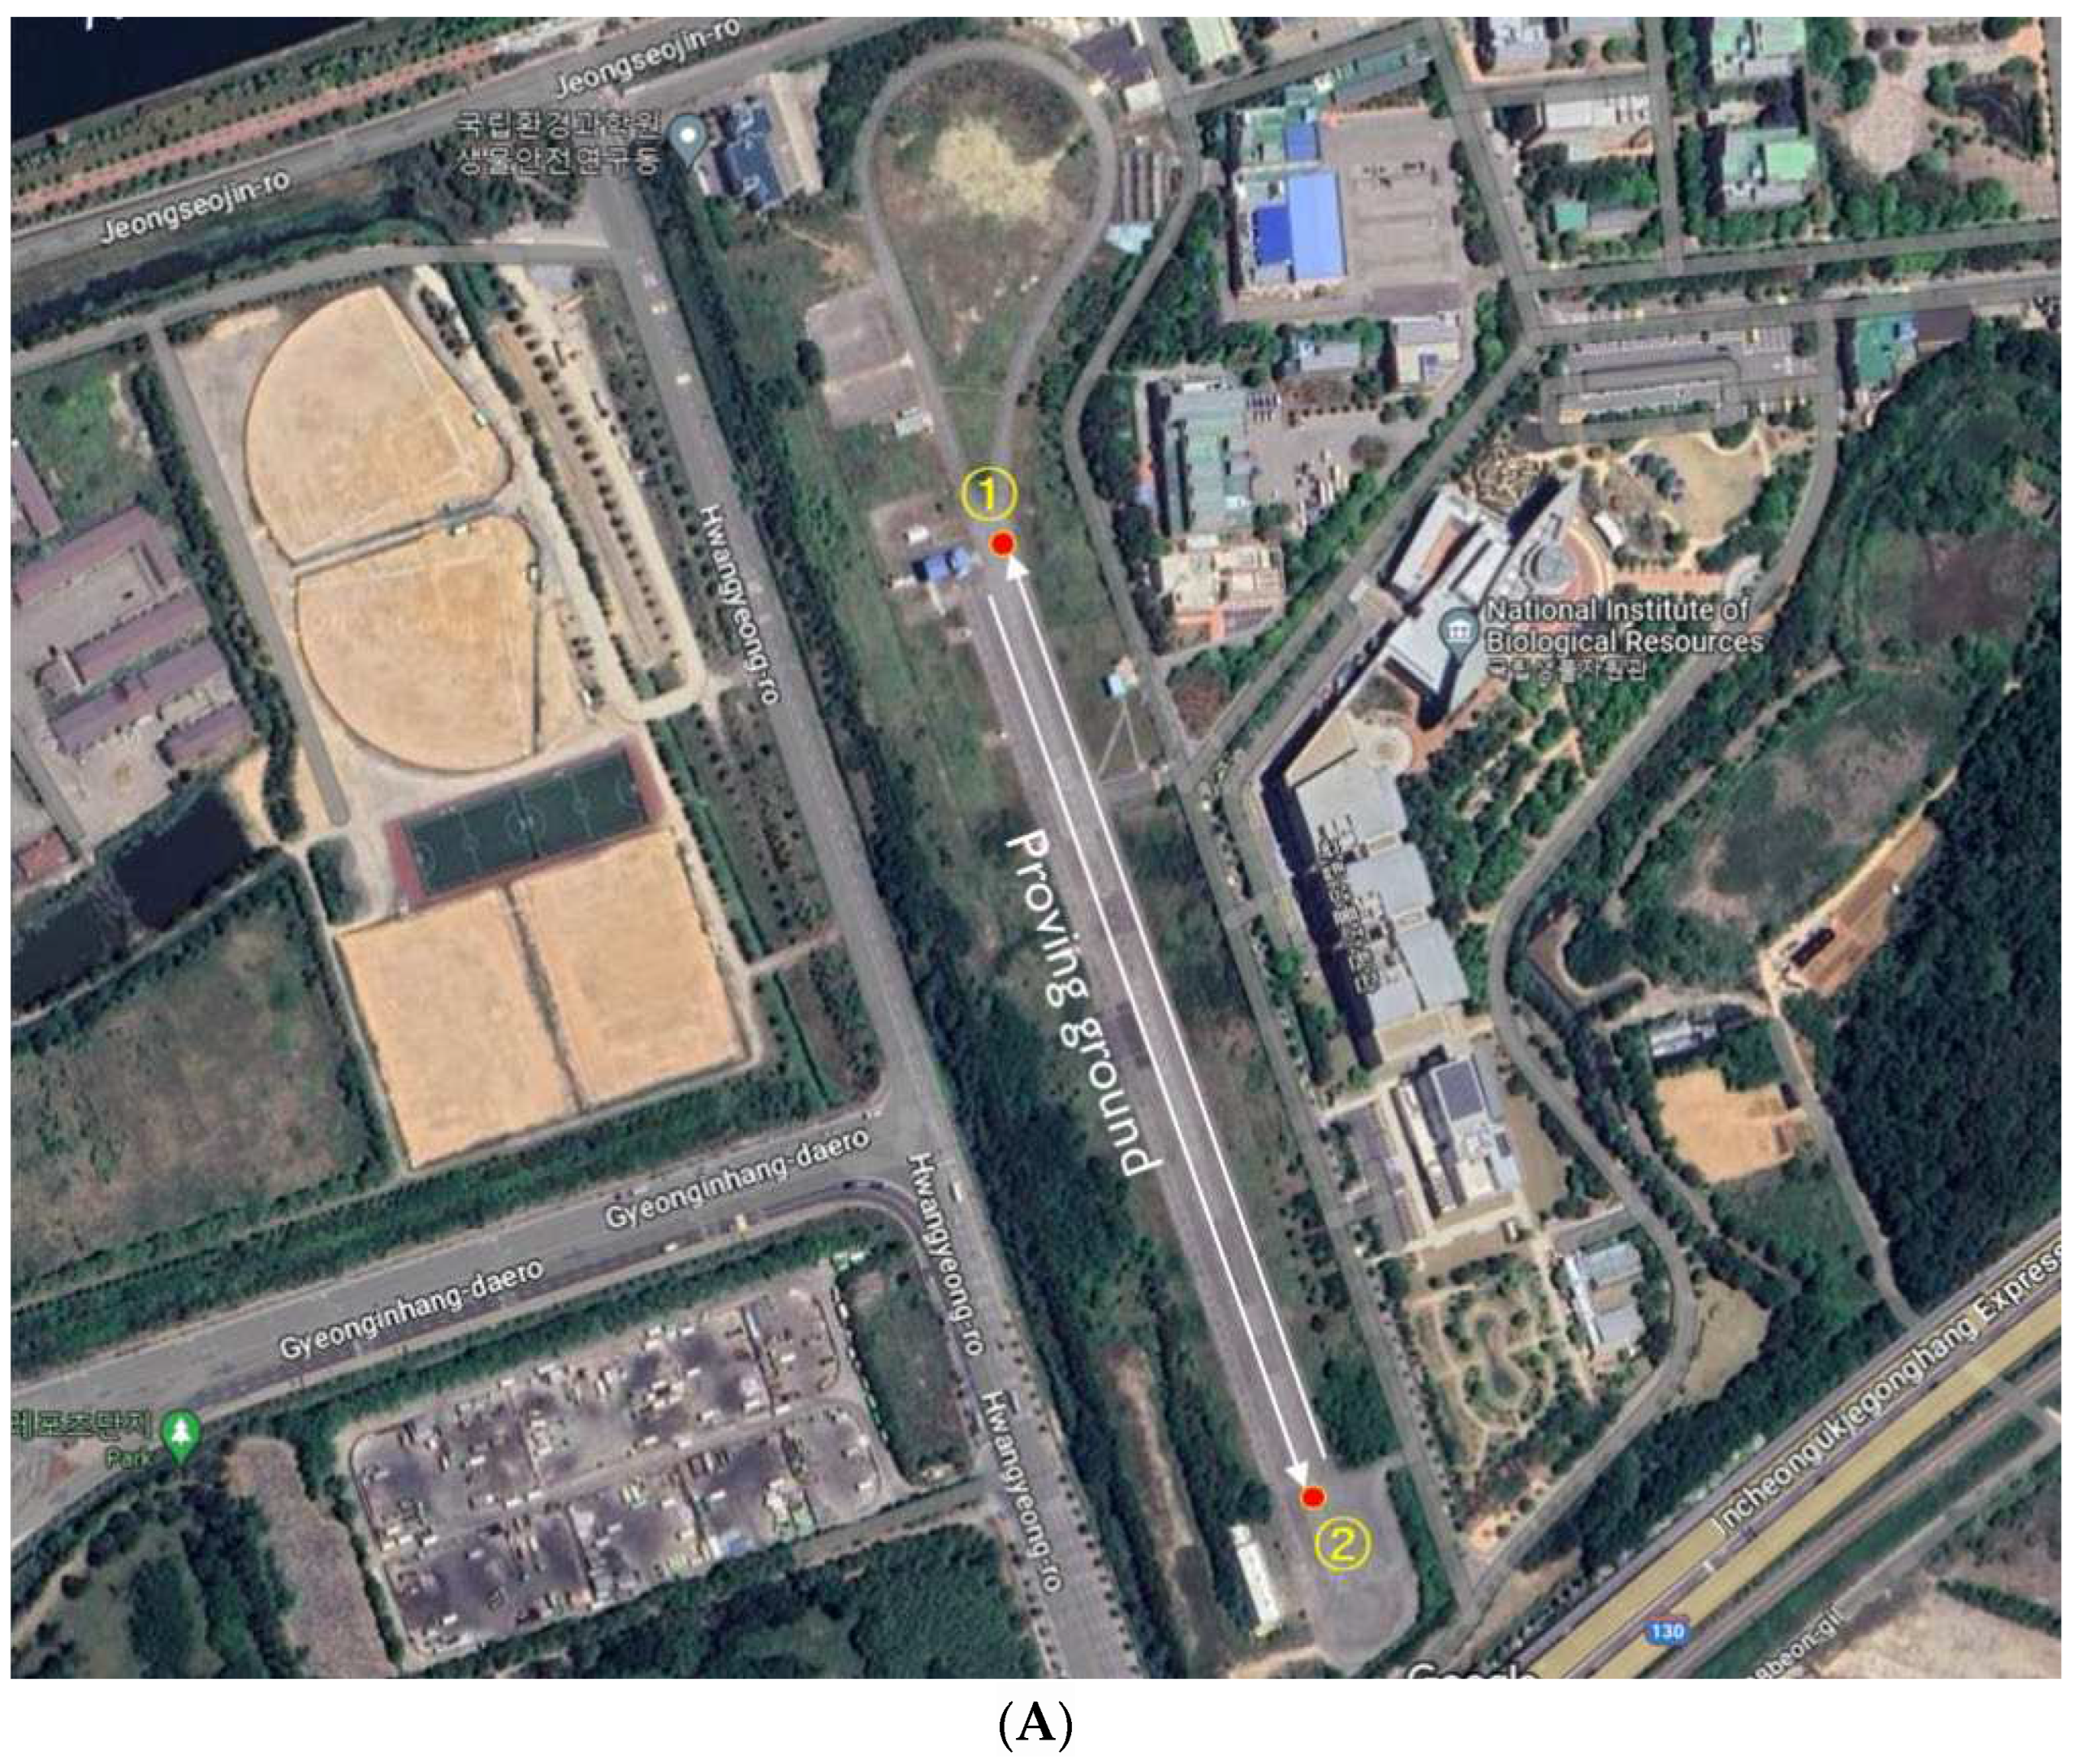

Figure 4.
The photograph of thermogravimetric analyzer (TGA) connected with gas chromatography-mass spectrometer (GC-MS).
Figure 4.
The photograph of thermogravimetric analyzer (TGA) connected with gas chromatography-mass spectrometer (GC-MS).
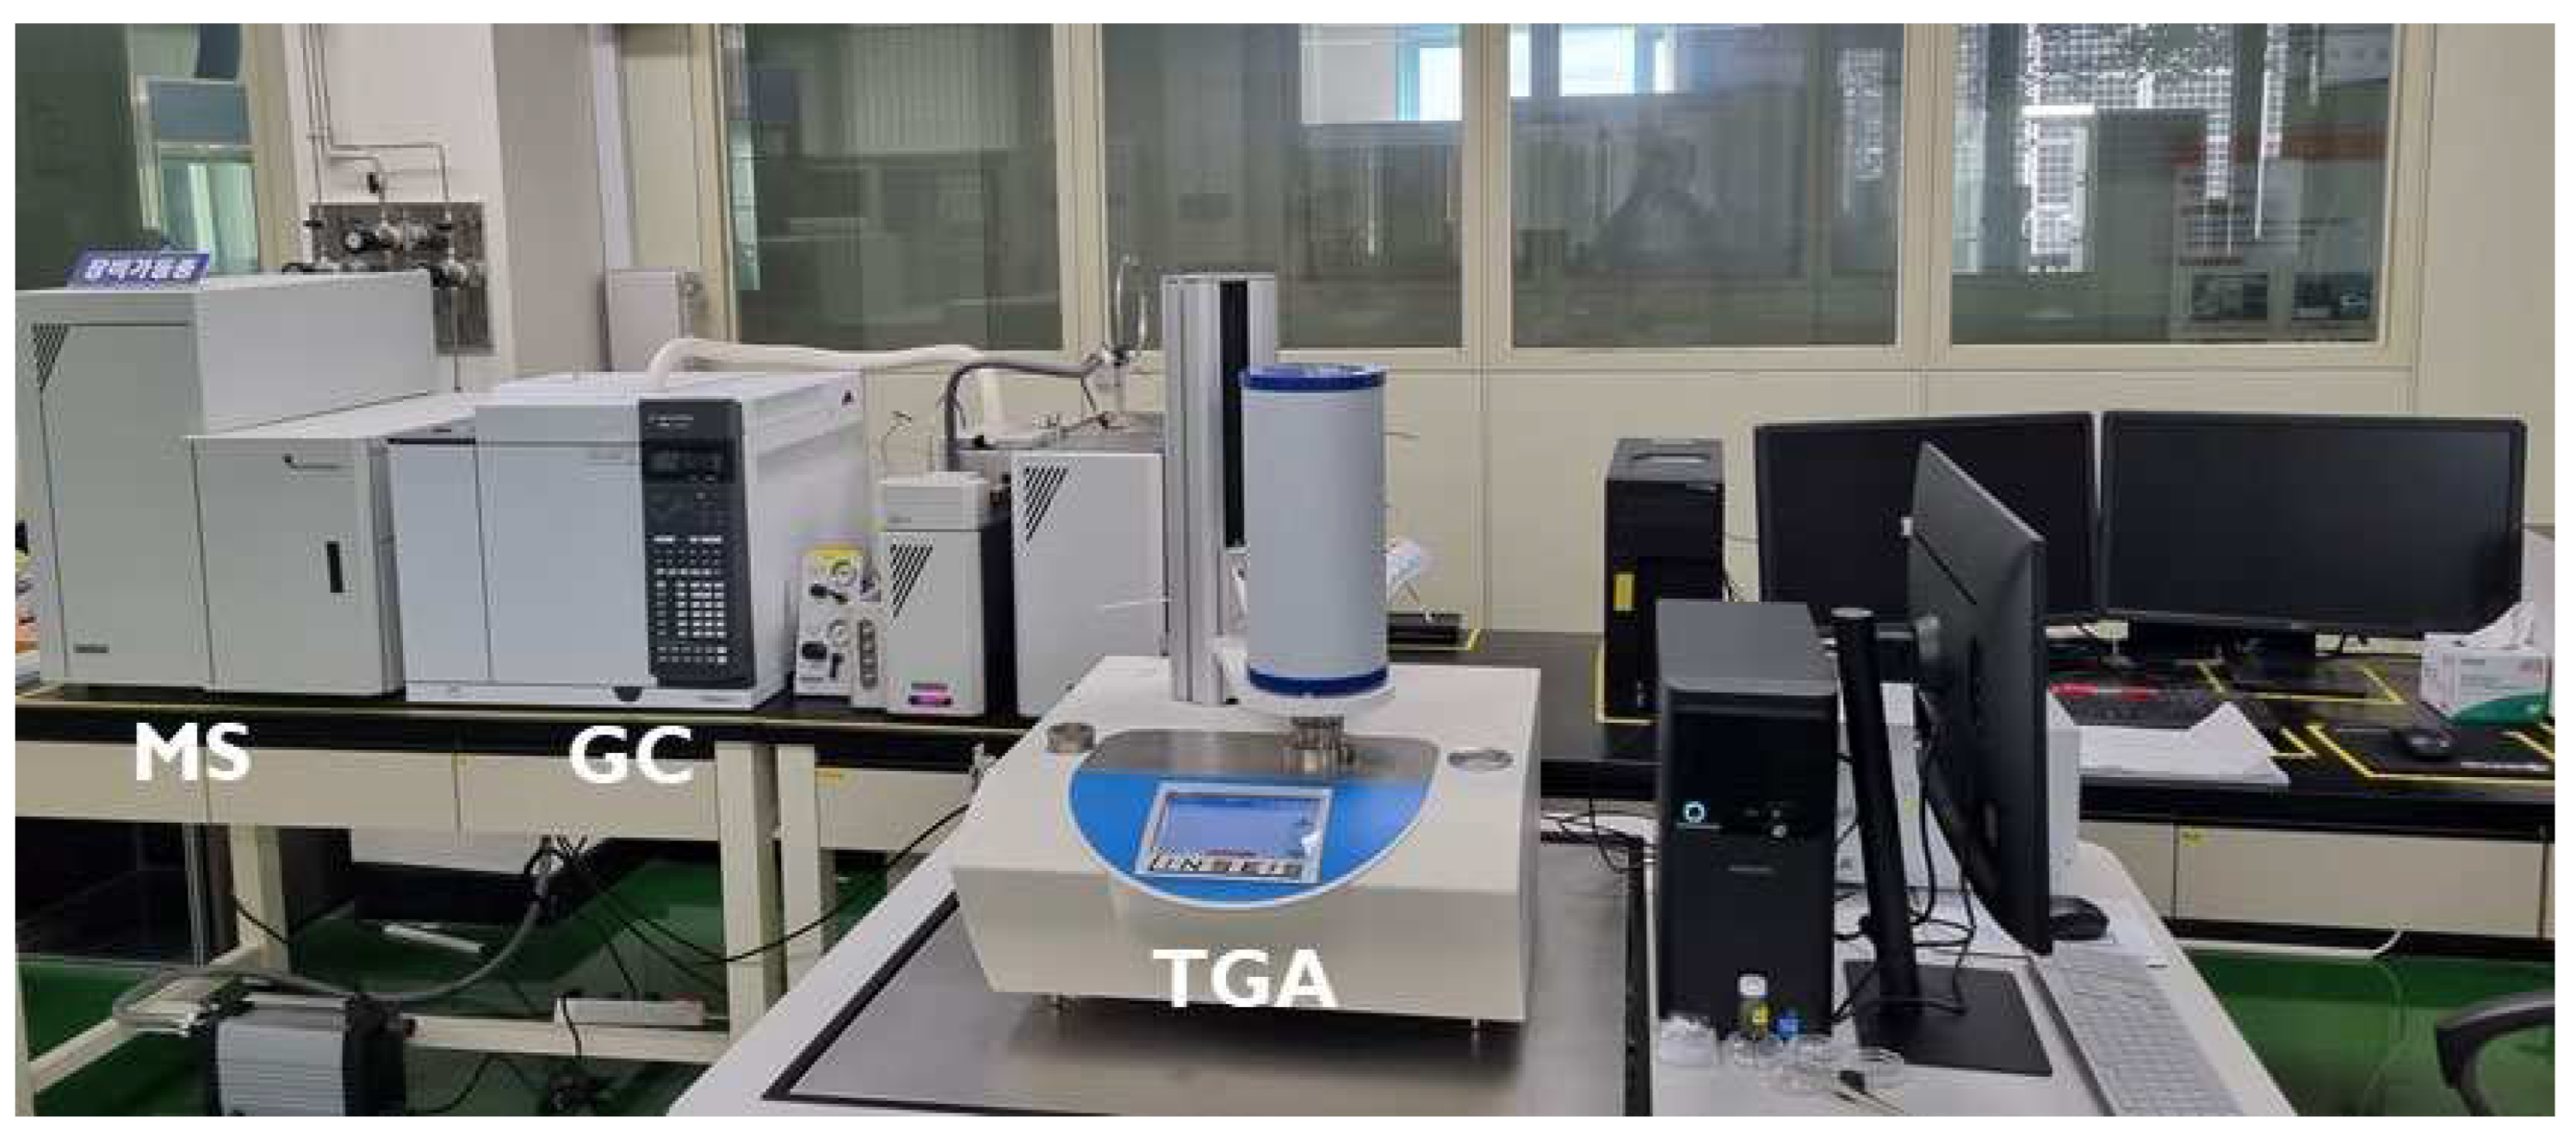
Figure 5.
The photograph of pyrolyzer-GC/MS for analyzing vinylcyclohexene and dipentene in the particle samples of tire, TRWPs and background.
Figure 5.
The photograph of pyrolyzer-GC/MS for analyzing vinylcyclohexene and dipentene in the particle samples of tire, TRWPs and background.
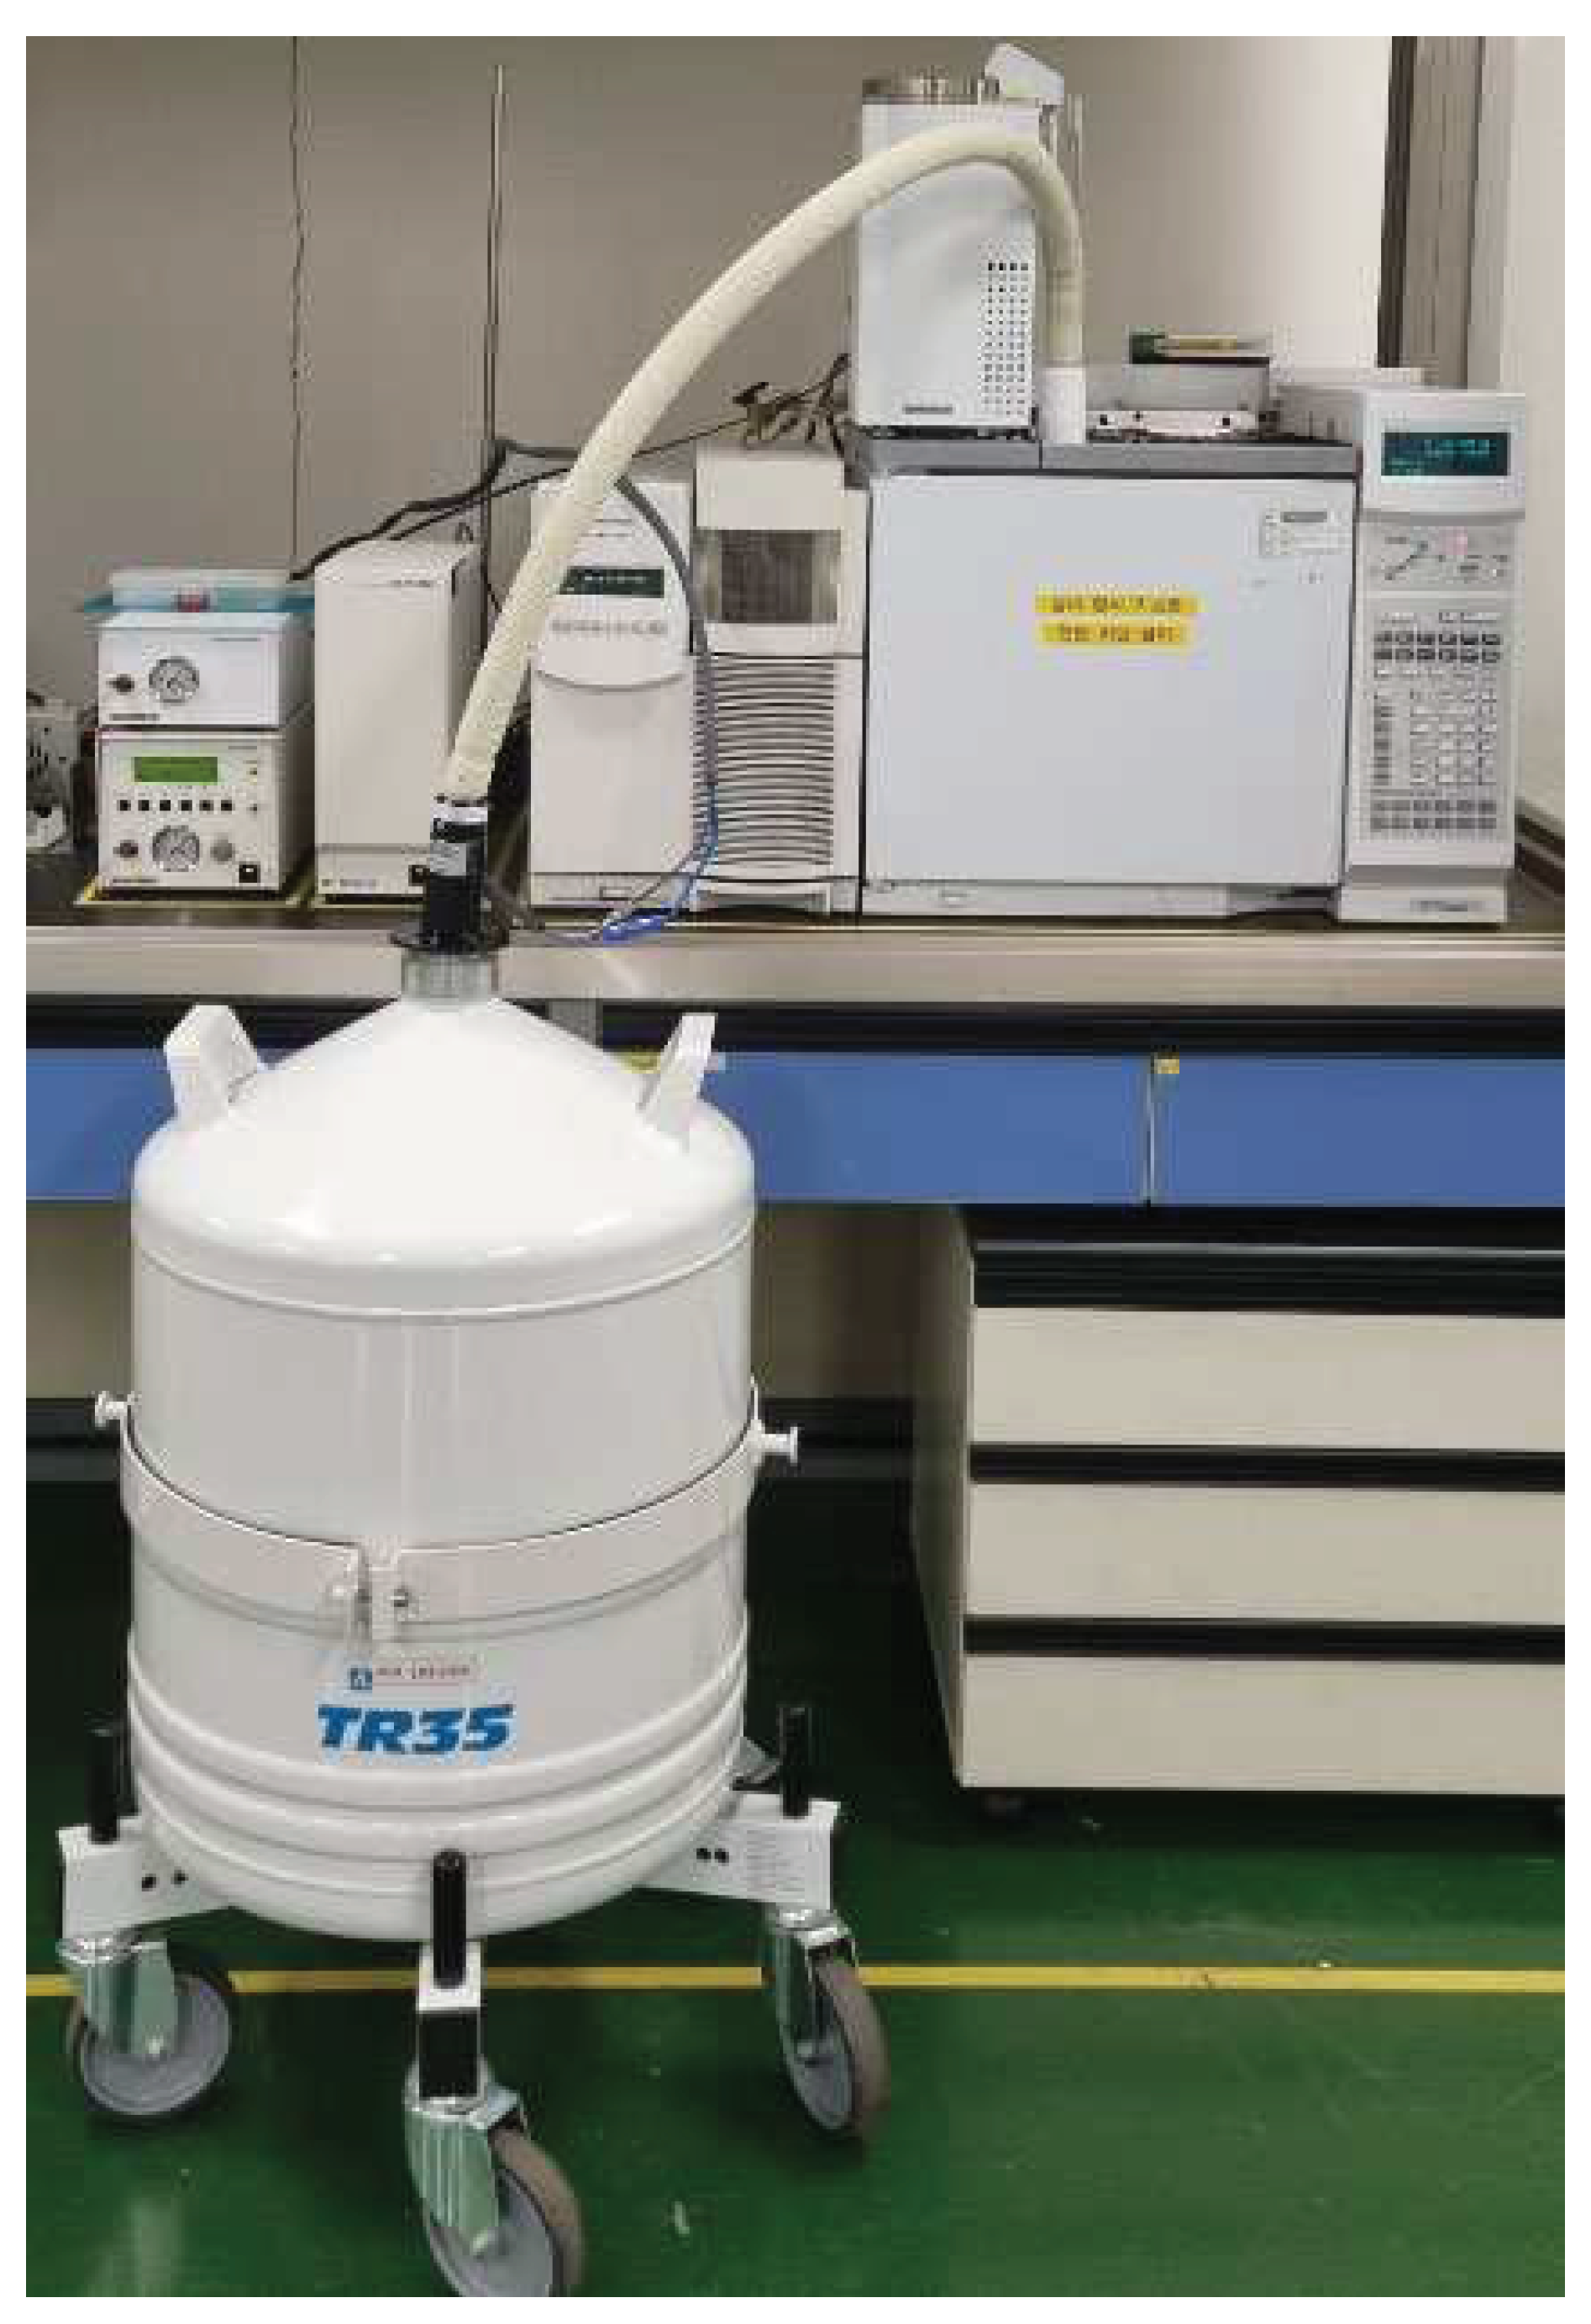

Table 1.
Vehicle specification.
| Manufacturer | Hyundai | |
| Vehicle type | Van | |
| Weight | Curb | 2,200 kg |
| Fully equip. | Total: 2,581 kg (Front: 1,346 kg, Rear: 1,235kg) | |
| Engine displacement | 3,470 cc | |
| Wheel & Tire | 17 inch - 215/65R17 Tire | |
| Max. power (kW/rpm) | 240 / 6,000 | |
| Max. Torque (kgf∙m/rpm) | 44.0 / 1,500 ~ 4,500 | |
Table 2.
52 kinds of ozone precursors with a purity of 99.999% in the gas mixture.
| Precursors | Precursors | ||||
|---|---|---|---|---|---|
| Name | Formula | Molecular Weight |
Name | Formula | Molecular Weight |
| Propylene | C3H6 | 42.08 | 2,2,4-trimethylpentane | C8H18 | 114.23 |
| Isobutane | C4H10 | 58.12 | n-Heptane | C7H16 | 100.21 |
| 1-Butene | C4H8 | 56.11 | Methylcyclohexane | C7H14 | 98.19 |
| n-Butane | C4H10 | 58.12 | 2,3,4-trimethylpentane | C8H18 | 114.23 |
| cis-2-Butene | C4H8 | 56.11 | Toluene | C7H8 | 92.14 |
| trans-2-Butene | C4H8 | 56.11 | 2-Methylheptane | C8H18 | 114.23 |
| Isopentane | C5H12 | 72.15 | 3-Methylheptane | C8H18 | 114.23 |
| 1-Pentene | C5H10 | 70.13 | n-Octane | C8H18 | 114.23 |
| n-Pentane | C5H12 | 72.15 | Ethylbenzene | C8H10 | 106.17 |
| Isoprene | C5H8 | 68.12 | m,p-Xylene | C8H10 | 106.14 |
| cis-2-Pentene | C5H10 | 70.13 | Styrene | C8H8 | 104.15 |
| trans-2-Pentene | C5H10 | 70.13 | o-Xylene | C8H10 | 106.17 |
| 2,2-Dimethylbutane | C6H14 | 86.18 | n-Nonane | C9H20 | 128.26 |
| Cyclopentane | C5H10 | 70.13 | Isopropylbenzene | C9H12 | 120.19 |
| 2,3-Dimethylbutane | C6H14 | 86.18 | n-Propylbenzene | C9H12 | 120.19 |
| 2-Methylpentane | C6H14 | 86.18 | m-Ethyltoluene | C9H12 | 120.19 |
| 3-Methylpentane | C6H14 | 86.18 | p-Ethyltoluene | C9H12 | 120.19 |
| 1-Hexene | C6H12 | 84.16 | 1,3,5-Trimethylbenzene | C9H12 | 120.19 |
| n-Hexane | C6H14 | 86.18 | o-Ethyltoluene | C9H12 | 120.19 |
| Methylcyclopentane | C6H12 | 84.16 | 1,2,4-Trimethylbenzene | C9H12 | 120.19 |
| 2,4-Dimethylpentane | C7H16 | 100.20 | n-Decane | C10H22 | 142.28 |
| Benzene | C6H6 | 78.11 | 1,2,3-Trimethylbenzene | C9H12 | 120.19 |
| Cyclohexane | C6H12 | 84.16 | m-Diethylbenzene | C10H14 | 134.22 |
| 2-Methylhexane | C7H16 | 100.20 | p-Diethylbenzene | C10H14 | 134.22 |
| 2,3-Dimethylpentane | C7H16 | 100.20 | n-Undecan | C11H24 | 156.31 |
| 3-Methylhexane | C7H16 | 100.20 | n-Dodecane | C12H26 | 170.34 |
Table 3.
The chemical species of volatile organic component dissolved from tire particle samples subjected to three different temperature conditions (unit: ppb).
Table 3.
The chemical species of volatile organic component dissolved from tire particle samples subjected to three different temperature conditions (unit: ppb).
| Species | Temperature (℃) | ||
|---|---|---|---|
| 50 | 100 | 200 | |
| Propylene | 0.75 | 0.60 | 5.10 |
| Isobutane | 0.61 | 0.62 | 1.53 |
| 1-Butene | 1.29 | 1.69 | 18.82 |
| n-Butane | 0.37 | 0.43 | 0.55 |
| cis-2-Butene | 0.93 | 0.67 | 0.47 |
| trans-2-Butene | 0.40 | 0.58 | 0.35 |
| Isopentane | 0.43 | 0.33 | - |
| 1-Pentene | 0.31 | 0.26 | - |
| n-Pentane | 0.31 | 0.30 | 0.42 |
| Isoprene | 0.07 | 0.33 | 1.95 |
| cis-2-Pentene | 0.45 | 0.35 | - |
| trans-2-Pentene | 0.26 | 0.28 | - |
| 2,2-Dimethylbutane | 0.17 | 0.17 | - |
| Cyclopentane | 0.32 | 0.17 | - |
| 3-Methylpentane | - | 0.18 | 1.26 |
| 1-Hexene | - | 0.18 | - |
| Methylcyclopentane | 0.75 | 1.76 | 0.61 |
| Benzene | 0.26 | 0.29 | - |
| 2-Methylhexane | 1.12 | 0.98 | 17.83 |
| 2,3-Dimethylpentane | 0.22 | 0.19 | 1.31 |
| 2-Methylheptane | 0.26 | 0.27 | 0.21 |
| 3-Methylheptane | 0.17 | 0.14 | - |
| Ethylbenzene | 3.44 | 2.20 | 3.54 |
| m,p-Xylene | 0.18 | 0.14 | - |
| Styrene | 0.11 | 0.16 | - |
| o-Xylene | 0.25 | 0.24 | 0.32 |
| n-Nonane | 4.49 | 2.49 | 1.31 |
| Isopropylbenzene | 3.75 | 2.59 | 17.07 |
| n-Propylbenzene | 33.91 | 9.63 | 4.69 |
| m-Ethyltoluene | 3.05 | 2.06 | 0.69 |
| p-Ethyltoluene | 0.39 | 0.33 | 0.11 |
| 1,3,5-Trimethylbenzene | 1.14 | 0.88 | 0.21 |
| o-Ethyltoluene | 4.45 | 2.28 | 0.48 |
| 1,2,4-Trimethylbenzene | 2.29 | 1.78 | 0.35 |
| n-Decane | 2.92 | 2.24 | 0.34 |
| 1,2,3-Trimethylbenzene | 1.84 | 1.67 | 0.24 |
| m-Diethylbenzene | 2.96 | 2.07 | 0.27 |
| p-Diethylbenzene | 5.61 | 4.04 | 0.72 |
| n-Undecan | 1.29 | 1.31 | 0.30 |
| n-Dodecane | 6.36 | 4.76 | 0.88 |
Table 4.
The mass of initial sample and VOCs dissolved from tire particle samples obtained from a vehicle running at 30 km/h on the proving ground, which is subjected to 200 ℃ for 1 hour in a nitrogen environment.
Table 4.
The mass of initial sample and VOCs dissolved from tire particle samples obtained from a vehicle running at 30 km/h on the proving ground, which is subjected to 200 ℃ for 1 hour in a nitrogen environment.
| Particle Type | Initial Sample Mass, mg | VOCs Mass, mg | |
|---|---|---|---|
| PM10 | Background | 19.399 | 0.314 |
| TRWP | 23.724 | 0.403 | |
| PM2.5 | Background | 21.328 | 0.338 |
| TRWP | 23.967 | 0.658 | |
Table 5.
The chemical components measured in PM10 and PM2.5 among TRWPs and background particles obtained from a vehicle running at 30 km/h on the proving ground (unit: ppb).
Table 5.
The chemical components measured in PM10 and PM2.5 among TRWPs and background particles obtained from a vehicle running at 30 km/h on the proving ground (unit: ppb).
| Species | PM10 | PM2.5 | ||
|---|---|---|---|---|
| Background Particles | TRWPs | Background Particles | TRWPs | |
| 1-Butene | 1.40 | 1.74 | 1.45 | 0.94 |
| n-Butane | 0.72 | 0.56 | 0.41 | 0.43 |
| cis-2-Butene | - | - | 0.17 | - |
| Isopentane | 0.71 | 0.52 | 0.37 | 0.50 |
| n-Pentane | 0.46 | 0.38 | - | - |
| n-Hexane | 5.78 | 4.76 | 3.36 | 7.39 |
| Benzene | 0.24 | 0.27 | 0.23 | - |
| n-Heptane | 0.47 | 0.33 | 0.30 | 0.51 |
| Toluene | 0.96 | 0.85 | 0.78 | 0.89 |
| Ethylbenzene | 0.48 | 0.43 | 0.39 | - |
| m,p-Xylene | 1.02 | 0.97 | 0.80 | 0.66 |
| o-Xylene | 0.41 | 0.37 | 0.39 | - |
| m-Ethyltoluene | 0.50 | - | 0.41 | - |
| 1,3,5-Trimethylbenzene | 0.50 | - | - | - |
| 1,2,4-Trimethylbenzene | 1.00 | 0.78 | 0.74 | 0.64 |
| n-Decane | - | 0.48 | 0.49 | 0.57 |
| 1,2,3-Trimethylbenzene | 0.62 | 0.51 | 0.44 | 0.38 |
| n-Dodecane | 3.12 | 3.36 | 3.45 | 2.84 |
Table 6.
The mass for two different tire markers (vinylcyclohexene, dipentene) for PM10 and PM2.5 among TRWPs and background particles obtained from a vehicle driving at 30 km/h on the proving ground (unit: ㎍).
Table 6.
The mass for two different tire markers (vinylcyclohexene, dipentene) for PM10 and PM2.5 among TRWPs and background particles obtained from a vehicle driving at 30 km/h on the proving ground (unit: ㎍).
| Particle Type | Vinylcyclohexene | Dipentene | Sum | |
|---|---|---|---|---|
| PM10 | Background | 0 | 0 | 0 |
| TRWP | 4.56 | 0.33 | 4.89 | |
| PM2.5 | Background | 0 | 0 | 0 |
| TRWP | 0.44 | 0 | 0.44 | |
Table 7.
The mass of initial sample and VOCs dissolved from tire particle samples obtained from a vehicle running at 40 km/h, 50 km/h and 60 km/h on the proving ground, which is subjected to 200 ℃ for 1 hour in a nitrogen environment.
Table 7.
The mass of initial sample and VOCs dissolved from tire particle samples obtained from a vehicle running at 40 km/h, 50 km/h and 60 km/h on the proving ground, which is subjected to 200 ℃ for 1 hour in a nitrogen environment.
| Velocity, km/h | Particle Type | Initial Sample Mass, mg | VOCs Mass, mg | |
|---|---|---|---|---|
| 40 | PM10 | Background | 19.204 | 0.228 |
| TRWP | 17.193 | 0.263 | ||
| PM2.5 | Background | 17.907 | 0.223 | |
| TRWP | 18.673 | 0.239 | ||
| 50 | PM10 | Background | 17.999 | 0.229 |
| TRWP | 18.352 | 0.246 | ||
| PM2.5 | Background | 21.995 | 0.282 | |
| TRWP | 21.342 | 0.319 | ||
| 60 | PM10 | Background | 22.453 | 0.265 |
| TRWP | 19.912 | 0.304 | ||
| PM2.5 | Background | 22.414 | 0.327 | |
| TRWP | 25.338 | 0.315 | ||
Table 8.
The chemical components measured in PM10 and PM2.5 among TRWPs and background particles obtained from a vehicle running at 40 km/h on the proving ground (unit: ppb).
Table 8.
The chemical components measured in PM10 and PM2.5 among TRWPs and background particles obtained from a vehicle running at 40 km/h on the proving ground (unit: ppb).
| Species | PM10 | PM2.5 | ||
|---|---|---|---|---|
| Background Particle | TRWP | Background Particle | TRWP | |
| Propylene | 0.65 | - | - | - |
| Isobutane | 1.35 | - | - | - |
| 1-Butene | 13.08 | 2.13 | 1.78 | 1.62 |
| n-Butane | 1.59 | 0.47 | - | 0.46 |
| cis-2-Butene | 0.36 | - | - | - |
| Isopentane | 1.60 | 0.48 | - | 0.49 |
| n-Pentane | 0.86 | - | - | - |
| cis-2-Pentene | 0.21 | - | - | - |
| 2-Methylpentane | 0.39 | - | - | - |
| 3-Methylpentane | 0.36 | - | - | - |
| n-Hexane | 28.70 | 6.29 | 4.25 | 4.63 |
| Methylcyclopentane | 0.44 | - | - | - |
| Benzene | 1.02 | 0.32 | - | - |
| n-Heptane | 1.51 | 0.45 | 0.29 | 0.32 |
| Toluene | 3.13 | 0.80 | 0.49 | 0.53 |
| Ethylbenzene | 3.08 | 0.75 | 0.48 | 0.44 |
| m,p-Xylene | 7.11 | 1.52 | 0.95 | 0.76 |
| Styrene | 0.68 | - | - | - |
| o-Xylene | 2.14 | 0.66 | 0.39 | 0.35 |
| n-Nonane | 0.50 | - | - | - |
| m-Ethyltoluene | 0.58 | 0.49 | - | - |
| p-Ethyltoluene | 0.43 | - | - | - |
| 1,3,5-Trimethylbenzene | 0.55 | 0.39 | - | - |
| 1,2,4-Trimethylbenzene | 1.29 | 1.02 | 0.92 | 0.61 |
| n-Decane | 1.13 | 0.74 | 0.59 | 0.44 |
| 1,2,3-Trimethylbenzene | 0.67 | 0.60 | 0.44 | 0.38 |
| m-Diethylbenzene | 0.32 | 0.37 | - | - |
| p-Diethylbenzene | 0.52 | 0.47 | - | - |
| n-Undecan | 0.80 | 0.95 | - | - |
| n-Dodecane | 2.60 | 2.73 | 3.20 | 2.51 |
Table 9.
The chemical components measured in PM10 and PM2.5 among TRWPs and background particles obtained from a vehicle running at 50 km/h on the proving ground (unit: ppb).
Table 9.
The chemical components measured in PM10 and PM2.5 among TRWPs and background particles obtained from a vehicle running at 50 km/h on the proving ground (unit: ppb).
| Species | PM10 | PM2.5 | ||
|---|---|---|---|---|
| Background Particle | TRWP | Background Particle | TRWP | |
| 1-Butene | 1.43 | 1.63 | 1.39 | 1.41 |
| n-Butane | - | 0.64 | 0.53 | 0.48 |
| Isopentane | - | 0.62 | 0.55 | 0.52 |
| n-Pentane | - | 0.35 | - | - |
| n-Hexane | 4.33 | 3.62 | 4.31 | 5.38 |
| Benzene | 0.24 | 0.30 | 0.23 | 0.23 |
| n-Heptane | 0.29 | 0.36 | 0.32 | 0.39 |
| Toluene | 0.51 | 0.61 | 0.55 | 0.69 |
| Ethylbenzene | 0.40 | 0.60 | 0.43 | 0.37 |
| m,p-Xylene | 0.75 | 1.05 | 0.92 | 0.81 |
| o-Xylene | 0.32 | 0.47 | 0.44 | 0.32 |
| m-Ethyltoluene | - | 0.42 | - | - |
| 1,3,5-Trimethylbenzene | - | 0.52 | 0.53 | - |
| 1,2,4-Trimethylbenzene | 0.54 | 0.77 | 0.65 | 0.57 |
| n-Decane | 0.44 | 0.64 | 0.63 | 0.60 |
| 1,2,3-Trimethylbenzene | - | 0.50 | 0.39 | 0.38 |
| n-Dodecane | 2.17 | 3.71 | 2.30 | 2.76 |
Table 10.
The chemical components measured in PM10 and PM2.5 among TRWPs and background particles obtained from a vehicle running at 60 km/h on the proving ground (unit: ppb).
Table 10.
The chemical components measured in PM10 and PM2.5 among TRWPs and background particles obtained from a vehicle running at 60 km/h on the proving ground (unit: ppb).
| Species | PM10 | PM2.5 | ||
|---|---|---|---|---|
| Background Particle | TRWP | Background Particle | TRWP | |
| 1-Butene | 1.24 | 1.55 | 11.83 | 2.04 |
| n-Butane | - | 0.50 | - | - |
| Isopentane | - | 0.49 | 0.69 | - |
| n-Pentane | - | 0.40 | 0.41 | - |
| n-Hexane | 2.00 | 4.09 | 4.87 | 2.20 |
| Benzene | - | 0.28 | 0.24 | 0.23 |
| n-Heptane | - | 0.26 | 0.29 | - |
| Toluene | 0.52 | 0.67 | 0.67 | 0.55 |
| Ethylbenzene | 0.33 | 0.37 | 0.38 | 0.33 |
| m,p-Xylene | 0.65 | 0.75 | 0.79 | 0.67 |
| o-Xylene | - | 0.33 | 0.33 | - |
| 1,2,4-Trimethylbenzene | 0.46 | 0.50 | 0.60 | 0.39 |
| n-Decane | - | - | 0.43 | - |
| 1,2,3-Trimethylbenzene | - | - | 0.38 | - |
| n-Dodecane | 2.54 | 2.17 | 2.32 | 2.27 |
Table 11.
The mass for two different tire markers (vinylcyclohexene, dipentene) for PM10 and PM2.5 among TRWPs and background particles obtained from a vehicle driving at running at 40 km/h, 50 km/h and 60 km/h on the proving ground on the proving ground (unit: ㎍).
Table 11.
The mass for two different tire markers (vinylcyclohexene, dipentene) for PM10 and PM2.5 among TRWPs and background particles obtained from a vehicle driving at running at 40 km/h, 50 km/h and 60 km/h on the proving ground on the proving ground (unit: ㎍).
| Velocity, Km/h |
Particle Type | Vinylcyclohexene | Dipentene | Sum | |
|---|---|---|---|---|---|
| 40 | PM10 | Background | 0 | 0 | 0 |
| TRWP | 6.5 | 0.2 | 6.7 | ||
| PM2.5 | Background | 0 | 0 | 0 | |
| TRWP | 0.6 | 0 | 0.6 | ||
| 50 | PM10 | Background | 0 | 0 | 0 |
| TRWP | 6.1 | 0.12 | 6.3 | ||
| PM2.5 | Background | 0 | 0 | 0 | |
| TRWP | 0.3 | 0 | 0.3 | ||
| 60 | PM10 | Background | 0 | 0 | 0 |
| TRWP | 13.0 | 0.4 | 13.4 | ||
| PM2.5 | Background | 0 | 0 | 0 | |
| TRWP | 0.6 | 0 | 0.6 | ||
Table 12.
The mass of initial sample and VOCs dissolved from tire particle samples obtained from a vehicle running on the real road, which is subjected to 200 ℃ for 1 hour in a nitrogen environment.
Table 12.
The mass of initial sample and VOCs dissolved from tire particle samples obtained from a vehicle running on the real road, which is subjected to 200 ℃ for 1 hour in a nitrogen environment.
| Particle Type | Initial Sample Mass, mg | VOCs Mass, mg | |
|---|---|---|---|
| PM10 | Background | 16.72 | 0.06 |
| TRWP | 17.06 | 0.06 | |
| PM2.5 | Background | 20.87 | 0.09 |
| TRWP | 19.56 | 0.08 | |
Table 13.
The chemical components measured in PM10 and PM2.5 among TRWPs and background particles obtained from a vehicle running on the real road (unit: ppb).
Table 13.
The chemical components measured in PM10 and PM2.5 among TRWPs and background particles obtained from a vehicle running on the real road (unit: ppb).
| Species | PM10 | PM2.5 | ||
|---|---|---|---|---|
| Background Particle | TRWP | Background Particle | TRWP | |
| Propylene | - | - | - | 0.32 |
| Isobutane | - | - | - | 0.33 |
| 1-Butene | 1.36 | 1.62 | 1.29 | 1.51 |
| n-Butane | 0.86 | 1.16 | 0.67 | 0.79 |
| cis-2-Butene | - | 0.38 | - | 0.28 |
| trans-2-Butene | - | - | 0.20 | - |
| Isopentane | 1.34 | 1.88 | 1.13 | 1.35 |
| n-Pentane | 0.90 | 1.21 | 0.73 | 0.89 |
| cis-2-Pentene | 0.38 | 0.43 | 0.29 | 0.33 |
| 2-Methylpentane | 0.73 | 0.74 | 0.45 | 0.53 |
| 3-Methylpentane | - | 0.55 | 0.33 | 0.37 |
| n-Hexane | 14.68 | 13.40 | 8.34 | 8.83 |
| Methylcyclopentane | 0.51 | 0.47 | 0.30 | 0.40 |
| Benzene | 0.65 | 0.47 | 0.33 | 0.35 |
| 2-Methylhexane | - | - | - | 0.15 |
| 3-Methylhexane | - | - | - | 0.17 |
| n-Heptane | 1.21 | 1.22 | 0.95 | 0.99 |
| Toluene | 2.77 | 2.04 | 1.63 | 1.72 |
| Ethylbenzene | 0.65 | 0.59 | 0.43 | 0.51 |
| m,p-Xylene | 1.59 | 1.41 | 1.03 | 1.23 |
| Styrene | - | - | - | 0.15 |
| o-Xylene | 0.50 | 0.55 | 0.33 | 0.43 |
| n-Nonane | 0.32 | 0.38 | - | 0.37 |
| Isopropylbenzene | - | - | - | 0.21 |
| m-Ethyltoluene | 0.82 | 0.89 | 0.57 | 0.77 |
| p-Ethyltoluene | 0.53 | 0.65 | - | 0.54 |
| 1,3,5-Trimethylbenzene | 0.45 | 0.57 | - | 0.43 |
| o-Ethyltoluene | - | 0.44 | - | 0.36 |
| 1,2,4-Trimethylbenzene | 1.50 | 1.58 | 1.04 | 1.35 |
| n-Decane | 0.87 | 0.87 | 0.56 | 0.78 |
| 1,2,3-Trimethylbenzene | 0.44 | 0.70 | 0.44 | 0.62 |
| m-Diethylbenzene | - | 0.43 | - | 0.34 |
| p-Diethylbenzene | 0.24 | 0.61 | 0.30 | 0.52 |
| n-Undecan | 0.63 | 1.29 | 0.70 | 1.19 |
| n-Dodecane | 0.66 | 5.50 | 2.06 | 5.30 |
Table 14.
The mass for two different tire markers (vinylcyclohexene, dipentene) for PM10 and PM2.5 among TRWPs and background particles obtained from a vehicle driving on the real road (unit: ㎍).
Table 14.
The mass for two different tire markers (vinylcyclohexene, dipentene) for PM10 and PM2.5 among TRWPs and background particles obtained from a vehicle driving on the real road (unit: ㎍).
| Particle Type | Vinylcyclohexene | Dipentene | Sum | |
|---|---|---|---|---|
| PM10 | Background | 0 | 0 | 0 |
| TRWP | 10.5 | 0 | 10.5 | |
| PM2.5 | Background | 0 | 0 | 0 |
| TRWP | 0 | 0 | 0 | |
Disclaimer/Publisher’s Note: The statements, opinions and data contained in all publications are solely those of the individual author(s) and contributor(s) and not of MDPI and/or the editor(s). MDPI and/or the editor(s) disclaim responsibility for any injury to people or property resulting from any ideas, methods, instructions or products referred to in the content. |
© 2023 by the authors. Licensee MDPI, Basel, Switzerland. This article is an open access article distributed under the terms and conditions of the Creative Commons Attribution (CC BY) license (http://creativecommons.org/licenses/by/4.0/).
Copyright: This open access article is published under a Creative Commons CC BY 4.0 license, which permit the free download, distribution, and reuse, provided that the author and preprint are cited in any reuse.


