Preprint
Article

Optimization of a tree pit as a Blue-Green Infrastructure object

Altmetrics

Downloads

85

Views

22

Comments

0

A peer-reviewed article of this preprint also exists.

Submitted:

04 October 2023

Posted:

05 October 2023

You are already at the latest version

Alerts
Abstract
Key elements of Blue-Green Infrastructure are vegetation and stormwater storage. A combination of a bioretention cell with an underlying trench (BC-T) serving as a tree pit is often used in dense urban environments. An adequate ratio of drained area to bioretention cell area is a crucial design parameter. The ratio is derived from the hydrological balance; however, input data are often difficult to obtain or uncertain. The goal is to study the sensitivity of such data (tree water uptake and water holding capacities of soil filter and trench substrate) in the BC-T design. Sensitivity analysis is performed for the setup of a BC-T used in Prague, Czech Republic. A 10-year rainfall series (1 hour resolution) is used as an input. Data that are subject to the sensitivity analysis are changed for different trench exfiltration rates, and the effect on the size of the drained area is studied. At low trench exfiltration rates (1.8 mm.h-1), both the water holding capacity of the trench substrate and potential tree water uptake have a significant influence (more than a 20% change in the size of the drained area) and cannot be neglected. At good exfiltration rates (more than 18 mm.h-1) or when the trench is equipped with an underdrain, all studied parameters can be neglected. However, it is recommended to reduce the size of the drained area by 10-20%.
Keywords: 
Subject: Engineering  -   Civil Engineering

1. Introduction

A paradigm shift in urban stormwater management started in the 1960s to mitigate the impacts of draining stormwater out of cities as fast as possible [1]. The Sustainable Drainage Systems (SuDS) concept evolved over decades; however, it was connected mainly with water-related problems in cities such as flood protection, surface water quality and ecology protection, restoration of natural local water balance, and stormwater harvesting [2]. Microclimate improvement as a reaction to climate change impacts was later incorporated as an additional goal of SuDS. The concept of blue-green infrastructure emerged [3].
Blue-Green Infrastructure (BGI) can be defined as a package of measures supporting ecosystem functions to deliver multiple benefits connected not only with water but also with urban microclimate, biodiversity, urban aesthetics, and social well-being. Its primary goal is to adapt urban areas to climate change [4]. Key elements of BGI are trees and other vegetation (providing the climate function [5]) as well as water retention spaces (providing water flow control). To provide the above-mentioned ecosystem functions, the elements are often combined in one BGI structure: an open terrain vegetated depression (bioretention cell) with an underlying trench (referred to as BC-T). Stormwater runoff from the surrounding paved area is conveyed to the terrain depression and infiltrates through a soil filter to the underground trench which also serves as a tree pit. The soil filter serves as the stormwater treatment [6] to prevent clogging of the underground trench [7] and protect the quality of underground and/or surface waters [8].
BC-T has to be optimized for both tree habitat criteria and water management criteria. The tree habitat criteria consist mainly of the sufficient volume of root space provided by the tree pit [9], type of substrate [10], and prevention of root system waterlogging [11]. The stormwater management criteria aim mainly at discharge regulation, stormwater pretreatment [12], and the duration of the retention space emptying [13].
To reach an optimal BC-T setup, the above-mentioned criteria must be related to performance criteria and site-specific conditions. Performance criteria consist of:
  • contributing to the restoration of the natural water regime, i.e., a portion of stormwater runoff retained by BC-T; this portion should be between 77 and 93% of the total stormwater runoff [14];
  • providing enough water for trees; computing a tree water balance is a complicated task with many uncertainties, depending on many factors including tree species and its climatic region [15];
  • sufficient pretreatment of stormwater; at least 80% of stormwater runoff is recommended to be pretreated through the soil filter in the bioretention cell [16];
  • prevention of waterlogging tree roots; various authors [16, 17] recommended between 24 and 48 hours as the trench emptying duration.
Site-specific conditions consist mainly of:
  • groundwater level;
  • exfiltration rate from the underground trench (i.e., permeability of the native soil);
  • space availability for BC-T.
The urban environment is specific, especially regarding the available space for BGI both on the surface and underground [18]. Conflicts of interests with transport, buried infrastructure, and historic preservation are common and lead to constrictions of the BGI design [19]. Thus, the use of the bioretention cell with the open retention space in close proximity to the tree trunk is often the only possible solution in dense urban environments and/or historical parts of cities. The area of the bioretention cell might be limited to 3-6 m2 per tree. This means that the open storage area is limited and the retained stormwater volume is reduced. The excess stormwater can be drained directly into the underground trench by a rainfall gully; however, this means that the stormwater is not pretreated by the soil filter in the bioretention cell. The lack of pretreatment increases the risk of groundwater pollution and underground trench clogging [20]. Therefore, an adequate ratio of drained area (reduced by the runoff coefficient) Ared to bioretention cell area ABC is a crucial parameter for BC-T performance [21].
Various authors studied a suitable Ared/ABC ratio, usually for specific conditions, in selected case studies. The bioretention cell area is considered 2.5% of the impervious drained area when the exfiltration rate from a trench is 34 mm per hour and 8.4% when the exfiltration is limited to 1 mm per hour [11]. A 100 mm ponding depth in the bioretention cell was considered. It equals the Ared/ABC ratio between 11 and 36, considering the runoff coefficient of paved surfaces at 0.90. Biofilter performance in Melbourne, Australia was studied in [22]. The authors considered a ponding depth in the bioretention cell of 200 mm and recommended its area to be at least 2% of the drained area (Ared/ABC ratio 45 considering the value of the runoff coefficient of paved surfaces of 0.90) to ensure treatment of 90% of the mean annual runoff. Christchurch City, New Zealand [16] analyzed several scenarios with a goal to capture 80% of stormwater runoff. They found that 350 m2 of drained area can be connected to a bioretention cell with a ponding area of 8.05 m2 and a depth of 150 mm (i.e., an Ared/ABC ratio of 39 considering the runoff coefficient of paved surfaces to be 0.90). Hamburg City, Germany recommends connecting 15-21 m2 of the drained area to 1 m2 of bioretention cell area [23] (i.e., Ared/ABC ratio 13.5-19 considering the runoff coefficient of paved surfaces of 0.90). The bioretention cell area equaling 2-10% of the drainage area is sufficient for stormwater purification. In cases where it is supplemented by an underlying trench (as in the case of BC–T), a sufficient area is 2-5% according to [24], resulting in an Ared/ABC ratio of 18-45 (considering the runoff coefficient of paved surfaces of 0.90). The authors of [21] declared that the Ared/ABC ratio for bioretention cells should be between 5 and 15, as a higher value may lead to faster clogging of the soil filter.
Based on the cited studies, it can be concluded that the recommended Ared/ABC ratio varies substantially from 5 to 45. The reason for this may be different locations of the studies, climatic data, different setups of bioretention cells, ambient soil characteristics, and performance criteria used for analysis. The methods used (where declared) are based on experimental studies and do not provide general methodical guidance that can be used in engineering and landscaping practice.
Generally, the quantification of an adequate Ared/ABC ratio is based on the calculation of the hydrological balance. A common practice is to calculate the hydrological balance using IDF (Intensity-Duration-Frequency) rainfall curves (i.e., uniform rainfalls) [25]. However, it is suitable for stand-alone BGI structures only [21]. For BGI structures connected in series (as in the case of BC-T, where the bioretention cell is connected in series with an underground trench), a more detailed description of the performance dynamics is necessary.
Data needed for the calculation of the hydrological balance of a BC-T consist of BC-T structural data (e.g., dimensions, used materials, and their characteristics), drainage area data (e.g., initial losses, runoff coefficient), geological data (e.g., exfiltration rate from underground trench), rainfall data (historical rainfall series), and tree water uptake data. Some of these data are easy to obtain (e.g., rainfall data is provided by national hydrometeorological institutes, or the exfiltration rate can be measured on-site before the BC-T construction) or are subject to the design process (e.g., dimensions of the B-CT or the drainage area size). However, there are data that are not readily available for an arbitrary location and/or are the subject of scientific research. Examples of these data are the tree water uptake (consisting of transpiration and tree water storage; [26]) and the available water holding capacity of the soil filter and structural substrates (stone-soil media used for the growth of tree roots) used in the underground trench [27].
The tree water uptake data are site-specific (e.g., climatic conditions, site conditions, degree of shading by adjacent buildings) and differ by tree species; the size of the tree must also be considered. The tree water uptake can be calculated theoretically, but the calculation is based on many data and parameters (such as radiation, air temperature, air humidity, wind, soil water content and the ability of the soil to conduct water to the roots, waterlogging, soil water salinity, water stress, growing season length, tree characteristics – type of tree, size of tree, diameter of crown, canopy structure, internal water storage, etc. [28-30]) that are difficult to obtain and quantify. This leads to a high level of uncertainty in the quantification of tree water uptake.
Water holding capacity in structural substrates was analyzed in several studies, both in the laboratory and in situ. The available water holding capacity in compacted stone-soil media was estimated by [31] as 7-11% by volume, which is comparable to loamy sand.
Adding biochar to structural substrates can increase the available water holding capacity by 25% in coarse-textured soils [32], by 50% (2-5% of biochar added to soil, [33]), or even by 100% (9% of biochar added to soil, [34]). However, the mentioned studies were not carried out with structural substrates and therefore the increase in the available water holding capacity by adding biochar under such conditions remains rather uncertain.
The effect of using or neglecting tree water uptake and available water holding capacity data in the calculation of the hydrological balance is unknown.
The goal of this presented paper is (i) to study the sensitivity of the tree water uptake rate and water holding capacity in the hydrological balance calculation used for the BC-T design (permissible Ared/ABC ratio) and (ii) to recommend a possible simplification of the hydrological balance used for the BC-T design in engineering and landscaping practice.

2. Materials and Methods

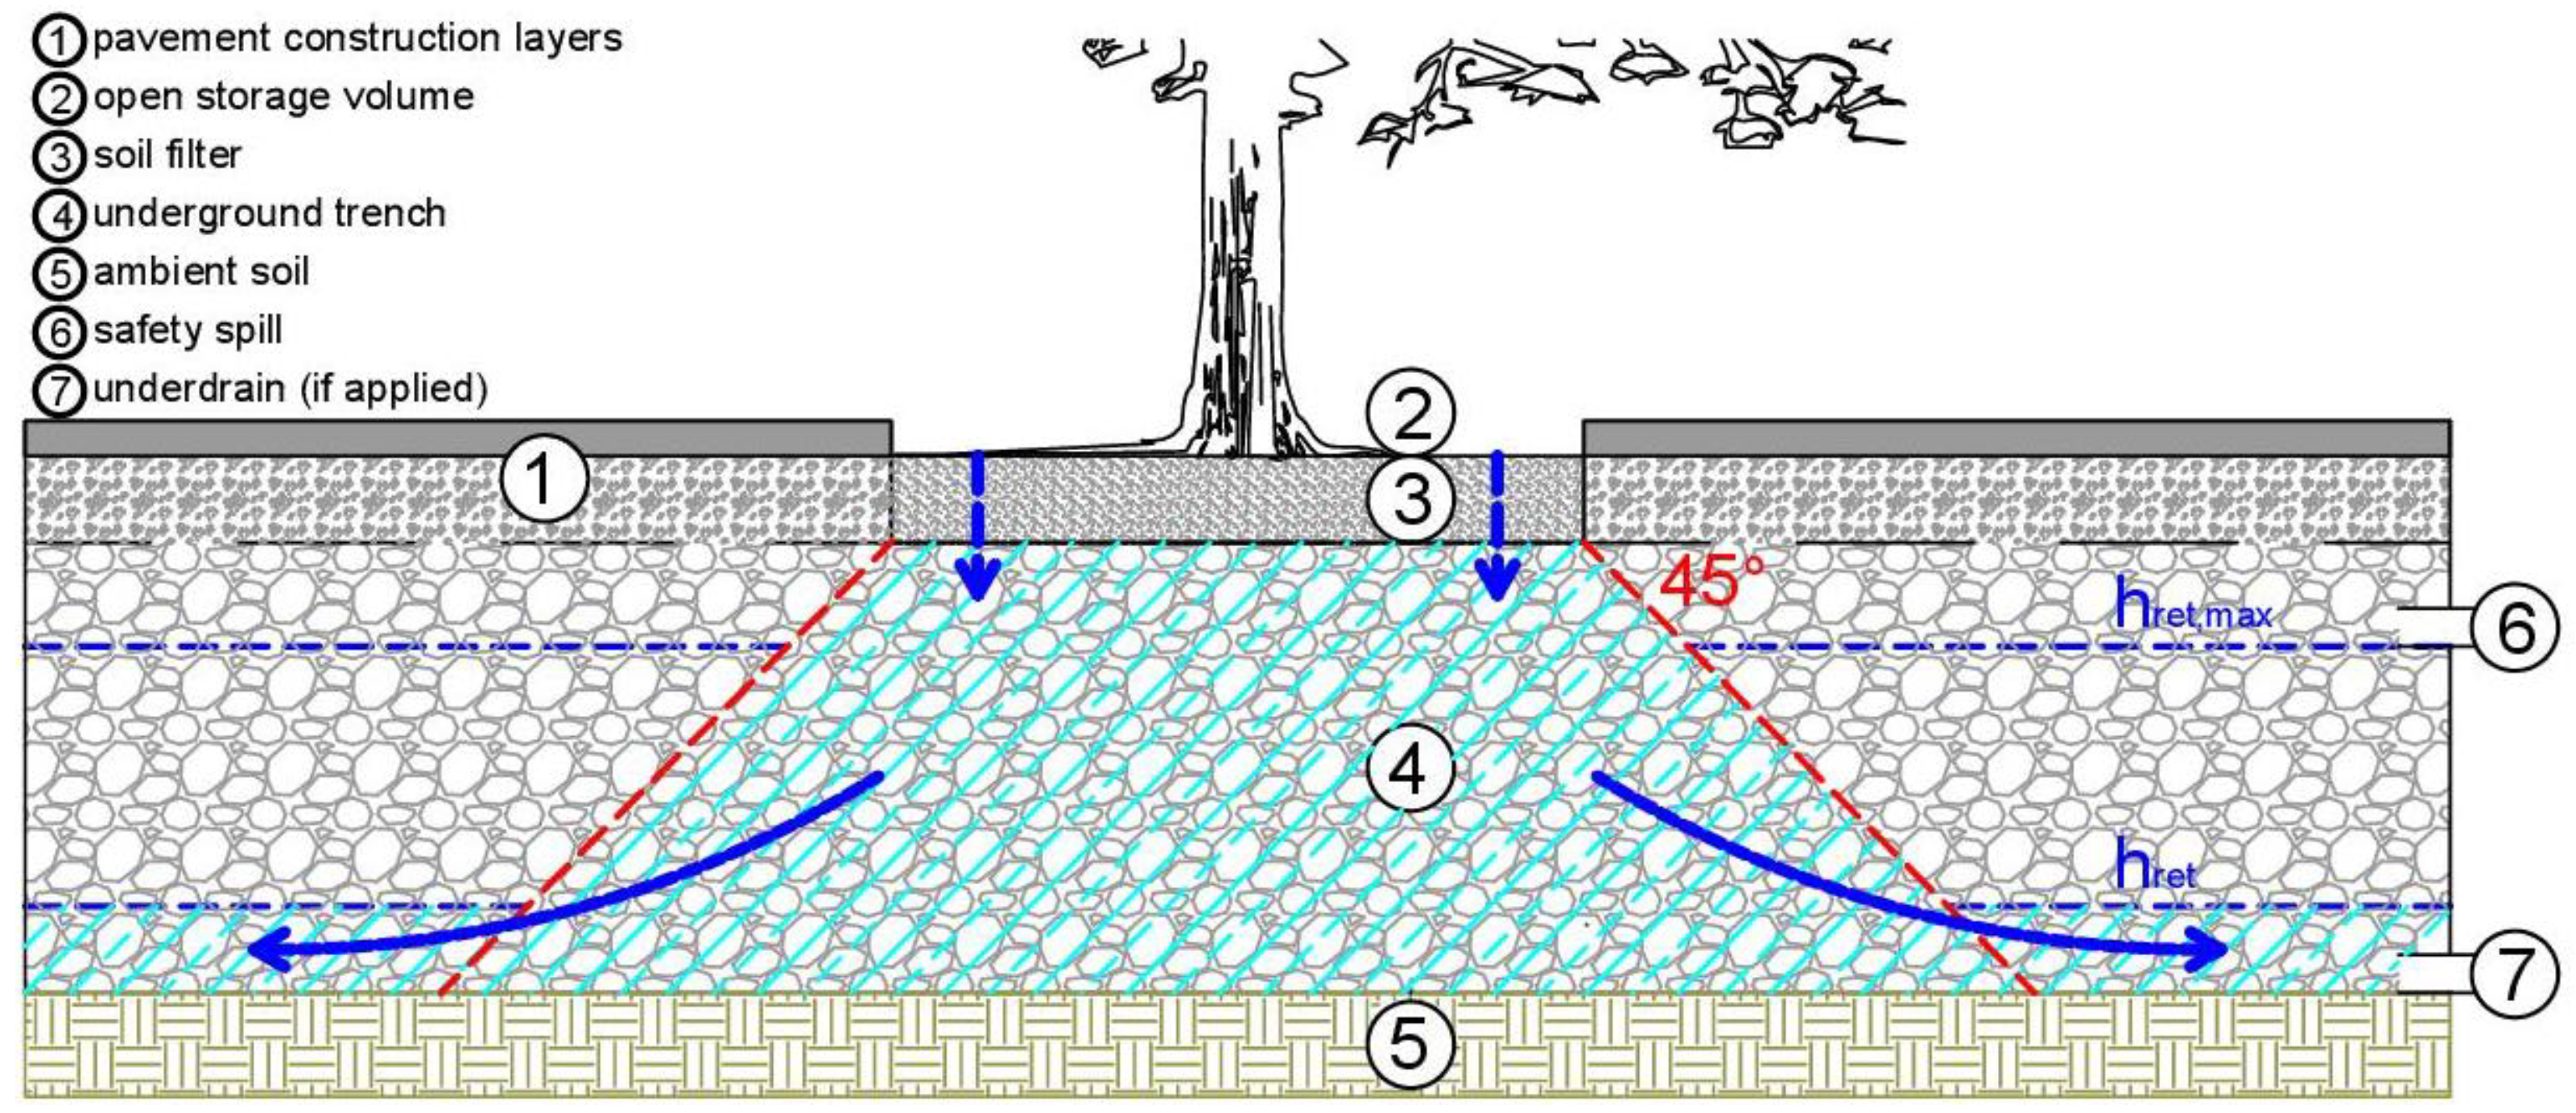
A BC-T consists of three separate elements (Figure 1): (i) an open storage volume, (ii) a soil filter, and (iii) an underground trench.

2.1. Subsection

The hydrological balance for each element can be written as follows.

2.1.1. Open storage volume

Vrunoff = Vopen_storage + Eopen_storage + INFsoil_filter + Vopen_storage_OF,
where
Vrunoff  is volume of inflow to open storage from drained area in m3 calculated as:
Vrunoff = (hrainfall – IL – IC) × Adrained × RF,
where
hrainfall      is rainfall depth in m;
IL            is initial loss depth on paved surfaces in m;
IC         is initial loss depth by interception in tree canopy in m;
Adrained       is area of drained catchment in m2;
RF        is dimensionless runoff coefficient;
Vopen_storage  is volume of open storage used for retention of inflow in m3;
Eopen_storage  is volume of water evaporated from ponded water in soil filter area in m3;
INFsoil_filter   is volume of water that infiltrates to soil filter in m3 and is calculated as:
INFsoil_filter = Asoil_filter × INFrate,
where
Asoil_filter    is area of soil filter in m2;
INFrate      is median infiltration rate in m.s-1;
Vopen_storage_OF  is volume of water that overflows from the open storage when it is full in m3.

2.1.2. Soil filter

INFsoil_filter = PERtrench + ETsoil_filter + WHCsoil_filter,
where
PERtrench     is volume of water that percolates to underground trench in m3;
ETsoil_filter      is volume of evapotranspiration from soil filter and vegetation planted in soil filter in m3;
WHCsoil_filter  is volume of water held by soil filter in m3.

2.1.3. Underground trench

PERtrench + Vopen_storage_OF = EXFtrench + Voutflow + WHCtrench + TWU + Vtrench_OF,
where
EXFtrench  is the volume of inflow to the open storage from the drained area in m3 and is calculated as:
EXFtrench = Aexf × EXFrate,
where
Aexf   is the effective area of exfiltration in m2 and is calculated as:
Aexf = (b + 0.5 × htrench) × (l + 0.5 × htrench),
where
b       is the width of the underground trench in m;
l        is the length of the underground trench in m;
htrench    is the depth of water in the underground trench in m;
EXFrate   is the median exfiltration rate in m.s-1;
Voutflow    is the volume of water drained by the flow control element (underdrain) in m3 (if applied);
WHCtrench    is the volume of water held by the structural substrate in m3;
TWU     is the tree water uptake in m3;
Vtrench_OF  is the volume of water overflowing the trench when it is full in m3.
Note: Vopen_storage_OF is applied only when the open storage is connected directly to the underground trench (e.g. by a street gully).

2.2. Sensitivity analysis

Sensitivity analysis is performed for the setup of a BC-T commonly used in Prague, Czech Republic. A surface setup of BC-T is prescribed in the historical part of the city because Prague is under UNESCO World Heritage protection. An unpaved area around a tree (bioretention cell) has an area of 3 m2 and is either vegetated or covered by a grate with slits to allow water to flow to the tree; the tree span is usually 7 meters. The underground trench is continuous (when permitted by buried infrastructure).
Sensitivity analysis overview is presented in Table 1.

2.2.1. BC-T physical characteristics

Characteristics of open storage, soil filter, underground trench and tree are in Table 2, Table 3, Table 4, and Table 5.

2.2.2. Performance criteria

Performance criteria used for calculation of the drained area size Adrained that can be connected to the BC-T are based on Czech technical standards [21] and are listed in Table 6.

2.2.3. Hydrological balance

A 10-year historical rainfall series with a time resolution of 1 hour is used as an input to the hydrological balance; see equation (2). Characteristics of used rainfall series are given in Table 7; characteristics of drained area are given in Table 8.
Several assumptions were introduced when calculating the hydrological balance:
  • interception in the tree canopy and initial loss are applied when rainfall starts after a 24-hour dry period or longer;
  • evaporation from the open storage ponding area is neglected as evaporation during rainfall is negligible; the same applies for the emptying period of the open storage after the rainfall (ca. 0.5 h when full);
  • retention volume in the soil filter pores and capillary rise is not considered as the underground trench percolation rate is much higher than the one in the soil filter;
  • the permanent wilting point in the soil filter (expressed as a fraction) is 0.1 (according to [37]) and the soil filter is allowed to dry out completely;
  • water held in the soil filter is considered to dry out in 7 days [38], it is assumed to be the result of evaporation from the soil filter surface and transpiration by vegetation planted in the soil filter (if present); trees are not considered to take water up from the soil filter;
  • the capillary rise in the underground trench is not considered because the ground water level is 3 m below the trench bottom and is less than 0.5 mm.d-1 (according to [15]);
  • the structural substrate cannot dry completely as it is placed under the soil filter with no capillary rise (the amount of water in the substrate cannot be lower than the permanent wilting point; therefore, WHCtrench can be substituted by the available water holding capacity AWHCtrench in the hydrological balance);
  • the covering of AWHCtrench is considered as shown in Figure 2; when water from the soil filter percolates downwards through the trench at a 45⁰ angle, AWHCtrench is primarily covered in corresponding volume of substrate only; when the water level in the trench rises, AWHCtrench is covered in the full length of the trench to the actual retention depth (up to the level of the safety spill);
  • the uptake of water held in the structural substrate in the trench is attributed to the tree only;
  • regulated outflow from the underground trench (underdrain) is considered as 50% of its maximum value;
  • a surcharge event of the underground trench is an event preceded by a minimum of 6 hours without an overflow;
  • data on the potential tree water uptake, TWUpotential, (i.e., the amount of water the tree theoretically claims for its wellbeing) are monthly average values for a mature broad leaf tree; TWUpotentional is calculated using the procedure described in [28, 29] with the basal crop coefficient used to describe plant transpiration taking into account the needs of the tree during the year (reference crop evapotranspiration is estimated using the Hargreaves equation [39] based on data from the nearest meteorological station; monthly transpiration data are assumed to vary between - 50% and + 30% according to available data in central Europe [40-44]); used TWUpotential scenarios represent average (20.2 m3.y-1), low (10.1 m3.y-1) and high (26.3 m3.y-1) annual tree water uptake (Table 9).

2.2.4. Subject to sensitivity analysis

Parameters that are subject to sensitivity analysis are listed in Table 10.

2.2.5. Sensitivity analysis evaluation

Parameter sensitivity was evaluated by comparing the calculated Adrained (which can also be expressed as the Ared/ABC ratio).
As supplementary information, the ratio of the amount of water taken up by the tree from the underground trench to TWUpotential (Table 2) was calculated. This value shows the extent to which the tree’s water need is covered by rainfall runoff drained to the BC-T. It is calculated as:
TWUcover = TWU / TWUpotential × 100,
where
TWUcover      is the extent to which the water claimed by the tree is covered by rainfall runoff in %;
TWU          is the tree water uptake based on the hydrological balance calculation in m3;
TWUpotential  is the theoretical value of water the tree must claim for its wellbeing in m3.

3. Results

3.1. Calculation with reference values

At first, Adrained is optimized for different exfiltration rates from the underground trench and reference values of parameters that are subject to the sensitivity analysis. Results are summarized in Table 11.
It is obvious that with the decreasing exfiltration rate, the maximum size of the drained area, Adrained, is rapidly decreasing. Therefore, the tree water need, TWUpotential, is covered to a smaller extent as well. For exfiltration rates lower than 18 mm.h-1, it might be helpful to speed up the emptying of the underground trench by incorporating an underdrain with regulated outflow (e.g., by an orifice). In cases where the regulated outflow of 0.5 l.s-1 is applied for exfiltration rates of 1.8 mm.h-1, the drained area can be increased from 14 to 112 m2, and as a result TWUcover increases from 16 to 68%.

3.2. Sensitivity of water holding capacity in soil filter

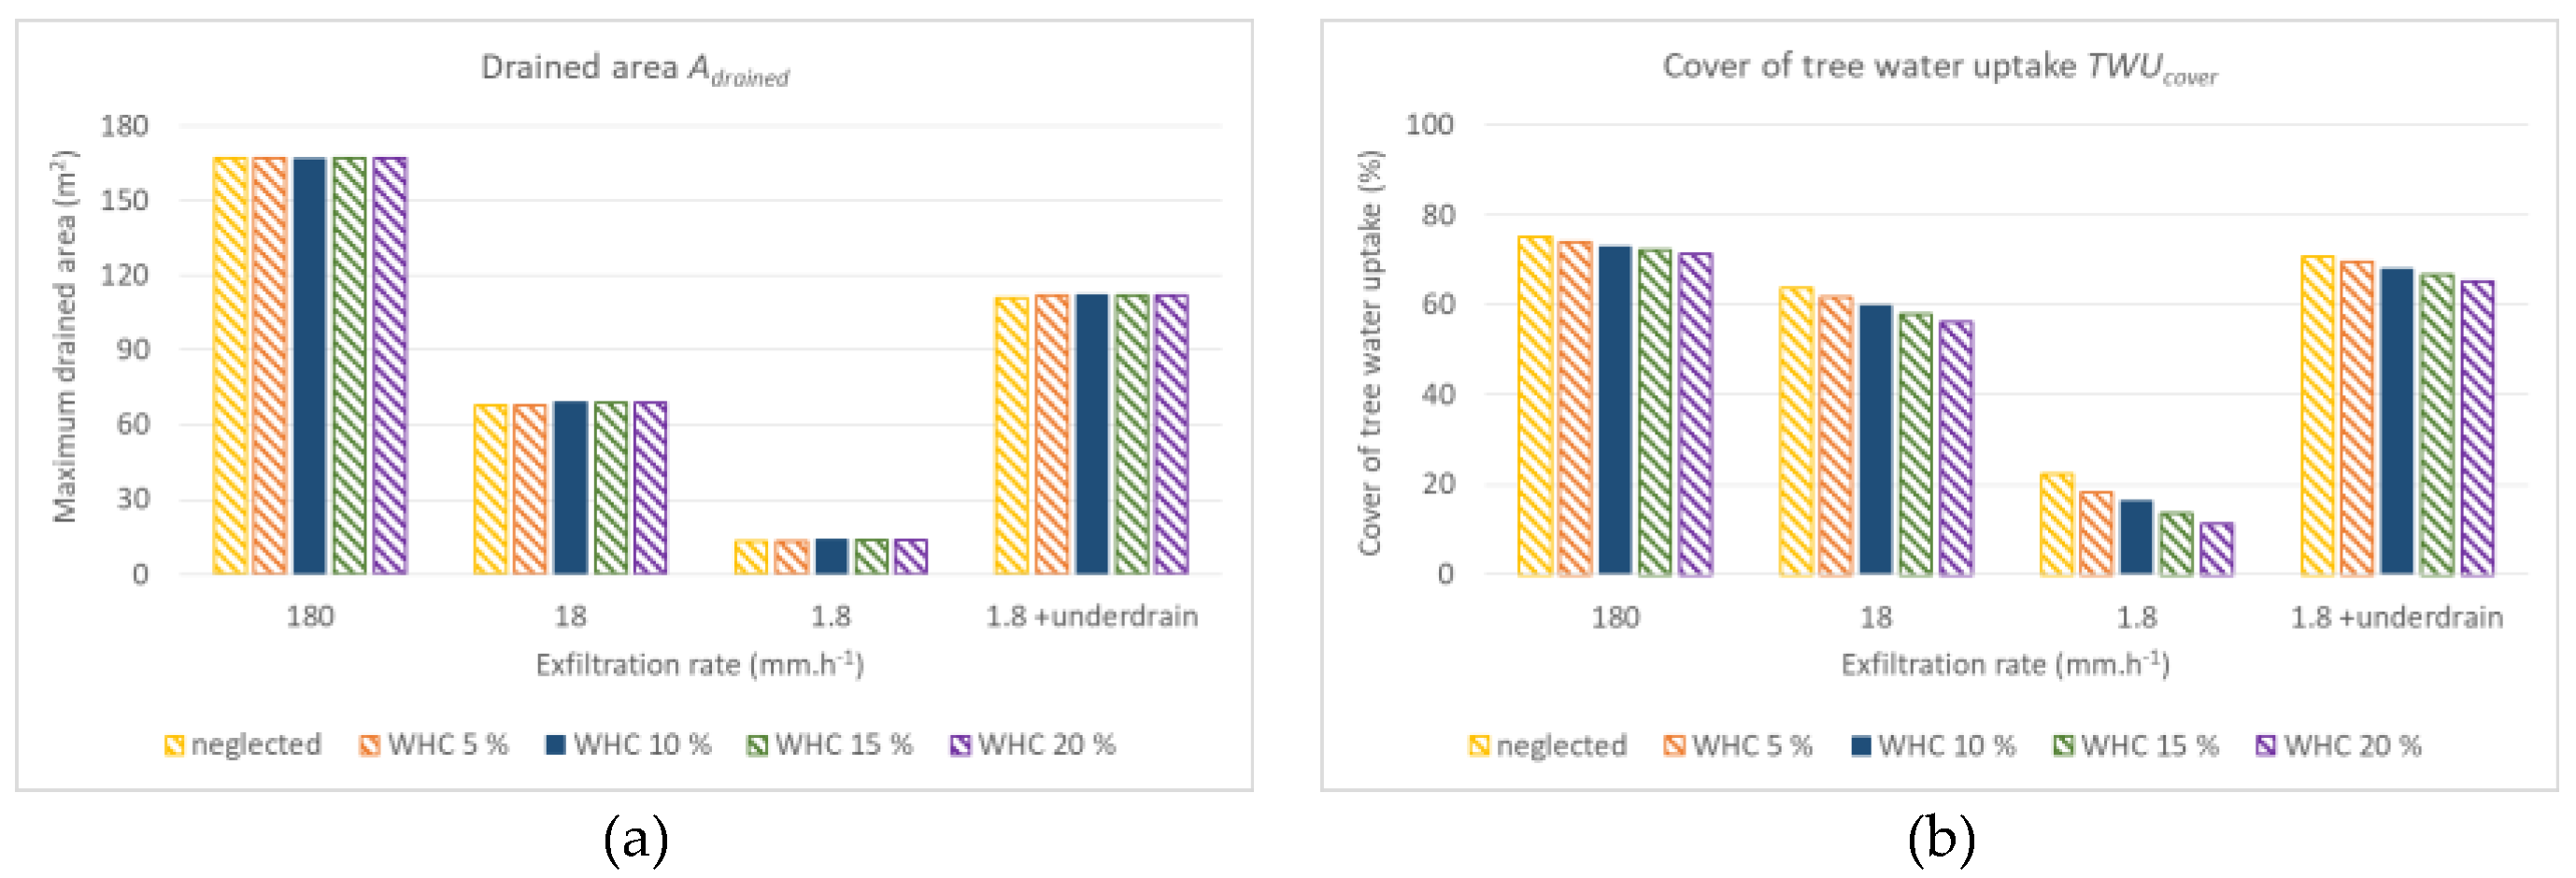
Results of the sensitivity analysis of the water holding capacity in the soil filter WHCsoil_filter are shown in Figure 3.
Changing the value of the WHCsoil_filter has a negligible effect on Adrained, which can be connected to the BC-T, as the soil filter deals only with a small amount of stormwater in comparison to the underground trench. A small effect can be seen in scenarios with lower exfiltration rates, in which even the small amount of water released from the soil filter into the underground trench can affect the duration of the trench emptying. However, the change is in the range of 1 m2 of connectable drained area.
TWUcover varies more. With the decreasing water holding capacity of the soil filter, even small rainfall events have a chance to percolate to the trench and contribute to its available water holding capacity and tree water uptake. The difference is more significant for very low exfiltration rates, as the amount of stormwater potentially held in the soil filter plays a more significant role in the overall water balance.

3.3. Sensitivity of available water holding capacity of underground trench

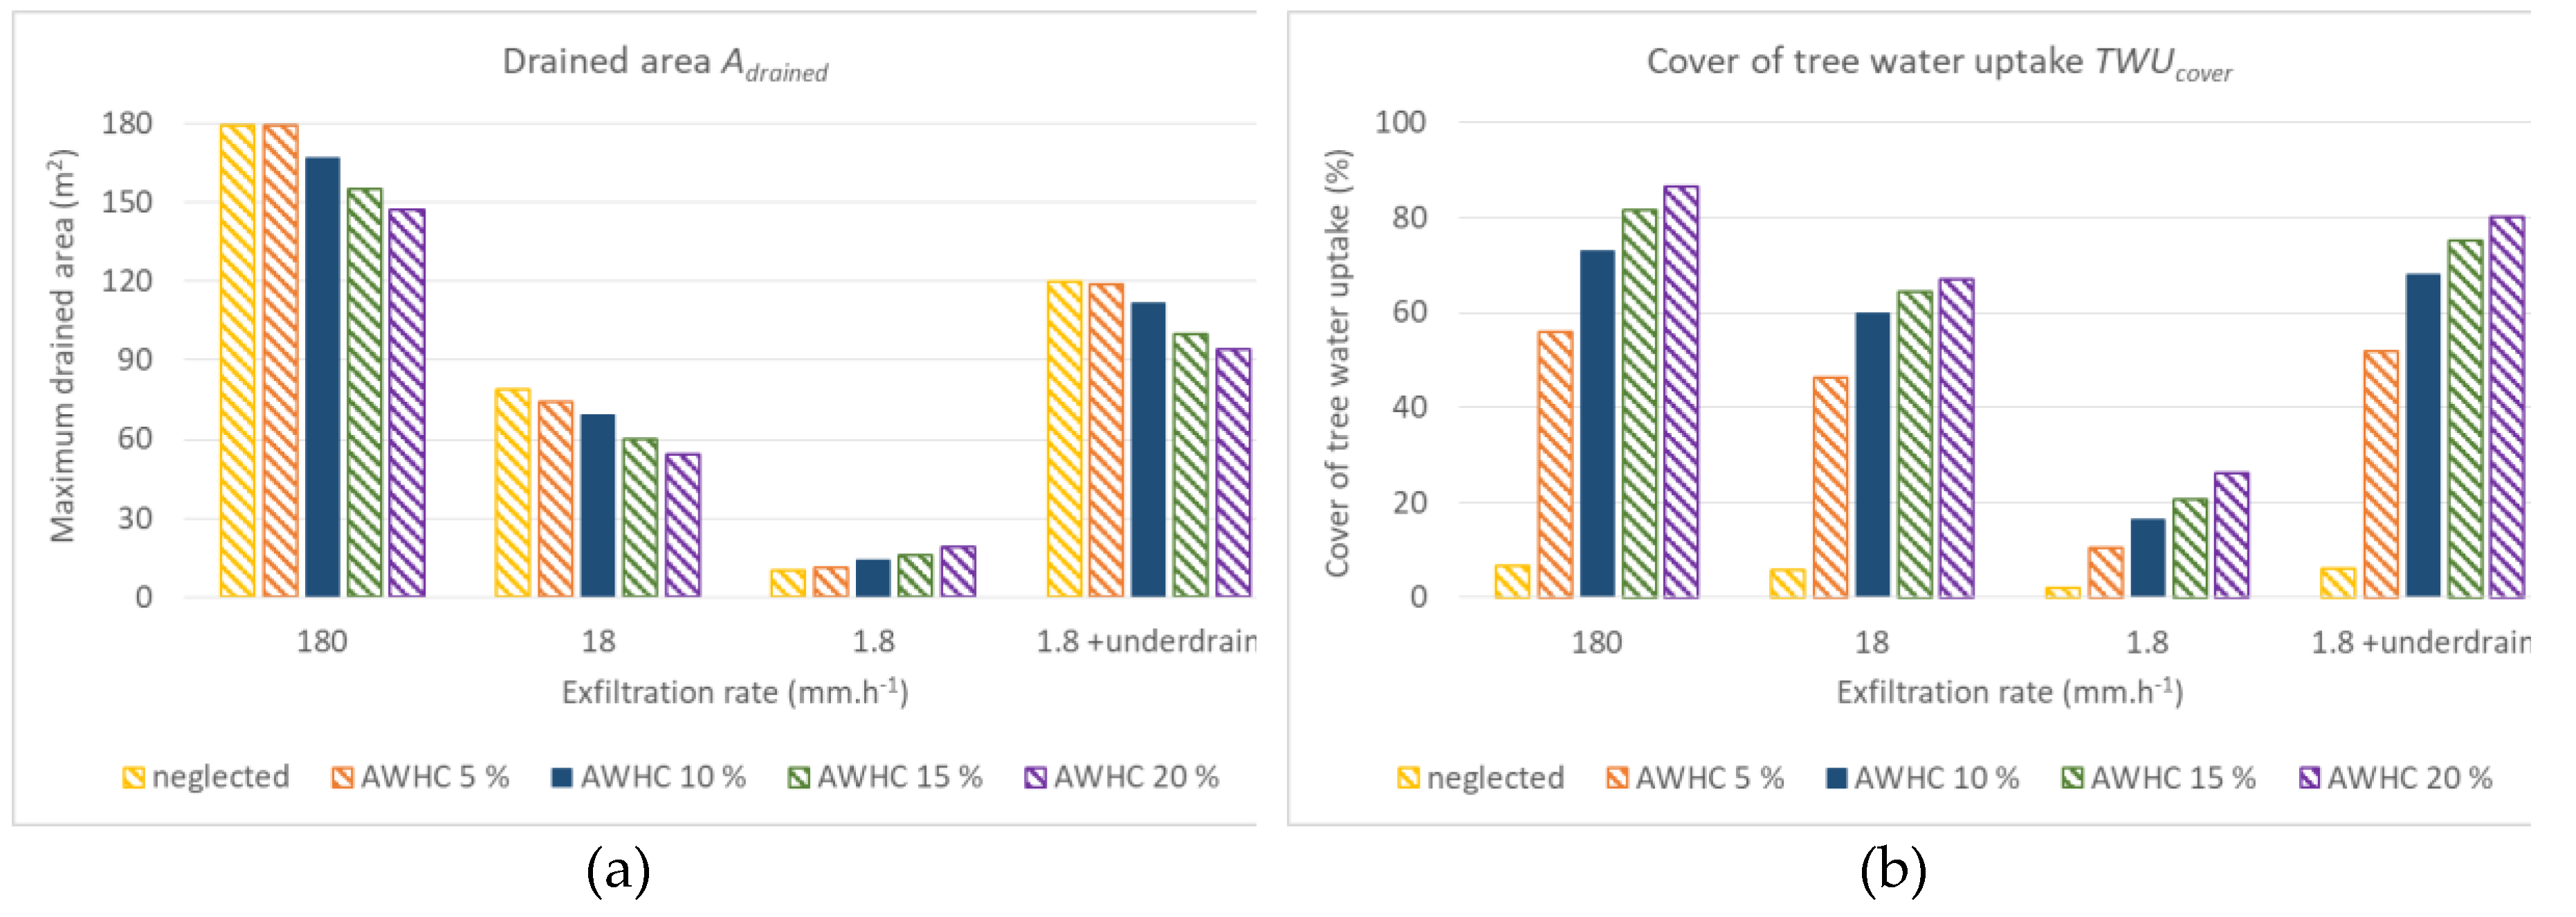
Results of the sensitivity analysis of the available water holding capacity in the underground trench AWHCtrench are shown in Figure 4.
Changing the AWHCtrench has a significant effect on Adrained, which can be connected to the BC-T. For higher exfiltration rates (and the trench with the underdrain), the amount of water held in the structural substrate of the trench decreases the available retention volume for stormwater inflow. It is especially important during heavy rainfall events that have the potential to surcharge the underground trench more often. Therefore, when AWHCtrench is neglected, the connectable drained area Adrained increases by 7-15% compared to the reference value of AWHCtrench (note: in the 180 mm.h-1 exfiltration scenario, Adrained for both the neglected and the 5% AWHCtrench is the same as percentage of water treated by the soil filter determines the result of calculation). Accordingly, with the increasing AWHCtrench value, the maximum drained area Adrained decreases by 12-22%.
The opposite situation occurs in cases of very low exfiltration rates when the duration of the trench emptying plays a major role. A lower value of AWHCtrench means that more water exfiltrates and Adrained must be significantly decreased (by 30% compared to the reference values); when AWHCtrench is higher, a larger area may be connected (increase by up to 35%).
TWUcover is increasing with the increase of AWHCtrench in all studied exfiltration scenarios. Omitting AWHCtrench from the hydrological balance means that the tree can take up water only during the rainfall runoff and shortly after it (until the trench is emptied, i.e., within 48 h). Therefore, TWUcover is very low (2-7%). Even the small value of AWHCtrench (5%) increases TWUcover by tenths of a percent. Coverage progress with further increases in AWHCtrench is still significant (15-30%).

3.4. Sensitivity of potential tree water uptake

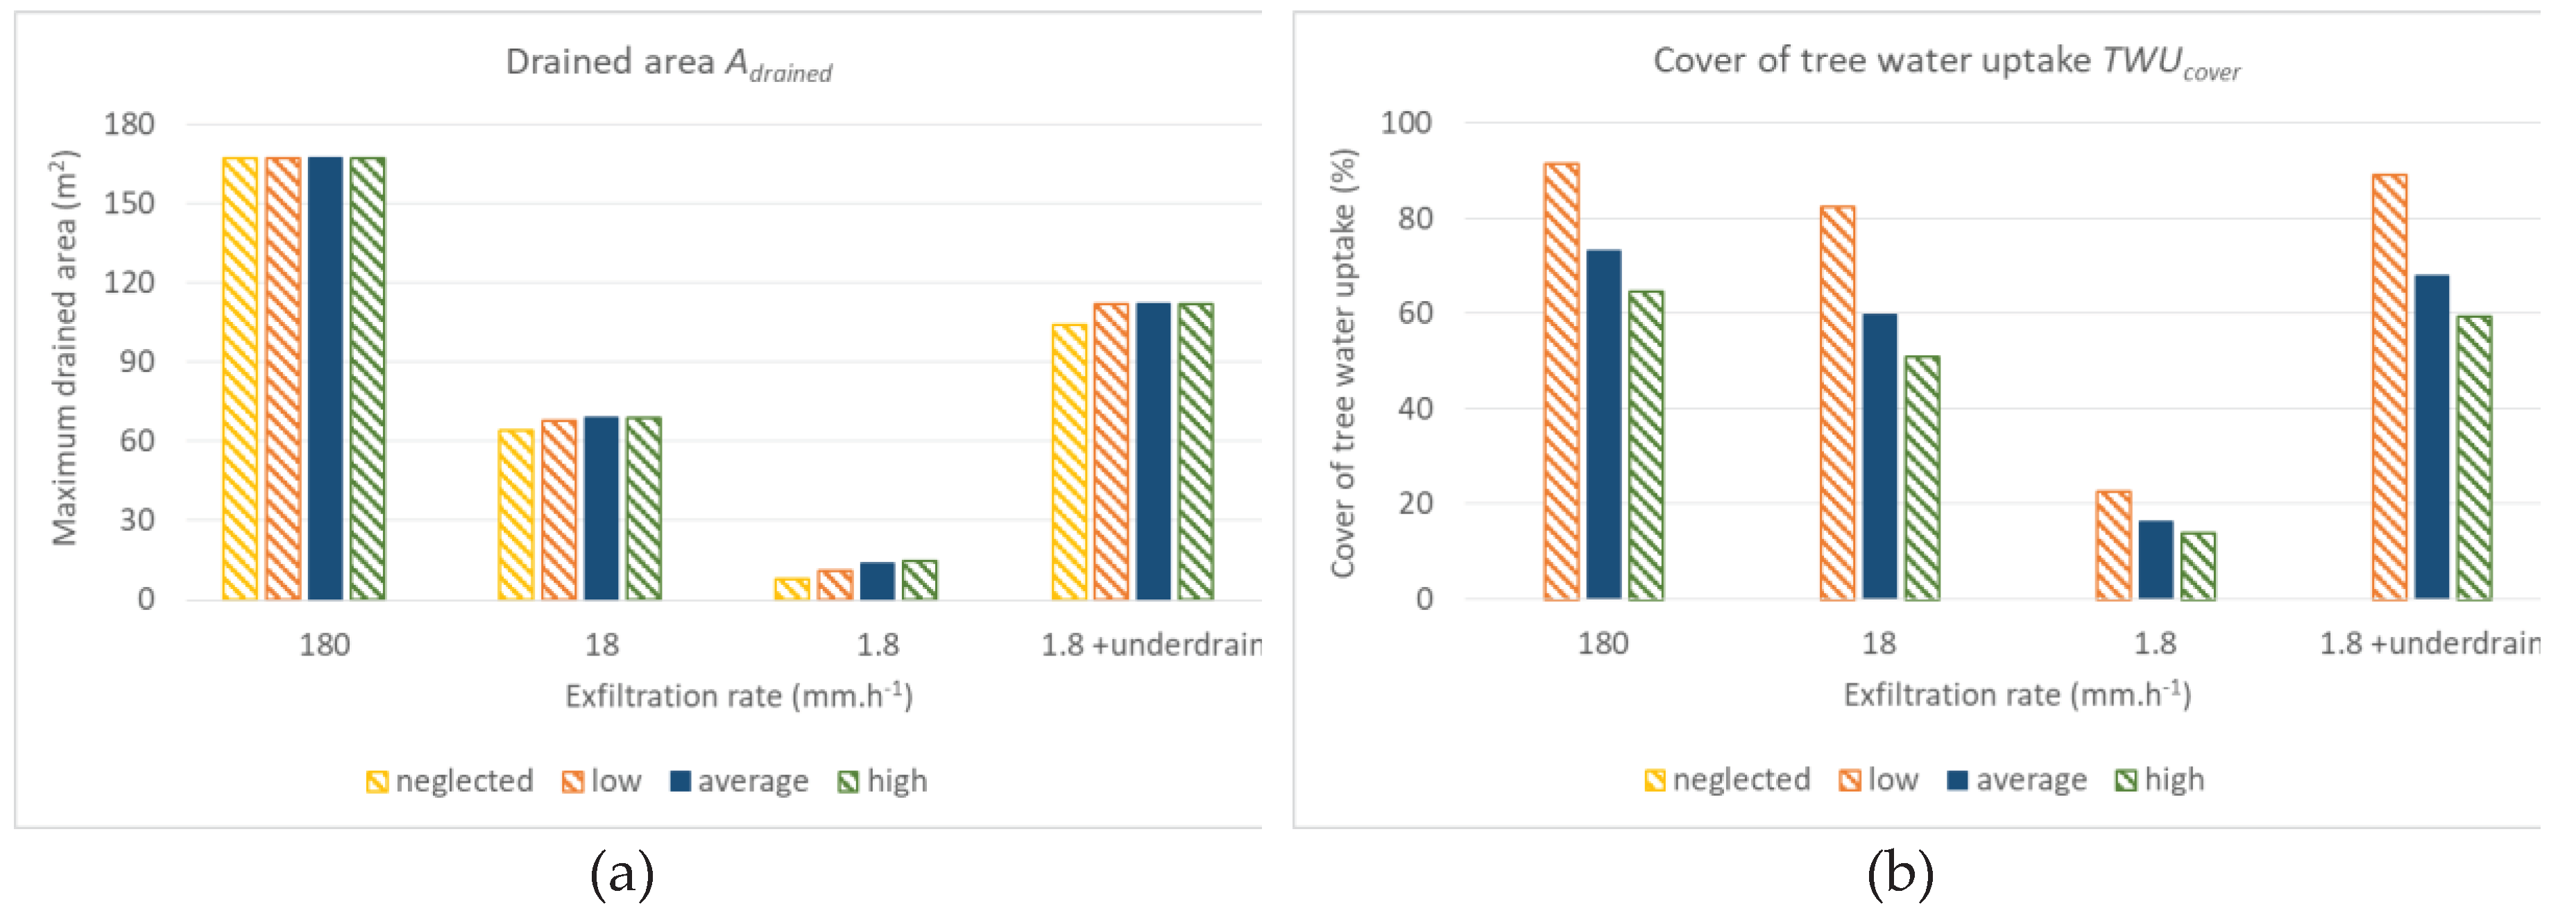
Results of the sensitivity analysis of tree water uptake claim TWUpotential are in Figure 5.
Adrained is slightly increasing with an increase in TWUpotential as the tree water uptake helps to empty the underground trench faster. It is not so important in cases of very good exfiltration rates (the volume of water taken up by the tree is of little significance in the overall water balance of BC-T); however, in cases of very low exfiltration conditions, Adrained doubles (from 8 m2 in the case of TWUpotential to a neglected 15 m2 in the case of ´high´ TWUpotential).
TWUcover decreases because Adrained does not increase substantially with the TWUpotential increase.

3.5. Summary of the sensitivity analysis

Summary of the sensitivity analysis results are shown in Table 12 and Table 13.
The most noticeable change in Adrained was caused by a change in AWHCtrench; however, the change in Adrained is generally within 10% in the case of good exfiltration conditions. Therefore, it is possible to state that the uncertainty in the value of the AWHCtrench (as well as the other two parameters) does not affect the results of the BC-T optimization significantly. Cases of very low exfiltration rates are a different situation, where values of AWHCtrench and TWUpotential can lead to more than a 20% change in Adrained. However, at such exfiltration rates it should be preferred to equip the underground trench with an underdrain to increase TWUcover.
TWUcover results are mainly affected by the parameters AWHCtrench and TWUpotential. Within their usual range of values, the effect on TWUcover is 10–40% for all exfiltration scenarios studied. If TWUcover is required for decision-making, these parameters should be quantified as accurately as possible. WHCsoil_filter has only a small effect on TWUcover (1-3%), especially in good exfiltration conditions. In the case of very low exfiltration rates, it might be up to 20%; however, the same conclusion as in the case of Adrained applies (i.e., the necessity to equip the underground trench with an underdrain).

3.6. Neglecting the parameters

A situation of neglecting all three studied parameters in the hydrological balance was also studied. To get an idea of to what extent it affects the result of optimization, the maximum drained area Adrained is calculated with WHCsoil_filter, AWHCtrench and TWUpotential neglected. The results, including their comparison with the above-presented results, are in Table 5.
The standard design procedure overestimates Adrained by 6-13% under good exfiltration conditions and in the scenario with the underdrain. The overestimation would be more significant with an increase in the AWHCtrench reference value (22% in the case where the AWHCtrench reference value is set to 20%). The other two parameters are not of such importance. In the case of a very low exfiltration rate, the Adrained is significantly underestimated by 50%; the underestimation would be more significant with an increase in the AWHCtrench reference value (63% when the AWHCtrench reference value is set to 20%) and less significant in the case of a decrease in TWUpotential (36% when the TWUpotential reference value is set to ´low´).

4. Discussion

Several counteracting factors affect the optimization of BC-T:
  • volume of water held by the soil filter WHCsoil_filter: its decrease means that a higher water volume percolates into the underground trench and is available to cover the AWHCtrench. On the other hand, more water in the trench must be exfiltrated;
  • volume of water held by the trench AWHCtrench: a higher volume held in the substrate of the trench means more water is available for tree uptake and less water is exfiltrated from the trench; however, less retention volume is available during heavy rainfall events;
  • amount of water needed by the tree for uptake TWUpotential: a higher value helps to restore the free retention volume in the underground trench; however, it is a slow process so it is significant only under very low exfiltration conditions;
  • exfiltration rate from the underground trench to the ambient soil: it determines which of the above-mentioned processes will be crucial during the optimization procedure.
Based on the analysis, it is possible to state that water holding capacities in the soil filter WHCsoil_filter, the trench AWHCtrench, and the tree water uptake TWUclaim can be neglected in the following situations:
  • all three parameters can be neglected under good exfiltration rates from the underground trench or when the trench is equipped with an underdrain; however, if AWHCtrench is omitted, it is recommended to reduce Adrained by 10-20%;
  • AWHCtrench and TWUpotential should not be neglected under very low exfiltration rates (without an underdrain) and should be expressed as accurately as possible;
  • if TWUcover is a subject of calculation, AWHCtrench and TWUpotential should not be omitted.
Also, further findings can contribute to the design process of BC-T:
  • in cases of very low exfiltration rates, it is recommended to equip the underground trench with an underdrain because it significantly increases Adrained and thus TWUcover;
  • AWHCtrench is the most important factor for satisfying the tree water need. Further research should be focused on developing structural substrates with high values of available water holding capacity,
  • Ared/ABC ratio was found to be in the range of 4.5-58 which is consistent with the studies [11, 16, 21-24] (identified Ared/ABC in the range 5-45). However, it is highly dependent on exfiltration conditions (48–58 when the exfiltration rate is 180 mm.h-1, 18-23 when exfiltration rate is 18 mm.h-1, 4.5-7 when the exfiltration rate is 1.8 mm.h-1, and 31–39 when an underdrain is applied). It corresponds with the findings of [11] that Ared/ABC should be 36 when the exfiltration rate is 34 mm.h-1 and only 11 when the exfiltration rate is 1 mm.h-1. However, the Ared/ABC value for 1 mm.h-1 stated by [11] is substantially higher than our finding for the exfiltration rate of 1.8 mm.h-1 (11 compared to 4.5-7). This difference be explained by different climatic data used for the analysis. While the annual rainfall depths in Melbourne, Australia and Prague, Czech Republic are similar (515 vs. 532 mm.y-1), the rainfall distribution during the year is different (Melbourne: minimum 33, maximum 60 mm.month-1; Prague: minimum 23, maximum 77 mm.month-1); thus, the retention space of BC-T has to be accommodated accordingly. Further, the risk of the soil filter clogging must be discussed [21]. A higher Ared/ABC leads to faster clogging and therefore higher costs associated with its more frequent replacement.

Author Contributions

Conceptualization, D.H. and D.S.; methodology, D.S. and L.N.; validation, I.K.; formal analysis, L.N. and D.S.; investigation, L.N. and D.S.; resources, L.N., D.H. and I.K.; data curation, L.N.; writing—original draft preparation, D.S.; writing—review and editing, I.K., D.H. and L.N.; visualization, L.N.; supervision, D.S.; project administration, L.N.; funding acquisition, L.N. All authors have read and agreed to the published version of the manuscript.

Funding

This research was funded by the Czech Technical University, Faculty of Civil Engineering, grant number SGS22/147/OHK1/3T/11.

Institutional Review Board Statement

Not applicable.

Informed Consent Statement

Not applicable.

Data Availability Statement

Not applicable.

Conflicts of Interest

The authors declare no conflict of interest. The funder had no role in the design of the study; in the collection, analyses, or interpretation of data; in the writing of the manuscript; or in the decision to publish the results.

References

  1. Chocat, B.; Krebs, P.; Marsalek, J.; Rauch, W.; Schilling, W. Urban drainage redefined: from stormwater removal to integrated management. Water Sci. Technol. 2001, 43, 61-68. [CrossRef]
  2. Fletcher, T.D.; Shuster, W.; Hunt, W.F.; Ashley, R.; Butler, D.; Arthur, S.; Trowsdale, S.; Barraud, S.; Semadeni-Davies, A.; Bertrand-Krajewski, J.-L.; Mikkelsen, P.S.; Rivard, G.; Uhl, M.; Dagenais, D.; Viklander, M. SUDS, LID, BMPs, WSUD and more — The evolution and application of terminology surrounding urban drainage. Urban Water J. 2015, 12, 525-542. [CrossRef]
  3. Selman, P. What do we mean by sustainable landscape? Sustain.: Sci. Pract. Policy 2008, 4, 23-28. [CrossRef]
  4. Voskamp, I.M.; Van de Ven, F.H.M. Planning support system for climate adaptation: Composing effective sets of blue-green measures to reduce urban vulnerability to extreme weather events. Build. Environ. 2015, 83, 159-167. [CrossRef]
  5. Wang, H.; Cai, Y.; Deng, W.; Li, Ch.; Dong, Y.; Zhou, L.; Sun, J.; Li, Ch.; Song, B.; Zhang, F.; Zhou, G. The Effects of Tree Canopy Structure and Tree Coverage Ratios on Urban Air Temperature Based on ENVI-Met. Forests 2023, 14. [CrossRef]
  6. Hatt, B.E.; Fletcher, T.D.; Deletic, A. Hydraulic and pollutant removal performance of stormwater filters under variable wetting and drying regimes. Water Sci. Technol. 2007, 56, 11-19. [CrossRef]
  7. Mueller, T.; Komlos, J.; Lewellyn, C.; Welker, A.; Traver, R.G.; Wadzuk, B.M. Field-Scale Analysis of a Stormwater Infiltration Trench's Failure. J. Sustain. Water Built Environ. 2022, 8. [CrossRef]
  8. Cederkvist, K.; Jensen, M.B.; Ingvertsen, S.T.; Holm, P.E. Controlling Stormwater Quality with Filter Soil-Event and Dry Weather Testing. Water 2016, 8, 349. [CrossRef]
  9. Lindsey, P.; Bassuk, N. Redesigning the urban forest from the ground below: A new approach to specifying adequate soil volumes for street trees. Arboric. J. 1992, 16, 25-39. [CrossRef]
  10. Rahman, M.A.; Smith, J.G.; Stringer, P.; Ennos, A.R. Effect of rooting conditions on the growth and cooling ability of Pyrus calleryana. Urban For. Urban Green. 2011, 10, 185-192. [CrossRef]
  11. Grey, V.; Livesley, S.J.; Fletcher, T.D.; Szota, C. Establishing street trees in stormwater control measures can double tree growth when extended waterlogging is avoided. Landsc. Urban Plan. 2018, 178, 122-129. [CrossRef]
  12. Pratt, C.J. A review of Source Control of Urban Stormwater Runoff. Water Environ. J. 1995, 9, 132-139. [CrossRef]
  13. Akan, A. Sizing stormwater infiltration structures J. Hydraul. Eng. 2002, 128, 534-537. [CrossRef]
  14. Burns, M.J.; Fletcher, T.D.; Walsh, C.J.; Ladson, A.R.; Hatt, B.E. Setting objectives for hydrologic restoration: from site-scale to catchment-scale. Proceedings of the Novatech 2013 - 8ème Conférence international sur les techniques et strategies durables pour la gestion des eaux urbaines par temps de pluie / 8th International Conference on planning and technologies for sustainable management of Water in the City, Lyon, France, 23-27 06 2013.
  15. Wessolek, G.; Kluge, B. Predicting Water Supply and Evapotranspiration of Street Trees Using Hydro-Pedo-Transfer Functions (HPTFs). Forests 2021, 12. [CrossRef]
  16. Stone, M. Christchurch Stormwater Tree Pit Design Criteria: Detailed Report, 2nd rev.; Christchurch City Council, Christchurch, New Zealand, 2008; pp. 90.
  17. Day, S.D.; Dove, J.E.; Bartens, J.; Harris, J.R. Stromwater management that combines paved surfaces and urban trees. Geosustainability and geohazard mitigation: proceedings of selected sessions of GeoCongress 2008, New Orleans, Lousiana, USA, 9-12 03 2008.
  18. Belmeziti, A.; Cherqui, F.; Kaufmann, B. Improving the multi-functionality of urban green spaces: Relations between components of green spaces and urban services. Sustain. Cities Soc. 2018, 43, 1-10. [CrossRef]
  19. O’Donnell, E.C.; Lamond, J.E.; Thorne, C.R. Recognising barriers to implementation of Blue-Green Infrastructure: a Newcastle case study. Urban Water J. 2017, 14, 964-971. [CrossRef]
  20. Siriwardene, N.R.; Deletic, A.; Fletcher, T.D. Clogging of stormwater gravel infiltration systems and filters: Insights from a laboratory study Water Res. 2007, 41, 1433-1440. [CrossRef]
  21. Kabelková, I.; Stránský, D.; Bareš, V. Basic Principles of the Czech Technical Standard on Sustainable Stormwater Management. Storm Water Management. Examples from Czech Republic, Slovakia and Poland, 1st ed.; Hlavínek, P.; Zeleňáková, M., Eds.; Springer: Cham, Switzerland, 2015; 179-195.
  22. Bratieres, K.; Fletcher, T.D.; Deletic, A.; Zinger, Y. Nutrient and sediment removal by stormwater biofilters: a large-scale design optimisation study. Water Res. 2008, 42, 3930-40. [CrossRef]
  23. Sommer, H.; Estupinan, F. Hydrologische Berechnungen für das Projekt KLIQ „Klimafolgenanpassung innerstädtischer hochverdichteter Quartiere in Hamburg“ - Berechnung des Wasserhaushaltes und des Verhaltens im Starkniederschlagsfall für unterschiedliche dezentrale Regenwasserbewirtschaftungsvarianten für das Untersuchungsgebiet Winterhude-Süd in Hamburg; Ingenieurgesellschaft Prof. Dr. Sieker mbH: Hoppegarten, Deutschland, 2017; pp. 25-26.
  24. Fridell, K.; Thynell, A.; Bruhn, F.; Fors, J.; Sixtensson, S.; Vysoký, M. Livable Streets—A Handbook of Bluegreengrey Systems Version 2.0; Edge: Malmö, Sweden, 2020; pp. 72.
  25. Woods-Ballard, B.; Wilson, S.; Udale-Clarke, H.; Illman, S.; Scot, T.; Ashley, R.; Kellagher, R. The SuDS Manual (C975), 1st ed.; CIRIA: London, United Kingdom, 2015; pp. 512.
  26. Liu, L.; Liu, Q.; Wei, Z.; Yu, X.; Jia, G.; Jiang, J. Partitioning tree water usage into storage and transpiration in a mixed forest. For. Ecosyst. 2021, 8. [CrossRef]
  27. Ow, L.F.; Gosh, S. Urban tree growth and their dependency on infiltration rates in structural soil and structural cells. Urban For. Urban Green. 2017, 26, 41-47. [CrossRef]
  28. Allen, R.G.; Pereira, L.S.; Raes, D., Smith, M. Crop Evapotranspiration (Guidelines for Computing Crop Water Requirements) FAO Irrigation and Drainage Paper No. 56; FAO – Food and Agriculture organization of the United Nations: Rome, Italy, 1998; pp. 135-158.
  29. Wullschleger, S.D.; Meinzer, F.C., Vertessy, R.A. A review of whole-plant water use studies in trees. Tree Physiol. 1998, 18, 499-512. [CrossRef]
  30. Pereira, L. S.; Allen, R. G.; Smith M.; Raes, D. Crop evapotranspiration estimation with FAO56: Past and future. Agric. Water Manag. 2015, 147, 4-20. [CrossRef]
  31. Grabosky, J.; Haffner, E.; Bassuk, N. Plant Available Moisture in Stone-soil Media for Use Under Pavement While Allowing Urban Tree Root Growth Arboric. Urban For. 2009, 35, 271-278.
  32. Wei, B.; Peng, Y.; Lin, L.; Zhang, D.; Li, M.; Jiang, L.; Li, Y.; He, T.; Wang, Z. Systematic review and meta-analysis Drivers of biochar-mediated improvement of soil water retention capacity based on soil texture: A meta-analysis. Geoderma 2023, 437. [CrossRef]
  33. Seyedsadr, S.; Šípek, V.; Jačka, L.; Sněhota, M.; Beesley, L.; Pohořelý, M.; Kovář, M.; Trakal, L. Biochar considerably increases the easily available water and nutrient content in low-organic soils amended with compost and manure. Chemosphere 2022, 293. [CrossRef]
  34. Yu, O.-Y.; Raichle, B.; Sink, S. Impact of biochar on the water holding capacity of loamy sand soil. Int. J. Energy Environ. Eng. 2013, 4.
  35. Breuer, L.; Eckhardt, K.; Frede, H.-G. Plant parameter values for models in temperate climates. Ecol. Modell. 2003, 169, 237-293. [CrossRef]
  36. Arnbjerg-Nielsen, K.; Harremoës, P. Prediction of hydrological reduction factor and initial loss in urban surface runoff from small ungauged catchments. Atmos. Res. 1996, 42, 137-147. [CrossRef]
  37. Rawls, W.J.; Brakensiek, D.L.; Miller, N. Green-Ampt infiltration parameters from soils data. J. Hyd. Engr. 1983, 109, 1316. [CrossRef]
  38. Rossman, L.A. Storm Water Management Model User’s Manual Version 5.1 (EPA/600/R-14/413b), 2nd rev.; EPA: Cincinnati, Ohio, USA, 2015; pp. 232.
  39. Hargreaves, G.H.; Allen, R.G. History and Evaluation of Hargreaves Evapotranspiration Equation. J. Irrig. Drain. Eng. 2003, 129, 53-63. [CrossRef]
  40. Jackisch, C.; Knoblauch, S.; Blume, T.; Zehe, E.; Hassler, S. K. Estimates of tree root water uptake from soil moisture profile dynamics. Biogeosciences 2020, 17, 5787-5808. [CrossRef]
  41. Hassler, S. K.; Weiler, M.; Blume, T. Tree-, stand- and site-specific controls on landscape-scale patterns of transpiration. Hydrol. Earth Syst. Sci. 2018, 22, 13-30. [CrossRef]
  42. Střelcová, K.; Matejka, F.; Minďáš, J. Estimation of beech tree transpiration in relation to their social status in forest stand. J. For. Sci. 2002, 48, 130-140. [CrossRef]
  43. Kocher, P.; Horna, V.; Leuschner, C. Stem water storage in five coexisting temperate broad-leaved tree species: significance, temporal dynamics and dependence on tree functional traits. Tree Physiol. 2013, 33, 817-832. [CrossRef]
  44. Skalová, V. Study of hydrological quantitative relationships between plant transpiration and soil moisture conditions in the catchment. Doctoral thesis, Czech Technical University in Prague, Czech Republic, 2023.
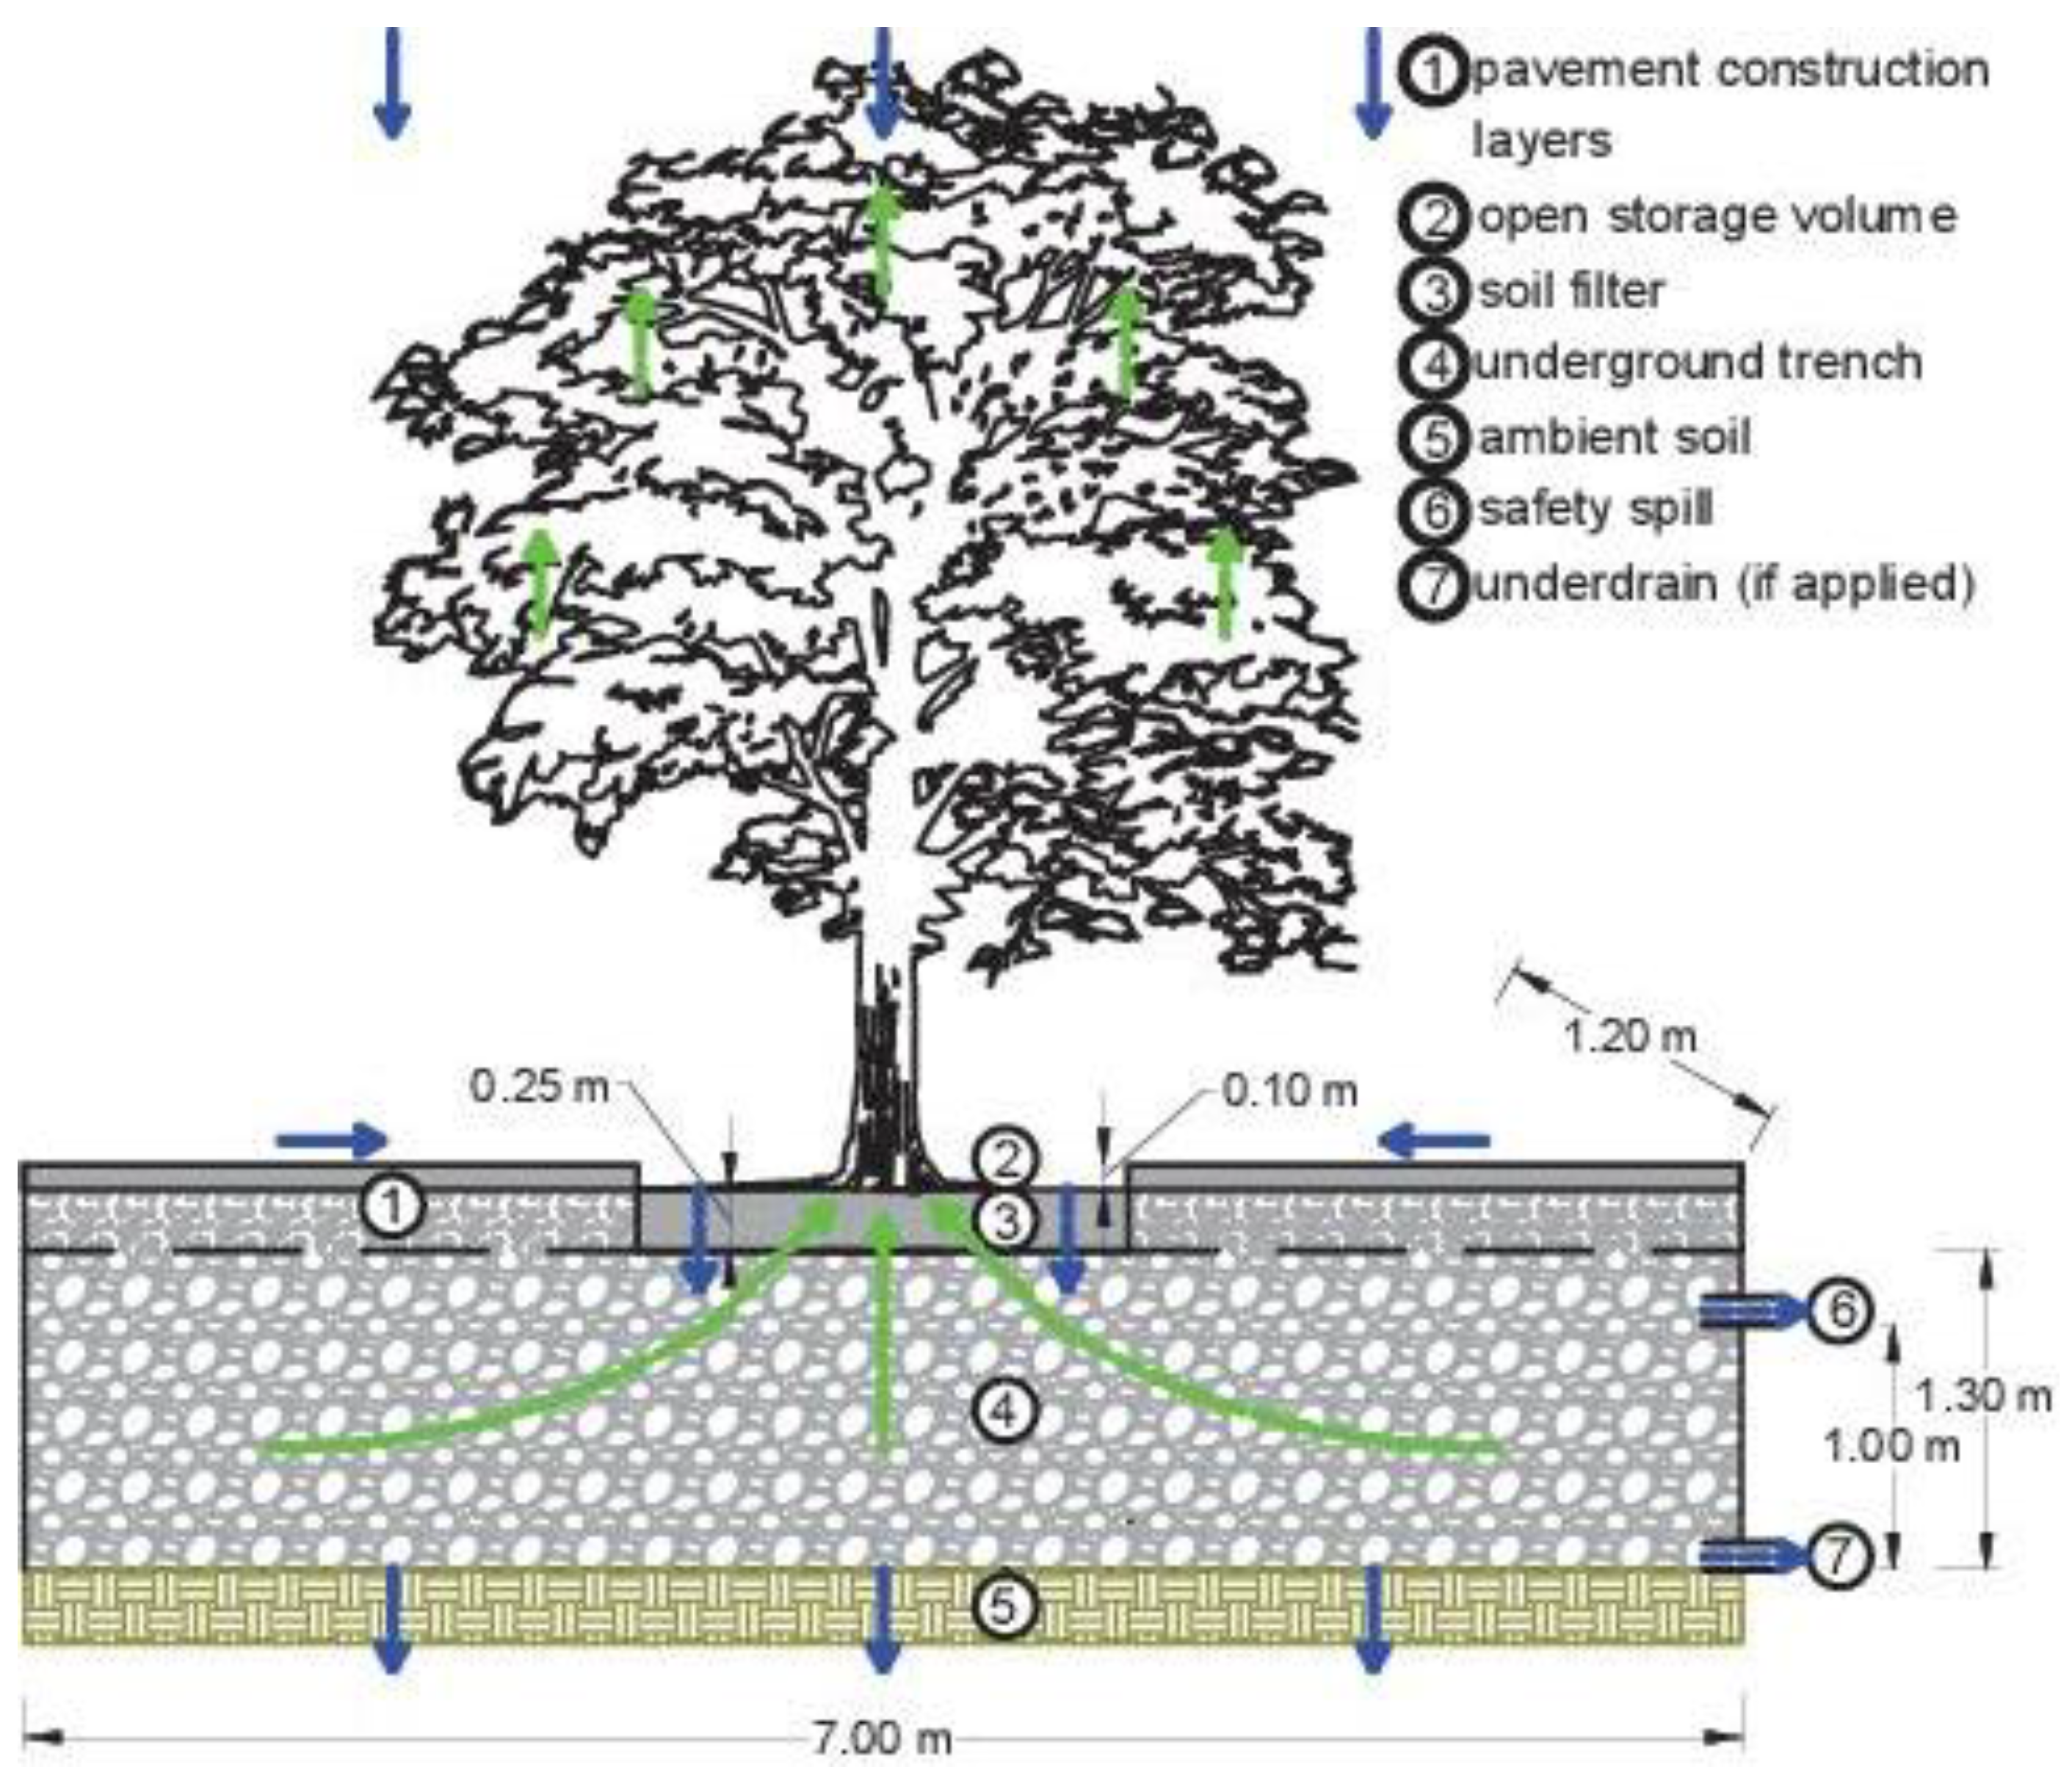
Figure 1. Scheme of a BC-T used for the hydrological balance calculation.
Preprints 86923 g001
Figure 2. Schematization of AWHCtrench calcuation in hydrological balance (hret is depth of retained water in time t, hret,max is a maximum depth of retained water).
Preprints 86923 g002
Figure 3. Effect of water holding capacity of the soil filter WHCsoil_filter on: (a) Adrained; (b) TWUcover.
Preprints 86923 g003
Figure 4. Effect of available water holding capacity of underground trench AWHCtrench on: (a) Adrained; (b) TWUcover.
Preprints 86923 g004
Figure 5. Effect of potential tree water uptake TWUpotential on: (a) Adrained; (b) TWUcover
Preprints 86923 g005
Table 1. Overview of groups of data used in sensitivity analysis procedure.
Data groups Data used
Given characteristics and inputs BC-T physical setup
Tree physical characteristics
Soil filter infiltration rate
Initial and interception losses, runoff coefficient of drained area
Historical rainfall series
Variable local conditions Exfiltration rates from underground trench to ambient soil
Use/non-use of underdrain for emptying of underground trench
Performance criteria Frequency of underground trench surcharge
Minimum amount of stormwater treated by soil filter
Duration of underground trench emptying
Target variable 1 Size of area drained to BC-T (Adrained) that can be connected to BC-T, can be also expressed as Ared/ABC ratio
Subject to sensitivity analysis Water holding capacity of soil filter (WHCsoil_filter)
Water holding capacity of underground trench substrate (WHCtrench, can be substituted by available water holding capacity AWHCtrench)
Potential tree water uptake (TWUpotential)
1 Result of hydrological balance calculation.
Table 2. Open storage characteristics.
Characteristic Value / Comment
Area 3 m2
Ponding area 2.8 m2 (a tree with a 0.5 m trunk diameter is considered)
Depth 0.10 m
Storage volume 0.28 m3
Overflow In case open storage is surcharged the excess water is diverted directly to the underground trench
Table 3. Soil filter characteristics.
Characteristic Value / Comment
Area 2.8 m2
Thickness 0.25 m
Material Soil with ca. 10% of clay and 3% of moisture-containing matter (humus, biochar)
Infiltration rate 180 mm.h-1 (recommended by [21])
Water holding capacity Subject to the sensitivity analysis
Table 4. Underground trench characteristics.
Characteristic Value / Comment
Area 8.4 m2 (width 1.2 m × length 7 m)
Depth 1.3 m (effective storage depth from the trench bottom to the level of the safety spill is considered 1.0 m)
Material Structural stone-soil substrate
Porosity 30%
Storage volume 2.52 m3
Exfiltration rate Scenarios: 180 mm.h-1, 18 mm.h-1 and 1.8 mm.h-1 without underdrain and 1.8 mm.h-1 with underdrain (regulated outflow at the bottom of the trench with maximum of 0.5 l.s-1)
Ground water level 3 m below trench bottom
Water holding capacity Subject to the sensitivity analysis
Table 5. Tree characteristics.
Characteristic Value / Comment
Trunk diameter at ground 0.5 m
Crown diameter 7 m
Tree type Broad leaved, mature
Interception of rainfall 1.1 mm in tree crown area (according to [35])
Tree water uptake Subject to the sensitivity analysis
Table 6. Performance criteria and their requested values.
Criterion Value / Comment
The maximum permissible frequency of underground trench surcharge 1 per 5 years
The minimum amount of water infiltrating to the soil filter ensure the restoration of the natural water regime and proper pretreatment of stormwater 85%
The maximum duration for emptying the underground trench when it is full (prevention of tree roots waterlogging) 48 h
Table 7. Historical rainfall series characteristics.
Characteristic Value / Comment
Location Prague, Czech Republic
Length of the record 10 years (from 2006 to 2015)
Time resolution 1 hour
Average rainfall depth 532 mm.y-1
Table 8. Drained area characteristics.
Characteristic Value / Comment
Area Target variable
Initial losses 0.5 mm (according to [36])
Runoff coefficient 0.90 (typical for urban paved surfaces in city centers)
Table 9. Potential tree water uptake TWUpotential data used in the hydrological balance.
Month Average air temperature in ⁰C TWUpotential in l.d-1
Average Low High
January 0.9 1.3 0.7 1.7
February 1.6 2.6 1.3 3.3
March 5.8 19.6 9.8 25.5
April 11.7 50.5 25.3 65.7
May 15.3 98.6 49.3 128.2
June 19.0 138.2 69.1 179.6
July 21.6 147.1 73.5 191.2
August 20.2 118.6 59.3 154.2
September 15.5 57.6 28.8 74.9
October 10.1 21.3 10.6 27.7
November 6.3 2.1 1.1 2.7
December 2.3 1.2 0.6 1.6
Table 10. Parameters that are subject to sensitivity analysis and their studied values.
Parameter Reference value Tested range Increments Neglected
WHCsoil_filter 10% 5 – 20% 5% parameters neglected in hydrological balance
AWHCtrench 10% 5 – 20% 5%
TWUpotential Average Low to High -50%; +30%
Table 11. Summary of results for different exfiltration rate scenarios with reference values of parameters that are subject to the sensitivity analysis (both WHCsoil_filter and AWHCtrench are set to 10%, average TWUpotential is used); determining performance criterion shows which of the three performance criteria used (Table 6) is critical for the optimization (i.e., two other criteria are fulfilled).
Exfiltration rate
in mm.h-1
Determining performance criterion Adrained
in m2
Ared/ABC
in m2.m-2
TWUcover
in %
180 Frequency of surcharge 167 54.6 73.1
18 Frequency of surcharge 69 23.1 59.9
1.8 Emptying duration 14 5.5 16.4
1.8 + underdrain Frequency of surcharge 112 37.0 68.1
Table 12. Effect of changing the studied parameters values (WHCsoil_filter, AWHCtrench and TWUpotential) on Adrained.
Tested parameters
WHCsoil_filter AWHCtrench TWUpotential
Reference value 10% 10% Average
Tested values 5% 15% 5% 15% Low High
Exfiltration Change in Adrained compared to reference value in %
180 mm.h-1 0.0 0.0 +7.2 -7.2 0.0 0.0
18 mm.h-1 -1.4 0.0 +7.2 -13.0 -1.4 0.0
1.8 mm.h-1 -7.1 0.0 -21.4 +14.3 -21.4 +7.1
1.8 mm.h-1 + underdrain 0.0 0.0 +6.3 -10.7 0.0 0.0
Table 13. Effect of changing the studied parameters values (WHCsoil_filter, AWHCtrench and TWUpotential) on TWUcover.
Tested parameters
WHCsoil_filter AWHCtrench TWUpotential
Reference value 10% 10% Average
Tested values 5% 15% 5% 15% Low High
Exfiltration: Change in TWUcover compared to reference value in %
180 mm.h-1 +1.4 -1.2 -23.4 +11.5 +25.2 -11.5
18 mm.h-1 +2.8 -3.3 -22.5 +7.3 +37.7 -15.2
1.8 mm.h-1 +11.0 -17.7 -36.0 +25.0 +38.4 -14.6
1.8 mm.h-1 + underdrain +2.2 -2.1 -23.8 +10.4 +30.8 -12.6
Table 14. Summary of results for different exfiltration scenarios with values of WHCsoil_filter, AWHCtrench and TWUpotential neglected.
Tested parameters
WHCsoil_filter AWHCtrench TWUpotential
Reference value 10% 10% Average
Tested value neglected neglected neglected
Exfiltration: Change in Adrained compared to reference value in %
180 mm.h-1 +7.2
18 mm.h-1 +13.0
1.8 mm.h-1 -50.0
1.8 mm.h-1 + underdrain +6.3
Disclaimer/Publisher’s Note: The statements, opinions and data contained in all publications are solely those of the individual author(s) and contributor(s) and not of MDPI and/or the editor(s). MDPI and/or the editor(s) disclaim responsibility for any injury to people or property resulting from any ideas, methods, instructions or products referred to in the content.
Copyright: This open access article is published under a Creative Commons CC BY 4.0 license, which permit the free download, distribution, and reuse, provided that the author and preprint are cited in any reuse.
Prerpints.org logo

Preprints.org is a free preprint server supported by MDPI in Basel, Switzerland.

Subscribe

© 2024 MDPI (Basel, Switzerland) unless otherwise stated