Submitted:
03 October 2023
Posted:
04 October 2023
You are already at the latest version
Abstract
Recently, smart mobility intelligent traffic services have become a critical task in Intelligent Transportation Systems (ITS). This involves not only the use of advanced sensors and controllers but also the ability to respond to real-time traffic situations at intersections, alleviate congestion, and generate policies to prevent traffic jams. DRL (Deep Reinforcement Learning) provides a natural framework for processing tasks. In DRL, each intersection can control itself and coordinate with neighbors to achieve optimal network-wide policies. However, comparing approaches remains a challenging task due to the existence of numerous possible configurations. This research performs a critical comparison of various traffic controllers found in the literature. It demonstrates that using a nonlinear approximator for coordination mechanisms and enhancing observability at each intersection are key performance drivers.
Keywords:
Smart Mobility Intelligent Traffic Service
; Intelligent Transportation System
; Real-time Traffic Situation
; Deep Reinforcement Learning (DRL)
; Optimal Network-wide Policy
1. Introduction
In Korea today, the smart mobility traffic
information system combines and analyzes personal movement information such as
taxis or private cars using big data. It also refers to a new transportation
information provision service that leads potential private users to complex
public transportation by extracting demand patterns of transportation users and
providing integrated mobility services for reservation, information, use, and
payment according to individual user needs. It is a technology that allows
users to set routes for transportation modes from their desired departure point
to destination, according to the demands of public transportation users [1]. By operating transportation modes at desired
time slots and implementing interconnections between different modes, it
enhances the convenience of transportation for individuals with mobility
challenges. It transitions from a conventional independent transportation
service system that focuses on individual modes to a user-centric integrated
and customized transportation service system that combines and operates various
modes such as public transportation, personal vehicles, and shared cars [2]. This system aims to provide seamless
transportation information connectivity, improve efficiency in short, medium,
and long-distance travel, and implement an environmentally friendly and sharing
economy-based transportation service in response to climate change. Due to
these reasons, the need for an intelligent transportation system in Korea can
be summarized as follows. Firstly, although the public transportation mode
share in Korea has shown excellent performance compared to advanced countries,
it has been stagnant at around 40% since 2014 [3],
reaching its limit in terms of increasing the mode share. To respond
efficiently to the constantly changing transportation demand that varies by
local government and small-scale areas, an efficient operational method is
needed along with the supply of new concept transportation modes. Secondly,
while Korea has improved the public transportation service centered around
public transportation providers, various countries have recently introduced new
public transportation services, and the concepts of car sharing and ride
sharing have been spreading in the private vehicle sector [4]. Thirdly, in the field of public transportation,
overseas cases of Mobility as a Service (MaaS) are emerging, especially in the
Nordic region of Western Europe. MaaS provides demand-based subscriber
transportation packages, offering integrated transportation information
including various modes of transportation on a single platform, as well as
integrated payment services [5]. It represents
a departure from the existing transportation systems provided by
supply-oriented providers and aims to provide personalized optimal
transportation information and route systems, reservation and payment systems,
and other integrated operational services from the user's perspective. The
rapid urbanization has led to increased congestion in urban areas. To alleviate
this, there is a need to establish an integrated system that provides personalized
transportation services based on comprehensive analysis using big data. This
includes tailored guidance for public transportation based on individual user
demands, integrated mobility services that provide information, reservations,
usage, and payment, and coordinated operations of various transportation modes
to meet the demand. Additionally, in terms of transportation planning and
operation in smart cities, it is necessary to activate smart mobility by
utilizing user activity-based mobility data and develop and standardize service
technologies for integrated public transportation and shared mobility services.
The related trends of strategic products for smart mobility intelligent
transportation systems are shown in Table 1.
2. Scope and Classification
2.1. Value Chain
Smart mobility is one of the key components of a
smart city, along with transportation, energy, resources, and infrastructure management.
It plays a crucial role in the city's economic and social systems, with
significant government funding and direct impact on citizens' daily lives.
Smart mobility generates a vast amount of data that influences the city's
resources, logistics, energy, and economic flows. The technologies that
constitute smart mobility are expected to play a significant role in enhancing
the competitiveness of cities and countries. The development and production of
new modes of transportation are expected to create jobs, reduce traffic
accidents through technological advancements, and improve the efficiency of
transportation systems, resulting in economic benefits. For example,
advancements in smart cars are projected to create around 320,000 jobs and
reduce approximately 2,500 serious traffic accidents annually, resulting in an
estimated economic impact of 75.4 billion KRW by 2030. The goal is to enhance
user convenience, such as reducing overall travel time, through the integration
of smart mobility systems. By establishing a bidirectional data collection and
sharing system between vehicles and infrastructure, rapid and proactive
responses to unforeseen situations and preventive measures become possible. As
vehicles themselves become a means of communication, they can contribute to
solving urban and transportation issues through data integration facilitated by
IoT, a key component of smart cities. During the initial stages of introducing
autonomous driving, potential challenges arising from the coexistence of autonomous
and conventional vehicles can be overcome through vehicle-to-everything (V2X)
communication, thereby improving the safety and efficiency of cities and
transportation. Table 2 represents the
industrial structure of the smart mobility transportation information system
field.
2.2. Classification by Purpose
In the field of smart mobility, various and
creative services are being discovered through citizen-participatory
(bottom-up) service concepts. Representative services include personal
transportation sharing services, public transportation sharing services, and
micro-mobility services. Table 3 provides
a classification by purpose for strategies to implement smart mobility.
2.3. Classification by Technology
The Smart Mobility Traffic Information System can
be broadly classified into the implementation technologies of an AI-based Smart
Mobility Center. It can be further categorized as follows: The implementation
technologies of the Mobility Center include AI-based urban traffic control
technology, mobile-based MaaS (Mobility as a Service) technology, prediction
technology based on big data and simulation, and navigation service technology
based on connected cars. These technologies work together to control the flow
of transportation throughout the city, providing personalized services and
delivering a higher level of service to citizens. The details are shown in the
table below as Table 4.
2.4. Case Study
For example, various research studies on traffic
management at intersections are being conducted in Korea. Among them, research
on traffic signal systems is actively underway. The current signal systems are
fixed in nature. In order to increase the throughput of intersections, adaptive
methods have also been studied. Adaptive methods involve adjusting the timing
of traffic signals or changing the sequence of signals based on traffic volume.
The optimization problem of traffic signal control, which involves a large
amount of data in a dynamically changing traffic environment, poses a high
level of complexity when solved using traditional mathematical models or
optimization methods. To solve the traffic signal problem, fuzzy techniques and
Q-learning techniques are widely used. A traffic signal control technique using
fuzzy techniques has been proposed for a single intersection. In this approach,
the order of green signals remains fixed, but the duration of green signals is
dynamically adjusted based on traffic volume. The number of vehicles entering
the intersection is measured to determine the current traffic flow during the
green signal and the traffic flow during the red signal in the next phase.
Based on the identified traffic flow, the decision to extend the duration of
the green signal is made. The reduction of green signal duration is not
considered in this approach. On the other hand, Askerzada et al [6]. determine the traffic flow pattern based on the
measured number of vehicles and adjust the duration of the green signal
accordingly. Traffic signal control using fuzzy techniques allows for more
flexible control in dynamic traffic environments. However, fuzzy control models
incur significant overhead as the fuzzy control rules change and are generated
with the changing environment. Therefore, research on traffic signal techniques
using reinforcement learning, such as Q-learning, is also being conducted. The
Q-learning (QL) technique learns through reinforcement learning to find the
optimal policy. QL has the advantage of not requiring a pre-defined environment
model, making it suitable for dynamic traffic environments. Research on signal
control at intersections using QL can be divided into single intersection
studies and studies that consider multiple intersections together. Single
intersection studies focus on obtaining learning experiences in a single
environment and determining useful ranges for various parameters. The order of
green signals is fixed, and the duration of green signals is adjusted through
learning. Chin et al [7]. considered the queue
length as a parameter and aimed to always have the fewest vehicles waiting at
the intersection. The queue length represents the length of vehicles waiting in
the intersection lane. Abdulhai et al [8,9,10].
considered the queue length and the time it takes for vehicles to exit the
intersection. They aimed to minimize traffic delay by reducing the deviation in
queue length. While studies on signal control at single intersections are
important, intersections are connected and influenced by adjacent
intersections. Therefore, studies on signal control considering multiple
intersections are being conducted. Multiple intersection studies involve
considering various variables due to the consideration of multiple
intersections. Khamis et al [11,12,13,14,15]. proposed
a system that minimizes travel time between multiple intersections. The travel
time refers to the time taken from the origin to the destination. The system
also pursues a green wave, which gradually turns on three or more consecutive
traffic signals for a progressing group of vehicles, allowing them to pass
through intersections without stopping. This enables vehicles to maintain speed
and minimize fuel consumption. Chin et al [16,17,18,19,20].
distribute appropriate green signal timings according to the situation by
extending or reducing the duration of green signals at multiple intersections.
This adaptive signal control technique aims to minimize queue length.
Comparative studies on various intersections analyzed and adjusted the duration
of green signals based on a fixed signal order. However, since intersections
are configured consecutively, adjacent intersections affect each other. If the
order of signals can be flexibly changed according to the situation, more
efficient traffic signal control can be achieved.
3. Deep Reinforcement Learning
Traffic signal controllers with fixed timings are
typically defined by different cycle profiles and are observed over time as
they alternate, attempting to handle the various traffic flows that commonly
occur. Some of these methods are defined by mathematical models that use
calculus, linear programming, and other optimization algorithms such as
Webster, GreenWave [21,22,23], and Maxband [24,25,26]. Other methods involve using traffic
simulators to build traffic models. For example, Rouphail et al [27]. minimized link delays and queue times using a
genetic algorithm (GA) applied with the CORSIM simulator, for a 9-intersection
network. However, the results were limited due to the slow convergence of the
GA algorithm. Traffic controllers have started using models that optimize
various traffic metrics by utilizing sensor data. This enables them to better
adapt to changes in traffic flow as following;
- -
- Max-pressure aims to maintain balance in the queue length of adjacent intersections. The pressure of a phase is defined as the difference in queue length between incoming and outgoing lanes. Minimizing the pressure of a phase maximizes the throughput of the system, according to Max-pressure algorithm.
- -
- SCATS (Sydney Co-Ordinated Adaptive Traffic System) repetitively selects the next signal plan from a predefined set of plans based on the current traffic conditions and predefined performance measures. The model infers the performance of all plans before each cycle and then chooses the plan with better performance.
- -
- RHODES is a hierarchical system that predicts the traffic load on each link and allocates phase time according to the predictions, and Liu, et al. developed a controller that identifies upstream and downstream vehicles, in intervals of 15 minutes, to measure their delay and then choosing a signal timing plan that minimizes it.
- -
- Tan, et al. developed a traffic controller that senses the number of incoming vehicles and uses fuzzy logic to determine the green time of a single intersection, and Lee, et al. also used a fuzzy logic controller but in multiple intersections. The controller takes decisions based on vehicle data of adjacent junctions.
While such systems generally outperform
fixed-timing controllers, they have been tested in very simplistic scenarios.
They cannot adapt well to real-world urban traffic with complex dynamics, such
as multi-intersection or heterogeneous traffic flow. Recently, reinforcement
learning has become popular in building traffic signal controllers as agents
can learn traffic control policies by interacting with the environment without
predefined models. The reinforcement learning framework naturally fits the
traffic signal controller problem, with the traffic controller as the agent,
traffic data as the state representation, and phase control as the agent's
actions. Various learning models have been explored to build traffic signal
controllers. However, comparing proposed solutions and results is challenging
due to significant variations in problem definitions across literature. We
offer the adoption of a Deep Reinforcement Learning (DRL) approach to address
the traffic control problem.
3.1. CRL (Classic Reinforcement Learning)
The main distinction in different reinforcement
learning approaches lies in whether there is a need to learn the transition
probability function P. In model-based methods, the agent learns a
transition model that estimates the probability of transitioning between given
states given possible actions, and then calculates the expected rewards for
each transition. The value function is then estimated using dynamic
programming-based methods, and decisions are made based on this estimation.
Model-based methods require learning P and the reward function R,
while model-free methods skip this step and learn by interacting with the
environment and directly observing rewards. They perform value function or
policy updates by interacting with the environment and directly observing
rewards. Learning the transition probability function in the context of traffic
control problems implies modeling an environment that can predict metrics such
as vehicle speed, position, and acceleration. Wiering [28] used a model-based approach in a multi-agent
model operating in a network of six controlled intersections, where each
controller receives the discretized positions and destinations of each vehicle
on approach lanes, resulting in 278 possible traffic situations. The defined
RL-controller performs better than simpler controllers such as fixed-time and
Longest Queue First (LQF), assuming that each vehicle can communicate with each
infeasible signal controller. Additionally, since all distances have the same
number of lanes, the network is simplified, resulting in unrealistic
homogeneous traffic patterns. Our research also mentions the possibility of
having smarter driving policies to avoid congested intersections when previous
communication is assumed to be possible. Some research have attempted a
model-based approach, but most of the research community adopts a model-free
approach due to the difficulty of fully modeling the unpredictable behavior of
human drivers when considering their natural and unpredictable actions. Most tasks
that use a model-free approach rely on algorithms such as Q-learning and SARSA
to learn optimal traffic control policies. Thorpe et al. [29] built a model-free system using SARSA and
compared the performance of three state representations: volume, presence, and
absence. By dividing each lane in each section of the network into
equal-distance intervals or unequal-distance intervals, vehicles can be
controlled. The RL model outperformed fixed-time and maximum volume controllers
regardless of the state representation used, and the unequal-distance intervals
state representation outperformed the other two state representations. Previous
reinforcement learning-based controllers were applied to single intersections
because the state space exponentially increases with the number of controlled
intersections. Considering that a single intersection model is overly
simplified and cannot estimate traffic at the city level, other studies aimed
to apply reinforcement learning to multiple traffic intersections by constructing
multi-agent models.
3.2. MRL (Multi-Agent Reinforcement Learning)
In a MA(Multi-agent setting), each agent controls
one intersection in a traffic network with multiple intersections. This
approach minimizes the explosion of the state space by allowing each agent to
operate in a small partition of the environment. In a non-cooperative approach,
each agent seeks to maximize specific rewards, such as queue lengths or
cumulative delays, using the state representing their respective intersections.
This is commonly referred to as Independent Learners (IL).
Independent Learners. The initial
systems consisted of independent learners (IL) and a small number of
intersections, where smaller intersections performed better. However, over
time, researchers were able to adapt IL to larger road networks. Camponogara et
al [30,31,32,33]. developed a multi-agent system
based on Q-learning and modeled it as a distributed stochastic game. They
applied the system to a simple network with two intersections and compared it
to random and Longest Queue First policies. The proposed multi-agent model
showed significant performance improvement compared to the other two policies.
However, the agents did not collaborate, and the proposed scenario was very
simplistic. Aslani et al [34,35,36]. controlled
50 intersections in Tehran using well-known reinforcement learning models,
Actor-Critic, and the classic tile coding for function approximation. Mnih et
al [37,38,39]. introduced Deep Q-Network (DQN) in
the Atari Learning Environment (ALE) domain. This approach uses deep neural
networks to estimate the Q-function and utilizes a replay buffer to store
experiences defined by tuples, which serve as inputs to the neural network. DQN
quickly adapts to outperform a baseline by controlling a single intersection in
the ATSC. Chu et al. verify that DQN-based IL performs under a greedy algorithm
that selects the phase with the highest vehicle count. DQN-IL also fails to
perform even simpler Q-learning counterparts for a network of 4 intersection
roads. These results suggest a trade-off between size and performance.
Collaborative Learners. In an
environment where the actions of one agent can affect other agents at nearby
intersections, having isolated self-interested agents that only seek to
maximize their own gains at their own intersections can improve local
performance for some agents but may lead to a degradation of global
performance, especially when dealing with large-scale networks. Therefore,
efforts are made to maximize global performance through some form of
collaboration or information sharing among agents. A naive approach is simply
adding information about every other intersection to the state space. However,
this leads to an exponential growth as the number of intersections increases
and becomes infeasible for larger networks. Thus, a key challenge in
multi-agent settings is to implement coordination and information sharing among
agents while maintaining a manageable size of the state space. There are two
types of cooperative MARL (Multi-Agent Reinforcement Learning) systems related
to this task. Joint Action Learners (JAL) explicitly construct models for
coordinating the actions of agents, and coordination graphs are one form of JAL
that has been applied to reinforcement learning-based adaptive traffic signal
control [40]. Kuyer et al. designed a
vehicle-based model similar to the model-based approach by Wiering using the
GLD (Green Light District) simulator [41]. The
system achieved coordination using the coordinate graph algorithm called
Max-Plus [42]. The proposed model was compared
with the original Wiering model, and the extension created by Steingröver added
congestion bits to the state space [43,44,45].
The designed model outperformed other models in both small-scale (4
intersections) and large-scale (8-15 intersections) networks. Van der Pol
applied a deep learning approach in both single and multi-agent settings. The
learning agents used the DQN (Deep Q-Network) algorithm with binary matrices as
inputs representing whether a vehicle is present at a specific location. For
single intersection networks, the DQN agents showed better stability and
performance compared to the baseline agent using linear approximation.
Collaborative multi-agent systems have been shown to overcome the curse of
dimensionality in dealing with complex traffic networks, outperforming
fixed-timing, single RL agent, and non-collaborative multi-agent RL models.
However, most of the tasks rely on directly adding information about other
agents to the state representation, which typically leads to state space
explosion or utilizes coordination graph approaches such as the Max-plus
algorithm that exploits the spatial locality of agents. The actual
effectiveness of such coordination methods is difficult to ascertain as each
task defines different state-action representations and test scenario sets.
This work is inspired by where a fixed MDP formulation is used to compare
traffic controllers. The methodology inspired by Varela is used for
experimental setup and evaluation to ensure fairness.
4. Proposed Research System
The proposal of this study emphasizes the
importance of adhering to a rigorous methodology in order to enable experiment
reproducibility and result comparison based on the traffic conditions in Korea.
The methodology employed is a slightly adapted version of Varela, which is a
reinforcement learning-based adaptive traffic signal control methodology for
multi-agent coordination. While the existing methodologies for independent
learners consist of four steps, this study extends it to two additional steps,
namely MDP formulation and RL method, as distinct components. The five steps
include simulation setup, MDP formulation, RL method, training, and evaluation
as followings in Figure 1.
Since Markov Decision Process (MDP) defines the
optimization problem, meaningful comparisons between different reinforcement
learning methods require the same underlying MDP. Moreover, the MDP formulation
can have a decisive impact on the performance of the reinforcement learning
model. This has been demonstrated by keeping the learning algorithm fixed and
altering the underlying MDP formulation. In this study, we keep the underlying
MDP fixed and test different baselines and RL-based methods, evaluating
separate function approximations, adjustment methods, and observation scopes.
4.1. Simulation Domain Setup
The first step of the proposed methodology is
simulation domain setup, which is composed based on the choice of traffic
conditions. A realistic modeling is used for the agent to train and learn
effective traffic control policies, defining the network topology used in the
simulator, and specifying the traffic demand, which is derived from Suncheon
City in Korea. Unlike traffic macro simulators that simulate the overall
traffic flow, traffic micro modeling simulate individual vehicle attributes
such as position, velocity, acceleration, route, and emission rate for each
vehicle from real environment. These have been used to evaluate current traffic
controllers and prototype new traffic controllers, and can be used in the
context of reinforcement learning to model the environment in which the agent
learns traffic policies in Figure 2.
4.2. MNT(Motorway Networks Topology)-Based MDP Formulation
It is possible to extract the network from
real-world locations. By leveraging available open-source services, it is
feasible to export parts of urban areas, and by preparing this information
during the simulation setup phase, it can be provided to the simulator, opening
up the possibility to simulate a rich set of networks related to real traffic
signal control.
Unfortunately, Real-world data can generate
realistic traffic demands that match actual observations, reducing the gap
between the simulator and the deployed traffic controllers in the real world.
However, this data needs to be validated before being used and the setup
process can be complex as it is often specific to the network. Acquiring such
data can be challenging, and it may be noisy or even unavailable. Therefore,
data-driven traffic demands fall outside the scope of this research.
MDP (Markov Decision Process) consists of state
features, reward signals, action schemes, and observation scope. A group of
collaborating multi agent-based DRL is defined by a MDP that accounts for the
lack of observability and interactions. The MDP is defined by the tuple is
shown as Equation (1) in Figure 2.
State space S (s∈S) is represents the state at time
t, composed of features of incoming approaches at intersections. In this
research, The equation is described by feature maps ϕ(s) composed of data on internal states
and incoming approaches by shown as Equation (2).
The internal state is defined by the index of the
current green phase, , where P is the number of phases, and the
time since this phase has been active, . The feature on the incoming approaches of any given agent n
at phase p is defined by the cumulative delay by shown as Equation (3).
Here, is the speed of the vehicle in the incoming
approach of step p for the agent, and is the speed limit for step r. No delay
occurs if all vehicles travel at the speed limit for each step, or if there are
no vehicles in a step. If a vehicle travels slower than the speed limit, the
delay becomes positive until it reaches the maximum stop (v = 0), and
the delay becomes a maximum of 1. Mostly, this choice was influenced by the
research done by Pedro theory.
4.3. DRL (Deep Reinforcement Learning) Approaches
The DRL (Deep Reinforcement Learning) method
consists of learning algorithms with different function approximation methods,
adjustment methods, and observation scopes. In this task, agent coordination is
achieved using the QL algorithm for the domain and some of its variations. It
should be noted that (i) the QL algorithm receives a discrete state space, so
it is necessary to discretize the state defined in the previous MDP formula.
(ii) In this algorithm, each intersection must share its state and behavior
during training and share its state during execution.
Deep QL (Deep Q-Learning) is a type of
reinforcement learning that explores a non-deterministic environment and
selects the best action based on experience. Deep QL learns based on the
concepts of state, action, and reward. When time is denoted as t, the situation
of the environment is defined as a state (). When an action () is taken in a state, a reward () is given, and the system transitions to the next
state () by shown as Equation (4).
The set of states for a total of n states
and m actions is represented by equation (5), and the set of actions is
represented by equation (6). Each state, action, and reward has a Q-function,
denoted by equation (7).
Q: S X A → R
The learning values in Deep Q-Learning are stored
in a Q-table. In this case, the value is obtained from the maximum value among
the values for the current state, action, and reward () and the new state ( Q(, )). This is done using the learning rate (lr, α)
and the discount factor (df, γ) by shown as Equation (8).
In general, Deep Q-Learning involves exploration, where actions are chosen based on the state and reward. When selecting actions, occasionally trying out new actions can lead to better results rather than solely relying on the actions that yield the highest immediate rewards. Therefore, the concept of exploration with randomness is applied, known as epsilon-greedy selection. This research proposes a traffic signal control system using Deep Q-Learning in a multi-intersection setting. Each intersection is equipped with a local agent (), and each agent independently performs Deep Q-Learning based on the time information of the waiting vehicles from neighboring intersections that are aiming to enter the respective intersection. Accordingly, we have our research approaches for it, during training, certain procedures of simulations and algorithm rely on random number generators. Simply changing the seed of these generators can statistically induce significant differences in the performance of the implemented traffic controllers. Due to this variance, multiple independent training runs are seeded for each controller, and the results are averaged across each controller to obtain performance outcomes that reflect how the traffic controller actually performs. These random seeds also allow for complete replication of all experiments. The DRL process involves exploration and exploitation phases, where congestion can occur in the network during simulations, preventing vehicles from moving through the road network. This can happen more frequently during the exploration phase, where actions are randomly selected by the agent. When congestion occurs, the agent halts learning, and the simulation essentially comes to a halt. To avoid congestion, the reinforcement learning task is episodic, where the simulator is reset after a set time to prevent unfavorable outcomes from persisting indefinitely. There are two main performance metrics and two auxiliary performance metrics. The reason for the reward to increase during training is to allow the agent to make better decisions and indicate that the generated policy, such as in deep reinforcement learning models like DQN, is approaching stable state preservation. The other two auxiliary metrics are the average number of vehicles in the road network and the average speed. As training progresses, the agent should be able to make better decisions reflecting a decrease in the average number of vehicles in the network as it becomes more dispersed and an increase in average speed in Figure 3.
Here, the state of DQL (Deep Q-Learning) is defined as the number of available directions for vehicles to move at a given intersection. For example, in Figure 4, it is a 4-way intersection with 4 adjacent directions. Each direction at a 4-way intersection allows for left turns and straight movements. Therefore, the state of a 4-way intersection can be classified into 8 categories (( S= {}). The actions in the proposed DQL consist of the possible actions to take at the intersection, and there are three action sets as shown in Figure 5 (A = {}).
At time t, the reward () of the local agent at an intersection is composed of the throughput () and the average waiting time (wt) of adjacent intersections, as shown in Equation 9. The throughput represents the number of vehicles processed at intersection i within a unit time, while the waiting time is the average waiting time of vehicles at intersection i and its adjacent intersections. The weights (α) are used to adjust the importance of throughput and waiting time, with w greater than 1 and ξ defined between 0 and 1.
5. Discussion
This research paper proposes a traffic signal control method using Deep Q-learning for multi-intersection of motorway of Suncheon City in Korea. The objective of this research is to maximize the throughput and minimize the waiting time at intersections through collaboration with neighboring intersections. To evaluate the performance of the proposed system, it is compared with fixed-time signal control and adaptive signal control methods. The results show that when using DRL-TCS (Deep Reinforcement Learning Traffic Control System) on 4 neighboring intersections, the proposed method outperforms in terms of average queue length, throughput, and waiting time. However, for larger intersections, using only a distributed approach may not be sufficient for traffic control. Therefore, further research on a deep learning-based traffic signal method that combines distributed and centralized approaches is needed to address this limitation.
Author Contributions
Y.J.O is an expert in the field of artificial intelligence, augmented reality, metaverse and intelligent vehicle research, actively participating in various national projects in Korea. She contributes to algorithm development and conducts experiments using simulations. She has granted permission for the publication of the manuscript.
Institutional Review Board Statement
Not applicable.
Informed Consent Statement
Not applicable.
Data Availability Statement
Not applicable.
Conflicts of Interest
The authors declare no conflict of interest.
References
- Xiaofeng Liu, Ben St. Amour and Arunita Jaekel. A Reinforcement Learning-Based Congestion Control Approach for V2V Communication in VANET. Appl. Sci. 2023, 13, 3640. [CrossRef]
- Dimitrakopoulos, G.; Demestichas, P. Intelligent transportation systems. IEEE Veh. Technol. Mag. 2010, 5, 77–84. [Google Scholar] [CrossRef]
- Society of Automotive Engineers. SAE J2735: Dedicated Short Range Communications (DSRC) Message Set Dictionary; Technical Report; Society of Automotive Engineers: Warrendale, PA, USA, 2009.
- Bansal, G.; Lu, H.; Kenney, J.B.; Poellabauer, C. EMBARC: Error model based adaptive rate control for vehicle-to-vehicle communications. In Proceedings of the Tenth ACM International Workshop on Vehicular Inter-Networking, Systems, and Applications, 2013, Taipei, Taiwan, 25 June 2013; pp. 41–50.
- Ogura, K.; Katto, J.; Takai, M. BRAEVE: Stable and adaptive BSM rate control over IEEE802. In 11p vehicular networks. In Proceedings of the 2013 IEEE 10th Consumer Communications and Networking Conference (CCNC), Las Vegas, NV, USA, 11–14 January 2013; pp. 745–748. [Google Scholar]
- F. Sivrikaya, N. Ben-sassi, X. Dang, O. Can Gorur, and C. Kuster, “Internet of smart city objects: a distributed framework for service discovery and composition. J. IEEE Access 2019, 7, 14434–14454. [CrossRef]
- B. Jang, M. Kim, G. Harerimana, and J. Kim, “Q-learning algorithms: a comprehensive classification and applications,”. J. IEEE Access 2019, 7, 133653–133667. [CrossRef]
- X. Liang, X. Du, G. Wang, and Z. Han, “A deep reinforcement learning network for traffic light cycle control,”. J. IEEE Trans. Veh. Technol. 2019, 68, 1243–1253. [CrossRef]
- H. Nguyen, L. Kieu, T. Wen, and C. Cai, “Deep learning methods in transportation domain: a review,”. J. IET Intell. Transportation Syst. 2018, 12, 998–1004. [CrossRef]
- Subramaniam, M.; Rambabu, C.; Chandrasekaran, G.; Kumar, N.S. A Traffic Density-Based Congestion Control Method for VANETs. Wirel. Commun. Mob. Comput. 2022, 2022, 7551535. [Google Scholar] [CrossRef]
- Sharma, S.; Panjeta, M. Optimization transmit rate-based decentralized congestion control scheme in vehicular ad hoc networks. AIP Conf. Proc. 2022, 2555, 030006. [Google Scholar]
- LucasV.Bonfati,José J. A. Mendes Junior,Hugo Valadares Siqueira and Sergio L. Stevan, Jr., Correlation Analysis of In-Vehicle Sensors Data and Driver Signals in Identifying Driving and Driver Behaviors. Senors 2023, 23, 263.
- Rodrigues, J. G. P.; Vieira, F.; Vinhoza, T. T. V.; Barros, J.; Cunha, J. P. S. A non-intrusive multi-sensor system for characterizing driver behavior. In Proceedings of the 13th International IEEE Conference on Intelligent Transportation Systems, Funchal, Madeira Island, Portugal, 19–22 September 2010; IEEE: Madeira Island, Portugal, 2010; pp. 1620–1624, 2010. [Google Scholar]
- Rebolledo-Mendez,G.; Reyes, A.; Paszkowicz, S.; Domingo, M. C.; Skrypchuk, L. Developing a Body Sensor Network to Detect Emotions During Driving. IEEE Trans. Intell. Transp. Syst. 2014, 15, 1850–1854. [CrossRef]
- McCall, J. C.; Trivedi, M. M. Driver Behavior and Situation Aware Brake Assistance for Intelligent Vehicles. Proc. IEEE 2007, 95, 374–387. [Google Scholar] [CrossRef]
- Kim, B.; Baek, Y. NETTED:Non-Standard CANID Extraction System Based on Deep Neural Networks. In Proceedings of the 2018 IEEE 3rd International Conferenceon Communication and Information Systems (ICCIS), Singapore, 28–30 December 2018; IEEE: Singapore, 2018; pp. 198–202. [Google Scholar]
- Martinelli, F.; Mercaldo, F.; Orlando, A. ; Nardone,V.; Santone, A.; Sangaiah, A. K. Human behavior characterization for driving style recognition in vehicle system. Comput. Electr. Eng. 2020, 83, 102504. [Google Scholar] [CrossRef]
- Lu, J.; Filev, D.; Prakah-Asante, K.; Tseng, F.; Kolmanovsky, I. V. From vehicle stability control to intelligent personal minder: Real-time vehicle handling limit warning and driver style characterization. In Proceedings of the 2009 IEEE Workshop on Computational Intelligence in Vehicles and Vehicular Systems, Nashville, TN, USA, 30 March–2 April 2009; IEEE: Nashville, TN, USA, 2009; pp. 43–50. [Google Scholar]
- Filev, D.; Lu, J.; Tseng, F.; Prakah-Asante, K. Real-time driver characterization during car following using stochastic evolving models. In Proceedings of the 2011 IEEE International Conference on Systems, Man, and Cybernetics, Anchorage, AK, USA, 9–12 October 2011; IEEE: Anchorage, AK, USA, 2011; pp. 1031–1036. [Google Scholar]
- Raz, O.; Fleishman, H.; Mulchadsky, I. System and Method for Vehicle Driver Behavior Analysis and Evaluation. U.S. Patent US7389178B2; 17 June 2008. 21,
- Obuhuma, J.; Okoyo, H.; Mcoyowo, S. Real-time Driver Advisory Model: Intelligent Transportation Systems. In Proceedings of the 2018 (IST-Africa) Week Conference (IST-Africa), Gaborone, Botswana, 9–11 May 2018. 11. 22. [Google Scholar]
- Khan, M. Q.; Lee, S. A Comprehensive Survey of Driving Monitoring and Assistance Systems. Sensors 2019, 19, 2574. [Google Scholar] [CrossRef] [PubMed]
- NHTSA. Critical Reasons for Crashes Investigated in the National Motor Vehicle Crash Causation Survey. Traffic Safety Facts Crash Stats 2018. Number:DOTHS812506. Available online: https://crashstats.nhtsa.dot.gov/Api/Public/ViewPublication/812506 (accessed on 10 November 2022).
- Petridou, E.; Moustaki, M. Human Factors in the Causation of Road Traffic Crashes. Eur. J. Epidemiol. 2000, 16, 819–826. [Google Scholar] [CrossRef] [PubMed]
- Lattanzi, E.; Freschi, V. Machine Learning Techniques to Identify Unsafe Driving Behavior by Means of In-Vehicle SensorData. Expert Syst. App l. 2021, 176, 114818. [Google Scholar] [CrossRef]
- Tadano, Y. S.; Potgieter-Vermaak, S.; Kachba, Y. R.; Chiroli, D. M.; Casacio, L.; Santos-Silva, J. C.; Moreira, C. A.; Machado, V.; Alves, T. A.; Siqueira, H.; et al. Dynamic model to predict the association between airquality, COVID-19 cases, and level oflockdown. Environ. Pollut. 2021, 268, 115920. [Google Scholar] [CrossRef]
- Wu, B.; Xuan, K.; Zhang, X.; Wu, Z.; Wang, W.; Shen, X.; Li, X.; Zhang, H.; Cao, X.; Hao, X.; et al. Quantitative of instantaneous BC emissions based on vehicle specific power from real-world driving diesel trucks in China. Sci. Total. Environ. 2022, 819, 153230. [Google Scholar] [CrossRef]
- Mahesh, S.; Ramadurai, G.; Nagendra, S.S. On-board measurement of emissions from freight trucks in urban arterials: Effect of operating conditions, emission standards, and truck size. Atmos. Environ. 2019, 212, 75–82. [Google Scholar] [CrossRef]
- Al Eisaeia, M.; Moridpourb, S.; Tay, R. Heavy Vehicle Management: Restriction Strategies. Transp. Res. Procedia 2017, 21, 18–28. [Google Scholar] [CrossRef]
- Winkler, M.; Fan, W.D. Evaluating impacts on freeway capacity using VISSIM: Accounting for truck lane restrictions, driver behavior, and interchange density. Adv. Transp. Stud. 2011, 25, 15–28. [Google Scholar]
- Siuhi, S.; Mussa, R. Simulation Analysis of Truck-Restricted and High-Occupancy Vehicle Lanes. Transp. Res. Rec. J. Transp. Res. Board 2007, 2012, 127–133. [Google Scholar] [CrossRef]
- Törnell, J.; Sebben, S.; Elofsson, P. Experimental investigation of a two-truck platoon considering inter-vehicle distance, lateral offset and yaw. J. Wind. Eng. Ind. Aerodyn. 2021, 213, 104596. [Google Scholar] [CrossRef]
- Mahnam, S.; Menendez, M. Analysis of strategies for truck platooning: Hybrid strategy. Transp. Res. Rec. 2016, 254, 41–48. [Google Scholar]
- Calvert, S.; Schakel, W.; van Arem, B. Evaluation and modelling of the traffic flow effects of truck platooning. Transp. Res. Part C Emerg. Technol. 2019, 105, 1–22. [Google Scholar] [CrossRef]
- Čičić, M.; Pasquale, C.; Siri, S.; Sacone, S.; Johansson, K.H. Platoon-actuated variable area mainstream traffic control for bot-tleneck decongestion. Eur. J. Control 2022, 68, 100687. [Google Scholar] [CrossRef]
- Piacentini, G.; Pasquale, C.; Sacone, S.; Siri, S.; Ferrara, A. Multiple Moving Bottlenecks for Traffic Control in Freeway Systems; Institute of Electrical and Electronics Engineers Inc.: Naples, Italy, 2019. [Google Scholar]
- Duret, A.; Wang, M.; Ladino, A. A hierarchical approach for splitting truck platoons near network discontinuities. Transp. Res. Part B Methodol. 2019, 132, 285–302. [Google Scholar] [CrossRef]
- Xu, M.; Yan, X.; Yin, Y. Truck routing and platooning optimization considering drivers’ mandatory breaks. Transp. Res. Part C Emerg. Technol. 2022, 143, 103809. [Google Scholar] [CrossRef]
- Xiang Gao, Long Chen, Kuan Wang, Xiaoxia Xiong, Hai Wang, and Yicheng Li, Improved Traffic Sign Detection Algorithm Based on Faster R-CNN, Appl. Sci. 2022, 12, 8948. [CrossRef]
- A Technical Overview of Transportation Electrification. In EPRI Technical Report; EPRI Customer Assistance Center: Dallas, TX, USA; Columbus, OH, USA, 2011. [Google Scholar]
- Qian, K.; Zhou, C.; Allan, M.; Yuan, Y. Modeling of load demand due to EV battery charging in distribution systems. IEEE Trans. Power Appar. Syst. 2011, 26, 802–810. [Google Scholar] [CrossRef]
- Datchanamoorthy, S.; Kumar, S.; Ozturk, Y.; Lee, G. Optimal Time of use Pricing for Residential Load Control. In Proceedings of the 2011 IEEE International Conference on Smart Grid Communications (Smart Grid Communications), Brussels, Belgium, 19–20 October 2011; pp. 375–380. [Google Scholar]
- Choi, S.; Kim, C.; Sung, B. Analysis of Daily Load Patterns Taking into Consideration PEVs Charging Stations in Seoul, South Korea. Energies 2021, 14, 2662. [Google Scholar] [CrossRef]
- Pang, M.Y. Trajectory Data Based Clustering and Feature Analysis of Vehicle Lane-Changing Behavior. In Proceedings of the 2019 4th International Conference on Electromechanical Control Technology and Transportation (ICECTT), Guilin, China, 26–28 April 2019; IEEE: Piscataway, NJ, USA, 2019; pp. 229–233. [Google Scholar]
- Shi, K.; Wu, Y.; Shi, H.; Zhou, Y.; Ran, B. An integrated car-following and lane changing vehicle trajectory prediction algorithm based on a deep neural network. Phys. Stat. Mech. Its Appl. 2022, 599, 127303. [Google Scholar] [CrossRef]
Figure 1.
Proposed Method of Flow Diagram, composed of five processes. MDP is Markov Decision Process and RL is Reinforcement Learning.
Figure 1.
Proposed Method of Flow Diagram, composed of five processes. MDP is Markov Decision Process and RL is Reinforcement Learning.
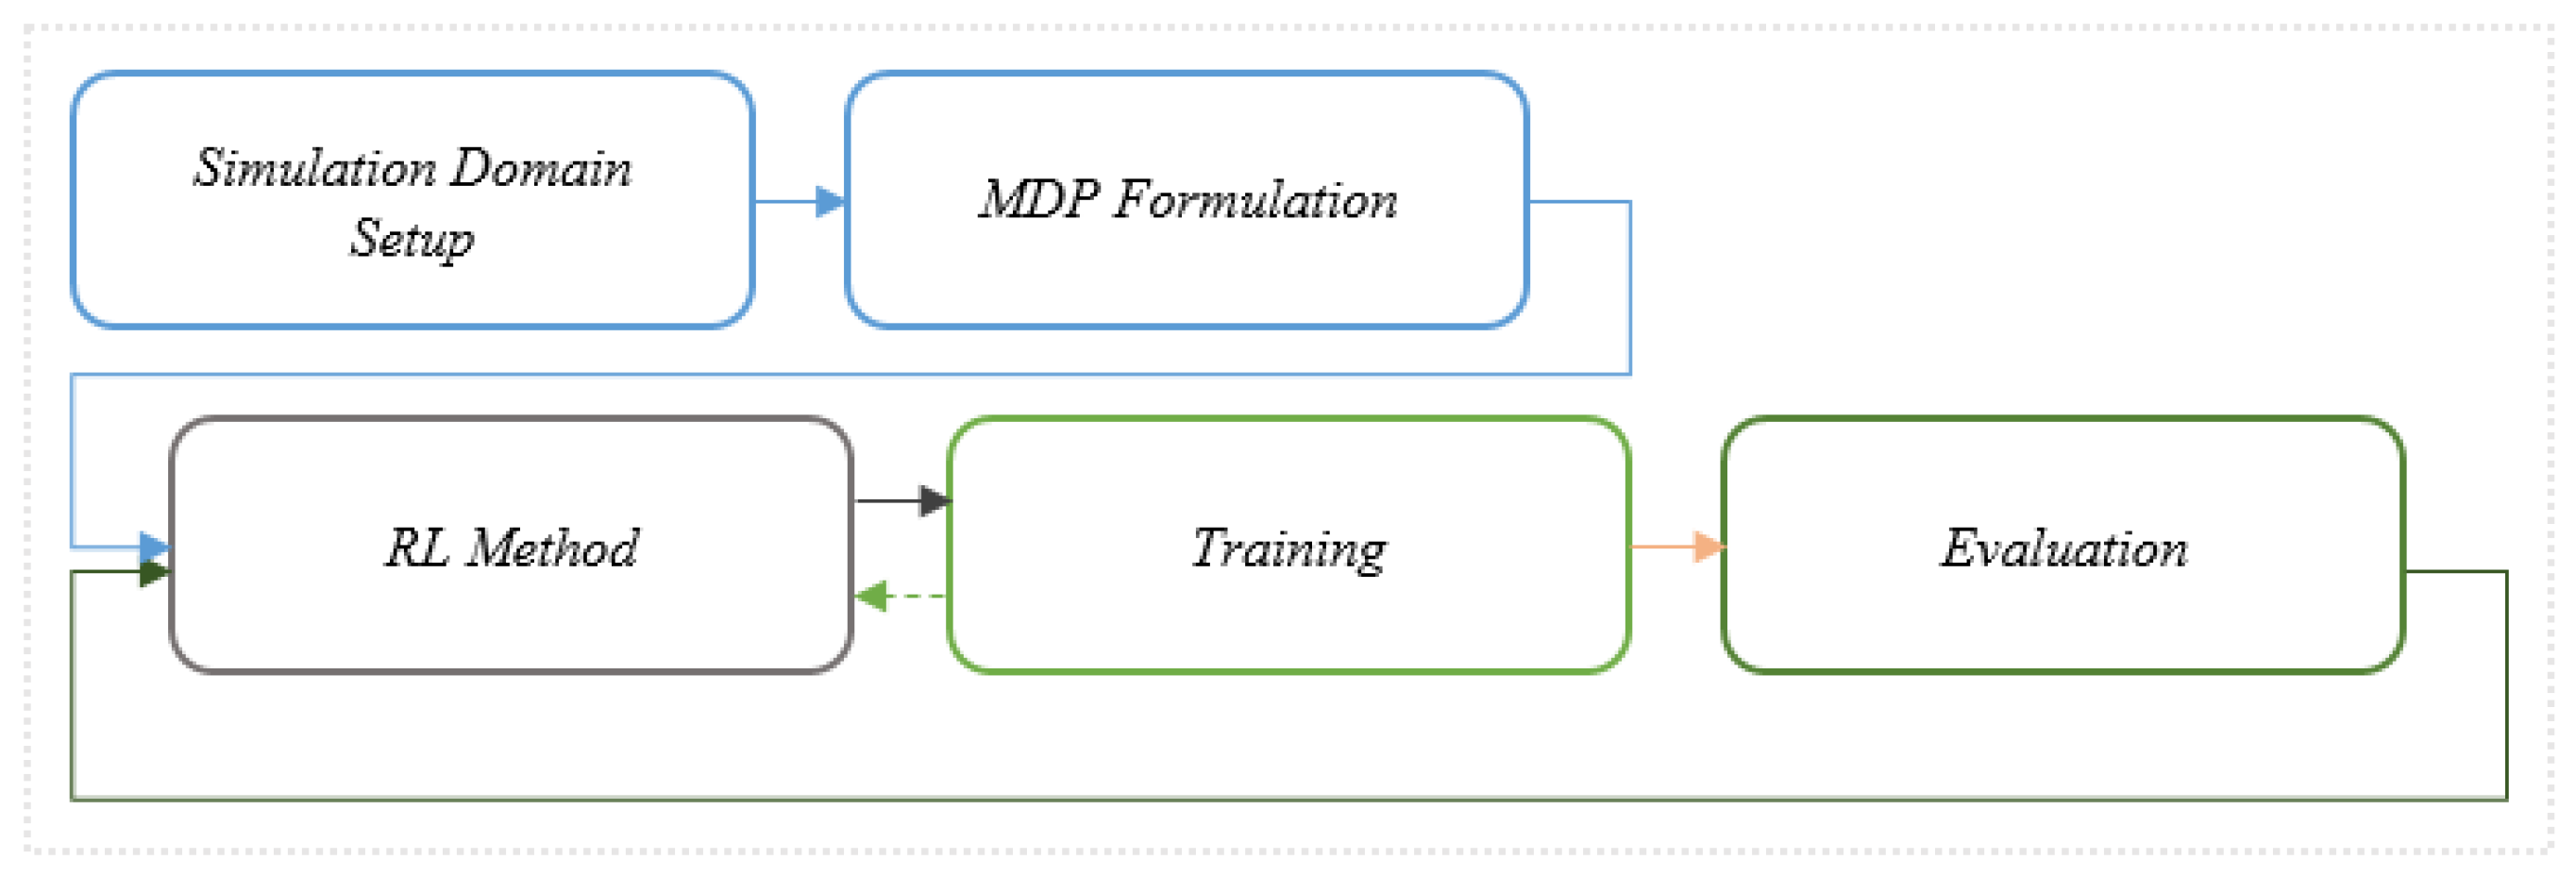
Figure 2.
Suncheon City Traffic Flow from real environment.
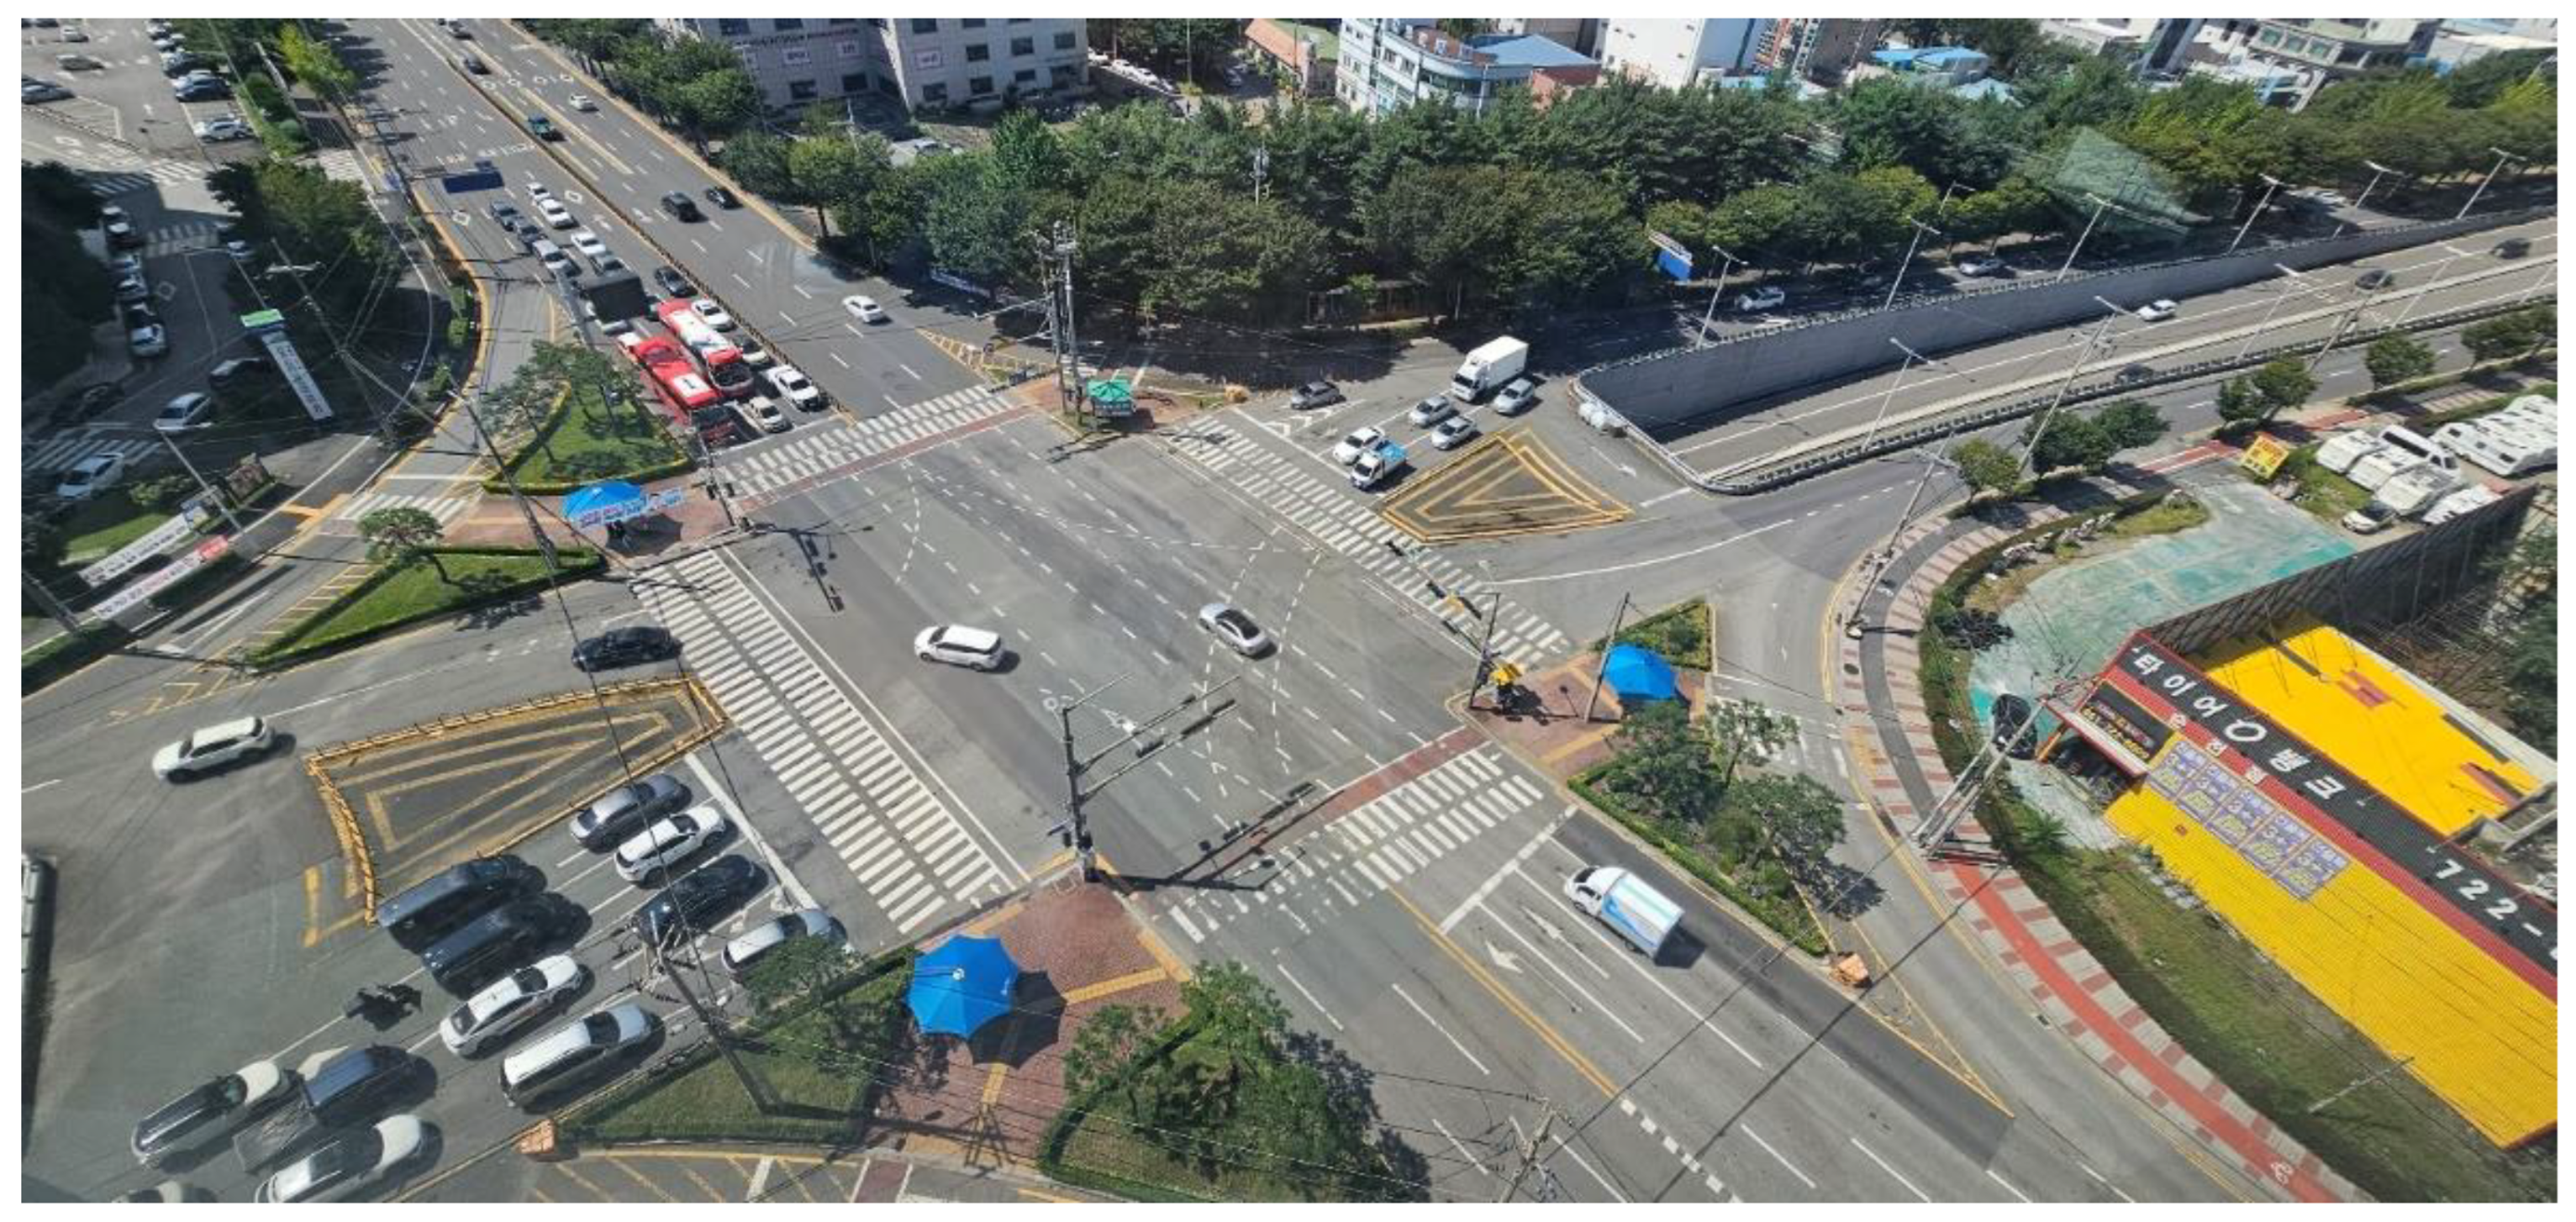
Figure 3.
Training metrics of Suncheon City Traffic Flow by Deep Q-Learning.
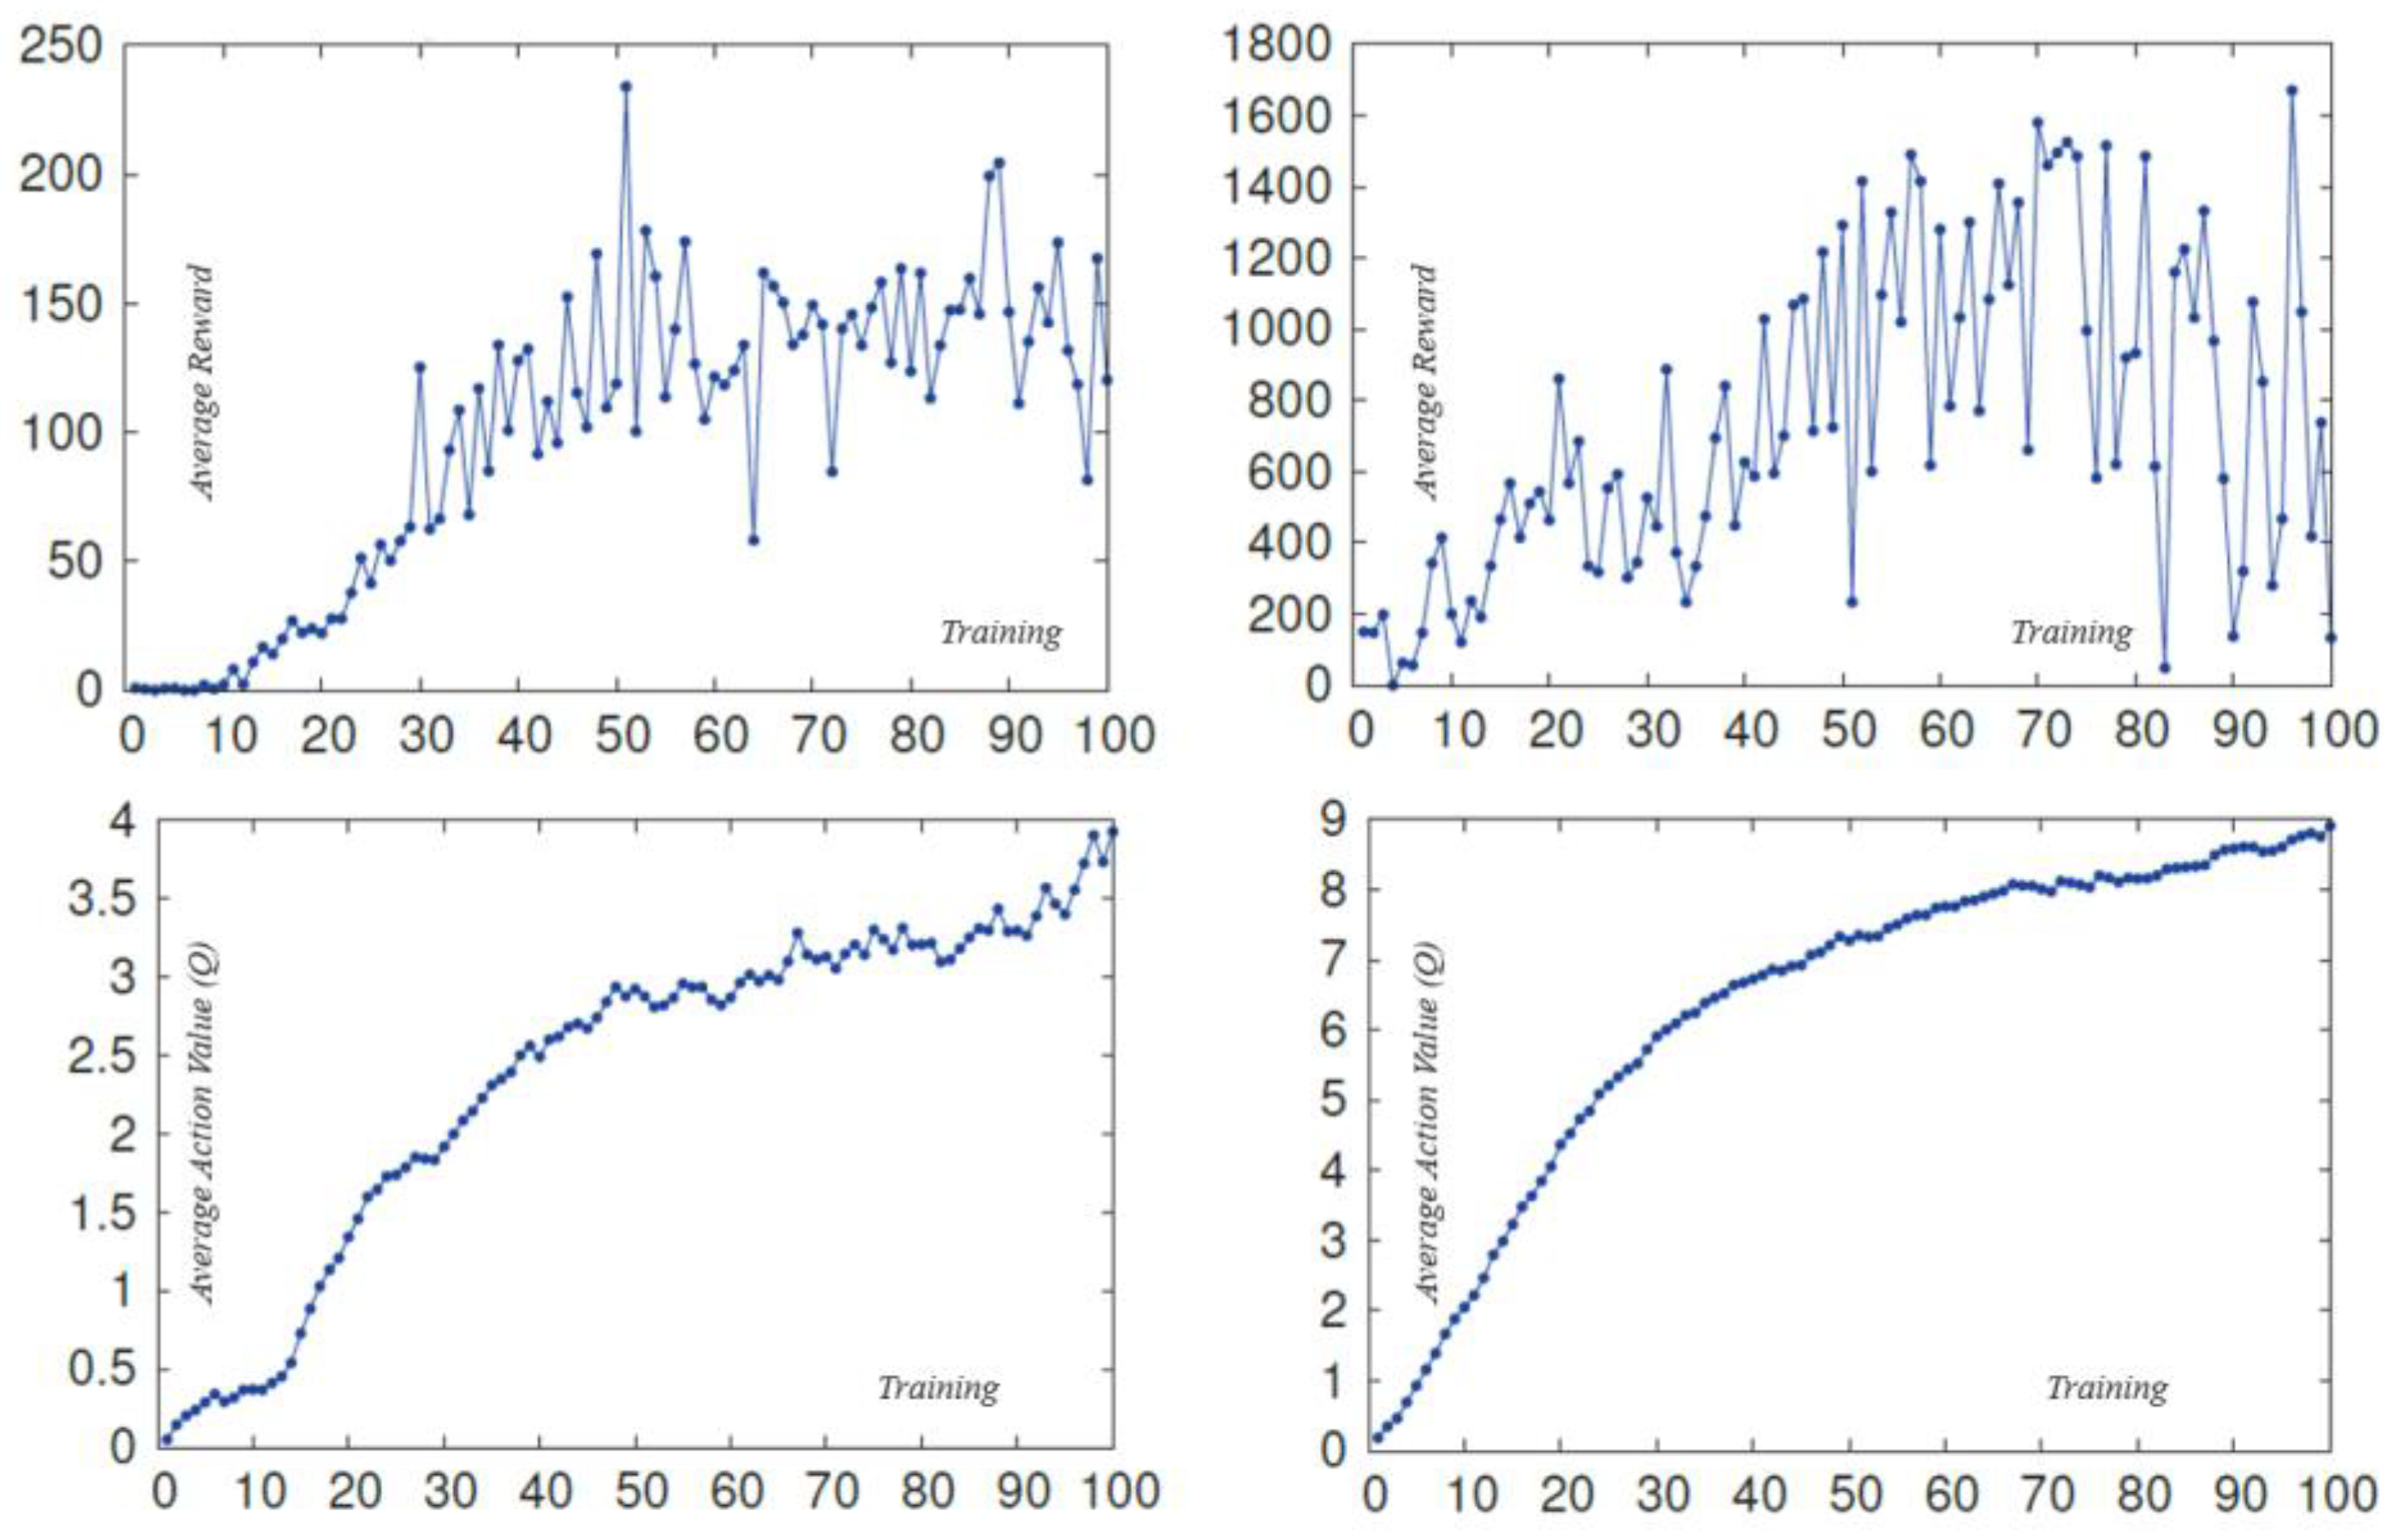
Figure 4.
Adjacent 4 Intersection of Motorway of Suncheon City.
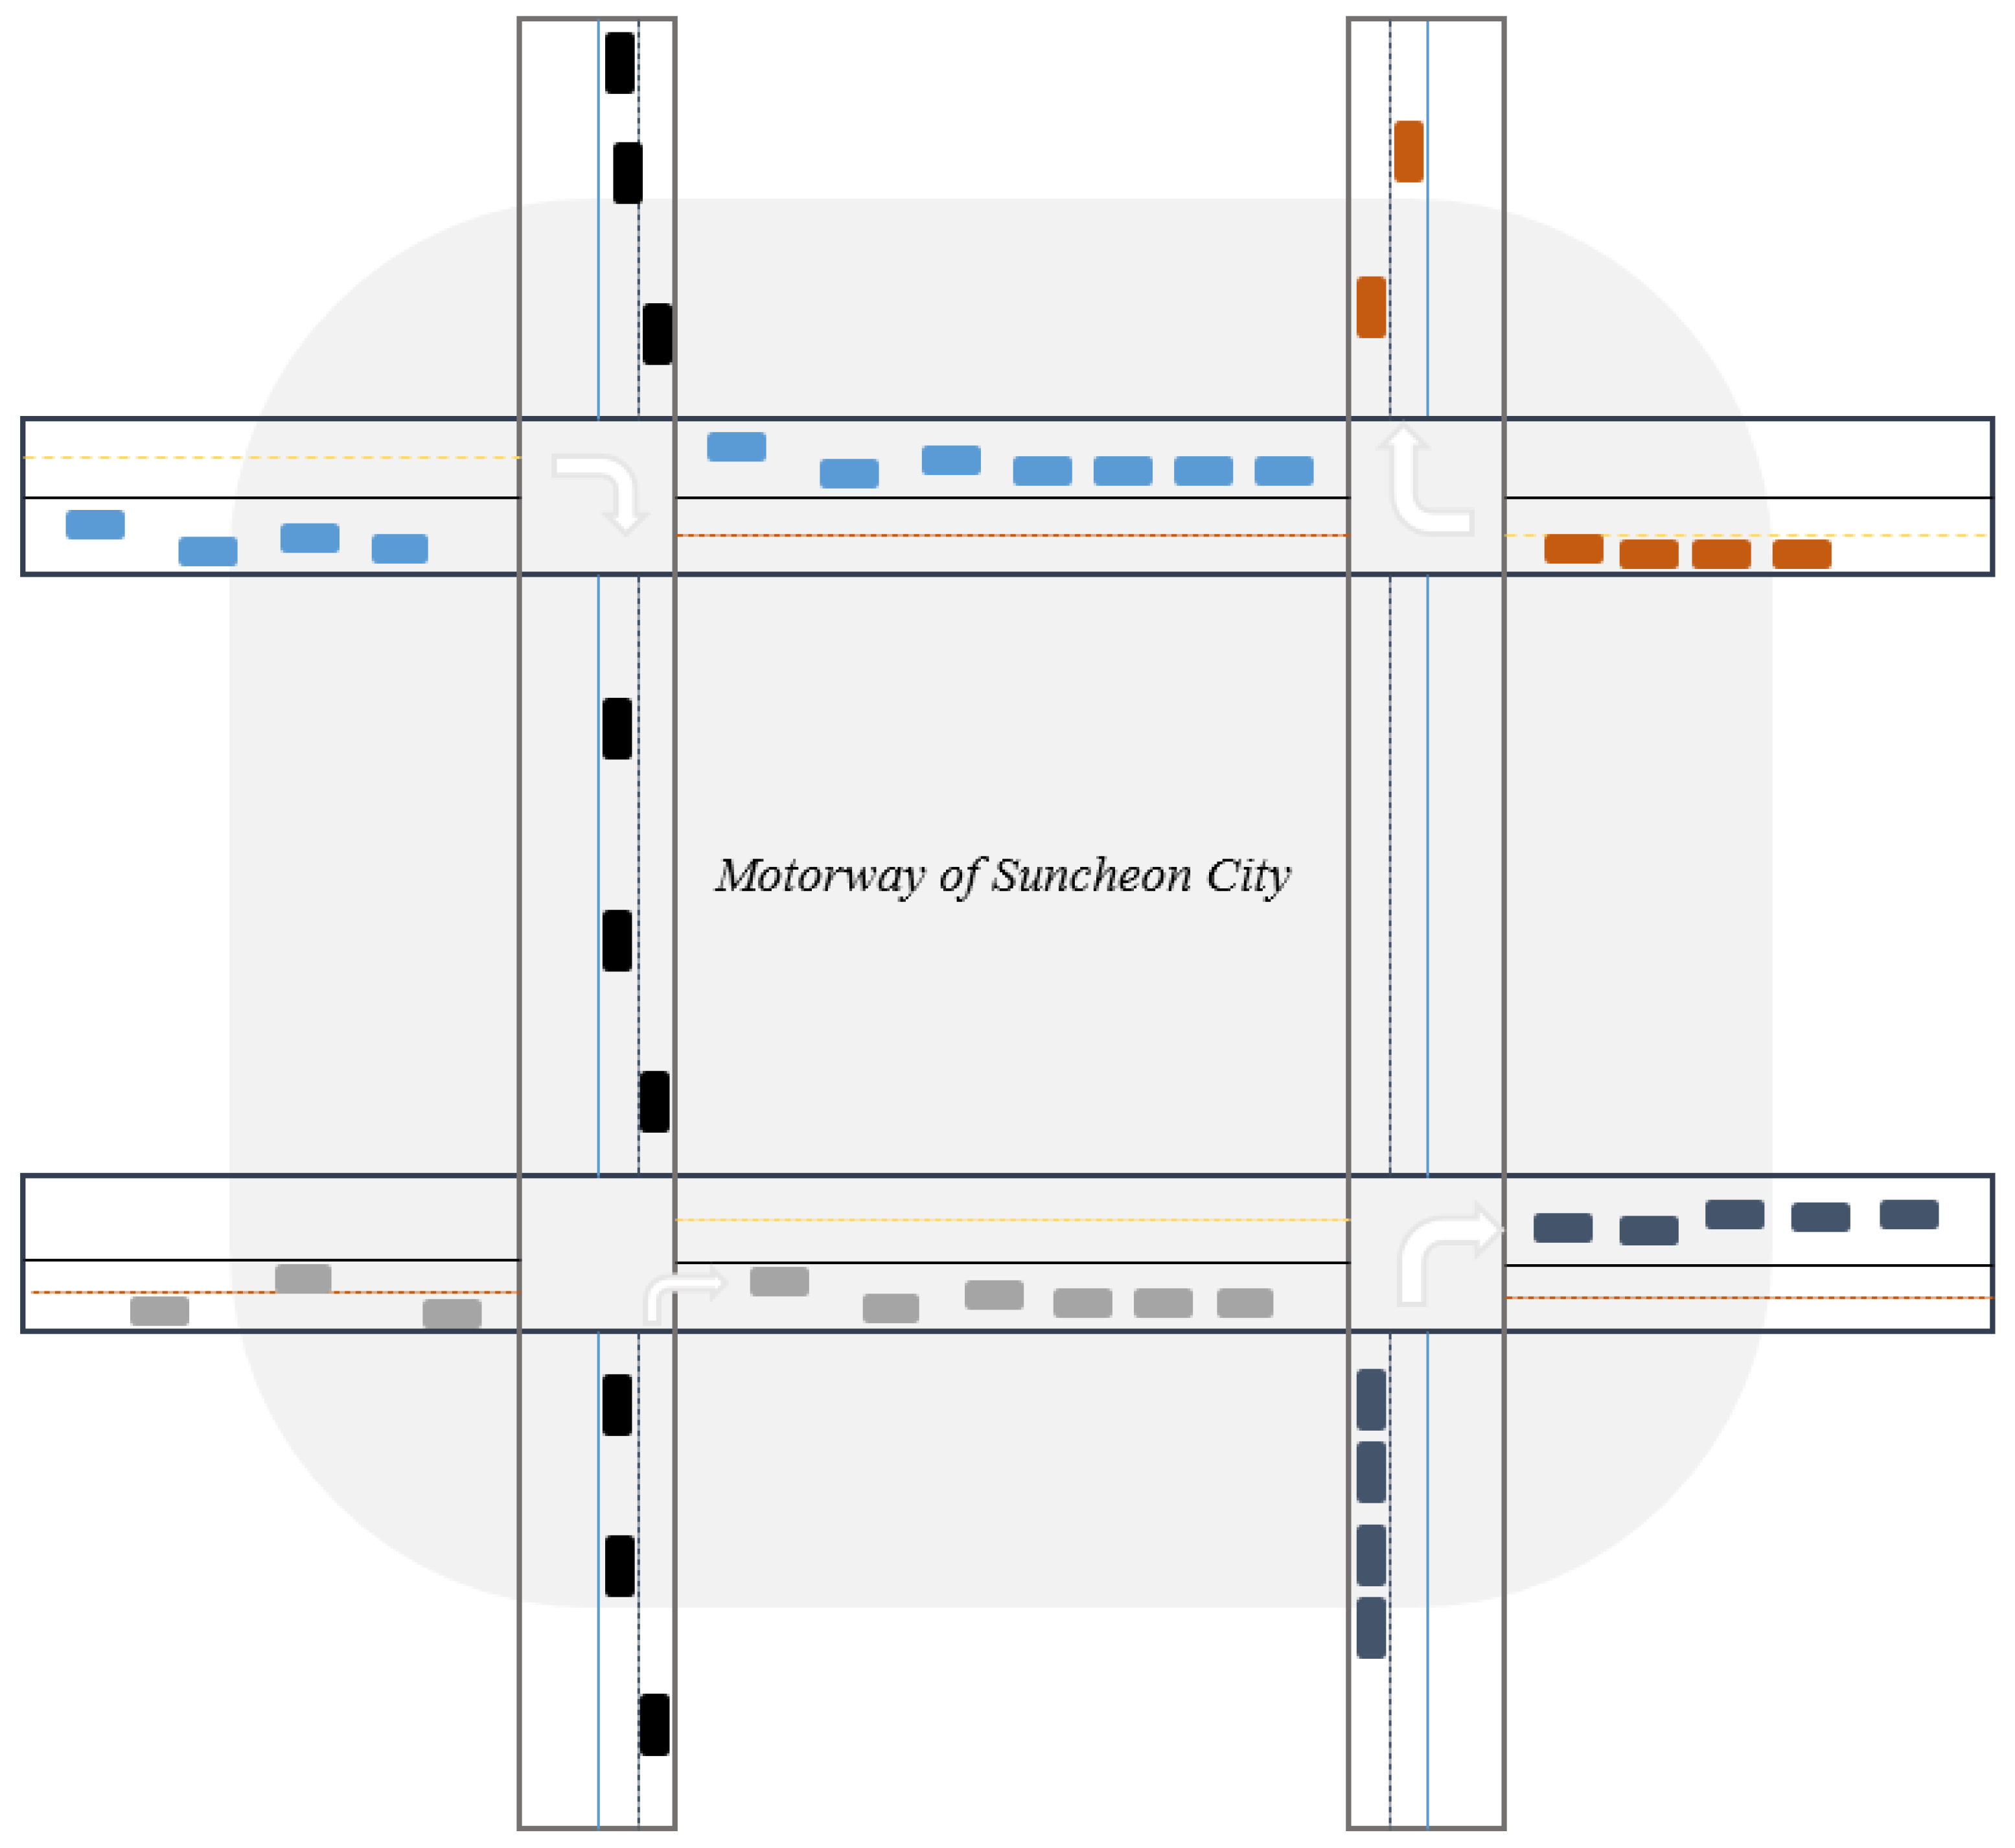
Figure 5.
Action set of Deep Q-Learning.
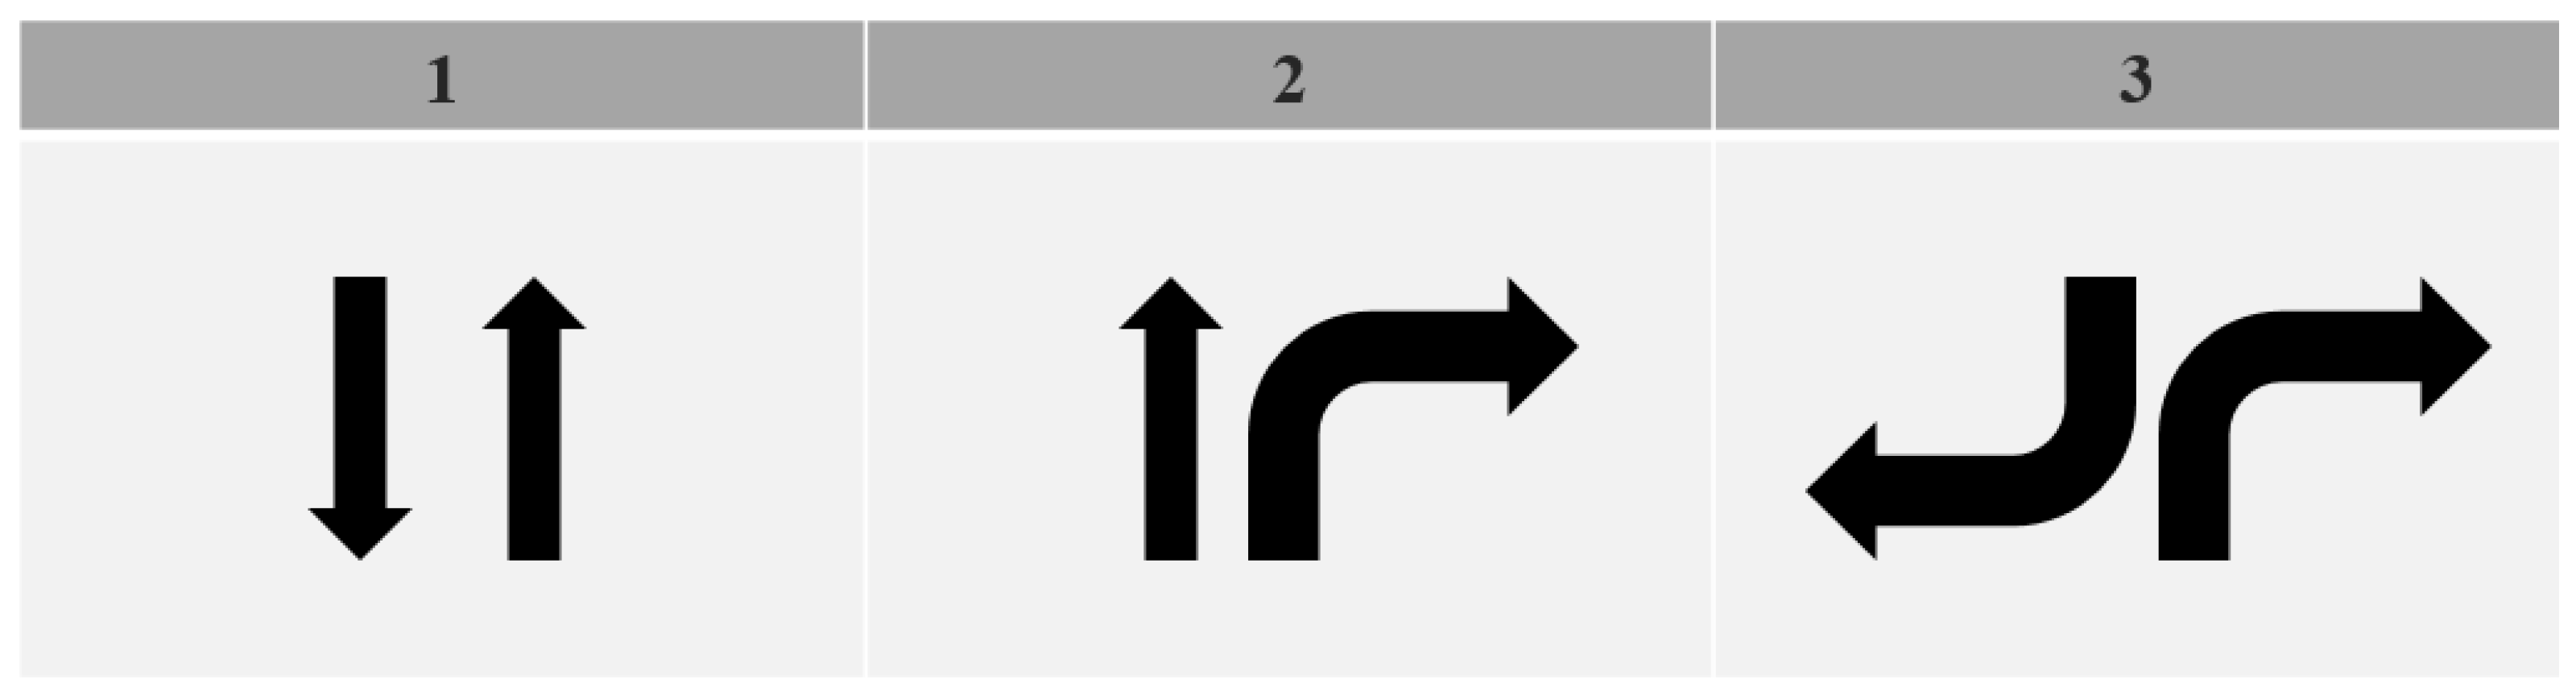

Table 1.
Current trends in strategic products.
| Market status and outlook | Product industry characteristics |
|---|---|
| - (Overseas) The smart mobility market is expected to grow from $33 billion and 31 million in 2019 to $91 billion in 2025. - (Domestic) The smart mobility market is expected to grow from KRW 727.1 billion in 2019 to KRW 2.2 trillion and 20 billion in 2025. |
- The smart mobility ecosystem is being formed, and the portfolio of transportation means is expanding. - Integration and synergy with new trans portation means such as Mobility as a Service (MaaS) and integrated information exchange. |
| Policy trends | Technological trends |
| - (Overseas) Various programs are being implemented, including research and development, and designation of pilot cities for smart mobility on a global scale. - (Domestic) The "Smart City National Strategy Project" is being pursued through research and development, and specific sub-projects in the field of smart mobility (such as the development of smart mobility and parking space sharing support technologies). |
- Establishment of domestic and interna- tional standards for transportation data and communication protocols. - Development of communication inter faces for interconnecting transportation means. - Development of interfaces for mutual in formation sharing between smart mobility service partners and private sector centers. |
| Key players (Companies) | Core technologies |
| - (Overseas) Uber, Grab, GM, Ford, Sie mens, Toyota - (Domestic) KT, Kakao, ESRI, DoctorSoft |
- Real-time traffic guidance system for situational response - Smart technology for traffic accident alerts - Integrated payment system and sharing of smart public transportation information - Real-time traffic information monitoring system based on video/images - Technology for real-time traffic information collection and sharing at lane level - Deep learning-based technology for traffic situation prediction - Technology for automatic detection of traffic accidents and identification of perpetrators/victims using video information |
Table 2.
Smart mobility transportation information system field.
| Back-end industry | Smart mobility transportation information system | Front-end industry |
|---|---|---|
| - Sensor communication - IoT communication - Big data analysis - Intelligent analysis - Machine Learning, etc. |
- Information collection technology - Information collection technology - User-centric personalized integrated transportation information - Service technology, etc. |
- Vehicle - Transportation - Information communication - Infrastructure Development - Platform provision, etc. |
Table 3.
Smart mobility transportation information system field.
| Classification | Contents |
|---|---|
| Personal transportation sharing service (On-demand) | - It is a service that operates on predetermined routes using small-scale personal transportation vehicles designed to accommodate 1-2 passengers, in response to individual demand for transportation. - It is a first-mile and last-mile service that operates based on individual calls and destination designation, without fixed operating hours. |
| - Public transit-based shared mobility service (Circular) | - It is a service that circulates on a predetermined route using small autonomous driving vehicles (6-12 passenger capacity) - It is a service that operates vehicles (dispatching, etc.) in response to real-time (or pre-surveyed) user demand through user information collection technology |
| - Micro Mobility service | - Micro mobility vehicles that use environmentally friendly fuels such as electric power and represent small-sized personal transportation for 1-2 passengers, including low-speed electric cars, single-seater electric vehicles, electric bicycles, etc. |
Table 4.
Classification by technology.
| Classification | Contents |
|---|---|
| Smart Traffic Signal System Implementation Technology | - To control urban traffic, the city is divided into larger sections first. Each section is equipped with cameras and LiDAR sensor-based intersection vehicle tracking systems to monitor queue lengths and traffic volume in each direction. The data is accumulated and utilized for regional macro-simulation and intersection-level simulation through reinforcement learning. This technology enables the control of large-scale traffic signals in the city. - By reducing congestion in chronic bottleneck areas, it aims to reduce greenhouse gas emissions and improve citizen satisfaction. It also enables the implementation of a new signal system using AI technology, which can lead to global technological leadership. |
| Big Data-Based Personal Mobility System Technology | - To effectively implement MaaS, efficient handling, management, and an ecosystem for big data are required. Key technologies include real-time acquisition and processing of mobile and vehicle GPS data, preprocessing of big data, analysis of individual mobility patterns, real-time prediction of urban traffic demand, and prediction of long-term traffic demand and movement patterns by day of the week. - Personal mobility services, including shared autonomous vehicles, need to consider operation in a mixed environment of autonomous and conventional vehicles. Key technologies include integration with urban traffic flow simulations, optimal dispatching of shared autonomous vehicles, and management of multimodal transportation operations, including public transportation. |
| Mobility Simulator-Based Traffic Prediction System Implementation Technology | - A simulation system that can faithfully replicate the actual transportation system in a virtual world plays an important role. Traffic simulation is essential for ITS impact assessment, public transportation route planning, traffic congestion prediction, and traffic flow control, among others. - To simulate cities larger than metropolitan scale, distributed/parallel simulation performance is crucial. It is also necessary to consider features such as the ability to handle events like accidents, construction, and emergency situations, as well as high-speed processing through mesoscopic or platoon-based behavioral model simulations. |
| C-ITS System and Service Implementation Technology | - C-ITS (Cooperative Intelligent Transport Systems) is a technology that can advance the functions of current traffic information centers in a future-oriented manner. It requires the establishment of wide-area C-ITS testbeds on actual roads and the development of various services. - It is possible to develop various services in categories such as traffic accident prevention services, traffic accident response services, emergency vehicle support services, public transportation support services, congestion mitigation services, and pedestrian services. |
| AI-Based Road Pavement Maintenance and Hazard Warning System Technology | - To ensure efficient pavement management, artificial intelligence technology is utilized in combination with drones and black boxes to continuously acquire videos of road pavement conditions. Deep learning is used to diagnose the pavement condition and predict the deterioration using big data. Based on predictive maintenance strategies, the road pavement condition is managed and maintained in the optimal state. Real-time information on road hazards such as potholes is provided to drivers, enhancing their safety. - In public transportation vehicles such as buses and taxis, video acquisition through black boxes and drones is possible, allowing for efficient and periodic video acquisition through various means of acquisition. |
Disclaimer/Publisher’s Note: The statements, opinions and data contained in all publications are solely those of the individual author(s) and contributor(s) and not of MDPI and/or the editor(s). MDPI and/or the editor(s) disclaim responsibility for any injury to people or property resulting from any ideas, methods, instructions or products referred to in the content. |
© 2023 by the authors. Licensee MDPI, Basel, Switzerland. This article is an open access article distributed under the terms and conditions of the Creative Commons Attribution (CC BY) license (http://creativecommons.org/licenses/by/4.0/).
Copyright: This open access article is published under a Creative Commons CC BY 4.0 license, which permit the free download, distribution, and reuse, provided that the author and preprint are cited in any reuse.


