
Submitted:
30 September 2023
Posted:
01 October 2023
You are already at the latest version
Abstract
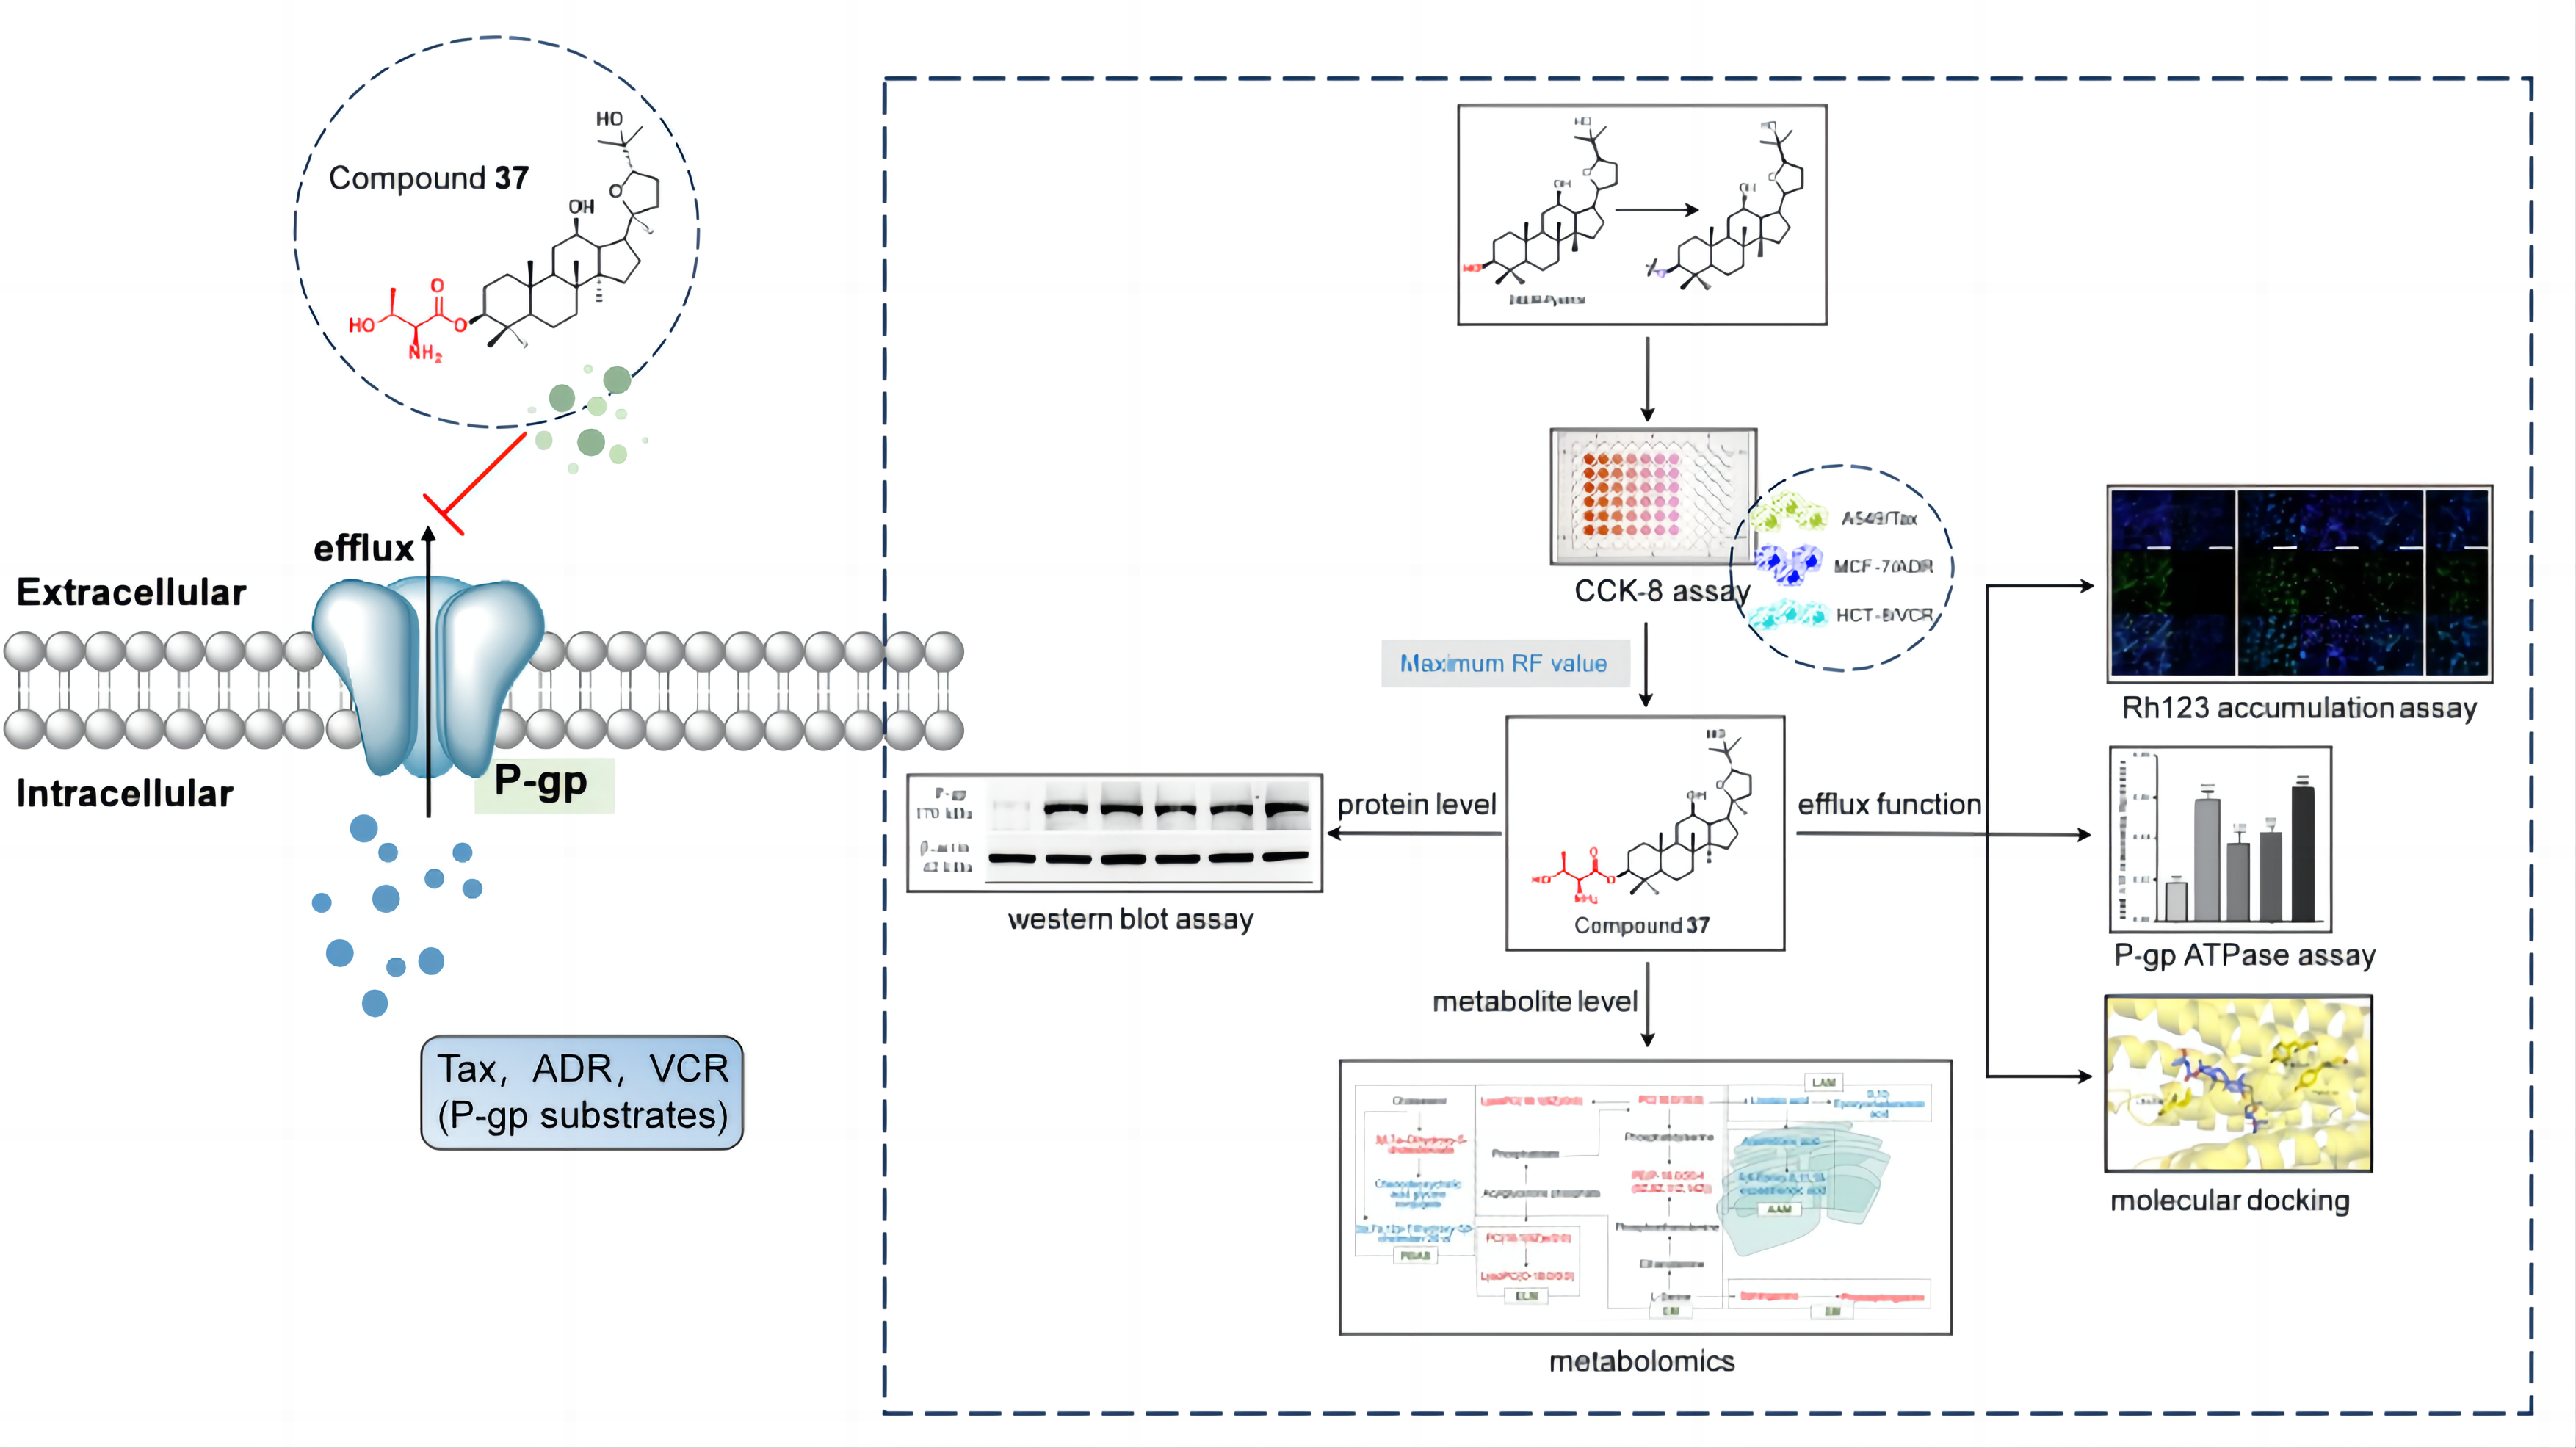
(1) Background: The typical transporter protein, P-glycoprotein (P-gp), has been proven to be associated with multidrug resistance (MDR). Pyxinol and 24S-Pyxinol amino acid ester derivatives had been demonstrated to be promising P-gp inhibitors for reversal of tumor MDR in KBV cells, however, their roles in MDR reversal in other tumor-resistant cells are still unclear. (2) Methods: In the present study, we synthesized 40 amino acid ester derivatives of Pyxinol and 24S-Pyxinol. The MDR reversal effects of these derivatives were evaluated in A549/Tax, MCF-7/ADR, and HCT-8/VCR cells using the CCK-8 assay. Subsequently, western blot assay, intracellular Rhodamine123 (Rh123) accumulation assay and P-gp ATPase activity assay were utilized to investigate the effects of active compound on P-gp. Molecular docking was used to predict the possible binding patterns of active compound to P-gp. Moreover, based on UPLC-Q/TOF-MS cellular metabolomics technology to identify endogenous differential metabolites and metabolic pathways associated with tumor MDR effects of the active compound. (3) Results: The results of the CCK-8 assay showed that compounds 8, 14, 16, 17, 18, 23, 25, 34, 36, 37 exhibited strong MDR reversal effect in A549/Tax, MCF-7/ADR and HCT-8/VCR cells, which were screened by reversal fold (RF) greater than 5. Among them, 10 μM of derivative 37 (new compound) showed the outstanding activity (RF: 15.31) in reversing MDR in A549/Tax cells. Compound 37 could act as a substrate for P-gp and inhibit the efflux function of P-gp by competitively binding to the binding site of antitumor drugs. Meanwhile, the molecular docking results confirmed that compound 37 was identified to under-go high-affinity binding to the drug binding site of P-gp. In addition, 14 endogenous differential metabolites and 6 metabolic pathways involved closely associated with the reversal of tumor MDR effects of compound 37 were identified. (4) Conclusions: Overall, a new candidate compound 37 (24S-3-L-threonyl-Pyxinol) could be provided for reversing tumor MDR by this study.
Keywords:
tumor multidrug resistance
; P-glycoprotein
; pyxinol amino acid ester derivatives
; molecular docking
; metabolomics
1. Introduction
Malignant tumors have high morbidity and mortality. Chemotherapy is one of the effective treatments for malignant tumors [1]. However, cancer cells can become resistant to chemotherapeutic drugs during treatment, which greatly reduces the efficacy of anti-tumor drugs. Tumor multidrug resistance (MDR) has become a significant impediment to the success of chemotherapy [2]. MDR is a phenomenon in which tumor cells become resistant to one anti-tumor drug and cross-resistant to other unexposed, structurally unrelated antitumor drugs with different mechanisms of action during the course of treatment [3]. The mechanisms of tumor MDR are complex, mainly closely related to ATP-binding cassette (ABC) transporter protein-mediated MDR, enzyme-mediated MDR, apoptosis and autophagy, and growth factors, among them ABC transporter protein-mediated efflux of anti-tumor drugs has been widely studied [4]. In the ABC transporter superfamily, P-glycoprotein (P-gp/ABCB1/MDR1), multidrug resistance associated protein 1 (MRP1/ABCC1) and breast cancer resistance protein (BCRP/ABCG2) play important roles in tumor MDR, of which P-gp, a polymeric glycoprotein encoded by the human gene MDR1, is a classical target for causing tumor MDR [5]. Some commonly used anti-tumor drugs, such as anthracyclines (adriamycin), antibiotic drug (zoerythromycin), and botanical drug (paclitaxel and vincristine), have reduced sensitivity and efficacy against cancer cells due to their role as substrates for P-gp [6,7]. Consequently, developing P-gp inhibition strategies to reverse tumor MDR is particularly important for effective cancer treatment. Three generations of P-gp inhibitors have been extensively studied, but their application has been limited due to the drawbacks of poor efficacy, high toxicity, and unsatisfactory pharmacokinetic properties [8], therefore P-gp inhibitors with high efficiency and low toxicity still need to be committed to development.
Active substances isolated from natural products, such as alkaloids [9], coumarins [10], monoterpenes [11], sesquiterpenes [12], diterpenes [13], and triterpenes [14], are effective sources of P-gp modulators because of their safety, efficacy, stability, quality control, and multi-targeting advantages. There is a typical chemical class of triterpenoids, ginsenosides, which are the most important active components in ginseng. It has been reported that ginsenosides Rh2, Rb1, Rg3 had the effect of reversing P-gp-mediated tumor MDR[15,16,17]. Most of the active metabolites of ginsenosides in vivo are ginsengenins, which are the remaining parent fraction of ginsenoside deglycosylation. Protopanaxadiol (PPD) was found to dose-dependently inhibit digoxin efflux from the P-gp substrate, showing a P-gp inhibition [18]. Pyxinol and 24S-Pyxinol (Figure 1) are the main active metabolites of PPD in human liver and have better oral bioavailability than PPD [19,20]. It was reported that the accumulation of Rh123 in Caco-2 cell was increased and the transmembrane efflux of digoxin was reduced by Pyxinol and 24S-Pyxinol, indicating that both of them had inhibitory effects on P-gp function [20]. Based on their medicinal value and safety, Pyxinol and 24S-Pyxinol were considered as lead compounds with the aim of developing P-gp inhibitors with better efficacy.
According to the structural characteristics of most P-gp inhibitors, the high hydrophobic and basic nitrogen atoms in the structure are the key features of P-gp efflux drugs [18]. It was found that nitrogen-containing substituents such as amino acids, amide, fatty acids, and aminothiazole [21,22] could enhance the MDR reversal activity of Pyxinol and 24S-Pyxinol.Because amino acids are characterized by structural diversity, good solubility and potent affinity for certain targets, Pyxinol and 24S-Pyxinol were modified by amino acid structure to improve their water solubility. A series of Pyxinol and 24S-Pyxinol amino acid ester derivatives were synthesized, and compound 3c (Figure 1) was screened to be the most potent derivative being a promising P-gp inhibitor for reversal of tumor MDR in KBV cells [21]. However, the role of amino acid ester derivatives in MDR reversal in other tumor-resistant cells remains unclear.
In the present study, we synthesized 40 amino acid ester derivatives (including 8 new compounds) of Pyxinol and 24S-Pyxinol. and evaluated their MDR reversal effects in three tumor resistant cells (A549/Tax, MCF-7/ADR, HCT-8/VCR). The derivative with the most significant effect on reversing P-gp-mediated tumor MDR was screened out, and the mechanisms were further investigated by using molecular docking and cellular metabolomics. A potential novel drug candidate with strong tumor MDR effects and low toxicity could be developed.
2. Results
2.1. Chemistry
The synthesis strategy of Pyxinol and 24S-Pyxinol amino acid ester derivatives in this study was shown in Figure 2. According to previous literature reports, the C3-OH of Pyxinol and 24S-Pyxinol, far away from other hydrogen bond donors or acceptor groups and being the main metabolic site, has the good reaction selectivity [19,23,24]. So C3-OH was chosen for structural modification in the current study.
A total of 40 derivatives were synthesized, of which 32 known compounds (1~5, 8~15, 18~25, 28~35, 38~40) were synthesized according to the procedures reported by our group [25]. The main steps for other 8 new compounds were as follows: In dry CH2Cl2, under the catalysis of 1-ethyl-3-(3-dimethylaminopropyl) carbodiimide (EDC) and 4-dimethylamino-pyridine (DMAP), the C3-OH was esterified by amino acids bearing Boc-protecting groups to synthesize compounds 6, 7 and 26, 27, respectively. After esterification, the Boc-protecting groups were deprotected by trifluoroacetic acid (TFA) at room temperature to obtain 16, 17 and 36, 37. Purification of the above compounds by silica gel column chromatography was employed to produce pure products with yields ranging from 80% to 90%. The structures were identified by physicochemical analysis, 1H-NMR, 13C-NMR and HR-MS. The H-3 proton signal of the parent nucleus was shifted from δ 3.42 to the low-field region near δ 4.50 in the 1H-NMR spectrum, and the C-3 chemical shift of the parent nucleus was shifted from δ 78.0 to the low-field region near δ 82.0 in the 13C-NMR spectrum, which corresponds to amino acids attached to C-3 position of Pyxinol or 24S-Pyxinol.
2.2. Evaluation of Derivatives in reversing tumor multidrug resistance activity
2.2.1. Cytotoxicity determination
In order to determine non-toxic concentration of the investigated derivatives and exclude their cytotoxicity in tumor cells, the CCK-8 assay was used to detect the effects of all derivatives on the cytotoxicity of cells. As shown in Table 1, Table 2, Table 3, the cell survival rates were greater than 80% when treated with 5 μM or 10 μM compounds for 24 h, which meant that these two concentrations of compounds did not have the significant impact on the proliferation of A549, A549/Tax, MCF-7, MCF-7/ADR, HCT-8, HCT-8/VCR cells [26]. Therefore, the tested compounds at a concentration of 10 μM were subjected to tumor MDR reversal studies.
In addition, compared with A549 cells (IC50 of Tax: 2.64±0.46 μM; IC50 of ADR: 7.38 ± 0.23 μM; IC50 of VCR: 3.37±0.53 μM), A549/Tax cells (IC50 of Tax: 345.33±12.33 μM; IC50 of ADR: 248.07±8.00 μM; IC50 of VCR: 64.95±1.14 μM) were significantly resistant to Tax, ADR and VCR, with resistance index (RI) values of 130.81, 33.61 and 19.27. Similarly, MCF-7/ADR cells and HCT-8/VCR cells were all significantly resistant to Tax, ADR and VCR compared with MCF-7 and HCT-8 cells, with RI values of 16.71, 75.12, 5.99 and 4.03, 49.92, 225.21, respectively (Table 4).
2.2.2. Evaluation of MDR reversal ability
To characterize the MDR reversal ability, 10 μM of tested compounds were co-administered with different concentrations of anti-tumor drugs Tax, ADR, and VCR (0.25, 0.5, 2.5, 5, 10, 20, 40 and 80 μM), and the IC50 and RF values were calculated for Tax in A549/Tax cells, ADR in MCF-7/ADR cells, and VCR in HCT-8/VCR cells.
The results of the experiments were shown in Table 5. As expected, the majority of derivatives exhibited superior reversal ability compared to Pyxinol and 24S-Pyxinol in A549/Tax, MCF-7/ADR and HCT-8/VCR cell lines. In general, the trend of action of Pyxinol and 24S-Pyxinol derivatives in different drug-resistant cells was basically consistent. Interestingly, compounds 8, 14, 16, 17, 18, 23, 25, 34, 36, 37 satisfied the standard (RF≥5) for strong MDR influence in A549/Tax, MCF-7/ADR and HCT-8/VCR cell lines. Particularly, compound 37 exhibited the most significant reversal effect (RF: 15.31) on Tax resistance in A549/Tax cells. Therefore, the effect of compound 37 on P-gp in A549/Tax cells was further investigated.
2.3. Effect of compound 37 on P-gp
2.3.1. Effect on the expression level of P-gp
P-gp expression differences between A549 sensitive cells and A549/Tax resistant cells, and the influence of compound 37 (2.5, 5, and 10 μM) on P-gp expression in A549/Tax cells, were both determined or investigated. Compared with A549 cells, the expression of P-gp was significantly increased (p<0.001) in drug-resistant cells A549/Tax, demonstrating that P-gp overexpression was closely related to drug resistance. In A549/Tax cells, compared with the A549/Tax model group, there was no significant impact (p>0.05) on the expression of P-gp by compound 37 or by Vrp (positive drug), indicating that the concentration (2.5, 5, and 10 μM) of compound 37 employed in the experiment did not inhibit the expression of P-gp. The above results were shown in Figure 3.
2.3.2. Effect on the efflux function of P-gp
P-gp, a drug efflux transporter protein highly expressed in drug-resistant cells, is responsible for transporting P-gp substrates from intracellular to extracellular compartments when there is a reduction in the concentration of intracellular P-gp substrate. To investigate whether the MDR reversal effect of compound 37 is associated with the P-gp function, Rh123 mitochondrial fluorescence staining was performed. Just as shown in Figure 4, compared to in A549 cells, the fluorescence accumulation of Rh123 in A549/Tax cells was significantly decreased (p<0.001). After being intervened with 2.5, 5, and 10 μM of compound 37, Rh123 fluorescence accumulation was dose-dependently increased in comparison to the A549/Tax model group (p<0.001). Moreover, the effect of 10 μM of compound 37 was similar to that of the same dose of Vrp, but with a weaker fluorescence intensity than that of A549 group. These results indicated that compound 37 might be effective by preventing P-gp from performing its efflux function.
2.3.3. Effect on P-gp ATPase activity
The obstruction of the efflux function of P-gp is energy-dependent and requires ATP hydrolysis for energy to exert drug efflux. The amount of ATP consumed is positively correlated with P-gp ATPase activity, and the extracellular function of P-gp will be impaired if the energy supply is inadequate. As shown in Figure 5, compound 37 stimulated ATP consumption in a dose-dependent manner, which was statistically different from the Basal group (p<0.001). In addition, compound 37 performed similar effect to same dose of Vrp. The results suggested that compound 37 could stimulate the activity of P-gp ATPase, act as a substrate for P-gp, and play a role in reversing tumor MDR effect by competitively binding to the binding site of anti-tumor drugs.
2.3.4. Molecular docking
The molecular docking strategy was applied to investigate the binding modes of compound 37 or Vrp with P-gp in order to further comprehend the interaction between them. As indicated by Figure 6, compounds 37 were binded to amino acid residues in comparable binding poses of Vrp in binding cavity through hydrophobic interactions (Figure 6A). Vrp was attached to GLN838 (2.5 Å), ASN721 (3.0 Å), GLN990 (2.3 Å), TYR307 (2.7 Å) and TYR310 (2.6 Å) of P-gp via hydrogen bonding with the binding energy of up to -7.2 kcal/mol (Figure 6B). Moreover, compound 37 formed three hydrogen bonds: the hydroxyl group at C-25 position exhibited hydrogen bonding interactions with TYR310 (1.8 Å), while the hydroxyl group at C-12 position formed strong hydrogen bond with TYR307 (2.0 Å), the amide group at threonine residue was connected with LEU236 (2.2 Å). The binding energy was −10.1 kcal/mol (Figure 6C). The docking results proved that both compound 37 and Vrp hydrogen-bonded to P-gp at the drug-binding site and that the linked amino acid residues shared two common (TYR307, TYR310), indicating that the binding modes of compound 37 and Vrp to P-gp were similar, which meant compound 37 directly binded to the large drug binding cavity of the Pgp transmembrane domain and inhibited the efflux function of Pgp.
2.4. Cellular metabolomics
2.4.1. Validation of UPLC-Q/TOF-MS method
Cellular metabolomics experiments were carried out with the support of the UPLC-Q/TOF-MS apparatus. Firstly, a validation test of the system was first carried out to monitor the mass/retention time pairs of 10 ions in cellular samples in both positive (ESI+) and negative (ESI-) modes. The RSD values of peak intenstiy or retention time of the 10 ion pairs were calculated in the system stability, precision, reproducibility and sample stability experiments, and the results were summarized in Table 6. The data revealed that each RSD value was less than 3%, confirming that the established UPLC-MS method could be applied for assessing test samples with good precision, reproducibility and stability.
2.4.2. Metabolomics profile analysis of compound 37 intervention in A549/Tax cells
The metabolic characteristics under ESI+ and ESI- modes of the control group, model group and compound 37 (10 μM) group were identified using the estabolished LC-MS method. The typical base peak intensity (BPI) chromatograms of cell samples were shown in Figure 7.
The Principal Component Analysis (PCA) score plots of cell metabolic profiling in ESI+ and ESI– modes were shown in Figure 8. Each point in the diagram represented a single cell sample, and the different groups of samples were represented by the different colors. The QC samples of ESI+ or ESI– mode were more concentrated, demonstrating the system's strong stability. The samples of three groups were distributed in different areas. The samples of model group were far away from control group, suggesting that the metabolic profile of model group was abnormal. And compound 37 group was positioned between control group and model group, indicating that the metabolic profile of the lung cancer drug-resistant cells was changed after the intervention of the compound 37, and the metabolism profile was adjusted trend to the normal level (Figure 8).
2.4.3. Identification of the differential metabolites and metabolic pathways
In order to explore the differences in endogenous metabolite levels between control group and model group, or between compound 37 group and model group, and to search for potential biomarkers associated with the reversal of tumor MDR by compound 37, the Orthogonal Partial Least-Squares Discrimination Analysis (OPLS-DA) model was developed and verified using the permutation tests. The establishment of S-plots were utilized to identify metabolites with significant differences. The cell samples of model group and control group, as well as compound 37 group and model group, are maximally divided into two regions in the OPLS-DA plots of positive and negative ion modes shown in Figure 9A. The large values of model explanation degree parameter R2 and the prediction ability parameter Q2 further demonstrated the high explanation and prediction rate of the established models. The permutation test was used to validate the OPLS-DA model, producing the permutation test plot shown in Figure 9B. The established OPLS-DA models were valid and credible, as can be shown from the depiction, where the R2 and Q2 values generated by the randomized arrangement on the left were lower than the original values on the right.
With each point representing a unique metabolite, the S-plots provided an accurate depiction of the metabolite profiles which led to differences between groups (Figure 9C). VIP>1.0 and p<0.01 metabolites were regarded as differential metabolites. Potential biomarkers and their m/z information were symbolized with red pentagrams in the S-plots. A total of 14 potential biomarkers were identified after matching the retention time and mass of references or matching the fragmentation information in the database, and the identification outcomes were displayed in Table 7.
The 14 potential biomarkers identified were used to generate the predictive receiver operating characteristic (ROC) curves (Figure 10A, Table 8), and the ROC curves between three groups validated that these metabolites significantly contributed to the reversal of tumor MDR effects of compound 37. The relative abundance of potential biomarkers could be visualized by the heatmap (Figure 10B), where red color represented high abundance and green color represented low abundance. The 14 potential biomarkers were discovered to be involved in 6 metabolic pathways with high weight values, including linoleic acid metabolism (LAM), glycerophospholipid metabolism (GM), arachidonic acid metabolism (AAM), primary bile acid biosynthesis (PBAB), ether lipid metabolism (ELM), and sphingolipid metabolism (SM) (Table 9), when MetaboAnalyst was applied to analyze the pathway enrichment of potential biomarkers. The cellular metabolomics mechanism was illustrated in Figure 11.
3. Discussion
One of the primary reasons why cancer treatments fail is tumor MDR. P-gp is a classic MDR transporter protein, and it transports many anti-tumor drugs as well as P-gp substrates outside the cell through active transport. It decreases intracellular drug accumulation, which in turn reduces drug efficacy, and ultimately increases drug resistance in cancer cells [27]. Therefore, it is crucial to develop P-gp inhibitors, which primarily inhibits P-gp through two mechanisms: One aspect is by avoiding P-gp from being expressed or by decreasing the level of expression, which subsequently reduces the amount of P-gp drug transporter proteins and prevents P-gp from acting as a transporter for anti-tumor drugs. The other aspect is preventing P-gp from function as a drug transporter pump by directly attaching to P-gp and inhibiting it from binding to substrates including anti-cancer medications. Any of the aforementioned mechanisms can lessen P-gp exocytosis of anticancer medications and make it easier to enhance their sensitivity to tumor drug-resistant cells.
Based on the study of MDR reversal effects of all derivatives on three drug-resistant cells, the possible structure-activity relationships (SARs) were proposed. Firstly, the stereo-configuration at C-24 position affected the activity, and most of the R-type derivatives showed stronger MDR reversal effects than the corresponding S-type derivatives in A549/Tax and MCF-7/ADR cells, which was in agreement with previous studies [21,22]. However, this phenomenon was not obvious in HCT-8/VCR cells, and it was presumed that it might be related to the different anti-tumor drugs. Secondly, compared to derivatives with N-Boc protection, most derivatives that removed N-Boc protection significantly enhanced MDR reversal ability. For examples, 4 vs 14; 6~8 vs 16~18; 24 vs 34; 26~28 vs 36~38; 9 vs 19; 10 vs 20; 29 vs 39; 30 vs 40. Thirdly, N-Boc-deprotected aliphatic amino acids derivatives (14, 16~18 vs 19~20; 34, 36~38 vs 39~40) showed good MDR reversal activity. Combined with possible SARs and the criterion of RF≥5, compound 37 with the most significant MDR activity was used for the following studies.
In order to investigate whether compound 37 affected P-gp and consequently exerted MDR reversal effects, western blot assay and intracellular Rh123 accumulation aassay were carried out to explore the two aspects of P-gp protein level and P-gp function, respectively. The results showed that compound 37 had no significant effect on the protein expression level of P-gp, while it could dose-dependently enhance the accumulation of Rh123 in drug-resistant cells, suggesting that it might have an inhibitory impact on the function of P-gp. To further confirm the effect of compound 37 on P-gp function, P-gp ATPase activity was performed and the results indicated that compound 37 could stimulate P-gp ATPase activity, and could be employed as a P-gp substrate to bind to P-gp like Vrp. Molecular docking analysis also supported these results. As a result, compound 37 could act as a substrate for P-gp and inhibit the exocytosis function of P-gp by competitively binding to the binding site of anti-tumor drugs, subsequently exert the role of reversing tumor MDR.
In order to investigate the effect of compound 37 on tumor MDR at the metabolite level, the current study applied UPLC-Q/TOF-MS cellular metabolomics to identify 14 endogenous differential metabolites and the corresponding 6 metabolic pathways. Among them, sphingolipid analogs such as phytosphingosine and sphinganine are mainly found in cell membranes and can promote apoptosis [28], and the sphingolipid metabolism associated with phytosphingosine and sphingomyelin plays an important role in the formation of lipid rafts, which can provide the lipid environment required for P-gp translocation, since the P-gp portion is located in the lipid rafts. In addition, sphingolipids can affect P-gp ATPase catalytic activity [29]. The findings of the study indicated that the intervention of compound 37 could influence the lipid environment of P-gp by increasing the content of phytosphingosine and sphinganine, regulating the sphingolipid metabolism, resulting in a decrease in P-gp ATPase activity, and consequently inhibiting the transporter function of P-gp. Furthermore, glycerophospho- lipids, such as LysoPC (18:1(9Z) /0:0), PC(18:1(9Z)e/2:0), LysoPC(O-18:0/0:0), PC(16:0/16: 0), and PE(P-18:0/20:4 (5Z, 8Z, 11Z,14Z)), are the main components of cell membranes and are involved in the cell membrane recognition of protein. Phosphatidylcholine (PC) is hydrolyzed by secretory phospholipase A2 to lysophosphatidylcholine (LysoPC), which is further hydrolyzed by lysophospholipase and other enzymes to ultimately produce glycerol, phosphate and choline [30]. Variations in choline concentration can lead to alterations in the lipid environment required for P-gp, which in turn affects P-gp transport function. The study showed that compound 37 intervention could upregulate the levels of the above five metabolites, affect glycerophospholipid metabolism, increase choline content, and alter the lipid environment of P-gp, thus inhibited the transport function of P-gp, and played a role in reversing tumor MDR. Here, we demonstrated that compound 37 had good pharmacological activity against tumor MDR, which provided a theoretical basis for its subsequent study.
4. Materials and Methods
4.1. Chemistry
4.1.1. General
Pyxinol and 24S-Pyxinol (purity>98%) were prepared in-house in the laboratory. The chemical solvents were of analytically pure grade and commercially available. 10% ethanol sulfate solution was used for thin layer chromatography (TLC) analysis to monitor the progress of the reaction. Silica gel (200~300 mesh) was used for column chromatography to purity compounds. 1H-NMR and 13C-NMR spectra were recorded on Bruker AV-500 spectrometer or Bruker AV-600 spectrometer (Bruker Co., Karlsruhe, Germany) with CDCl3, MeOD, and C5D5N as solvents and TMS as an internal standard. Chemical shifts were expressed as δ values (ppm). High-resolution electrospray ionization mass spectrometry (HR-ESI-MS) were detected with a Waters Xevo G2-XS QTOF mass spectrometer (Waters Co., Milford, MA, USA).
4.1.2. Synthesis of Pyxinol and 24S-Pyxinol derivatives
4.1.2.1. Synthesis of known derivatives
4.1.2.2. Synthesis of new derivatives
Pyxinol or 24S-Pyxinol (1.05 mmol, 1.0 eq), N-Boc amino acids (2.10 mmol, 2.0 eq), EDC (3.15 mmol, 3.0 eq), and DMAP (1.05 mmol, 1.0 eq) were sequentially added into dry CH2Cl2 (10 mL) at room temperature and the reaction was carried out with stirring for 12 h. The reaction progress was monitored by TLC (n-hexane : ethyl acetate = 3 : 1). The mixture was diluted with CH2Cl2 and washed 3 times with saturated NaHCO3 aq, water and saturated NaCl aq, respectively, dried with Na2SO4, filtered and concentrated under reduced pressure. The crude products were purified by silica gel column chromatography and the eluent ratio was n-hexane : ethyl acetate = (10 : 1~3 : 1) to obtain 6, 7, 26 and 27.
Derivatives 6 (or 7, 26, 27) was dissolved in dry CH2Cl2 (5 mL) at room temperature, and TFA (2 mL) was added dropwise and stirred for 1 h. The reaction progress was monitored by TLC (dichloromethane : methanol = 15 : 1). After which the solution was slowly added saturated NaHCO3 to pH 7.0, washed 3 times with saturated NaHCO3 aq, water and saturated NaCl aq, dried with Na2SO4, filtered, concentrated under reduced pressure and pure compound 16, 17, 36 and 37 were generated by column chromatography with the eluent ratio of dichloromethane : methanol = 60 : 1~15 : 1.
20S, 24R-Epoxy-3β-O-(N-Boc-O-tert-butyl-L-aspartyl)-dammarane-12β, 25-diol (6)
White powder (yield 86.3%), 1H-NMR (600 MHz, CDCl3) δ 4.50 (m, 1H), 4.43 (m, 2H), 4.19 (m, 1H), 3.86 (m, 1H), 3.53 (td, J=4.3Hz, 1H), 2.22-2.18 (m, 3H), 2.08-1.85 (m, 7H), 1.74-1.52 (m, 8H), 1.48 (s, 9H), 1.45 (s, 9H), 1.29 (s, 3H), 1.28 (s, 3H), 1.27 (m, 1H), 1.11 (s, 3H), 1.08-1.01 (m, 2H), 1.00 (s, 3H), 0.91 (s, 3H), 0.89 (s, 3H), 0.86 (s, 3H), 0.85 (s, 3H), 0.83 (m, 1H). 13C-NMR (150 MHz, CDCl3) δ 170.96, 170.20, 155.57, 86.66, 85.57, 82.37, 81.73, 79.87, 71.08, 70.24, 56.23, 52.14, 50.78, 50.56, 49.54, 48.11, 39.90, 39.14, 38.76, 37.98, 37.20, 34.88, 32.75, 31.47, 31.34, 28.73, 28.45 (3C), 28.07 (3C), 27.74 (2C), 27.01, 26.27 (2C), 25.14, 18.32, 18.28, 16.57, 16.50, 15.52. HR-MS (ESI) m/z calcd for C43H73NO9 [M+H]+ 749.0477, found 749.0490.
20S, 24R-Epoxy-3β-O-(N-Boc-O-tert-butyl-L-threonyl)-dammarane-12β, 25-diol (7)
White powder (yield 90.4%), 1H-NMR (600 MHz, CDCl3) δ 4.48 (m, 1H), 4.24 (m, 1H), 4.14 (m, 1H), 3.86 (m, 1H), 3.53 (td, J=4.6 Hz, 1H), 2.22-2.18 (m, 3H), 2.08-1.85 (m, 7H), 1.74-1.64 (m, 2H), 1.60-1.49 (m, 5H), 1.47 (s, 9H), 1.45 (m, 1H), 1.30 (s, 3H), 1.28 (s, 3H), 1.27 (m, 1H), 1.23 (s, 3H), 1.16 (s, 9H), 1.11 (s, 3H), 1.05 (m, 1H), 1.00 (s, 3H), 0.91 (s, 3H), 0.90 (s, 3H), 0.89 (s, 3H), 0.89 (s, 3H), 0.86-0.83 (m, 2H). 13C-NMR (150 MHz, CDCl3) δ 171.78, 156.04, 86.66, 85.57, 82.39, 79.65 (2C), 74.02, 71.10, 70.24, 67.64, 56.23, 52.16, 50.57, 49.54, 48.12, 39.92, 38.78, 38.17, 37.17, 34.91, 32.76, 31.47, 31.36, 29.84, 28.85 (3C), 28.74, 28.58 (3C), 28.06 (2C), 27.75, 26.28, 25.15, 20.94, 18.30, 18.26, 16.59, 16.54, 15.54. HR-MS (ESI) m/z calcd for C43H75NO8 [M+H]+ 735.0627, found 735.0654.
20S, 24S-Epoxy-3β-O-(N-Boc-O-tert-butyl-L-aspartyl)-dammarane-12β, 25-diol (26)
White powder (yield 85.3%), 1H-NMR (600 MHz, CDCl3) δ 4.50 (m, 1H), 4.31 (m, 2H), 4.24 (m, 1H), 3.92 (m, 1H), 3.53 (td, J= 4.9Hz, 1H), 2.26-2.14 (m, 3H), 2.04-1.60 (m, 9H), 1.57-1.47 (m, 6H), 1.45 (s, 9H), 1.42 (s, 9H), 1.34-0.95 (m, 3H), 1.27 (s, 3H), 1.25 (s, 3H), 1.09 (s, 3H), 1.01 (s, 3H), 0.91 (s, 3H), 0.88 (m, 1H), 0.86 (s, 3H), 0.85 (s, 3H), 0.84 (s, 3H). 13C-NMR (150 MHz, CDCl3) δ 172.90, 172.23, 154.04, 87.51, 86.80, 81.93, 81.33, 79.67, 70.69, 69.71, 56.16, 54.76, 52.28, 50.28, 48.97, 47.68, 39.91, 39.13, 38.68, 38.15, 37.22, 34.83, 32.32, 31.76, 31.47, 30.30, 29.37, 28.55 (6C), 28.26 (2C), 28.04, 27.33, 25.18, 18.30, 17.89, 16.60, 16.46, 15.62. HR-MS (ESI) m/z calcd for C43H73NO9 [M+H]+ 749.0485, found 749.0490.
20S, 24S-Epoxy-3β-O-(N-Boc-O-tert-butyl-L-threonyl)-dammarane-12β, 25-diol (27)
White powder (yield 87.9%), 1H-NMR (600 MHz, CDCl3) δ 4.47 (m, 1H), 4.22 (m, 1H), 4.13 (m, 1H), 3.88 (dd, J=5.5 Hz, 1H), 3.54 (td, J=4.8 Hz, 1H), 2.27-2.23 (m, 3H), 2.09-1.83 (m, 7H), 1.78-1.63 (m, 2H), 1.58-1.46 (m, 6H), 1.45 (s, 9H), 1.31-1.29 (m, 1H), 1.28 (s, 3H), 1.24 (s, 3H), 1.21 (s, 3H), 1.14 (s, 9H), 1.10 (s, 3H), 1.09-1.03 (m, 2H), 1.01 (s, 3H), 0.92 (s, 3H), 0.91 (s, 3H), 0.88 (s, 3H), 0.88 (s, 3H), 0.85 (s, 1H). 13C-NMR (150 MHz, CDCl3) δ 171.76, 156.04, 87.54, 87.33, 82.38, 79.64 (2C), 78.85, 70.70, 70.17, 61.07, 56.19, 52.30, 50.29, 49.07, 48.93, 39.91, 38.74, 28.69, 38.17, 37.18, 34.84, 32.88, 32.33, 31.77, 29.83, 29.01, 28.84 (3C), 28.58 (3C), 28.18 (2C), 28.06, 25.18, 20.93, 18.30, 17.87, 16.61, 16.49, 15.61. HR-MS (ESI) m/z calcd for C43H75NO8 [M+H]+ 735.0674, found 735.0654.
20S, 24R-Epoxy-3β-O-(L-aspartyl)-dammarane-12β, 25-diol (16)
White powder (yield 82.4%), 1H-NMR (500 MHz, MeOD) δ 4.58 (m, 1H), 4.22 (m, 1H), 3.95 (m, 1H), 3.50 (m, 1H), 3.06 (dd, 1H, J=17.9, 4.1 Hz), 2.90 (dd, 1H, J=17.8, 7.7 Hz), 2.25-2.18 (m, 1H), 2.08-1.73 (m, 8H), 1.66-1.52 (m, 4H), 1.46-1.34 (m, 4H), 1.44 (s, 3H), 1.30 (s, 3H), 1.24 (s, 3H), 1.16 (s, 3H), 1.05 (s, 3H), 1.04-0.99 (m, 2H), 1.02 (s, 3H), 0.96 (s, 3H), 0.92 (s, 3H), 0.85 (m, 1H). 13C-NMR (125 MHz, MeOD) δ 173.56, 172.45, 87.84, 85.96, 83.37, 72.28, 71.96, 57.36, 53.18, 52.10, 51.73, 50.05, 49.85, 41.01, 40.11, 39.79, 38.19, 35.93, 35.76, 33.67, 32.92, 32.11, 29.55, 28.48, 27.07, 26.75, 26.50 (2C), 26.03, 19.23, 18.63, 16.91, 16.88, 15.88. HR-MS (ESI) m/z calcd for C34H57NO7 [M+H]+ 592.4100, found 592.4135.
20S, 24R-Epoxy-3β-O-(L-threonyl)-dammarane-12β, 25-diol (17)
White powder (yield 89.1%), 1H-NMR (500 MHz, CDCl3) δ 4.50 (m, 1H), 4.07 (dd, J=25Hz, 1H), 3.95 (m, 1H), 3.78 (m, 1H), 3.45 (m, 1H), 2.15-2.09 (m, 3H), 2.00-1.76 (m, 8H), 1.67- 1.47 (m, 7H), 1.39 (s, 3H), 1.25 (m, 1H), 1.21 (s, 3H), 1.20 (s, 3H), 1.07 (s, 3H), 1.05 (m, 1H), 1.03 (s, 3H), 0.97 (m, 1H), 0.93 (m, 1H), 0.92 (s, 3H), 0.83 (s, 3H), 0.82 (s, 3H), 0.81 (s, 3H). 13C-NMR (125 MHz, CDCl3) δ 173.60, 86.64, 85.42, 82.18, 71.92, 71.06, 70.25, 60.19, 56.21, 52.14, 50.53, 49.52, 48.09, 39.89, 38.72, 38.12, 37.19, 34.86, 32.74, 31.48, 31.33, 28.72, 28.18, 28.04, 27.85, 27.73, 26.27, 25.13, 19.29, 18.30, 18.27, 16.72, 16.48, 15.52. HR-MS (ESI) m/z calcd for C34H59NO6 [M+H]+ 578.4332, found 578.4342.
20S, 24S-Epoxy-3β-O-(L-aspartyl)-dammarane-12β, 25-diol (36)
White powder (yield 81.6%), 1H-NMR (500 MHz, MeOD) δ 4.60 (m, 1H), 4.21 (m, 1H), 3.96 (m, 1H), 3.54 (m, 1H), 3.07 (dd, J=17.9, 4.1 Hz, 1H), 2.85 (dd, J=17.8, 8.3 Hz, 1H), 2.28-2.23 (m, 3H), 2.07-1.71 (m, 11H), 1.65-1.52 (m, 6H), 1.42-1.34 (m, 1H), 1.29 (s, 3H), 1.24 (m, 1H), 1.20 (s, 3H), 1.13 (s, 3H), 1.08 (s, 3H), 0.98 (s, 3H), 0.97 (s, 3H), 0.93 (s, 3H), 0.92 (s, 3H). 13C-NMR(125 MHz, MeOD) δ 175.13, 172.48, 88.94, 88.45, 83.33, 72.03, 71.34, 57.36, 53.26, 52.30, 51.46, 50.21, 49.75, 40.98, 39.80, 39.03, 38.20, 36.14, 35.80, 33.41, 32.78, 32.70, 29.37, 29.10, 28.52, 28.18, 27.89, 26.46, 26.06, 19.25, 18.32, 16.94 (2C), 15.92. HR-MS (ESI) m/z calcd for C34H57NO7 [M+H]+ 592.4123, found 592.4135.
20S, 24S-Epoxy-3β-O-(L-threonyl)-dammarane-12β, 25-diol (37)
White powder (yield 83.8%), 1H-NMR (600 MHz, CDCl3) δ 4.48 (m, 1H), 4.09 (m, 1H), 3.85 (m, 1H), 3.52 (m, 1H), 3.18 (m, 1H), 2.33-2.14 (m, 3H), 2.06-1.76 (m, 8H), 1.70-1.40 (m, 7H), 1.28 (m, 1H), 1.38 (s, 3H), 1.28 (m, 1H), 1.27 (s, 3H), 1.26 (s, 3H), 1.11 (s, 3H), 1.05 (s, 3H), 1.03-0.96 (m, 2H), 0.93 (s, 3H), 0.90 (s, 3H), 0.87 (s, 3H), 0.85 (s, 3H), 0.83 (m, 1H). 13C-NMR (150 MHz, CDCl3) δ 169.29, 87.57, 87.27, 82.96, 70.62, 70.24, 67.66, 60.17, 56.23, 52.30, 50.29, 49.09, 48.96, 41.01, 39.91, 38.12, 37.23, 34.83, 33.27, 32.36, 31.79, 29.47, 29.04, 28.68, 28.28 (2C), 28.16, 25.25, 20.45, 18.31, 17.98, 16.77, 16.44, 15.62. HR-MS (ESI) m/z calcd for C34H59NO6 [M+H]+ 578.4356, found 578.4342.
4.2. Cell culture
A549 and A549/Tax were purchased from Procell Life Science&Technology Co., Ltd. (Wuhan, China), MCF-7 and MCF-7/ADR were provided from KeyGen Biotechnology Co., Ltd. (Jiangsu, China), HCT-8 and HCT-8/VCR were obtained from YaJi Biotechnology Co., Ltd. (Shanghai, China). A549 and A549/Tax were cultured in DMEM/F-12(HAM) 1:1 medium supplemented with 10% fetal bovine serum (FBS), 100 U/mL penicillin, and 100 mg/mL streptomycin, where 500 ng/mL Tax was added to the A549/Tax medium to maintain resistance. Similarly, MCF-7 and MCF-7/ADR were cultured in DMEM high-glucose medium containing 10% FBS, 100 U/mL penicillin, and 100 mg/mL streptomycin, and 300 ng/mL ADR was added to MCF-7/ADR medium. HCT-8 and HCT-8/VCR were cultured in RPMI 1640 medium with 10% FBS, 100 U/mL penicillin, and 100 mg/mL streptomycin, and HCT-8/VCR medium was supplemented with 2000 ng/mL VCR. All cells were incubated in a 5% CO2 humidified atmosphere at 37 °C and harvested during the logarithmic growth period. Anti-tumor drugs were removed from A549/Tax, MCF-7/ADR and HCT-8/VCR cell cultures one week prior to the experiments and replaced with normal medium for cultivation.
4.3. Cytotoxicity and MDR reversal assay
A549, A549/Tax, MCF-7, MCF-7/ADR, HCT-8, HCT-8/A549 cells were inoculated in 96-well plates at a density of 1×10⁵~1.2×10⁵ cells/mL and cultured for 24h. Tumor cells were treated with different concentrations of compounds dissolved with 0.1% DMSO (final concentrations of tested compounds or Vrp: 0, 5, 10, 20 μM; final concentrations of Tax, ADR and VCR: 0, 0.25, 0.5, 2.5, 5, 10, 20, 40, and 80 μM) and incubated in 5% CO2 incubator at 37 °C for 24 h. Subsequently, 10 μL of CCK-8 reagent was added to each well and incubation was continued for 1 h. Absorbance (OD) was measured at 450 nm using an enzyme marker to calculate the cytotoxicity of the tested compounds and the IC50 value of anti-tumor drugs. Concentrations with cell survival rate>80% were selected as the non-toxic dosages of tested compounds. Next, the tested compounds with non-toxic dosages were co-administered with Tax, ADR and VCR, the IC50 values of Tax, ADR and VCR were also measured using the CCK-8 assay to assess the MDR reversal function of the tested compounds. The experiments were repeated three times in parallel. Data analysis was represented by GraphPad Prism 8.0.2 software (GraphPad software, USA) [32].
4.4. Western blot assay
P-gp protein levels in A549/Tax cells treated with compound 37 (2.5, 5, 10 μM) or Vrp (10 μM) for 24 h were detected by Western blot. Briefly, after treatment, A549 and A549/Tax cells were lysed in RIPA lysis buffer (Beyotime, China) containing 1% phenylmethylsulfonylfluoride (PMSF), and centrifuged at 4 °C, 12,000 rpm for 10 min. The supernatants were used for protein quantifications. Protein concentrations were quantified by the Protein Assay Kit (Beyotime, China). Proteins were separated by 10% sodium dodecyl sulfate-polyacrylamide gel electrophoresis and transferred to polyvinylidene fluoride membranes (Millipore, USA). The membranes were then incubated with anti-Pgp antibody (Ab261736, Abcam) or anti-β-actin antibody (81115-1-RR, Proteintech) with HRP-conjugated secondary antibody (074-1506, KPL). Chemiluminescence detection was performed using a chemiluminescence imaging system (ClinxChemiscope 6000, China). The experiments were repeated three times.
4.5. Intracellular Rh123 accumulation assay
A549 and A549/Tax cells in logarithmic growth phase were collected, resuspended and formulated into single-cell suspension, inoculated into 24-well plates at a cell density of 1×10⁶ cells/mL, and incubated at 37 °C in a 5% CO2 incubator for 24 h. A549/Tax cells were treated with compound 37 (2.5, 5, 10 μM) or Vrp (10 μM) for 24 h. In the dark, Rh123 and Hoechst33342 were added and incubated for 30 min and 1 h, respectively. The unbound dye was washed away with PBS, and 500 μL of PBS was added to each well. The 24-well plates were placed under a fluorescence microscope (Olympus BX50, Japan) to observe the accumulation of intracellular Rh123 and the average fluorescence intensity was calculated using Image J software (NIH, Japan).
4.6. ATPase activity assay
A549 and A549/Tax cells were seeded into 96-well plates at a cell density of 1×10⁵ cells/mL, and incubated at 37 °C in a 5% CO2 incubator for 24 h. A549/Tax cells were treated with compound 37 (2.5, 5, 10μM) or Vrp (10μM) for 24 h. According to the instructions, the diluted Pgp protein was added to compound 37 or Vrp and incubated at 37 °C for 5 min, then Mg-ATP was added and mixed well, incubated at 37 °C for another 40 min. ATP detection reagent was added to stop the reaction and start luminescence for 20 min at room temperature. The luminescence was detected using a Synergy H1 Enzyme Marker (BioTek, USA) [33].
4.7. Molecular docking
Autodock 4.2.6 was used to predict the binding pattern between compound 37 and human P-gp structures. The 3D crystal structure of human P-gp (PDB ID:6QEX) was downloaded from RCSB Protein Data Bank (http://www.rcsb.org/pdb) and established through preprocessing by removing water, metal ions, and eutectic ligands. The structure of compound 37 was generated using Chem3D 19.0 software (CambridgeSoft Co., USA) and the energy minimization process was performed to obtain the ligand file of mol2. The binding site of P-gp to compound 37 was set to x=173.330, y=166.743, z=161.482, and the grid box with the binding site as the center of the grid was set a dimension of 40×40×40 points, and the grid point spacing was set to 0.375 Å. The minimum binding energy value of compound 37 and human P-gp was calculated to evaluate the docking mode.
4.8. Cellular metabolomics
Cell samples of the control, model, and treatment groups (n = 6) were analyzed for metabolic profiles in positive and negative modes using UPLC-Q/TOF-MS.
4.8.1. Preparation of cell samples
4.8.1.1. Cell culture
A549 cells and A549/Tax cells were inoculated in 6-well plates with a cell density of 1×10⁶ cells/mL, and placed in a 37 °C, 5% CO2 cell culture incubator for 24 h. The experiments were divided into control group, model group and treatment group, Tax (2.6 μM) treated A549 cells for 24 h as control group, Tax (2.6 μM) treated A549/Tax cells for 24 h as model group, Tax (2.6 μM) and compound 37 (10 μM) co-treated A549/Tax cells for 24 h as treatment group. There were six parallel replicates in each group, and cells were subsequently collected as metabolomic samples.
4.8.1.2. Cell quenching and metabolites extraction
The above cell samples were obtained, the original culture medium was discarded and the cells were washed with 2 mL of ice-cold phosphate buffered saline (PBS). In order to make the cells fragment, the cells were quenched with liquid nitrogen for 10 min before thawing in a 37 °C incubator, and the freeze-thaw process was repeated three times. Subsequently, 400 μL of ice methanol was added to cover the cells, and the 6-well plates were stored in a -80 °C refrigerator for 30 min.
After removing the 6-well plates from -80 °C, 100 μL of 80% methanol was added to each well and the cells were collected with a cell scraper and transferred to a centrifuge tube, 200 μL of 80% methanol was added to wash the cell residue, then the cells were vortexed for 5 min and ultrasonicated for 10 min, centrifuged for 10 min at 13,000 rpm at 4 °C to extract the supernatants. The samples were freeze-dried and reconstituted with 300 μL of 80% methanol, centrifuged at 13,000 rpm for 10 min at 4 °C, and the supernatants were extracted to obtain the samples to be tested. 10 μL of each sample was aspirated and mixed to obtain a quality control (QC) sample and the QC sample was randomly injected.
4.8.2. UPLC-Q/TOF-MS conditions
The Waters Xevo G2-XS QTOF mass spectrometer (Waters Co., USA) was equipped with a UPLC system via an electrospray ionization (ESI) interface to test and analyze samples in both positive and negative modes.
A Waters ACQUITY UPLC BEH C18 column (100 mm×2.1 mm, 1.7 μm; Waters Co., USA) was used for the chromatographic separation, with the column temperature set at 30 °C and the sample manager temperature set at 15 °C. The mobile phase A was 0.1% formic acid aqueous solution (v/v) and mobile phase B was 0.1% formic acid acetonitrile solution (v/v). The elution program was as follows: 0~2 min, 10% B; 2~26 min, 10%→100% B; 26~28 min, 100% B; 28~28.1 min, 100%→10% B; 28.1~40 min, 10% B, at a flow rate of 0.4 mL/min.
Data was collected using an ESI source in MSE centroid mode with the following MS parameters: source temperature 180 °C, desolvation temperature 350 °C, and desolvation gas flow rate 700 L/h; cone voltage 50 V, and cone gas flow rate 50 L/h; low-energy channel energy 6 V, and high-energy channel energy 20~40 V; capillary voltage 2.5 kV (ESI+) and 2.3 kV (ESI-). Sodium formate solution at 20 μg/mL was used to calibrate the instrument mass number to ensure mass reproducibility and accuracy. The real-time calibration solution was leucine-enkephalin (100 ng/mL) m/z 556.2771 (ESI+) and 554.2615 (ESI-), and the real-time calibration flow rate was 10 μL/min; the mass scanning range was m/z 100-1200 Da. The sample injection volume was 5 μL for each run, and the QC sample was injected randomly. Data was collected using a MassLynxTM V4.1 workstation.
4.8.3. Validation of UPLC-Q/TOF-MS
The UPLC-MS method should be validated in ESI+ and ESI- including:
(i) System stability: QC samples were randomly injected five times.
(ii)Sample stability: the same cell sample was placed in the sample manager for 0, 2, 4, 8, 10, and 12 h and measured.
(iii)Precision: The same QC sample was taken for five consecutive injections to assess precision.
(iv) Reproducibility: Reproducibility was assessed by testing five replicates of the same cell sample prepared in parallel.
Under the ESI+ and ESI- modes, 10 ion pairs with different retention time and m/z were selected to investigate the stability, precision and reproducibility, and the relative standard deviation (RSD) of peak area and retention time were calculated.
4.8.4. Metabolomic data analysis
Based on the UPLC-Q/TOF-MS platform, metabolites and related metabolic pathways which were closely related to the reversal of MDR effects exerted by compound 37 were searched. The main processes were as follows:
(i) The MarkerLynx XS V4.1 software (Waters Co., USA) was used for peak detection, calibration, de-folding, data reduction and normalization of the collected data. The main parameters included: retention time 0~30 min, mass range 100~1200 Da, mass error 0.10, retention time deviation 0.10, peak threshold 5000, and noise elimination level 7.
(ii) The datus obtained above were subjected to multivariate statistical analysis, including PCA and OPLS-DA. PCA could evaluate the differentiation profile between groups, OPLS-DA maximized the separation between the two samples, and validity and predictive accuracy were evaluated with Permutation Test R2/Q2 values. S-plots were created to explore differential metabolites using Variable Importance in the Projection (VIP) values. Metabolites with VIP>1.0 and p<0.01 in the S-plots were screened as differential metabolites [34].
(iii) HMDB (http://www.hmdb.ca/), KEGG (http://www.kegg.com/), METLIN (http://metlin.scripps.edu/) and MetaboAnalyst (http://www.Metaboanalyst.ca/) databases were utilized to screen and identify differential metabolites. The identification method was performed by comparing the retention time and fragmentation information with the databases and selecting the pathways with impact>0.1 in the MetaboAnalyst database as the key signaling pathways [35]. Heatmaps were used to visualize the changes of contents of potential biomarkers.
(iv) ROC curves were used to validate differential metabolites, and differential metabolites with area under the curve (AUC)>0.8 were considered to be metabolites which were closely related to the action of compound 37 [35].
4.9. Statistical analysis
The experimental results were analyzed using SPSS software (Version 20.0, USA), and all data were expressed as mean ± standard deviation (SD). One-Way Analysis of Variance (ANOVA) combined with Tukey's test was used to analyze the comparison between different groups, and p-value < 0.05 was considered as statistically significant.
5. Conclusions
In current study, a total of 40 amino acid ester derivatives of Pyxinol and 24S-Pyxinol, including 8 new compound, were synthesized. A549/Tax, MCF-7/ADR, and HCT-8/VCR cells were used to investigate the MDR reversal effects of these derivatives. Compounds 8, 14, 16~18, 23, 25, 34, 36, 37 exhibited strong MDR reversal effect with RF values greater than 5. Among them, 10 μM of new derivative 37 showed the outstanding activity (RF: 15.31) in A549/Tax cells.It could play a role in reversing P-gp-mediated tumor MDR by inhibiting P-gp efflux function. Cellular metabolomic analysis showed that 14 differential metabolites and 6 metabolic pathways were closely associated with the reversal of tumor MDR effects of compound 37. Overall, the novel agent (24S-3-L-threonyl-Pyxinol) was successfully screened in drug-resistant cells. This study could provide a new candidate compound for reversing tumor MDR.
Author Contributions
Luying Tan: Methodology, Software, Writing and Original draft. Peng Gao: Software and visualization. Zhuoqiao Li: Software and Data curation. Chencheng Gao: Methodology and Formal analysis. Xiaoyu Geng: Methodology and Formal analysis. Qianyun Wang: Methodology. Daohao Tang: Methodology. Fang Wang: Conceptualization and Funding acquisition. Jinping Liu: Conceptualization, Data curation, Funding acquisition, Investigation, Supervision, Validation, Resources, Writing – review & editing.
Funding
This work was supported by the Science and Technology Development Project of Jilin Province (No. 20230204038YY, 20230204055YY).
Data Availability Statement
The data presented in this study are available on request from the corresponding author.
Conflicts of Interest
All the authors declare that there are no conflicts of interest associated with this publication and there is no significant financial support for this work that could have influenced its outcome.
Abbreviations
ABC: ATP-binding cassette; AUC, area under the curve; BCRP, breast cancer resistance protein; BPI, base peak intensity; DMAP, 4-dimethylamino-pyridine; EDC, 1-ethyl-3- (3-dimethylaminopropyl) carbodiimide; ESI, electrospray ionization; FBS, fetal bovine serum; MDR, multidrug resistance; MRP1, multidrug resistance associated protein 1; OPLS-DA, Orthogonal Partial Least-Squares Discrimination Analysis; P-gp, P-glycoprotein; PPD, Protopanaxadiol; PCA, Principal Component Analysis; QC, quality control; Rh123, Rhodamine123; RF, reversal fold; RI, resistance index; ROC, receiver operating characteristic; RSD, relative standard deviation; SARs, structure-activity relationships; SD, standard deviation; TFA, trifluoroacetic acid; TLC, thin layer chromatography; UPLC-Q/TOF-MS, Ultra Performance Liquid Chromatography Quadrupole-Time of Flight Mass Spectrome; VIP, Variable Importance in the Projection.
References
- Kibria, G.; Hatakeyama, H.; Harashima, H. Cancer multidrug resistance: Mechanisms involved and strategies for circumvention using a drug delivery system. Archive pharmacal research 2014, 37, 4–15. [Google Scholar] [CrossRef] [PubMed]
- Ford, J.M.; Halt, W.N. Pharmacology of drugs that alter multidrug resistance in cancer. Pharmacological reviews 1990, 42, 155–199. [Google Scholar] [PubMed]
- Kumar, A.; Jaitak, V. Natural products as multidrug resistance modulators in cancer. European journal of medicinal chemistry 2019, 176, 268–291. [Google Scholar] [CrossRef] [PubMed]
- Bukowski, K.; Kciuk, M.; Kontek, R. Mechanisms of multidrug resistance in cancer chemotherapy. International journal of molecular sciences 2020, 21, 3233–3257. [Google Scholar] [CrossRef] [PubMed]
- Kartal-Yandim, M.; Adan-Gokbulut, A.; Baran, Y. Molecular mechanisms of drug resistance and its reversal in cancer. Critical reviews in biotechnology 2016, 36, 716–726. [Google Scholar] [CrossRef]
- Bogman, K.; Peyer, A.K.; TöRöK, M.; Küsters, E.; Drewe, J. HMG-CoA reductase inhibitors and P-glycoprotein modulation. British journal of pharmacology 2001, 132, 1183–1192. [Google Scholar] [CrossRef]
- Glaeser, H. Importance of P-glycoprotein for drug-drug interactions. Handbook of experimental pharmacology 2011, 201, 285–297. [Google Scholar]
- Kathawala, R.J.; Gupta, P.; Ashby, C.R.; Chen, Z.-S. The modulation of ABC transportermediated multidrug resistance in cancer: A review of the past decade. Drug Resistant Update 2015, 18, 1–17. [Google Scholar] [CrossRef]
- Joshi, P.; Vishwakarma, R.A.; Bharate, S.B. Natural alkaloids as P-gp inhibitors for multidrug resistance reversal in cancer. European journal of medicinal chemistry 2017, 138, 273–292. [Google Scholar] [CrossRef]
- Shah, D.; Ajazuddin; Bhattacharya, S. Role of natural P-gp inhibitor in the effective delivery for chemotherapeutic agents. Journal of cancer research and clinical oncology 2023, 149, 367–391. [Google Scholar] [CrossRef]
- Silva, N.; Fortuna, A.; Salgueiro, L.; Cavaleiro, C. The essential oil from the fruits of Peucedanum oreoselinum (L.) Moench (Apiaceae) as a natural source of P-glycoprotein inhibitors. Journal of herbal medicine 2021, 29, 100482. [Google Scholar] [CrossRef]
- Di Sotto, A.; Irannejad, H.; Eufemi, M.; Mancinelli, R.; Abete, L.; Mammola, C.L.; Altieri, F.; Mazzanti, G.; Di Giacomo, S. Potentiation of Low-Dose Doxorubicin Cytotoxicity by Affecting P-Glycoprotein through Caryophyllane Sesquiterpenes in HepG2 Cells: An in Vitro and in Silico Study. International journal of molecular sciences 2020, 21, 633. [Google Scholar] [CrossRef]
- Yang, T.; Wang, S.; Li, H.; Zhao, Q.; Yan, S.; Dong, M.; Liu, D.; Chen, X.; Li, R. Lathyrane diterpenes from Euphorbia lathyris and the potential mechanism to reverse the multi-drug resistance in HepG2/ADR cells. Biomedicine & Pharmacotherapy 2020, 121, 109663. [Google Scholar]
- Silva, C.D.; Ramalhete, C.; Spengler, G.; Mulhovo, S.; Molnar, J.; Ferreira, M.U. Triterpenes from Momordica balsamina (African pumpkin): ABCB1 inhibition and synergistic interaction with doxorubicin in resistant cancer cells. Phytochemistry 2022, 203, 113354. [Google Scholar] [CrossRef] [PubMed]
- Zhang, J.; Zhou, F.; Wu, X.; Zhang, X.; Chen, Y.; Zha, B.S.; Niu, F.; Lu, M.; Hao, G.; Sun, Y.; Sun, J.; Peng, Y.; Wang, G. Cellular pharmacokinetic mechanisms of adriamycin resistance and its modulation by 20(S)-ginsenoside Rh2 in MCF-7/Adr cells. British journal of pharmacology 2012, 165, 120–134. [Google Scholar] [CrossRef]
- Li, Y.; Wang, Z.Z.; Yu, T.F. In vitro study on the reversal of multidrug resistance (MDR) in HL60/VCR cell line with Ginsenoside-Rb1. Journal-of-radioimmunology 2005, 18, 362–365. [Google Scholar]
- Liu, C.; Gong, Q.; Chen, T.; Lv, J.; Feng, Z.; Liu, P.; Deng, Z. Treatment with 20(S)-ginsenoside Rg3 reverses multidrug resistance in A549/DDP xenograft tumors. Oncology letters 2018, 15, 4376–4382. [Google Scholar] [CrossRef]
- Zhang, J.W.; Zhou, F.; Niu, F.; Lu, M.; Wu, X.L.; Sun, J.G.; Wang, G.J. Stereoselective regulations of P-glycoprotein by ginsenoside Rh2 epimers and the potential mechanisms from the view of pharmacokinetics. PLoS ONE 2012, 7, 1–9. [Google Scholar] [CrossRef] [PubMed]
- Li, L.; Chen, X.; Li, D.; Zhong, D. Identification of 20(S)-protopanaxadiol metabolites in human liver microsomes and human hepatocytes. Drug metabolism and disposition 2011, 39, 472–483. [Google Scholar] [CrossRef]
- Wang, W.; Wu, X.; Wang, L.; Meng, Q.; Liu, W. Stereoselective property of 20(S)-protopanaxadiol ocotillol type epimers affects its absorption and also the inhibition of P-glycoprotein. PLoS ONE 2014, 9, 1–10. [Google Scholar] [CrossRef] [PubMed]
- Wang, C.; Gao, M.; Liu, S.; Zou, Z.; Ren, R.; Zhang, C.; Xie, H.; Sun, J.; Qi, Y.; Qu, Q.; Song, Z.; Yang, G.; Wang, H. Pyxinol bearing amino acid residues: Easily achievable and promising modulators of P-glycoprotein-mediated multidrug resistance. European journal of medicinal chemistry 2021, 216, 113317. [Google Scholar] [CrossRef] [PubMed]
- Ren, Q.; Yang, G.; Guo, M.; Guo, J.; Li, Y.; Lu, J.; Yang, Q.; Tang, H.; Li, Y.; Fang, X.; Sun, Y.; Qi, J.G.; Tian, J.; Wang, H. Design, synthesis, and discovery of ocotillol-type amide derivatives as orally available modulators of P-glycoprotein-mediated multidrug resistance. European journal of medicinal chemistry 2019, 161, 118–130. [Google Scholar] [CrossRef] [PubMed]
- Wang, K.Y.; Zhou, Z.W.; Zhang, H.Y.; Cao, Y.C.; Xu, J.Y.; Ma, C.; Meng, Q.G.; Bi, Y. Design, Synthesis and Antibacterial Evaluation of 3-Substituted Ocotillol-Type Derivatives. Molecules 2018, 23, 3320. [Google Scholar] [CrossRef] [PubMed]
- Zhou, Z.; Ma, C.; Zhang, H.; Bi, Y.; Chen, X.; Tian, H.; Xie, X.; Meng, Q.; Lewis, P.J.; Xu, J. Synthesis and biological evaluation of novel ocotillol-type triterpenoid derivatives as antibacterial agents. European Journal of Medicinal Chemistry 2013, 68, 444–453. [Google Scholar] [CrossRef]
- Zhang, Y. Studies on Synthesis,Anti-tumor Activity and Pharmacokineticsof Amino Acid Ester Derivatives of Ginsengenins. Doctor’s Thesis, Jilin University,, Jilin, China, 2022. [Google Scholar]
- Cheng, G.R. The Mechanism Study of Chinese Medicine on Reversing Multidrug Resistance and Metastasis to Breast Cancer. Doctor’s Thesis, University of Science and Technology of China, Hefei, China, 2021. [Google Scholar]
- Wen, X.Z.; Zhou, F.; Wu, X.L.; Wang, G.J. Research advance on P-glycoprotein inhibitors and the structure-activity relationship. Chinese Journal of Clinical Pharmacology and Therapeutics 2010, 15, 814–820. [Google Scholar]
- Ahn, E.H.; Lee, M.B.; Seo, D.J.; Lee, J.; Kim, Y.; Gupta, K. Sphingosine induces apoptosis and down-regulation of MYCN in PAX3-FOXO1-positive alveolar rhabdomyosarcoma cells irrespective of TP53 mutation. Anticancer research 2018, 38, 71–76. [Google Scholar]
- Loo, T.W.; Clarke, D.M. P-glycoprotein ATPase activity requires lipids to activate a switch at the first transmission interface. Biochemical & biophysical research communications 2016, 472, 379–383. [Google Scholar]
- Zhao, T.Y. The tumor-promoting effect and mechanism of glycerophospholipid-related gene LPCAT1 in endometrial cancer. Master’s Thesis, Shandong University, Jinan, China, 2022. [Google Scholar]
- Zhang, Y.; Yu, H.; Fu, S.Z.; Tan, L.Y.; Liu, J.L.; Zhou, B.S.; Li, L.; Liu, Y.H.; Wang, C.X.; Li, P.Y.; Liu, J.P. Synthesis and Anti-Hepatocarcinoma Effect of Amino Acid Derivatives of Pyxinol and Ocotillol. Molecules 2021, 26, 780. [Google Scholar] [CrossRef]
- Song, Z.; Wang, C.; Ding, F.; Zou, H.; Liu, C. Ganoderic Acid A Enhances Tumor Suppression Function of Oxaliplatin via Inducing the Cytotoxicity of T Cells. Anti-cancer agents in medicinal chemistry 2023, 23, 832–838. [Google Scholar]
- Yang, Y.; Guan, D.; Lei, L.; Lu, J.; Liu, J.Q.; Yang, G.; Yan, C.; Zhai, R.; Tian, J.; Bi, Y.; Fu, F.; Wang, H. H6, a novel hederagenin derivative, reverses multidrug resistance in vitro and in vivo. Toxicology & Applied Pharmacology 2018, 341, 98–105. [Google Scholar]
- Jiao, Y.F.; Si, Y.; Li, L.; Wang, C.Z.; Lin, H.Q.; Liu, J.L.; Liu, Y.H.; Liu, J.P.; Li, P.Y.; Li, Z. Comprehensive phytochemical profiling of American ginseng in Jilin province of China based on ultrahigh-performance liquid chromatography quadrupole time-of-flight mass spectrometry. Journal of mass spectrometry: JMS 2021, 56, e4787. [Google Scholar] [CrossRef] [PubMed]
- Wang, C.Z.; Yuan, Y.Z.; Pan, H.; Hsu, A.C.Y.; Chen, J.L.; Liu, J.P.; Li, P.Y.; Wang, F. Protective Effect of Ocotillol, the Derivate of Ocotillol-Type Saponins in Panax Genus, against Acetic Acid-Induced Gastric Ulcer in Rats Based on Untargeted Metabolomics. International Journal of Molecular Sciences 2020, 21, 2577. [Google Scholar] [CrossRef] [PubMed]
Figure 1.
Structures of Pyxinol, 24S-Pyxinol and 3c.
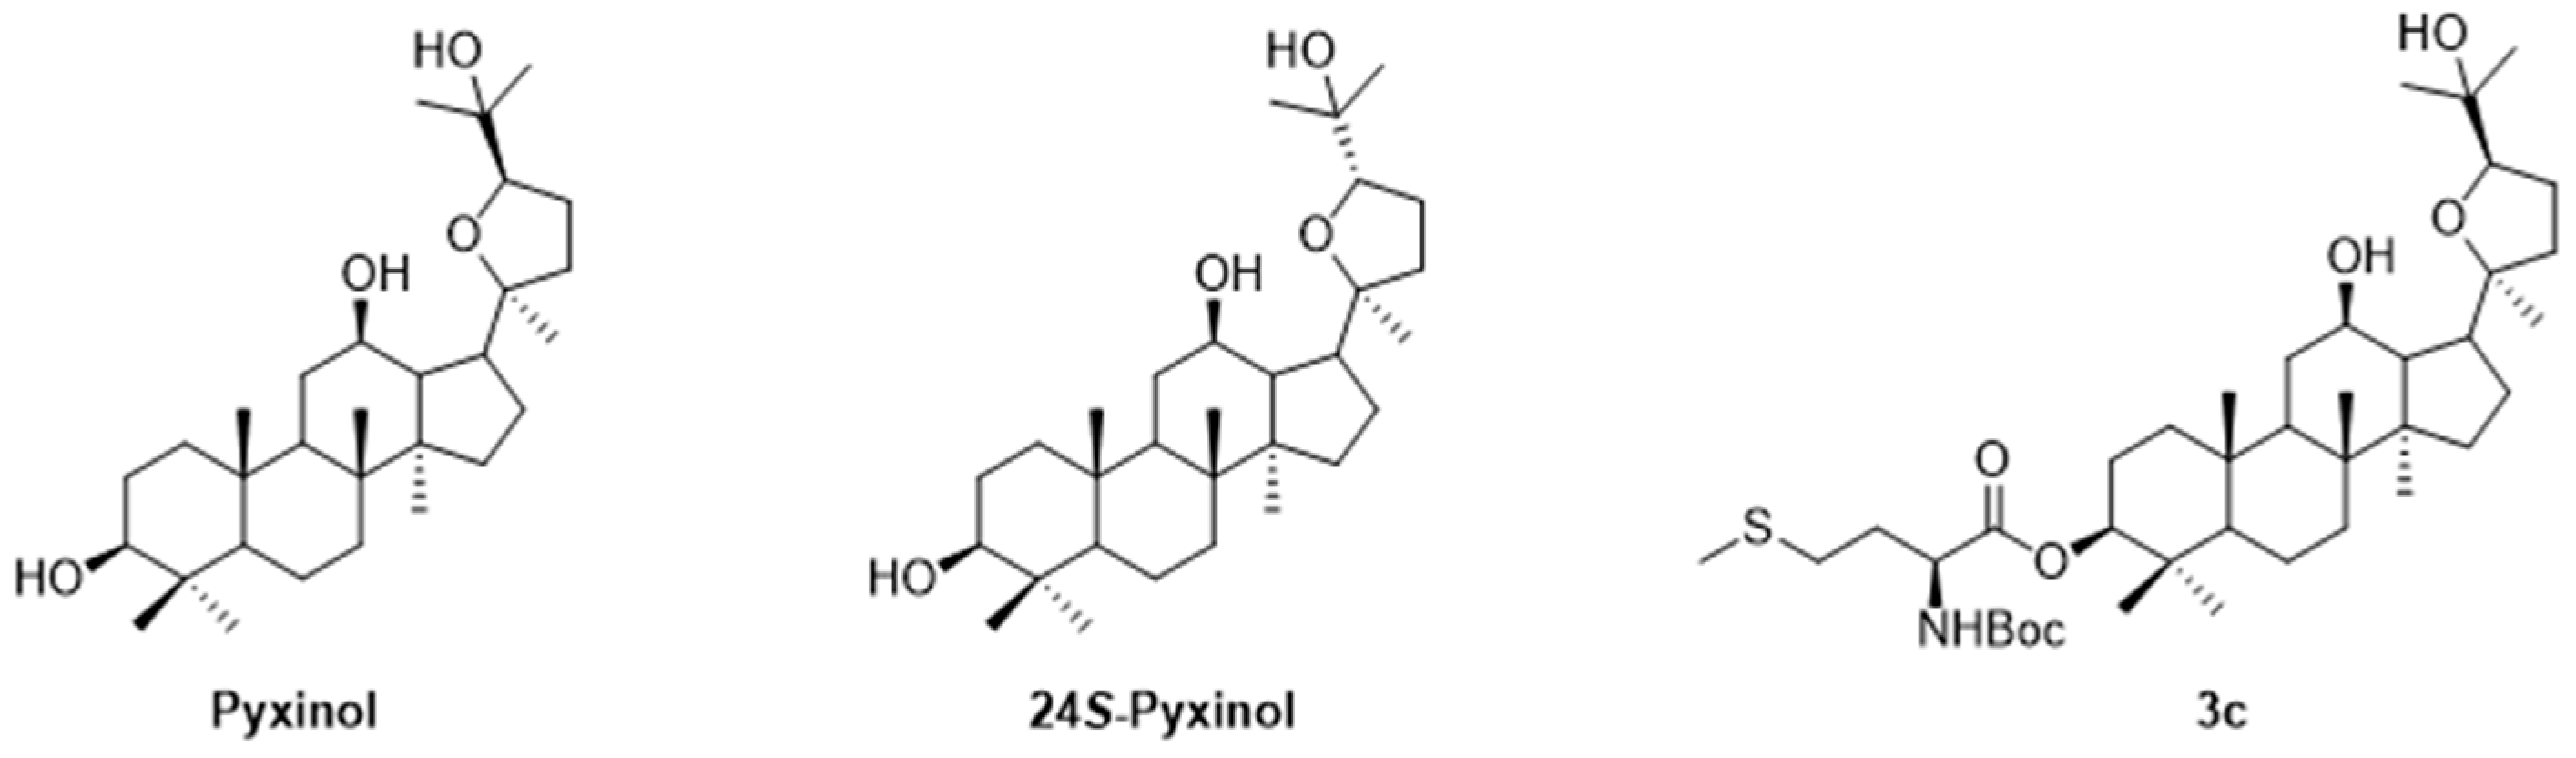
Figure 2.
Synthesis of Pyxinol and 24S-Pyxinol amino acid ester derivatives 1-40 (tBu: tert-butyl; Boc: t-butyloxy carbonyl).
Figure 2.
Synthesis of Pyxinol and 24S-Pyxinol amino acid ester derivatives 1-40 (tBu: tert-butyl; Boc: t-butyloxy carbonyl).
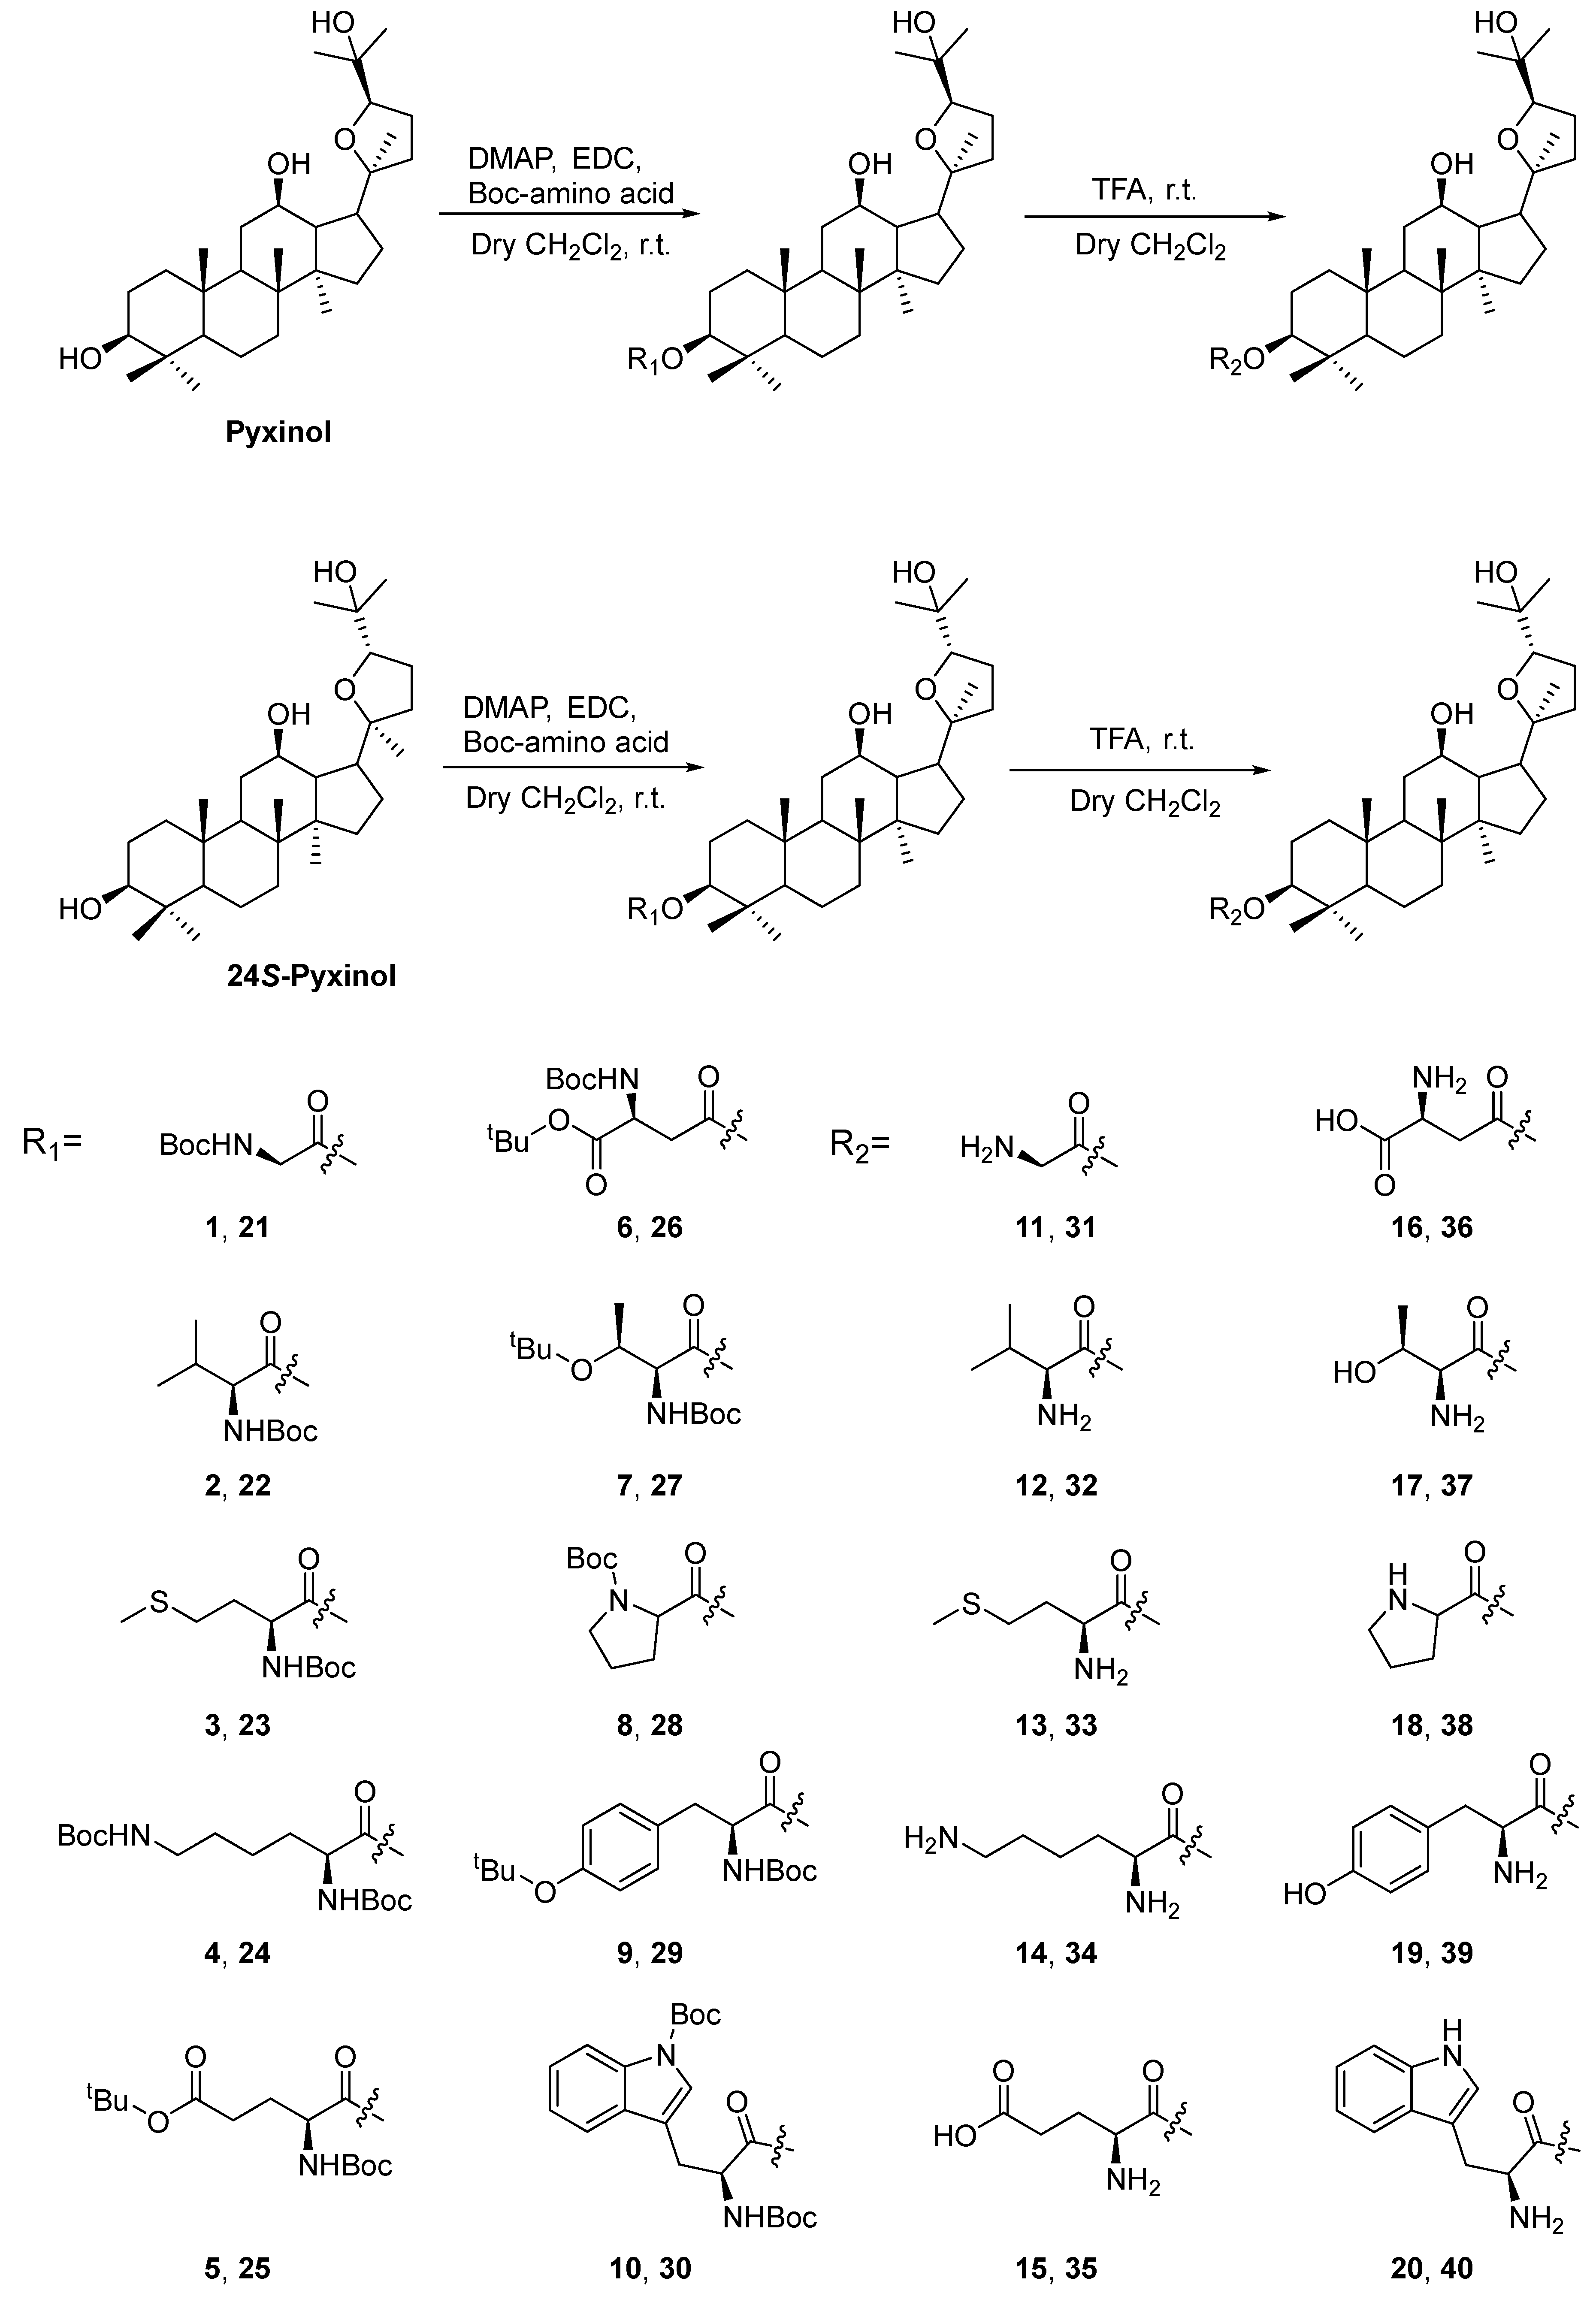
Figure 3.
Effect of compound 37 on the protein expression level of P-gp. All data were presented as means ± SD (n = 3). ***p<0.001, vs A549/Tax group.
Figure 3.
Effect of compound 37 on the protein expression level of P-gp. All data were presented as means ± SD (n = 3). ***p<0.001, vs A549/Tax group.
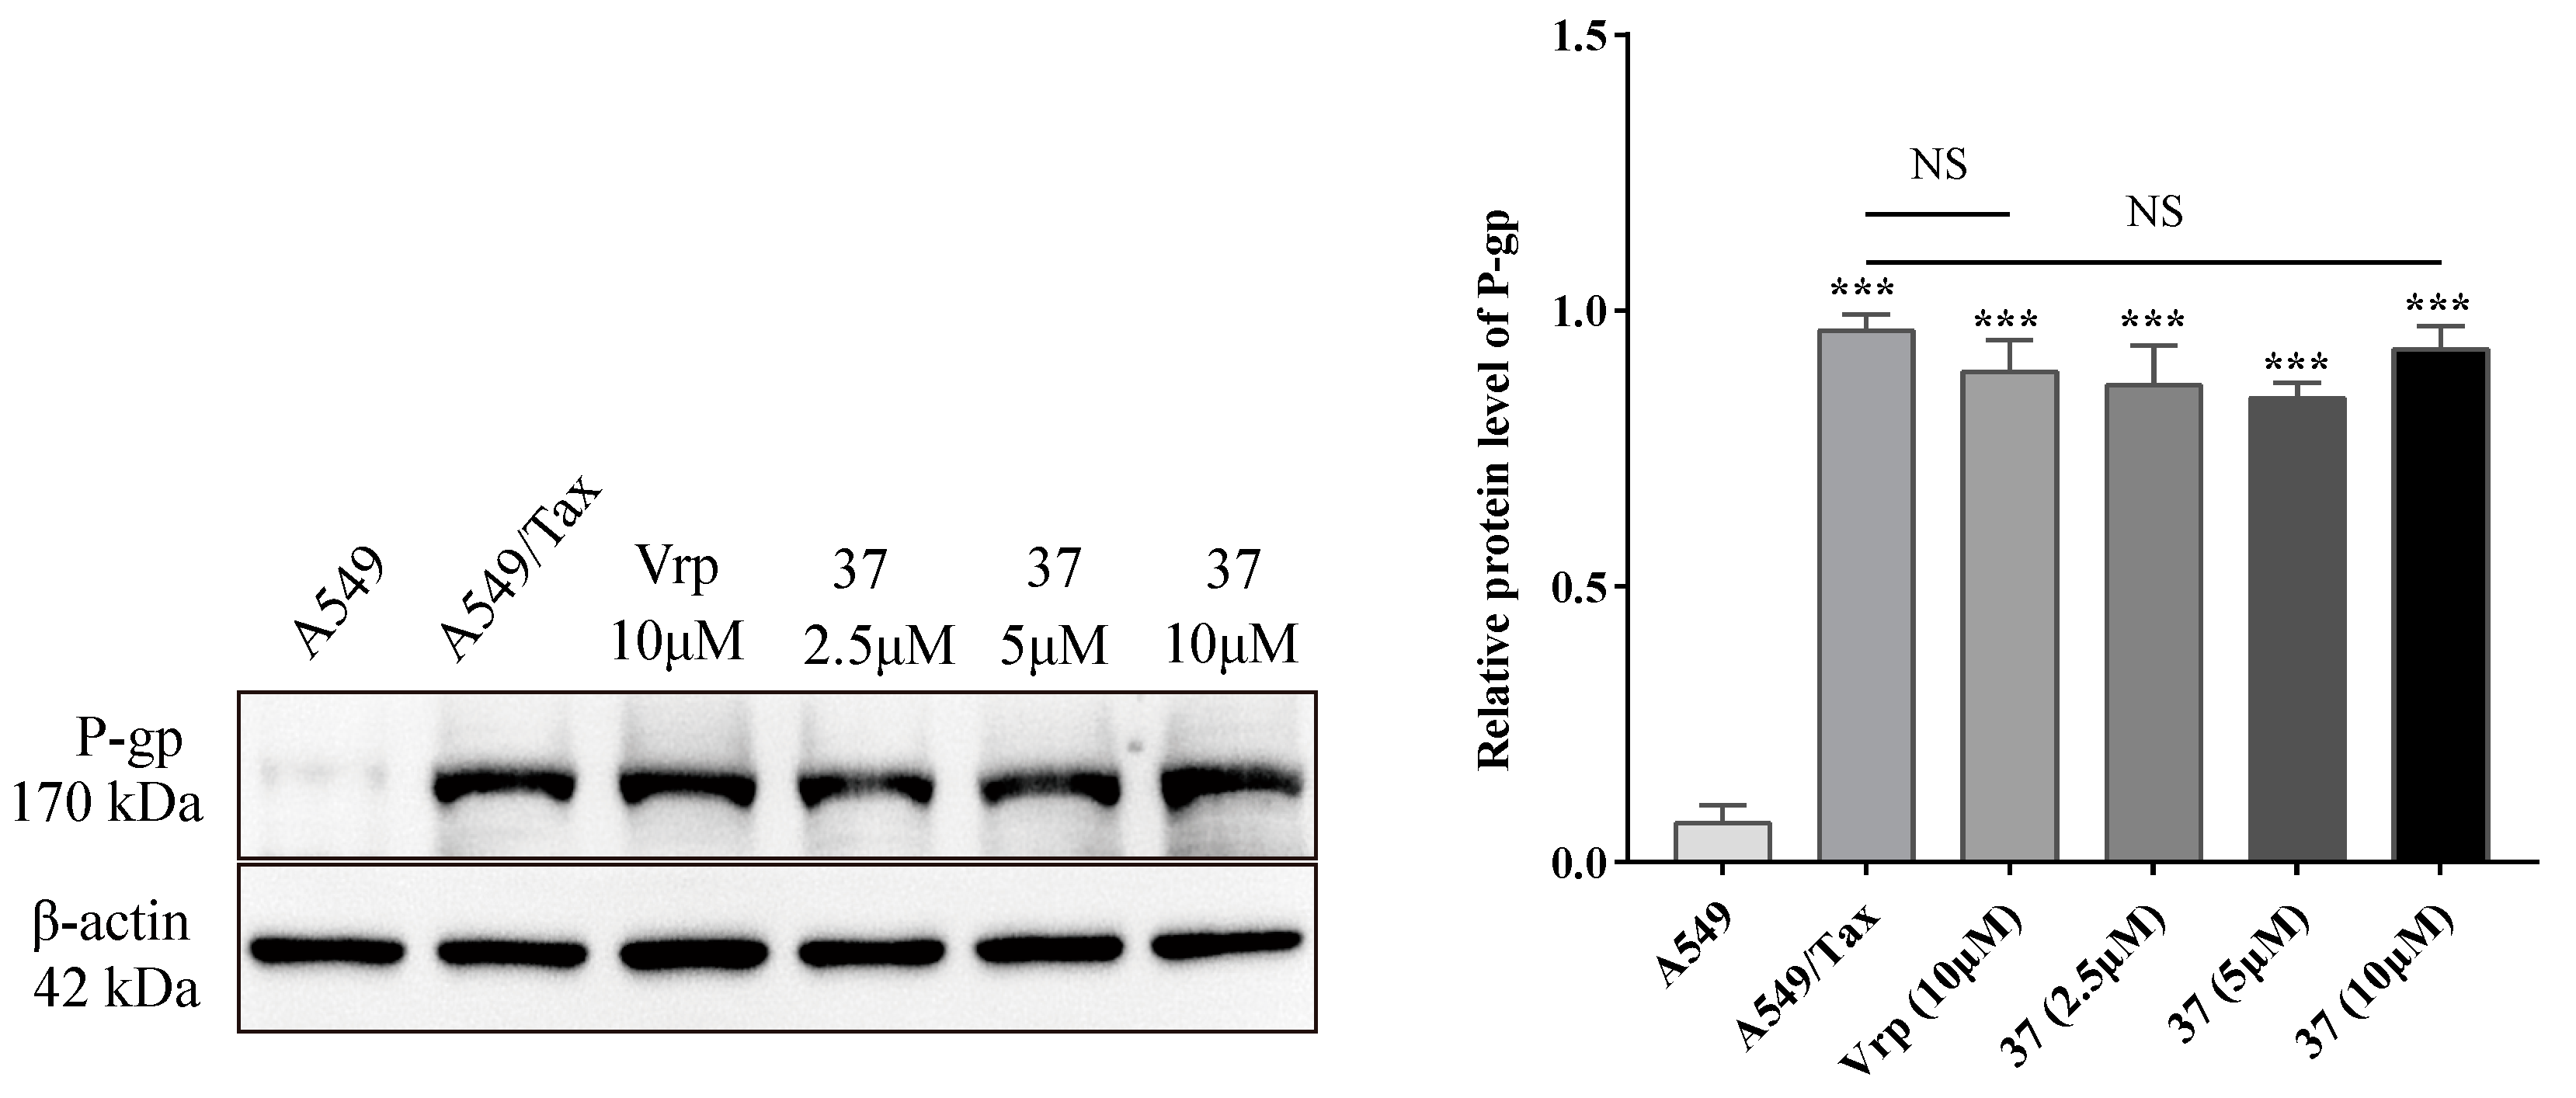
Figure 4.
Effect of compound 37 on intracellular Rh123 accumulation in A549/Tax cells. All data were presented as means ± SD (n=3). ***p<0.001, vs A549/Tax model group.
Figure 4.
Effect of compound 37 on intracellular Rh123 accumulation in A549/Tax cells. All data were presented as means ± SD (n=3). ***p<0.001, vs A549/Tax model group.
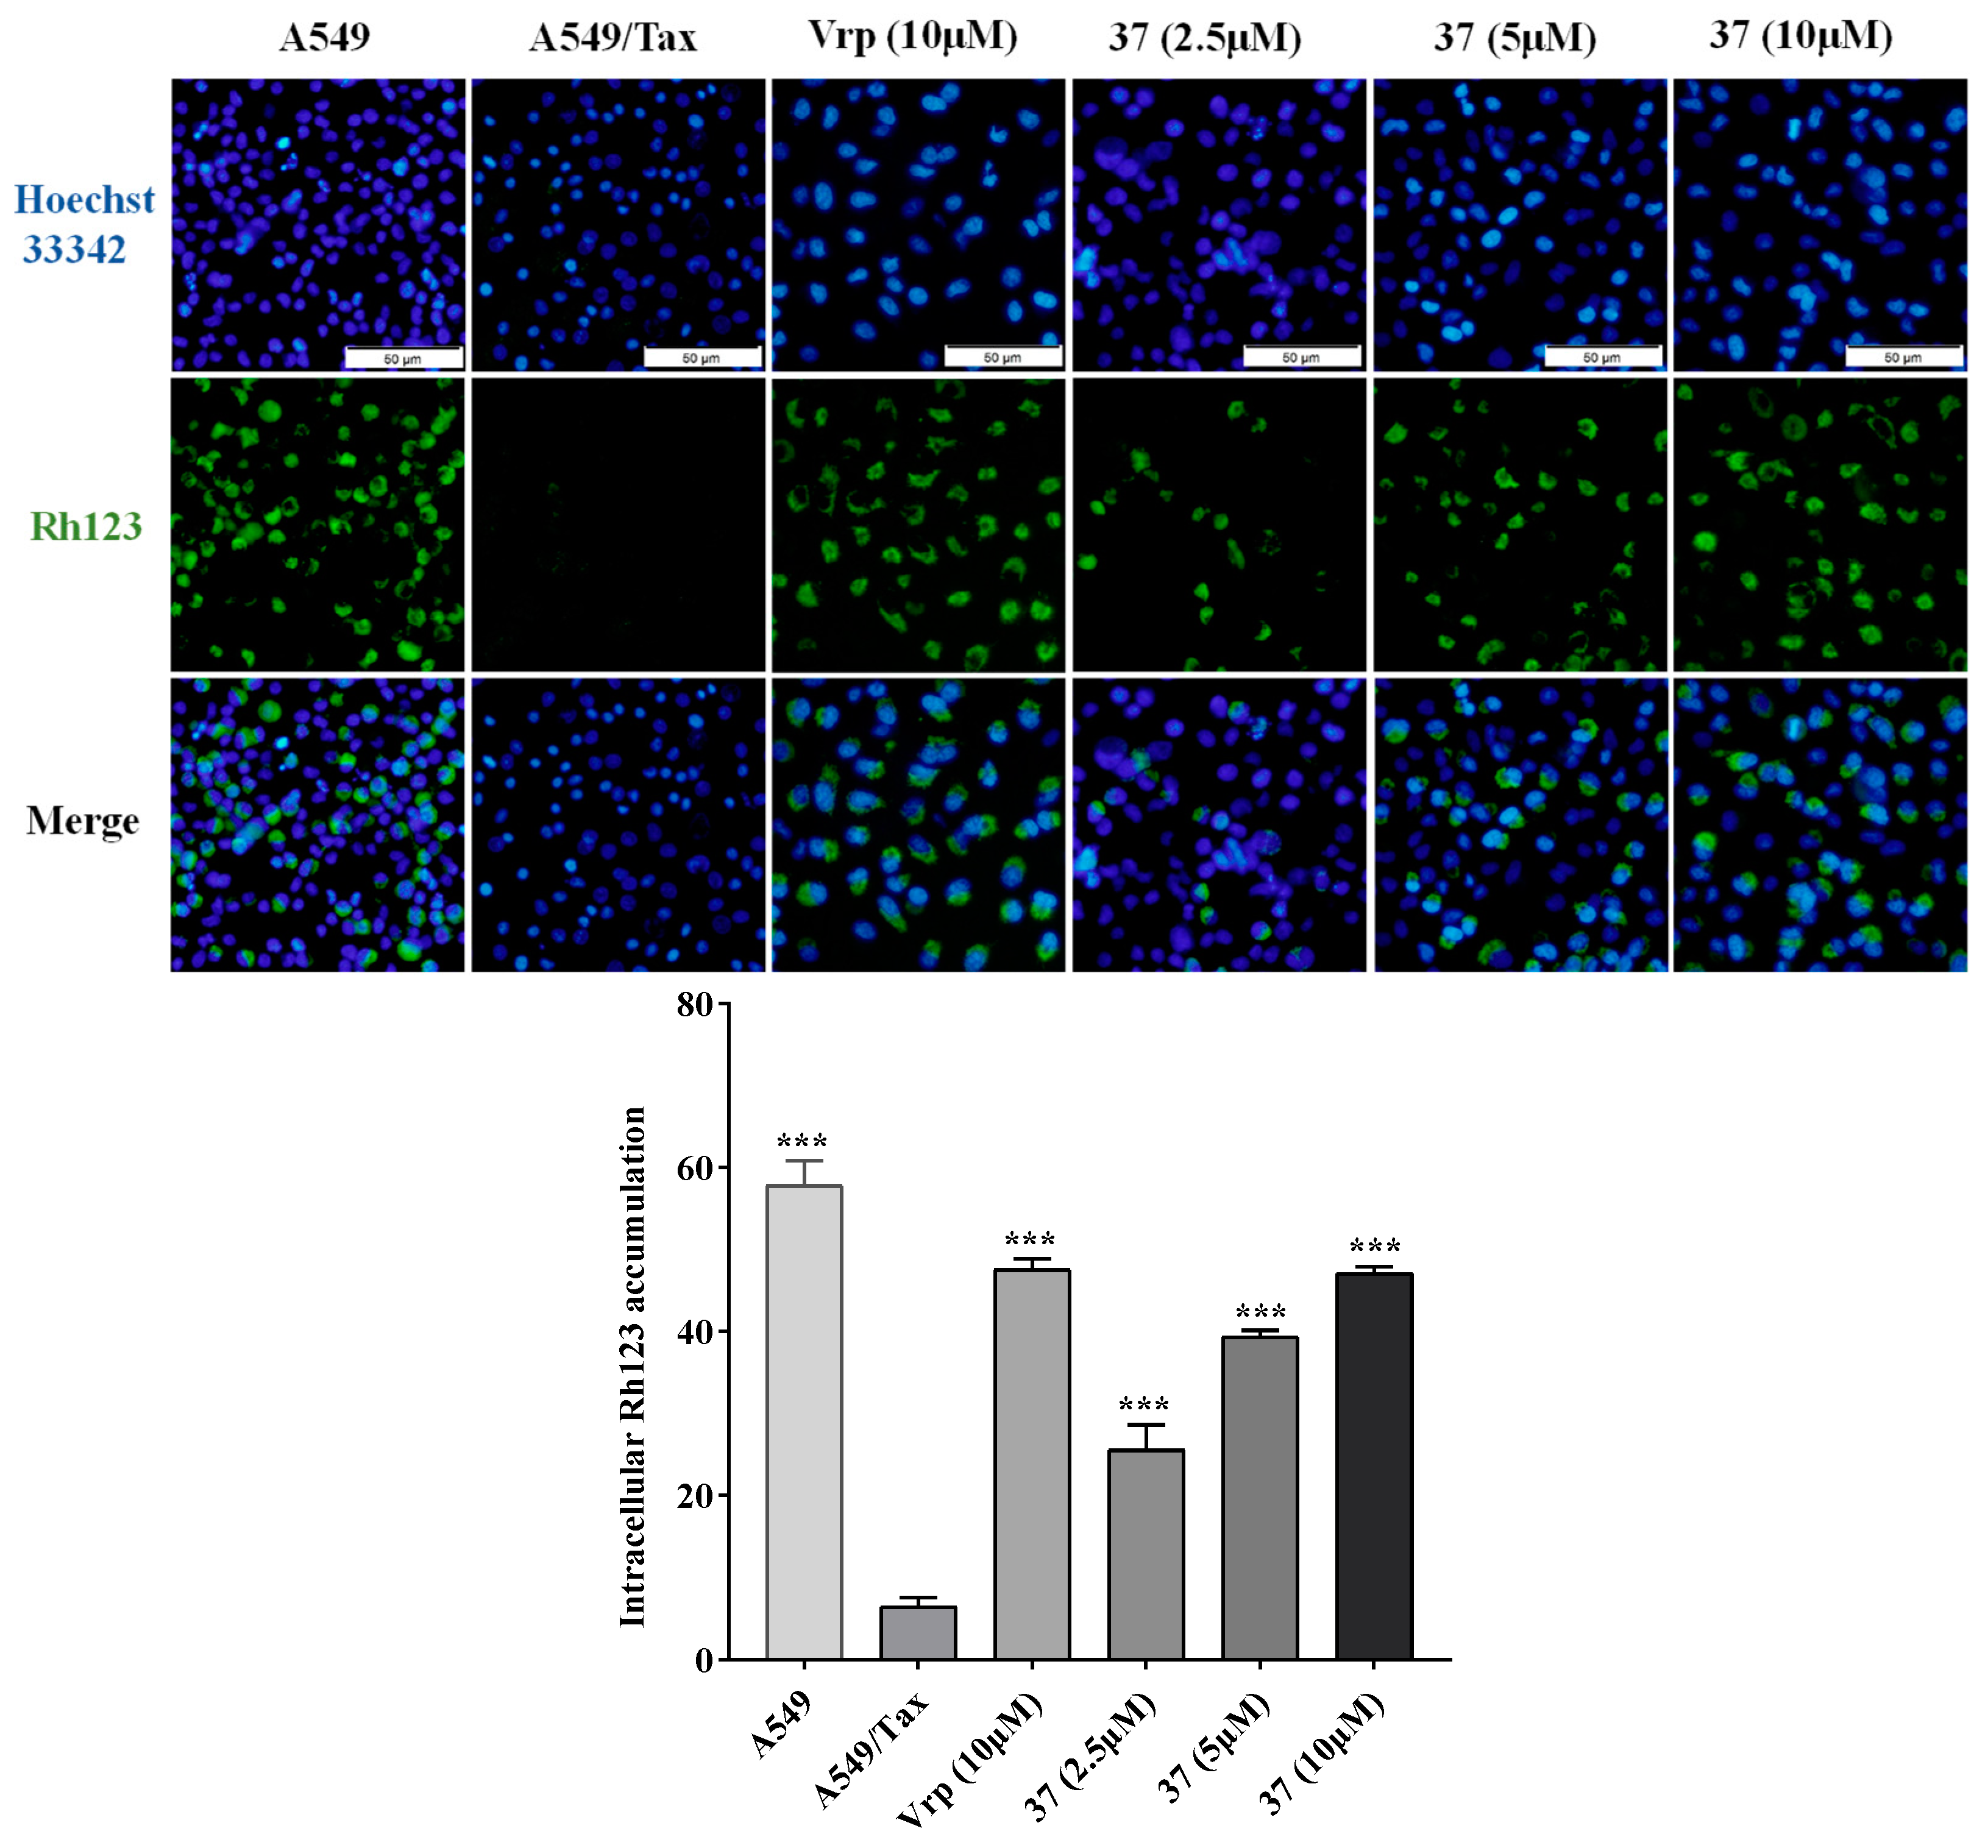
Figure 5.
Effect of compound 37 on the P-gp ATPase activity. All data were presented as means ± SD (n = 3). ***p<0.001, vs Basal group.
Figure 5.
Effect of compound 37 on the P-gp ATPase activity. All data were presented as means ± SD (n = 3). ***p<0.001, vs Basal group.
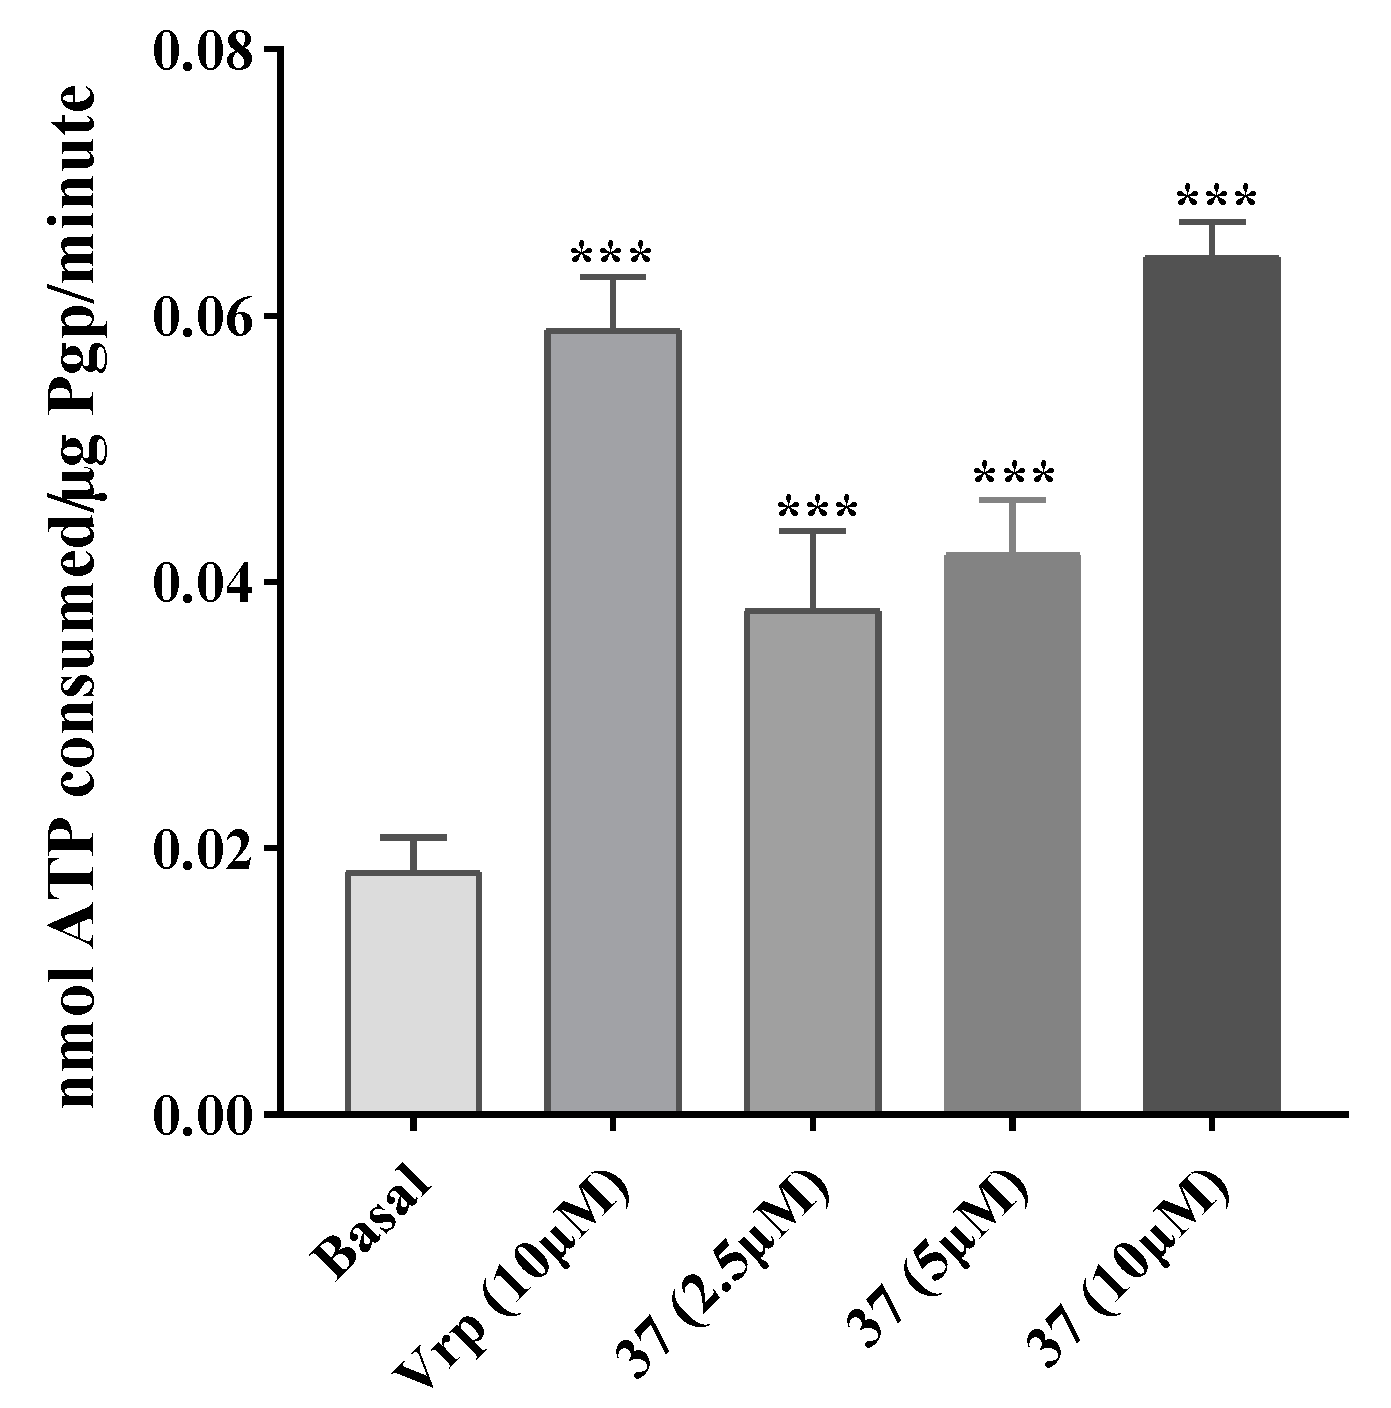
Figure 6.
Molecular docking conformation of Vrp, compound 37 binding with human P-gp. (A) The binding poses of the compounds with human P-gp. Vrp in blue, compound 37 in purple. (B) The binding pose of Vrp with human P-gp. (C) The binding pose of compound 37 with human P-gp. The amino acid residues are represented in yellow and hydrogen bonds in yellow dashed lines.
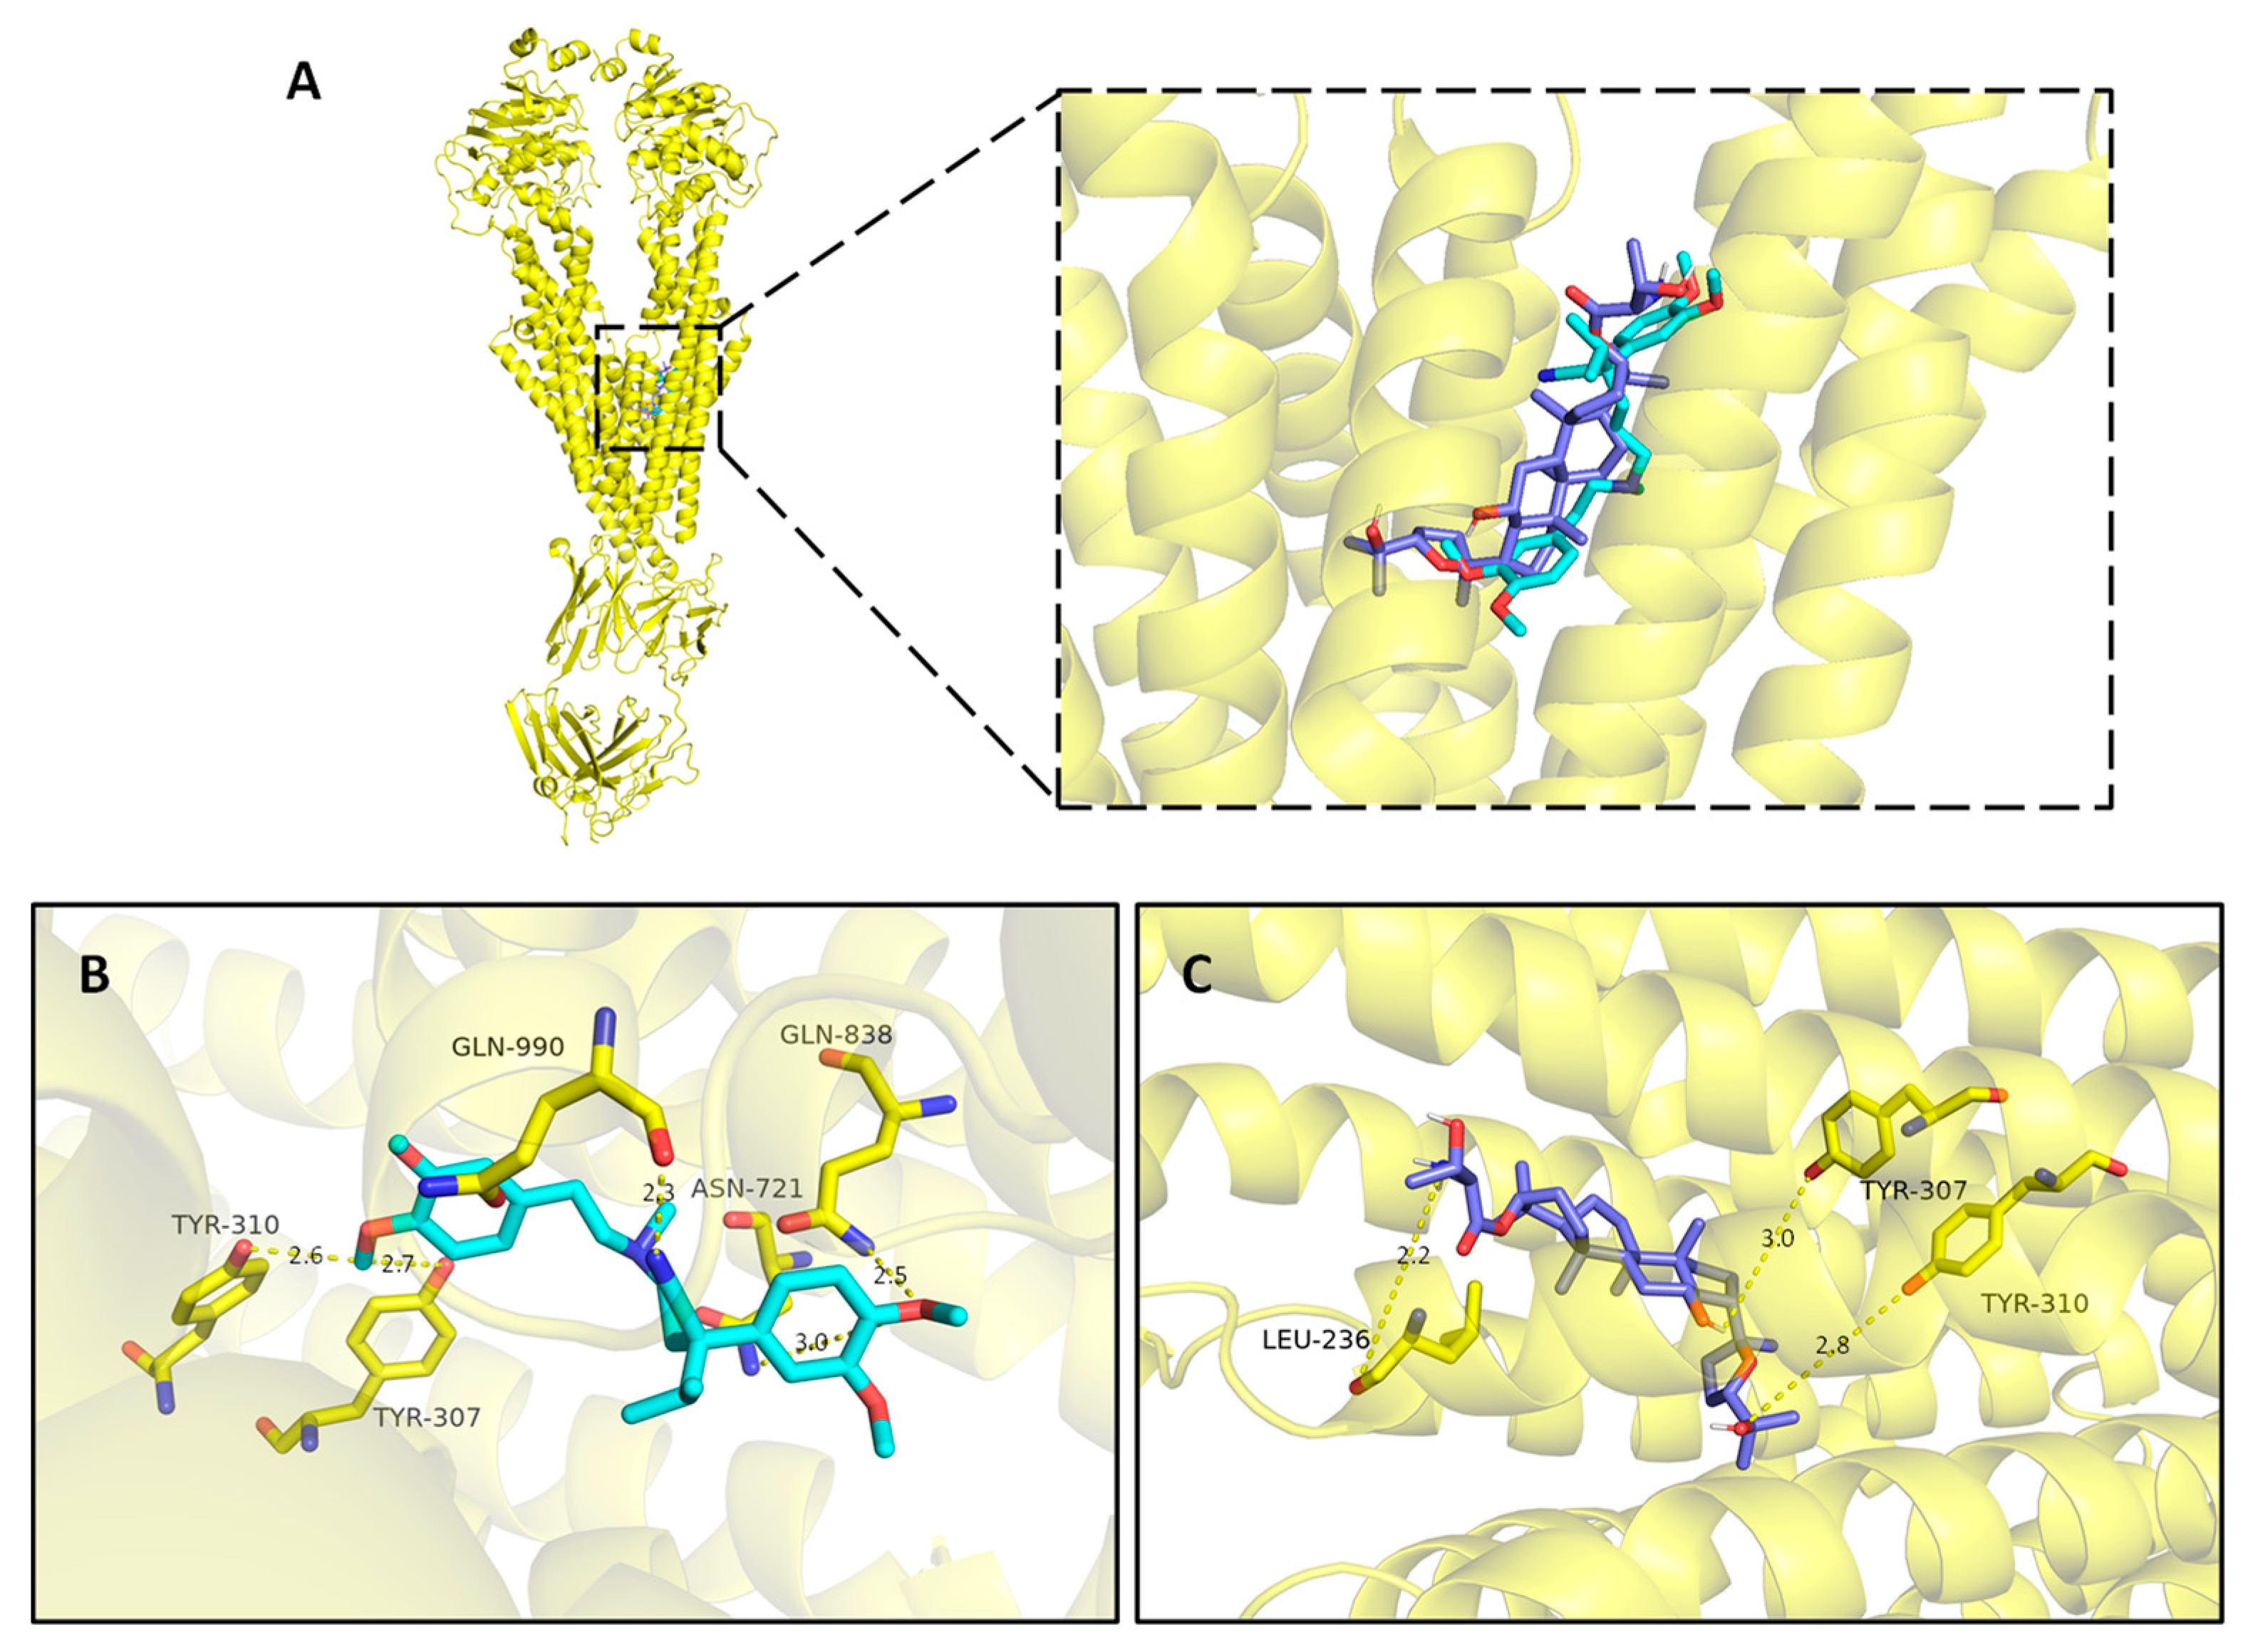
Figure 7.
The typical BPI chromatograms of cell samples.
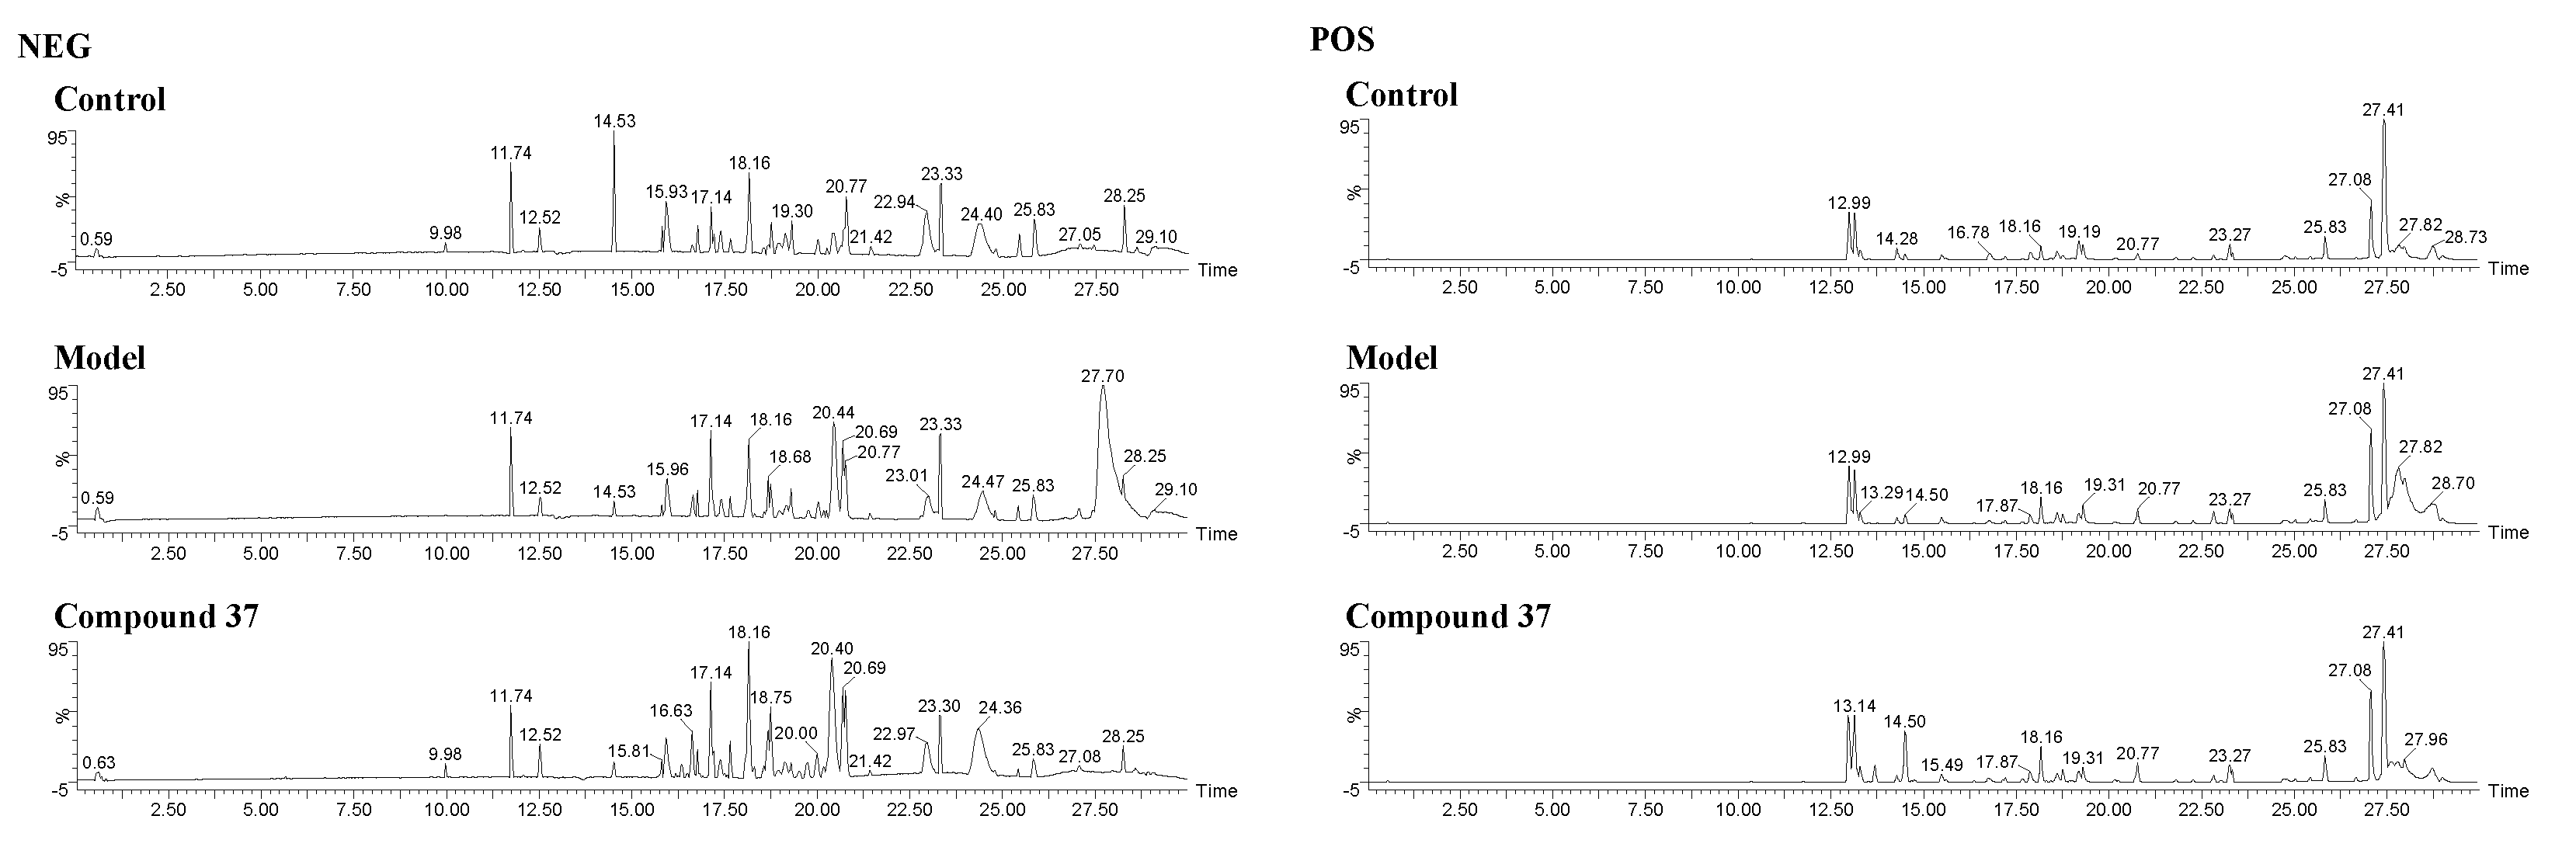
Figure 8.
The PCA score plots of cell metabolic profiling in ESI+ and ESI– modes.
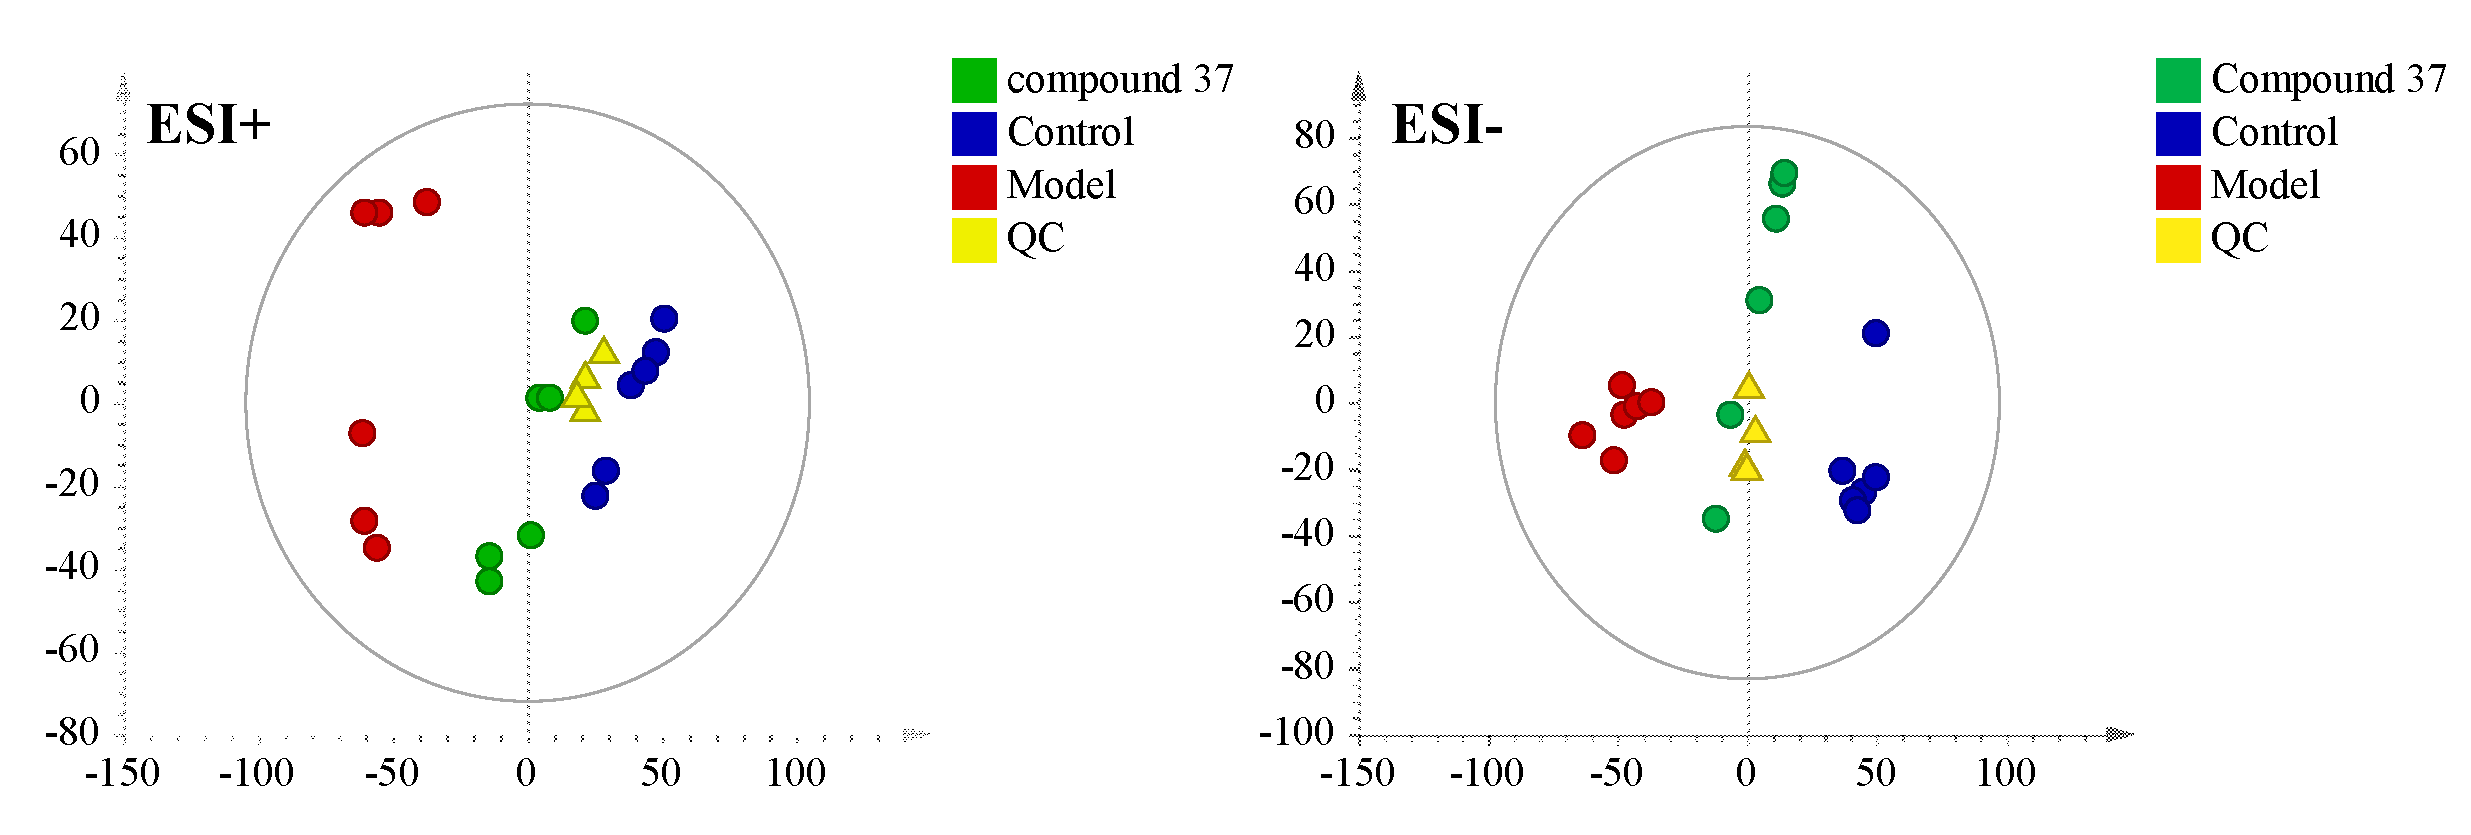
Figure 9.
The OPLS-DA scores (A), permutations tests (B) and S-plots (C) of model & control groups and model & compound 37 groups.
Figure 9.
The OPLS-DA scores (A), permutations tests (B) and S-plots (C) of model & control groups and model & compound 37 groups.
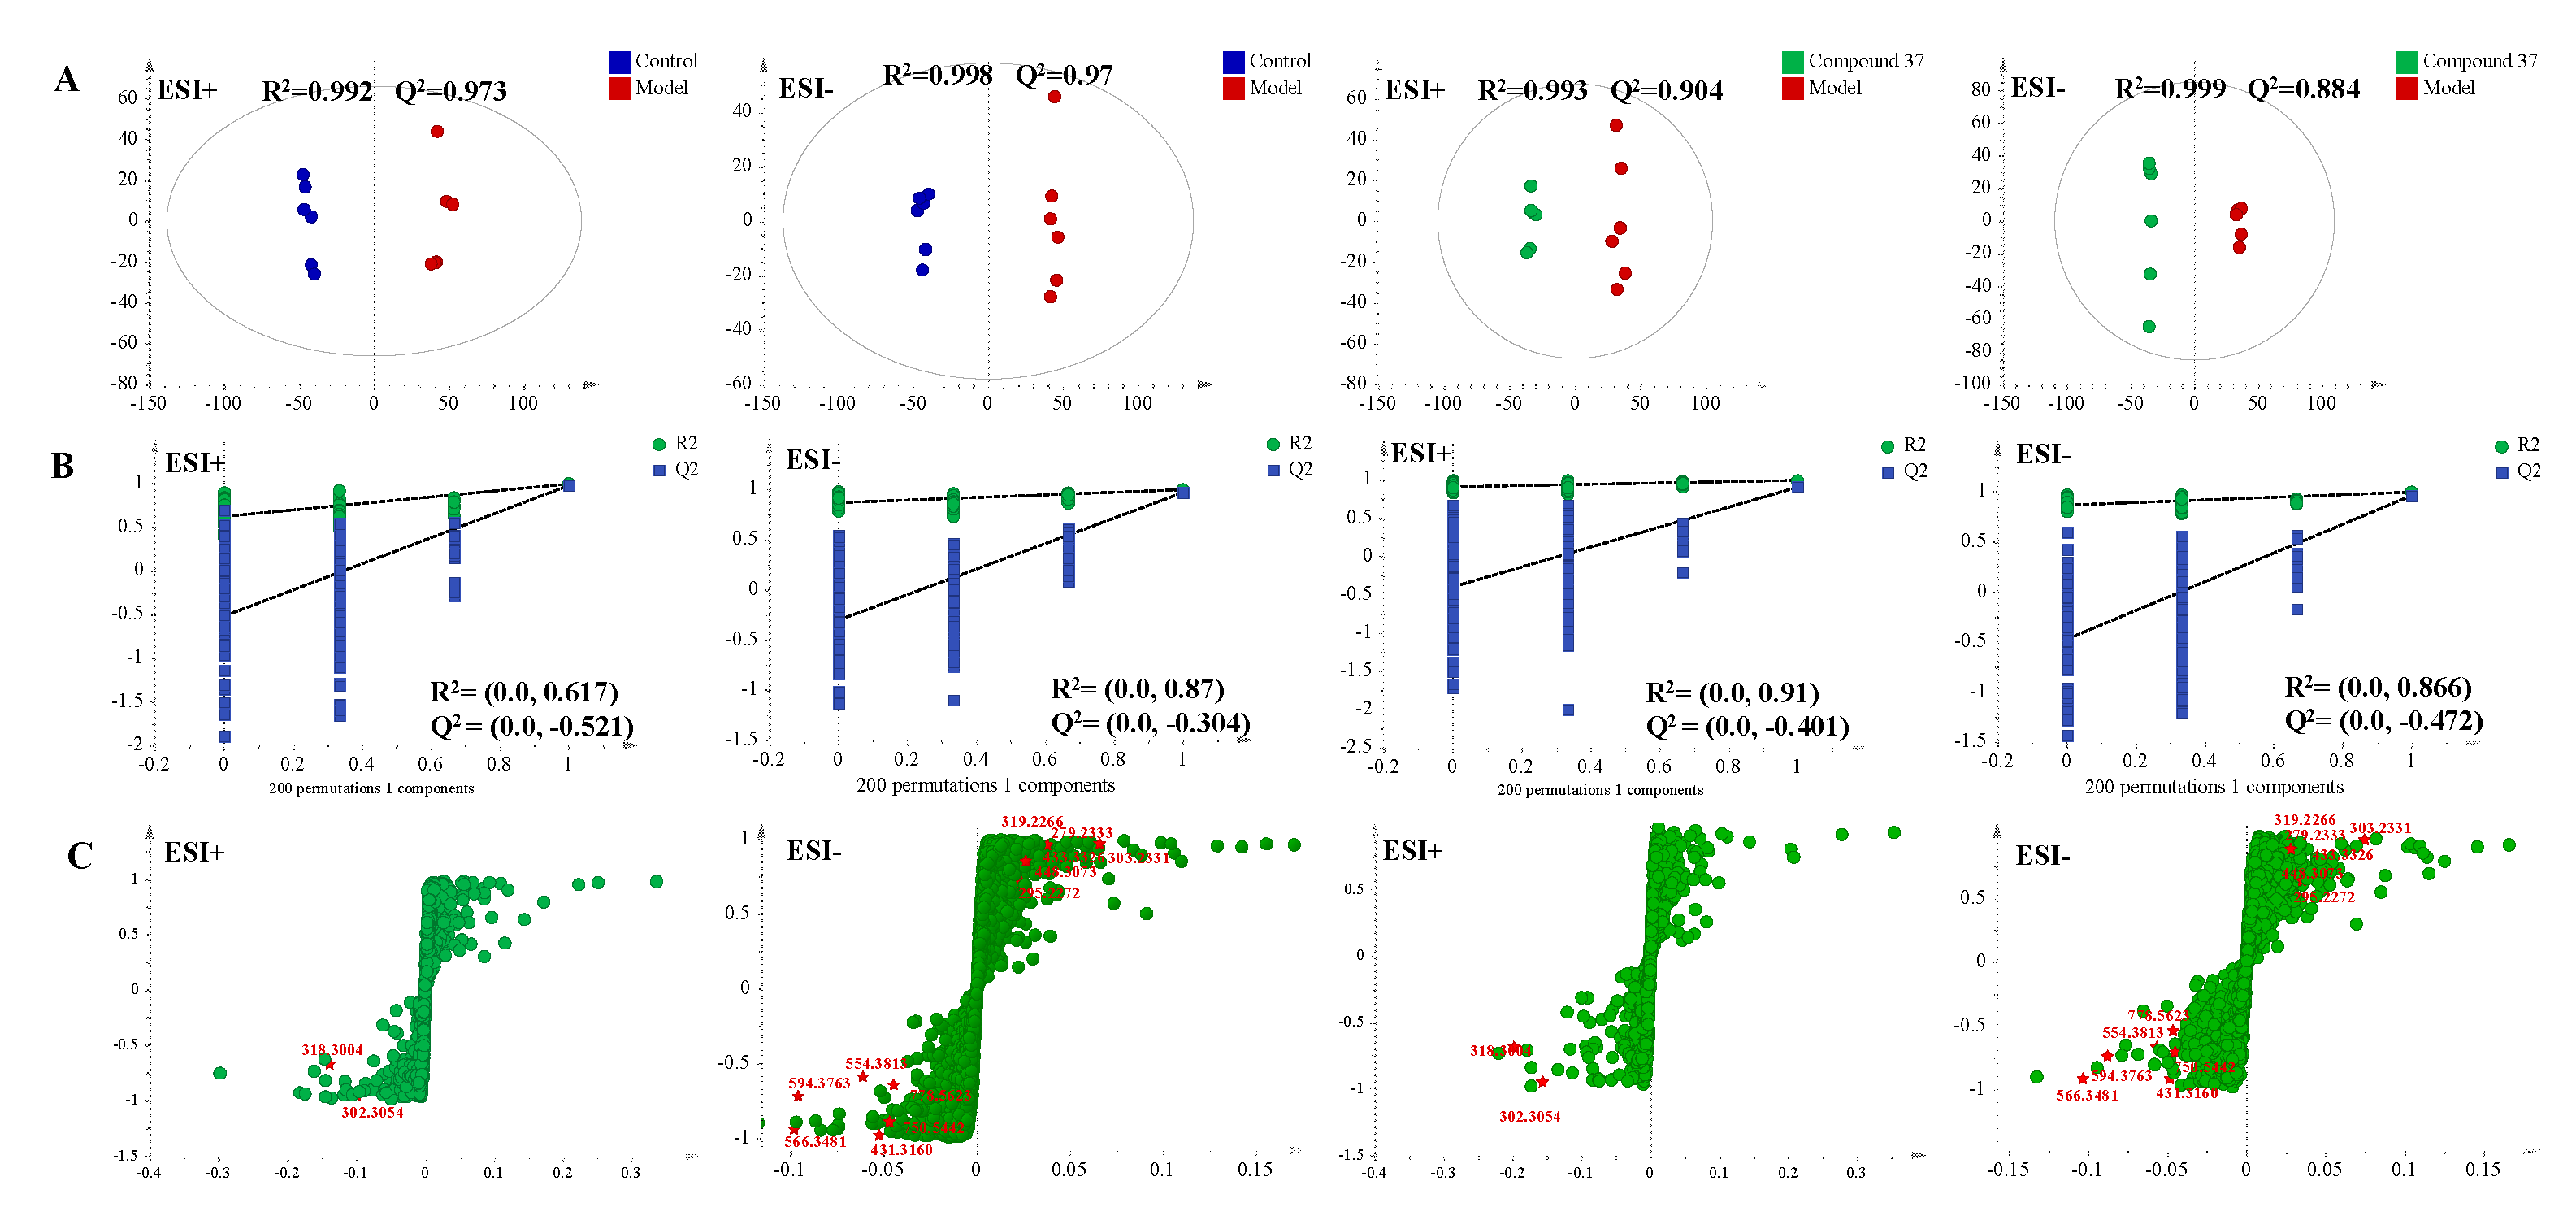
Figure 10.
ROC curves (A) and the heatmap of the identified potential biomarkers (B).
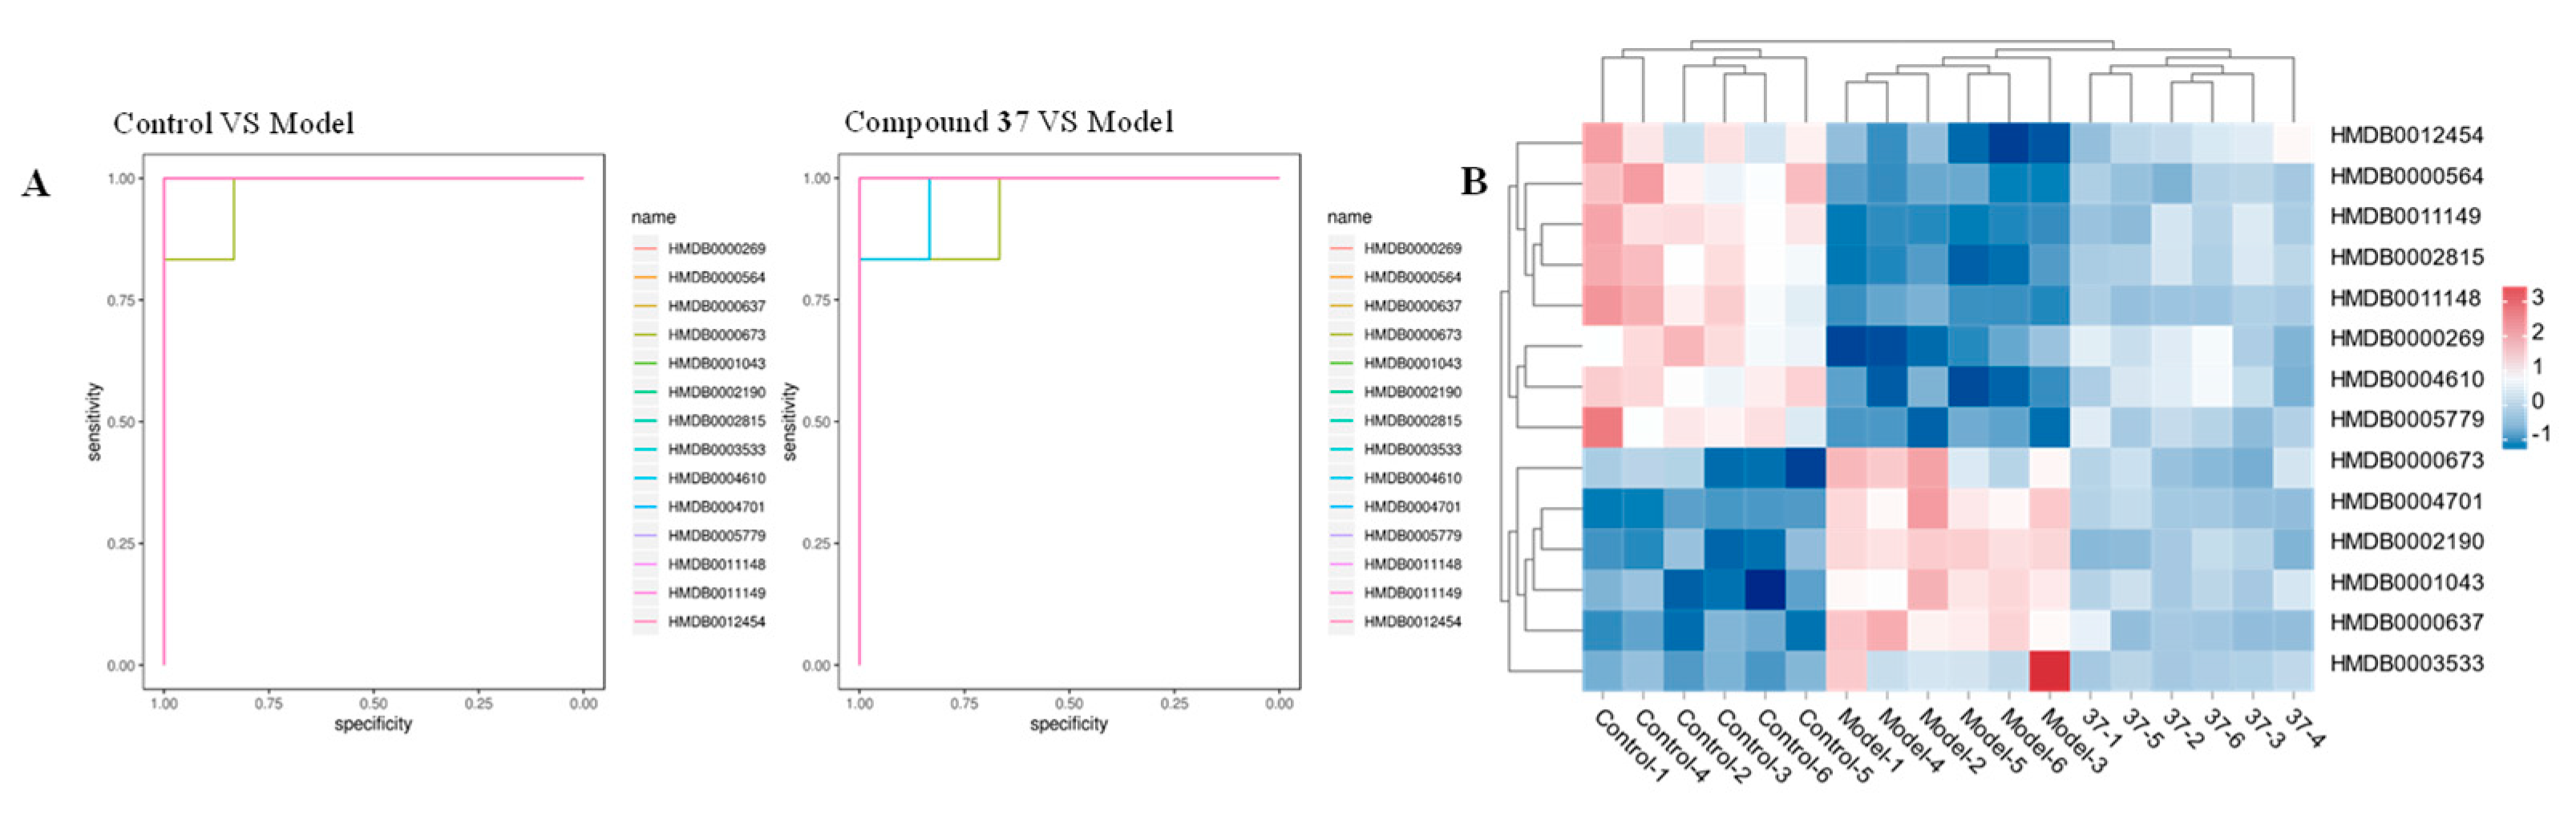
Figure 11.
The cellular metabolomics mechanism.
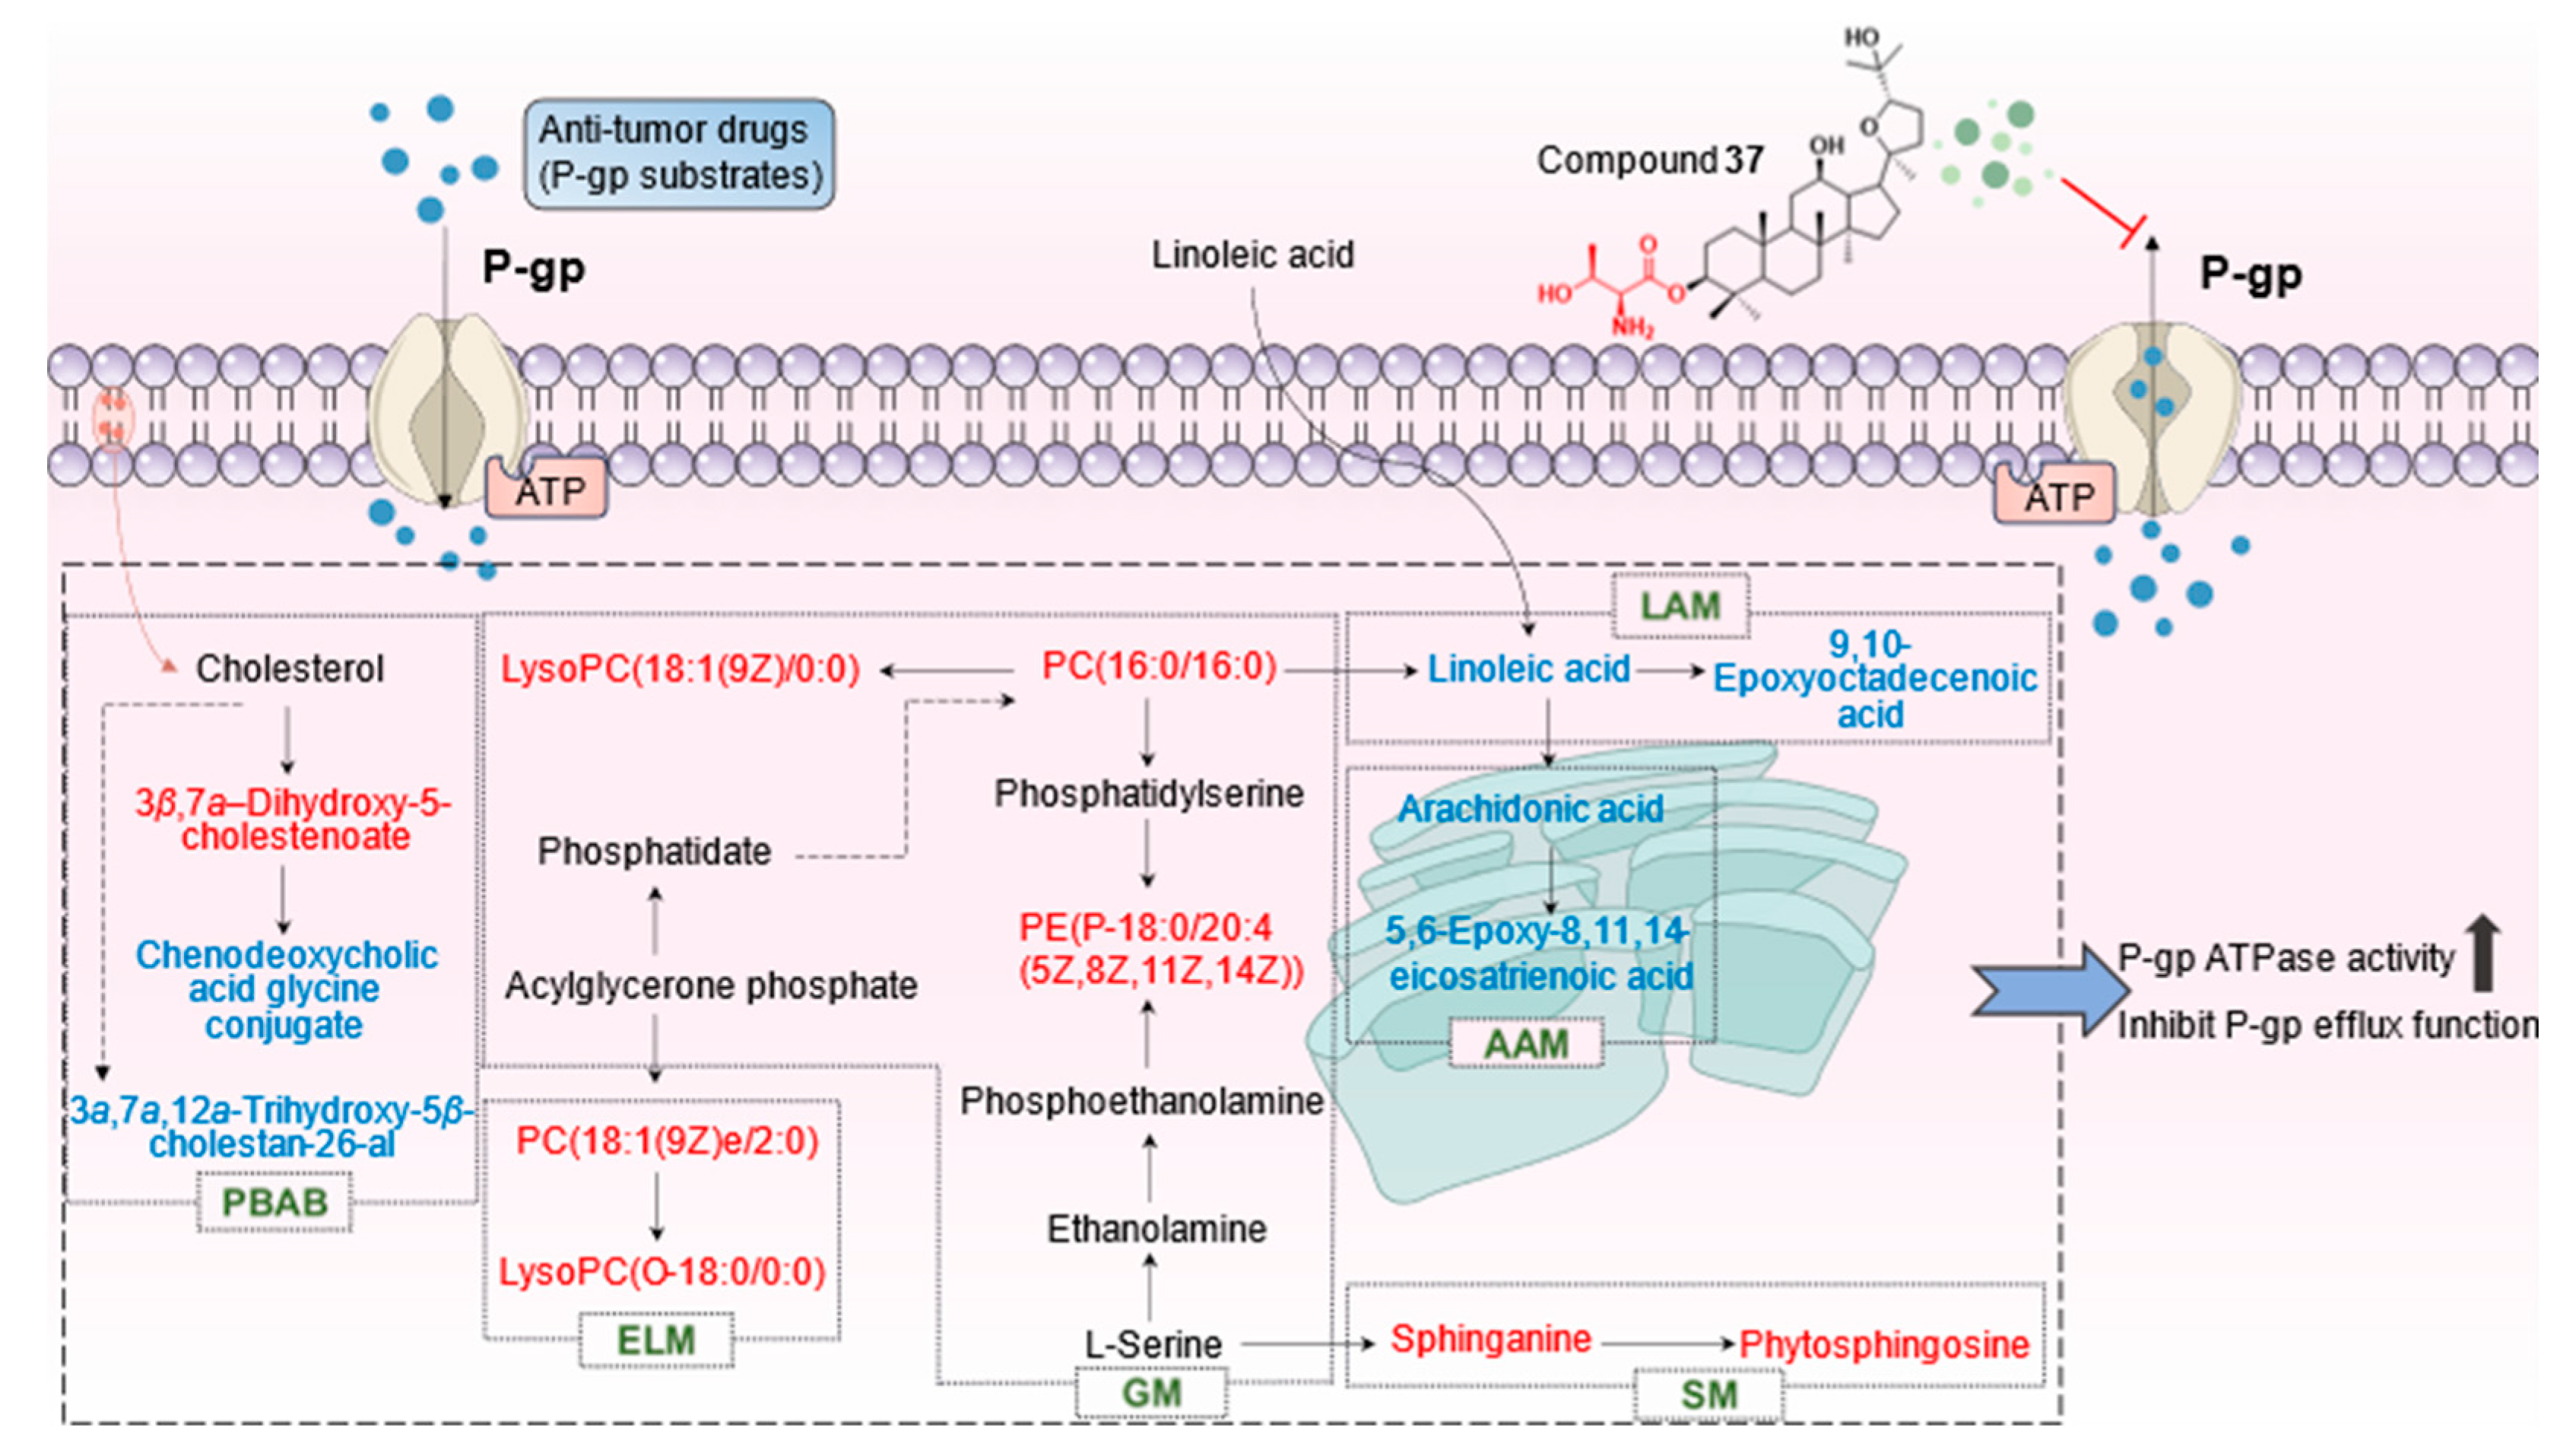

Table 1.
Cytotoxicity of Derivatives on A549 and A549/Tax cells (± SD, n = 3).
| Compounds | Cell survival (%) | |||||
|---|---|---|---|---|---|---|
| A549 | A549/Tax | |||||
| 5 μM | 10 μM | 20 μM | 5 μM | 10 μM | 20 μM | |
| Pyxinol | 97.63±4.89 | 89.47±5.54 | 82.17±6.05 | 105.42±5.67 | 97.05±5.73 | 91.22±3.06 |
| 24S-Pyxinol | 92.70±5.27 | 87.05±5.66 | 78.50±8.70 | 98.84±2.33 | 94.62±3.50 | 89.37±3.76 |
| 1 | 99.02±1.83 | 97.40±3.11 | 91.21±3.21 | 96.72±1.99 | 92.83±2.37 | 86.21±3.18 |
| 2 | 95.71±4.21 | 94.64±2.90 | 89.25±2.02 | 93.47±3.14 | 90.02±2.66 | 87.13±2.54 |
| 3 | 98.04±2.29 | 90.84±7.09 | 84.05±3.11 | 96.34±4.17 | 83.36±2.68 | 78.66±3.27 |
| 4 | 98.39±1.06 | 95.20±1.42 | 84.17±7.46 | 93.27±2.75 | 89.41±4.50 | 76.64±4.00 |
| 5 | 98.12±4.50 | 94.59±2.60 | 89.19±2.01 | 94.84±1.67 | 89.44±2.19 | 84.81±4.63 |
| 6 | 103.08±1.79 | 92.58±4.28 | 86.13±3.19 | 95.77±2.27 | 85.00±3.15 | 83.50±2.75 |
| 7 | 97.34±2.34 | 93.98±0.54 | 85.43±3.28 | 94.98±2.10 | 86.94±2.35 | 82.40±1.95 |
| 8 | 98.84±3.53 | 92.13±1.24 | 79.90±0.67 | 98.19±2.84 | 88.77±2.11 | 83.77±3.32 |
| 9 | 96.63±2.21 | 88.36±2.40 | 71.72±2.35 | 93.09±3.08 | 88.78±2.61 | 84.80±3.36 |
| 10 | 99.18±4.02 | 93.55±5.17 | 78.96±6.94 | 90.79±3.07 | 86.10±3.54 | 79.51±3.74 |
| 11 | 98.26±1.14 | 93.46±1.50 | 88.01±1.53 | 90.90±3.22 | 83.62±1.88 | 79.99±2.40 |
| 12 | 95.12±1.49 | 89.81±2.51 | 83.51±0.74 | 91.85±3.07 | 88.56±3.21 | 83.47±2.24 |
| 13 | 95.16±1.04 | 88.69±7.60 | 78.35±4.88 | 92.37±2.84 | 87.71±2.03 | 80.07±1.75 |
| 14 | 93.68±5.64 | 86.85±4.10 | 79.49±3.58 | 96.55±1.90 | 88.68±2.25 | 85.13±2.03 |
| 15 | 97.11±2.16 | 86.90±2.17 | 82.25±1.63 | 92.67±3.20 | 86.51±2.85 | 77.28±2.18 |
| 16 | 94.05±4.09 | 86.13±7.23 | 78.35±4.88 | 98.90±3.00 | 97.10±2.23 | 85.29±1.84 |
| 17 | 96.43±2.37 | 85.23±3.41 | 81.82±1.40 | 91.83±2.66 | 82.58±1.54 | 79.01±2.96 |
| 18 | 97.61±3.47 | 86.61±3.01 | 80.07±2.85 | 89.99±5.51 | 90.86±3.57 | 89.43±2.41 |
| 19 | 100.41±4.20 | 95.45±2.70 | 87.31±6.78 | 102.54±4.60 | 101.40±2.86 | 97.27±3.28 |
| 20 | 99.54±0.88 | 93.31±0.68 | 86.66±3.89 | 93.81±2.52 | 91.52±3.02 | 90.99±3.28 |
| 21 | 97.97±1.63 | 90.03±1.25 | 81.79±1.82 | 94.34±2.32 | 89.55±2.86 | 87.74±2.64 |
| 22 | 97.17±1.97 | 87.95±2.32 | 82.13±1.82 | 96.13±3.07 | 92.92±3.55 | 87.65±2.21 |
| 23 | 98.84±0.58 | 90.34±2.52 | 83.32±3.21 | 96.82±2.90 | 94.06±4.96 | 86.48±3.61 |
| 24 | 96.30±1.28 | 94.41±0.97 | 88.01±1.33 | 95.39±4.82 | 91.60±2.93 | 86.55±2.11 |
| 25 | 95.90±0.62 | 93.18±1.17 | 88.02±0.76 | 98.35±3.45 | 92.36±2.72 | 82.68±3.97 |
| 26 | 95.37±2.27 | 87.87±4.03 | 80.53±1.96 | 98.69±1.56 | 94.58±2.33 | 87.27±3.61 |
| 27 | 92.65±5.37 | 84.46±2.26 | 79.33±2.10 | 95.66±2.91 | 90.85±2.70 | 88.32±3.95 |
| 28 | 96.22±5.22 | 85.74±4.19 | 75.90±2.53 | 98.47±0.81 | 90.54±2.47 | 84.98±2.61 |
| 29 | 96.95±1.92 | 93.22±0.77 | 87.79±3.30 | 98.07±2.23 | 90.56±3.56 | 86.09±3.21 |
| 30 | 97.11±0.82 | 94.28±1.93 | 90.17±0.79 | 91.53±3.27 | 87.41±2.70 | 79.79±2.68 |
| 31 | 96.41±1.81 | 89.01±1.89 | 82.82±1.82 | 97.12±2.81 | 93.42±1.09 | 89.71±3.58 |
| 32 | 96.53±1.82 | 92.49±1.10 | 88.62±2.34 | 97.84±3.54 | 90.05±5.72 | 83.62±5.38 |
| 33 | 98.15±0.59 | 95.65±0.78 | 87.24±0.60 | 99.19±3.35 | 93.88±4.51 | 87.81±8.25 |
| 34 | 96.81±1.87 | 86.87±5.00 | 77.26±3.53 | 96.98±3.60 | 92.45±3.26 | 86.91±4.33 |
| 35 | 98.33±0.97 | 91.76±1.65 | 81.65±3.17 | 97.09±2.80 | 89.30±2.44 | 86.56±2.87 |
| 36 | 94.96±0.42 | 93.13±0.45 | 83.51±2.49 | 96.69±3.18 | 88.96±3.75 | 81.74±3.58 |
| 37 | 102.88±6.35 | 95.97±5.76 | 82.54±3.00 | 97.81±1.99 | 92.90±3.78 | 78.65±3.33 |
| 38 | 98.12±1.20 | 90.51±2.10 | 80.91±0.84 | 96.01±2.84 | 88.56±3.26 | 78.40±3.95 |
| 39 | 106.69±3.24 | 97.15±3.15 | 79.76±2.72 | 98.63±2.79 | 89.67±2.61 | 87.97±2.27 |
| 40 | 96.92±1.37 | 87.97±0.71 | 79.74±0.34 | 94.46±2.84 | 92.67±2.00 | 87.85±4.80 |
| Vrp | 93.84±6.01 | 86.32±6.78 | 68.15±3.76 | 98.14±2.88 | 97.42±4.82 | 91.46±2.89 |
Table 2.
Cytotoxicity of Derivatives on MCF-7 and MCF-7/ADR cells (± SD, n = 3).
| Compounds | Cell survival (%) | |||||
|---|---|---|---|---|---|---|
| MCF-7 | MCF-7/ADR | |||||
| 5 μM | 10 μM | 20 μM | 5 μM | 10 μM | 20 μM | |
| Pyxinol | 100.62±3.02 | 97.43±2.67 | 94.42±3.19 | 99.18±3.10 | 93.12±1.53 | 88.49±2.76 |
| 24S-Pyxinol | 101.30±4.35 | 94.55±5.79 | 94.80±4.43 | 101.33±2.08 | 97.26±3.03 | 88.70±6.75 |
| 1 | 98.79±1.37 | 93.77±3.60 | 84.73±1.41 | 97.46±1.04 | 93.02±2.86 | 84.63±2.90 |
| 2 | 97.24±2.78 | 86.89±3.80 | 76.34±3.78 | 98.64±2.11 | 90.08±2.92 | 85.34±2.22 |
| 3 | 99.25±4.05 | 92.66±3.20 | 85.82±3.30 | 96.83±1.80 | 93.18±2.30 | 87.58±2.80 |
| 4 | 96.85±3.03 | 89.45±2.95 | 82.92±2.23 | 97.91±1.05 | 95.57±2.81 | 89.56±3.37 |
| 5 | 96.88±2.85 | 88.90±3.00 | 84.47±3.81 | 98.87±1.58 | 93.42±1.88 | 90.93±1.94 |
| 6 | 95.68±3.93 | 87.85±2.88 | 81.53±2.35 | 98.55±1.68 | 91.89±1.72 | 88.02±2.15 |
| 7 | 92.29±3.38 | 88.64±4.82 | 82.38±2.57 | 93.85±3.32 | 88.84±2.31 | 79.88±3.07 |
| 8 | 91.25±3.06 | 87.03±2.88 | 84.59±2.73 | 94.67±4.54 | 94.54±2.93 | 84.61±1.24 |
| 9 | 96.90±3.11 | 95.01±3.14 | 86.13±3.38 | 96.89±3.17 | 90.86±2.24 | 85.58±1.67 |
| 10 | 92.30±2.06 | 87.41±1.83 | 82.23±2.78 | 98.70±0.84 | 95.48±3.51 | 86.42±2.73 |
| 11 | 95.97±2.10 | 90.93±2.07 | 79.89±5.63 | 94.38±1.86 | 88.10±3.02 | 79.99±2.33 |
| 12 | 96.82±1.64 | 92.01±2.60 | 85.34±2.67 | 95.09±2.03 | 90.53±2.99 | 84.11±2.15 |
| 13 | 95.93±2.75 | 93.51±2.22 | 88.63±2.12 | 96.19±3.55 | 88.52±2.43 | 83.73±1.53 |
| 14 | 95.95±3.47 | 88.65±2.49 | 84.16±3.55 | 95.24±4.43 | 86.66±2.77 | 78.36±2.25 |
| 15 | 95.21±2.57 | 87.14±2.49 | 83.07±1.81 | 97.98±3.40 | 90.65±2.41 | 78.76±2.52 |
| 16 | 91.87±3.08 | 87.97±3.82 | 83.74±3.26 | 99.54±2.47 | 95.34±3.50 | 87.66±2.65 |
| 17 | 94.00±4.03 | 90.64±2.41 | 80.64±2.62 | 96.27±3.37 | 85.33±3.62 | 82.93±5.05 |
| 18 | 91.80±3.86 | 87.20±2.91 | 78.21±4.40 | 98.49±2.85 | 88.98±3.06 | 82.77±2.62 |
| 19 | 89.65±5.91 | 89.58±6.23 | 84.02±2.03 | 96.28±6.25 | 91.52±6.30 | 84.41±4.20 |
| 20 | 98.55±0.94 | 94.50±2.08 | 89.17±1.06 | 97.44±2.44 | 89.52±2.82 | 81.54±2.57 |
| 21 | 97.47±3.48 | 86.18±3.70 | 81.21±5.81 | 97.68±3.49 | 91.92±2.12 | 84.56±1.71 |
| 22 | 96.23±2.75 | 87.75±4.73 | 82.39±3.44 | 101.21±2.63 | 96.10±3.46 | 89.93±1.42 |
| 23 | 93.47±2.90 | 85.35±2.16 | 82.33±4.02 | 95.51±3.44 | 88.04±2.96 | 81.95±2.55 |
| 24 | 95.67±1.97 | 89.47±1.32 | 82.23±3.20 | 95.44±2.06 | 88.39±2.63 | 82.87±2.45 |
| 25 | 96.40±2.46 | 87.49±4.95 | 84.60±2.31 | 96.40±1.97 | 91.52±1.96 | 85.27±1.98 |
| 26 | 98.93±1.65 | 92.48±1.41 | 88.56±3.25 | 91.45±2.44 | 85.34±2.49 | 80.55±3.13 |
| 27 | 90.40±4.72 | 82.43±4.59 | 78.08±3.82 | 93.68±4.41 | 87.21±2.30 | 85.11±2.81 |
| 28 | 94.52±5.13 | 91.93±4.83 | 82.71±2.52 | 94.13±4.59 | 87.58±1.01 | 86.38±3.45 |
| 29 | 90.27±4.34 | 85.40±3.58 | 79.87±1.67 | 95.27±3.81 | 88.04±1.60 | 79.57±2.72 |
| 30 | 90.37±3.80 | 85.99±3.88 | 81.79±2.67 | 97.99±1.93 | 89.27±3.75 | 80.21±4.03 |
| 31 | 96.59±2.46 | 91.92±3.00 | 82.49±2.64 | 98.70±1.16 | 94.84±2.89 | 87.76±1.24 |
| 32 | 93.84±5.82 | 88.27±4.22 | 84.16±5.41 | 95.54±2.45 | 87.80±2.39 | 82.86±3.33 |
| 33 | 95.81±2.44 | 89.11±1.76 | 85.86±0.77 | 100.87±3.16 | 90.28±2.85 | 83.38±3.14 |
| 34 | 96.82±2.29 | 94.39±2.27 | 87.39±2.54 | 98.05±1.12 | 92.44±2.75 | 83.24±4.17 |
| 35 | 90.45±9.36 | 85.40±4.88 | 81.12±5.47 | 92.87±3.84 | 88.71±4.08 | 79.15±1.90 |
| 36 | 96.17±2.21 | 86.13±3.13 | 79.43±2.28 | 97.55±2.01 | 87.74±3.93 | 85.54±2.91 |
| 37 | 93.54±2.04 | 92.86±6.15 | 79.21±2.67 | 98.65±1.99 | 94.40±5.10 | 87.30±2.48 |
| 38 | 96.95±2.06 | 88.94±2.80 | 78.65±3.60 | 96.70±2.22 | 91.47±1.81 | 84.56±2.62 |
| 39 | 99.47±4.38 | 97.41±3.10 | 93.90±5.84 | 96.82±3.22 | 97.30±4.29 | 92.09±6.24 |
| 40 | 97.82±1.38 | 93.87±2.33 | 81.10±3.09 | 94.17±2.05 | 85.66±2.37 | 76.43±3.27 |
| Vrp | 99.02±2.65 | 96.24±3.01 | 90.21±3.53 | 98.98±6.77 | 88.81±2.65 | 84.32±3.96 |
Table 3.
Cytotoxicity of Derivatives on HCT-8 and HCT-8/VCR cells (± SD, n = 3).
| Compounds | Cell survival (%) | |||||
|---|---|---|---|---|---|---|
| HCT-8 | HCT-8/VCR | |||||
| 5 μM | 10 μM | 20 μM | 5 μM | 10 μM | 20 μM | |
| Pyxinol | 96.09±3.96 | 91.74±4.38 | 89.50±2.62 | 98.69±0.47 | 94.04±1.34 | 88.30±2.48 |
| 24S-Pyxinol | 96.09±3.55 | 90.82±2.65 | 89.01±3.18 | 100.72±2.44 | 95.24±1.33 | 87.09±4.36 |
| 1 | 93.48±4.95 | 88.37±6.15 | 82.39±5.90 | 96.96±1.13 | 89.52±3.13 | 84.88±1.85 |
| 2 | 93.25±4.05 | 86.72±6.11 | 79.84±8.48 | 96.43±2.03 | 90.82±0.97 | 86.72±2.25 |
| 3 | 94.43±3.19 | 92.47±0.71 | 86.72±1.54 | 97.13±1.21 | 92.25±3.18 | 88.19±2.15 |
| 4 | 96.66±1.14 | 89.80±1.95 | 89.36±1.74 | 97.88±1.11 | 92.54±1.52 | 88.60±1.57 |
| 5 | 94.50±2.88 | 87.19±3.57 | 83.87±1.84 | 97.35±1.67 | 91.11±1.57 | 87.51±2.59 |
| 6 | 94.38±1.58 | 90.97±2.88 | 86.17±4.26 | 93.09±2.91 | 88.03±1.49 | 79.97±1.06 |
| 7 | 95.59±5.08 | 94.03±2.39 | 87.51±0.87 | 93.82±2.75 | 92.51±2.66 | 89.31±3.20 |
| 8 | 95.79±1.29 | 86.70±2.38 | 76.03±4.69 | 97.00±2.85 | 93.40±1.64 | 89.41±2.47 |
| 9 | 94.55±3.56 | 91.03±3.30 | 87.70±6.26 | 98.41±0.91 | 97.50±1.71 | 87.96±1.54 |
| 10 | 94.37±3.01 | 89.12±2.77 | 84.10±4.46 | 94.90±3.31 | 88.86±3.69 | 80.11±3.47 |
| 11 | 91.85±3.05 | 86.83±2.63 | 76.27±2.46 | 95.46±2.91 | 86.73±1.87 | 84.14±1.80 |
| 12 | 91.15±4.98 | 90.49±3.35 | 82.87±2.48 | 96.03±2.51 | 87.66±2.48 | 84.44±3.02 |
| 13 | 97.19±2.40 | 91.65±6.80 | 87.96±2.93 | 94.17±1.72 | 91.77±2.27 | 87.52±1.79 |
| 14 | 99.77±2.08 | 90.76±4.02 | 80.81±3.07 | 94.69±2.63 | 89.63±5.34 | 86.24±3.17 |
| 15 | 94.10±1.68 | 85.79±2.54 | 82.04±1.87 | 95.06±2.11 | 91.58±1.26 | 88.19±2.40 |
| 16 | 92.92±2.32 | 85.17±2.77 | 81.77±2.97 | 98.78±1.05 | 93.02±1.81 | 87.43±2.97 |
| 17 | 93.13±2.57 | 85.82±1.57 | 77.99±3.83 | 99.71±3.13 | 93.78±2.00 | 89.40±2.58 |
| 18 | 96.54±2.09 | 87.83±3.04 | 83.94±4.39 | 96.83±2.92 | 91.16±3.63 | 81.58±3.99 |
| 19 | 93.14±4.54 | 91.17±2.41 | 86.50±2.25 | 94.32±2.89 | 91.49±3.61 | 86.98±2.12 |
| 20 | 92.99±2.93 | 86.91±2.30 | 82.81±2.16 | 96.81±3.36 | 91.87±2.68 | 88.31±2.75 |
| 21 | 91.01±2.39 | 86.22±3.44 | 83.90±2.04 | 97.96±2.74 | 91.60±2.52 | 90.33±3.73 |
| 22 | 95.15±2.43 | 94.17±1.95 | 86.74±2.86 | 98.55±1.60 | 94.36±2.73 | 87.07±1.98 |
| 23 | 94.10±2.30 | 87.38±2.21 | 79.90±2.13 | 98.45±1.01 | 91.58±2.74 | 87.45±2.28 |
| 24 | 97.23±1.88 | 89.22±1.62 | 76.79±5.23 | 93.39±2.13 | 89.15±3.05 | 82.61±2.60 |
| 25 | 96.23±2.29 | 92.97±1.51 | 86.52±1.95 | 96.43±2.74 | 94.91±1.93 | 92.03±1.06 |
| 26 | 95.57±2.31 | 92.98±2.68 | 87.26±1.44 | 96.01±2.96 | 94.47±6.82 | 86.00±4.44 |
| 27 | 96.54±1.39 | 86.82±1.91 | 84.29±3.00 | 96.58±3.55 | 95.82±4.88 | 88.67±8.42 |
| 28 | 95.82±2.04 | 87.58±2.94 | 80.78±1.61 | 97.15±2.13 | 91.74±3.07 | 87.33±2.27 |
| 29 | 91.46±2.70 | 89.74±3.06 | 82.96±2.04 | 98.60±2.92 | 90.70±1.56 | 87.37±2.72 |
| 30 | 96.26±3.35 | 89.38±3.70 | 79.28±2.76 | 98.19±1.57 | 91.09±2.49 | 82.42±3.06 |
| 31 | 96.34±1.91 | 88.07±2.57 | 76.67±5.49 | 98.47±1.36 | 90.59±1.51 | 85.70±2.39 |
| 32 | 98.00±0.91 | 95.08±2.99 | 85.34±0.78 | 95.35±2.81 | 89.50±2.52 | 85.28±1.86 |
| 33 | 94.68±2.05 | 91.22±1.10 | 82.31±0.98 | 92.16±4.16 | 87.47±2.48 | 79.36±3.40 |
| 34 | 95.40±2.27 | 86.49±5.22 | 80.59±3.57 | 93.59±3.40 | 86.36±1.46 | 79.71±1.75 |
| 35 | 93.27±9.55 | 80.68±4.00 | 75.99±3.40 | 94.00±2.02 | 91.57±1.74 | 86.40±3.45 |
| 36 | 94.36±1.10 | 87.97±3.35 | 80.54±1.78 | 94.20±2.41 | 89.95±3.57 | 83.21±1.55 |
| 37 | 93.17±3.54 | 82.56±6.98 | 74.26±6.62 | 99.19±1.90 | 91.18±3.77 | 86.10±2.41 |
| 38 | 96.82±2.59 | 84.77±2.93 | 79.39±3.20 | 93.42±3.92 | 86.09±1.65 | 80.44±2.18 |
| 39 | 95.28±2.74 | 88.69±2.84 | 80.74±2.29 | 98.86±2.46 | 94.96±1.01 | 88.19±2.13 |
| 40 | 96.19±1.88 | 93.71±0.96 | 84.74±2.50 | 93.76±3.21 | 85.60±2.49 | 80.90±2.60 |
| Vrp | 96.53±1.18 | 91.96±3.22 | 87.22±5.07 | 99.96±1.96 | 96.72±2.62 | 84.65±3.50 |
Table 4.
Effects of Tax, ADR and VCR on tumor cells cytotoxicity (± SD, n = 3).
| Cell lines | Tax | ADR | VCR | |||
|---|---|---|---|---|---|---|
| IC50 (μM) | RI | IC50 (μM) | RI | IC50 (μM) | RI | |
| A549 | 2.64±0.46 | 130.81 | 7.38±0.23 | 33.61 | 3.37±0.53 | 19.27 |
| A549/Tax | 345.33±12.33 | 248.07±8.00 | 64.95±1.14 | |||
| MCF-7 | 8.07±3.12 | 16.71 | 2.91±0.29 | 75.12 | 5.86±0.11 | 5.99 |
| MCF-7/ADR | 134.87±10.93 | 218.60±37.01 | 35.10±2.19 | |||
| HCT-8 | 8.28±0.47 | 4.03 | 4.37±0.11 | 49.92 | 0.24±0.07 | 225.21 |
| HCT-8/VCR | 33.37±1.91 | 218.17±23.86 | 54.05±5.45 | |||
The RI values were calculated based on the ratios of the IC50 values for anti-tumor drugs in resistant cells and sensitive cells.
Table 5.
MDR reversal abilities of derivatives in A549/Tax, MCF-7/ADR and HCT-8/VCR cells (± SD, n = 3).
Table 5.
MDR reversal abilities of derivatives in A549/Tax, MCF-7/ADR and HCT-8/VCR cells (± SD, n = 3).
| Compounds | A549/Tax | MCF-7/ADR | HCT-8/VCR | |||
|---|---|---|---|---|---|---|
| IC50 (Tax) | RF | IC50 (ADR) | RF | IC50 (VCR) | RF | |
| Pyxinol | 100.20±6.60 | 3.45 | 106.46±4.07 | 2.05 | 43.23±1.71 | 5.21 |
| 24S-Pyxinol | 111.83±5.13 | 3.09 | 105.89±20.51 | 2.06 | 26.90±0.70 | 8.37 |
| 1 | 33.97±0.32 | 10.17 | 69.70±11.46 | 3.14 | 30.38±2.15 | 7.41 |
| 2 | 46.64±1.79 | 7.40 | 69.84±1.48 | 3.13 | 25.50±1.48 | 8.83 |
| 3 | 31.61±0.94 | 10.92 | 63.41±2.17 | 3.45 | 20.29±1.48 | 11.10 |
| 4 | 53.34±2.90 | 6.47 | 94.47±4.96 | 2.31 | 46.64±1.99 | 4.83 |
| 5 | 37.55±0.38 | 9.20 | 68.81±2.38 | 3.18 | 35.38±9.87 | 6.37 |
| 6 | 69.74±11.19 | 4.95 | 183.50±12.32 | 1.19 | 62.06±10.47 | 3.63 |
| 7 | 67.94±6.71 | 5.08 | 71.58±2.50 | 3.05 | 50.03±4.01 | 4.50 |
| 8 | 54.81±2.73 | 6.30 | 47.14±2.22 | 4.64 | 33.19±5.15 | 6.79 |
| 9 | 75.37±3.01 | 4.58 | 114.93±3.91 | 1.90 | 111.35±27.33 | 2.02 |
| 10 | 75.63±1.52 | 4.57 | 80.74±1.41 | 2.71 | 52.72±3.46 | 4.27 |
| 11 | 44.60±1.71 | 7.74 | 77.87±1.77 | 2.81 | 32.25±1.20 | 6.98 |
| 12 | 49.60±3.61 | 6.96 | 202.60±7.95 | 1.08 | 48.26±2.12 | 4.67 |
| 13 | 38.41±3.12 | 8.99 | 100.53±2.83 | 2.17 | 39.81±2.52 | 5.66 |
| 14 | 51.52±1.50 | 6.70 | 47.38±3.79 | 4.61 | 24.29±2.88 | 9.27 |
| 15 | 59.55±6.15 | 5.80 | 162.50±1.73 | 1.35 | 39.86±4.46 | 5.65 |
| 16 | 32.21±3.54 | 10.72 | 46.35±0.87 | 4.72 | 27.15±0.39 | 8.30 |
| 17 | 31.44±1.89 | 10.98 | 51.78±4.94 | 4.22 | 20.56±0.82 | 10.95 |
| 18 | 32.25±6.13 | 10.71 | 44.74±3.36 | 4.89 | 25.00±0.98 | 9.01 |
| 19 | 62.97±18.64 | 5.48 | 62.49±3.01 | 3.50 | 40.61±3.85 | 5.55 |
| 20 | 52.00±6.80 | 6.64 | 72.11±7.09 | 3.03 | 27.90±1.26 | 8.07 |
| 21 | 41.56±5.94 | 8.31 | 79.71±7.14 | 2.74 | 32.21±3.51 | 7.00 |
| 22 | 118.73±1.59 | 2.91 | 52.36±5.93 | 4.17 | 22.77±1.65 | 9.89 |
| 23 | 66.56±4.50 | 5.19 | 49.60±3.23 | 4.41 | 47.23±4.14 | 4.77 |
| 24 | 92.98±4.75 | 3.71 | 272.23±36.41 | 0.80 | 42.74±1.45 | 5.27 |
| 25 | 69.83±5.41 | 4.95 | 42.13±1.31 | 5.19 | 19.42±1.08 | 11.60 |
| 26 | 76.34±3.70 | 4.52 | 74.74±9.80 | 2.92 | 44.36±4.39 | 5.08 |
| 27 | 107.03±7.71 | 3.23 | 103.20±6.91 | 2.12 | 24.06±0.99 | 9.36 |
| 28 | 94.69±12.11 | 3.65 | 114.57±2.48 | 1.91 | 26.33±2.87 | 8.55 |
| 29 | 73.83±9.12 | 4.68 | 59.72±3.77 | 3.66 | 59.52±13.63 | 3.78 |
| 30 | 125.47±2.80 | 2.75 | 80.79±3.10 | 2.71 | 37.56±1.45 | 6.00 |
| 31 | 78.26±7.40 | 4.41 | 124.27±4.52 | 1.76 | 32.43±1.21 | 6.94 |
| 32 | 120.17±13.70 | 2.87 | 149.47±13.16 | 1.46 | 111.56±18.75 | 2.02 |
| 33 | 86.07±1.47 | 4.01 | 106.11±16.45 | 2.06 | 75.26±8.69 | 2.99 |
| 34 | 64.60±5.68 | 5.35 | 43.98±4.08 | 4.97 | 25.87±0.33 | 8.71 |
| 35 | 87.28±3.44 | 3.96 | 154.90±9.99 | 1.41 | 50.18±0.14 | 4.49 |
| 36 | 60.33±4.29 | 5.72 | 48.09±1.89 | 4.55 | 25.64±2.86 | 8.78 |
| 37 | 22.55±1.79 | 15.31 | 35.33±0.95 | 6.19 | 16.14±0.45 | 13.95 |
| 38 | 54.80±15.83 | 6.30 | 58.95±10.72 | 3.71 | 21.99±1.95 | 10.24 |
| 39 | 71.14±2.15 | 4.85 | 66.51±1.37 | 3.29 | 37.04±2.79 | 6.08 |
| 40 | 87.31±7.19 | 3.96 | 100.64±2.72 | 2.17 | 25.99±4.77 | 8.67 |
| Vrp | 17.98±0.47 | 19.21 | 34.27±1.45 | 6.38 | 26.79±0.67 | 8.41 |
RF values were calculated based on the ratios of the IC50 values in resistant cells without and with the tested compounds.
Table 6.
The RSD (%) of peak area and RT in validation tests.
| Experiments | ESI+ mode | ESI- mode | ||
| Peak intensity | Retention time | Peak intensity | Retention time | |
| System stability | 1.35~2.89 | 0.29~2.51 | 1.23~2.86 | 0.22~2.69 |
| Precision | 0.57~2.35 | 0.16~2.47 | 1.16~2.74 | 0.28~2.16 |
| Reproducibility | 1.78~2.52 | 0.17~2.88 | 1.17~2.63 | 0.18~2.58 |
| Sample stabililty | 0.45~2.65 | 0.21~2.54 | 0.71~2.62 | 0.53~2.24 |
Table 7.
Distinct metabolites identified in cell samples.
| NO. | RT(min) | VIP | Formula | Biomarkers | Measured乐mass(Da) | Mass error (ppm) | Adducts | HMDB ID | Pathway | Change trend | |
|---|---|---|---|---|---|---|---|---|---|---|---|
| M/C | D/M | ||||||||||
| 1# | 12.91 | 1.54 | C26H43NO5 | Chenodeoxycholic acid glycine conjugate | 448.3073 | 2.23 | M-H | 0000637 | PBAB | ↑ | ↓ |
| 2* | 13.15 | 8.44 | C18H39NO3 | Phytosphingosine | 318.3004 | -1.26 | M+H | 0004610 | SM | ↓ | ↑ |
| 3* | 15.49 | 2.67 | C18H39NO2 | Sphinganine | 302.3054 | -1.65 | M+H | 0000269 | SM | ↓ | ↑ |
| 4# | 17.68 | 1.10 | C20H32O3 | 5,6-Epoxy-8,11,14-eicosatrienoic acid | 319.2266 | -2.19 | M-H | 0002190 | AAM | ↑ | ↓ |
| 5# | 18.75 | 15.34 | C26H52NO7P | LysoPC(18:1(9Z)/0:0) | 566.3481 | 4.06 | M-H+FA | 0002815 | GM | ↓ | ↑ |
| 6# | 19.86 | 1.49 | C18H32O3 | 9,10-Epoxyoctadecenoic acid | 295.2272 | -0.34 | M-H | 0004701 | LAM | ↑ | ↓ |
| 7# | 21.14 | 2.06 | C28H56NO7P | PC(18:1(9Z)e/2:0) | 594.3763 | -1.35 | M-H+FA | 0011148 | ELM | ↓ | ↑ |
| 8# | 21.4 | 1.66 | C26H56NO6P | LysoPC(O-18:0/0:0) | 554.3813 | -1.62 | M-H+FA | 0011149 | ELM | ↓ | ↑ |
| 9* | 22.98 | 9.16 | C20H32O2 | Arachidonic acid | 303.2331 | 2.31 | M-H | 0001043 | AAM | ↑ | ↓ |
| 10# | 23.13 | 3.02 | C27H46O4 | 3a,7a,12a-Trihydroxy-5β-cholestan-26-al | 433.3326 | 1.85 | M-H | 0003533 | PBAB | ↑ | ↓ |
| 11* | 23.28 | 4.12 | C18H32O2 | Linoleic acid | 279.2333 | 3.22 | M-H | 0000673 | LAM | ↑ | ↓ |
| 12# | 25.8 | 1.79 | C40H80NO8P | PC(16:0/16:0) | 778.5623 | 3.21 | M-H+FA | 0000564 | LAM,GM | ↓ | ↑ |
| 13# | 26.49 | 1.32 | C27H44O4 | 3β,7a -Dihydroxy-5-cholestenoate | 431.316 | -0.23 | M-H | 0012454 | PBAB | ↓ | ↑ |
| 14# | 26.84 | 1.38 | C43H78NO7P | PE(P-18:0/20:4 (5Z,8Z,11Z,14Z)) | 750.5442 | 0.53 | M-H | 0005779 | GM | ↓ | ↑ |
C: Control group; M: Model group; D: Compound 37; #: Metabolites confirmed by MS fragmentation, *: Metabolites identified by references.
Table 8.
The AUC values and p values of 14 differential metabolites in ROC curves.
| HMDB | Model group vs Control group | Compound 37 group vs Model group | ||
|---|---|---|---|---|
| AUC | p | AUC | p | |
| HMDB 0000637 | 1.000 | <0.001 | 1.000 | <0.001 |
| HMDB 0004610 | 1.000 | <0.001 | 0.972 | <0.001 |
| HMDB 0000269 | 1.000 | 0.01 | 0.972 | <0.001 |
| HMDB 0002190 | 1.000 | <0.001 | 1.000 | <0.001 |
| HMDB 0002815 | 1.000 | <0.001 | 1.000 | <0.001 |
| HMDB 0004701 | 1.000 | <0.001 | 1.000 | <0.001 |
| HMDB 0011148 | 1.000 | <0.001 | 1.000 | <0.001 |
| HMDB 0011149 | 1.000 | <0.001 | 1.000 | <0.001 |
| HMDB 0001043 | 1.000 | <0.001 | 1.000 | <0.001 |
| HMDB 0003533 | 1.000 | 0.01 | 1.000 | 0.01 |
| HMDB 0000673 | 0.972 | 0.01 | 0.944 | 0.01 |
| HMDB 0000564 | 1.000 | <0.001 | 1.000 | <0.001 |
| HMDB 0012454 | 1.000 | 0.01 | 1.000 | <0.001 |
| HMDB 0005779 | 1.000 | <0.001 | 1.000 | <0.001 |
Table 9.
The analysis results of metabolic pathways.
| NO. | Pathway Name | Match status | P | -log(P) | Holm p | FDR | Impact |
|---|---|---|---|---|---|---|---|
| 1 | Linoleic acid metabolism | 3/5 | 5.81E-06 | 5.2355 | 0.0005 | 0.0005 | 1.0000 |
| 2 | Glycerophospholipid metabolism | 3/36 | 0.0035 | 2.4540 | 0.2918 | 0.0984 | 0.2163 |
| 3 | Arachidonic acid metabolism | 3/36 | 0.0035 | 2.4540 | 0.2918 | 0.0984 | 0.3337 |
| 4 | Primary bile acid biosynthesis | 3/46 | 0.0071 | 2.1498 | 0.5737 | 0.1487 | 0.0442 |
| 5 | Ether lipid metabolism | 2/20 | 0.0131 | 1.8820 | 1.0000 | 0.2020 | 0.2289 |
| 6 | Sphingolipid metabolism | 2/21 | 0.01443 | 1.8408 | 1.0000 | 0.2020 | 0.1582 |
Disclaimer/Publisher’s Note: The statements, opinions and data contained in all publications are solely those of the individual author(s) and contributor(s) and not of MDPI and/or the editor(s). MDPI and/or the editor(s) disclaim responsibility for any injury to people or property resulting from any ideas, methods, instructions or products referred to in the content. |
© 2023 by the authors. Licensee MDPI, Basel, Switzerland. This article is an open access article distributed under the terms and conditions of the Creative Commons Attribution (CC BY) license (http://creativecommons.org/licenses/by/4.0/).
Copyright: This open access article is published under a Creative Commons CC BY 4.0 license, which permit the free download, distribution, and reuse, provided that the author and preprint are cited in any reuse.


