Submitted:
28 September 2023
Posted:
30 September 2023
You are already at the latest version
Abstract
This research, which focuses on wave energy generating technology, suggests a brand-new oscillating float-type wave energy conversion system that is appropriate for the offshore wave environment. To accurately model the device, a three-dimensional viscous numerical pool is created based on STAR-CCM+. The array-type power generation device is numerically simulated using theoretical analysis and numerical simulation, and the wave energy power generation device is arranged as double floats in the front and rear rows, representing triangular array type and rectangular array type, respectively. The triangular array type is a superior layout and can make greater use of marine resources, according to this paper's analysis of the hydrodynamic and power generation impacts of the three array types. The findings are meant to serve as a guide for engineering practice.
Keywords:
Wave power generation
; Oscillating float
; Computational Fluid Dynamics
; Array
1. Introduction
Traditional energy sources are becoming more and more rare as human civilization and the global economy evolve, and humanity is gradually turning its focus to the wide sector of ocean energy. A lot of different types of power generators have been developed as a result of research into marine renewable energy, which includes wave power generators. The structural design and hydrodynamic performance of oscillating float-type power generation devices, one type of wave energy power generation device, have a significant influence on analyzing the motion characteristics and efficacy of wave energy devices. The criteria for large-scale power generation cannot be met by a single float-type wave energy generation equipment because it is unable to completely use the wave energy in the sea per unit area. Wave energy may be constantly and uniformly absorbed by array float wave energy generating technology, which significantly lowers the cost of power generation.
People have given the development of renewable resources considerable thought since the 1973 start of the oil crisis. Research on wave energy devices is still in its infancy overseas, particularly in offshore nations. During the energy crisis of 1974, Stephen Salter [1], a marine engineer at the University of Edinburgh, created Salter’s duck, a wave energy device that was the first to use oscillating floats to harness wave energy. McIver [2] discovered in 1994 that changes in wave direction angle had a major influence on device motion, and that the presence of a particular range of wave direction angles can maximize the array device’s impact factor. In 2002, Falcao [3], based on linear wave theory, came to the conclusion that the form of the array arrangement influences how hydrodynamic motion affects the device’s ability to collect energy. In 2007, Fitzgerald et al. [4] investigated the impact of various float array arrangements and incoming wave directions using numerical techniques, and they discovered that the average value of the influence coefficient of the array device was almost equal to 1. The macroscopic characteristic equations of the array system were constructed by Garnaud [5] in 2009, and they discovered that the array system outperformed single floats in terms of capturing wave energy. In 2011, Haller [6] et al. performed experiments with arrayed wave energy devices, analyzing the effective wave energy capturing effect between the array device in a regular wave and under the irregularity. However, they did not perform a thorough analysis of the hydrodynamic properties between the floats. In 2012, Borgarino [7] discovered that the PTO system had a certain level of damping, meaning that the float spacing has little to no impact on the device’s overall hydrodynamics and energy. In 2016, Wolgamot [8] et al. carried out a hydrodynamic analysis of the square array floats for the analysis and discovered that there is an approximate trapped wave phenomena between the floats, wave energy will be concentrated, and the collected power of the array will be greatly boosted. In 2017, Penalba [9] et al. discovered that the energy absorption is best at a specific array spacing and that hydrodynamic interactions have a higher impact on the device’s overall collected power at lower array spacings. A frequency domain analytical model of the hydrodynamic properties of an arrayed float wave energy device was created by Wei [10] in 2019 and its nonlinear PTO damping effect was calculated. In 2020, Gomes [11] et al. tested a five-float array physically, examined the device’s motion and mooring stresses, and contrasted the mooring performance of the device under various array configurations.
This article investigates the hydrodynamic performance and captured energy characteristics of device array systems through theoretical analysis and numerical simulation. The analyses and conclusions drawn from the investigation are meant to serve as a technical foundation and a point of reference for the engineering application of the oscillating float wave energy generation device [12,13,14,15].
2. Design and Theoretical Analysis of a New Oscillating Float-Type Wave Energy Device
2.1. Design Concept and Overall Design of the Device
The Wells turbine, which can adjust to the effects of bidirectional airflow and maintain unidirectional rotation, and the working mechanism of the conventional cylindrical oscillating float were both used in the design of the novel float-type wave power generator. Combining the two, a torque is produced by the blades’ unidirectional spinning during the raising and sinking motion, and this torque finally propels the generator at the device’s rear to produce energy. Developed in Australia, the Poseidon is a model oscillating float-type wave power generator and is seen in Figure 1.
The structural engineer Alan Arthur Wells created the Wells turbine, a low-pressure head air turbine [16]. An illustration of the Wells turbine’s construction may be found in Figure 2. The Wells blades are symmetrical airfoils that maintain unidirectional rotation in the reciprocating air flow. It consists of a symmetrical rotor with numerous sets of airfoil blades positioned along the hub with the chord surface normal to the rotating axis. It is frequently employed in air turbines for oscillating water column wave energy producers because of its inventive structural construction. It is also the most affordable option for wave power generators due to its simplicity.
The classic cylindrical float and the Wells turbine, which can sustain unidirectional rotation in the reciprocating airflow impact, are thoroughly imitated in this device’s design, as illustrated in Figure 3. The two are successfully combined in this paper to simplify the transmission process, allowing the device to realize the blades’ unidirectional rotation to create a torque during the lifting and sinking motion, and ultimately drive the generator at the device’s back to produce electricity [17].
The novel device’s design employs a suspension chain line mooring rope to anchor it in the ocean. To preserve the device’s general stability, four dampening plates are mounted vertically on the sleeve. The entire apparatus uses a gear mechanism to convey energy. The vortex fan section is the main part of the energy conversion device and is also what sets it apart structurally from other wave energy conversion systems. Since the spinning blade serves as the primary study object in this work, its hydrodynamic and operational features are systematically investigated. Figure 4 depicts the condensed model of the device used in the CFD simulation. The float is created in a cylindrical shape, measuring 200 mm in diameter and 120 mm in height. It is sealed and hollow. The float is equipped with a generator and a transmission mechanism inside, and it floats on the water’s surface while oscillating in response to wave force.
2.2. Characteristics of Energy Conversion
In the wave energy generator, energy flow is unidirectionally and irreversibly converted. A fair study of the device’s energy conversion law can decrease energy loss throughout the transfer process and increase the efficiency of energy conversion as a whole. Through its distinctive structural design and transmission mechanism, the innovative float-type wave energy generator realizes the absorption and conversion of wave energy. The float responds to the waves during the wave transmission process by oscillating, which then transforms the energy from the waves into mechanical energy in the form of linear motion. It is subjected to the effect of saltwater in the process of pendulum motion and creates unidirectional rotating motion to transmit mechanical energy because it is permanently coupled with the turbofan through the sleeve. Through the transmission system, the end generator causes mechanical energy in the form of rotation to be transformed into electrical energy [18].
The new float-type wave energy conversion device divides energy conversion into three conversion links together with other power producing devices. A power production system can take entity energy, which is manifested in wave movement under the undulation of mechanical energy, at the initial level of direct contact with floats and waves. The undulation of mechanical energy through the unidirectional rotation will be the second level of the intermediate conversion and transmission system, oscillating turbofan acting as the floats, to the third level of transmission to power generation. The output of the power system, for the generator, and the third level of the power producing system. The three levels of conversion are interconnected and interact with each other.
Overall efficiency η:
Vortex fan input power Pinput
where Einput is the kinetic energy of a cylindrical fluid of height h and radius R passing through the horizontal cross-section of the fan blade at time t. is the relative flow velocity of the fluid to the horizontal cross-section of the vortex fan.
The output power of the vortex fan :
where T is the output torque of the vortex fan, ω is the rotational speed (rad/s), N is the number of blades the vortex fan has, and Ts is the torque generated by a single blade on the drive shaft [19].
2.3. Mechanical Characteristics
The revolving turbo-fan is the primary structural component of the energy conversion in this study, the theoretical analysis of this component is the primary focus. In order to analyze the motion and force of each rotating blades, a section parallel to the rotating axis and parallel to the airfoil is obtained since the spinning blades of the power generating device do not change in form along the direction of the drive shaft and each blade is precisely the same. Figure 5 depicts the blade motion and force, and its horizontal cross section serves as the reference plane. When seawater impinges on the impeller motion with velocity , it induces a current angle . This results in a lift force perpendicular to the current direction and a drag force parallel to the current direction.
As shown in Figure 5, is the circular velocity of the fan blade, as
where is the rotational angular velocity of the blade and is its directional diameter.
Then the combined velocity of the blade relative to the incoming flow is
The angle of water flow is
The blade lift and drag forces are
where is the fluid density, is the characteristic area of the blade, is the lift coefficient and is the drag coefficient.
The above forces can be decomposed into axial and tangential forces as follows
From the above analysis, it can also be found that for a given value , the direction of the tangential force is independent of the positive or negative value , and the fan blade rotates in one direction regardless of the direction of the flow.
3. Hydrodynamic Performance Analysis of Double Float Devices
3.1. Basic Theory of CFD
The conservation of mass, conservation of momentum, and conservation of energy are the three physics principles that should be adhered to while transporting fluids. Without taking into account the law of conservation of energy, the hydrodynamic performance of a new oscillating float wave energy generator in an incompressible viscous fluid is examined in this paper. Instead, the law of conservation is expressed only by using the equations for mass and momentum conservation.
Figure 6 depicts the CFD simulation method. This study initially builds the control equations to model the pool using a wall and constant pressure barrier in the CFD simulation. The computational model is embodied in the form of a grid, which is separated into structural and non-structural grids. The structural grid is simple to manage, while the non-structural grid is more accurate for simulating the flow field around the complicated boundary. In this research, the finite volume approach is applied after the computational domain has been discretized [20]. A system of algebraic equations with definite solutions is formed once the boundary conditions are discretized, the solution parameters are supplied, and the setup is finished. Line-value plots are mostly employed in this paper’s examination of the device’s motion, while vector plots are used to illustrate and elaborate the flow field’s physical phenomena, such as the dynamic pressure on the fan surface.
3.2. Simulation Setup for CFD
In this chapter, a physical model must be chosen in order to calculate the STAR-CCM+. The main goal of the hydrodynamic simulation is to ascertain the dynamic reaction of the novel float-type wave energy generator under various wave circumstances. Table 1 displays the different parameter settings used throughout the simulation in this work.
In this study, Stokes fifth order waves are created using the boundary condition wave-making techniques. At the wave period T=1.5s, the computational domain is configured based on the wave’s wavelength. The intake border is situated 1 from the origin in the x-axis’s anticlockwise orientation. With a total length of 3 inches, the inlet boundary is situated 1 inch from the origin in the x-axis’s negative direction, while the outlet boundary is situated 2 inches away in the x-axis’s positive direction. The water depth is set to be 1 m, and the water surface is set to be 1.08 m above the water’s surface. The computational domain is 2.56 m wide and 2.08 m high. For a total computational grid of roughly 1 million, encryptions are generated near the water’s surface, in the distance, and in the region where movements overlap. Figure 7 depicts the power generator’s computational domain layout [21].
3.3. Hydrodynamic Performance Study of Power Generation Unit with Double Float System
The array arrangement considerably decreases the power production cost while increasing the efficiency of power conversion. A single float-type wave energy generator has a high cost of power generation and cannot absorb wave energy per unit of sea area well. Future wave energy generating research will focus on arraying. In this chapter, the arrayed power generating device is numerically simulated. The array type is a triangular array type, with double floats in the front and rear rows, and a rectangular array type, respectively. The three array approaches’ impacts on hydrodynamics and energy capture are examined, and the findings are meant to serve as a guide for engineering practice.
As the research items in this part, two gadgets with a front and rear arrangement have been chosen. The devices simulate the motion in a wave with wave height H=0.1m and period T=1.5s, and their directions are all perpendicular to the direction of wave propagation. The distance between the two devices is one-fourth of the wavelength. Figure 8 depicts the placement and action of the double float devices.
After the double float device system’s operation has been stabilized, Figure 9 displays the time history curves for pendant oscillation displacement and velocity. According to the figure, device one’s pendulum displacement fluctuation is more obvious than device two’s, which is because device one is affected by the wave ripples of device two and has a stronger fluctuation while device two is affected by the wave diffraction of device one and has a weaker fluctuation. The arrangement of device one in front of the wave-facing end produces a certain blocking effect on the wave when responding to the wave movement, and in addition, the absorption of energy reduces the intensity of the wave when it propagates backwards, which results in a larger movement amplitude for device one than for device two.
The time-calendar curve for the vortex fan angular velocity of the double-float system is depicted in Figure 10. As observed in the image, both devices gradually experience an increase in rotating angular velocity as operating time rises, and both devices eventually stabilize. Device One’s rotational speed converges steadily at 4 rad/s, while Device Two’s rotational speed converges steadily at a lower rate of roughly 2.5 rad/s. This is because device 2’s reaction to wave motion is less than device 1’s, which correlates to a lower rotating angular velocity of the fan blades. Device 2 is situated towards the rear end of the wave propagation direction.
The absorption of wave energy by device one will obstruct wave propagation and impede the absorption of wave energy by device two because the two floats are positioned back and forth in the direction of wave propagation. As a result, the corresponding output power will exhibit the same pattern. The output power of device one is higher than that of device two, according to the output power comparison graphs of the two devices in Figure 11. The overall power of device two is still less than that of device one, which is in a suppressed state, after a thorough analysis of the individual power generation devices reveals that the increase in wave energy utilisation efficiency is primarily reflected in the increase in output power of device one.
4. Hydrodynamic Study of Arrayed Power Plants
4.1. Hydrodynamic Performance Study of Power Generator with Triangular Formation System
Three devices that are grouped in an equilateral triangle arrangement are the subject of research in this section. The devices, which simulate motion in a wave with wave height H = 0.1 m and time T = 1.5 s, are aligned perpendicular to the wave propagation direction. The remaining computational domains are set up in the same way as in the case of a single power generating device, and the longitudinal distance between the two devices is one-quarter of the wavelength. Figure 12 depicts the devices’ motion and dispersion.
When all movements were stabilized, the three devices were chosen to be examined, as seen in Figure 13. The vertical oscillation velocity and displacement of device one are shown in the figure to be much higher than those of devices two and three. The impact of device one on devices two and three is, however, less when compared to the double floats arranged in front and rear. This is because device one is not aligned in a straight line with devices two and three in the wave direction, which is connected to the array approach. Wave-to-wave interference and diffraction effects are weaker than device-to-device interference and diffraction effects.
In Figure 14, the rotating angular velocities of the blades of the triangular array system are shown as time history curves. The three devices’ rotating angular velocities are seen in the figure to steadily grow with the number of blades until eventually converging. Device one’s rotational speed stabilizes at 4.12 rad/s, while devices two and three have rotational speeds that are similar. Device two’s rotational speed stabilizes at about 3.08 rad/s, while device three’s rotational speed stabilizes at about 2.89 rad/s, a lower rotational speed.
The output power of the triangular array system is depicted as a time-calendar curve in Figure 15. The output power patterns of the three devices are shown in the figure to be consistent with the rotating angular velocity. Device One has an output power that is roughly double that of Devices Two and Three.
4.2. Hydrodynamic Performance Study of a Rectangular Array System Power Generator
This part analyzes motion in a wave with wave height H = 0.1m and period T = 1.5s using four devices arranged in a rectangular array. A parametric analysis is conducted in order to regulate the variables; the spacing between the four power production devices is set to be one-fourth of the wavelength, and the rest of the computational domain is configured similarly to the case of a single power generation device. Figure 16 depicts the devices’ dispersion and motion.
As indicated in Figure 17, the four devices were chosen for analysis once their motions were all stabilized. Devices one and two have similar and slightly higher velocities and displacements than one another, whereas devices three and four have somewhat higher velocities and displacements than one another. This means that even if the two objects are laterally at the same position while travelling relative to the wave, their motion will be impacted by the unidirectional rotational force of the fan blades.
The time-calendar curve for the rotating angular velocity of the rectangular array system is shown in Figure 18. The four devices’ regular periodicity and the fact that their rotating angular velocities eventually converge may be observed in the illustration. The maximum rotational speed of Device 1 converges steadily at 3.78 rad/s. Device 2’s rotational speed stabilizes at roughly 3.52 rad/s. The two devices at the wave-facing end, which have slower rotation speeds, have an impact on the comparable rotation speeds of devices three and four.
The output power of the rectangular array system is depicted as a time-calendar curve in Figure 19. The output power patterns of the four devices are shown in the figure to be consistent with the rotating angular velocity. Devices one and two have output powers that are comparable to and greater than those of devices three and four. Devices three and four are similarly powerful, and it has been shown that, under the same wave circumstances, the distance between the adjacent devices has essentially no impact on the total system conversion efficiency.
4.3. Comparison of Formation Energy Capture Effects Based on Array Influence Factors
The wave energy array impact factor [16] is a crucial indicator of the properties of wave energy arrays because it considers how mutual hydrodynamic interference between the arrays affects the power produced by wave energy generators. The wave energy array impact factor may be written as, assuming N identical producing devices make up the array field:
where is the total power generated by a wave energy array of N floating wave energy generators; and is the power generated by a single floating wave energy device.
If greater than 1, the array arrangement improves the overall energy capture efficiency of the wave energy generator and the array has a positive effect on the efficiency of wave energy use; if less than 1, the array arrangement reduces the overall energy capture efficiency of the wave energy converter and the array has a negative effect on wave energy use. The wave environment and the configuration of the array of wave energy devices determine how much of an effect factor there will be. It is possible to modify the configuration of the device array technique so that the combined output of the array of power generators is larger than the combined output of the individual float wave energy generators. In light of the operational circumstances and power output of the various float devices, a comparison of the array impact factors of the three arrays is made. The triangular array structure is a superior configuration to enhance the total output power in this device simulation, as evidenced by a comparison of the particular parameters in Figure 20.
5. Conclusions
An innovative design for an oscillating float wave energy generator is put forth for the wave environment off the coast of China in this research. Based on STAR-CCM+, a numerical pool is created, and its hydrodynamic performance and energy conversion characteristics are examined for various array configurations. Investigating the impacts of various array types on the power generation efficiency and motion performance of the power generating device, the following findings can be drawn:
(1) The numerical simulation of the hydrodynamic performance of the power generation device using overlapping grid technology reveals that the numerical simulation calculations are able to capture the complex flow field information of the device and consistently respond to the change rule of the device, which can be used as a key tool for CFD analysis of the new oscillating float-type wave energy power generation device.
(2) While the volatility of the double float system is smaller when compared side by side, it exhibits larger volatility overall in the direction of wave propagation before and after the alignment of the motion response with the change in wave period. The effects of the front device on the rear device are mostly caused by diffraction, whereas the effects of the back device on the front device are primarily caused by reflection.
(3) The wave energy output power of the various devices varies with the wave period, with the floats in front of the wave-facing end of each formation showing greater variability and the floats in the back showing less variability. The interaction between the two devices facilitates or inhibits the front device’s ability to convert energy, while hindering the back device. When two devices are used in parallel, their output power is comparable to that of a single device.
(4) When the distance between the three arrays is known, the performance of the devices designed in this paper is better overall in the triangular array arrangement than in the other two arrays, and the overall energy conversion efficiency can be increased by arranging the power generation equipment sensibly.
References
- Salter S H. Wave power [J]. Nature. 1974, 249: 720-724.
- McIver P. Some hydrodynamic aspects of arrays of wave-energy devices [J]. Applied Ocean Research. 1994, 16: 61-69.
- Falcao A D F O. Wave energy utilization: A review of the technologies [J]. Renewable and Sustainable Energy Reviews. 2002, 14(3):899-918P.
- Fitzgerald C, Thomas G. A preliminary study on the optimal formation of an array of wave power devices[C]. In: Proceedings of the 7th European Wave and Tidal Energy Conference (EWTEC2007), 2007.
- Garnaud X. Mei C C. Wave-power extraction by a compact array of buoys [J ]. Journal of Fluid Mechanics,2009,635:389.
- Haller M C , Porter A . Leneebluhm P , et al. Laboratory observation of waves in thevicinity of WEC-Arrays[J]. Oregon Wave Energy Trust.2011.
- Borgarino B. Babarit A. Ferrant P.Impact of wave interactions effects on energy absorption in large arrays of wave energy converters[J].Ocean Engineering.2012.41:79-88.
- Wolgamot H A, Eatock Taylo R,Taylor P H.Effects of second-order hydrodynamics onthe efficiency of a wave energy array [J]. International Journal of Marine Energy,2016,15.
- Penalba M.Touzon 1. L.opez-Mendia J, ct al. A numerical study on the hydrodynamicimpact of device slenderness and array size in wave energy farms in realistic waveclimates[J]. Ocean Engineering.2017,142:224-232.
- Wei Y, Bechlenberg A, van Rooij M, et al. Modelling of a wave cnergy converter arraywith a nonlinear power take-off system in the frequency domain[J]. Applied OceanResearch.2019,90:101824.
- Gomes. Hydrodynamic coefficients of heave plates with application to wave energy conversion [J]. IEEE Journal of Oceanic Engineering, 2020, 43(4): 983- 996.
- Ahn, S., Haas, K. A., Neary, V. S., 2020. Wave energy resource characterization and assessment for coastal waters of the United States. Applied Energy, 267, 114922. [CrossRef]
- Kim, S.S., Lee, J.H., Lee, S.S., Kang, D., Lee, S. J., 2018. A Study of Motion Characteristics Led by Connection Methods and Positions of a Wave-Energy Converter in a Regular Wave. Brodogradnja, 69(2), 35-54. [CrossRef]
- Schubert, B. W., Sergiienko, N. Y., Cazzolato, B. S., Robertson, W. S. P., Ghayesh, M. H., 2022. The true potential of nonlinear stiffness for point absorbing wave energy converters. Ocean Engineering, 245, 110342. [CrossRef]
- Li, Q., Mi, J., Li, X., Chen, S., Jiang, B., Zuo, L., 2021. A self-floating oscillating surge wave energy converter. Energy, 230, 120668. [CrossRef]
- Francesco Cambuli,Tiziano Ghisu,Irene Virdis,Pierpaolo Puddu. Dynamic interaction between OWC system and Wells turbine: A comparison between CFD and lumped parameter model approaches[J]. Ocean Engineering,2019,191(C).
- Kotb, A. T. M., Nawar, M. A. A., Abd El Maksoud, R. M., Mohamed, M. H., 2021. Comprehensive and synergistic analysis of geometry effect on an axial turbine performance for wave energy conversion. Ocean Engineering, 233, 109212. [CrossRef]
- Takao, M., Setoguchi, T., Kinoue, Y., Kaneko, K., 2006. Effect of end plates on the performence of a wells turbine for wave energy conversion. Journal of Thermal Science, 15(4), 319-323. [CrossRef]
- Zhang Y, Li D, Hong S, et al.,2023. Design of a new oscillating-buoy type wave energy converter and numerical study on its hydrodynamic performance. Brodogradnja 74(1): 145-68. [CrossRef]
- Adam, B., Noel, Abderrazak, Abdaoui, & Tarek, et al.,2017. Structural health monitoring using wireless sensor networks: a comprehensive survey. IEEE Communications Surveys & Tutorials, 19(3), 1403-1423. [CrossRef]
- Miquel, A., Kamath, A., Alagan Chella, M., Archetti, R., Bihs, H., 2018. Analysis of Different Methods for Wave Generation and Absorption in a CFD-Based Numerical Wave Tank. Journal of Marine Science and Engineering, 6(2), 73. [CrossRef]
Figure 1.
Wave power generator named Poseidon.
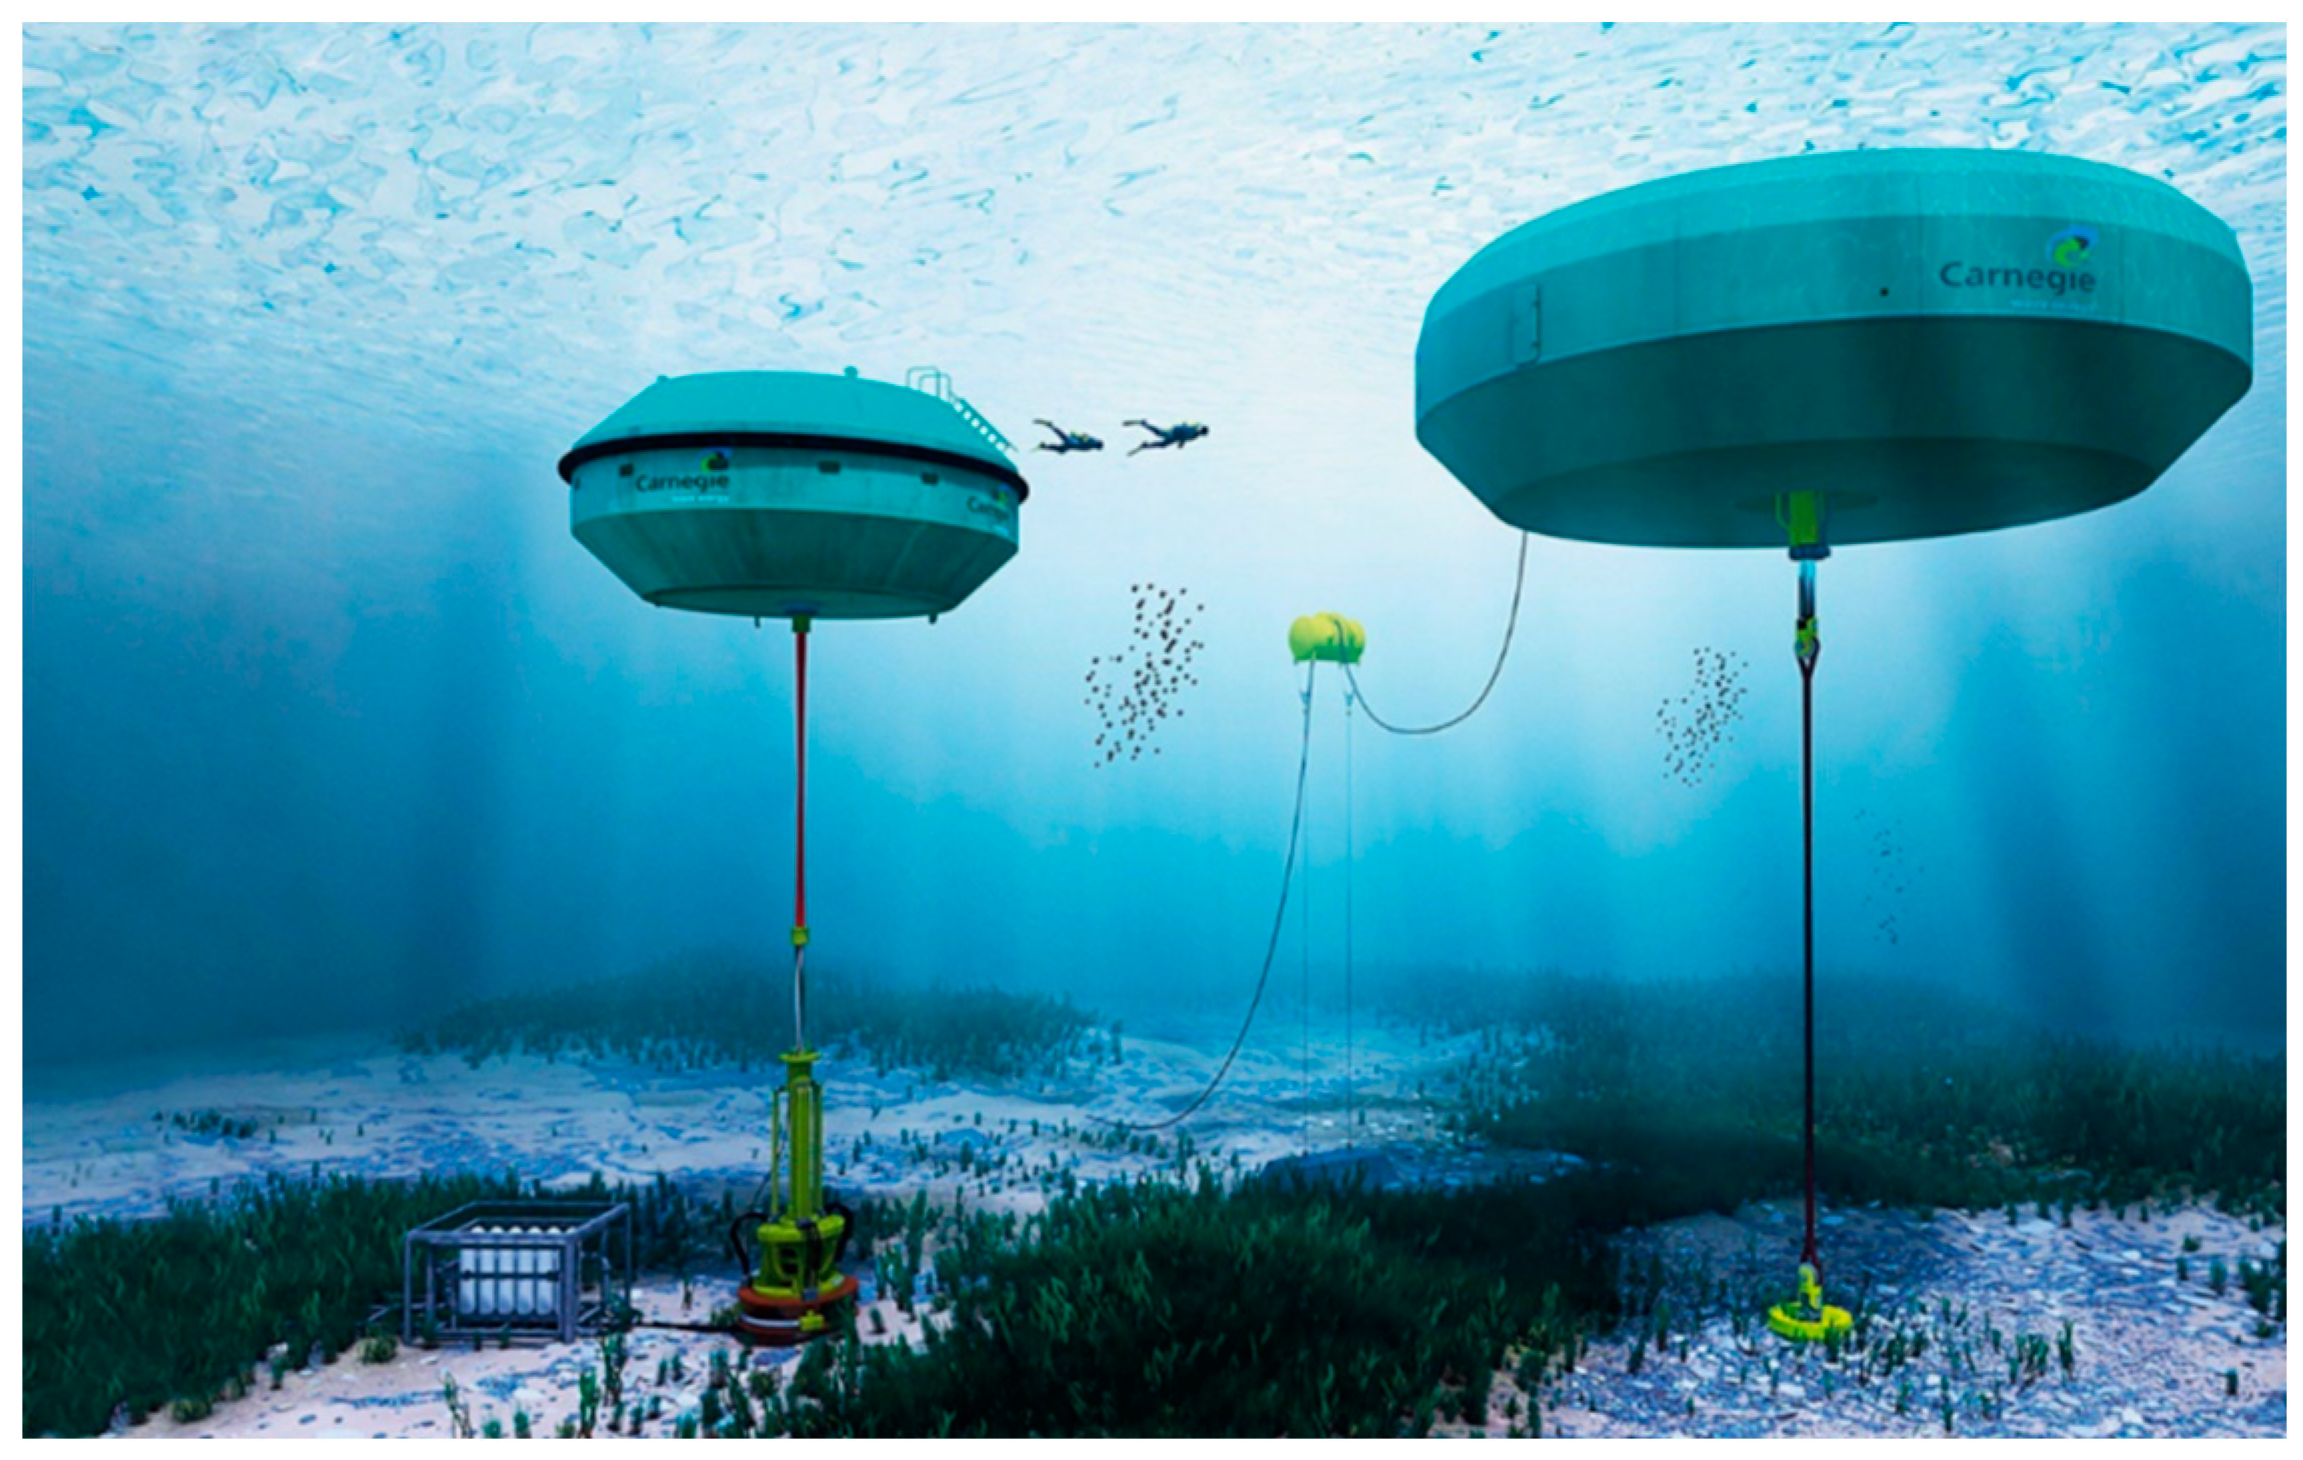
Figure 2.
Wells turbofan.
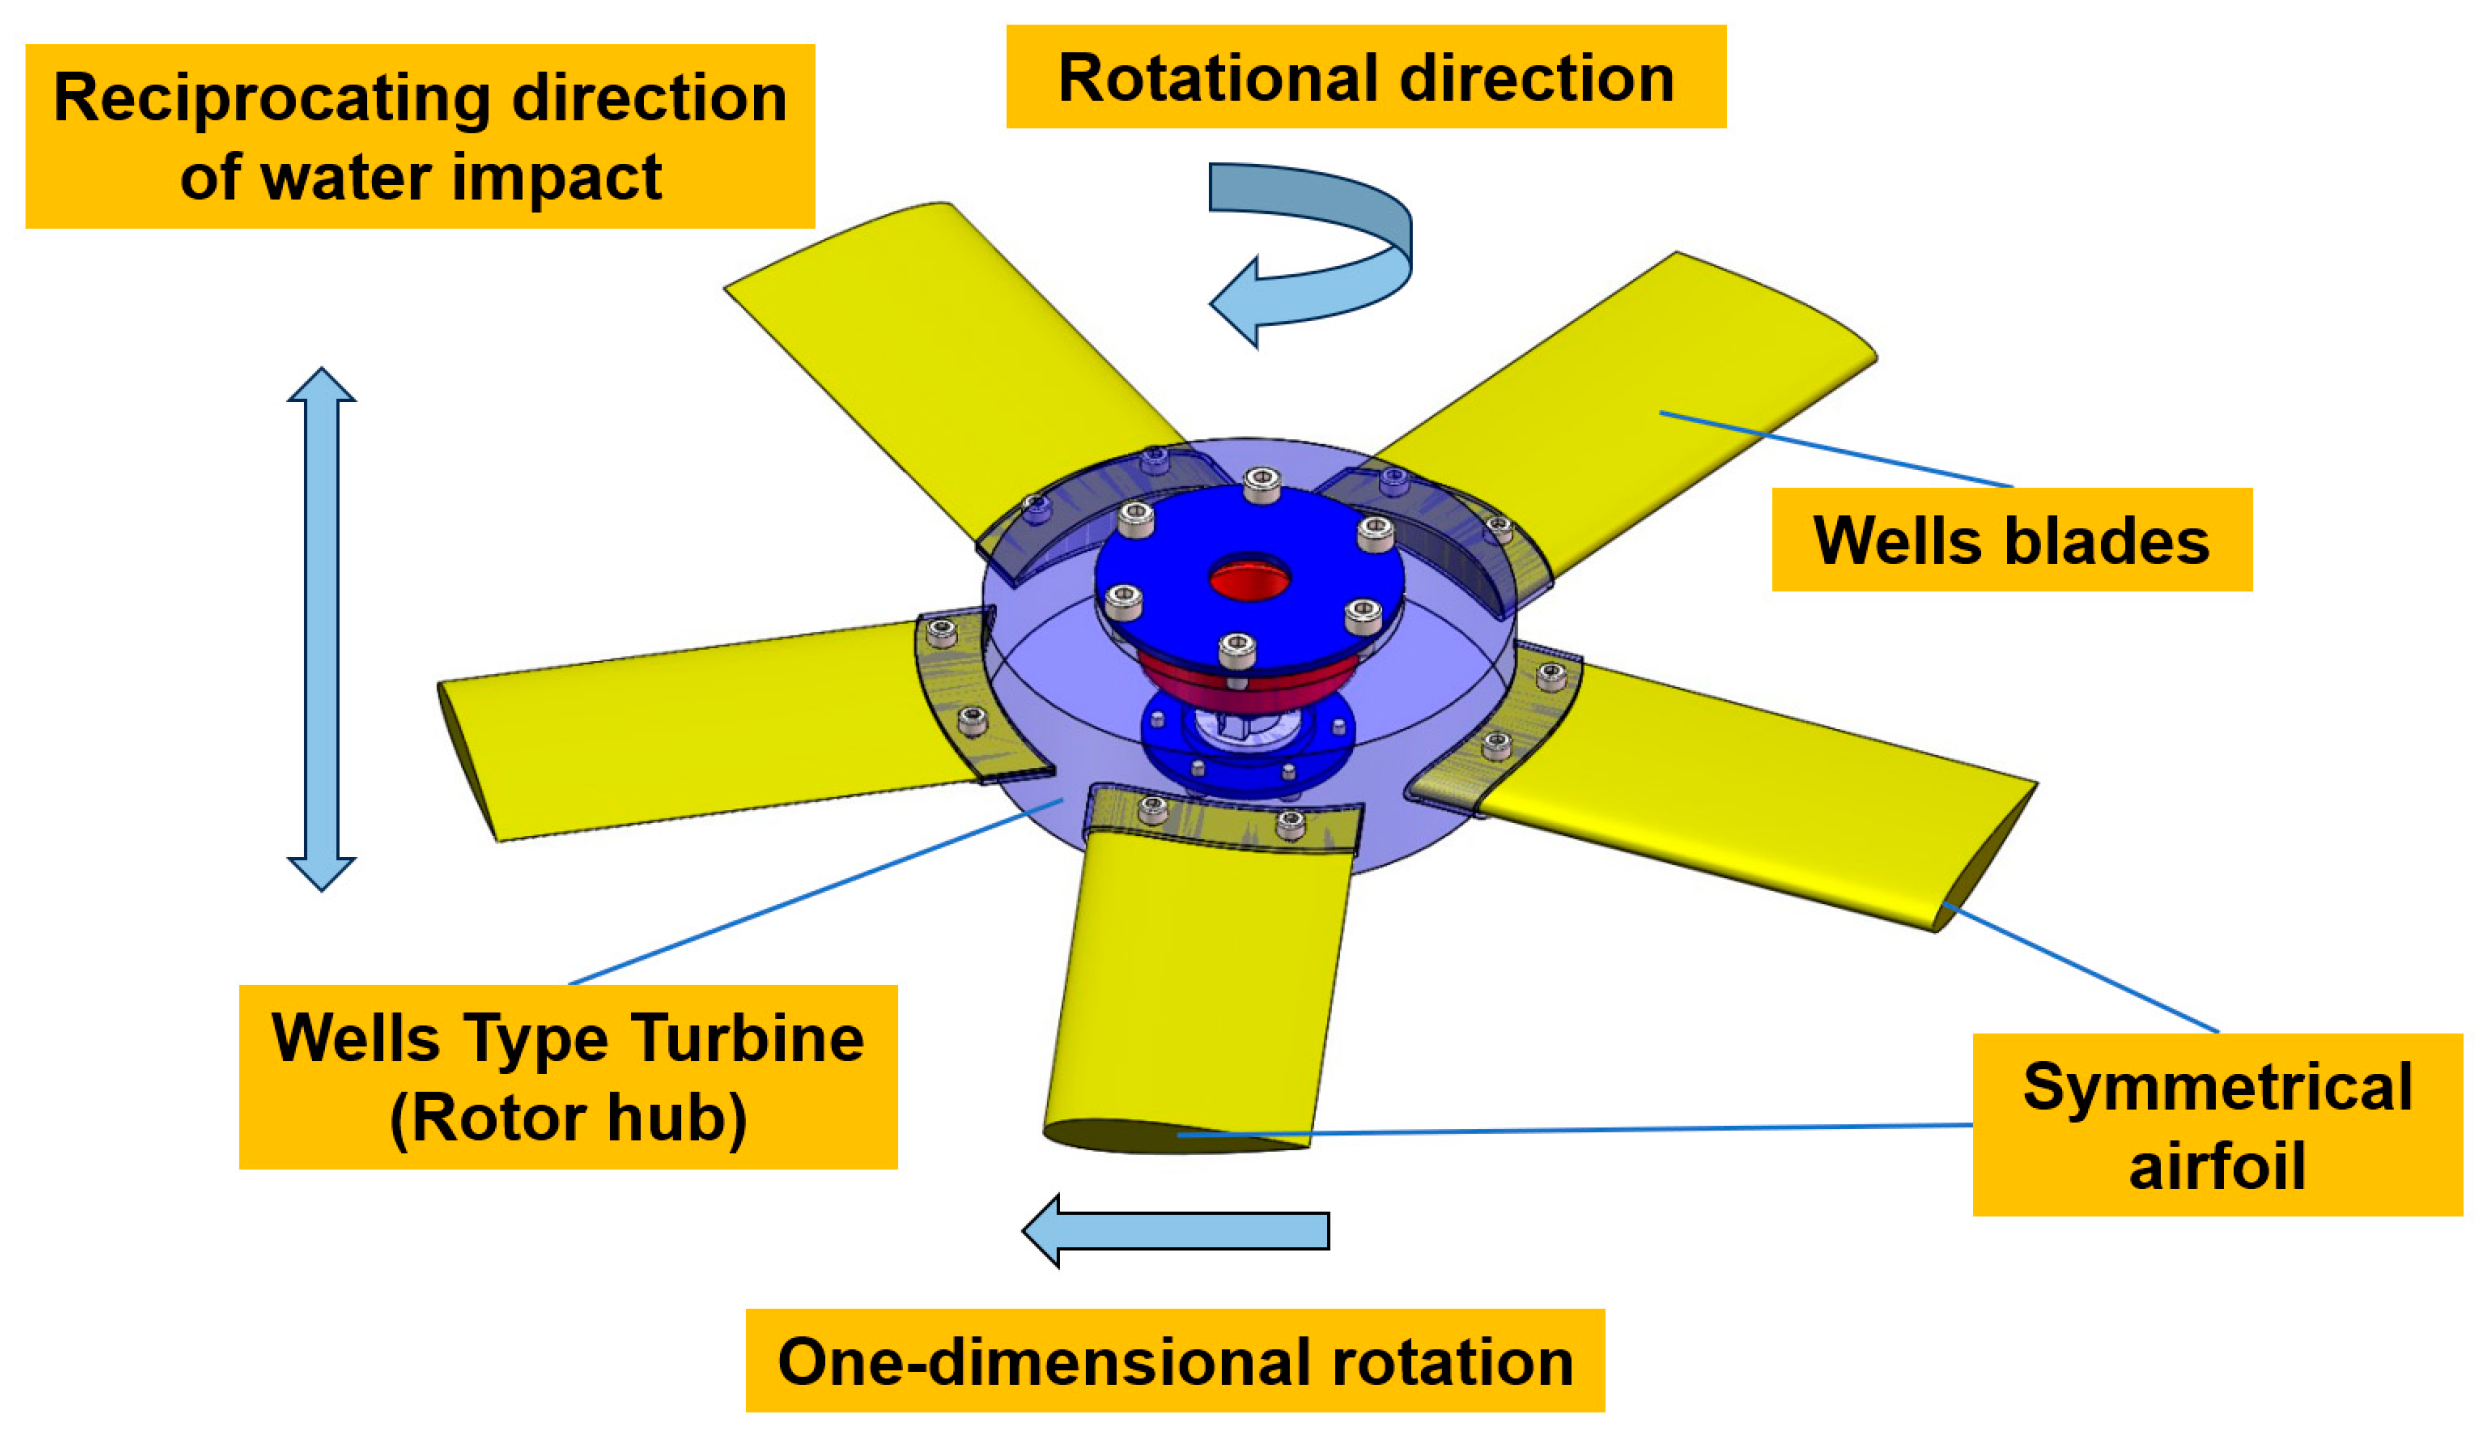
Figure 3.
Design ideas.
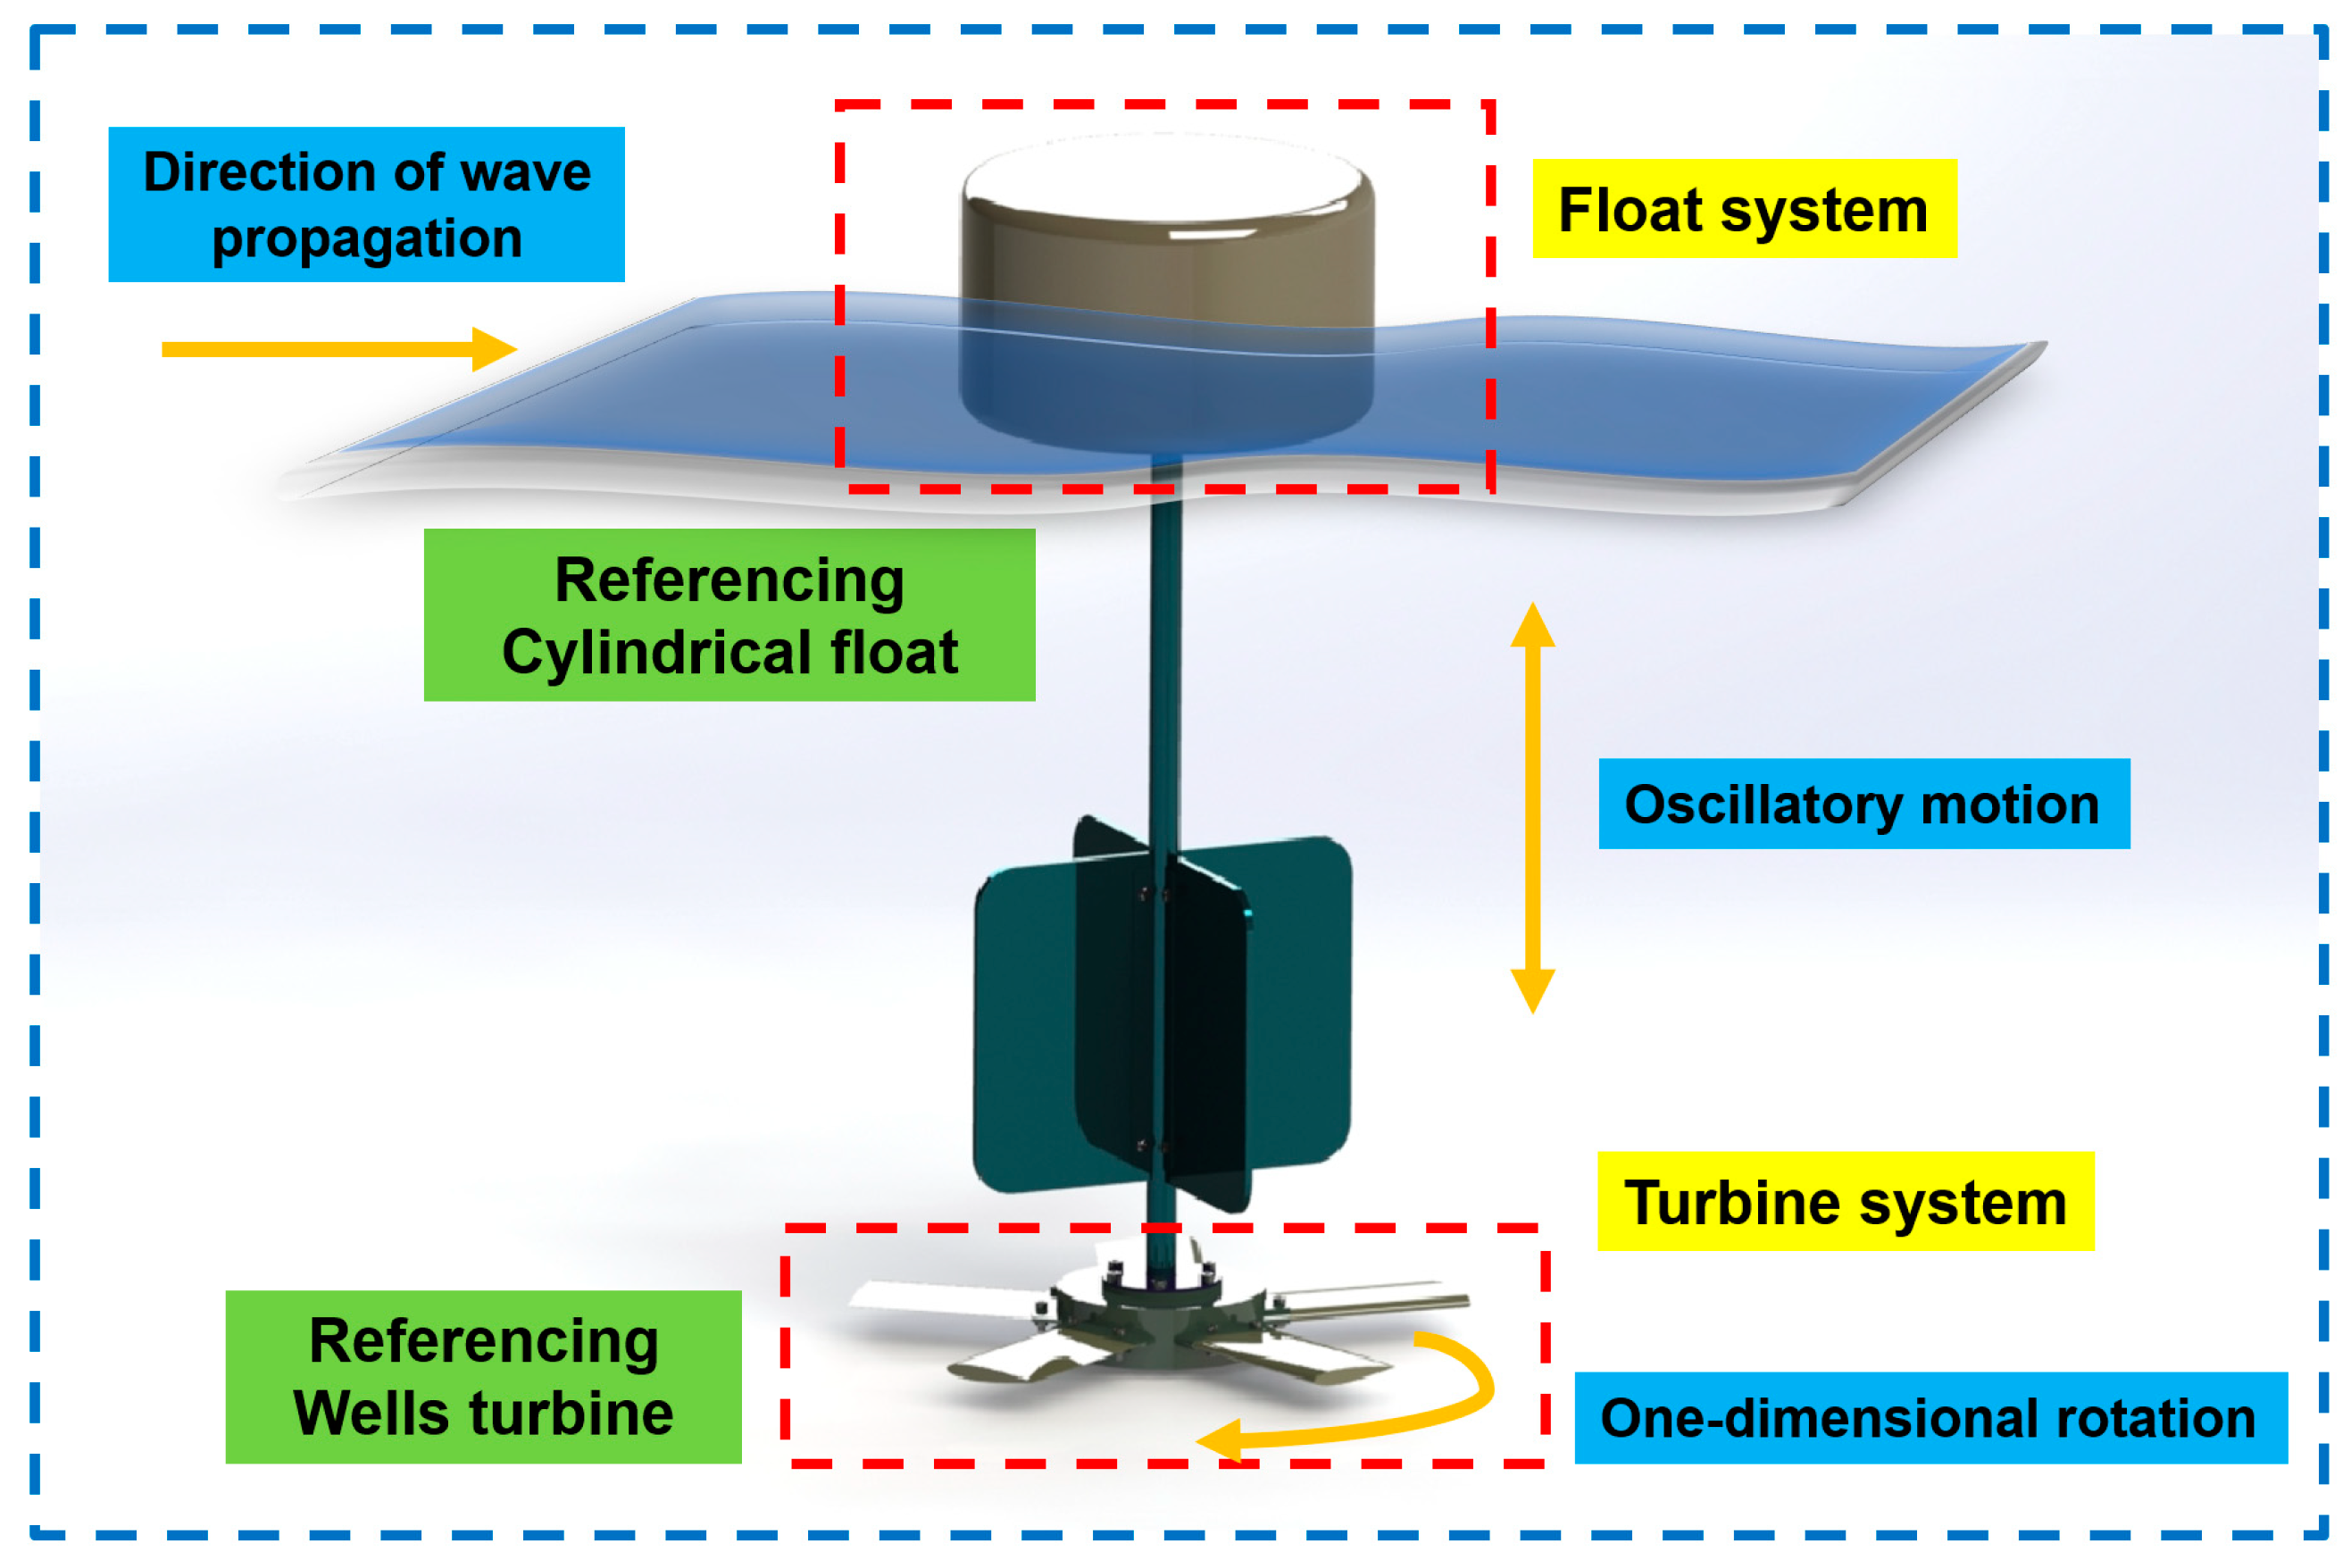
Figure 4.
Simplified model of the device.
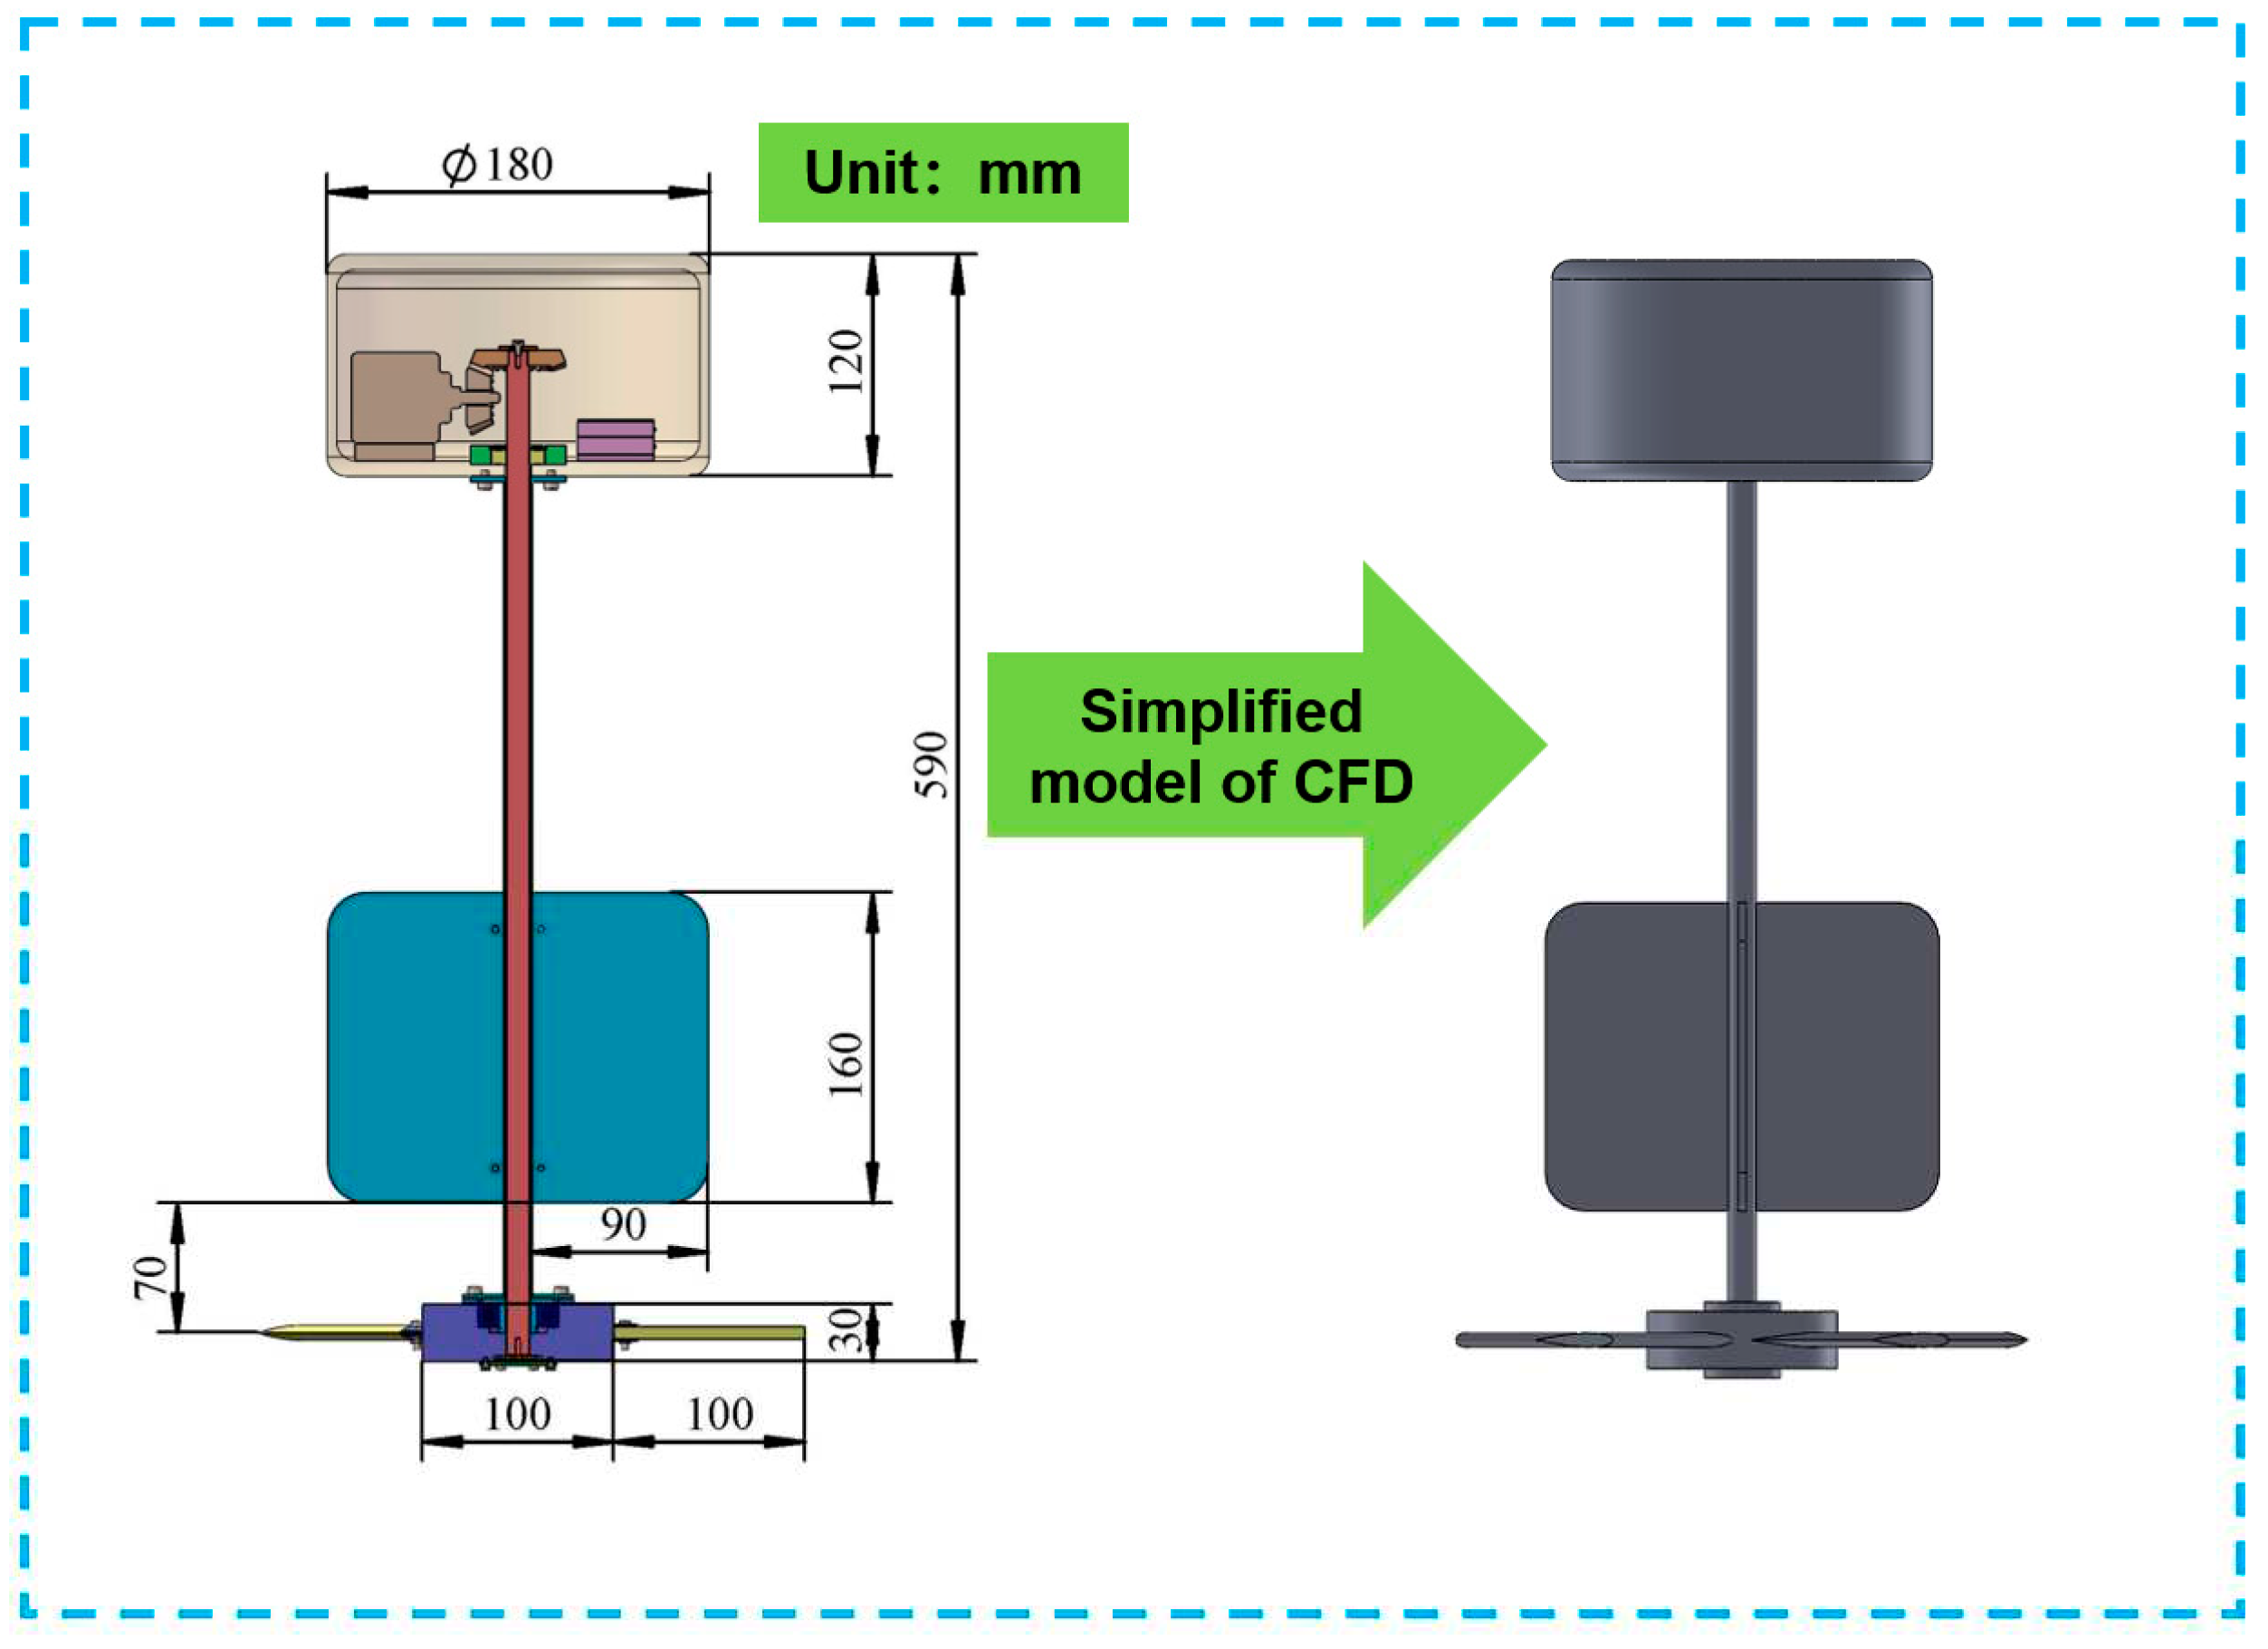
Figure 5.
Schematic diagram of rotating blade speed and force.
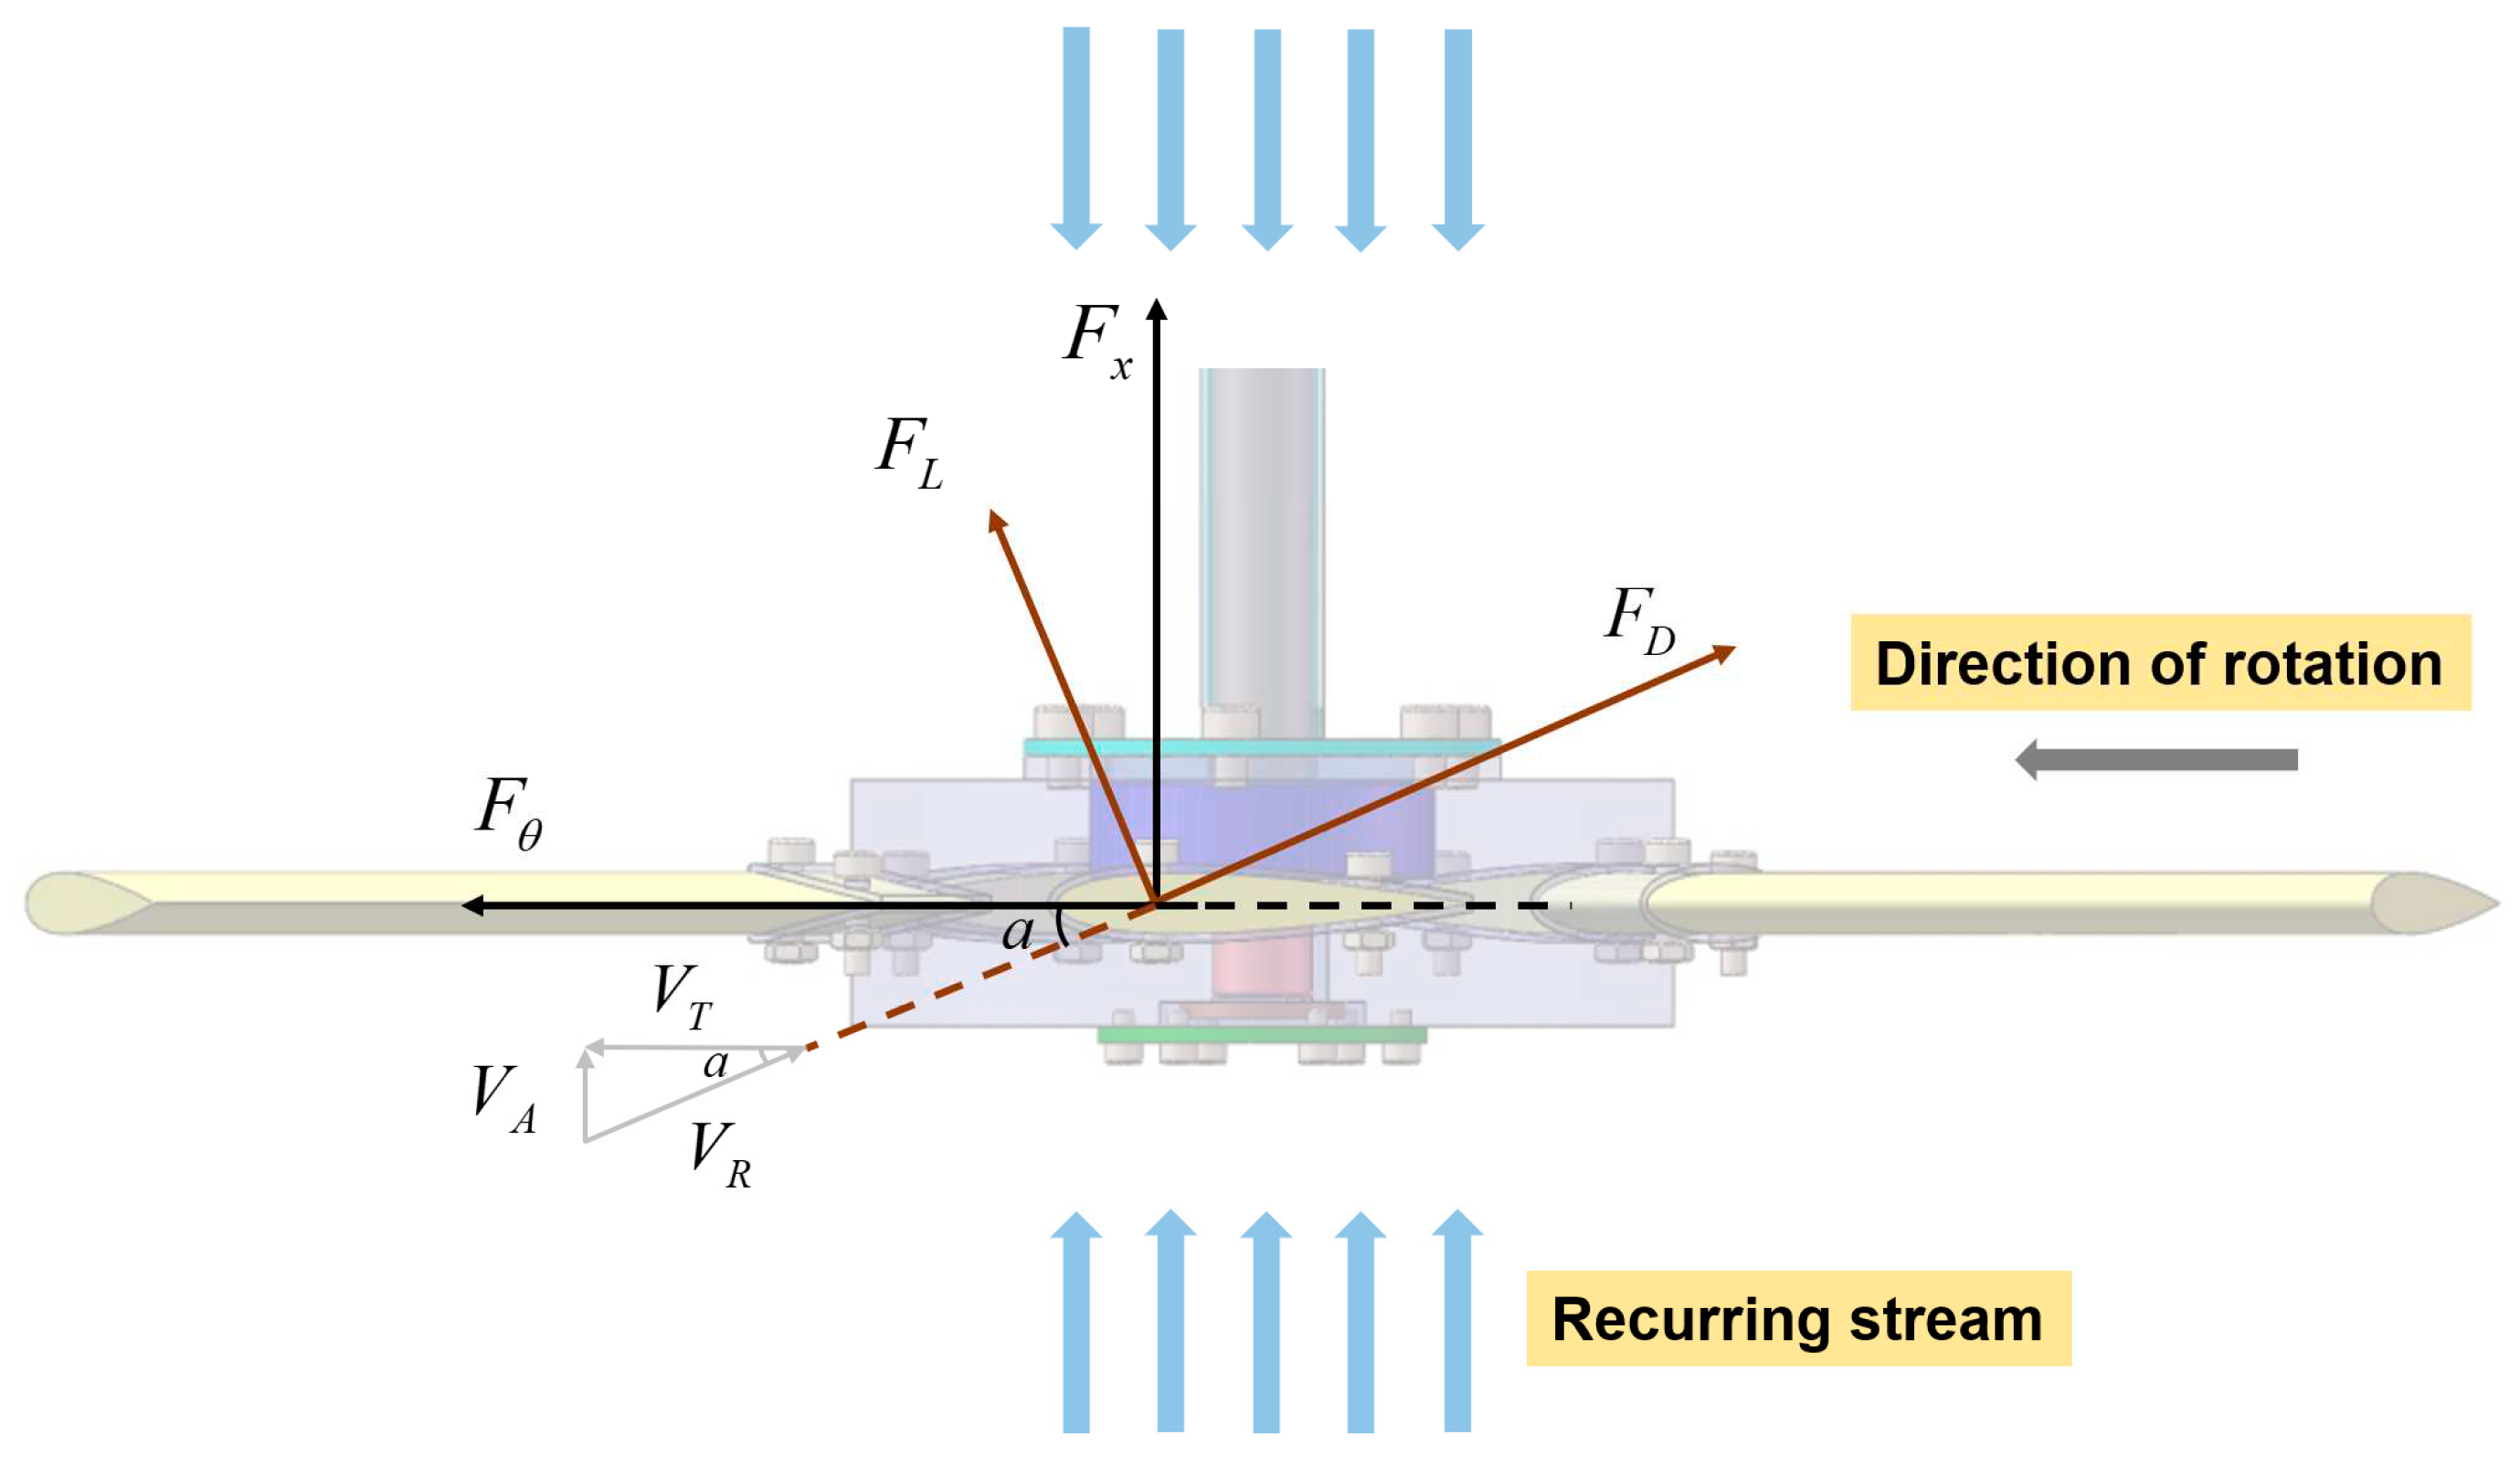
Figure 6.
Simulation process of CFD.
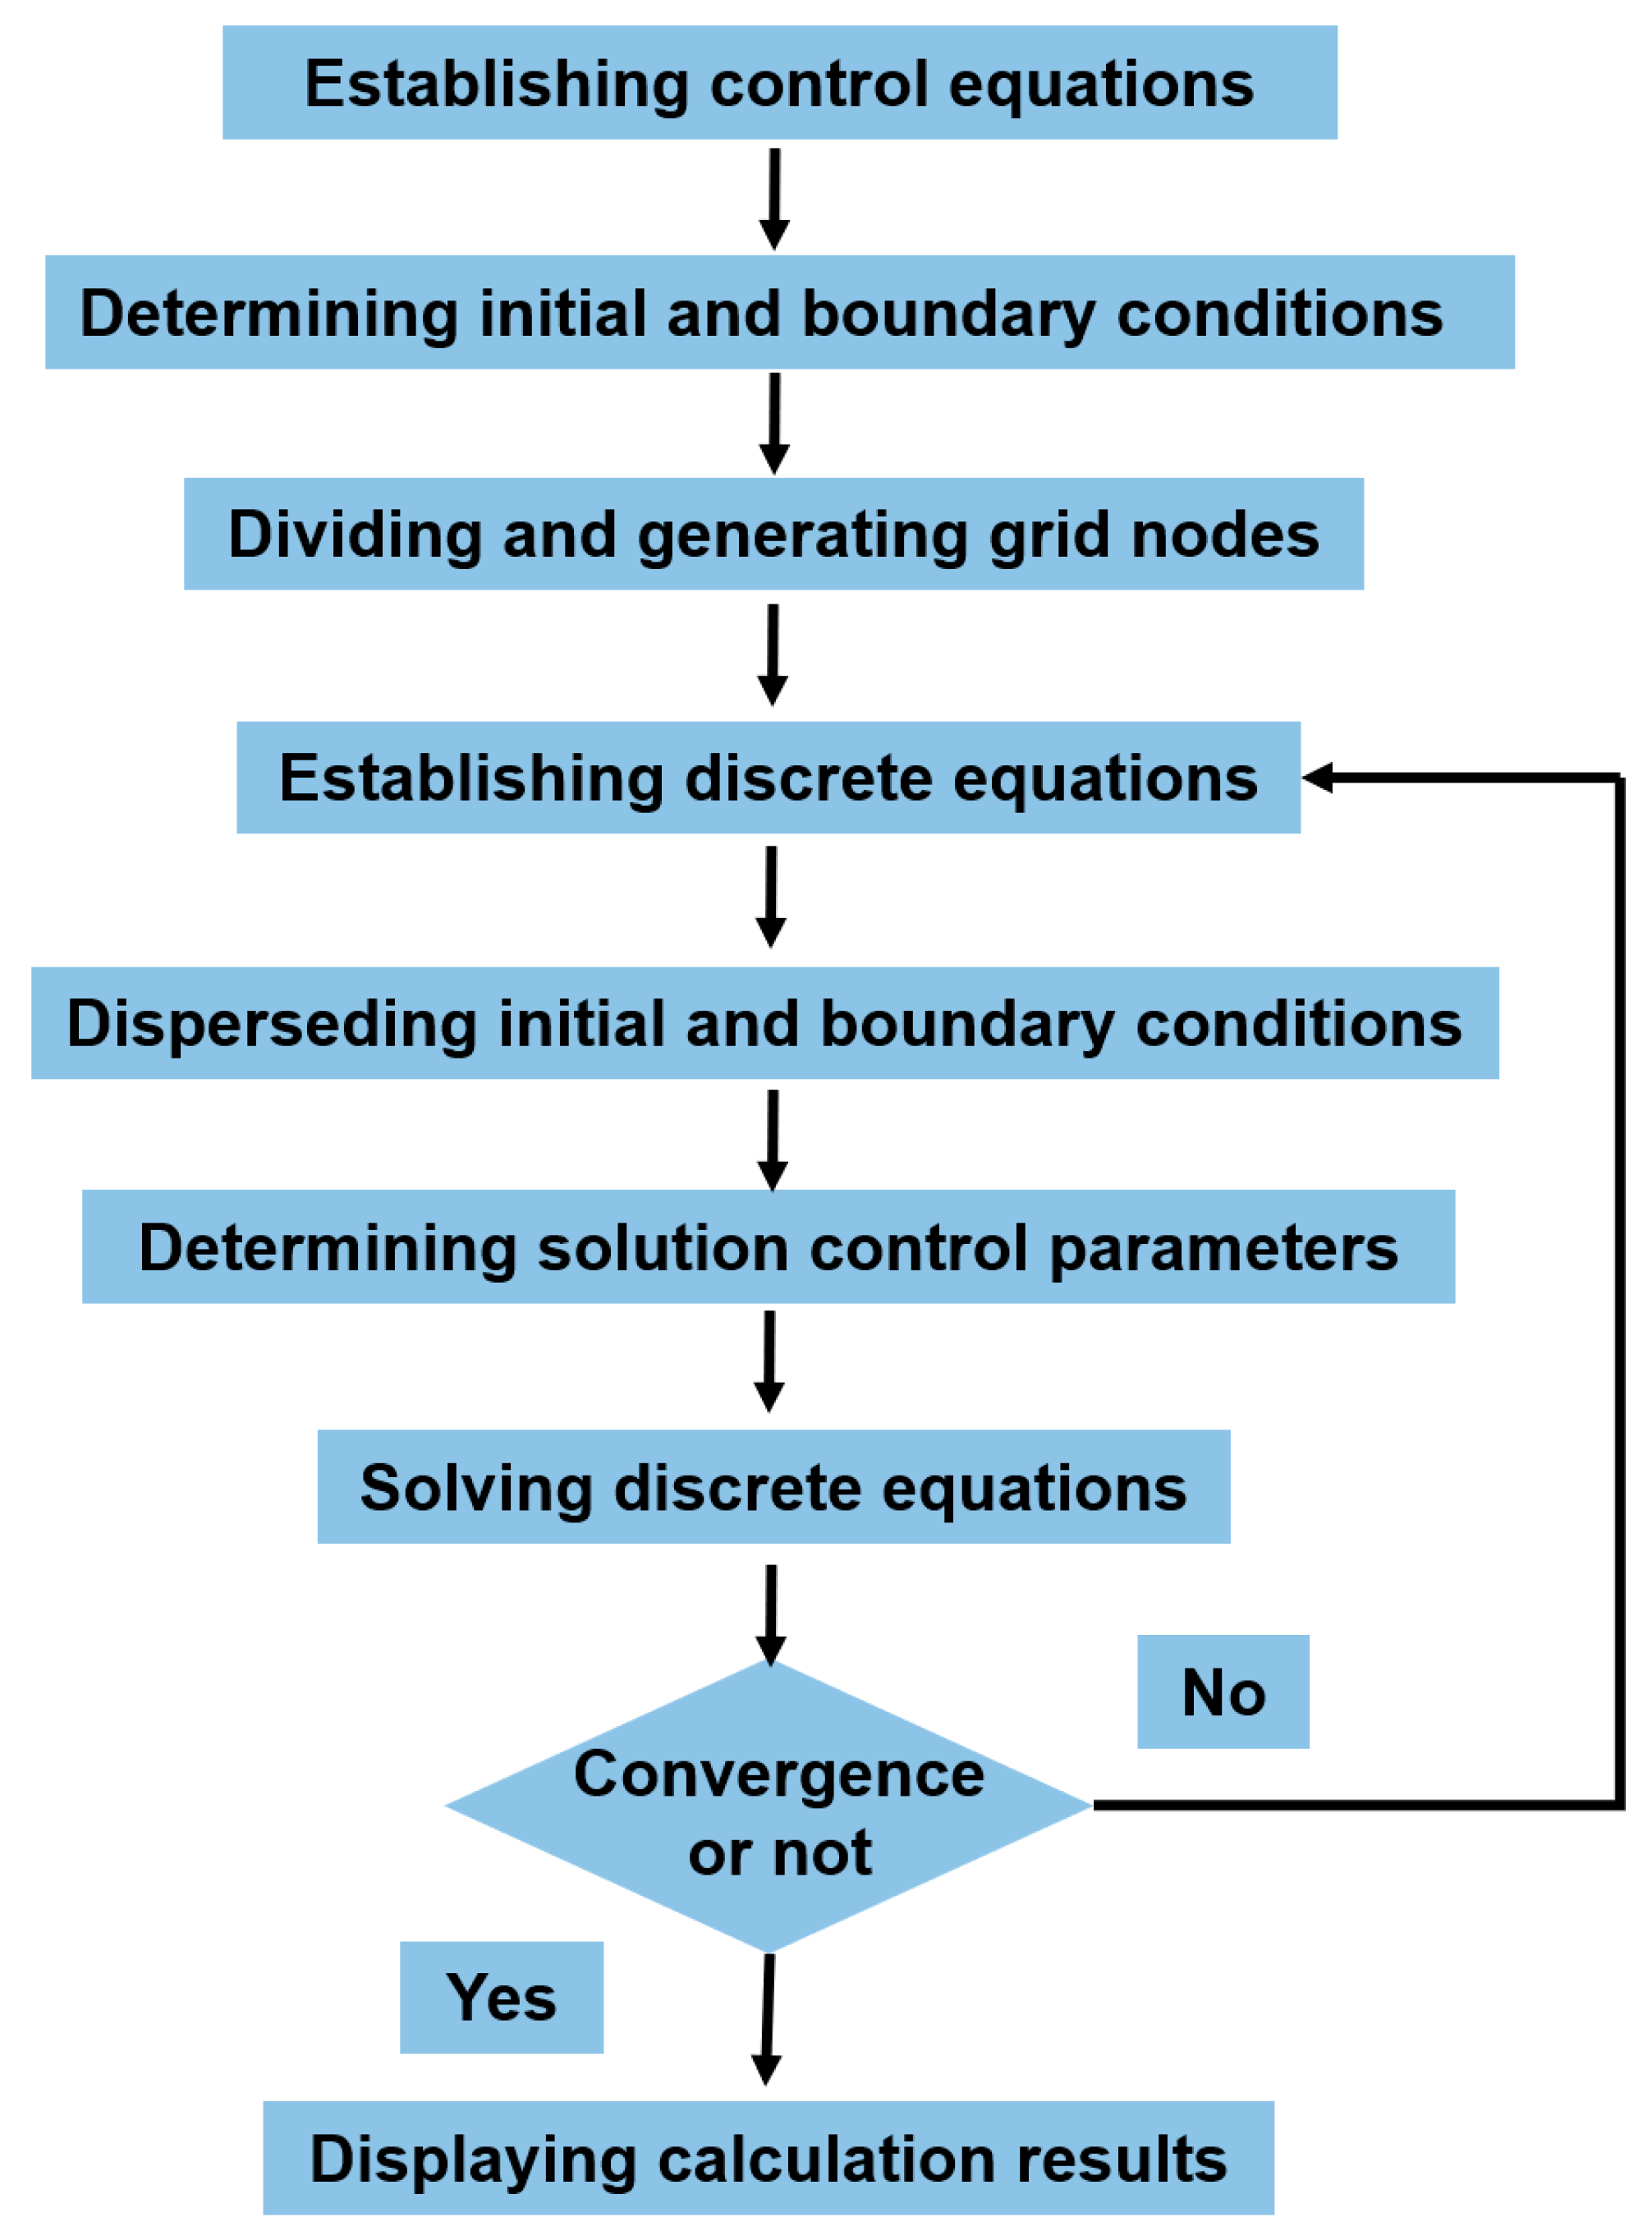
Figure 7.
Calculation domain setup and meshing.
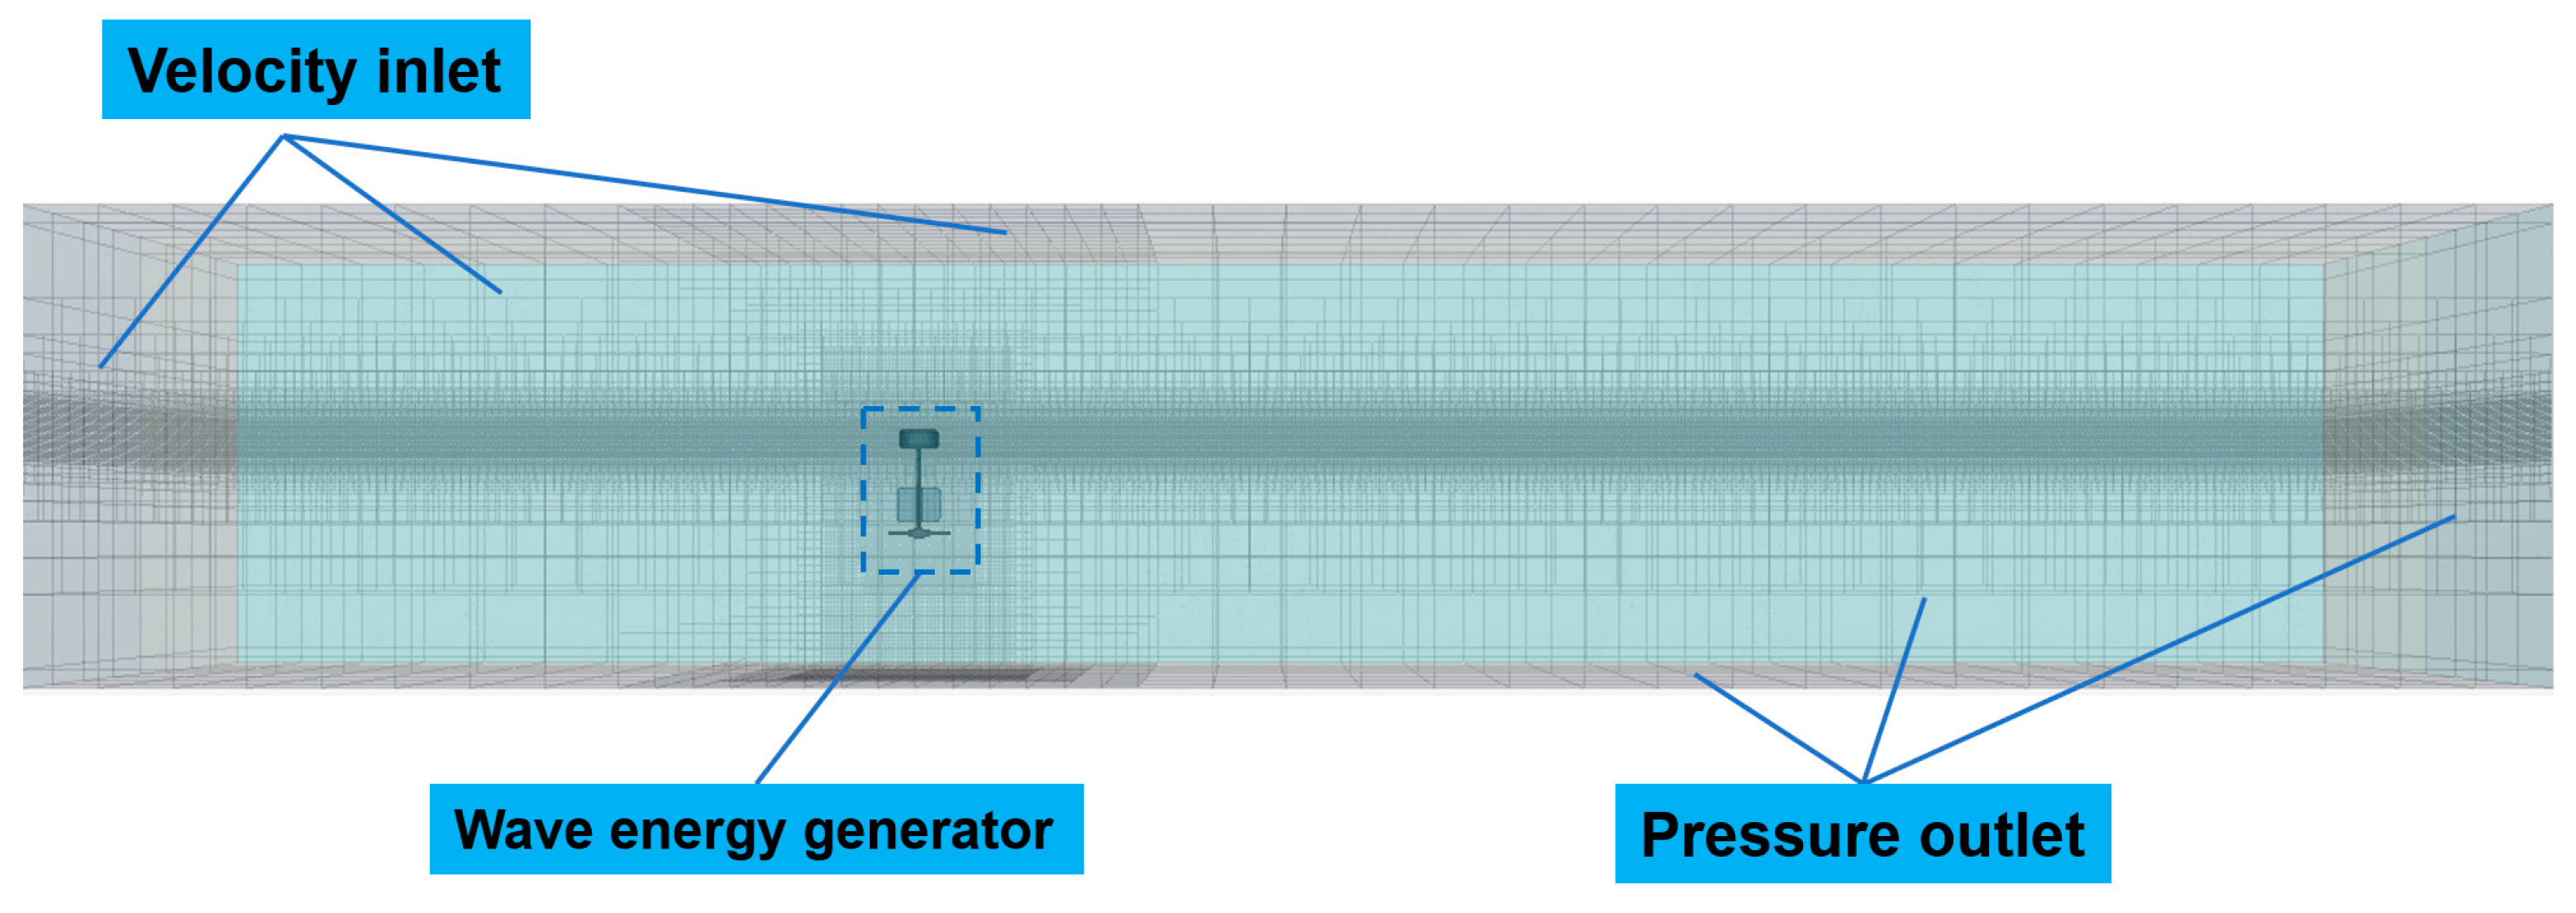
Figure 8.
Motion scene of a double float device.
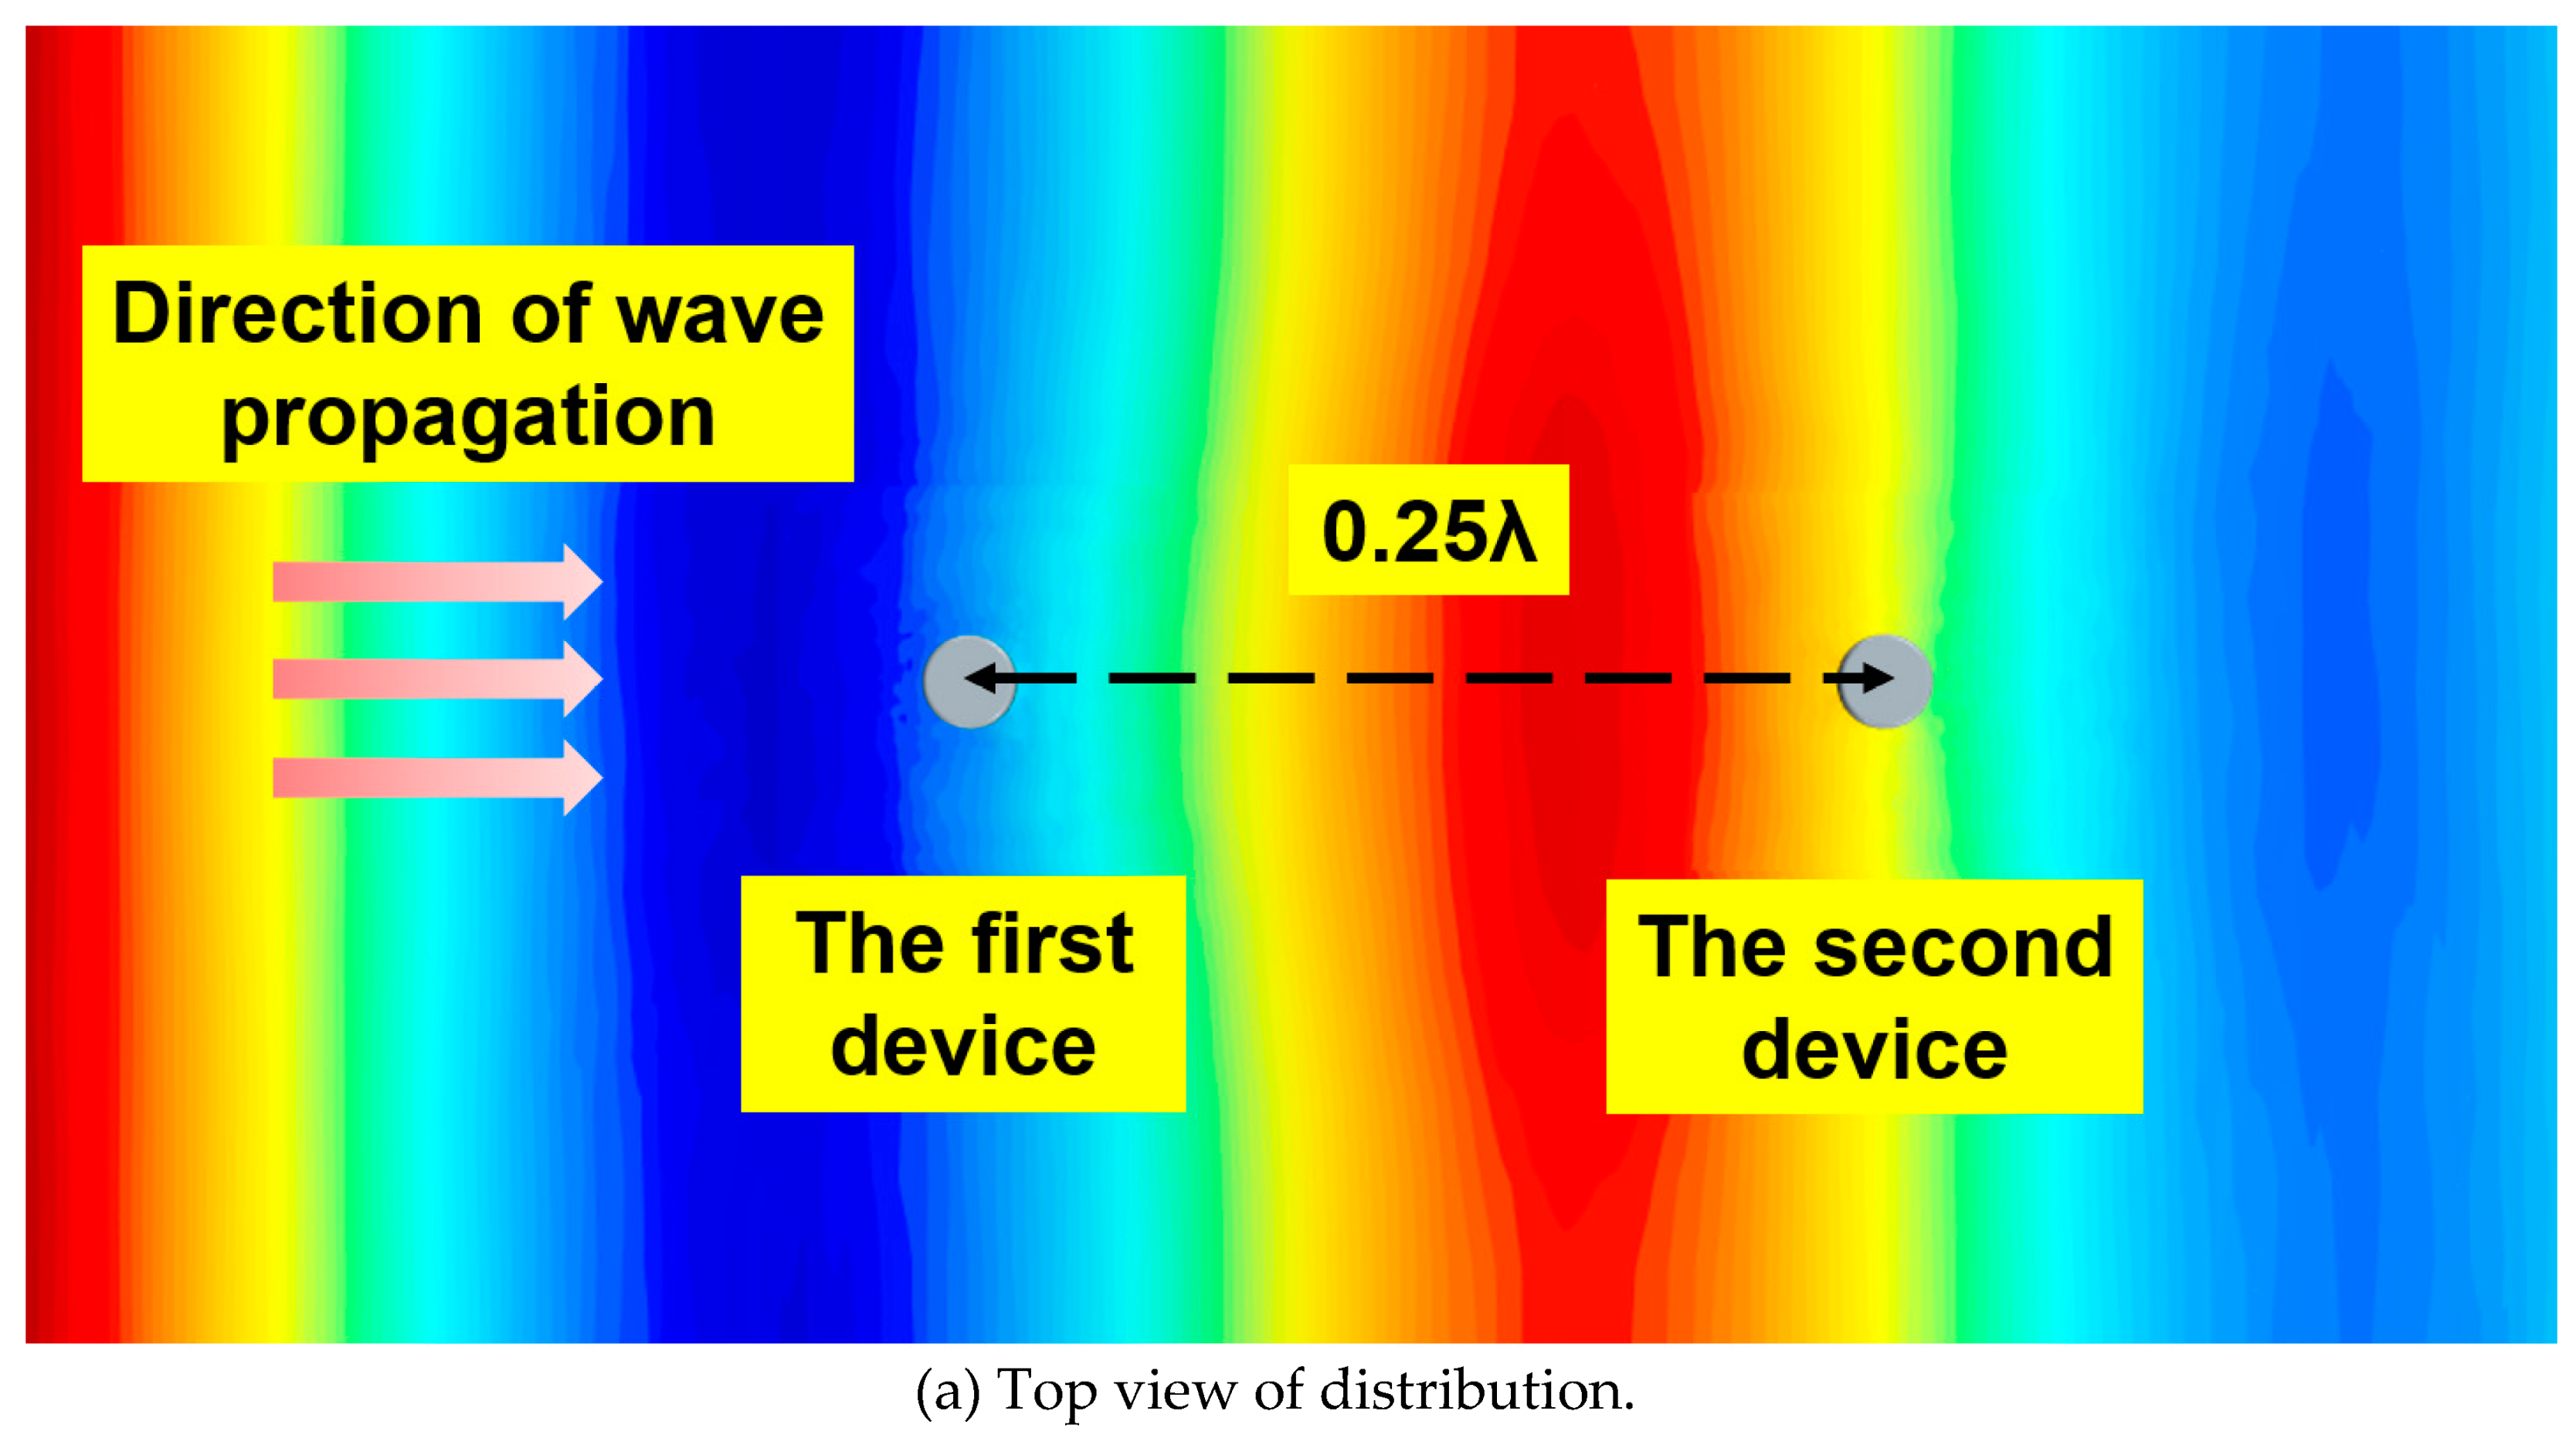
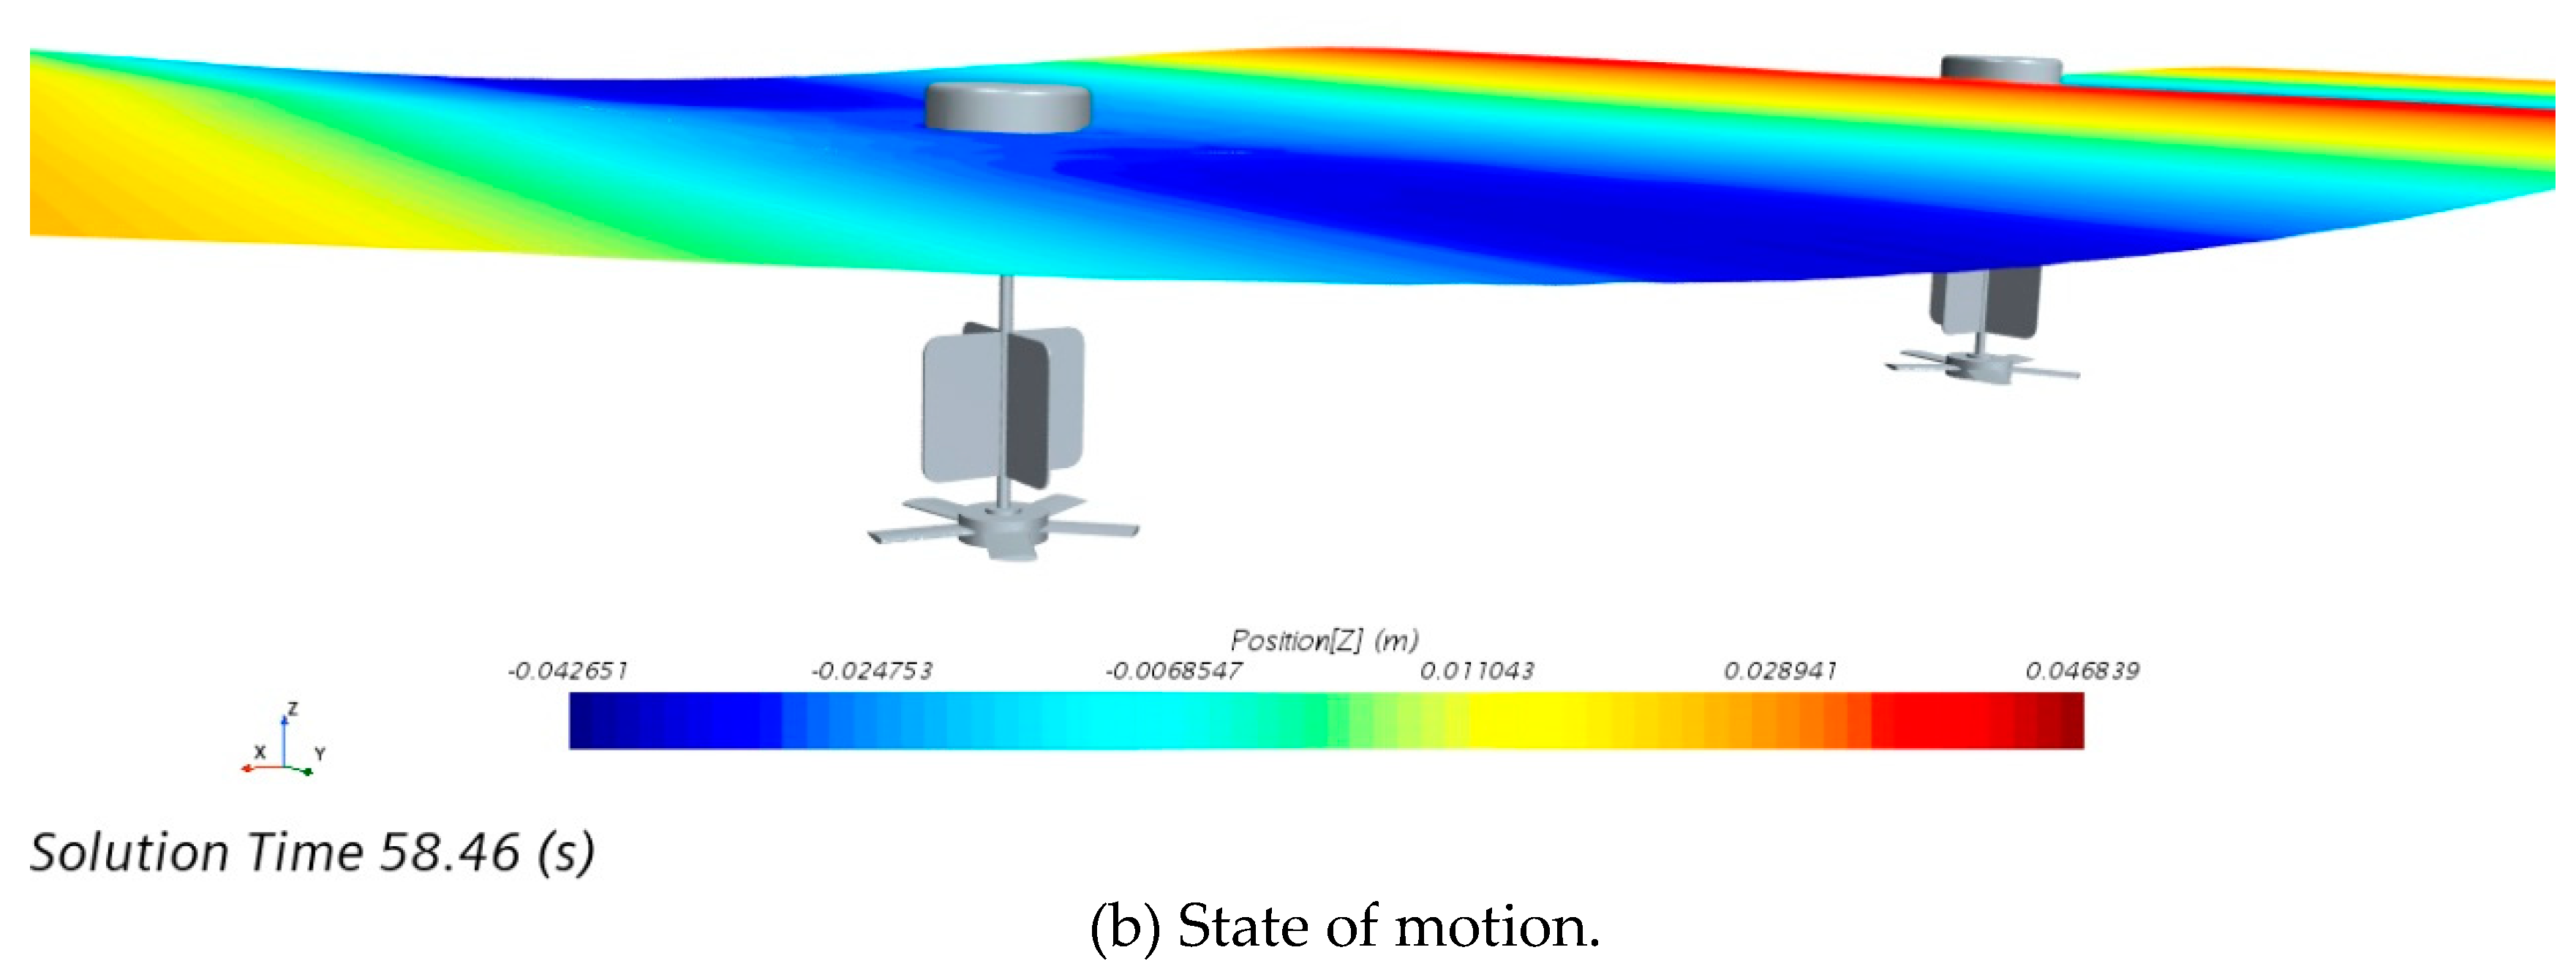
Figure 9.
Time-calendar curves of pendulum velocity and pendulum displacement for a double float system.
Figure 9.
Time-calendar curves of pendulum velocity and pendulum displacement for a double float system.
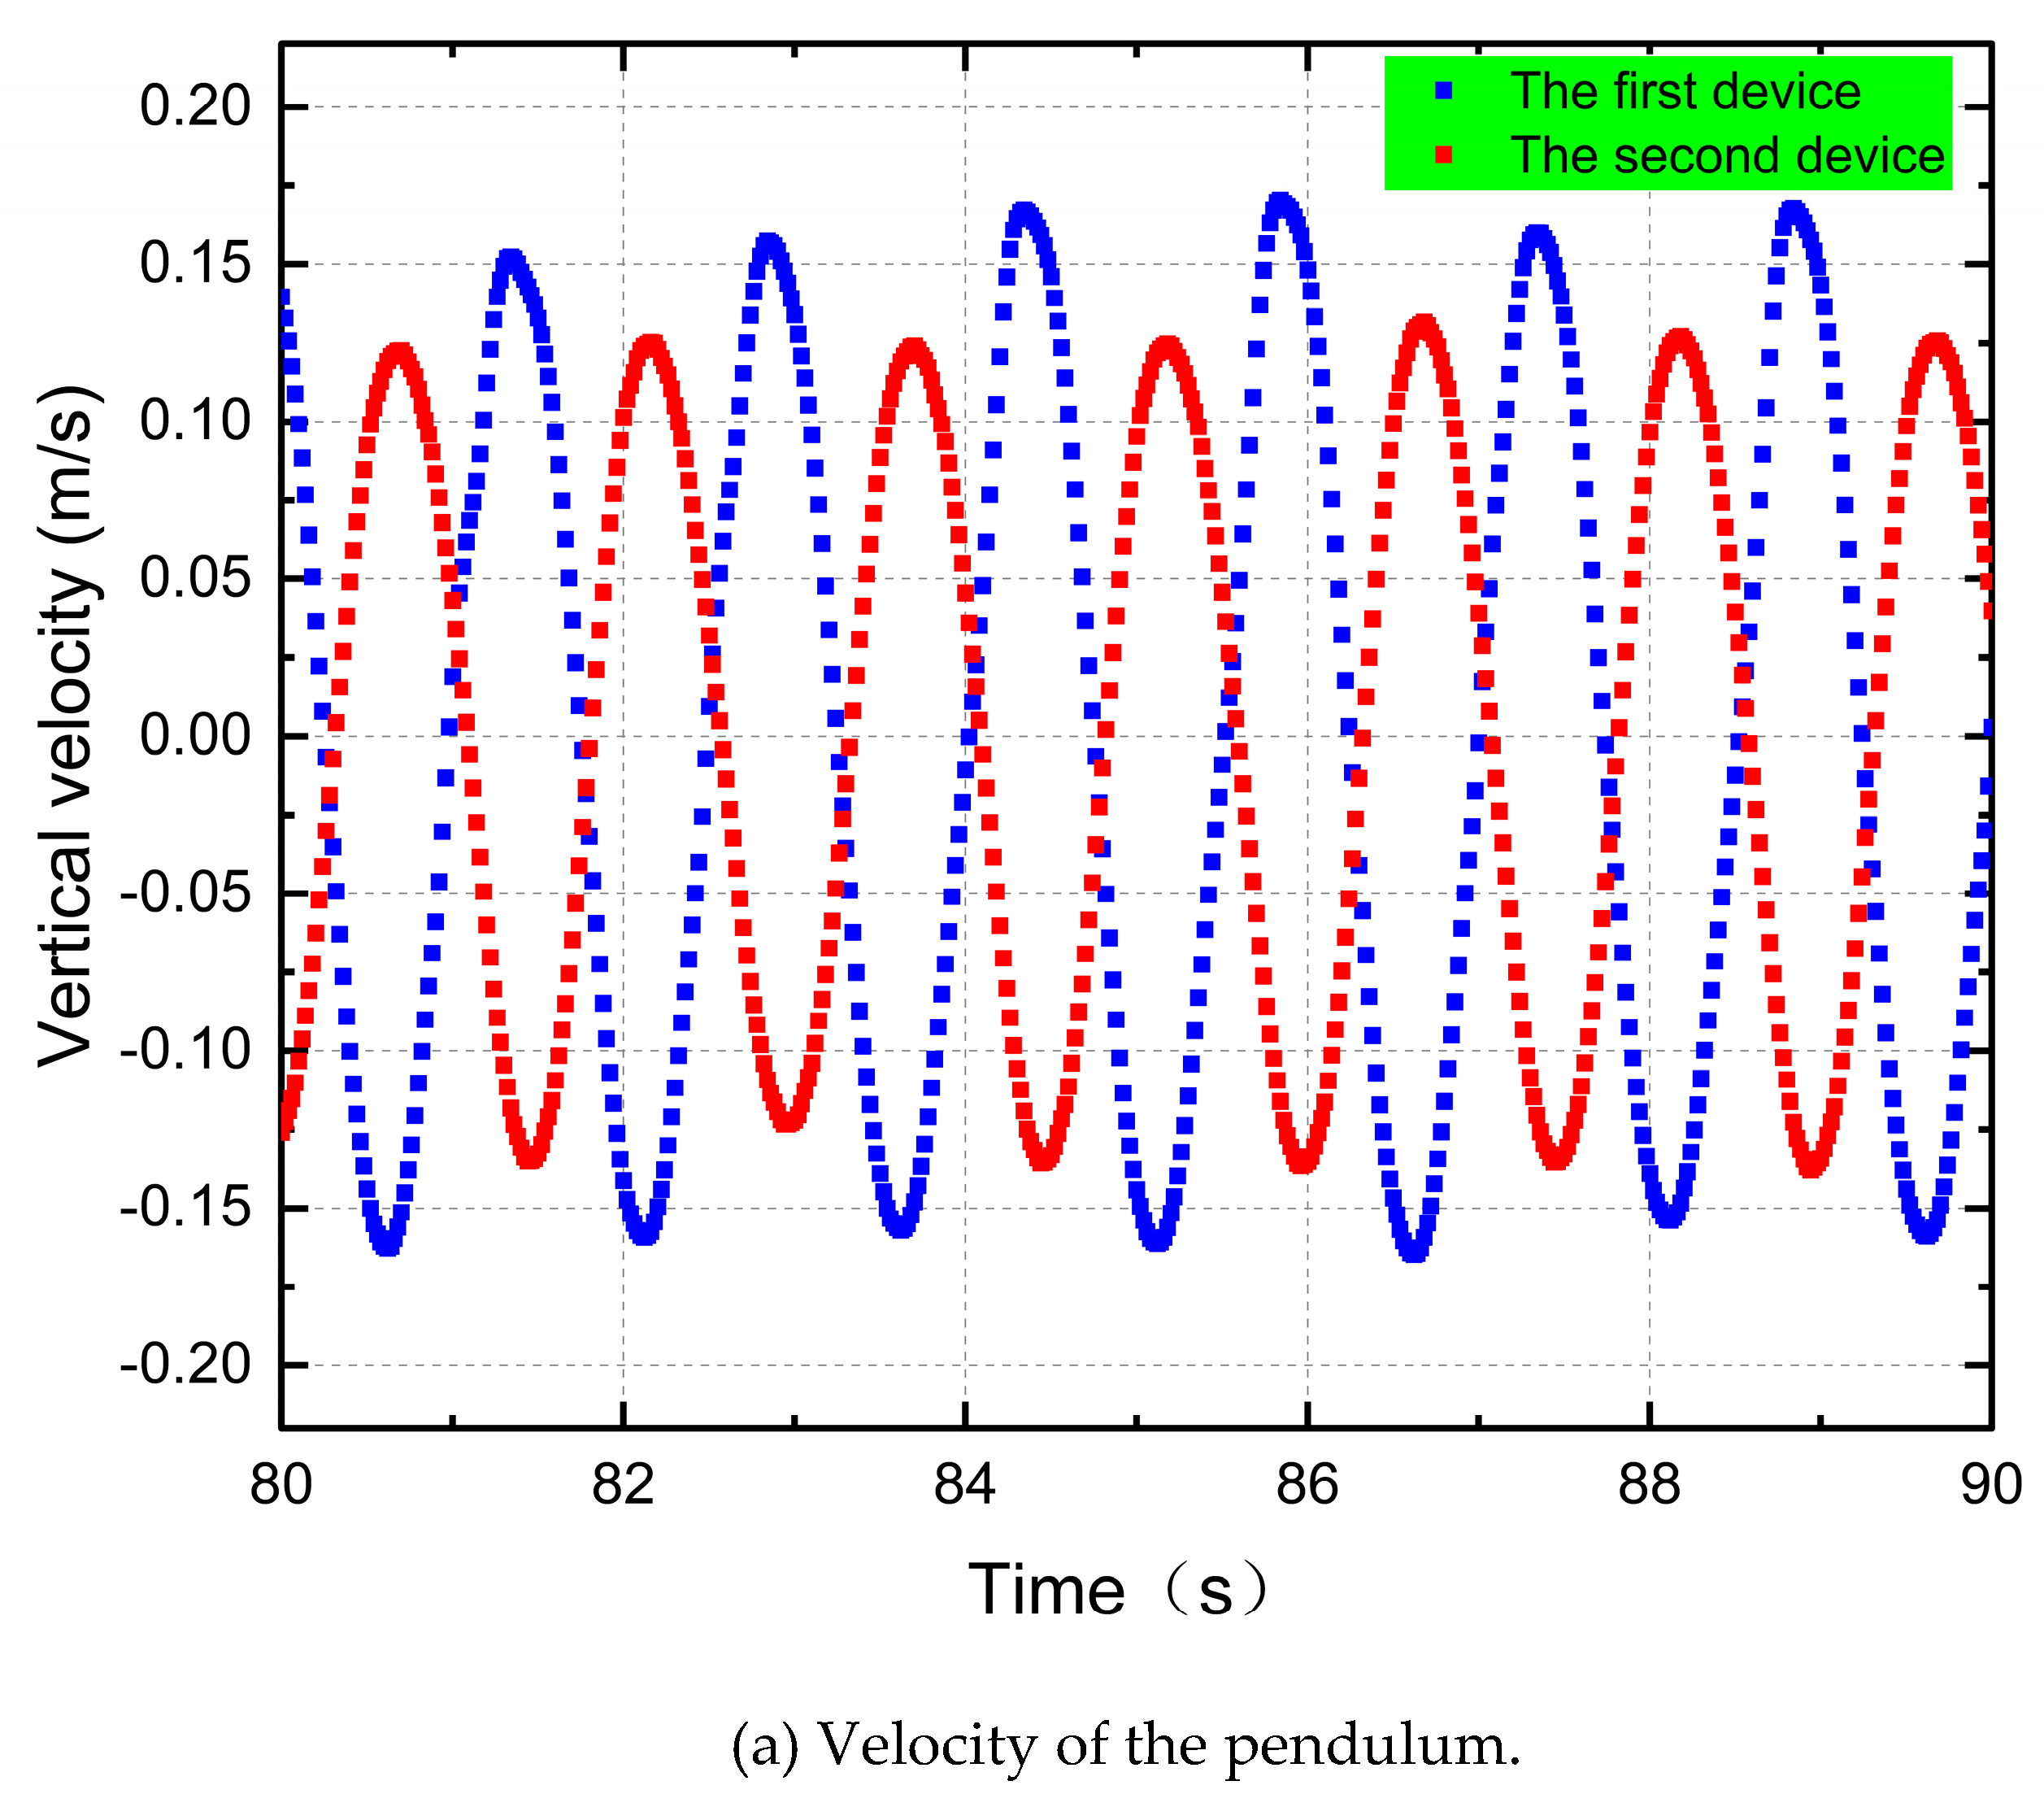
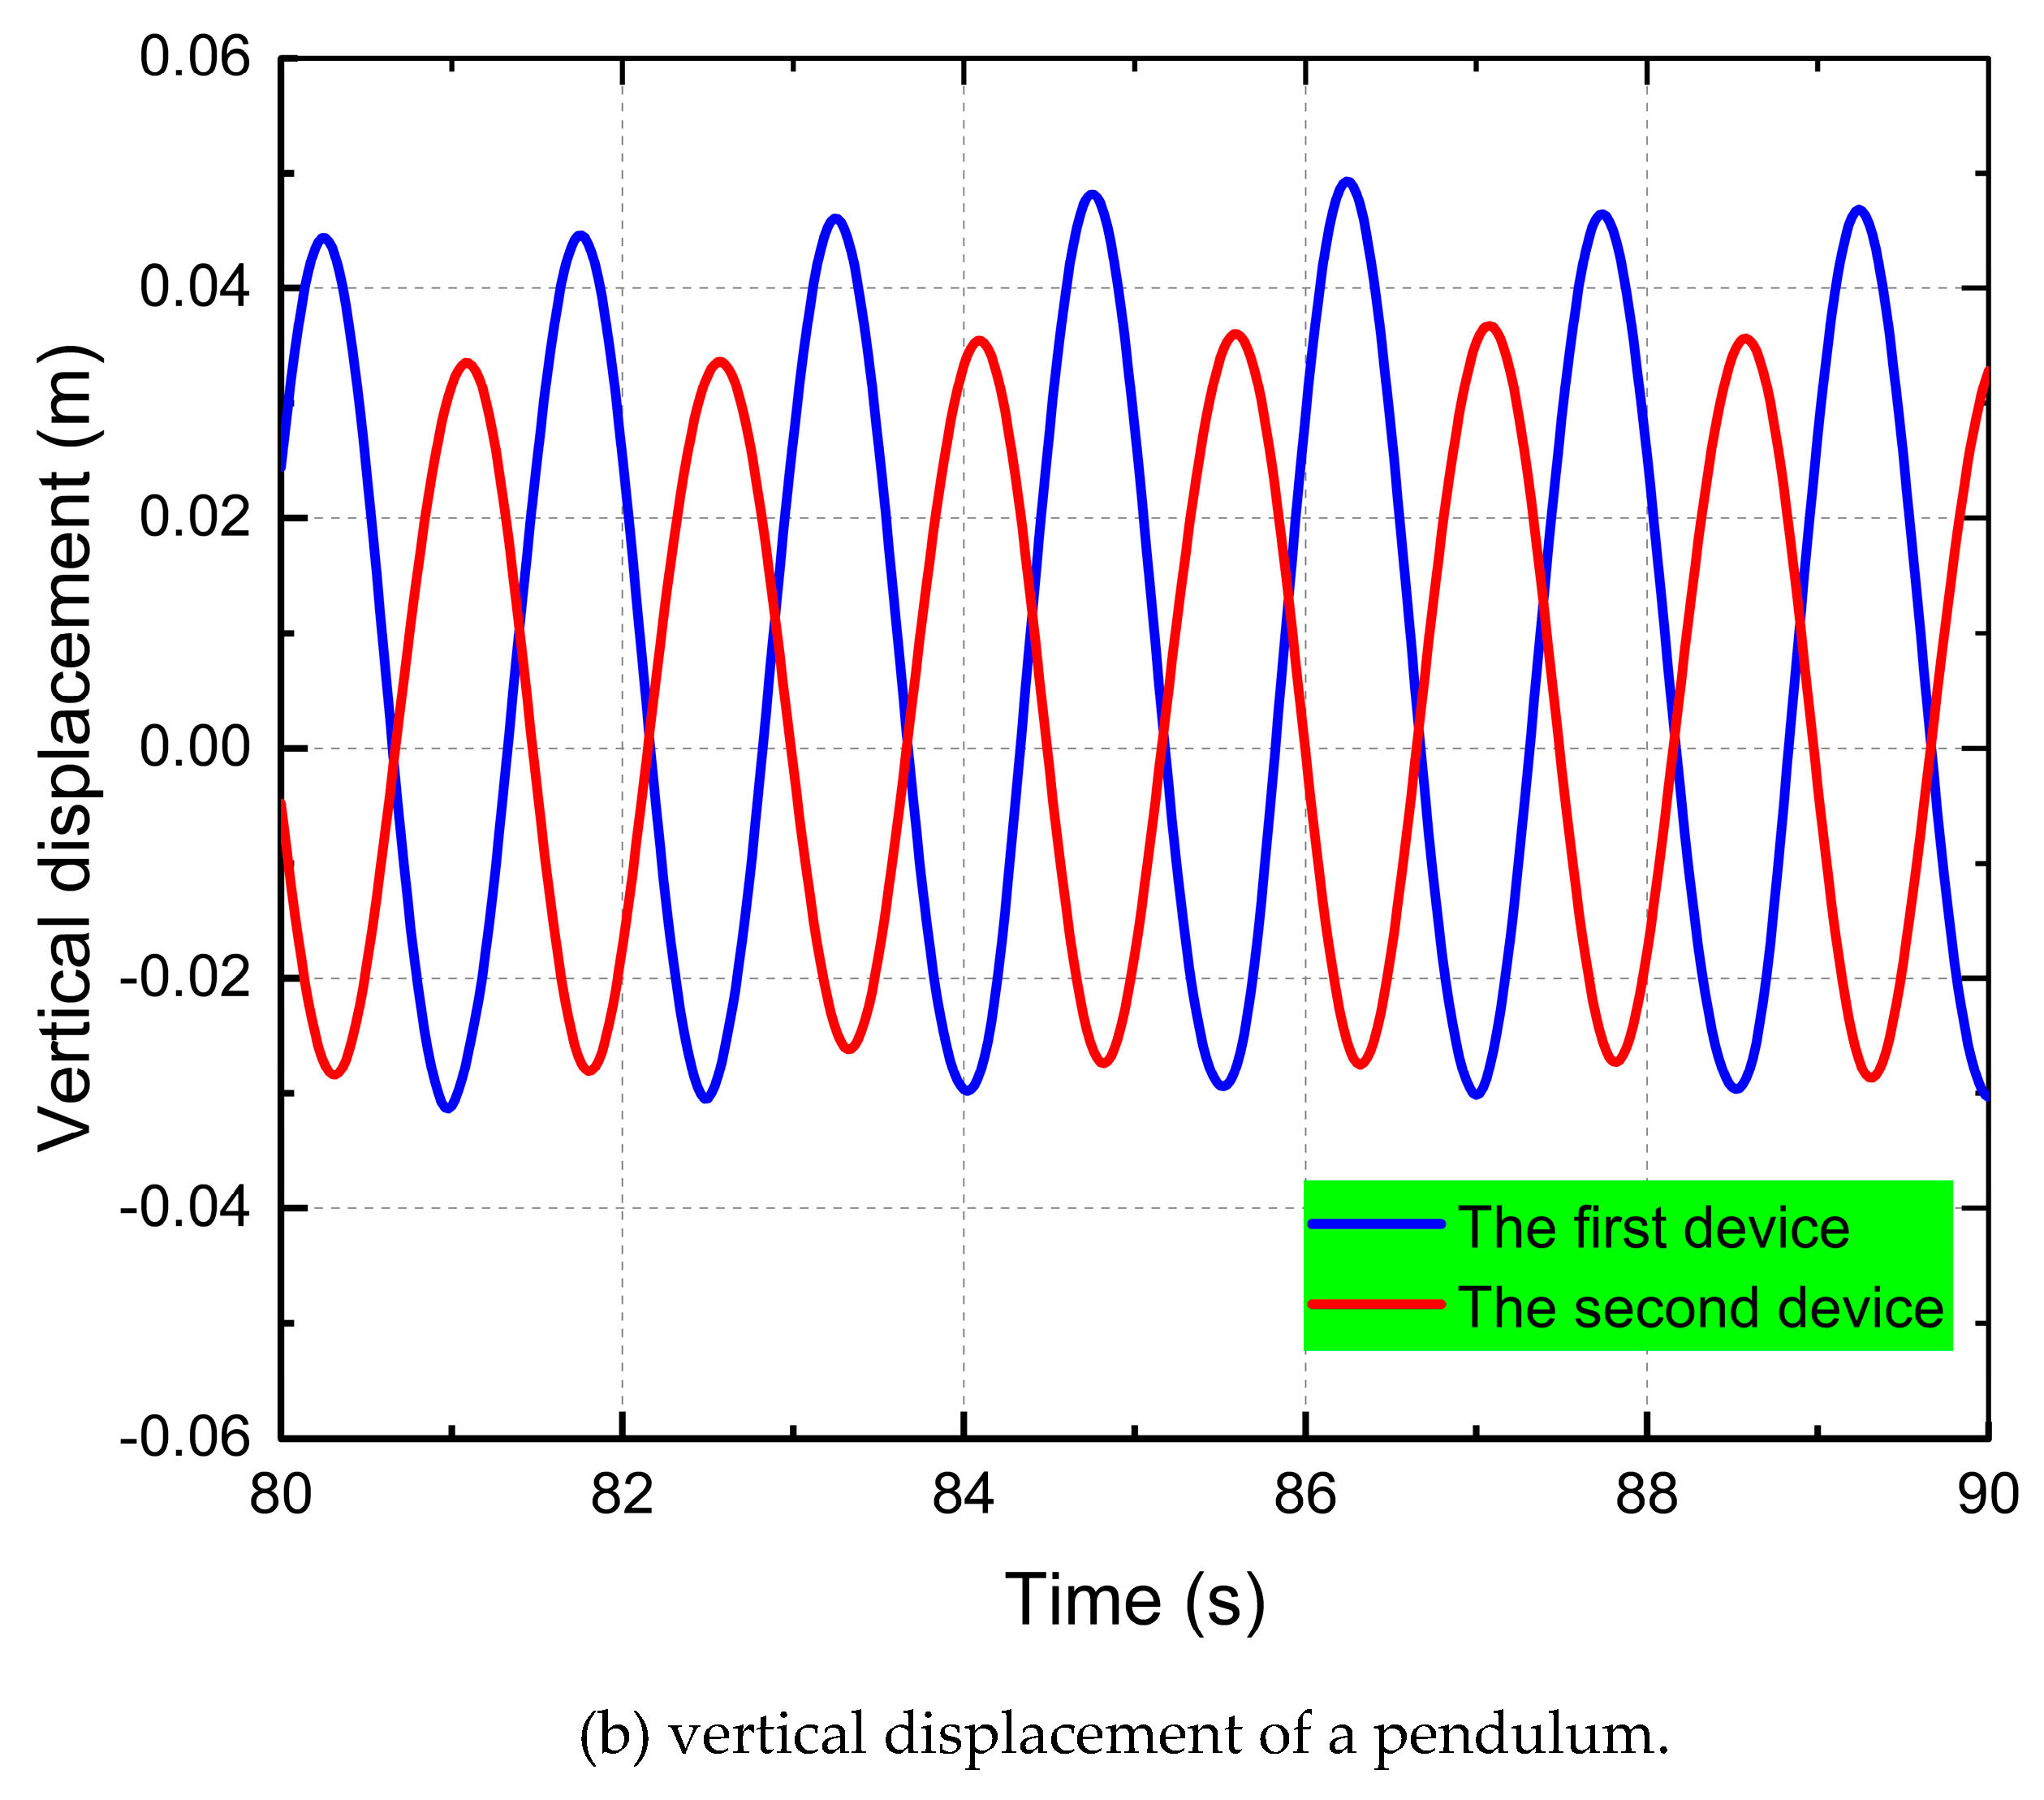
Figure 10.
Time-calendar curve of rotational angular velocity of double float system.
Figure 11.
Output power of the double-float system.
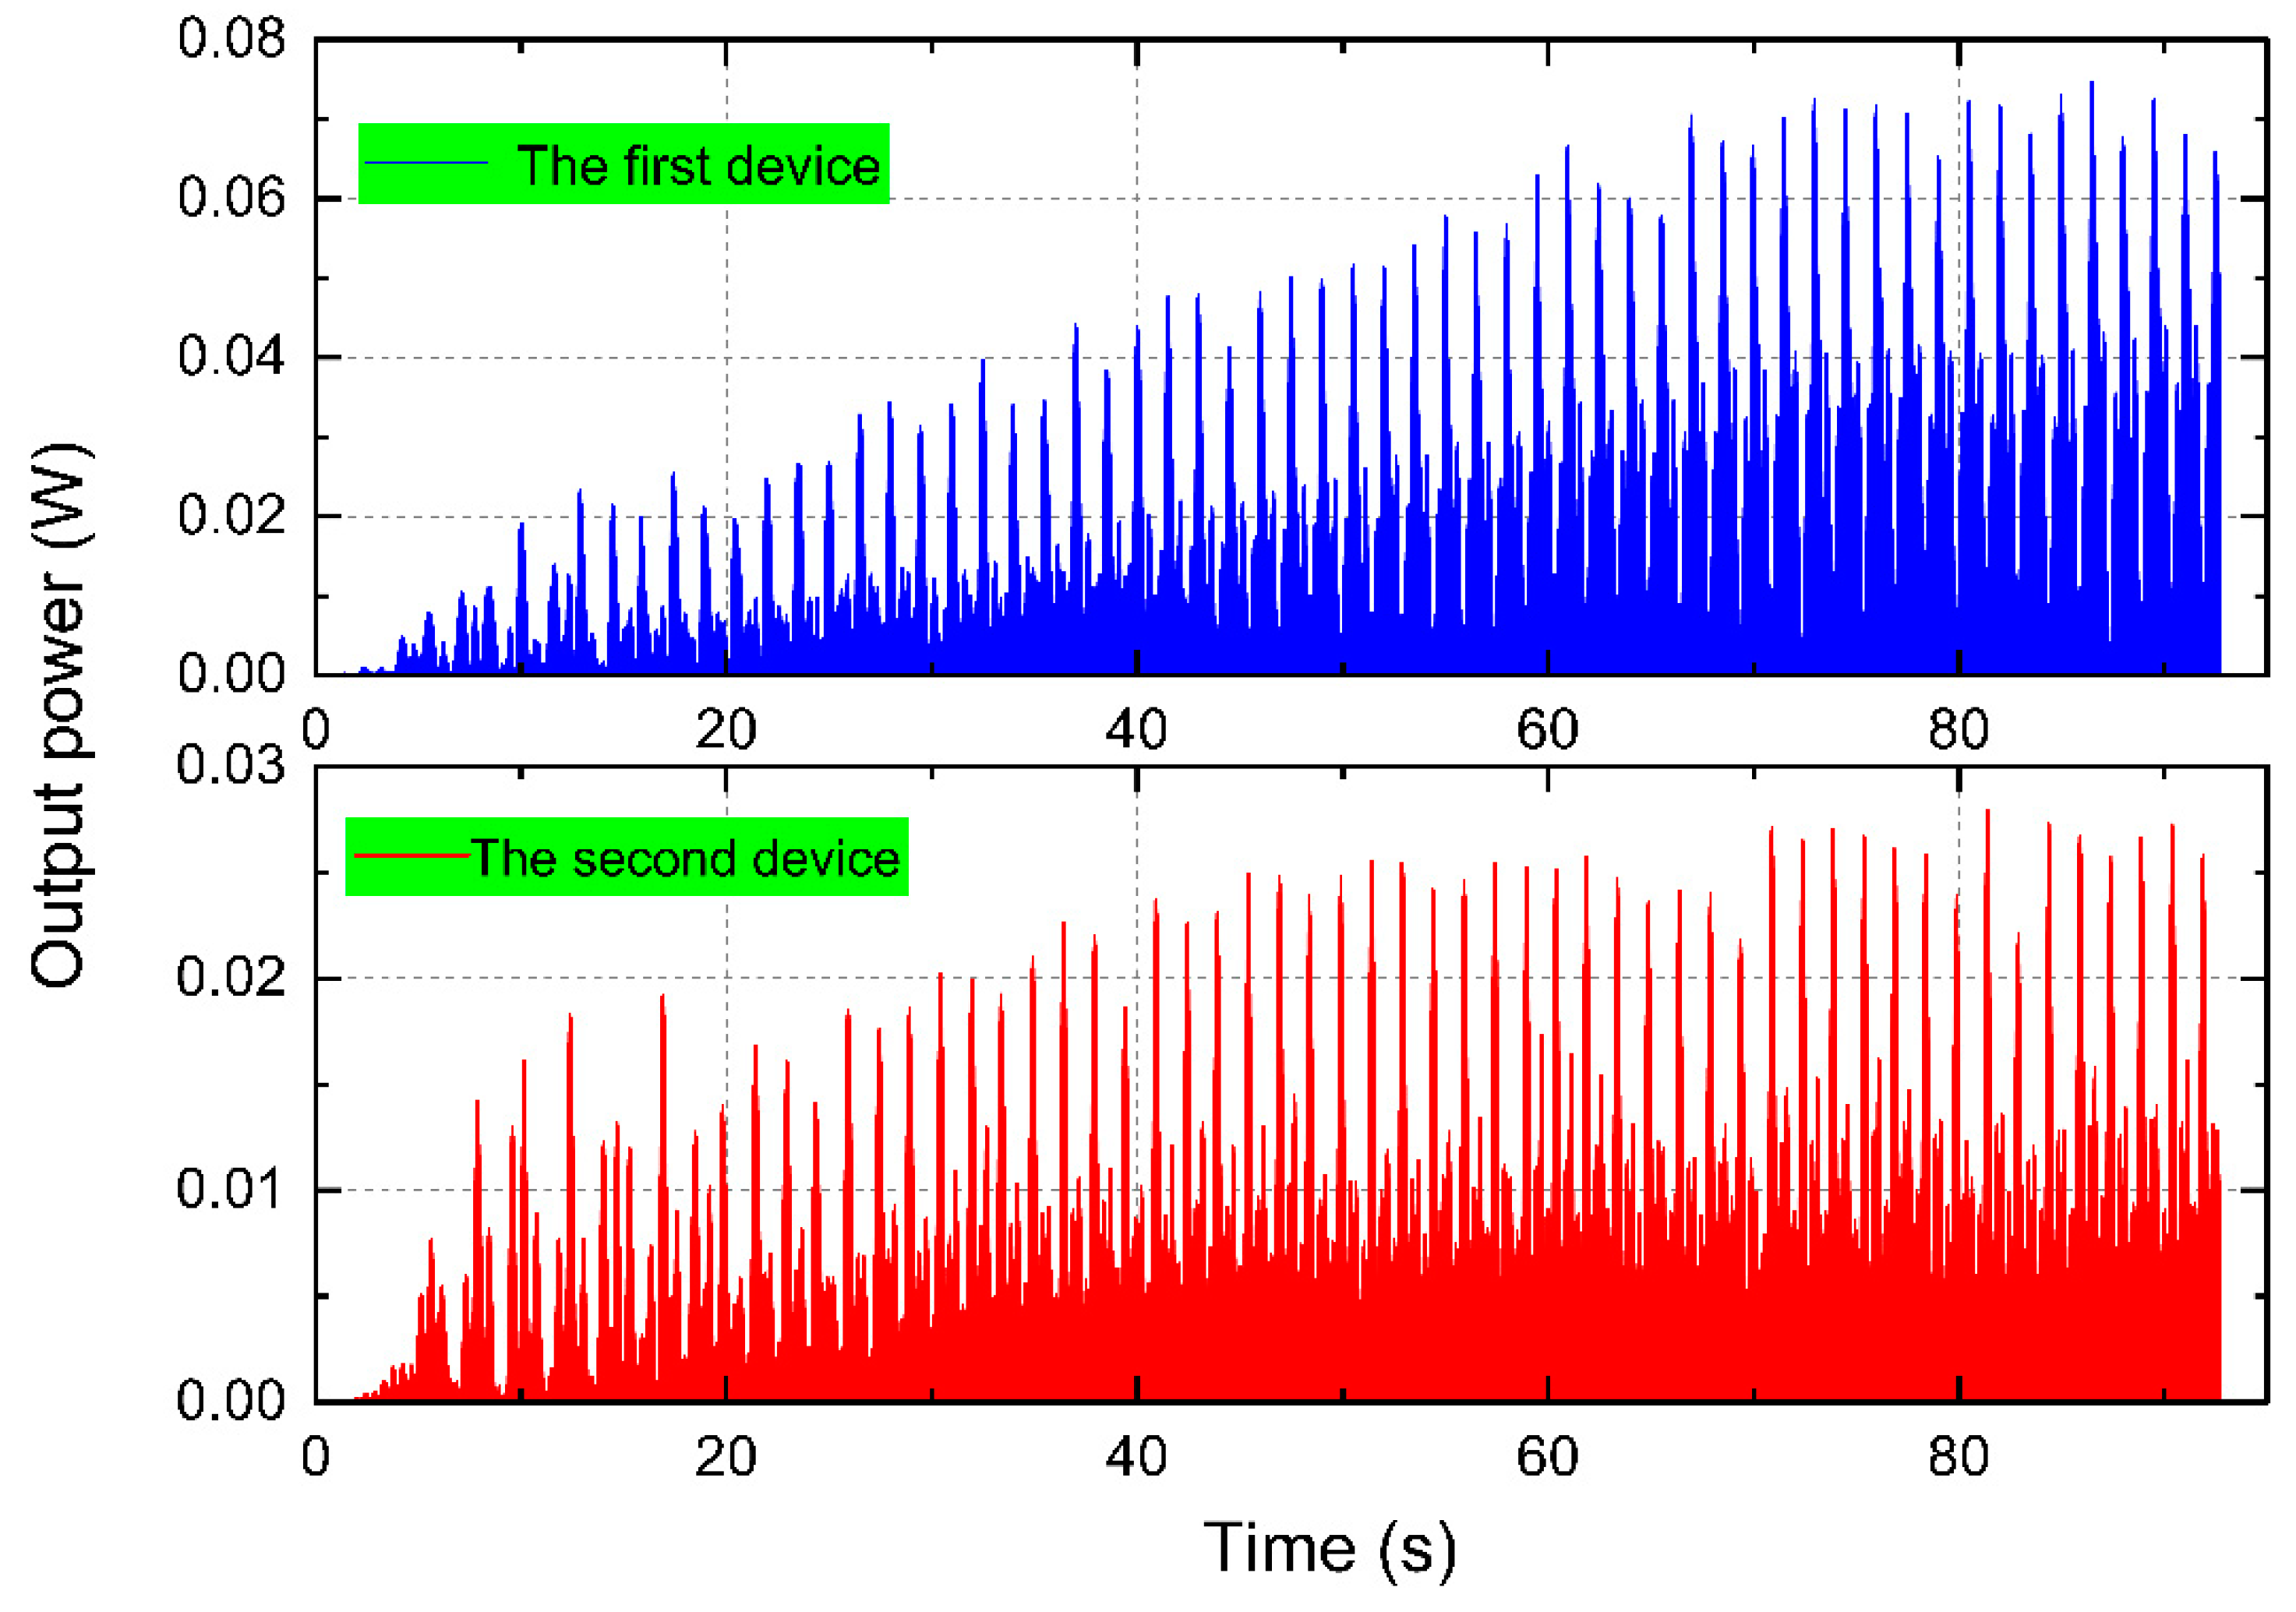
Figure 12.
Scene of movement of the device in triangular formation.
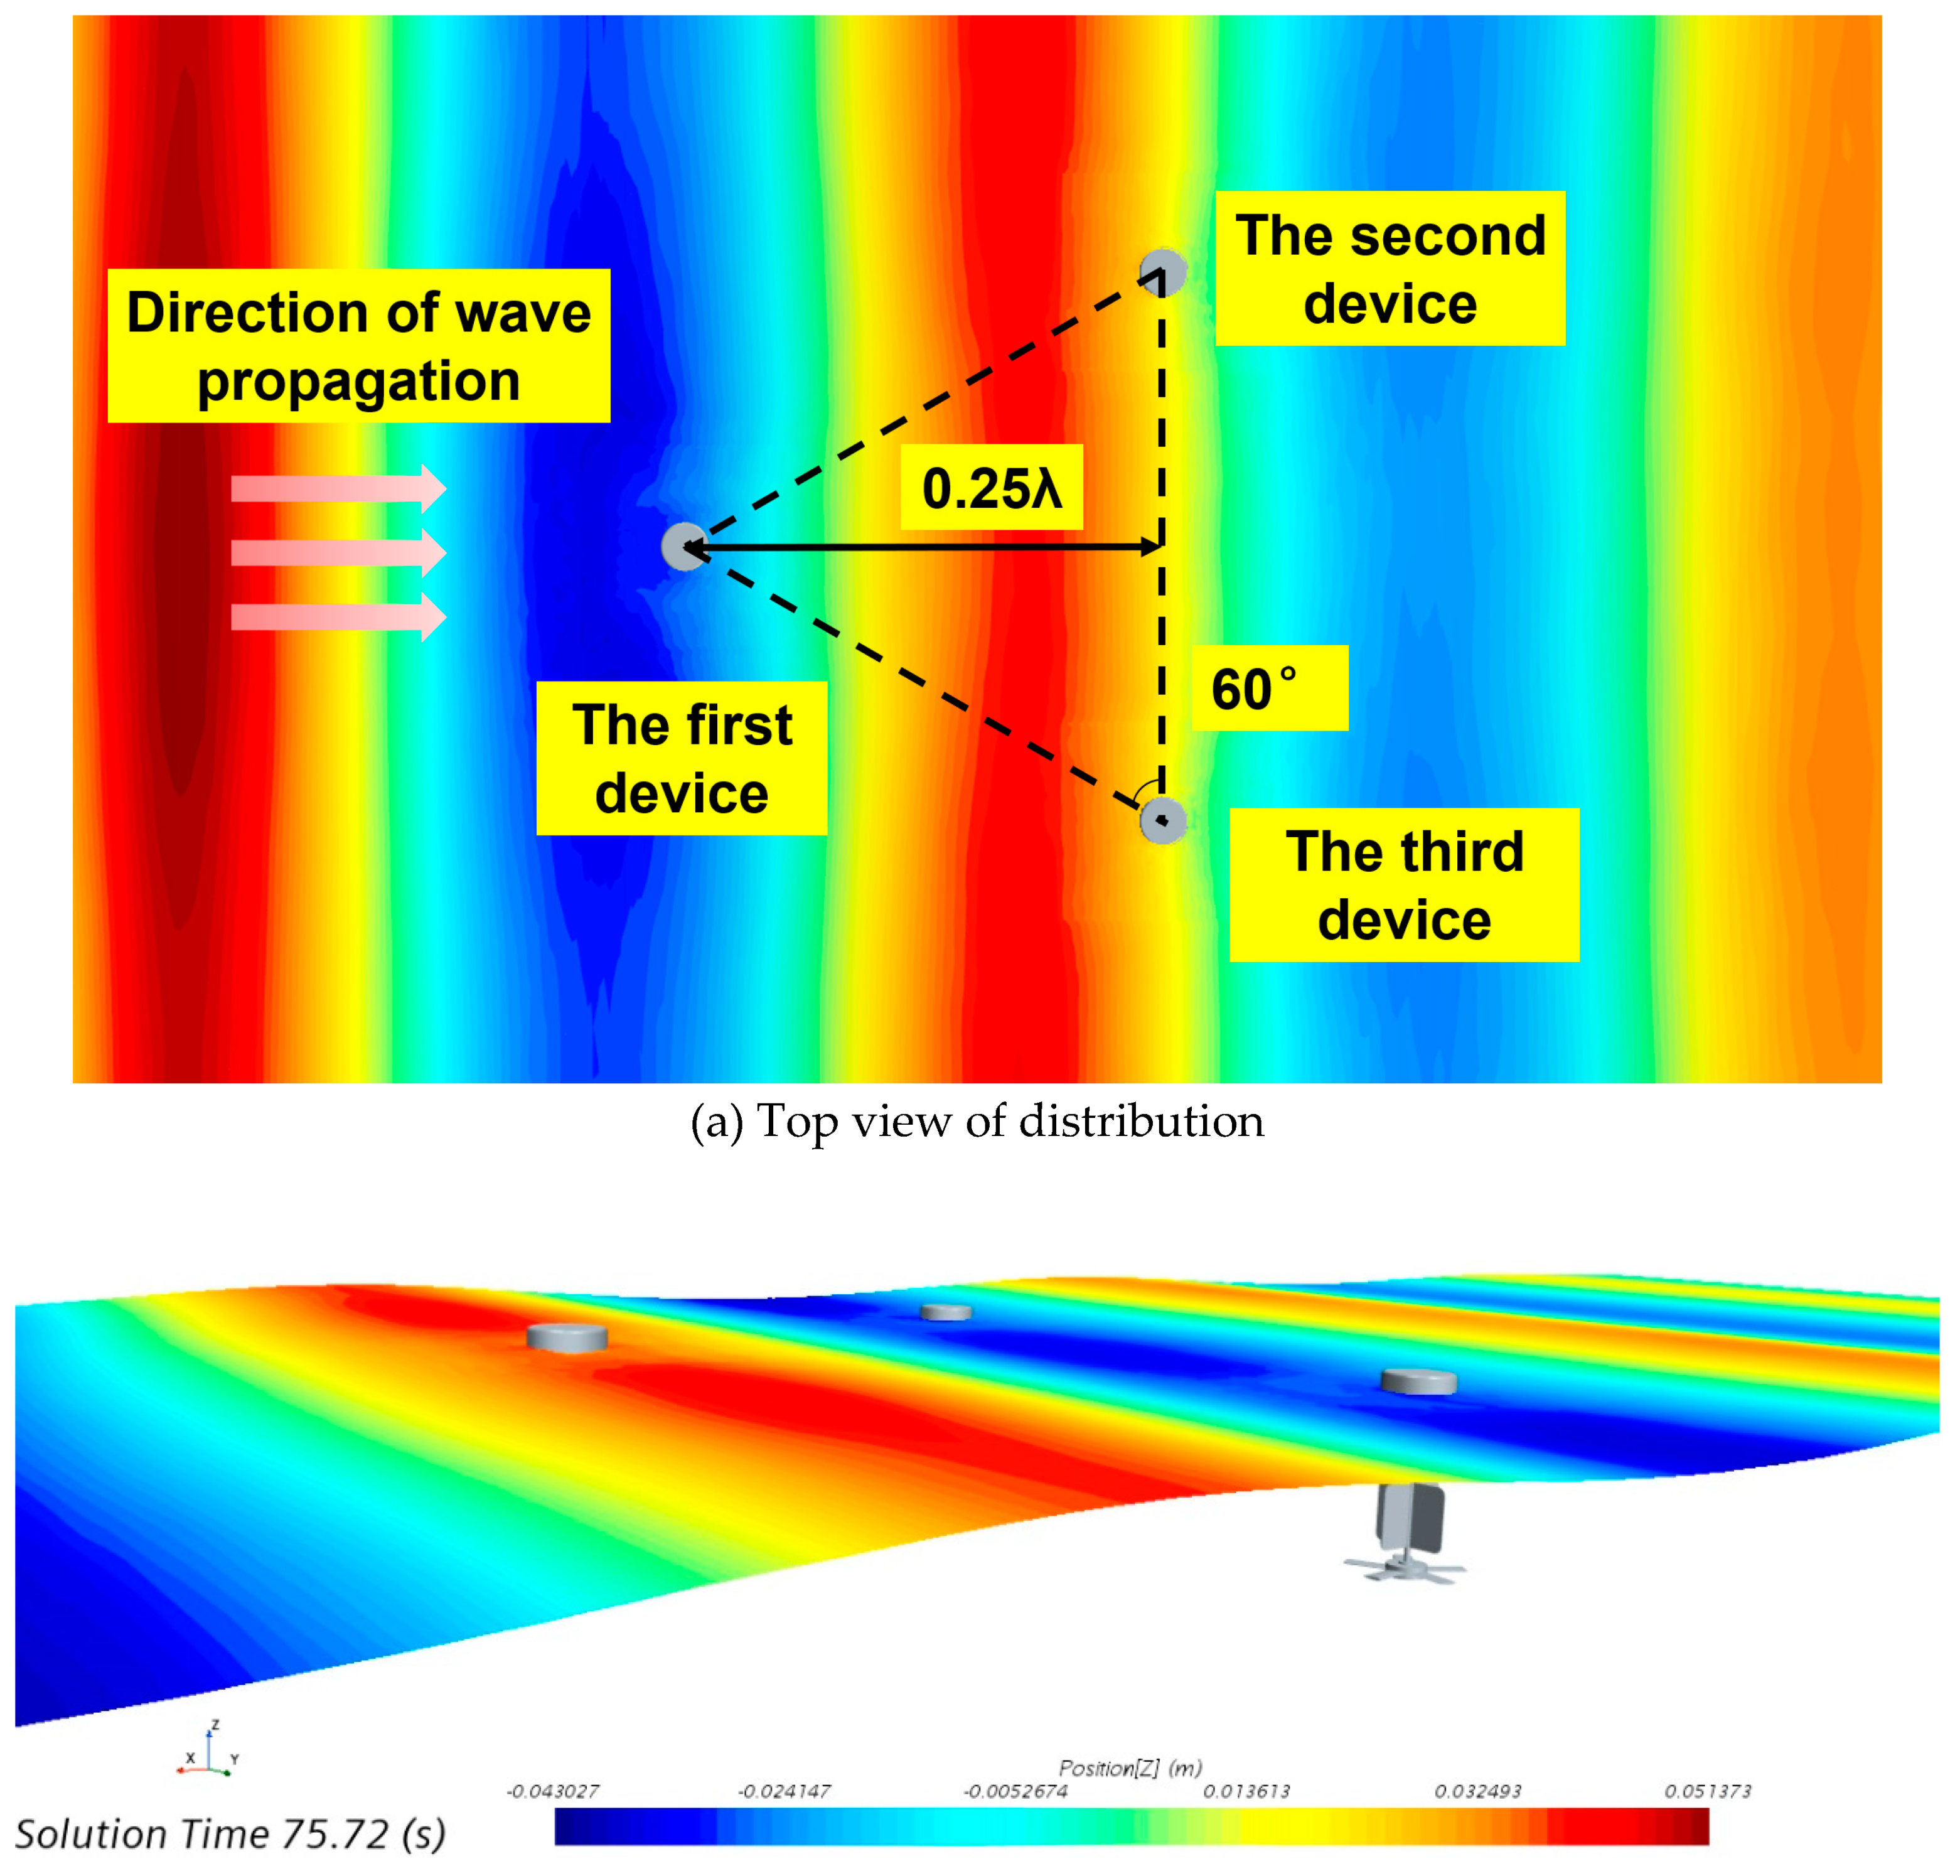
Figure 13.
Time-history curves of pendulum velocity versus pendulum displacement for triangular formation systems.
Figure 13.
Time-history curves of pendulum velocity versus pendulum displacement for triangular formation systems.
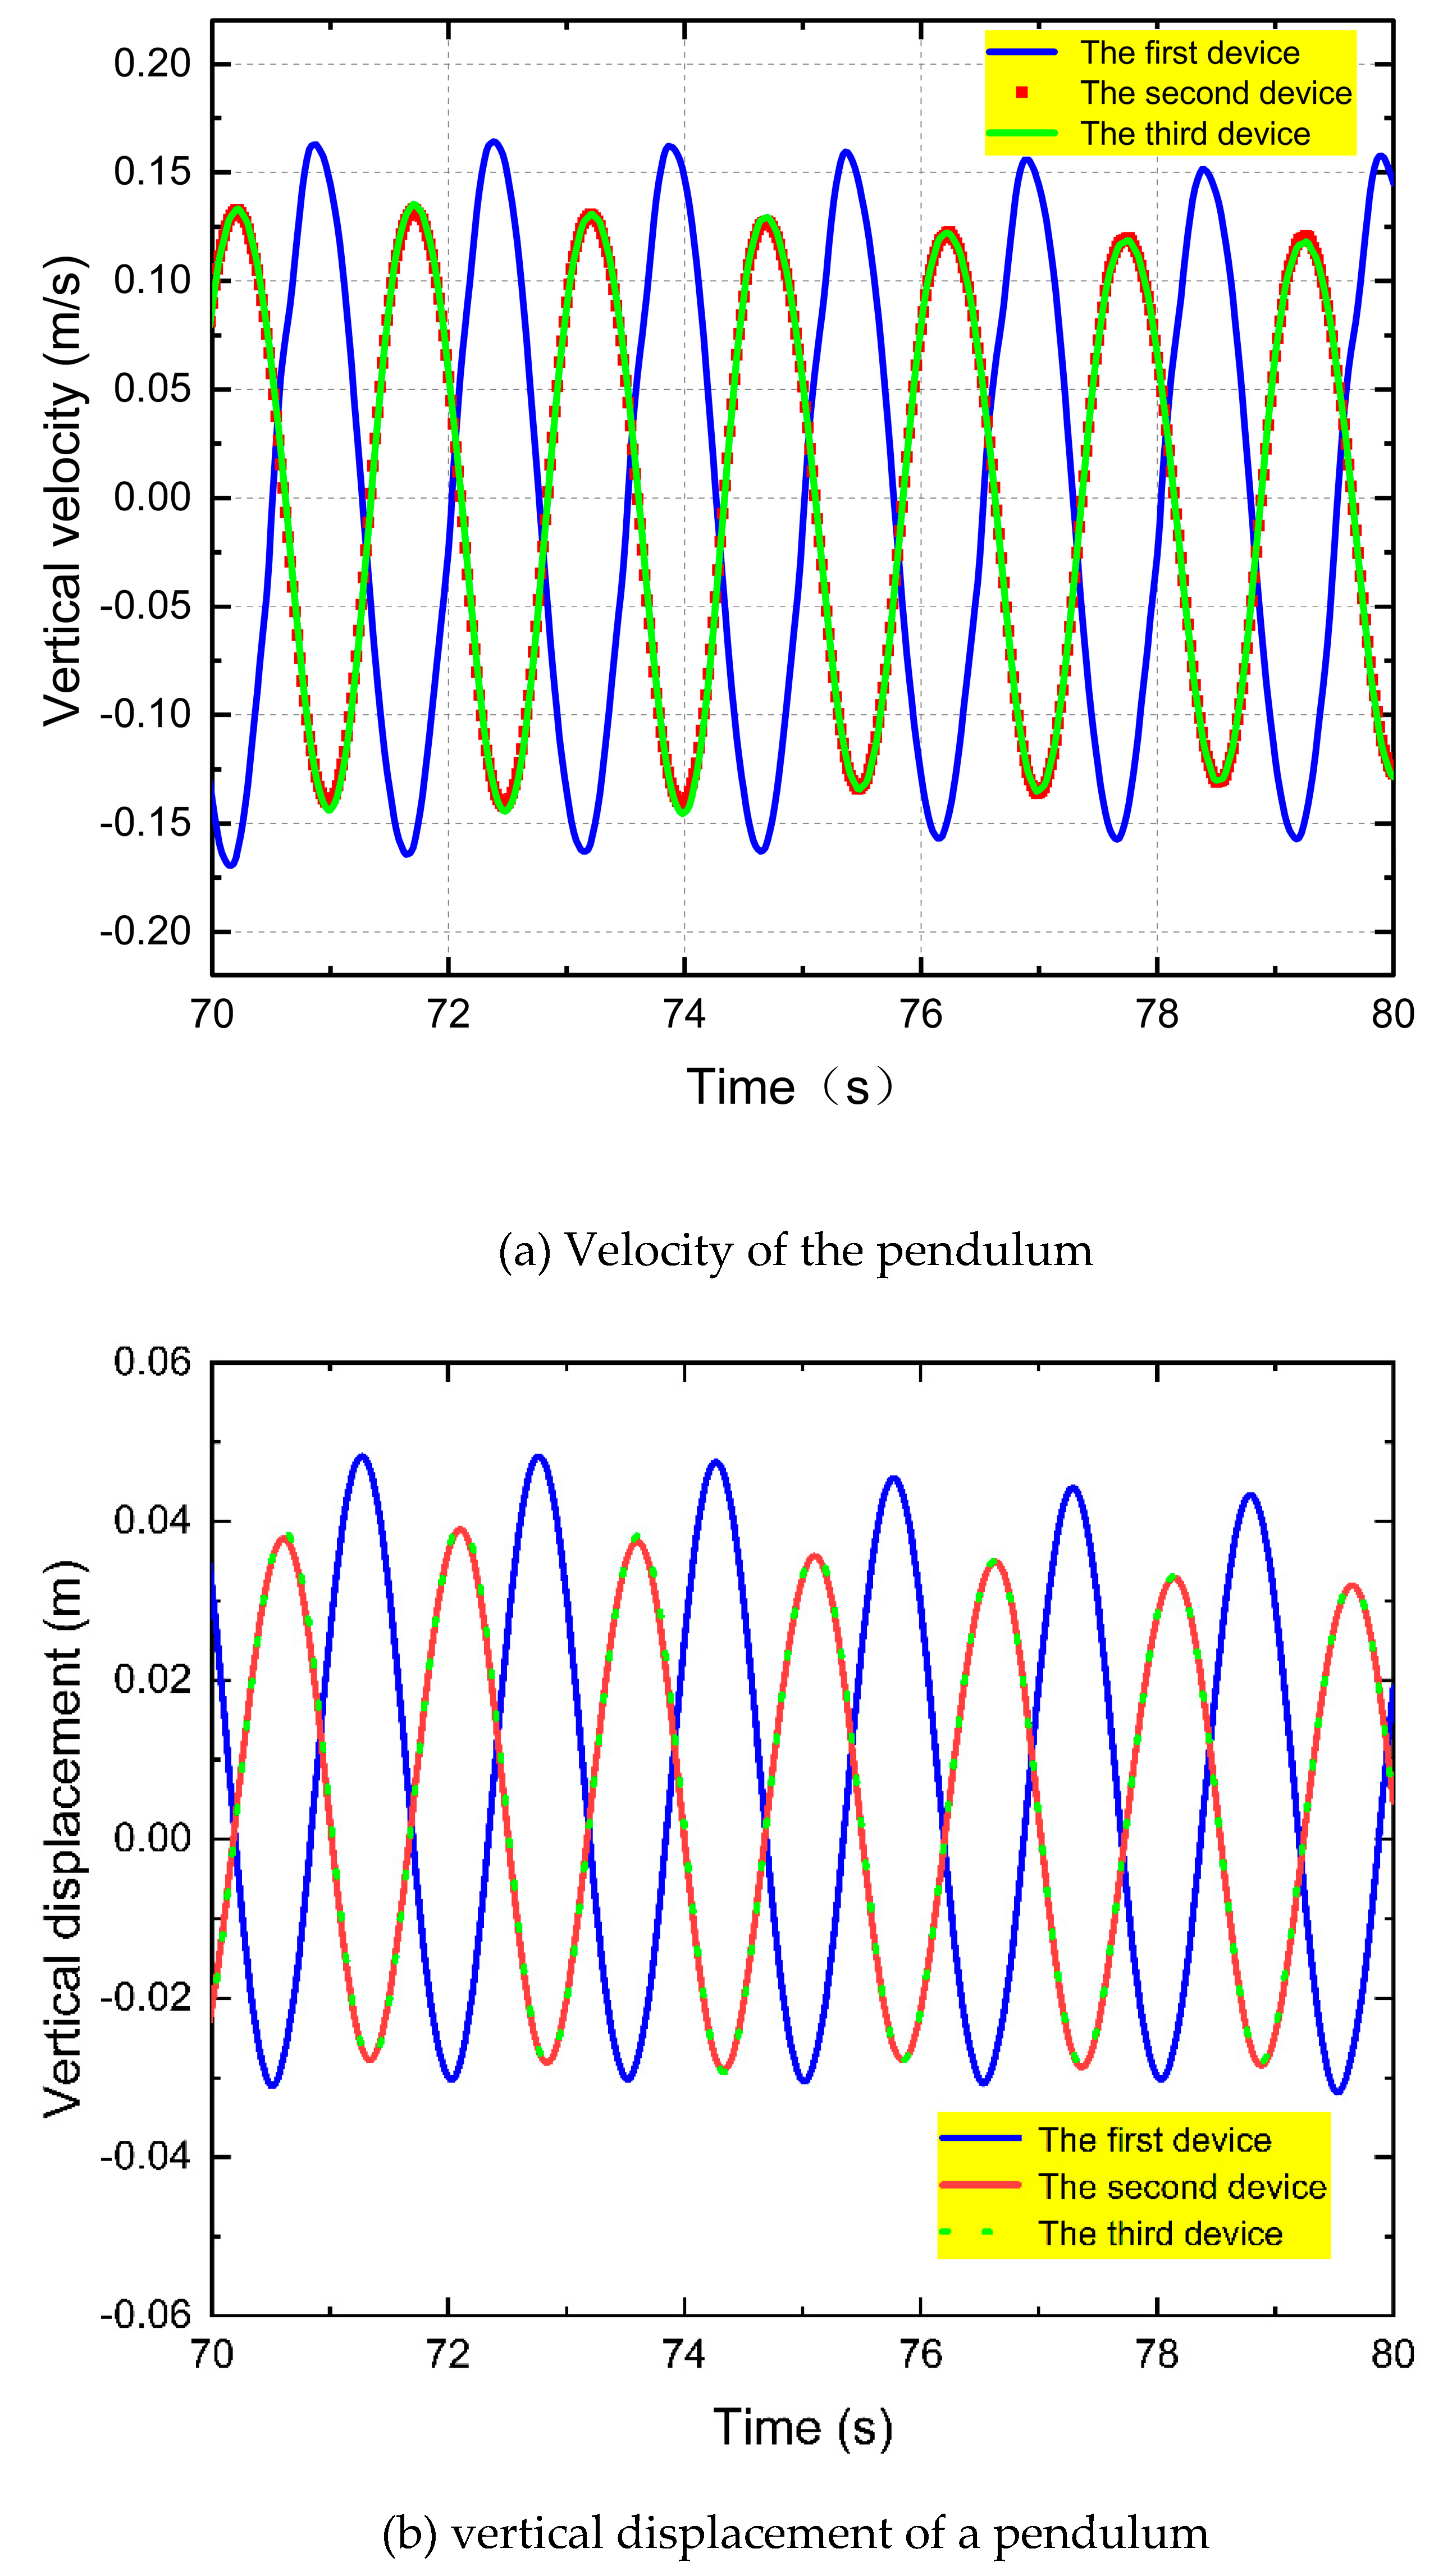
Figure 14.
Time-calendar curves of rotational angular velocity for a triangular formation system.
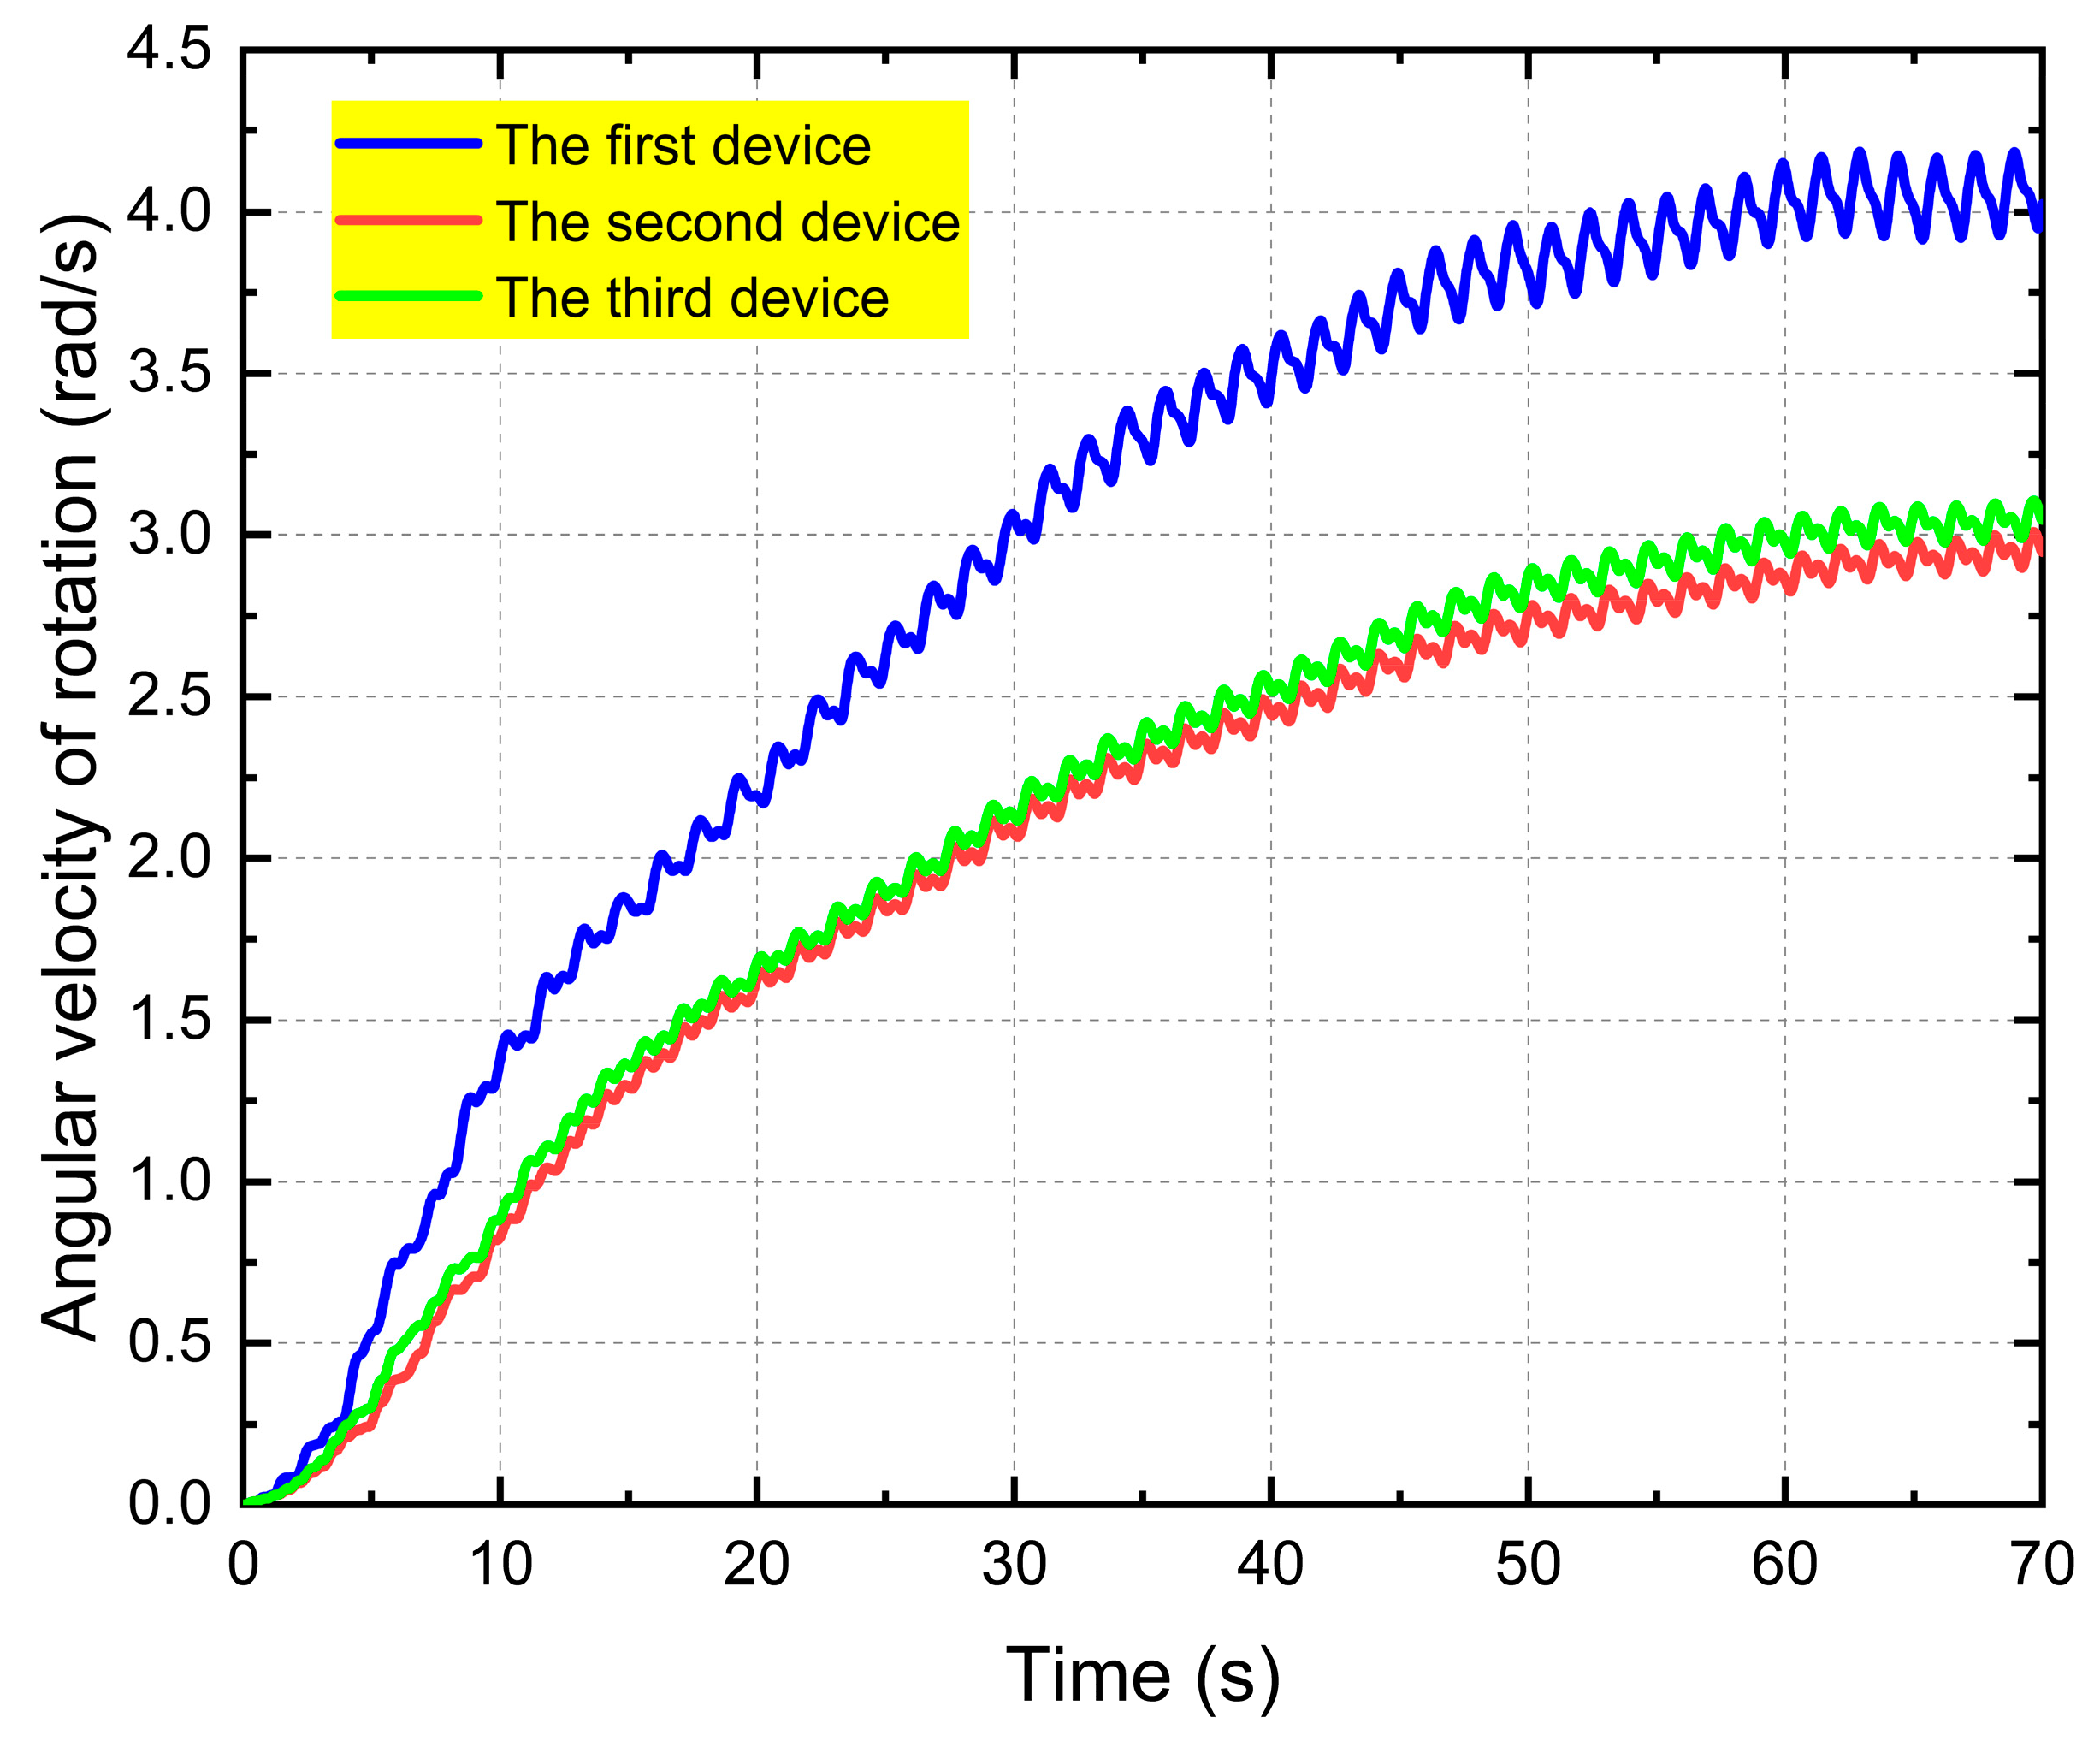
Figure 15.
Output power of the triangular formation system.
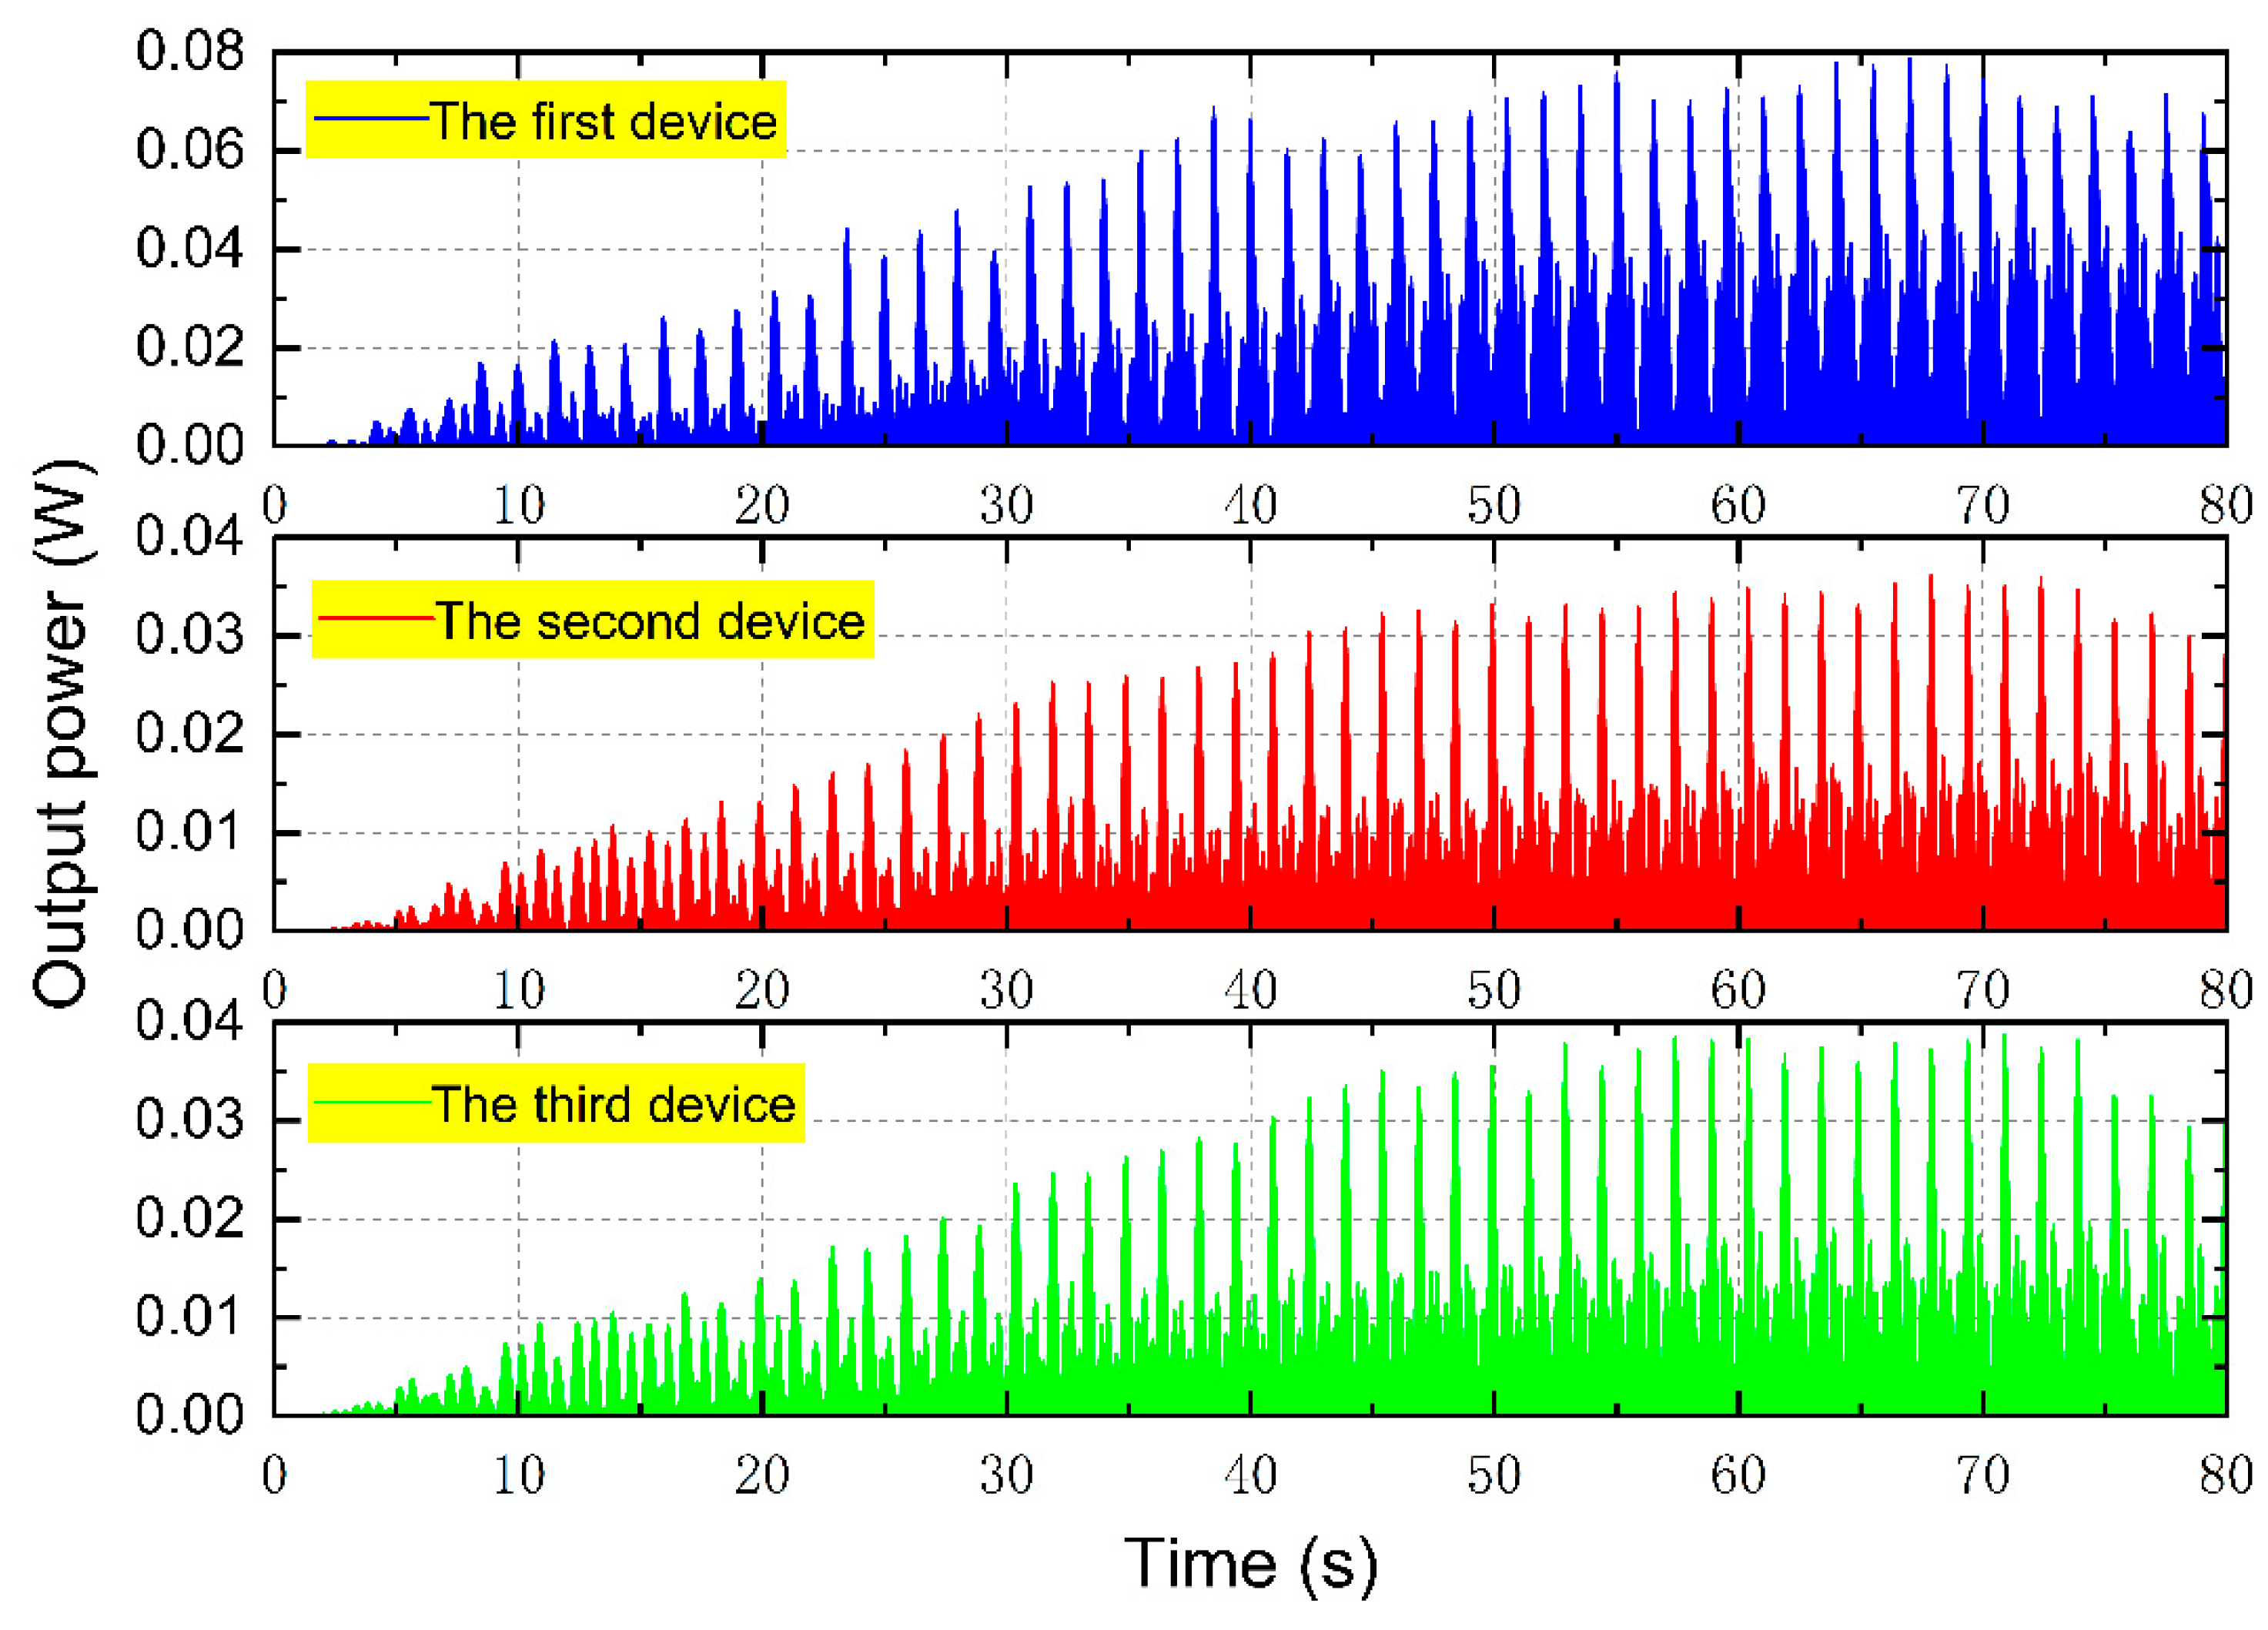
Figure 16.
Rectangular formation device movement scene.
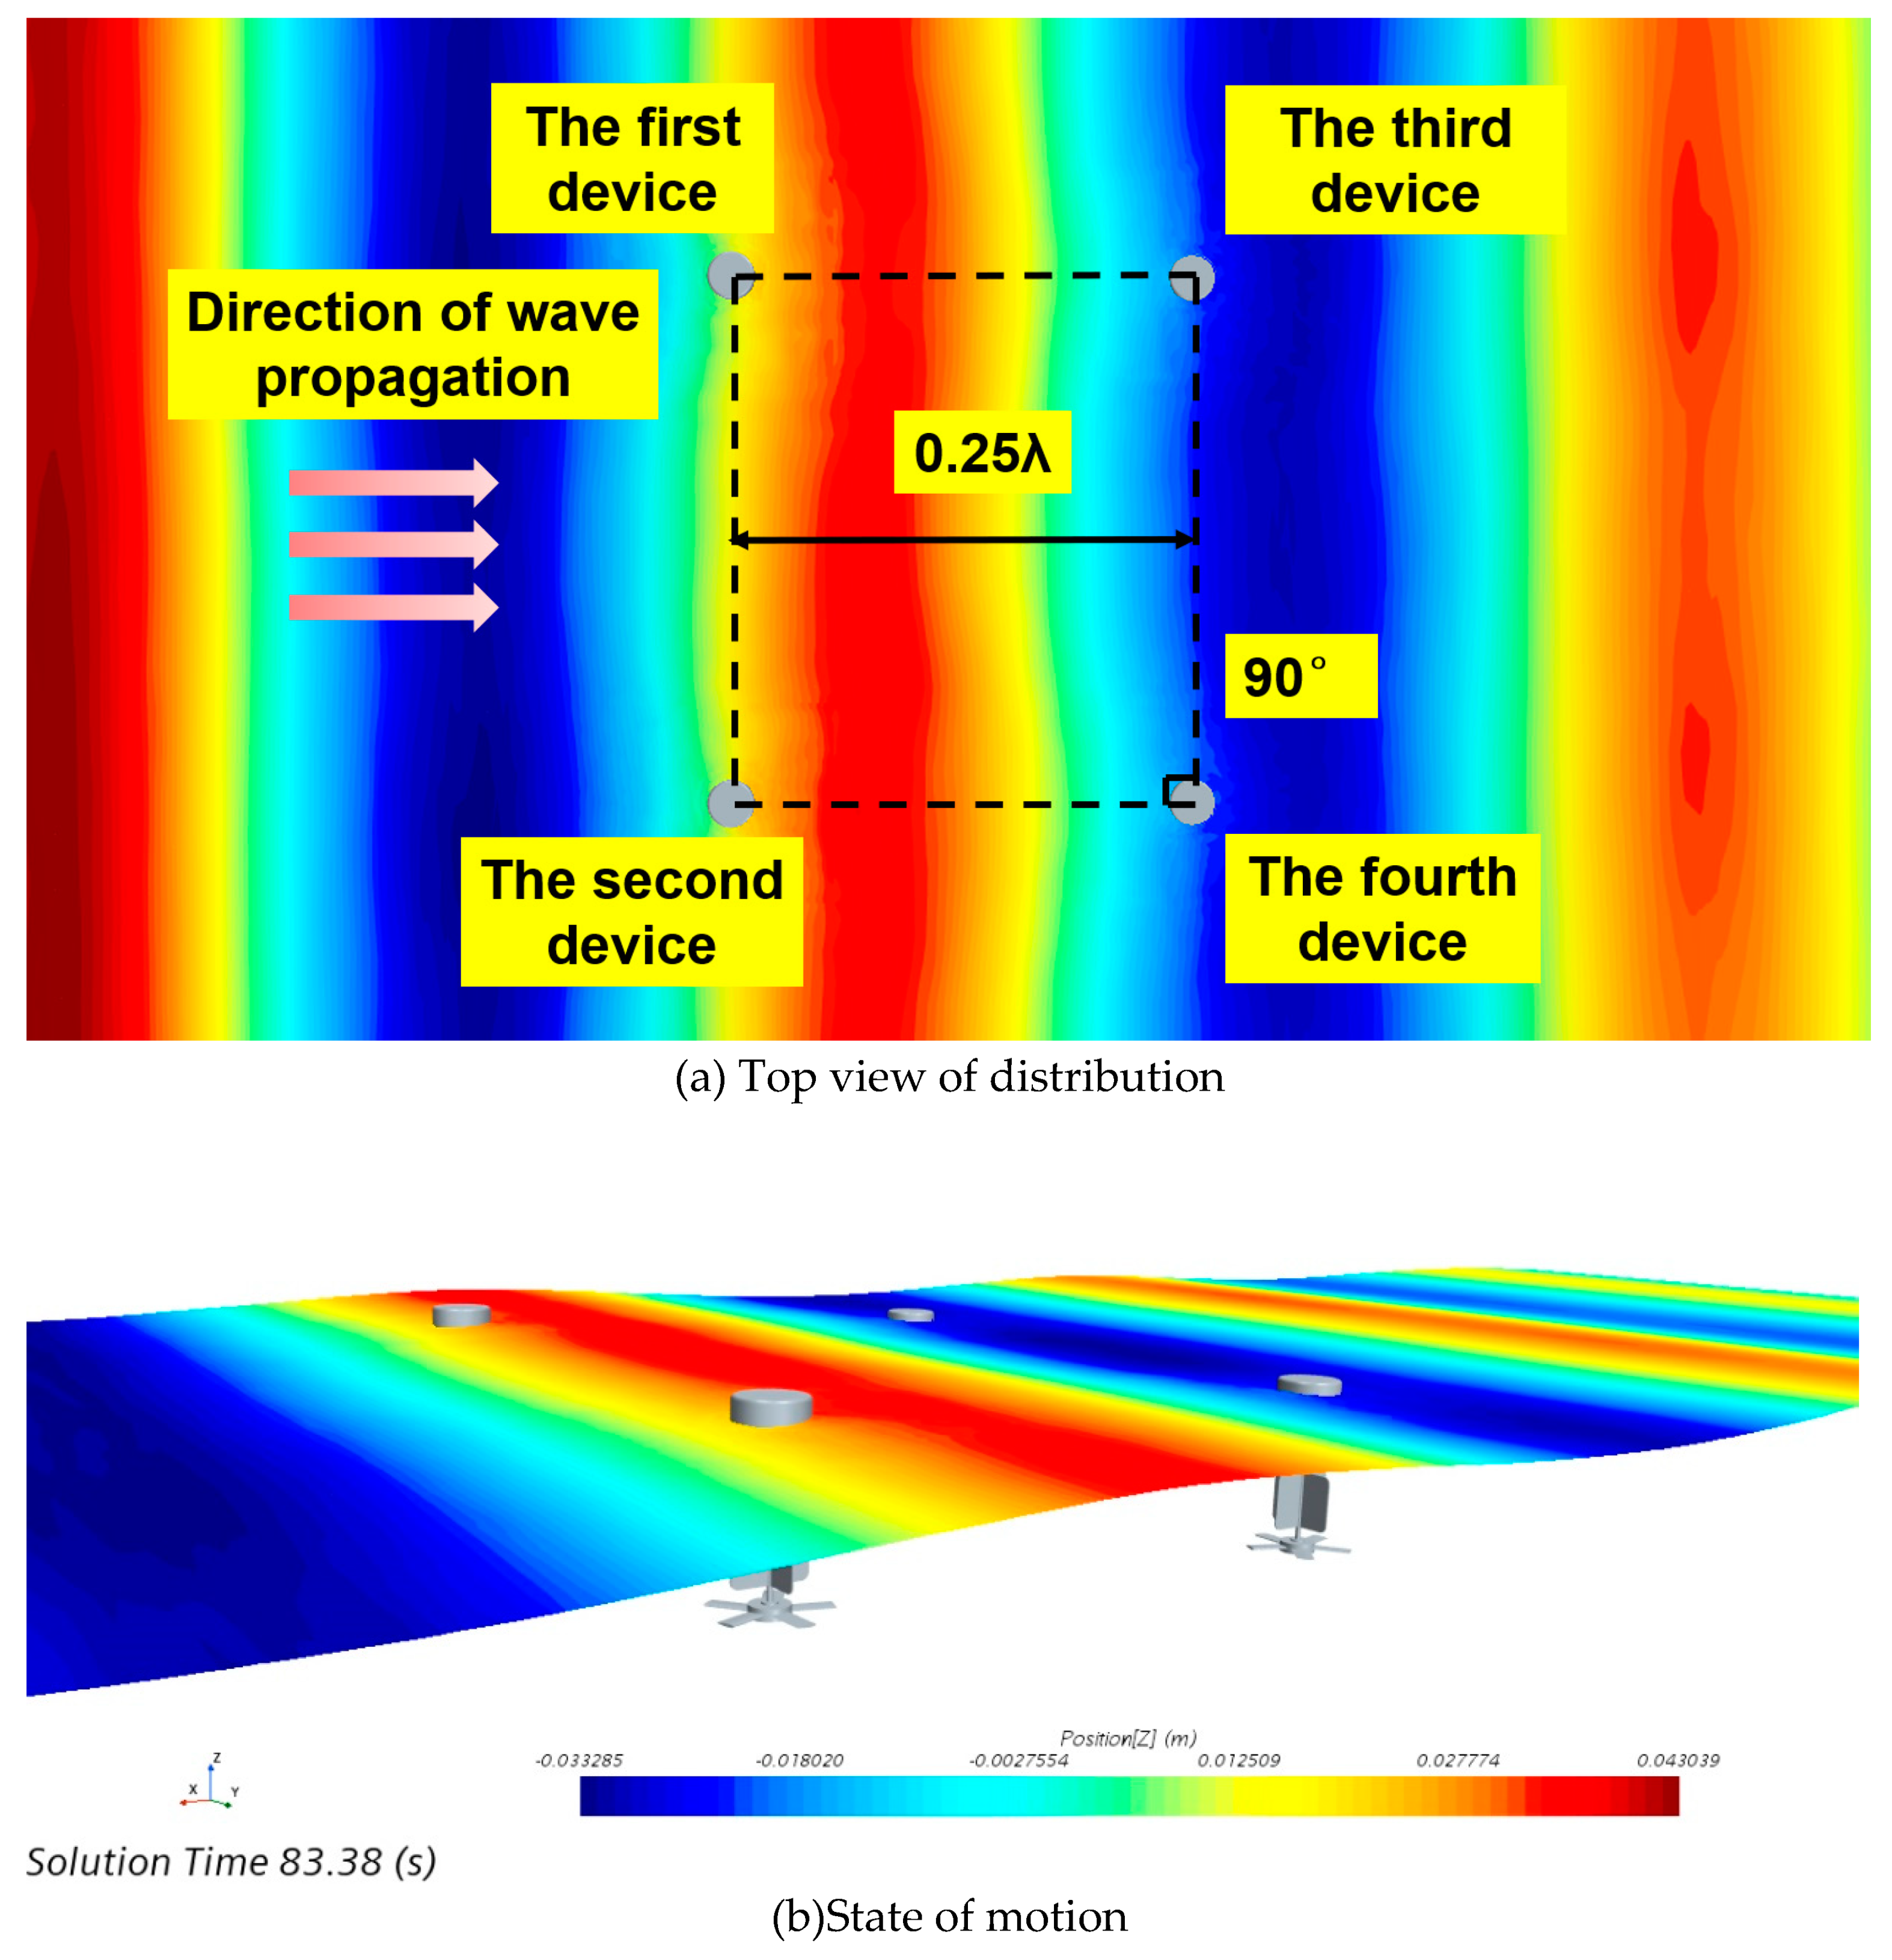
Figure 17.
Time-history curves of pendulum velocity versus pendulum displacement for a rectangular array system.
Figure 17.
Time-history curves of pendulum velocity versus pendulum displacement for a rectangular array system.
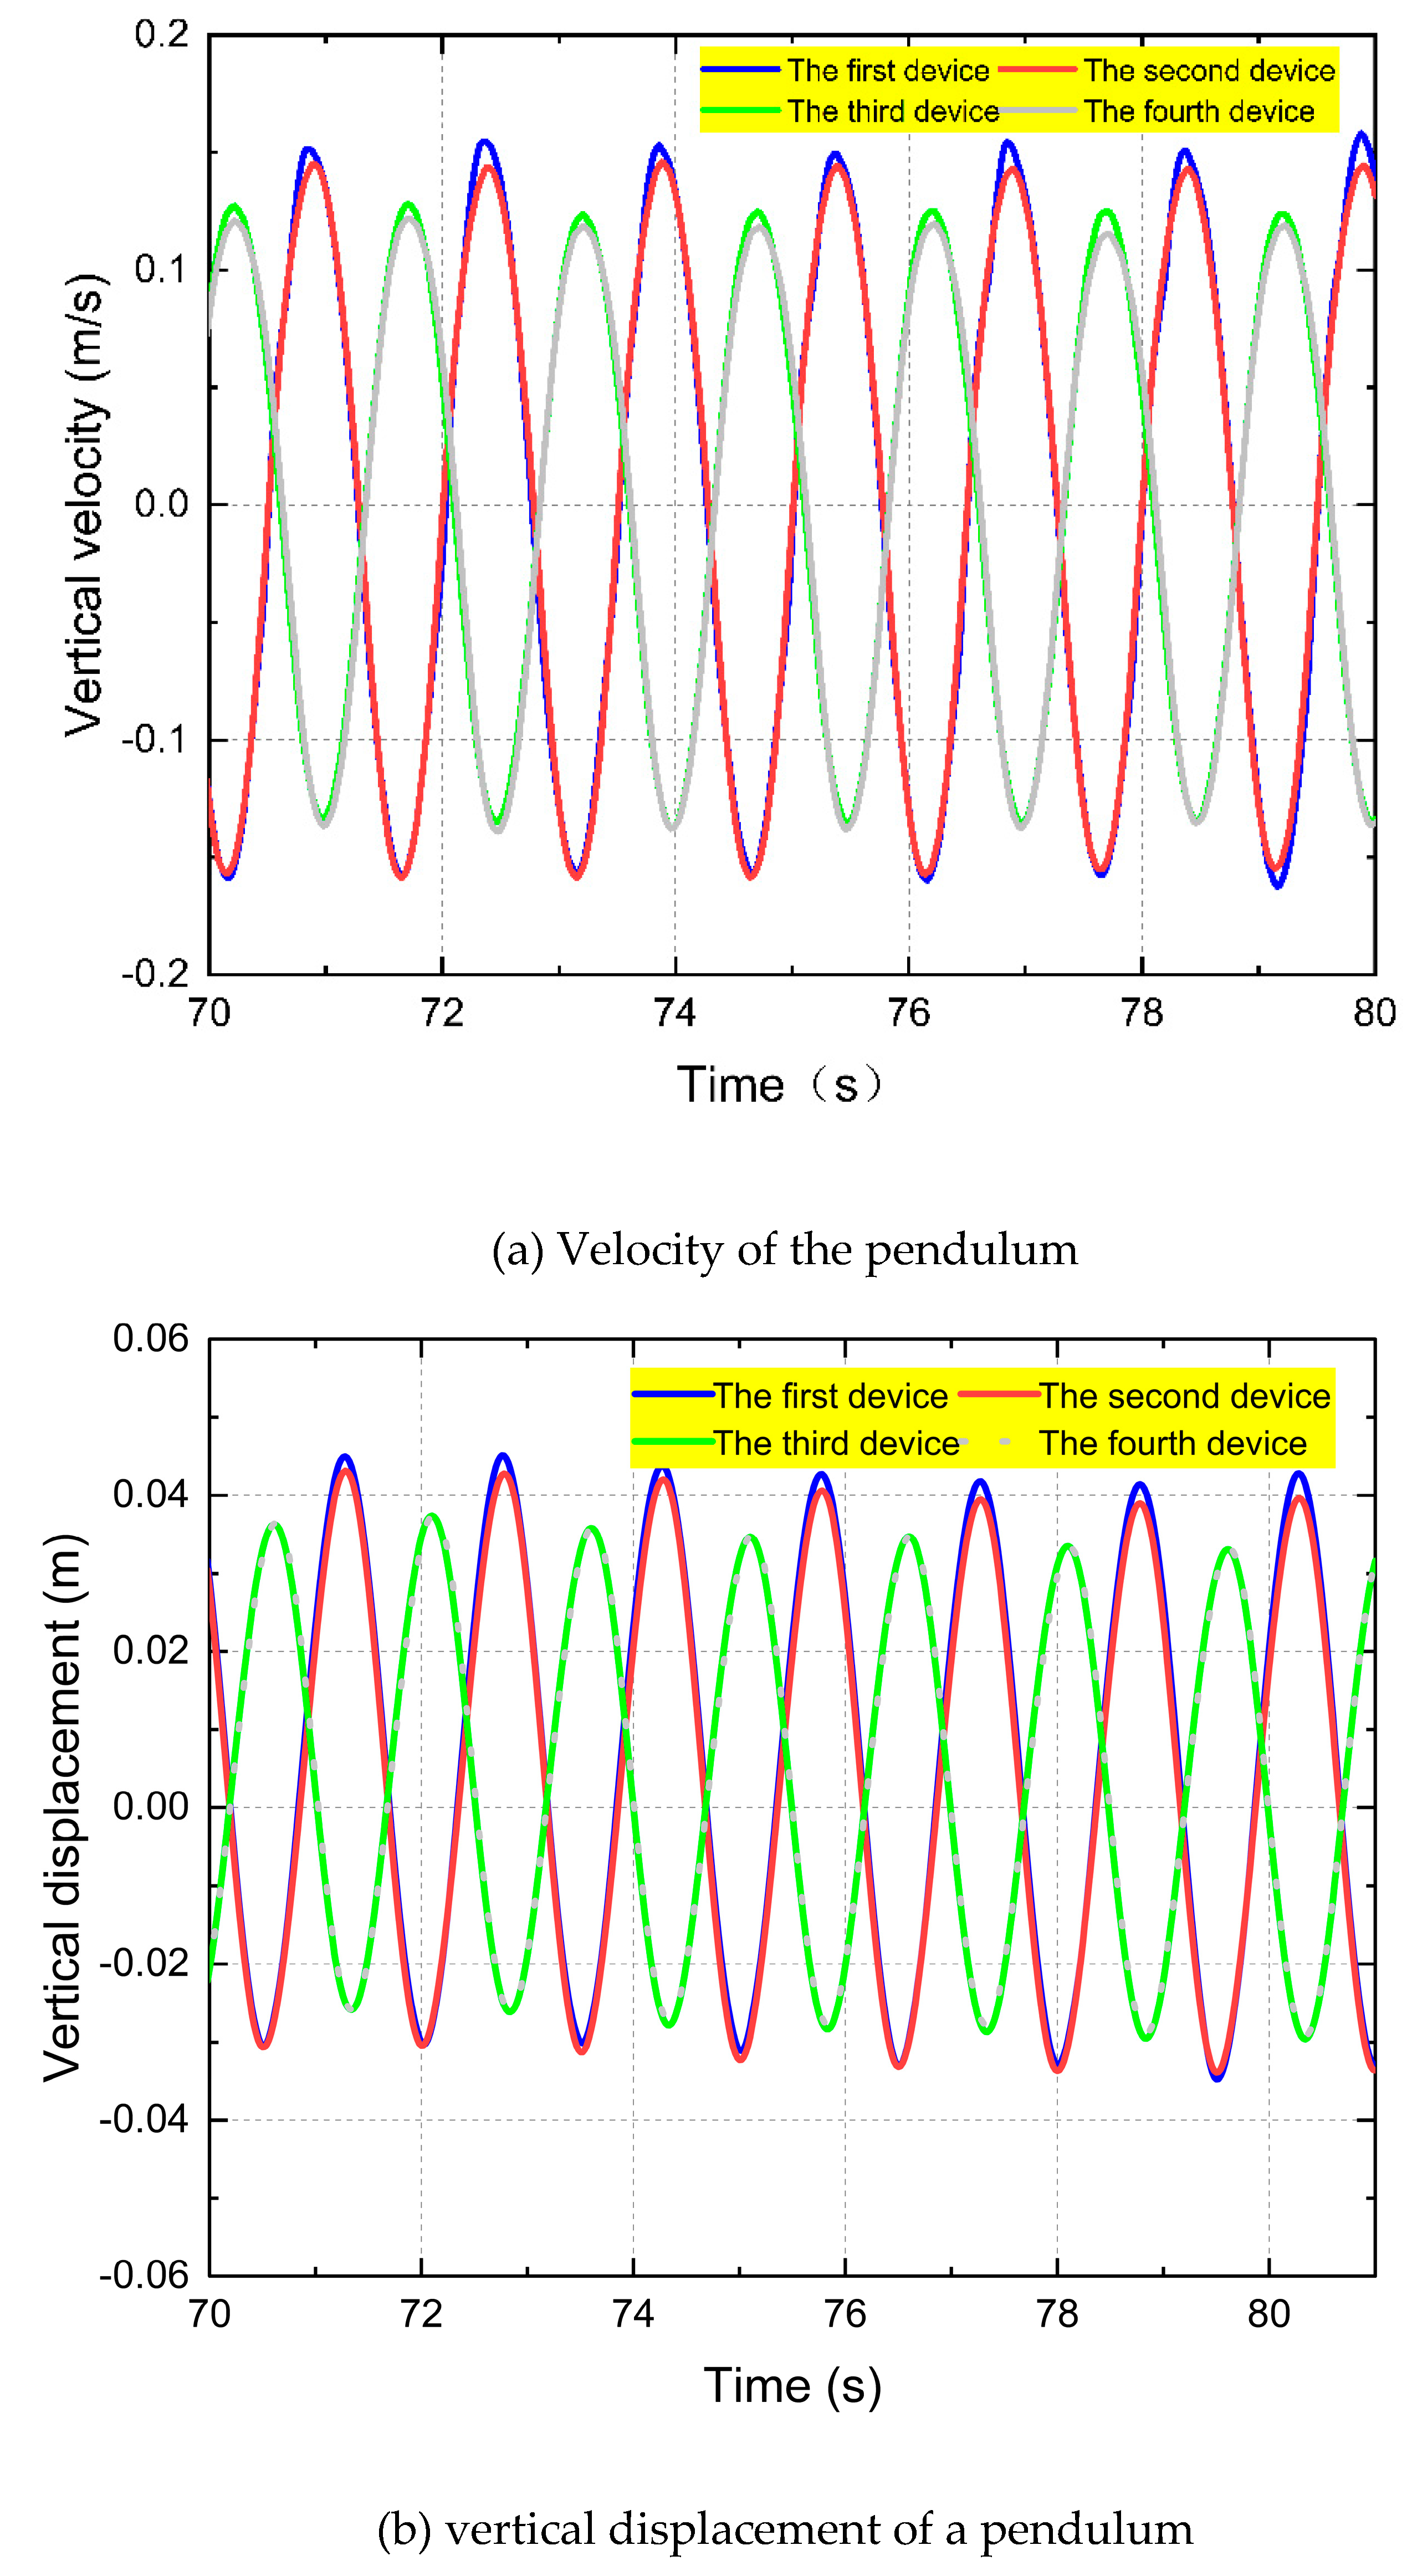
Figure 18.
Time-calendar curves of rotational angular velocity for a triangular formation system.
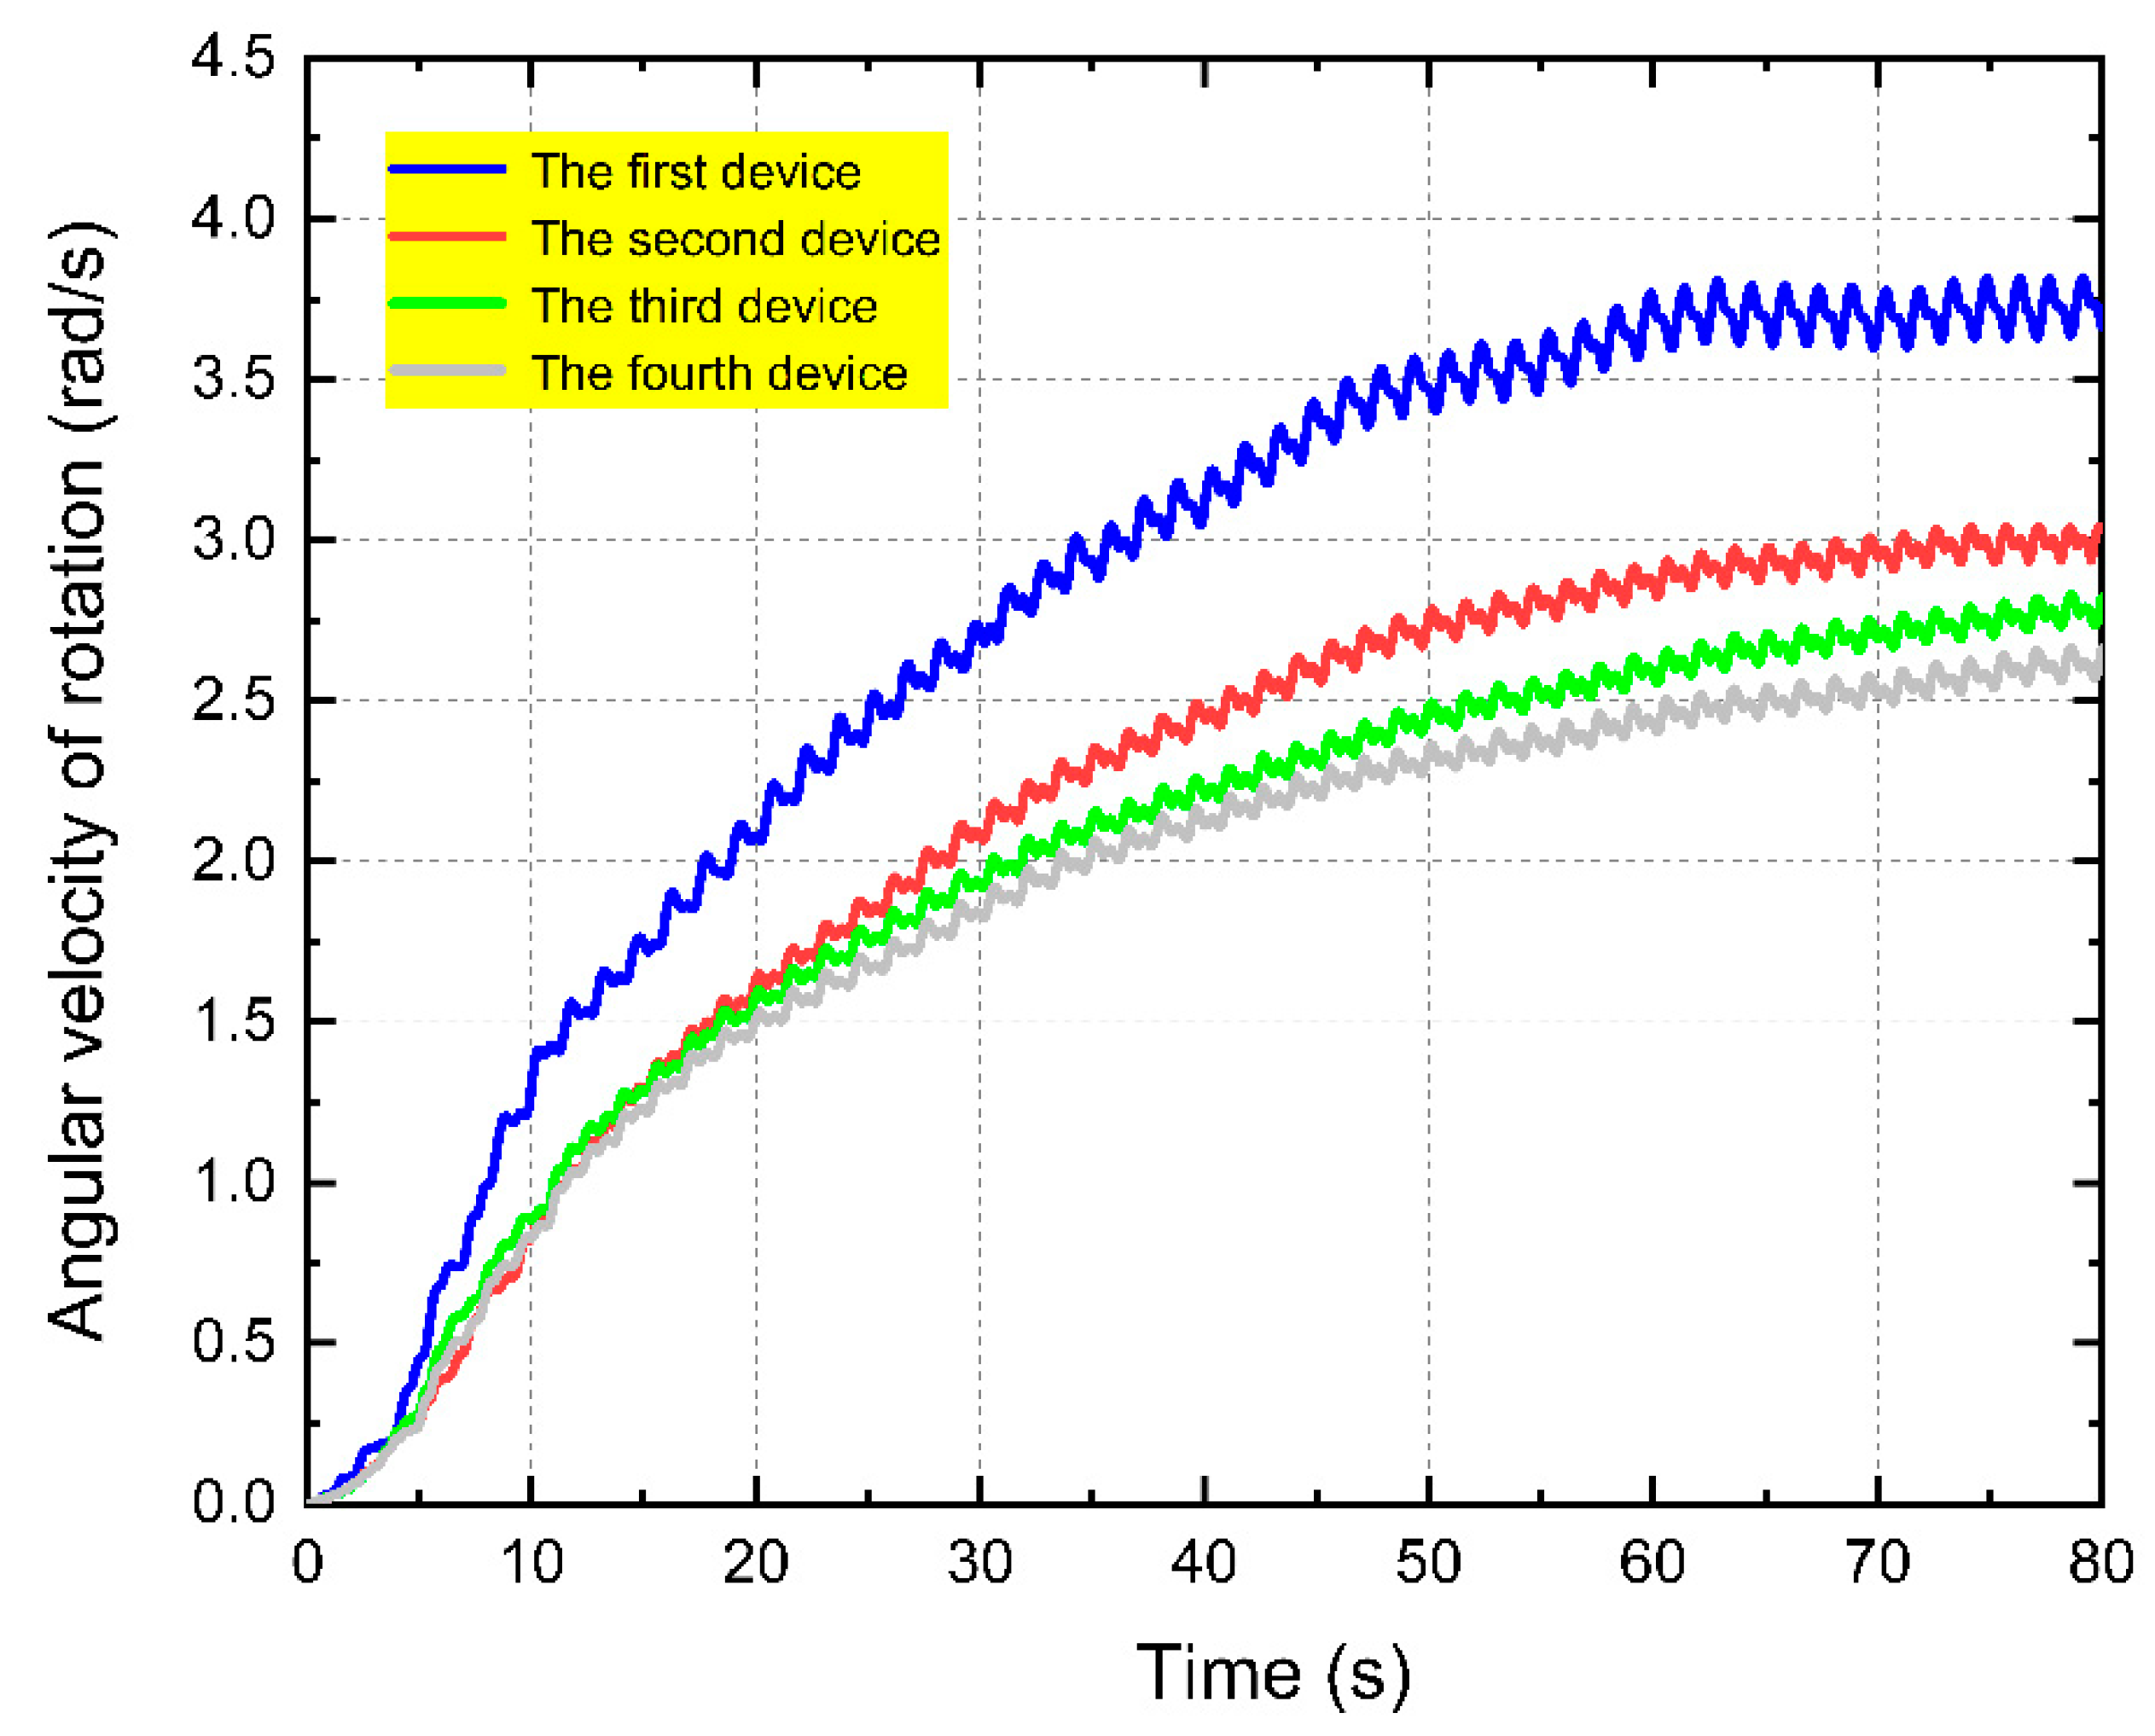
Figure 19.
Output power of rectangular array system.
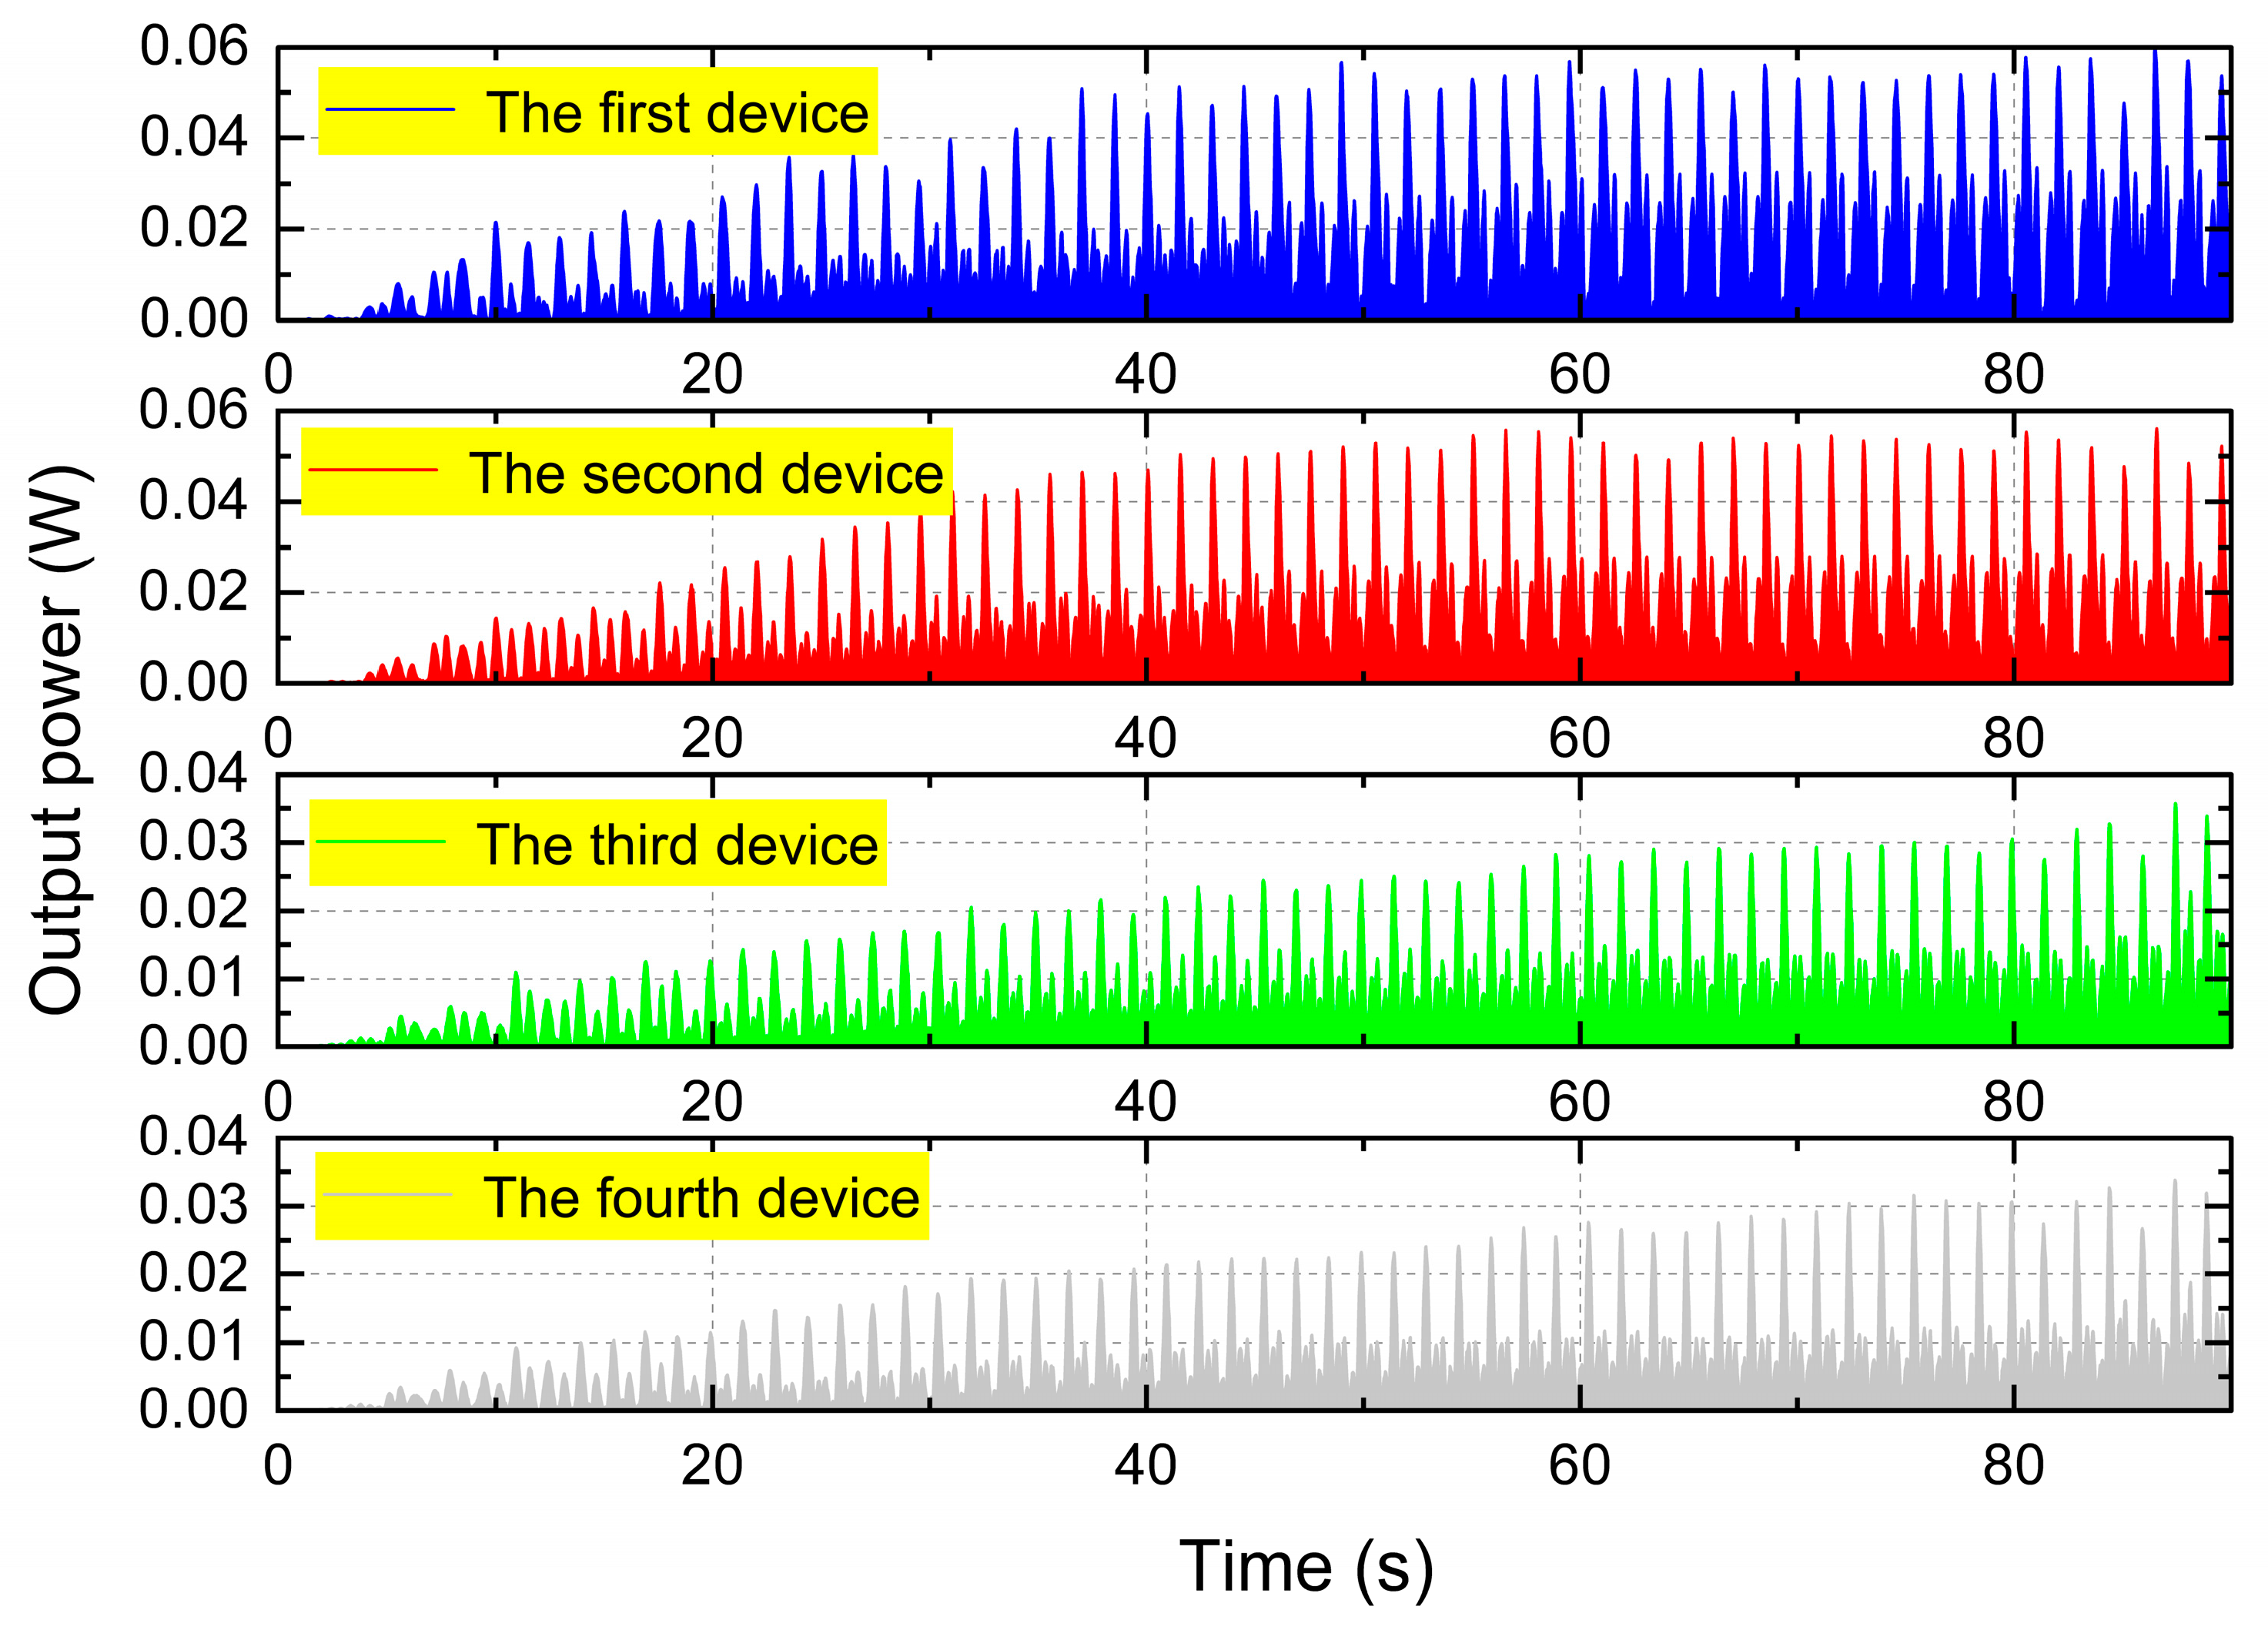
Figure 20.
Comparison of array impact factors for different formations.
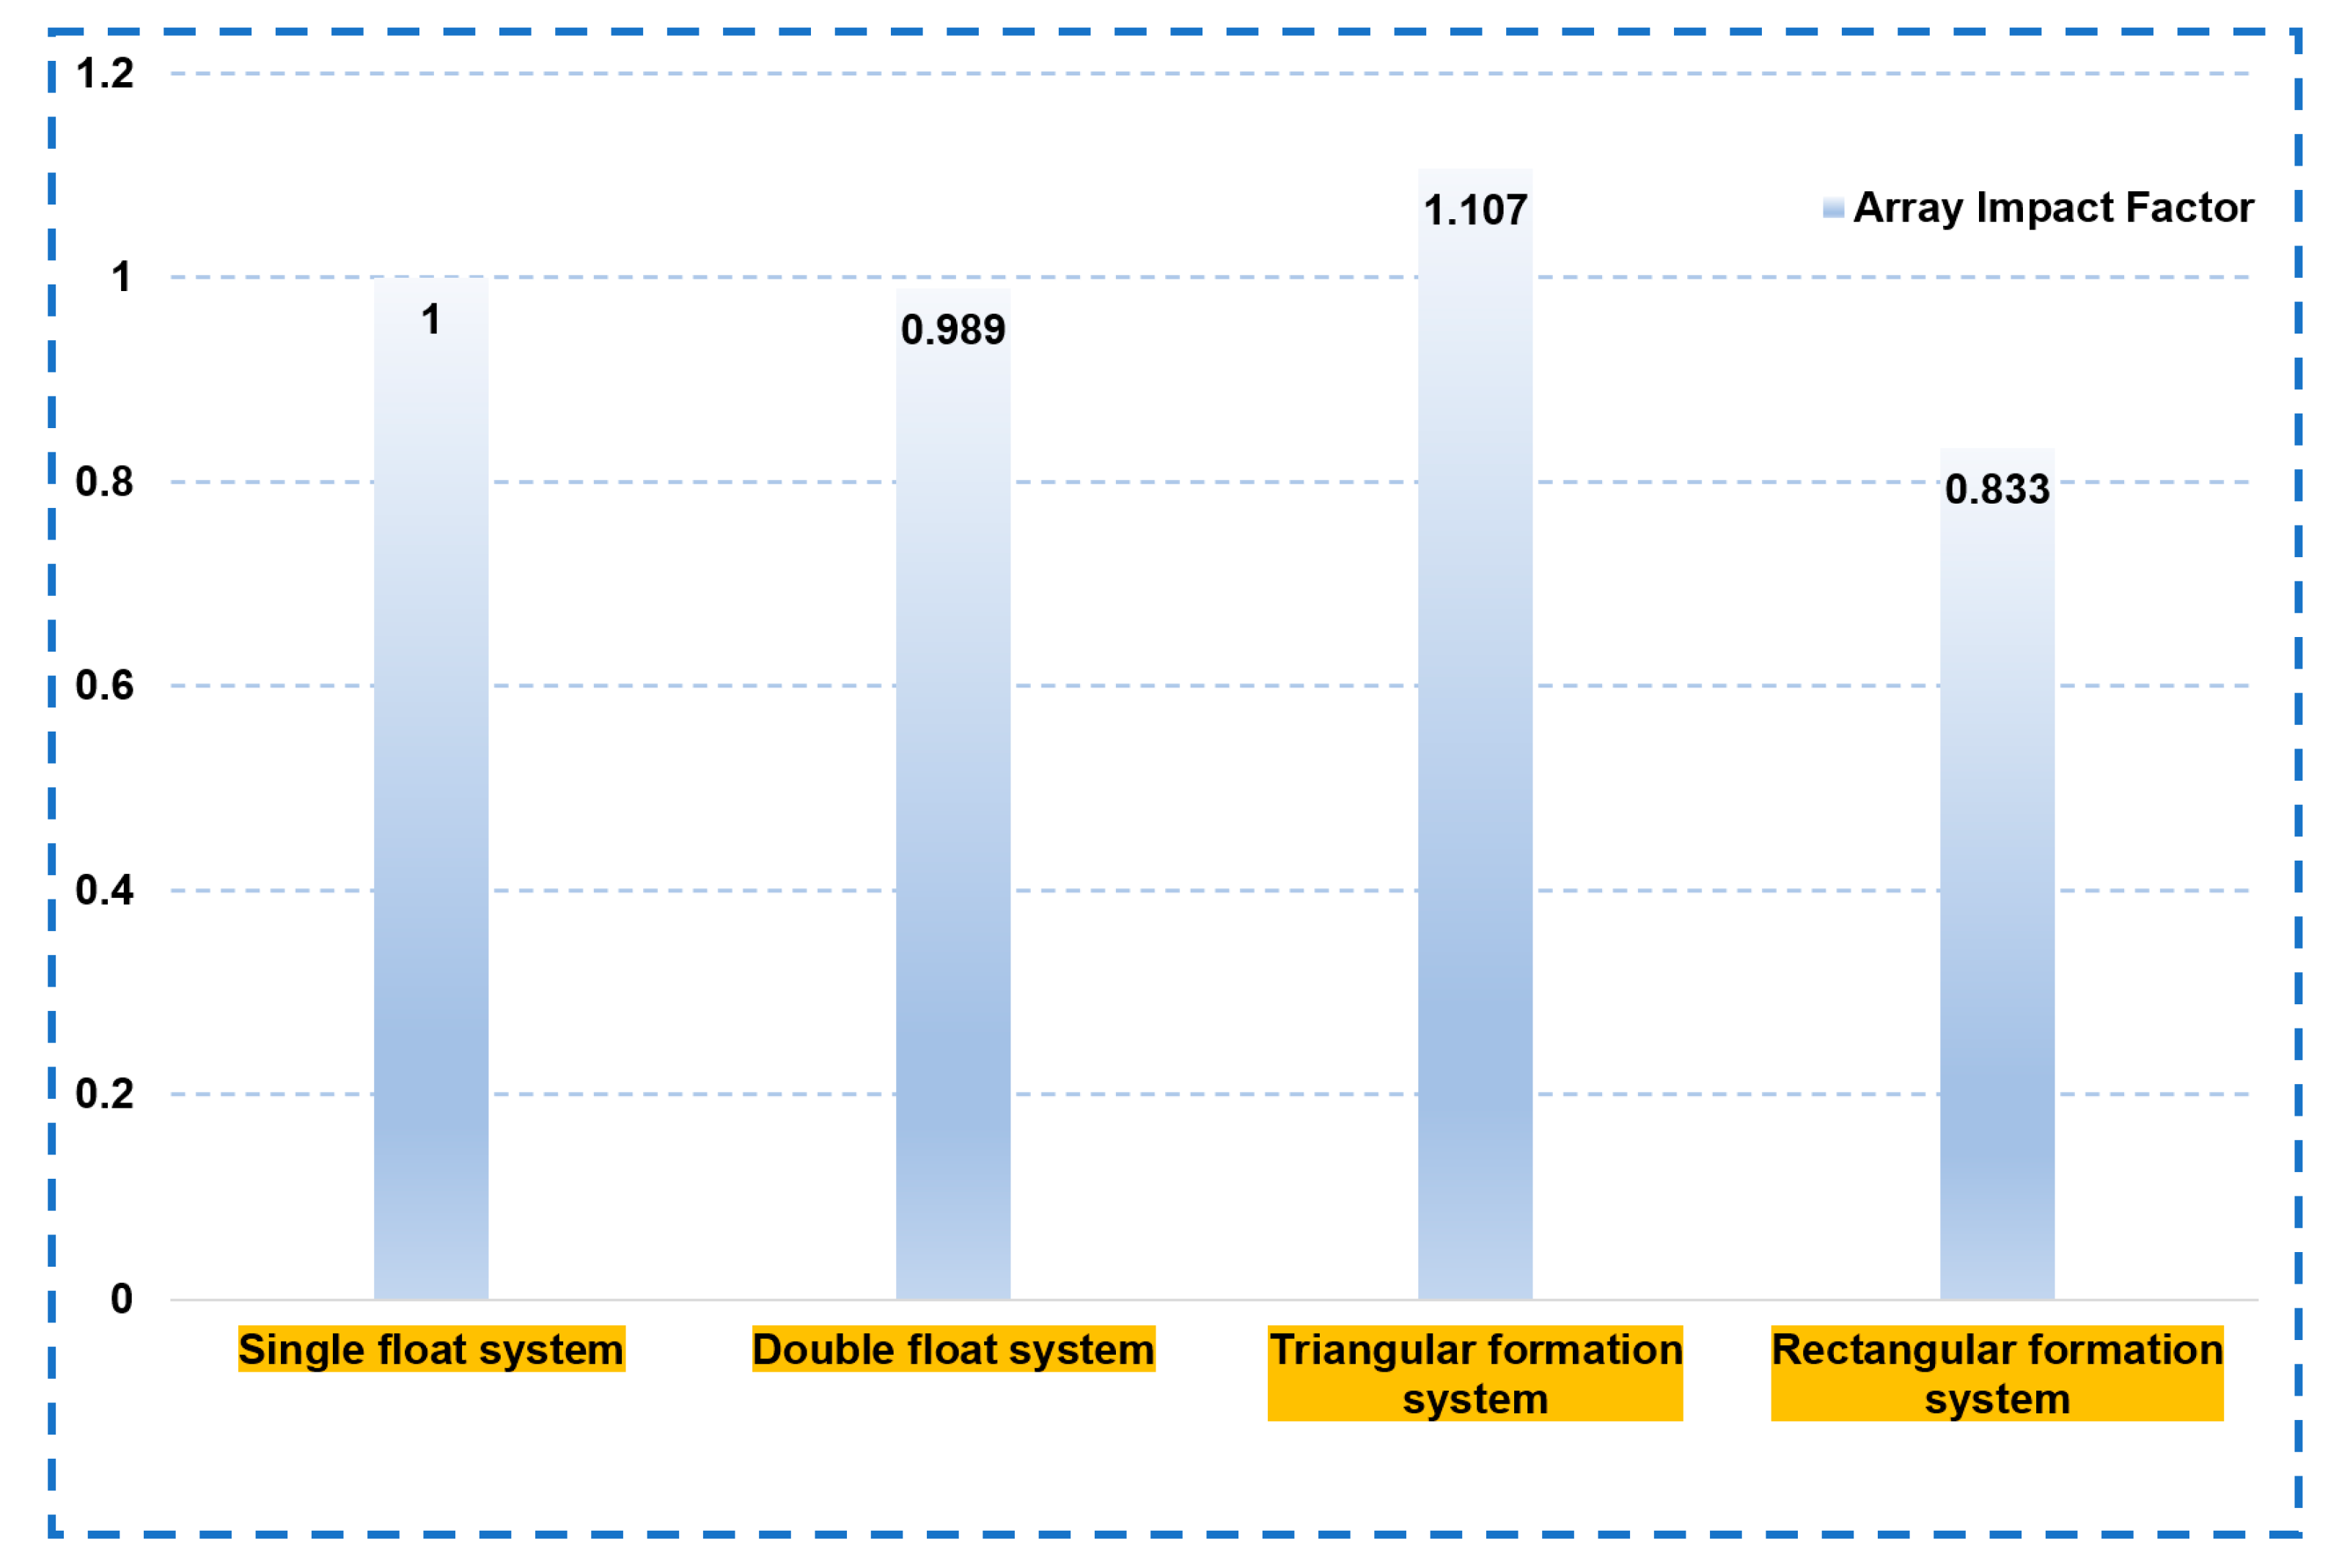

Table 1.
Main parameters of the turbofan model.
| Combined Parameters | Physical Models |
|---|---|
| Space | Three-dimensional |
| Time | Implicit Indeterminacy |
| Eulerian multiphase flow models | Volume of fluid domain (VOF) |
| Turbulence model | Gravity, VOF waves |
| Other models | Physical models |
Disclaimer/Publisher’s Note: The statements, opinions and data contained in all publications are solely those of the individual author(s) and contributor(s) and not of MDPI and/or the editor(s). MDPI and/or the editor(s) disclaim responsibility for any injury to people or property resulting from any ideas, methods, instructions or products referred to in the content. |
© 2023 by the authors. Licensee MDPI, Basel, Switzerland. This article is an open access article distributed under the terms and conditions of the Creative Commons Attribution (CC BY) license (http://creativecommons.org/licenses/by/4.0/).
Copyright: This open access article is published under a Creative Commons CC BY 4.0 license, which permit the free download, distribution, and reuse, provided that the author and preprint are cited in any reuse.


