Preprint
Review

Aerodynamic Performance of Wind Turbines Operating under Hazard Environmental Conditions: A Review

Altmetrics

Downloads

235

Views

73

Comments

0

A peer-reviewed article of this preprint also exists.

This version is not peer-reviewed

Submitted:

28 September 2023

Posted:

29 September 2023

You are already at the latest version

Alerts
Abstract
This paper provides a review of the aerodynamic behavior of horizontal axis wind turbines operating in hazardous environmental conditions. Over the past decade, renewable energy use has accelerated due to global warming, depleting fossil fuel reserves, and stricter environmental regulations. Among renewable options, solar and wind energy have shown economic viability and global growth. Horizontal axis wind turbines offer promising solutions for sustainable energy demand. Since wind turbines operate in an open environment, their efficiency depends on environmental conditions. Hazard environmental conditions, such as icing, rainfall, hailstorm, dust or sand, insects’ collisions, increased humidity and sea spray, result in degraded aerodynamic performance. The outcome of the most studies is that lift is degraded and at the same time drag is increased when wind turbines operate under these conditions. The objective of this review is to improve our comprehension of the crucial aspects to take into account when designing wind turbine blades, and it offers suggestions for future research paths. It serves as a valuable resource that can inspire researchers who are dedicated to enhancing the aerodynamic performance of horizontal axis wind turbines.
Keywords: 
Subject: Engineering  -   Mechanical Engineering

1. Introduction

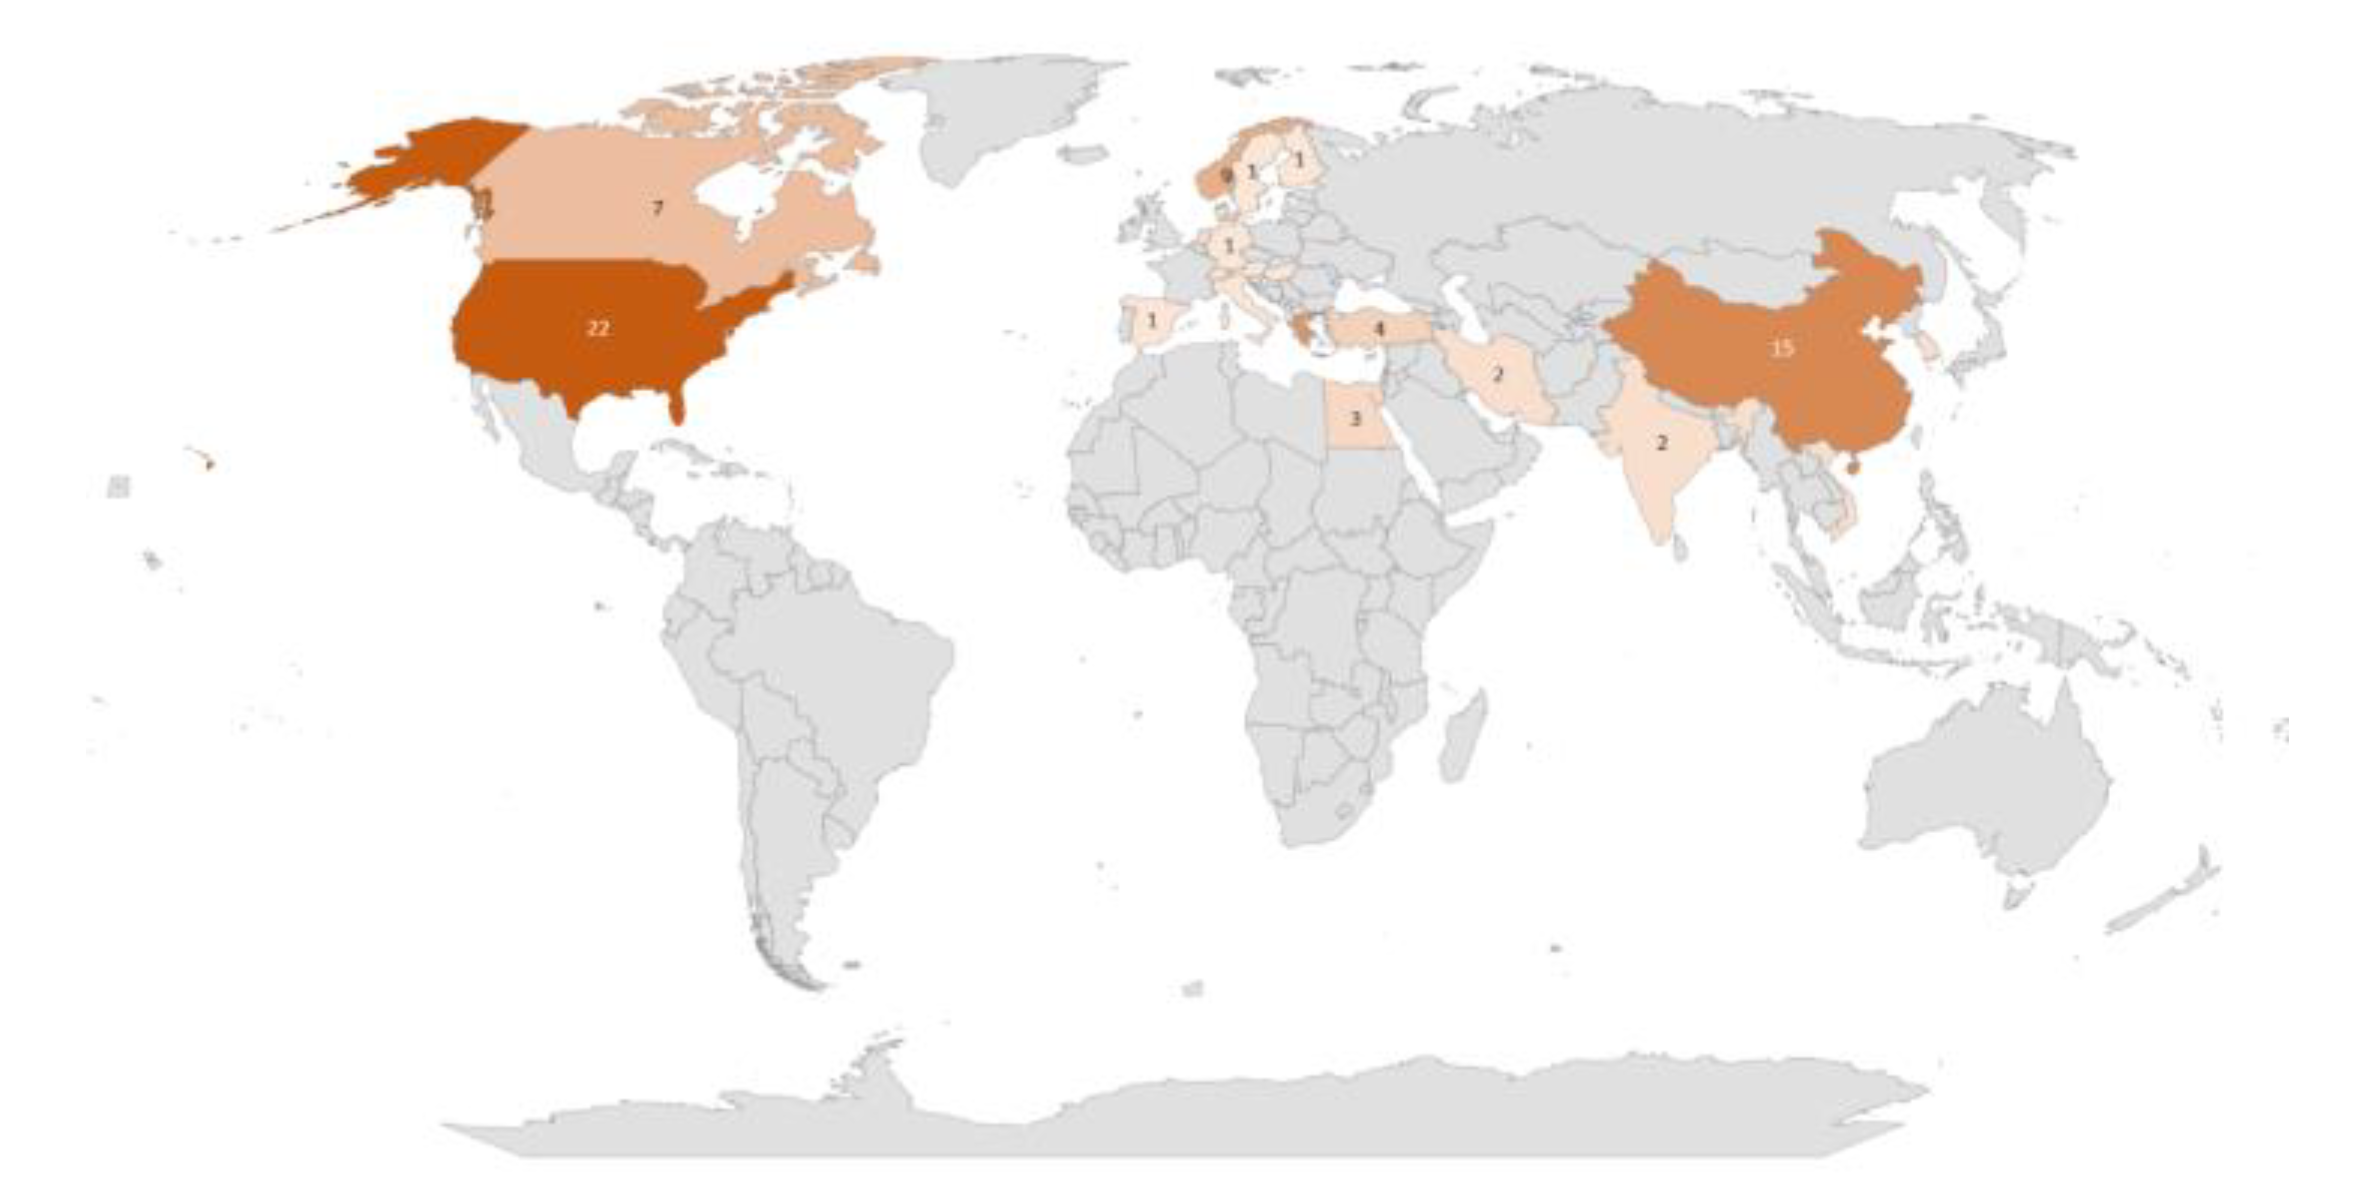
Over the past decade, the utilization of renewable energy sources (RES) has witnessed a significant acceleration in response to the escalating threats posed by global warming, the depletion of fossil fuel reservoirs, and the implementation of stricter environmental regulations in the global energy market and society [1]. Among all the available renewable energy options, solar energy and wind energy have emerged as the most economically viable sources, experiencing rapid growth on a global scale [2]. Figure 1 illustrates the global distribution of operational and under construction wind farms with capacities of 10 MW or more.
After experiencing a consecutive decline over the past two years, the capacity additions for onshore wind energy are projected to witness a remarkable recovery in 2023, with an anticipated increase of 70% to reach a historic milestone of 107 GW [3]. This resurgence can primarily be attributed to the successful completion of delayed projects in China that were affected by the Covid-19 restrictions imposed last year. Furthermore, accelerated expansion is also expected in Europe and the United States, as the challenges faced in the supply chain have caused project commissioning to be postponed from 2022 to 2023. Conversely, the growth of offshore wind energy is not projected to match the unprecedented expansion achieved two years ago, largely due to the limited number of projects currently under construction outside of China.
There are two primary types of wind turbines, categorized based on their rotor structure and position in airflow: horizontal axis wind turbines (HAWTs) and vertical axis wind turbines (VAWTs). HAWTs have gained significant popularity in the commercial electricity generation sector, owing to extensive research and development efforts over the years, due to their higher efficiency. The present review paper primarily examines HAWTs, which enjoy broader adoption and are commonly employed in wind farms.
The efficiency of a HAWT is influenced by numerous variables, including the wind speed during operation, the length of the blades, the height of the tower, the design of the casing, and the environmental conditions in the vicinity, including weather conditions, as well as collisions with birds and insects [5].
The aerodynamics of the blade significantly impacts the performance of a HAWT. Additionally, collisions with birds and insects can disrupt the blade’s aerodynamic profile, resulting in increased aerodynamic drag and a subsequent decrease in power generation of up to 50% [6,7,8]. Moreover, the accumulation of ice on the surface further impacts the HAWT’s performance, leading to a potential decrease in power generation ranging from 20% to 50% [6]. Under normal circumstances, the performance of a HAWT is closely linked to the wind speed profile at a specific site. Any variations in wind speed profiles have a substantial impact on turbine performance.
Power performance testing and Annual Energy Production (AEP) assessments depend on precise calculations of HAWT power curves. The presence of icing causes a decrease in the AEP by up to 17% and leads to a reduction in the power coefficient within the range of 20-50% [9]. Rainfall has the potential to induce erosion on the surfaces of HAWT blades, leading on an increase in in surface roughness, which eventually increases the aerodynamic drag of the blades [10,11,12,13,14,15]. Consequently, this leads to a decline in performance and a subsequent loss of energy [10,16]. It is worth noting that erosion on HAWT blades can result in AEP losses of up to 25% [17,18,19,20]. Moreover, the accumulation of dirt and insects on the blade surface can result in roughness, leading to a potential decrease of up to 50% in power output [6,21,22]. Increased surface roughness caused by erosion was examined in relation to its impact on the power output of HAWTs [23].
Hence, it is imperative to comprehensively examine all the variables influencing HAWT aerodynamic performance and discuss potential solutions. HAWTs offer a promising solution to address the growing demand for sustainable energy in the future, particularly the HAWT, which presents an appealing technology for harnessing wind energy and converting it into electricity or other useful forms. This review aims to enhance our understanding of the key parameters that must be considered during HAWT blade design and provides recommendations for future research areas. It serves as a valuable source of inspiration for researchers engaged in optimizing wind turbine performance, specifically focusing on aerodynamic improvements for HAWTs.

2. Aerodynamic performance of wind turbines

The blades of the wind turbine harness the kinetic energy of the incoming wind and convert it into mechanical energy stored in the shaft. The shaft is then linked to an electrical generator, which produces electricity. The power output of a wind turbine is determined by the speed of the incoming wind, the size of the turbine, and the area it sweeps. The maximum amount of kinetic energy extractable from the wind is approximately 59.3% of the total available wind power, according to the Betz limit [24]. The power generated by a wind turbine (P) is in direct proportion to the density of the air (ρ), the rotor sweep area (A), the cube of the wind velocity (u), and the aerodynamic coefficient ( C p ) by equation 1 [25].
P = 1 2 ρ A u 3 C p
The maximum aerodynamic coefficient ( C p m a x ) for HAWTs can be calculated by the empirical equation (2), proposed by Wilson et al. [26]:
c p m a x = 16 27 λ λ + 1.32 + λ 8 20 2 Β 2 / 3 1 0.57 ̇ · λ 2 c L c D · λ + 1 2 Β
where λ is the tip speed ratio, ranging from 4 to 20, Β is the number of blades and c L and c D are the aerodynamic coefficients of lift and drag, respectively. It is apparent that the generated power of HAWTs depends on the airfoils, from which the blades are constructed. Thus, any changes in the flow field could lead to changes in the aerodynamic performance of the airfoils, and finally impact the power production of HAWTs.

3. Aerodynamic performance of wind turbines under hazard environmental conditions

3.1. Icing

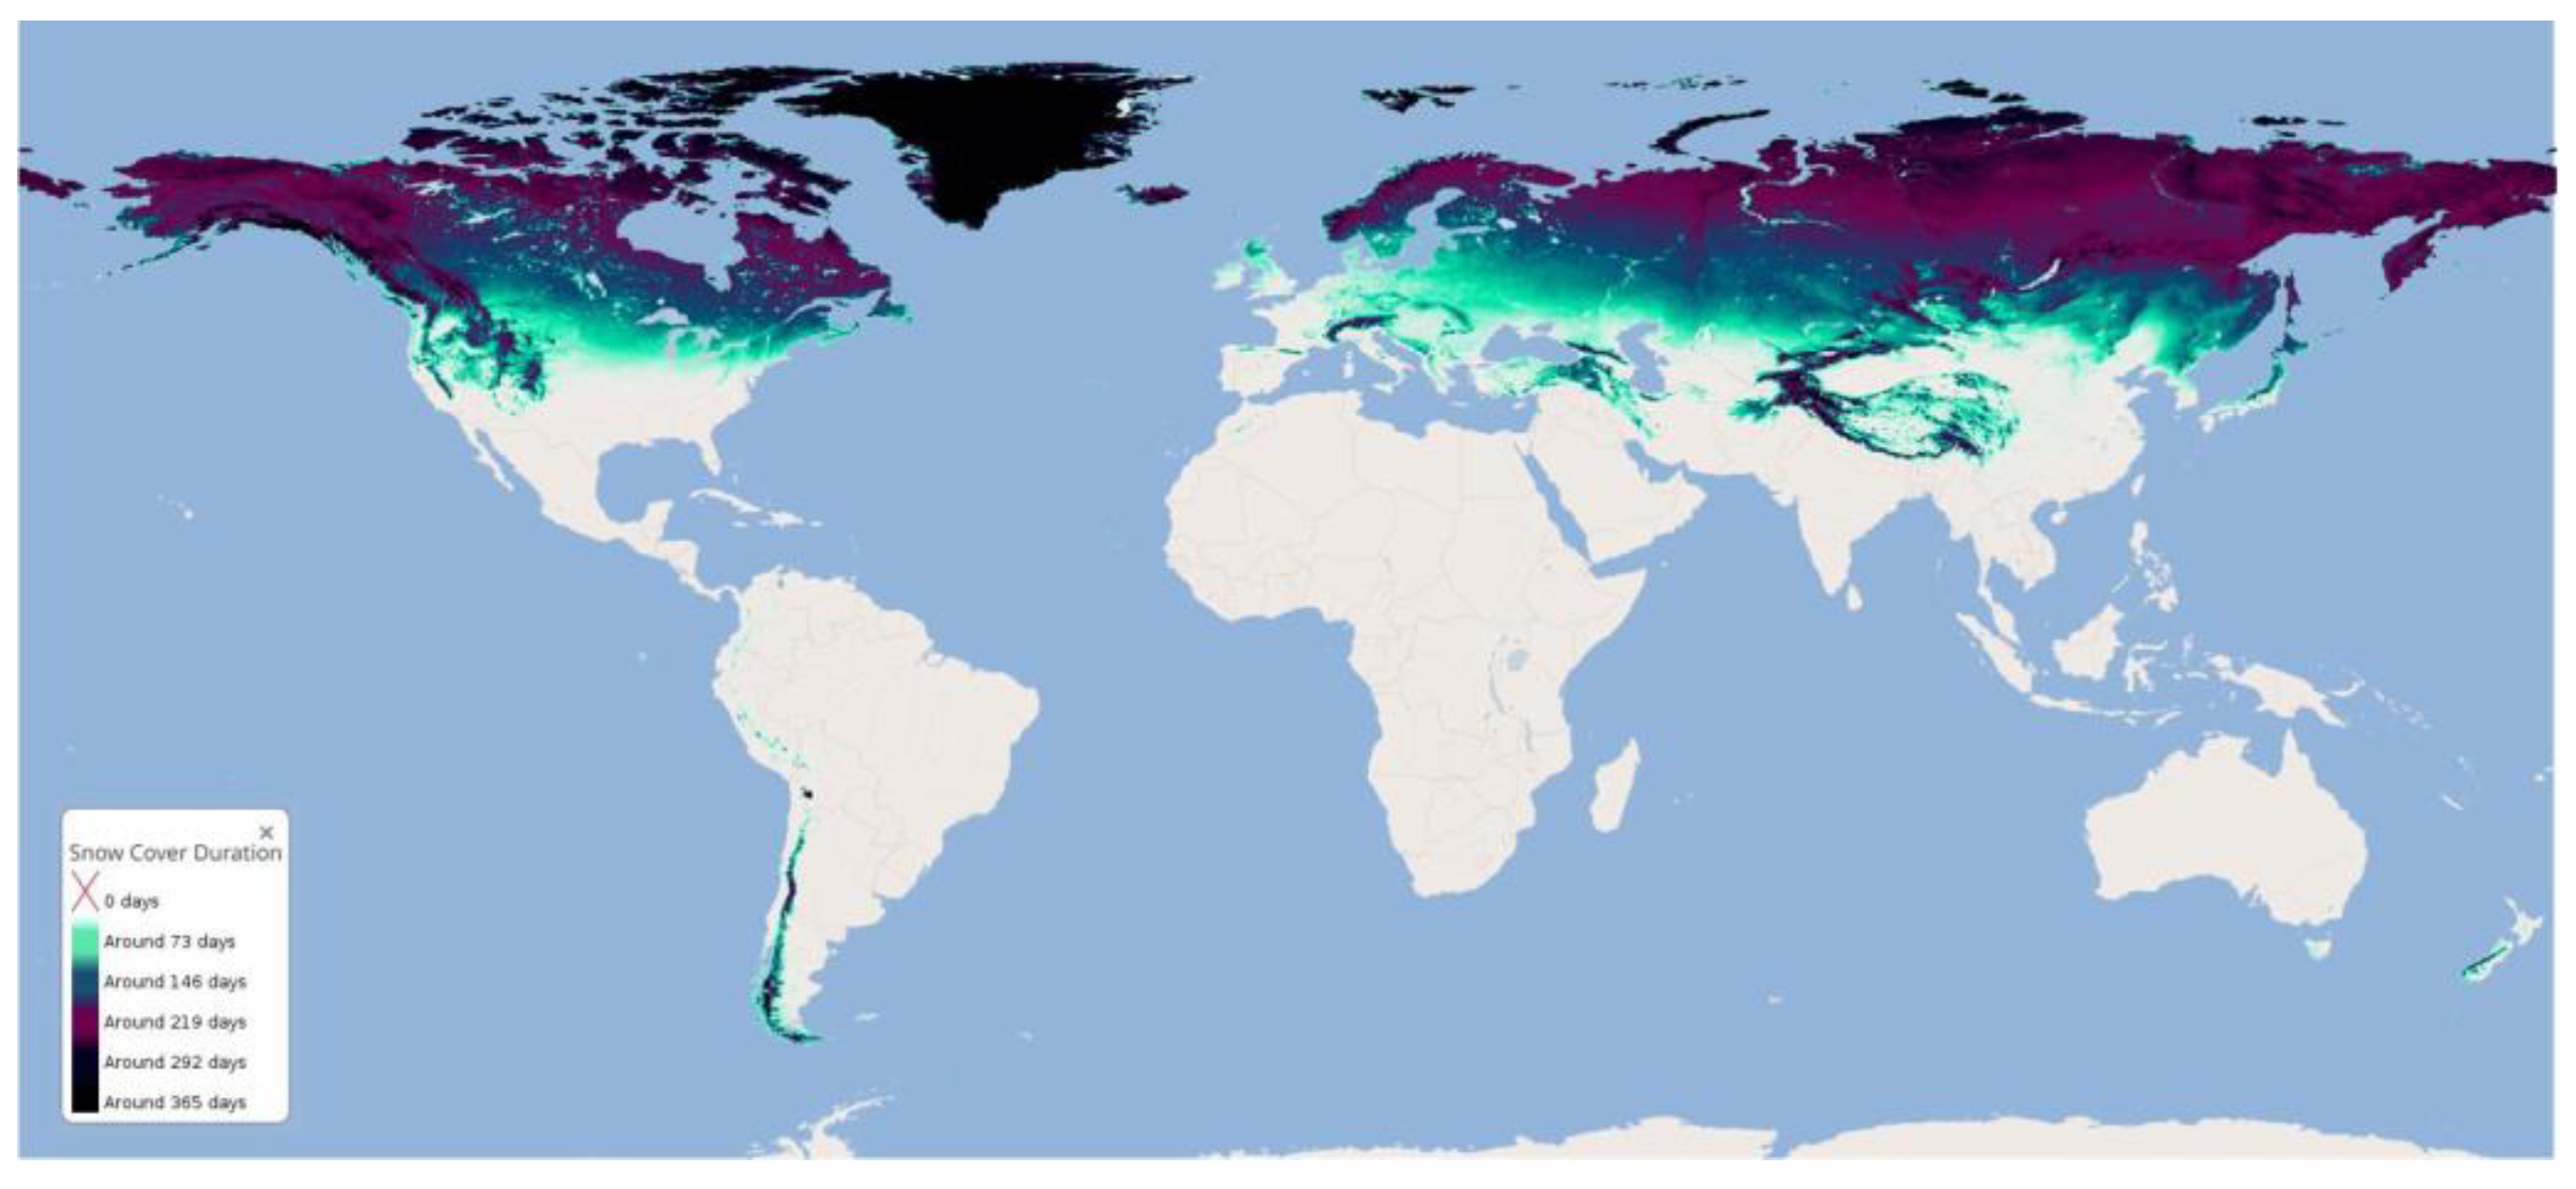
Many countries in cold climate regions already harness wind energy and will increasingly rely on it due to their favorable abundant wind resources. These regions offer a naturally advantageous environment for wind energy utilization. To ensure optimal power production, wind turbine manufacturers, including airfoil designers for turbine blades, must account for the challenging conditions caused by atmospheric icing events. Wind farms located in cold regions with higher altitudes are particularly promising, as wind speeds tend to increase by approximately 0.1 m·s−1 for every 100 m of altitude over the initial 1000 m [27]. Additionally, colder regions benefit from a wind power potential approximately 10% greater than other areas, thanks to their higher air density. The denser cold air boosts the kinetic energy of the wind, resulting in increased power generation for HAWTs [28]. Figure 2 shows the mean snow cover duration obtained from the last 23 years on an annual basis.
In cold climate regions, icing is a physical phenomenon that significantly impacts the performance of HAWTs and poses a significant challenge. There are two primary types of ice formation: glaze ice and rime ice [21]. Glaze ice forms when rain freezes on cold surfaces and typically occurs near 0°C. It appears transparent and spreads as ice sheets over large areas. On the other hand, rime ice develops when supercooled moisture droplets in the air come into contact with a cold surface. Rime ice accumulates in temperatures below 0°C. The presence of ice on aerodynamic surfaces negatively impacts turbine performance and can lead to sensor failures or inaccurate readings on anemometers and wind vanes. Moreover, ice buildup can lead to rotor imbalances, impaired aerodynamic brakes, power line disruptions, and pose a risk of falling ice hazards to personnel [21].
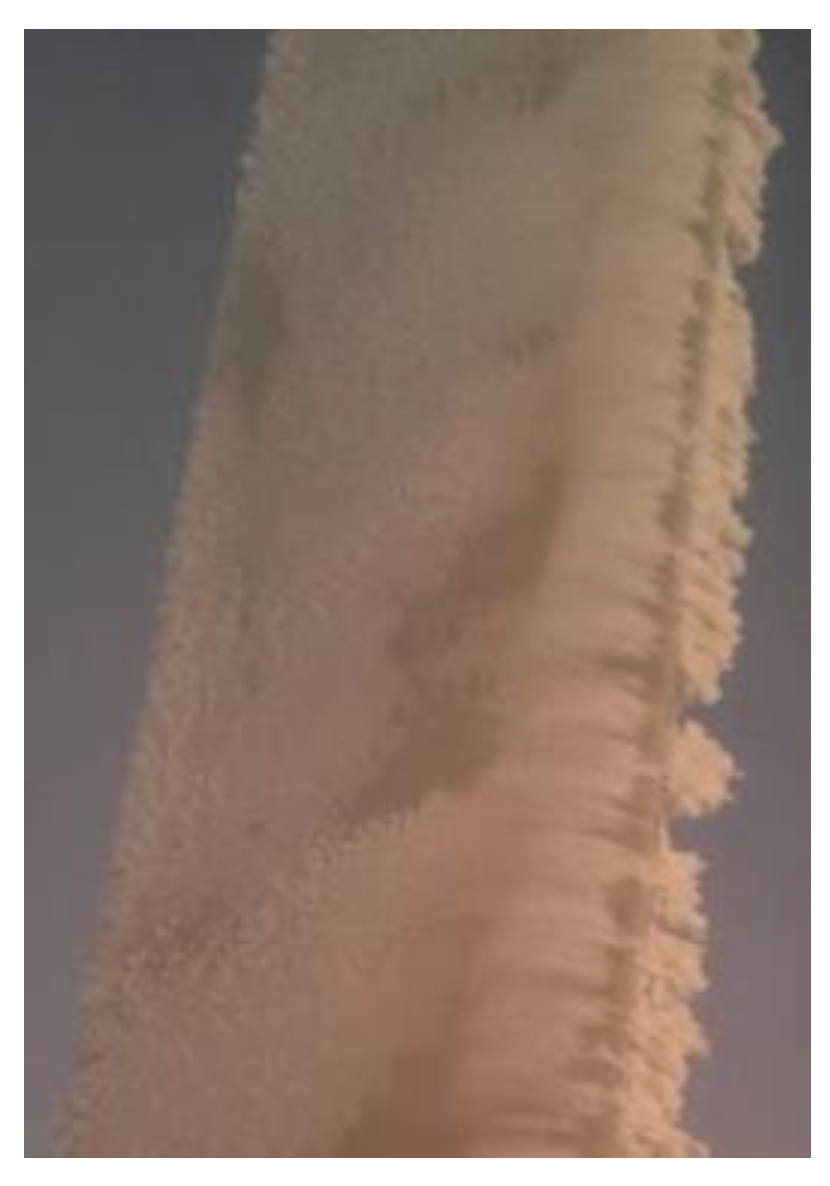
Ice accretion on wind turbines (Figure 3) can have a significant impact on aerodynamic performance and power production. It has been observed that ice growth is influenced by changes in blade design, such as size and profile, as well as the relative velocity at each section of the blade. Various software codes have been developed to simulate and predict ice accretion on different surfaces.
  • LEWICE is a 2-D ice accretion code created by NASA Glenn Research Center [31]. It utilizes a time-stepping procedure to forecast the shape of ice accretion. The flow field calculations are performed using the Douglas Hess-Smith 2-D panel code. The obtained solution is then used to determine particle trajectories and the points at which they impinge on the object. Additionally, LEWICE incorporates an icing model to estimate the rate and shape of ice growth.
  • Turbine Blade Icing Model (TURBICE) is a two-dimensional simulation program specifically designed to anticipate ice accretion on HAWT blades [32,33]. It employs panel methods to calculate the potential flow field around the blade and utilizes a Lagrangian technique for droplet trajectories and impingement calculations. TURBICE can also estimate the amount of energy required for heating to prevent ice accretion on the blade surface.
  • FENSAP ICE represents a premier 3-D in-flight icing simulation solver [34,35]. It simulates the flow field, droplet impingements, ice shapes, and predicts anti/de-icing heat loads. FENSAP ICE incorporates built-in computational fluid dynamics (CFD) modules to perform these calculations. The software employs 3D Navier-Stokes and energy equations for flow field calculations, along with a 3-D Eulerian model for droplet calculations.
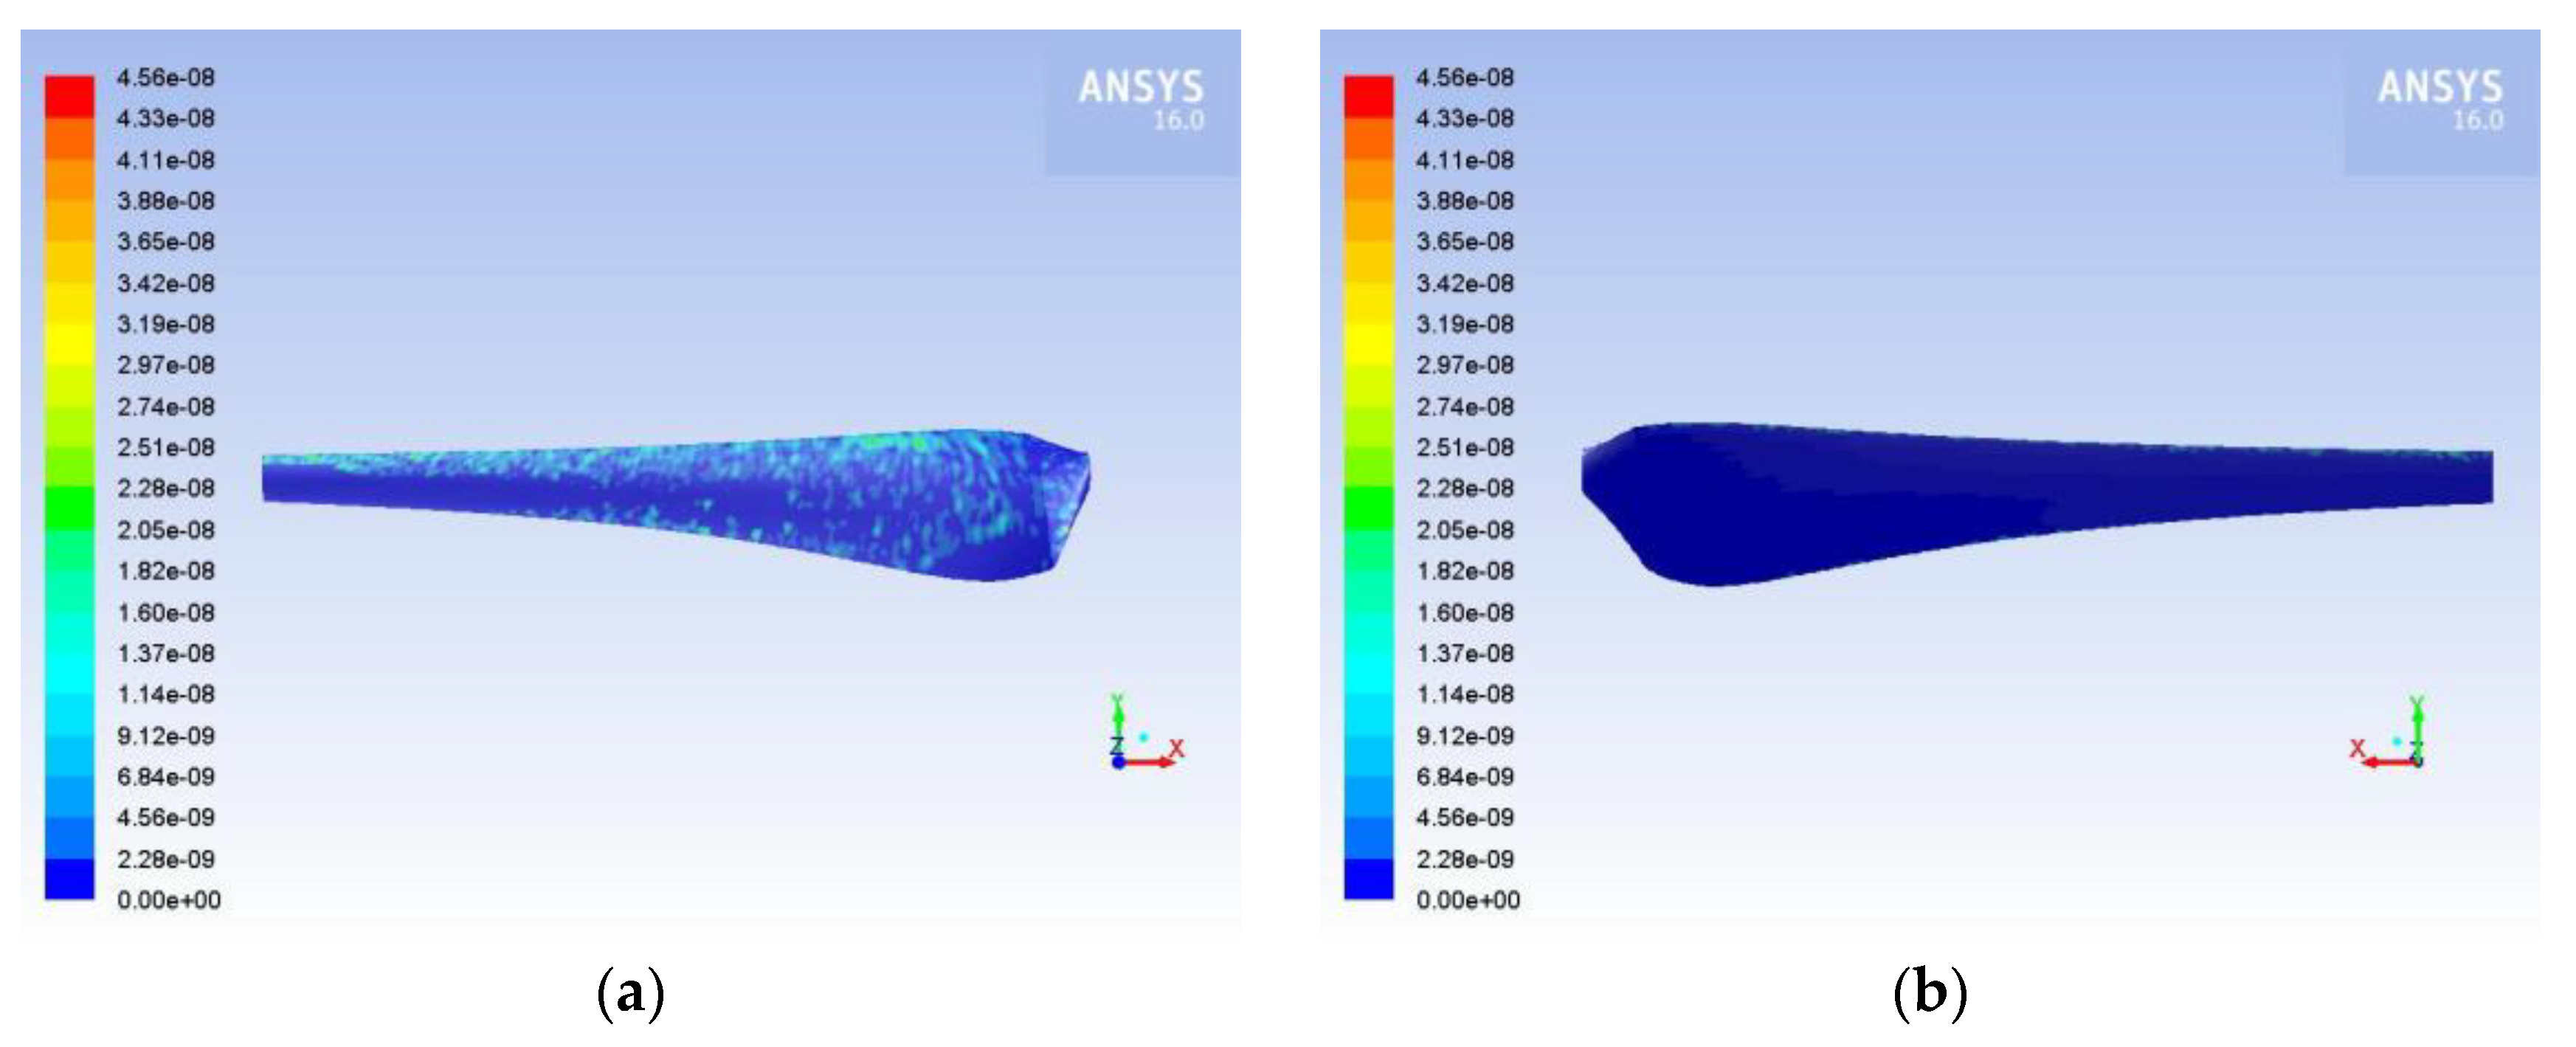
Limited efforts have been undertaken to incorporate rotational effects when simulating the 3D model of an entire HAWT blade at full scale [36,37,38]. The buildup of ice on the blades (Figure 4) affects both the aerodynamic efficiency and safety. Icing can increase blade mass, alter the aerodynamic profile shape, cause abnormal tower vibrations, decrease torque, and result in power output losses [39,40]. Even minor icing roughness on the blade surface can lead to a decrease in power output, while a severe icing event has the potential to result in a complete turbine shutdown [41]. Pinar Pérez et al. [42] found out that a wind farm consisting of 517 HAWTs experienced a 3% reduction in production as a result of blade icing, over a period of 29 months. On the other hand, ice accumulation can lead to an increase in power output by altering the blade profile [41].
Icing poses a critical challenge for HAWTs operating in cold environments, as it is impacted by multiple fluctuating factors. The accumulation of ice on the airfoils of turbine blades results in a significant reduction in aerodynamic performance, ultimately leading to a loss in productivity. This ice accretion causes deformation in the airfoil’s geometry, leading to pronounced turbulence, especially on the suction side of the airfoil when exposed to high angles of attack. Employing modeling and simulation techniques is essential for assessing the impact of icing on HAWT operations and enhancing our comprehension of this phenomenon [44].
During the winter of 1990-1991, Bose [45] monitored closely the natural icing occurrences of a HAWT with a diameter of 1.05m, designed for battery charging. The most severe icing events were observed as glaze ice accretion, which formed due to freezing rain and drizzle. The icing process exhibited a qualitatively similar pattern at the leading edge of the blade section, resembling the formation observed on fixed airfoil sections under comparable conditions in icing wind tunnels. The rotational motion of the blades contributed to a greater accumulation of ice at the blade tips compared to the blade roots. While the pressure side of the sections was covered in ice, a significant portion of the suction side remained free of ice.
A large and growing body of literature has investigated the ice formation process on airfoils and HAWT blades [46,47,48,49,50,51,52]. The accumulation of ice on HAWT blades is influenced by a combination of operating factors such as temperature, velocity, mean volume diameter (MVD), and liquid water content (LWC), as well as geometric characteristics including size and shape. Varied temperatures and heat distribution across the HAWT blades will lead to the formation of ice with differing masses and shapes.
Seifert and Richert [53] conducted an experimental investigation on a typical airfoil used in HAWT blades, specifically the NACA 4415 airfoil. The study examined the aerodynamic coefficients of the airfoil with and without various types of ice formations at the leading edge. The aerodynamic degradation was more severe when more ice was accumulated on the leading edge. The aerodynamic data obtained from the iced airfoil were utilized as input for load and power calculation codes, and the energy loss was predicted for a typical 300 kW turbine, revealing a 6% to 19% decrease in the AEP, depending on the ice formation, after three months of operation.
Jasinski et al. [54] conducted a study to estimate the impact of rime ice on the performance of HAWTs. They used the NASA LEWICE code to predict four rime ice formations on the S809 airfoil, used for HAWT blades construction, in conditions of usual supercooled fog, prevalent in cold northern regions. Wind tunnel tests were performed on the resulting airfoil/ice profiles to analyze aerodynamic characteristics of lift, drag, and pitching moment at Reynolds numbers ranging from 1 to 2 million. The obtained data were then input into the PROPID HAWT performance prediction code to evaluate the effects of rime ice on a 450-kW rated-power, 28.7-m diameter turbine operating in both stall-regulated and variable-speed/variable-pitch modes. The variable-speed/variable-pitch rotor showed performance losses of approximately 20%. On the other hand, for the stall-regulated rotor, even a relatively small rime ice formation led to significantly larger performance losses.
Hochart et al. [55] studied experimentally the NACA 63 415 airfoil under two in-fog icing condition. The measurements encompassed the shapes and masses of the ice deposits, alongside the lift and drag forces exerted on the ice-covered profiles. During the wet regime testing, glaze primarily developed near the leading edge and on the pressure side, while also accumulating through run-off on the trailing edge of the outer half of the blade. In the dry-regime testing, rime predominantly accreted on the leading edge and formed horns. In both icing events, the presence of glaze or rime on the blade profile resulted in reduced lift of 40% and increased drag, of about 365% for glaze and 250% for rime ice.
Zhao et al. [56] investigated the fault mechanism of HAWT blade icing through theoretical and experimental analysis. Initially, the aerodynamic performance of S830 airfoil was simulated under normal and icing conditions. The simulation results indicated that the irregular icing coverage significantly alters the airfoil’s aerodynamics, leading to a decrease in lift coefficient and an increase in drag coefficient, consequently resulting in a direct reduction of power output. Furthermore, icing-induced mass unbalance generated an exciting force causing power frequency vibrations in the HAWT. They concluded that icing can be detected either directly or indirectly, with decreases in power output and power frequency vibrations serving as evidence of the presence of icing or similar conditions.
Homola et al. [57] conducted a numerical study to investigate the impact of variations in atmospheric temperature and droplet size on the rate and morphology of ice accretion, as well as the resulting flow field characteristics, for a 5 MW pitch controlled HAWT with blades constructed by NACA 64-618 airfoil. The findings indicated that while icing leads to a reduction in lift coefficients across all scenarios, the extent of this reduction varied. Specifically, the cases yielding streamlined ice shapes resembling rime ice exhibited minimal changes in lift, whereas those resulting in horn-shaped glazed ice experienced more significant reductions in lift. These results underscore the necessity of obtaining accurate measurements of the atmospheric conditions during icing events to reliably estimate energy production losses, considering the specific shape and type of ice accretion.
Villalpando et al. [58] examined the influence of ice accretion on the aerodynamic coefficients of a HAWT airfoil. CFD simulations were performed at different angles of attack, considering both NACA 63-415 clean airfoil and the same airfoil with ice accumulation. The presence of ice on the airfoil significantly alters the pressure distribution (Cp). Notably, it increases the minimum Cp value, thereby diminishing the suction effect on the suction side of the airfoil. As pressure forces are the primary contributors to lift and drag coefficients, the aerodynamic performance experiences notable effects, resulting in reduced lift and increased drag.
Turkia et al. [30] simulated the impact of icing on power production for a typical 3 MW HAWT. Three different rime ice cases were simulated, representing various phases of an icing event: the beginning of icing, a short icing event, and a prolonged icing event. The simulations utilized the in-house code TURBICE to model the accretion of ice masses on HAWT blades. The findings revealed a significant influence of small-scale surface roughness on power production. During the initial stages of an icing event, power production was observed to decrease by approximately 17% below rated wind speeds compared to the scenario without ice. With the accumulation of greater ice masses, the reduction in production reached 18% for the short icing event and 24% for the prolonged icing event.
Hudecz et al. [59] conducted experimental and numerical analyses investigate the impact of glaze, rime, and mixed ice accretion on a NACA 64-618 airfoil at a 7° angle of attack. The experiments were carried out in a controlled climatic wind tunnel, while the numerical analyses employed the TURBICE ice accretion model. It was observed that the lift coefficient decreased, and the drag coefficient increased as ice accreted. These effects exhibited a nearly linear relationship. Mixed ice formation resulted in the most significant reduction in lift coefficient, while rime ice led to the least reduction. They also concluded that a noticeable decrease in lift and subsequent loss in power production can be experienced within the initial hour of ice accretion.
Hu et al. [60] investigated the ice distribution and load response of various components using the NREL Phase VI HAWT. The study primarily focused on exploring the impact of different parameters on ice distribution, considering the size of dispersed water droplets. The results indicate a linear increase in both ice mass and ice thickness from the blade root to the blade tip. Furthermore, it was observed that both asymmetric icing and symmetric icing lead to a reduction in rotor thrust force, and the blade root moments. In the case of the low-speed shaft, asymmetric icing can introduce an additional imbalance shear force. The resulting asymmetric load can elevate the fatigue damage of the blade by up to 97.6% and that of the tower by up to 70.8%.
Virk et al. [61] simulated the profiles of blade icing for four HAWTs of different sizes. The findings suggest that larger HAWTs experience less severe dry rime icing in terms of both local ice mass and ice thickness. A notable alteration in flow behavior and aerodynamic performance is observed when comparing clean and iced profiles. Moreover, it is determined that the decrease in torque is more pronounced for the smaller HAWT, providing further evidence to support the hypothesis that dry rime icing has a lesser impact on larger HAWTs compared to smaller ones.
Han et al. [62] conducted CFD simulations, utilizing the dispersed multiphase (DMP) droplet model, to anticipate the development of ice along the leading edge of a blade tip airfoil. Once verified, their model was utilized to forecast ice formation along the leading edge of the NACA 64-618 airfoil and predict its aerodynamic behavior under varying environmental conditions. The BLADED software was utilized to conduct steady power computations for the NREL 5-MW HAWT. The modifications in the shape of the airfoil’s leading edge due to ice formation resulted in a 37% reduction in lift coefficient and a 550% increase in drag coefficient. The findings also revealed that the presence of ice on the leading edge of the blade tip airfoil led to an approximate decrease of 8-29% in HAWT performance.
Ibrahim et al. [43] investigated numerically the forecasting of ice loads on an 80% span HAWT blade section. Simulations of air flow, droplet impingement, and ice accretion using the FENSAP ICE software were conducted. The analysis focuses on assessing the impact of varying low and high liquid water content (LWC) conditions on blade thickness. Moreover, it examines all NREL airfoil families commonly utilized in HAWTs to analyze the influence of blade design on ice accretion. The degradation in aerodynamic characteristics resulting from ice formation was found to be 10%-65% in the lift coefficient, a value significantly influenced by the specific shape of the accumulated ice.
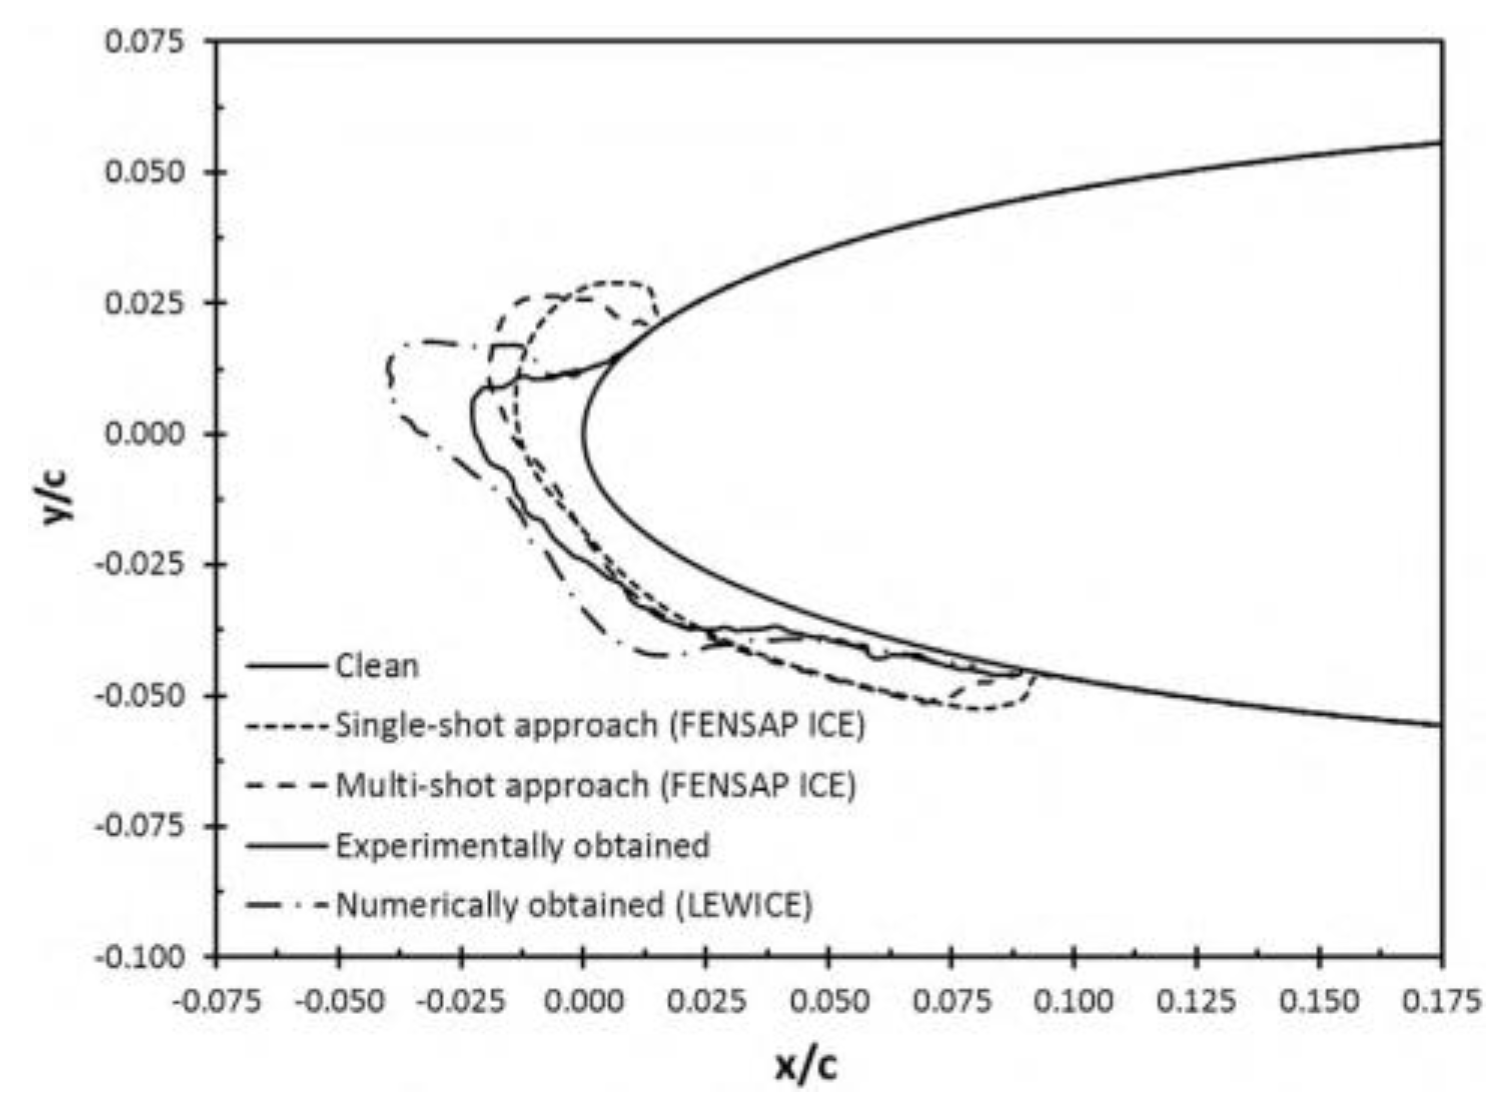
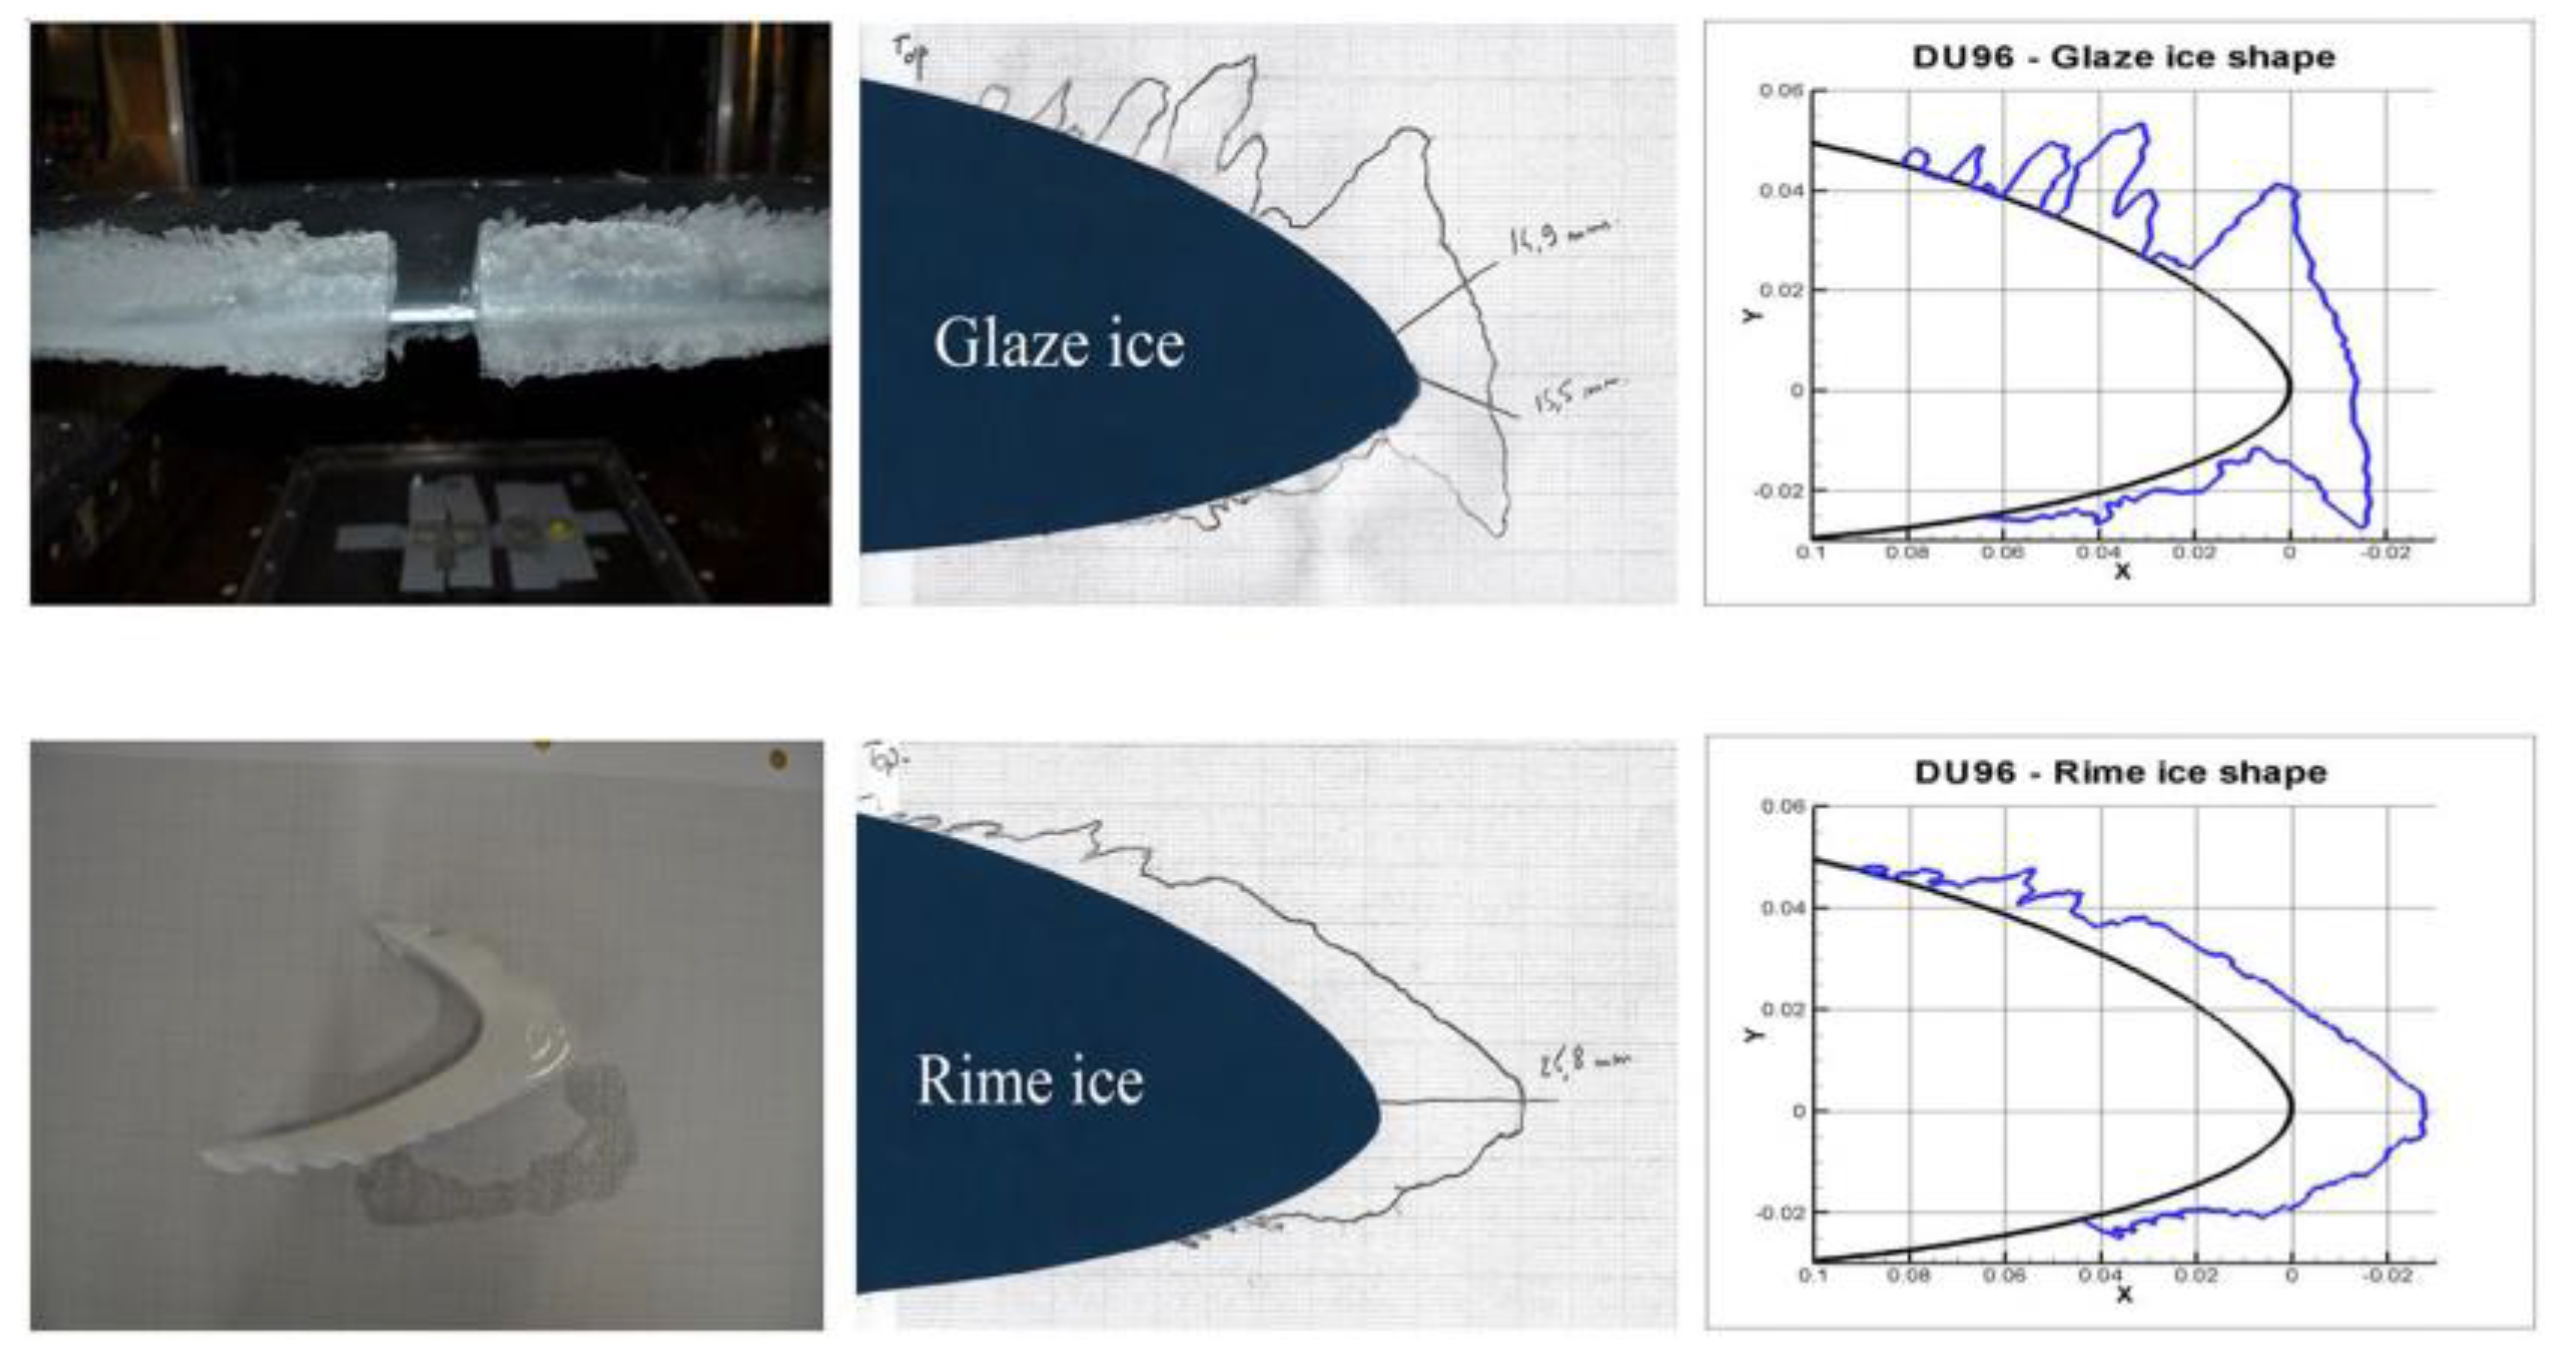
Jin and Virk investigated numerically the phenomenon of ice accretion on HAWT blades, focusing on both symmetric and asymmetric airfoils, NACA 0012 and NACA 23012 [63], DU96-W-180 airfoil [64] and S826 and S832 airfoils [65]. The findings indicate that the shape and dimensions of the airfoil have a notable influence on the rate and morphology of ice accretion. Specifically, streamlined ice formations were observed on the symmetric airfoil, contrasting with the structures formed on the asymmetric airfoil. In the presence of glaze ice conditions, more complex ice formations can be observed, which have a distinct impact on the aerodynamic performance compared to rime ice conditions (Figure 5). The analysis reveals a greater deterioration in aerodynamic performance under glaze ice conditions, particularly at higher angles of attack. Moreover, the S832 airfoil experienced greater changes, particularly under wet ice conditions.
Yirtici et al. [66,67] developed an ice accretion prediction tool, based on the Blade Element Momentum (BEM) method and the Extended Messinger model, to forecast ice formations on HAWT blades and the resulting power production losses. In their next study [68], they simulated the operation of a 30 kW HAWT in different icing conditions and predicted a power loss of approximately 20% during an hour-long exposure to icing conditions.
Gao et al. [69] investigated experimentally the deterioration of aerodynamic performance of HAWT blades, constructed by the DU91-W2-250 airfoil, caused by the dynamic process of ice accretion. During the ice accretion experiment, it was observed that ice structures formed rapidly on both the upper and lower surfaces of the blade model. These irregular-shaped ice formations significantly disrupted the airflow around the blade, resulting in extensive flow separations and the shedding of unsteady vortex structures from the ice-covered surface. The aerodynamic performance of the blade model experienced a substantial degradation as a result. The extent of performance deterioration due to ice accretion was found to strongly depend on the angle of attack of the blade model, with more pronounced degradations occurring at lower angles of attack. In the case of a 5.0° angle of attack, the lift force decreased to approximately 12% of its initial value after 10 min of the ice accretion experiment, while the drag force correspondingly increased by a factor of 4.5.
Jiang and Qiu [70] simulated the impact of icing on both the aerodynamic performance of NACA 0012 airfoil and the power efficiency of HAWTs. They found that icing significantly influences the airflow surrounding the airfoil, resulting in premature appearance of flow separation vortex. Consequently, the lift coefficient decreases, while the drag coefficient increases. Notably, clear ice exhibits a more detrimental effect on the airfoil compared to frost ice. Furthermore, ice accretion on the airfoil causes a drop in the power curve, with a stall occurring near the rated wind speed. By analysis of the daily power generation of the HAWT, it is determined that icing can lead to a power generation loss of up to 4.8%.
Martini et al. [71] studied ice formation on NACA 64-618 airfoil and estimated aerodynamic losses due to icing. Two turbulence models were used, Spalart–Allmaras and k- ω SST, and the impact of surface roughness was also examined. The results matched experimental data for both clean and iced airfoils, showing increased drag and decreased lift on the iced airfoil. Both turbulence models worked well for the clean airfoil, but the k- ω SST model performed better for the iced airfoil. The Spalart–Allmaras model had limitations at high angles of attack but was suitable for low angles. Surface roughness significantly affected ice growth and should be considered to estimate icing effects on aerodynamic performance.
Chitransh and Kaur [72] predicted ice formation and acceleration on NACA 4412 airfoil by the help of a numerical solution. The Extended Messinger method was employed to detect ice deposition, while various parameters relevant to HAWT analysis are also calculated. The simulation reveals that ice deposition on the airfoil has a significant impact on power generation by altering the airfoil’s shape. The findings indicate a considerable decrease in the lift coefficient and an increase in the drag coefficient.
Rotich and Kollár [73] examined the influence of ice accretion on the aerodynamic behavior of a NACA 2412 airfoil under various environmental conditions. The lift and drag coefficients for the iced airfoil were calculated, considering different liquid water contents (LWCs), angles of attack and accretion time. The results demonstrated that the lift-to-drag ratio is highest shortly after ice begins to accumulate for angles of attack up to 10°, but significantly decreases with longer accretion times.
Yang et al. [74] analyzed the impact of blade rime icing on a 5 MW offshore floating HAWT with blades constructed by NACA64_A17, DU21_A17 and DU25_A17 airfoils, by using CFD. Results showed concentrated icing on the NACA64_A17 airfoil’s tip. Changes in wind speed had some influence on icing, while temperature had minimal effect. Iced airfoil geometry had little impact on lift coefficient (-34%) but significantly increased drag coefficient (36%-200%). Power production decreased by about 17% with iced airfoils compared to clean ones.
Table 1. Various airfoil types tested in bibliography for icing.
Author Investigation Method Airfoil Type Main Conclusions
Seifert and Richert [53] experimental NACA 4415 More ice on the leading edge led to worse aerodynamic performance.
AEP dropped by 6% to 19% for a 300 kW turbine.
Jasinski et al. [54] experimental S809 The rotor with variable speed and pitch had about a 20% decrease in performance.
numerical The stall-regulated rotor experienced higher performance losses even with a small amount of ice.
Hochart et al. [55] experimental NACA 63-415 Reduced lift by 40% in both icing events
Increased drag by 365% for glaze and 250% for rime ice.
Zhao et al. [56] theoretical S830 Icing creates an unbalanced mass, causing vibrations at the power frequency of HAWT.
experimental Decreased power output and power frequency vibrations are signs of icing.
Homola et al. [57] numerical NACA 64-618 Horn-shaped glazed ice had a more significant reduction of lift than streamlined rime ice.
Accurate measurement of atmospheric conditions during icing events is crucial to estimate energy production losses, considering ice shape and type.
Villalpando et al. [58] numerical NACA 63-415 The ice on the airfoil increases the minimum pressure coefficient value, reducing the suction effect on the airfoil.
Turkia et al. [30] numerical NACA 64-618 In the early stages of ice formation, power production decreased by about 17% below rated wind speed.
As more ice accumulated, the reduction increased to 18% for a short icing event and 24% for a prolonged one.
Hudecz et al. [59] experimental NACA 64-618 Mixed ice had the biggest impact on reducing lift, while rime ice had the smallest.
numerical Within the first hour of ice formation, there was a noticeable decrease in lift and a loss in power production.
Hu et al. [60] numerical S809 Ice mass and thickness increase linearly from the blade root to the blade tip.
Both asymmetric and symmetric icing reduce rotor thrust force and blade root moments.
Asymmetric icing on the low-speed shaft can cause an extra shear force imbalance.
This asymmetric load can increase blade fatigue damage by up to 97.6% and tower damage by up to 70.8%.
Virk et al. [61] numerical NACA 63-215 The decrease in torque is more significant for smaller turbines, supporting the hypothesis that dry rime icing affects them more than larger turbines.
NACA 63-417
NACA 63-416
Han et al. [62] numerical NACA 64-618 The airfoil’s shape changed due to ice, causing a 37% decrease in lift and a 550% increase in drag.
Ice on the blade tip’s leading edge reduced HAWT performance by about 8-29%.
Ibrahim et al. [43] numerical S809 Ice accumulation reduces lift coefficient by 10%-65%, depending on the ice shape.
Jin and Virk [63] numerical NACA 0012 The airfoil’s shape and dimensions affect ice formation.
NACA 23012 For the symmetric airfoil, streamlined ice formations were seen, while the asymmetric one had different structures.
Jin and Virk [64] DU96-W-180 Glaze ice led to more complex formations that affected aerodynamic performance more than rime ice.
Jin and Virk [65] S826 Aerodynamic performance deteriorated more with glaze ice, especially at higher angles of attack.
S832s The S832 airfoil showed significant changes, especially with wet ice.
Yirtici et al. [66] numerical NACA 64-618 Icing causes a power loss of 24%.
S809
Yirtici et al. [67] S809 The estimated quantities of rime and glaze ice, and the maximum ice thickness, exhibit variances ranging from 3% to 25% when compared to experimental data.
DU93-W210
Yirtici et al. [68] NACA 23012 During exposure to icing conditions for an hour, there is a reduction in power of around 20%.
NACA 0012
DU93-W210
Gao et al. [69] experimental DU91-W2-250 Ice formed quickly on the blade, disrupting airflow and causing flow separations and vortex shedding., negatively affecting the blade’s aerodynamic performance.
The degree of degradation depended on the blade’s angle of attack, with greater deterioration at lower angles.
At a 5.0° angle of attack, lift force decreased to about 12% of the initial value after 10 minutes, while drag force increased by a factor of 4.5.
Jiang and Qiu [70] numerical NACA 0012 Icing affects airflow around the airfoil, causing flow separation vortex.
Clear ice is more harmful than frost ice.
Icing can result in up to 4.8% power loss in HAWT.
Martini et al. [71] numerical NACA 64-618 Iced airfoils experienced higher drag and lower lift.
The k- ω SST model was more effective for the iced airfoil, while the Spalart–Allmaras model had limitations at high angles of attack but worked well at low angles.
Surface roughness played a significant role in ice growth and should be considered when estimating the effects of icing on aerodynamic performance.
Chitransh and Kaur [72] numerical NACA 4412 The presence of ice on the airfoil significantly affects power generation by modifying the shape of the airfoil.
Significant reduction in the lift coefficient and an increase in the drag coefficient.
Rotich and Kollár [73] numerical NACA 2412 The lift-to-drag ratio reaches its peak shortly after ice accumulation begins for angles of attack up to 10°.
The ratio decreases significantly as the accretion time becomes longer.
Yang et al. [74] numerical NACA64_A17 Ice concentrated more on NACA64_A17 airfoil’s tip.
DU21_A17 Icing reduced lift coefficient by 34% and increased drag coefficient up to 200%.
DU25_A17 HAWT power production decreased by 17% with icing.
Virk et al. [75] used CFD to analyze ice formation on NREL 5 MW HAWT blade. Different sections of the blade were tested under various ice conditions and atmospheric temperatures. Results showed that ice formation was less severe near the blade root, where the blade is larger and thicker. Ice growth varied along the blade, with more ice near the tip. Barber et al. [76] examined experimentally and computationally the ice formation effects on HAWT performance. Results show that ice at high altitudes (2,330 m) can reduce power coefficient by up to 22% and AEP by up to 2%, while extreme icing conditions can lead to 17% AEP losses. Icing at the blade tip region (95-100% span) has the strongest impact and icing at high altitudes has less impact than at lower altitudes on AEP.
Homola et al. [77] modeled ice accretion on NREL 5 MW HAWT blade, by using a CFD solver. The calculated power curve changes due to icing were compared with observed changes in power production for a similar turbine operating under icing conditions. The model showed a 27% decrease in power production for wind speeds ranging from 7m·s-1 to 11m·s-1. These effects were less severe than the observed HAWT, possibly due to a shorter icing event in the model. Their results indicate that modeling can be useful for estimating icing effects and exploring ways to reduce them. In a follow study, they suggested [78] that modifying the turbine controller could enhance power production when operating with iced blades.
Dimitrova et al. [79] employed the numerical model PROICET in a HAWT to determine the aerodynamic performance degradation, and the energy and power losses, incurred due to light icing. The findings indicate a general deterioration in aerodynamic performance, with lift coefficient losses not surpassing 30% and an increase in drag coefficient up to 140%. The aerodynamic performance degradation during light icing precipitation resulted in 3.4% power losses and less than 1% on AEP losses.
In their research, Lamraoui et al. [80] identified the presence of glaze and rime ice on the blade to identify the areas responsible for significant power reduction. The distribution of power production and the characteristics of the accreted ice are inconsistent along the blade. Under icing conditions, the outer section of the blade, starting from the radial position r/R=0.8, significantly affects the blade’s aerodynamics. The distribution of the freezing fraction is not uniform; rime ice forms near the root and transitions to glaze ice toward the blade’s tip. Their study considers four values of liquid water content, defining five classes of icing severity and the major power reduction is found to be situated at r/R ~ [0.93 0.96] and the maximum power reduction reaches 40%. Regarding power loss, it is observed that locally, the shape of the ice has a more significant impact than its thickness. However, when considering the entire blade, power degradation is mainly influenced by the ice thickness, irrespective of the ice type.
Etemaddar et al. [81] studied the impact of eight atmospheric and system parameters on the patterns of ice accretion on a NACA 64-618 airfoil, using the 2D ice accumulation software LEWICE. Among the system parameters, relative wind speed and blade thickness, along with environmental parameters such as liquid water content (LWC) and median volume diameter (MVD), are identified as key factors influencing HAWT icing. Through aerodynamic analysis of an iced rotor, it is observed that within the linear region of the lift curve, icing-induced performance degradation primarily stems from an increase in the drag coefficient, as the lift curve undergoes minimal alteration in this particular region. At high angles of attack, the discrepancies between the lift coefficients of iced and clean rotors intensify, while the discrepancies in drag coefficients diminish.
Myong [82] employed computational methods to examine the effects of atmospheric icing on the aerodynamics of HAWT blades and also explored the similarities and differences between atmospheric icing on HAWTs and in-flight icing on aircraft. Although certain distinctions exist, such as turbulent shear boundary layers and iced areas other than the leading edge, many characteristics of aircraft icing can be applied to atmospheric icing on HAWTs. Their findings illustrate that the thickness of ice accumulation increases from the blade root to the tip, and icing conditions, such as relative wind velocity, significantly influence the shape of the ice buildup. Furthermore, they concluded that ice on the blade surface can cause a substantial reduction in power coefficients across all tip speed ratios.
Reid et al. [83] presented a numerical analysis of the performance degradation of NREL phase VI rotor operating under icing conditions. By utilizing FENSAP-ICE, simulations were conducted to examine airflow, water impingement, and ice accretion. The investigation focused on four different icing conditions, revealing power losses exceeding 60% in certain cases. Simulations with rime ice conditions exhibited lower power losses than those with glaze ice conditions. The glaze ice shape formed at the largest droplet diameter resulted in the most significant performance degradation, attributed to greater ice thickness and an enlarged contaminated area.
Shu et al. [84] studied experimentally the characteristics and performance of a small HAWT and created a three-dimensional model of a HAWT covered in glaze ice for simulation purposes. The findings indicate that the presence of ice considerably diminishes the rotational speed and power output of the turbine. The rate of ice accretion initially increases but then declines over time. Ice accumulates predominantly at the leading edge, gradually increasing from the root to the tip of the turbine. As the rotational speed decreases, the area covered by ice shifts toward the pressure side. Although higher wind velocity and lower temperature deteriorate the impact of ice, they do not alter its shape. Notably, the impact of ice load appears to have a greater influence on the rotor performance of small HAWTs than the deterioration of aerodynamic characteristics.
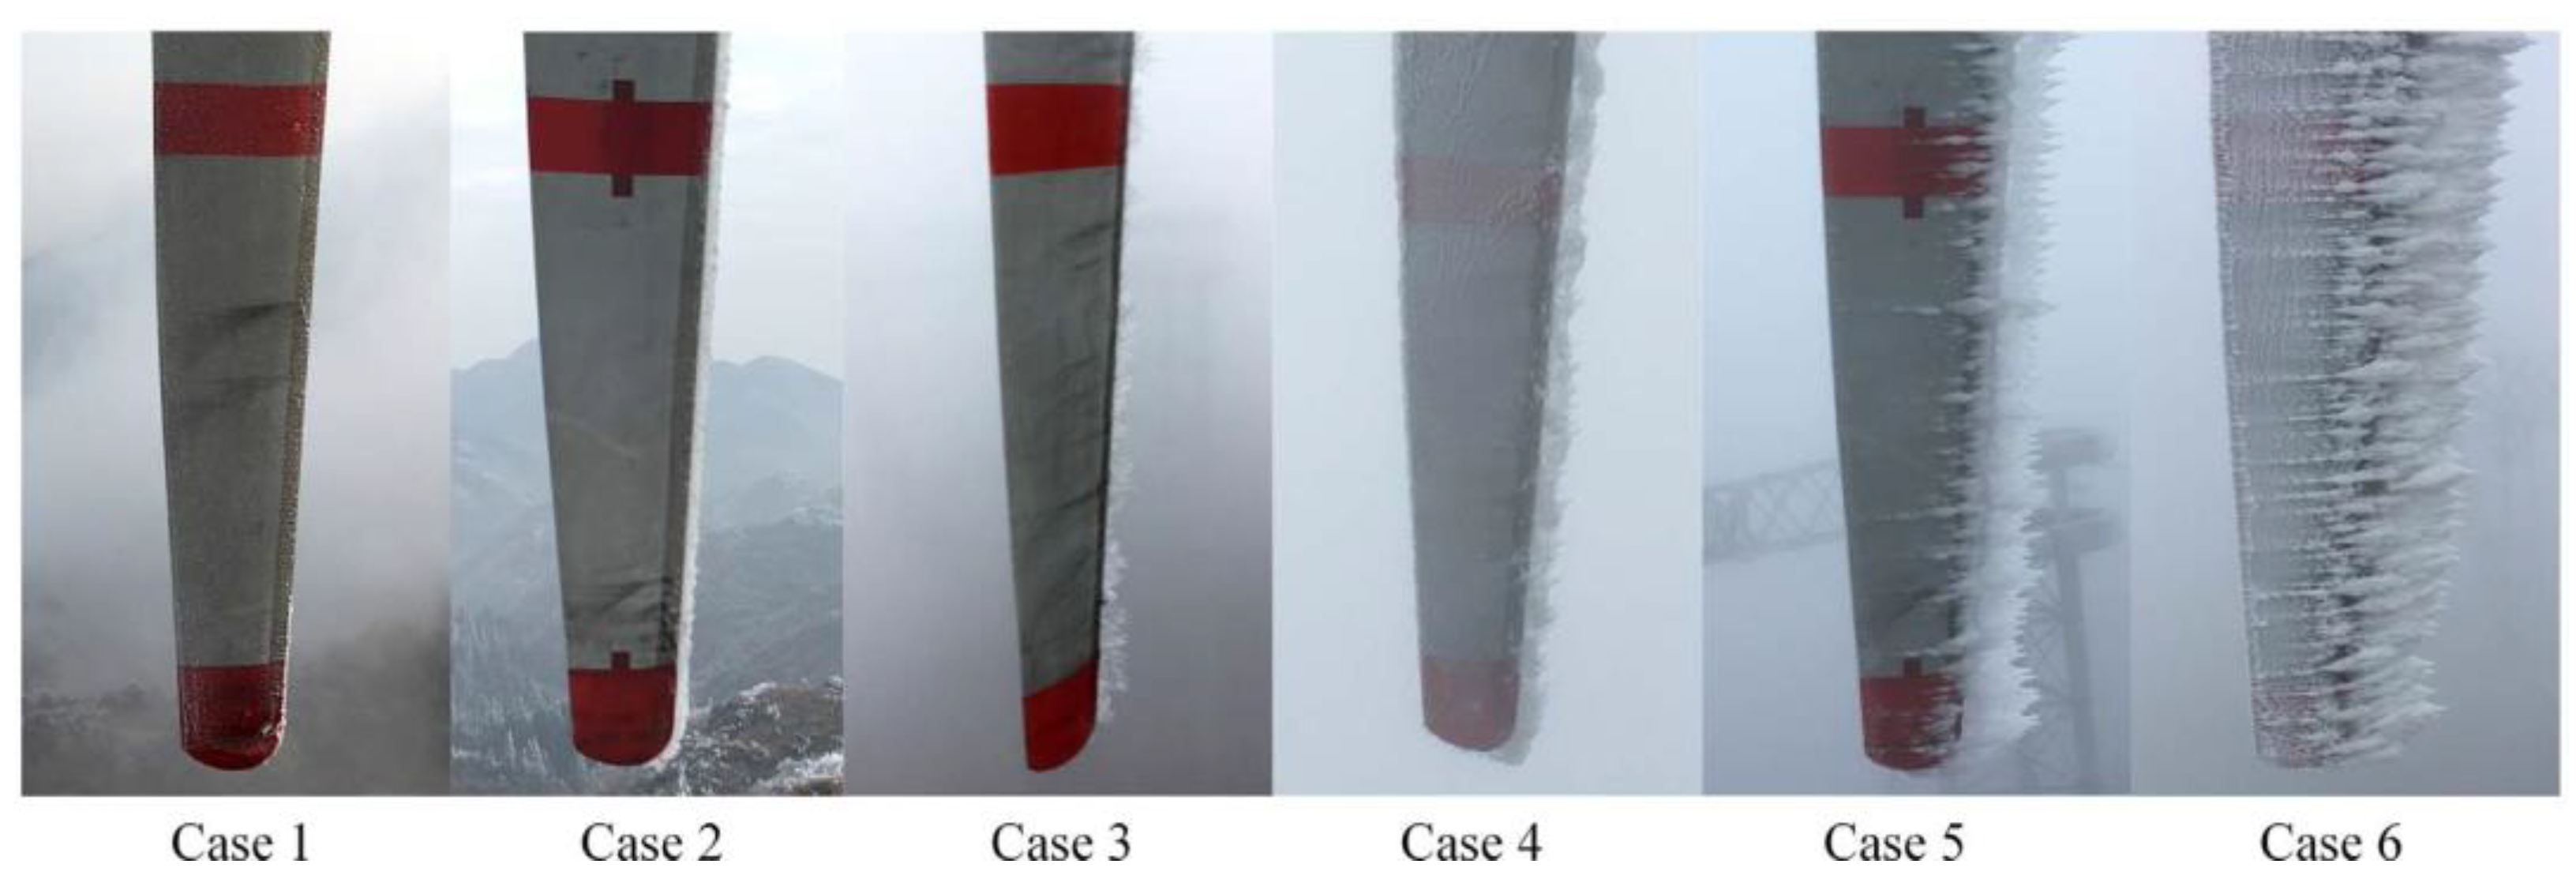
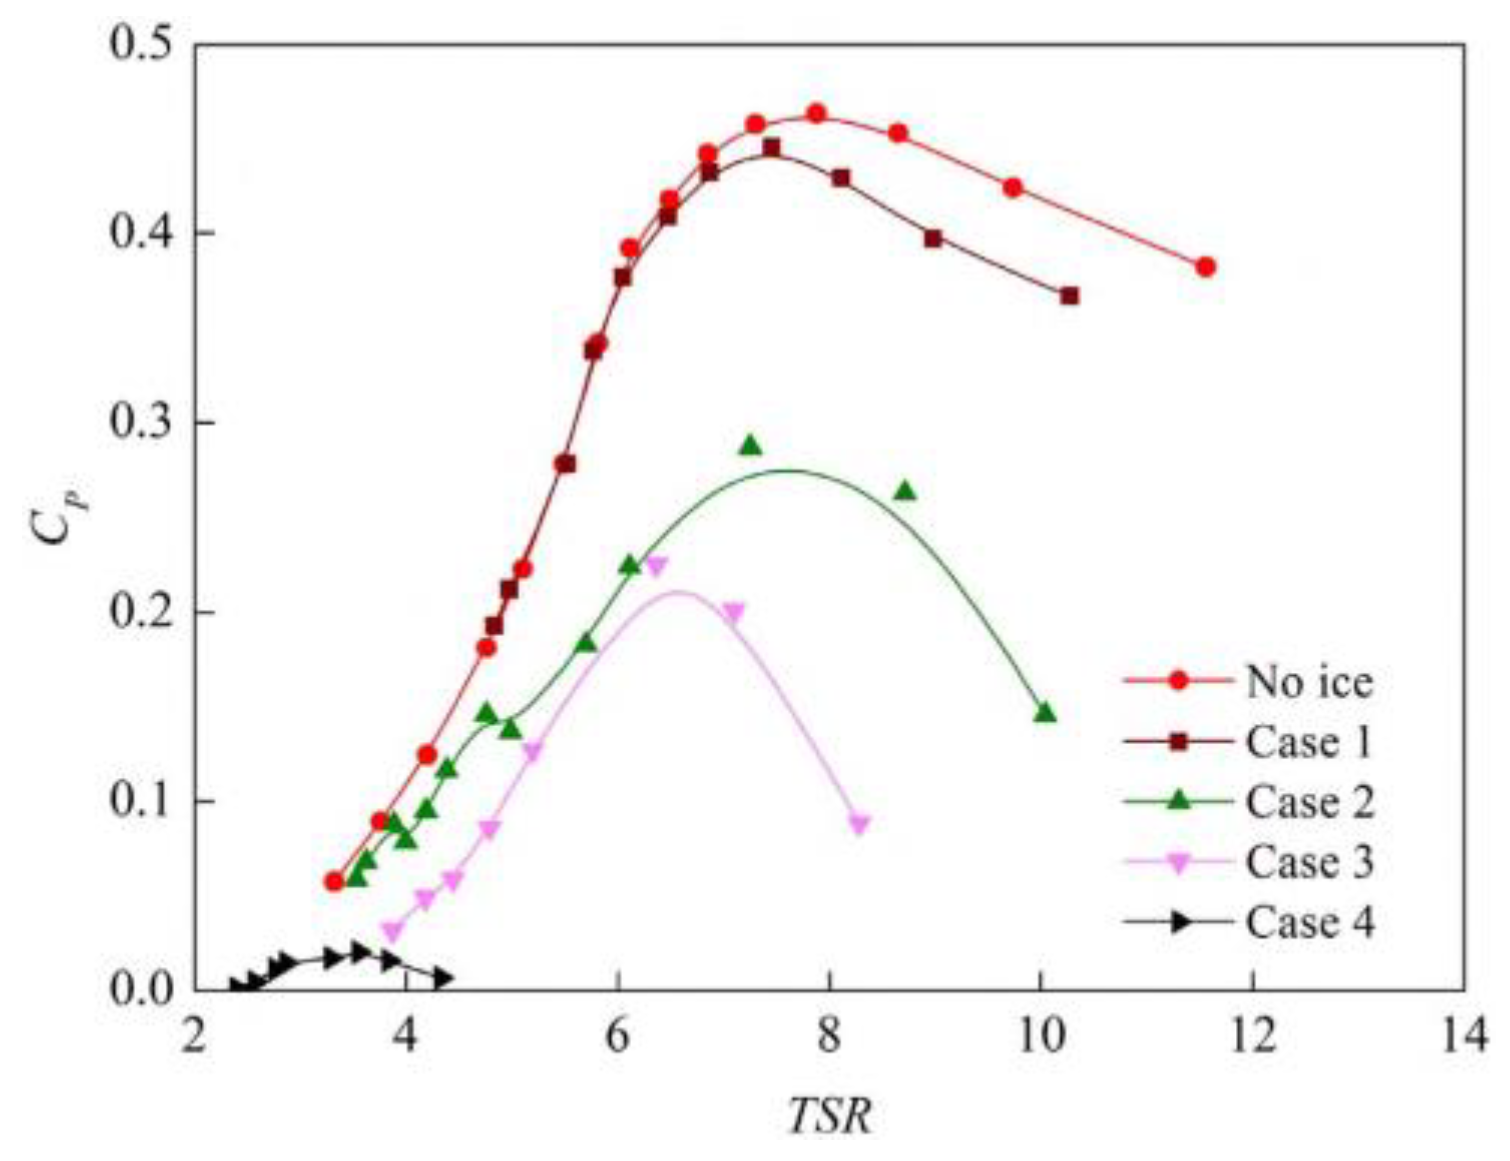
The same researchers [85] conducted a study focusing on the ice formation on HAWT blades and its impact on the power performance of a 300 kW HAWT operating in a natural icing environment (Figure 6 and Figure 7). The results indicated a significant decrease in power output at higher wind speeds following blade icing, with the severity of deterioration increasing as the ice thickness at the blade tip grows. Furthermore, it is observed that irregular and coarse ice formations have a more detrimental effect on power performance. The rotor speed of iced rotors noticeably decreases at the same wind speed as the ice thickness increases. In icing cases, both the power and moment coefficients experience a greater decline as the ice thickness increases, at the same tip speed ratio. Additionally, the maximum power and moment coefficients in icing cases occur at lower tip speed ratios. Later, they proposed a 3D numerical simulation model to assess blade aerodynamics after icing, by employing the multiple reference frame model, Reynold Averaged Navier Stokes, and k-ω SST turbulence model [86]. Results demonstrate agreement between computational and experimental clean and rime-iced rotors within rated wind speed, but overestimation for glaze-iced rotors at high wind speed. Increasing wind speed leads to significant decreases in rotor speed and power output under icing conditions. Ice shapes primarily impact pressure distribution at the airfoil’s leading edge, reducing normal and tangential forces and result in more stall conditions at the same wind speed and heightened flow separation, particularly for glaze ice.
Zanon et al. [87] introduced a numerical methodology that effectively simulated the transient phenomenon of ice accretion and its impact on the performance of HAWTs. The NREL 5 MW reference HAWT was utilized to apply this approach, aiming to forecast its performance during and after an 8-hour icing event, and the potential enhancement in energy extraction through various operational strategies. The findings indicate that by reducing the rotational speed of the turbine and accepting a minor decline in energy conversion during the icing event, the performance can improve by up to 6% once full operation is restored, in comparison to the baseline operational strategy. Conversely, maintaining the rotational speed during the icing event can result in a subsequent 3% decrease in performance, relative to the same baseline.
Tabatabaei et al. [88] evaluated the accuracy and limitations of the Blade Element Momentum (BEM) method in icing conditions. They investigated the aerodynamic performance of the full-scale NREL 5MW rotor through computational simulations. 3D steady Reynolds-Averaged Navier-Stokes (RANS) simulations were employed to analyze both clean and iced blades, while 2D CFD airfoil data were used for BEM calculations. The calculated total power using the BEM method closely aligns with the 3D CFD results for the clean blade, with a deviation of 4%. However, for the iced blade, the BEM method underestimates the total power by 28%. The load distribution along the span of the clean blade differs between the two methods. The 3D CFD predicts a 32% load loss in extracted power due to the presence of ice, with the main loss occurring in regions where the ice horn height exceeds 8% of the chord length.
Caccia and Guardone [89] conducted a simulation to analyze ice accretion on the NREL 5 MW HAWT blade, utilizing the Blade Element Momentum (BEM) approach. To enhance accuracy in calculating ice shapes, they proposed utilizing independent time steps in a multi-step ice accretion simulation. Additionally, they investigated the impact of surface roughness on the aerodynamic performance of the iced sections, by considering two roughness heights and two roughness extensions for each section. By calculating the aerodynamic coefficients for each case, they evaluated whether the observed aerodynamic penalty resulted from ice, roughness, or both. The findings demonstrated that even in the presence of a complex ice shape, roughness can significantly influence the aerodynamics of an iced section when the roughness height is sufficiently significant, and that the high-roughness case exhibited a power loss that was 50% greater than the low-roughness case.
Yirtici and Tuncer [90] conducted an aerodynamic shape optimization study conducted to minimize power production losses caused by ice on HAWT blades. Their study focused on the Aeolos-H 30 kW HAWT exposed to icing conditions for 30 minutes at a wind speed of 11 m/s. Through optimization, the power losses due to icing were reduced by approximately 4%. Similarly, for the larger NREL 5 MW HAWT, the optimized blade design reduced the power losses by about 1%. The study concludes that optimizing blade profiles around the leading edge is most effective for low Reynolds number and small-scale HAWTs.
Table 2. Various HAWT types tested in bibliography for icing.
Author Investigation Method HAWT Main Conclusions
Virk et al. [75] numerical NREL 5 MW Ice formation exhibited lower severity in the proximity of the blade root.
The growth of ice varied along the blade, with a greater presence of ice observed towards the tip.
Barber et al. [76] experimental ETH Zurich subscale model Ice reduces power coefficient by up to 22% and AEP by up to 17% for severe icing.
numerical Blade tip icing has the greatest impact, while high-altitude icing has less impact than lower-altitude icing on AEP.
Homola et al. [77] numerical NREL 5 MW 27% decrease in power production for wind speeds 7m/s-11m/s
Modeling can help estimate icing effects and find ways to reduce them.
Homola et al. [78] numerical NREL 5 MW Adjusting the turbine controller can improve power production with iced blades.
Dimitrova et al. [79] numerical Vestas V80 1.8 MW Aerodynamic performance declines with light icing, causing up to 30% loss in lift coefficient and a maximum increase of 140% in drag coefficient.
This leads to a 3.4% power loss and <1% decrease in AEP.
Lamraoui et al. [80] numerical Vestas V80 1.8 MW Both glaze and rime ice on the blade affect power.
Outer section from r/R=0.8 significantly affects aerodynamics.
Freezing fraction is non-uniform, with rime ice near the root and glaze ice towards the tip.
Major power reduction occurs around r/R ~ [0.93 0.96] with a maximum reduction of 40%.
Ice shape has a bigger local impact than thickness, but blade-wide, thickness matters most for power loss, regardless of ice type.
Etemaddar et al. [81] numerical NREL 5 MW In the linear region of the lift curve, ice-induced performance degradation mainly occurs due to higher drag coefficient.
At high angles of attack, the differences between the lift coefficients of iced and clean rotors become more pronounced, while the differences in drag coefficients decrease.
Myong [82] numerical NREL 5 MW Many aircraft icing features can be applied to icing on HAWTs.
Ice thickness increases from the base to the tip of the blade.
Ice on the blade reduces power coefficients at all tip speeds.
Reid et al. [83] numerical NREL phase VI Some icing conditions showed power losses over 60%.
Simulations with rime ice had less power losses than glaze ice.
Glaze ice at the largest droplet size caused the greatest performance decline due to thicker ice and a larger contaminated area.
Shu et al. [84] experimental Small HAWT (with blade radius 0.5m) The presence of ice slows down the turbine and reduces its power.
Ice builds up more at the front edge and increases from the base to the tip of the turbine.
As the speed decreases, the ice shifts to the other side.
Higher wind and lower temperature make ice less effective but don’t change its shape.
Ice load affects small HAWTs more than changes in aerodynamics.
Shu et al. [85] experimental 300 kW HAWT (with blade radius 14.6m) Power output decreases as wind speed increases and ice thickness at the blade tip grows.
Irregular and coarse ice formations have a more negative impact on power performance.
Iced rotors experience a noticeable decrease in rotor speed as ice thickness increases.
In icing conditions, power and moment coefficients decline more as ice thickness increases, at the same tip speed ratio.
Maximum power and moment coefficients in icing conditions occur at lower tip speed ratios.
Shu et al. [86] numerical 300 kW HAWT (with blade radius 14.6m) Computational and experimental results show agreement for clean and rime-iced rotors at rated wind speed, but overestimate for glaze-iced rotors at high wind speed.
Higher wind speed reduces rotor speed and power output when icing occurs.
Ice shapes mainly affect pressure distribution at the airfoil’s front edge, decreasing normal and tangential forces, causing more stalls at the same wind speed and increased flow separation, especially with glaze ice.
Zanon et al. [87] numerical NREL 5 MW By lowering the turbine’s rotational speed during icing, the performance can increase by up to 6% once normal operation resumes.
Maintaining the speed during icing can lead to a 3% decrease in performance compared to the baseline.
Tabatabaei et al. [88] numerical NREL 5MW The BEM method agrees closely with the 3D CFD results for the clean blade (4% deviation) but underestimates the total power for the iced blade by 28%.
The 3D CFD predicts a 32% loss in extracted power due to ice, mainly when the ice horn height is over 8% of the chord length.
Caccia and Guardone [89] numerical NREL 5 MW When the ice shape is complex, roughness can greatly affect the aerodynamics of an iced area if the roughness is significant enough.
In the high-roughness case, there was a 50% higher power loss compared to the low-roughness case.
Yirtici and Tuncer [90] numerical Aeolos-H The optimization of HAWT blades reduced losses by about 4% for Aeolos-H turbine and 1% for NREL 5 MW.
NREL 5 MW

3.2. Rainfall

Among the various meteorological conditions during HAWT operation that can impact their performance is rainfall, which leads to a decrease in aerodynamic lift and an increase in drag [91,92,93]. Moreover, the low-pressure region above the airfoil experiences significant water vapor condensation, releasing latent heat from water droplets [93]. The remaining raindrops form a thin water film on the airfoil surface, which is subsequently affected by subsequent raindrops. This interaction results in the formation of craters and an uneven film, effectively roughening the airfoil surface and causing increased drag [94].
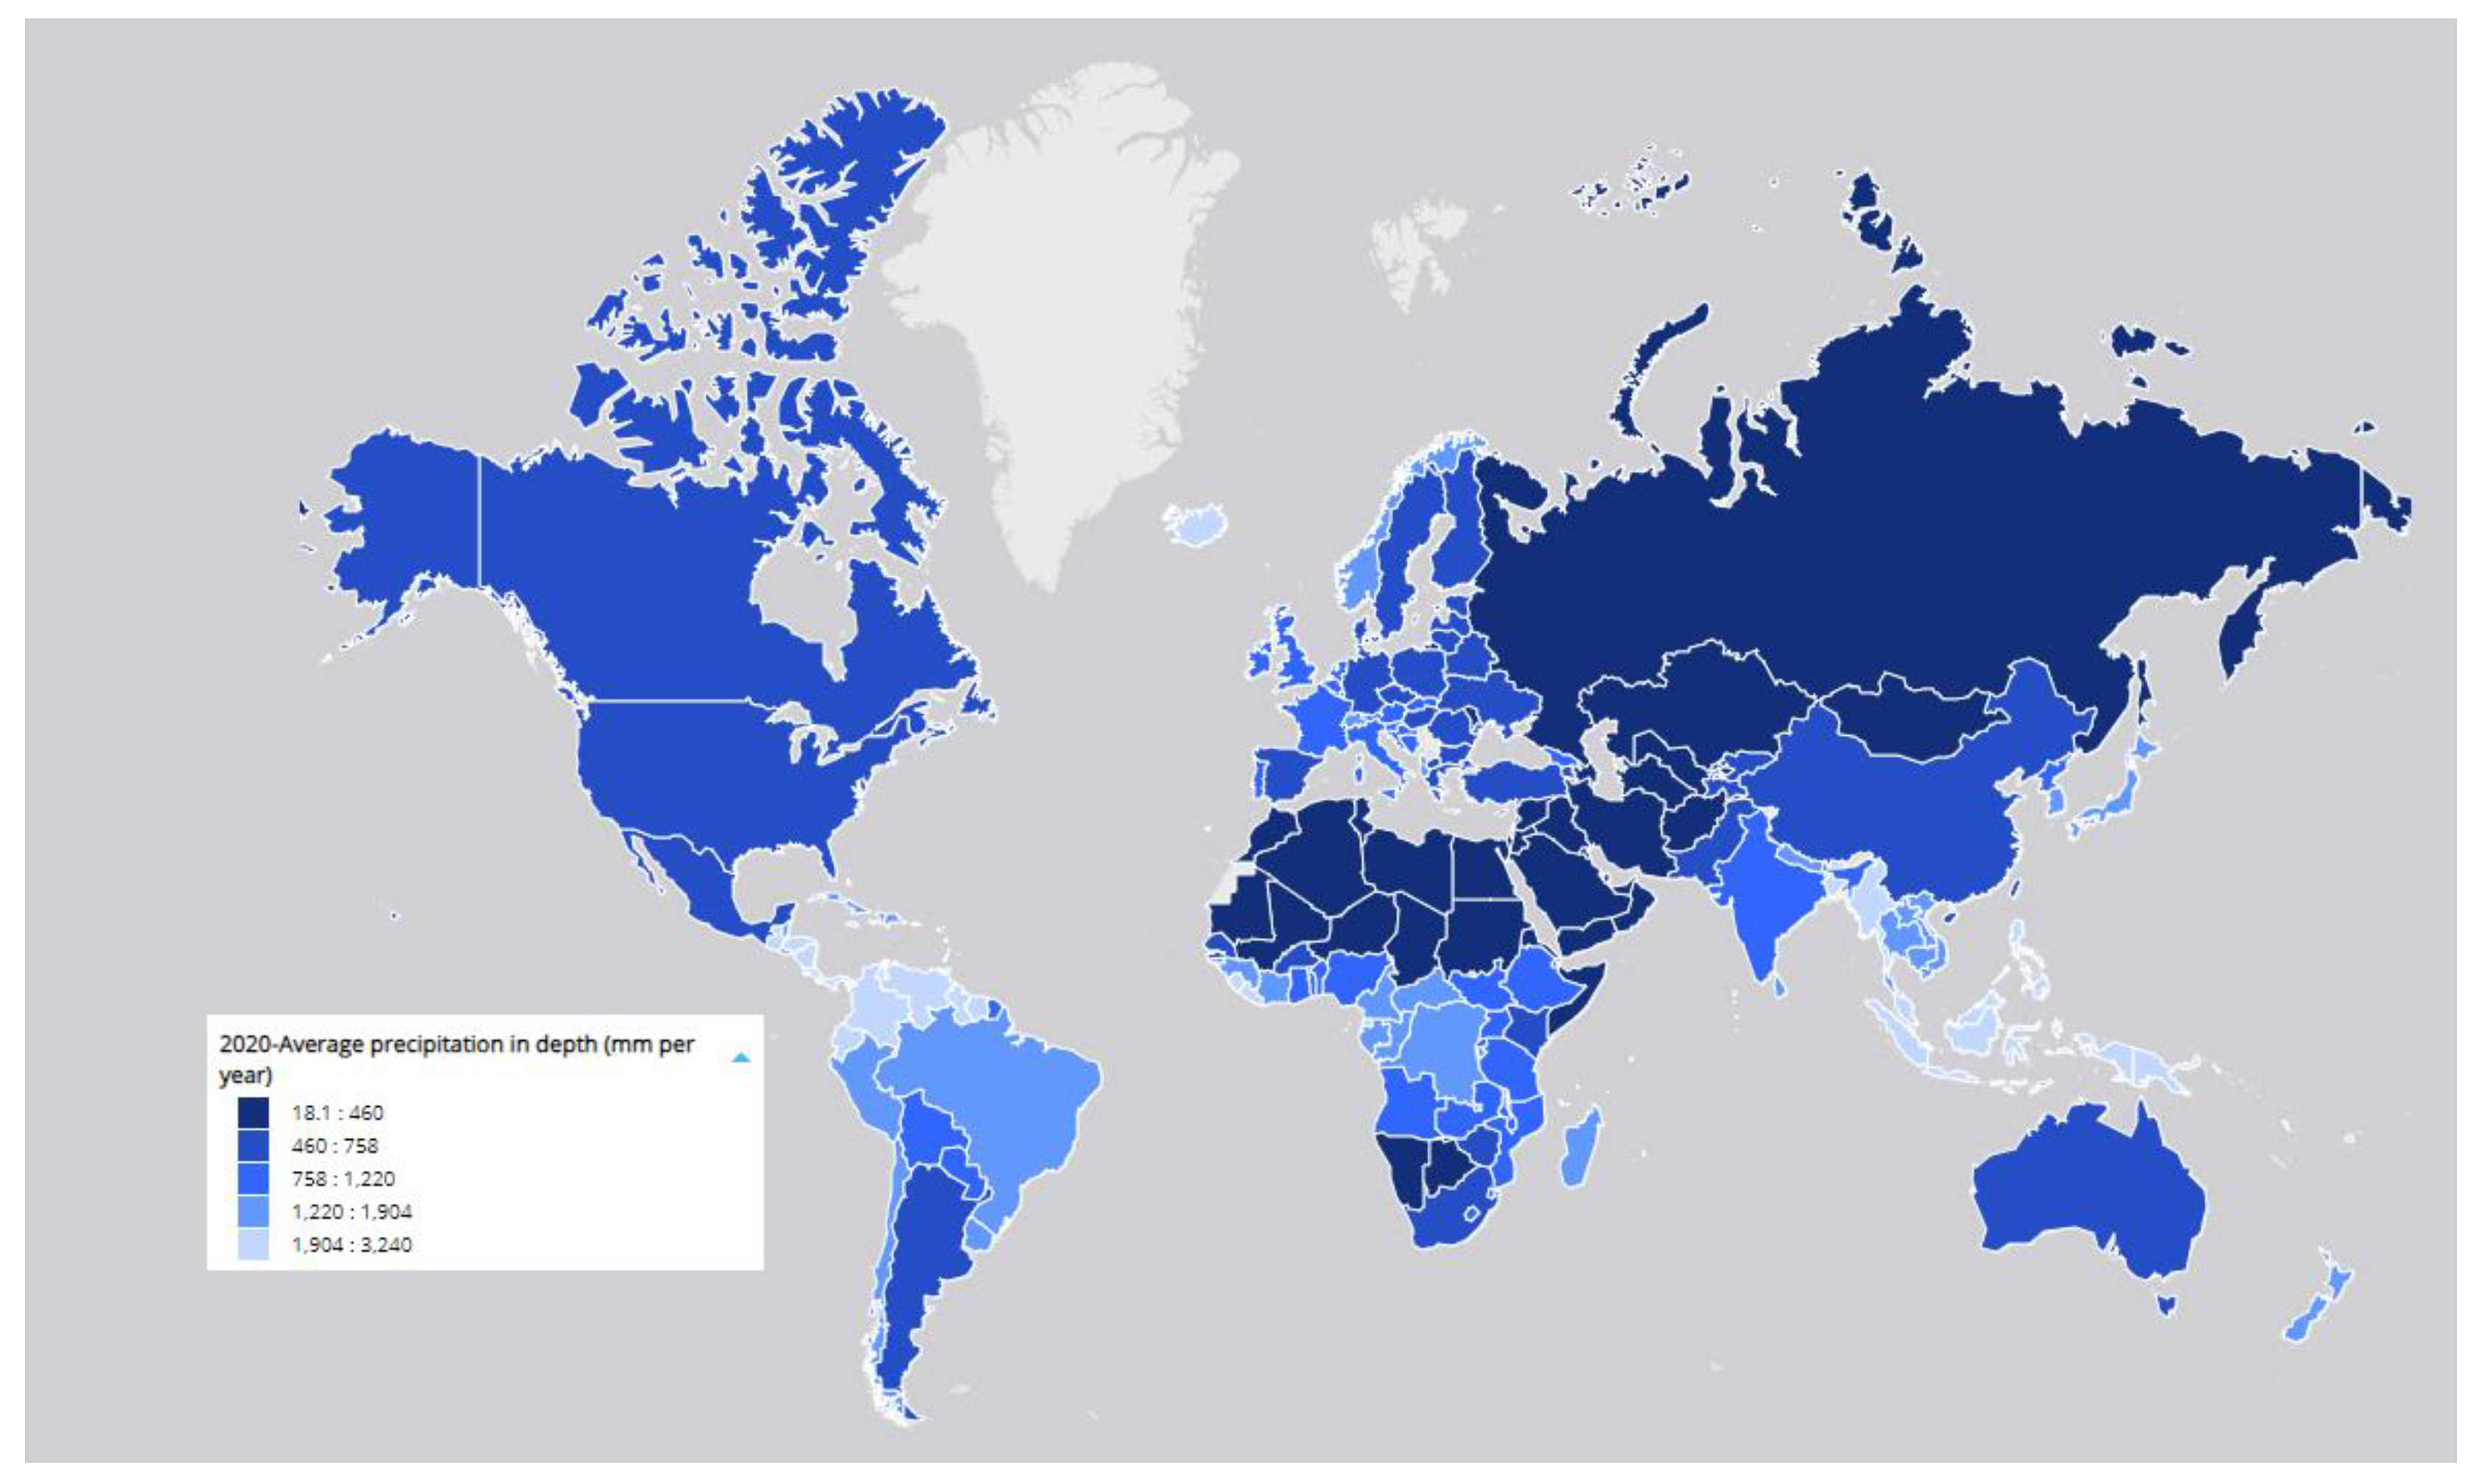
Figure 8 shows the average precipitation globally, and it is evident that there is a necessity to study the operation of HAWTs under rainfall and hailstorm conditions. Limited investigation has taken place regarding the impact of rain on the operational efficiency of HAWTs, despite rain being a frequent occurrence in certain regions. While numerous studies have explored the effects of rain in aviation applications [95,96,97,98,99,100,101,102,103], similar investigations specifically focused on HAWTs remain scarce. Research from the airfoil and aircraft industry highlights the adverse impact of rain on drag and lift, causing a significant reduction in power generation. Consequently, there is an evident necessity for a comprehensive examination of HAWT performance in rainy conditions and the subsequent reduction in operational efficiency.
The first systematic research about the effects of precipitation on HAWT power output was conducted by Corrigan and Demiglio [105]. They experimentally studied the two-bladed Mod-0 HAWT with three different rotor configurations revealed the impact of rain on its performance. The results indicated a degradation in performance due to rain, with light rainfall leading to a decrease of up to 20% and heavy rainfall up to 30%. Furthermore, when snow was mixed with drizzle, the performance degradation reached as high as 36% in low windspeeds. Additionally, an analysis was performed to forecast the impact of rain on HAWT performance. Their analysis utilized a blade element/momentum code, incorporating adjusted airfoil characteristics to account for the rain effect. The analysis predicted a performance loss of 31% in high winds with moderate rainfall rates, and these projected results corresponded well with the experimental data.
CFD advancements over the past decades have significantly contributed to enhancing our understanding of the dynamics of two-phase flows. Rainfall can be characterized as a two-phase flow, necessitating the utilization of CFD codes to address supplementary transport equations for the second phase. Moreover, these codes facilitate the management of interaction terms encompassing mass, momentum, and energy exchanges between the phases. In the modeling of fluid-particle flows, two prevalent approaches have been extensively examined by researchers such as Valentine and Decker [106], as well as Durst et al. [107].
Following, Luers [108] analyzed theoretically the aerodynamic performance of the same HAWT and the computational results aligned well with experimental data from Corrigan and Demiglio [105]. According to Luers [108] findings, there is a significant 25% power loss at a wind speed of 10 m/s and a rain rate of 50 mm/hr. Additionally, notable performance penalties are observed even under less intense rain conditions and lower wind speeds. It has been determined that the deterioration in performance is attributed to the aerodynamic roughness caused by the impact of raindrops and the waviness of the water film on the HAWT’s blades.
Cai et al. [109] developed a novel CFD model to evaluate the performance of the S809 airfoil under rainy conditions. These validated single-phase simulation results served as a reference point for quantifying the impact of rain on the HAWT’s performance. By employing a coupled Lagrangian-Eulerian approach, they captured the formation of a water film over the airfoil. Through the accurate representation of the water film’s shape and position, they estimated the resulting performance loss and they concluded that heavy rain could lead to significant performance degradation of the airfoil.
Douvi and Margaris [110] simulated the heavy rain over NACA 0012 airfoil by employing the Discrete Phase Model and computed lift and drag coefficients at various angles of attack under both dry and wet conditions. The findings indicated that heavy rain significantly affects airfoil performance, leading to a decrease in lift and an increase in drag. The degradation is a result of water film formation on the airfoil’s surface and the impact-induced cratering from raindrops. The rate of degradation is more pronounced at higher angles of attack. The computational results also reveal droplet breakup near regions with severe pressure gradients, forming an “ejecta fog” near the airfoil and causing water streams to flow from the trailing edge.
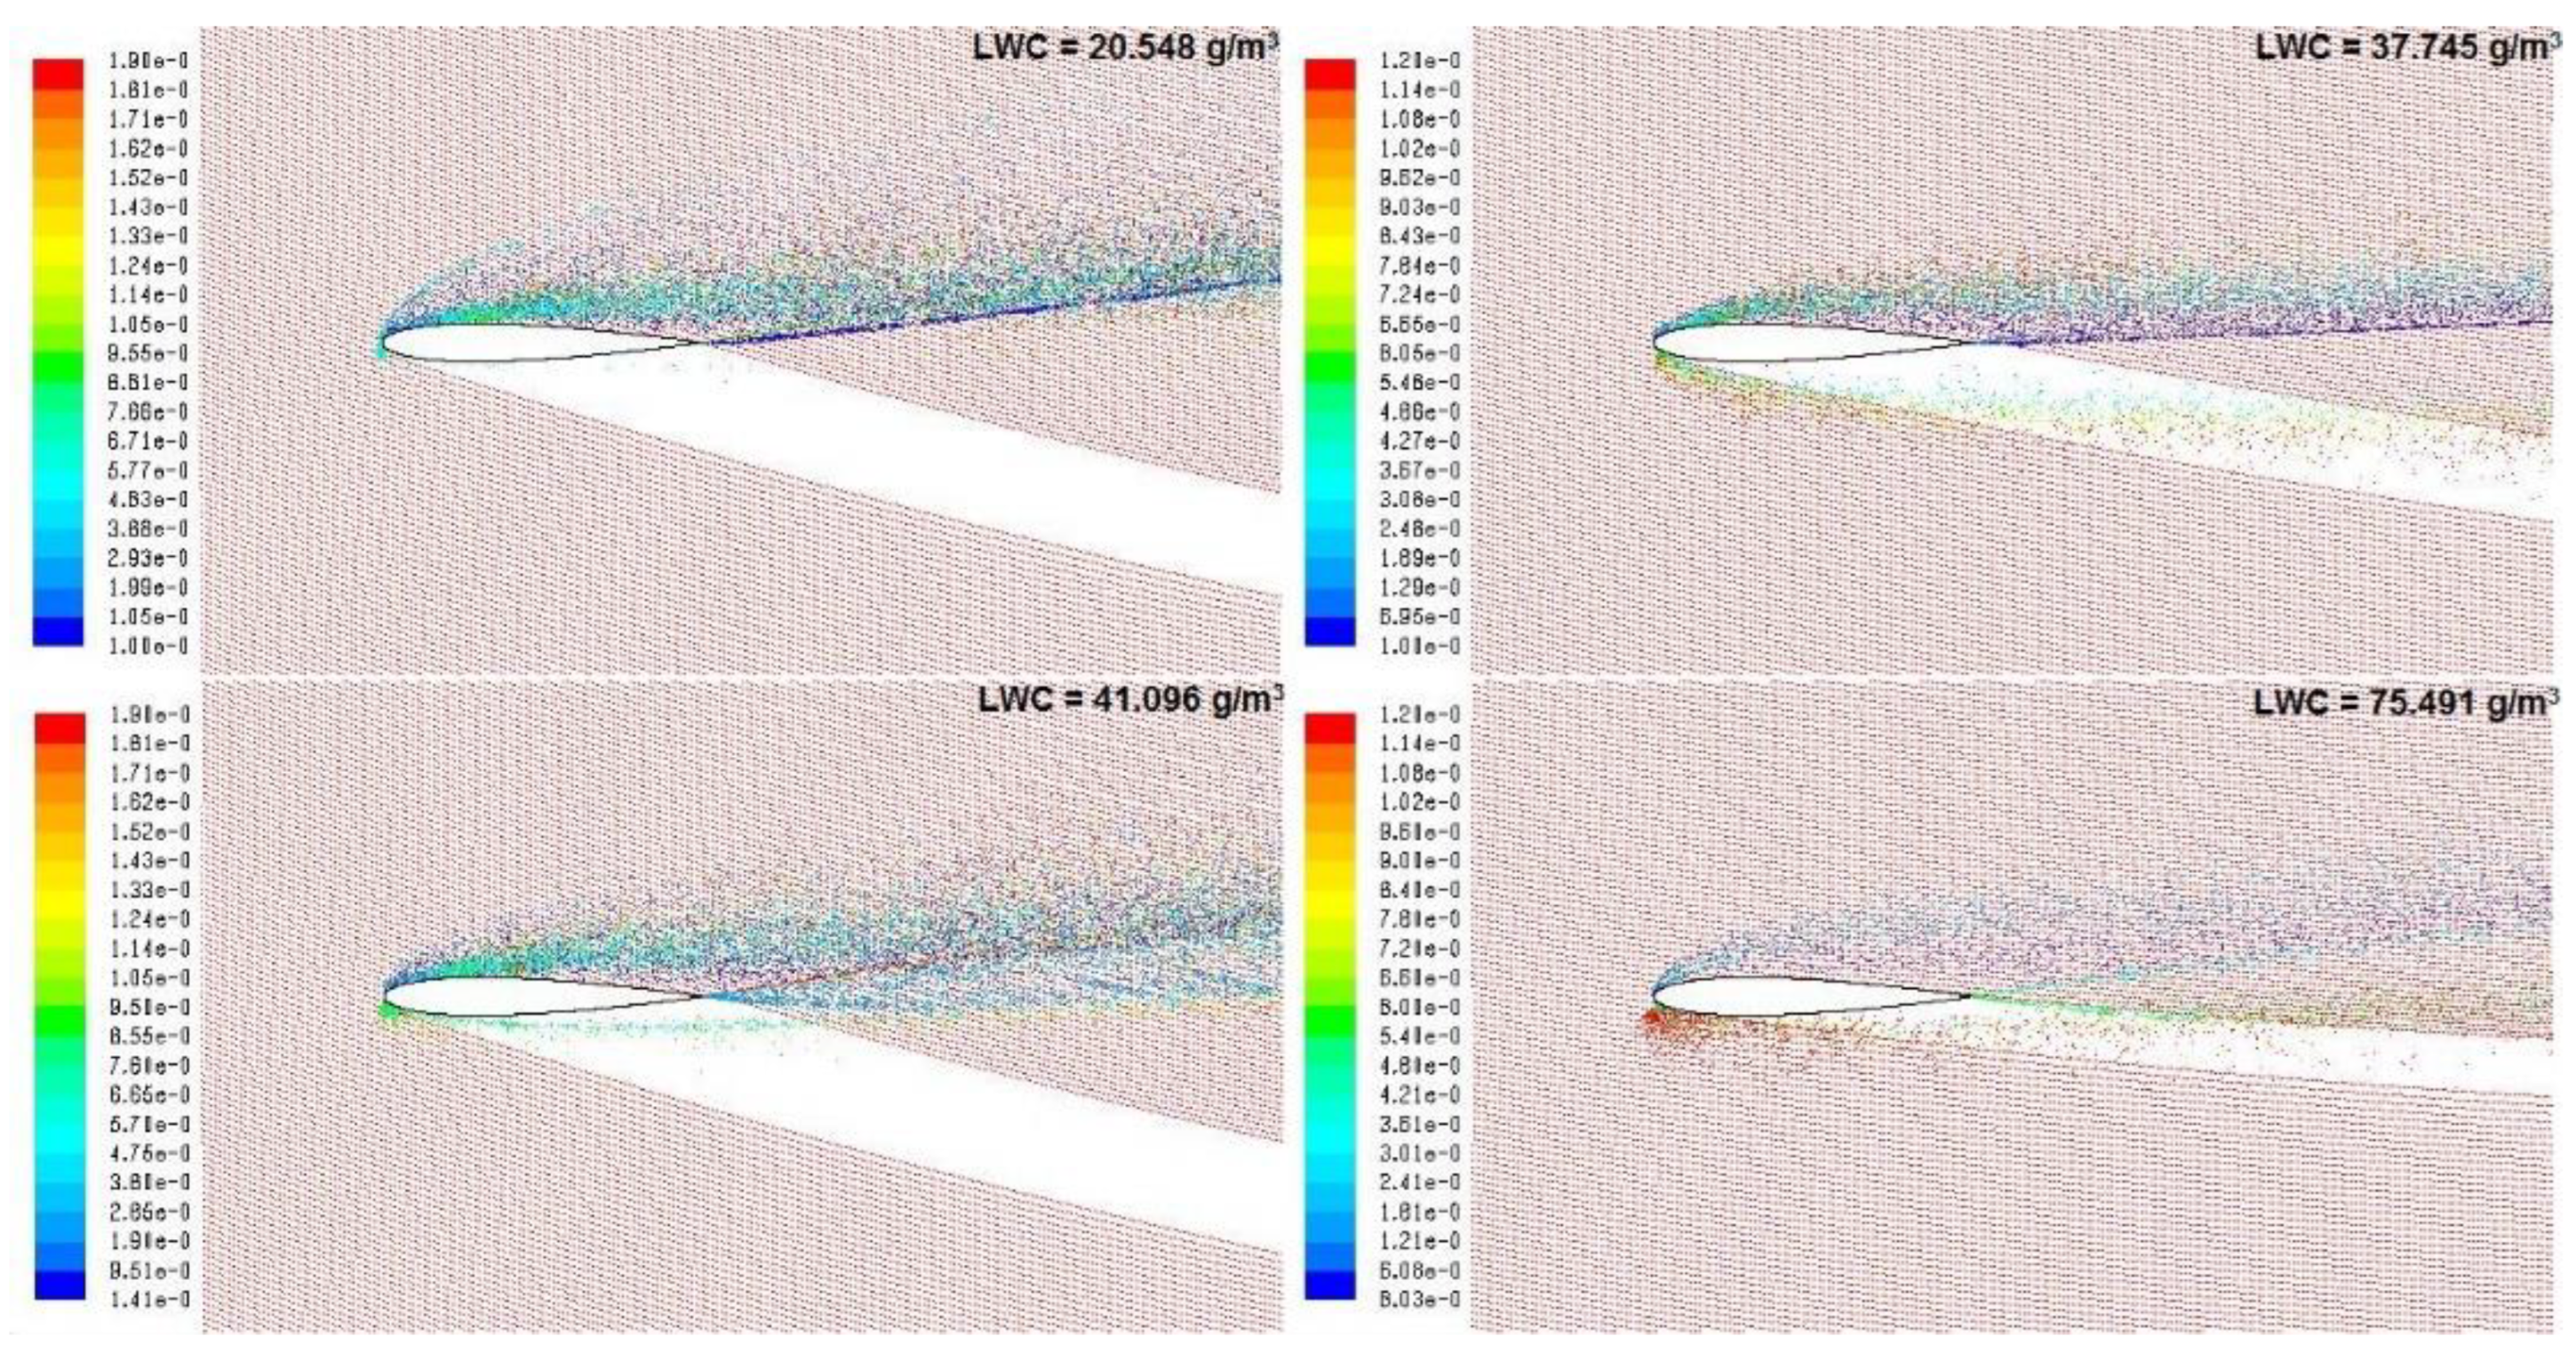
Douvi et al. [92,94] studied experimentally and computationally the influence of different rain rates on the aerodynamic performance of the NACA 0012 airfoil operating at a low Reynolds number. To simulate various rainfall rates, they injected water droplets upstream of the airfoil model using commercial rain simulation nozzles, achieving four different LWCs and they used a CFD code to gain further insight into the flow field. Their findings indicated that as LWC increased, the degradation of aerodynamic performance also increased, particularly up to the stall angle. Additionally, stall onset was delayed for all rainfall rates. The computational results revealed that larger droplets were more prone to droplet breakup, particularly in regions with severe pressure gradients near the airfoil (Figure 9). The thickness of the water film on the upper surface of the airfoil increased with higher LWC. The maximum height of the water film appeared near the trailing edge at a 0° angle of attack for all LWCs but shifted towards the leading edge at higher angles of attack. Furthermore, as the angle of attack increased, less water accumulated on the upper surface of the airfoil for all LWCs. Finally, they observed that the rivulet formation point on the upper surface of the airfoil was close to the trailing edge for low angles of attack and moved towards the leading edge with increasing angle of attack.
Cohan and Arastoopour [111] enhanced the Cai et al. [109] model and developed a CFD model to investigate the influence of rainfall rate, surface tension, and surface properties on HAWT blades by employing the Discrete Phase Model (DPM) and the Eulerian Volume of Fluid (VOF) model. They observed that, at low rainfall rates, the airfoil’s performance is highly responsive to the rainfall rate. However, when the rainfall rate becomes sufficient to form water film on the airfoil surface, further increase in rainfall do not substantially impact its performance. At higher rainfall rates, the lift coefficient is higher compared to the no-rain case but accompanied by an unfavorable increase in the drag coefficient.
Arastoopour and Cohan [112] refined their previous CFD model [111], to more effectively simulate the transfer of momentum during the formation of water films on the airfoils of a HAWT. The 2D airfoil simulation demonstrated an increase in the lift coefficient with the angle of attack, surpassing the stall angle observed in the single-phase case. However, this favorable lift increase was accompanied by a higher drag coefficient, particularly at larger angles of attack. Furthermore, they examined the impact of rainwater films on the turbine performance using the 3D NREL Phase VI HAWT as a case model and concluded that the accumulation and flow of rain film on the turbine airfoil surface led to a reduction in power output by up to 25% at a wind speed of 7 m/s and a rainfall rate of 40 mm/h.
Wu et al. [113,114] presented a hybrid method designed to analyze the dynamic characteristics of HAWTs operating under wind-rain conditions, which utilizes a Eulerian multiphase model to represent the flow of wind and rain, a single rotating frame to simulate the rotational motion of HAWTs, and collision theory to calculate the load generated by rain. Numerical simulations were conducted to investigate various scenarios involving wind speed, rotation speed, and rain intensity for a 5 MW HAWT. The results clearly indicate that the impact of rain on the HAWT is more pronounced near the blade tip during rotation, whereas free-falling rain primarily affects the region near the blade root. Moreover, the rain-induced load, in terms of thrust and torque, increases with higher rain intensity. Additionally, empirical formulae are derived from the numerical results to describe the relationship between the three influencing factors (wind speed, rotation speed, and rain intensity) and the rain-induced load coefficient.
Barfknecht et al. [115] calculated and compared the Annual Energy Production (AEP) loss resulting from leading-edge erosion (LEE) and from operating in an Erosion-Safe Mode (ESM), for the IEA 15MW and NREL 5MW offshore HAWTs. Performance evaluations were conducted under uniform and sheared inflow conditions for both turbines, with a focus on identifying trends and trade-offs between LEE and ESM. LEE negatively impacts power production below rated capacity, while operating in the ESM predominantly reduces performance at the turbine’s rated power. The IEA 15MW reference turbine experienced a higher performance loss due to erosion, particularly at lower wind speeds, compared to the NREL 5MW turbine. However, the turbine design had little sensitivity to the break-even point for the ESM.
Anh and Duc [116] presented an analytical method and model that simulate the physical processes of raindrops forming on the blades of HAWTs. Their model estimated the effect of precipitation, determined optimal wetness, and subsequently evaluated power and performance, under various rainy weather conditions, considering different turbine blade geometrical shapes. They found out that the wetness on turbine blades corresponded to the impact force of rain, with an optimal wind speed minimizing both the impact force and power loss. Moreover, larger raindrop size significantly reduced power output, affecting the rotation speed of turbine blades. In a following study, Anh and Duc [117] proposed an analytical method to study the power output of a HAWT and the operation of the pitch control system under various rainy conditions. Their model simulated the physics-based process of raindrops falling on the blades’ surface, enabling the determination of optimal wetness levels based on the swept area’s shape. Subsequently, they analyzed the power generation and performance of the turbine in rainy conditions and the results indicated that during rain, the pitch angles should be decreased when the wind speed exceeds the predefined threshold value.
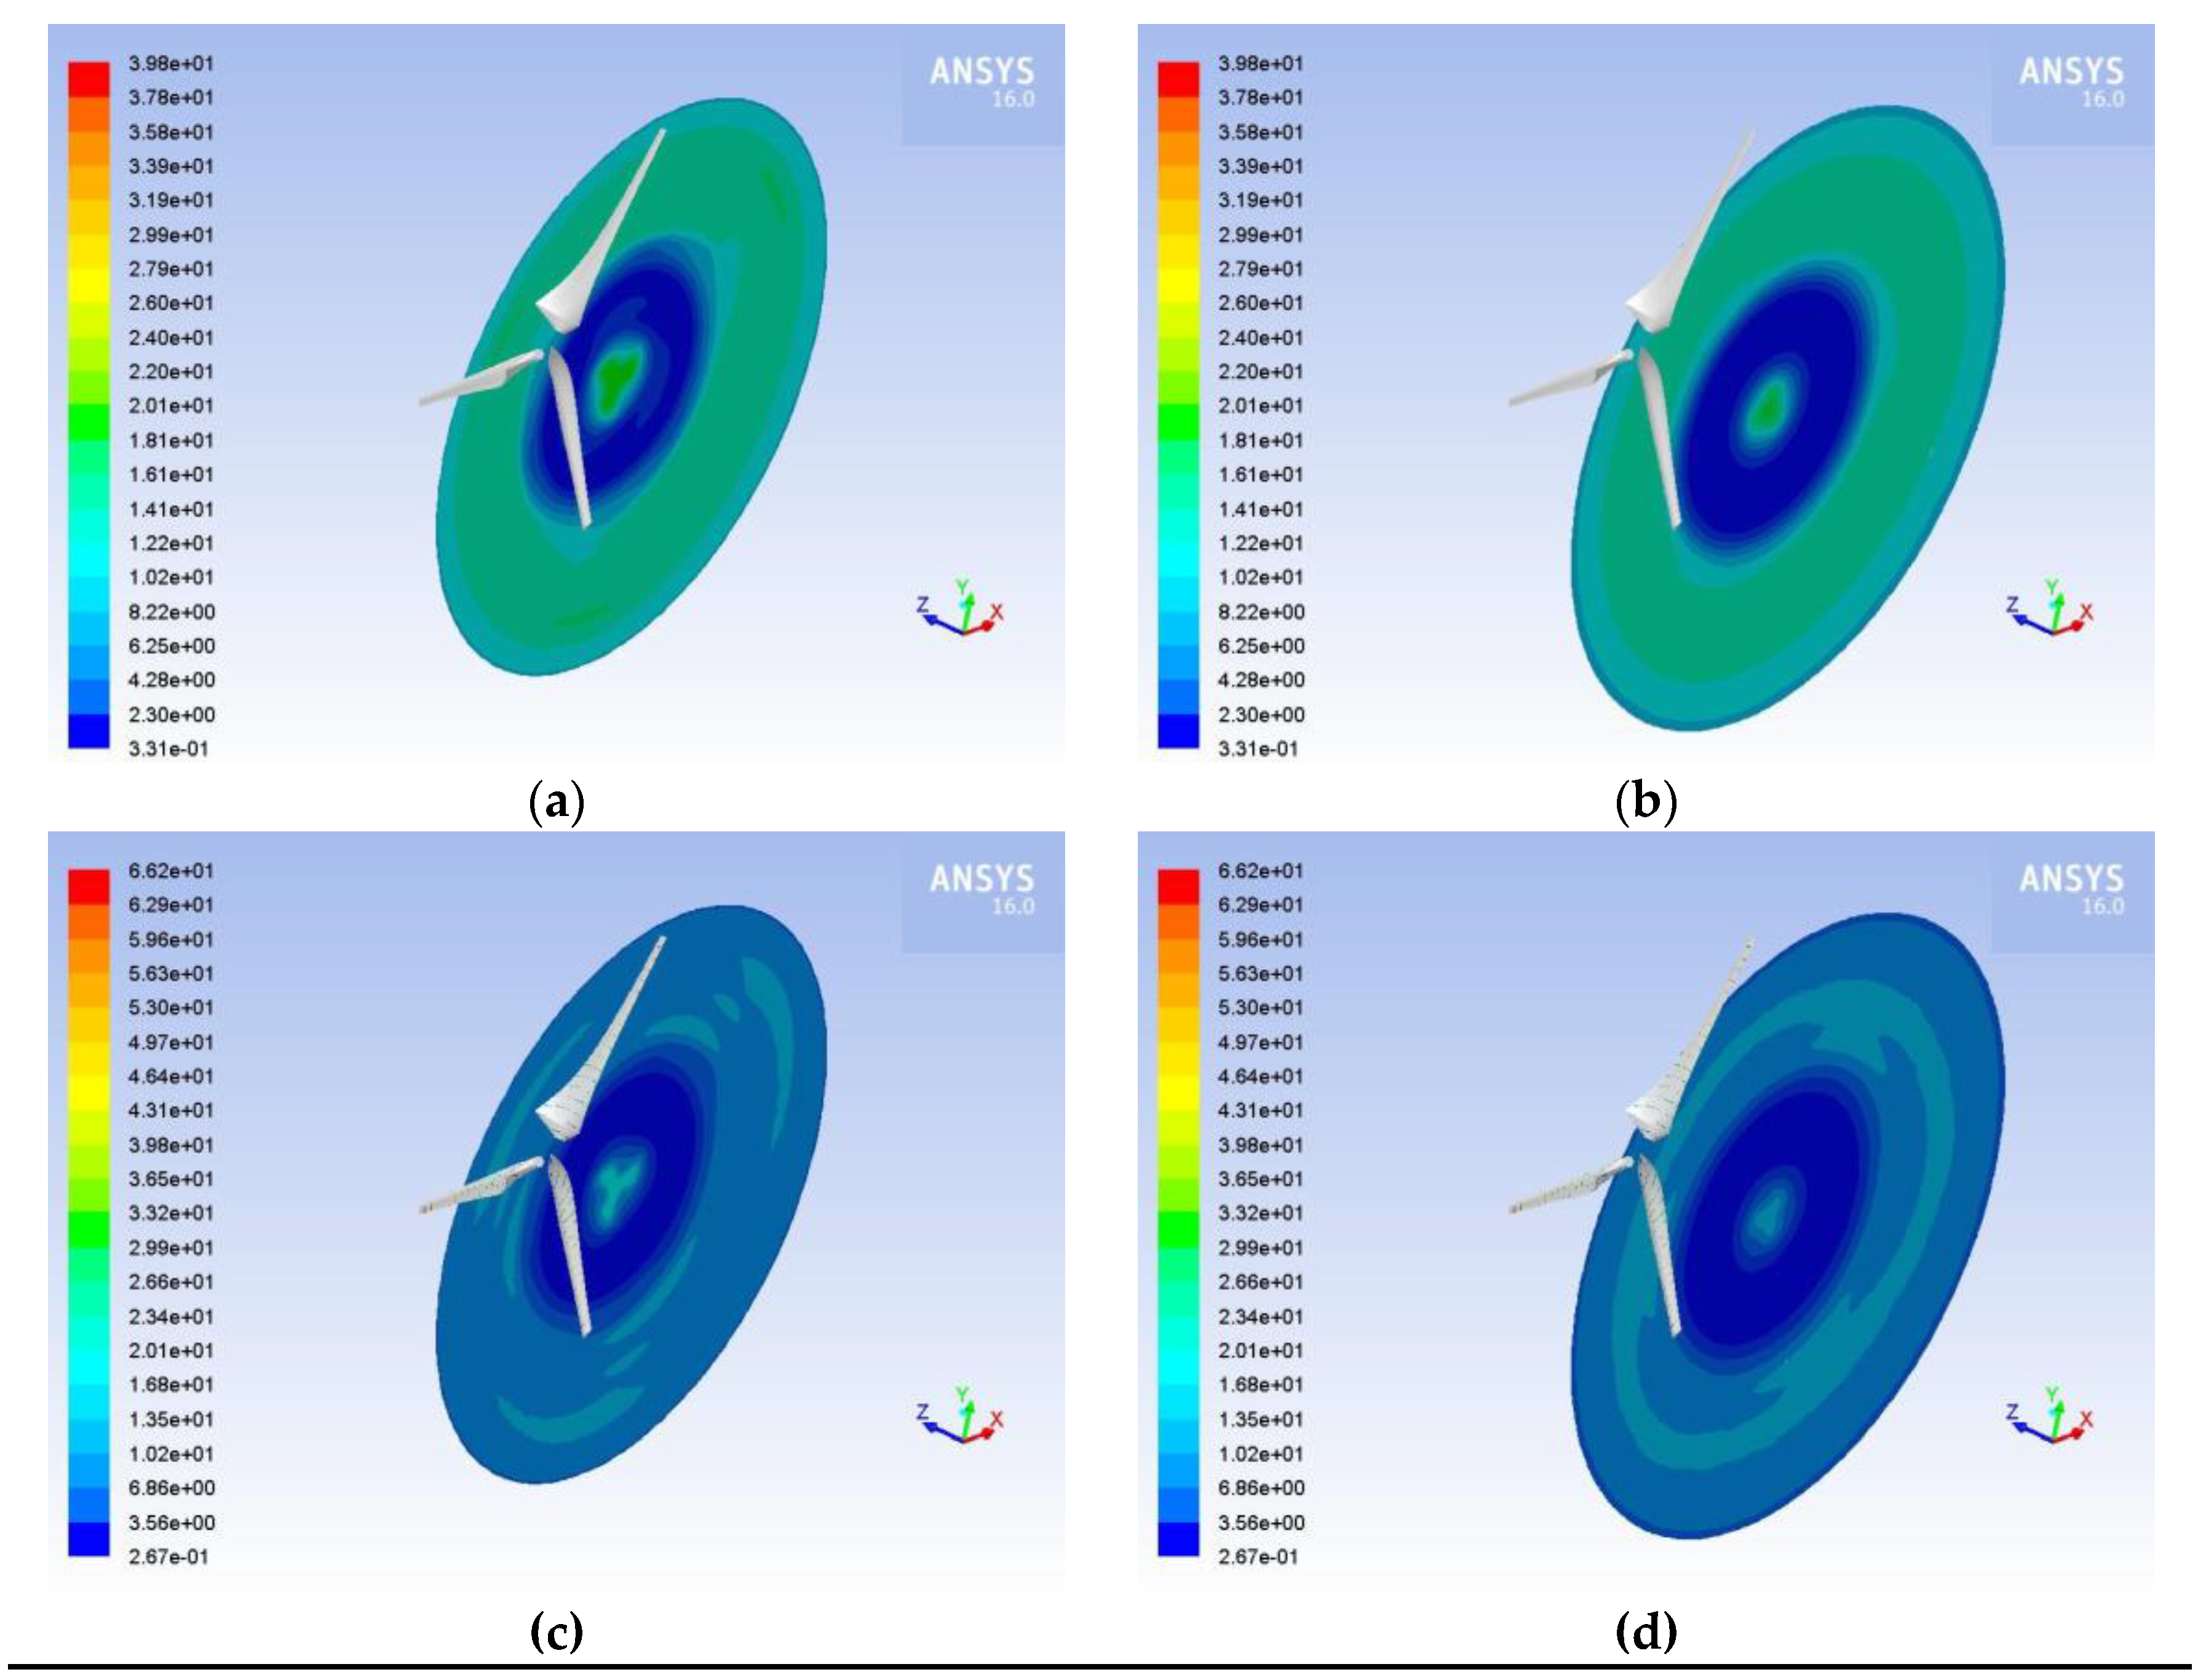
Douvi et al. [118] investigated the aerodynamic performance of a three-bladed HAWT, with blades constructed by NACA 4418 airfoil, under three different rainy conditions. The blade geometry was optimized using the TTBEM application [119], while a commercial CFD code was employed for simulations. The study first analyzed the blade’s operation in dry conditions and subsequently examined different rainfall scenarios to evaluate rain droplets’ impact on the turbine’s aerodynamic performance. It concluded that rain negatively affects the aerodynamic performance of the HAWT, specifically causing a decrease in the power coefficient as the LWC and droplet diameter increase. A significant decline in aerodynamic efficiency compared to the single-phase flow was observed: reductions of 11.84%, 16.87%, and 23.9% were identified for rain densities of 10g/m³, 30g/m³, and 60g/m³, respectively. Notably, the maximum water film thickness was observed near the hub, where the blade’s chord length is greater, while a smaller amount of water accumulated near the blade tip due to centrifugal force removing the water from the blade. Additionally, under a two-phase flow with an LWC of 30g/m³, power coefficient reductions of 15.33%, 16.87%, and 17.99% were observed for raindrop diameters of 0.5mm, 1mm, and 2mm, respectively.
Table 3. Various airfoil and HAWT types tested in bibliography for rainfall.
Author Investigation Method HAWT or airfoil type Main Conclusions
Corrigan and Demiglio [105] experimental two-bladed Mod-0 HAWT Light rainfall caused up to a 20% decrease, while heavy rainfall caused up to a 30% decrease in aerodynamic performance.
When snow mixed with drizzle, performance dropped by as much as 36% in low winds.
31% performance loss in high winds with moderate rainfall, which aligned with the experimental data.
Luers [108] theoretical two-bladed Mod-0 HAWT A 25% power loss occurs at a wind speed of 10 m/s and a rain rate of 50 mm/hr.
Even under lighter rain and lower wind speeds, noticeable performance issues are seen.
The decrease in performance is due to the roughness caused by raindrops and the waviness of the water film on the HAWT’s blades.
Cai et al. [109] numerical S809 airfoil They observed water forming on the airfoil and estimated how it affected performance.
Heavy rain can significantly degrade the airfoil’s performance.
Douvi and Margaris [110] numerical NACA 0012 airfoil Heavy rain affects airfoil performance, reducing lift and increasing drag, due to water film formation on the airfoil’s surface and impact-induced cratering from raindrops.
The degradation is more significant at higher angles of attack.
Droplets breakup near areas with severe pressure gradients, creating an “ejecta fog” near the airfoil and causing water streams to flow from the trailing edge.
Douvi et al. [92,94] numerical NACA 0012 airfoil Increasing LWC degrades aerodynamic performance, especially up to stall angle.
Rainfall delays stall onset. Larger droplets break up more in areas with pressure gradients near the airfoil.
Higher LWC increases water film thickness on the upper airfoil surface.
The maximum water film height near trailing edge occurs at 0° angle, shifting towards leading edge at higher angles.
With higher angles of attack, less water accumulates on the upper surface.
Rivulet formation point on upper surface moves from trailing edge to leading edge with increasing angle of attack.
Cohan and Arastoopour [111] numerical S809 airfoil At low rainfall rates, the airfoil’s performance is affected by rainfall.
When the rainfall rate is enough to form a water film on the airfoil surface, further increase in rainfall doesn’t significantly affect performance.
Higher rainfall rates increase the lift coefficient but also the drag coefficient detrimentally.
Arastoopour and Cohan [112] numerical S809 airfoil Increasing the angle of attack in the airfoil simulation increased the lift coefficient but also resulted in a higher drag coefficient.
NREL Phase VI HAWT Rain film accumulation and flow on the airfoil surface reduced power output by up to 25% at a wind speed of 7 m/s and a rainfall rate of 40 mm/h.
Wu et al. [113,114] numerical NREL 5 MW The results show that rain affects the HAWT differently at the blade tip and root.
Rain intensity increases the impact.
Empirical formulae describe the relationship between wind speed, rotation speed, rain intensity, and the load caused by rain.
Barfknecht et al. [115] numerical IEA 15 MW and NREL 5 MW offshore HAWTs The IEA 15MW turbine had higher erosion-related performance loss at lower wind speeds compared to the NREL 5MW turbine.
Turbine design had little sensitivity to the Erosion-Safe Mode break-even point.
Anh and Duc [116] numerical --- The wetness on turbine blades correlates with the impact force of rain.
The optimum wind speed reduces both the impact force and power loss.
Larger raindrops lower power output and affect blade rotation.
Anh and Duc [117] numerical --- Optimal wetness levels based on the blade shape were determined.
Pitch angles should decrease when wind speed exceeds a set threshold during rain.
Douvi et al. [118] numerical Optimized three-bladed HAWT, with blades constructed by NACA 4418 airfoil Rain has a detrimental impact on HAWT aerodynamics, causing a decrease in power coefficient as raindrop size and liquid water content (LWC) increase.
Significant reductions in aerodynamic efficiency were observed, with declines of 11.84%, 16.87%, and 23.9% for rain densities of 10g/m³, 30g/m³, and 60g/m³, respectively.
The thickest water film accumulated near the hub, where the blade chord is longest, while less water collected near the blade tip due to centrifugal force.
Under rainfall with an LWC of 30g/m³, power coefficient reductions of 15.33%, 16.87%, and 17.99% occurred for raindrop diameters of 0.5mm, 1mm, and 2mm, respectively.

3.3. Hailstorm

Hailstorms are less frequent than rainfalls, but they can cause significant damages to crops and infrastructures, resulting in financial and insured damages [120]. Unlike rain, the solid particles that prevail in hailstorms include a wide range of shapes and sizes. Hailstones, for instance, are larger than 5 mm, and there is no upper limit; some of the largest hailstones ever recorded reached a diameter of approximately 20 cm [121]. In the Midwest of the USA, where numerous HAWTs operate, hail is a common phenomenon [122]. However, there is a lack of similar data on hail events in the North Sea region. Europe on the other hand, experiences fewer hail occurrences when compared to USA, constitute a significant meteorological risk as well [120].
Fiore et al. [123] investigated numerically the damage caused by raindrops and hailstones over a HAWT blade. The trajectory of the particles hitting the blades was analyzed using a numerical code, the areas of the blade surface that subjected to damage were estimated and it was found that they depend on the airfoil type, the angle of attack and the particle mass. More raindrops and hailstones were captured by the blade section constructed by thinner airfoils. Notably, the hailstones generated significant impact forces at the leading edge of the blade due to the angle of their trajectory in relation to the blade surface. On the other hand, raindrops are more sensitive to the flow field around the blade compared to hailstones. This sensitivity is reflected in the impact force’s dependence on the blade’s angle of attack. The erosion rate resulting from raindrop impact is found to be proportional to the cube of the blade’s relative wind velocity, while the impact force exhibits a power-law relationship with the square of the wind velocity.
Douvi et al. examined computationally the impact of hailstorm conditions on the aerodynamic performance of the S809 [124] and the NACA 0012 [125] airfoil. The results confirmed that hailstorm conditions have a significant effect on the aerodynamic performance of both airfoils, resulting in a decrease in the lift coefficient and an increase in the drag coefficient when compared to normal airflow. When operating under hailstorm conditions, discrepancies between the hailstorm and air flow contours were observed primarily at the trailing edge and leading edge of the airfoils. Furthermore, the analysis of hailstone and water droplet distribution around the airfoils revealed that both particles impact the airfoils, breaking up into smaller particles. Shadow zones were also apparent, and it was concluded that an increased angle of attack leads to a wider distribution of smaller hailstones across the upper surface of the airfoil and a higher concentration of hailstones below the airfoil. Ultimately, the prediction of the power coefficient for a three-bladed HAWT indicated a decrease in power coefficient during hailstorm conditions.
Douvi and Douvi [126] expanded their research to study the pressure coefficient and wall film height, both on the upper and lower surfaces of the S809 airfoil, while operating in hailstorm conditions. A significant finding of this study was that the upper surface of the airfoil near the leading edge displayed the highest wall film height for all angles of attack. These findings support the notion that particles contribute to the deterioration of airfoil aerodynamics due to the roughness of the leading edge. The wavy nature of these curves reflected the shape of the water film on the airfoils. Increasing the angle of attack resulted in reduced water accumulation on the upper surface and increased water presence on the lower surface of the airfoil. Lastly, the prediction of the power coefficient for a three-bladed HAWT using the S809 airfoil profile indicated a decrease in the power coefficient during hailstorm conditions for various tip speed ratios.
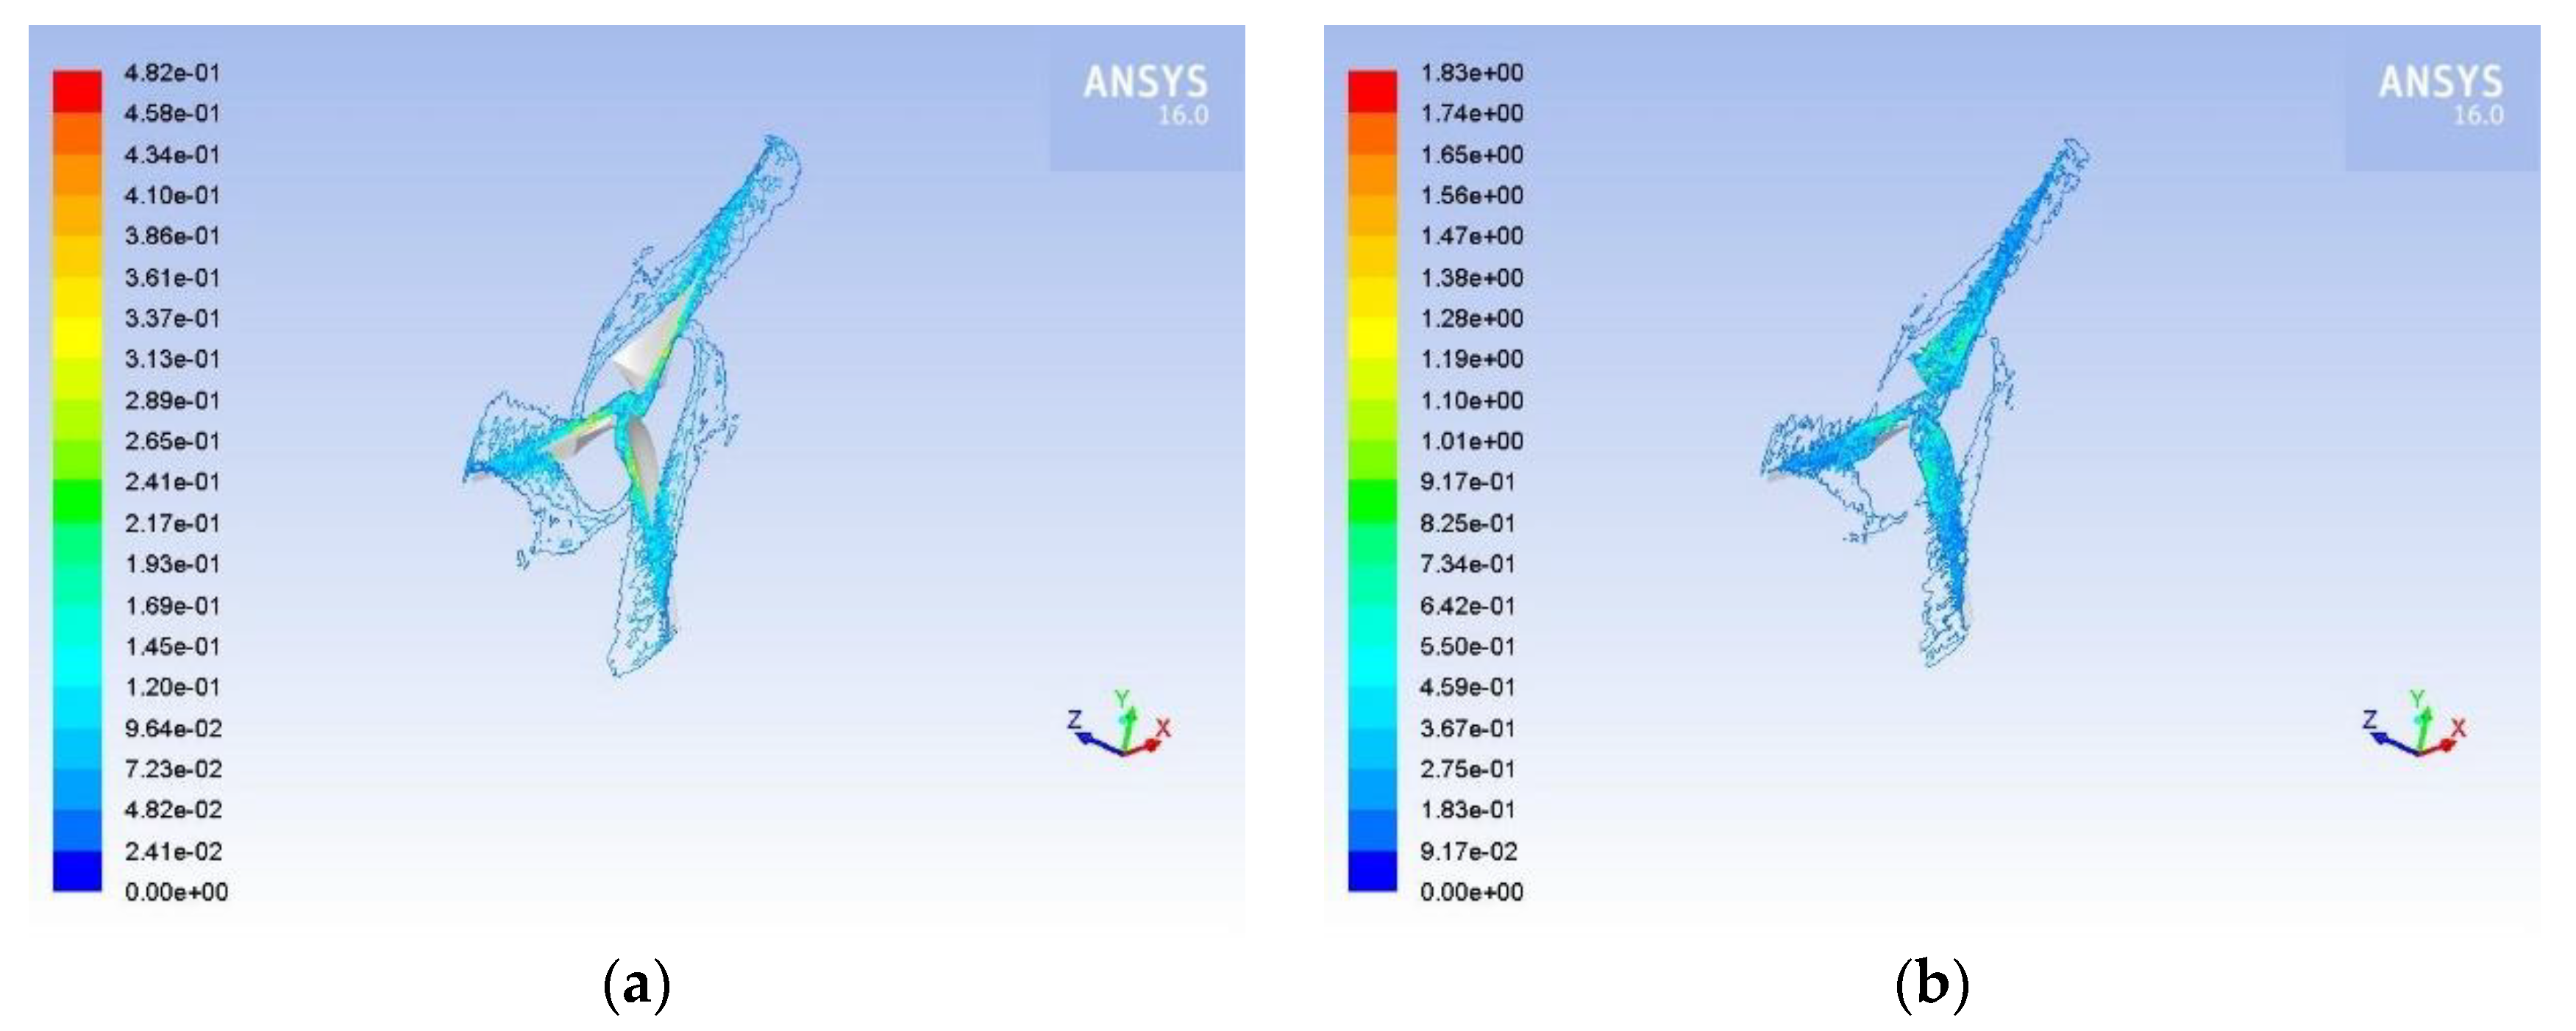
Douvi et al. [127] conducted a novel computational study investigating the aerodynamic performance of an optimal three-bladed HAWT during hailstorm conditions when hailstones and raindrops are present. The optimal blade geometry characteristics, such as twist and chord length, were computed using a user-friendly application. This study explored not only the power output of a HAWT operating under hailstorm conditions but also analyzed comprehensively the entire flow field, providing valuable information about the regions on the blade susceptible to erosion and offering insights into the wake development downwind of the HAWT rotor (Figure 10). The findings indicate that the HAWT’s aerodynamic performance declines due to particle impact and breakup on the blade.
Table 4. Various airfoil and HAWT types tested in bibliography for hailstorm conditions.
Author Investigation Method HAWT or airfoil type Main Conclusions
Fiore et al. [123] numerical DU 97-W-300 airfoil
DU 96-W-212 airfoil
DU 96-W-180 airfoil
Thinner airfoil sections captured more raindrops and hailstones.
Hailstones generated significant impact forces at the blade’s leading edge due to their trajectory angle.
Raindrops were more influenced by the blade’s flow field and angle of attack, affecting their impact force.
Raindrop erosion rate correlated with the cube of the blade’s relative wind velocity, while impact force followed a power-law relationship with wind velocity squared.
Douvi et al. [124] numerical S809 airfoil Hailstorms significantly affect airfoil aerodynamics, leading to decreased lift coefficients and increased drag coefficients compared to normal airflow.
These effects were particularly notable at the airfoil’s trailing and leading edges.
Douvi et al. [125] numerical NACA 0012 airfoil Hailstones and water droplets impacting the airfoils fragmented into smaller particles, and shadow zones were observed.
Increasing the angle of attack resulted in a wider distribution of smaller hailstones on the airfoil’s upper surface and a higher concentration below it.
The power coefficient prediction for a three-bladed HAWT indicated a decrease during hailstorm conditions.
Douvi and Douvi [126] numerical S809 airfoil The airfoil’s upper surface near the leading edge consistently had the highest wall film height, suggesting that particle accumulation contributes to airfoil aerodynamic deterioration, especially at the leading edge.
The shape of wall film curves implies the water film’s wavy shape on the airfoils.
Increasing the angle of attack led to reduced water accumulation on the upper surface and more on the lower surface of the airfoil.
Decrease of power coefficient of a three-bladed HAWT using the S809 airfoil profile during hailstorm conditions across different tip speed ratios.
Douvi et al. [127] numerical Optimized three-bladed HAWT with blades constructed by S809 airfoil The turbine’s power decreases by 6.4% at an wind speed of 10 m/s and by 3.0% at 15 m/s under hailstorm conditions.
Hailstorms create rings of varying speeds and diameters in the wake, weakening the wake.
Particles are concentrated on the pressure side and mainly on 50% of the blade near the hub.
With increased air velocity, particles move closer to the hub and appear on the upper surface, causing erosion.

3.4. Dust and sand

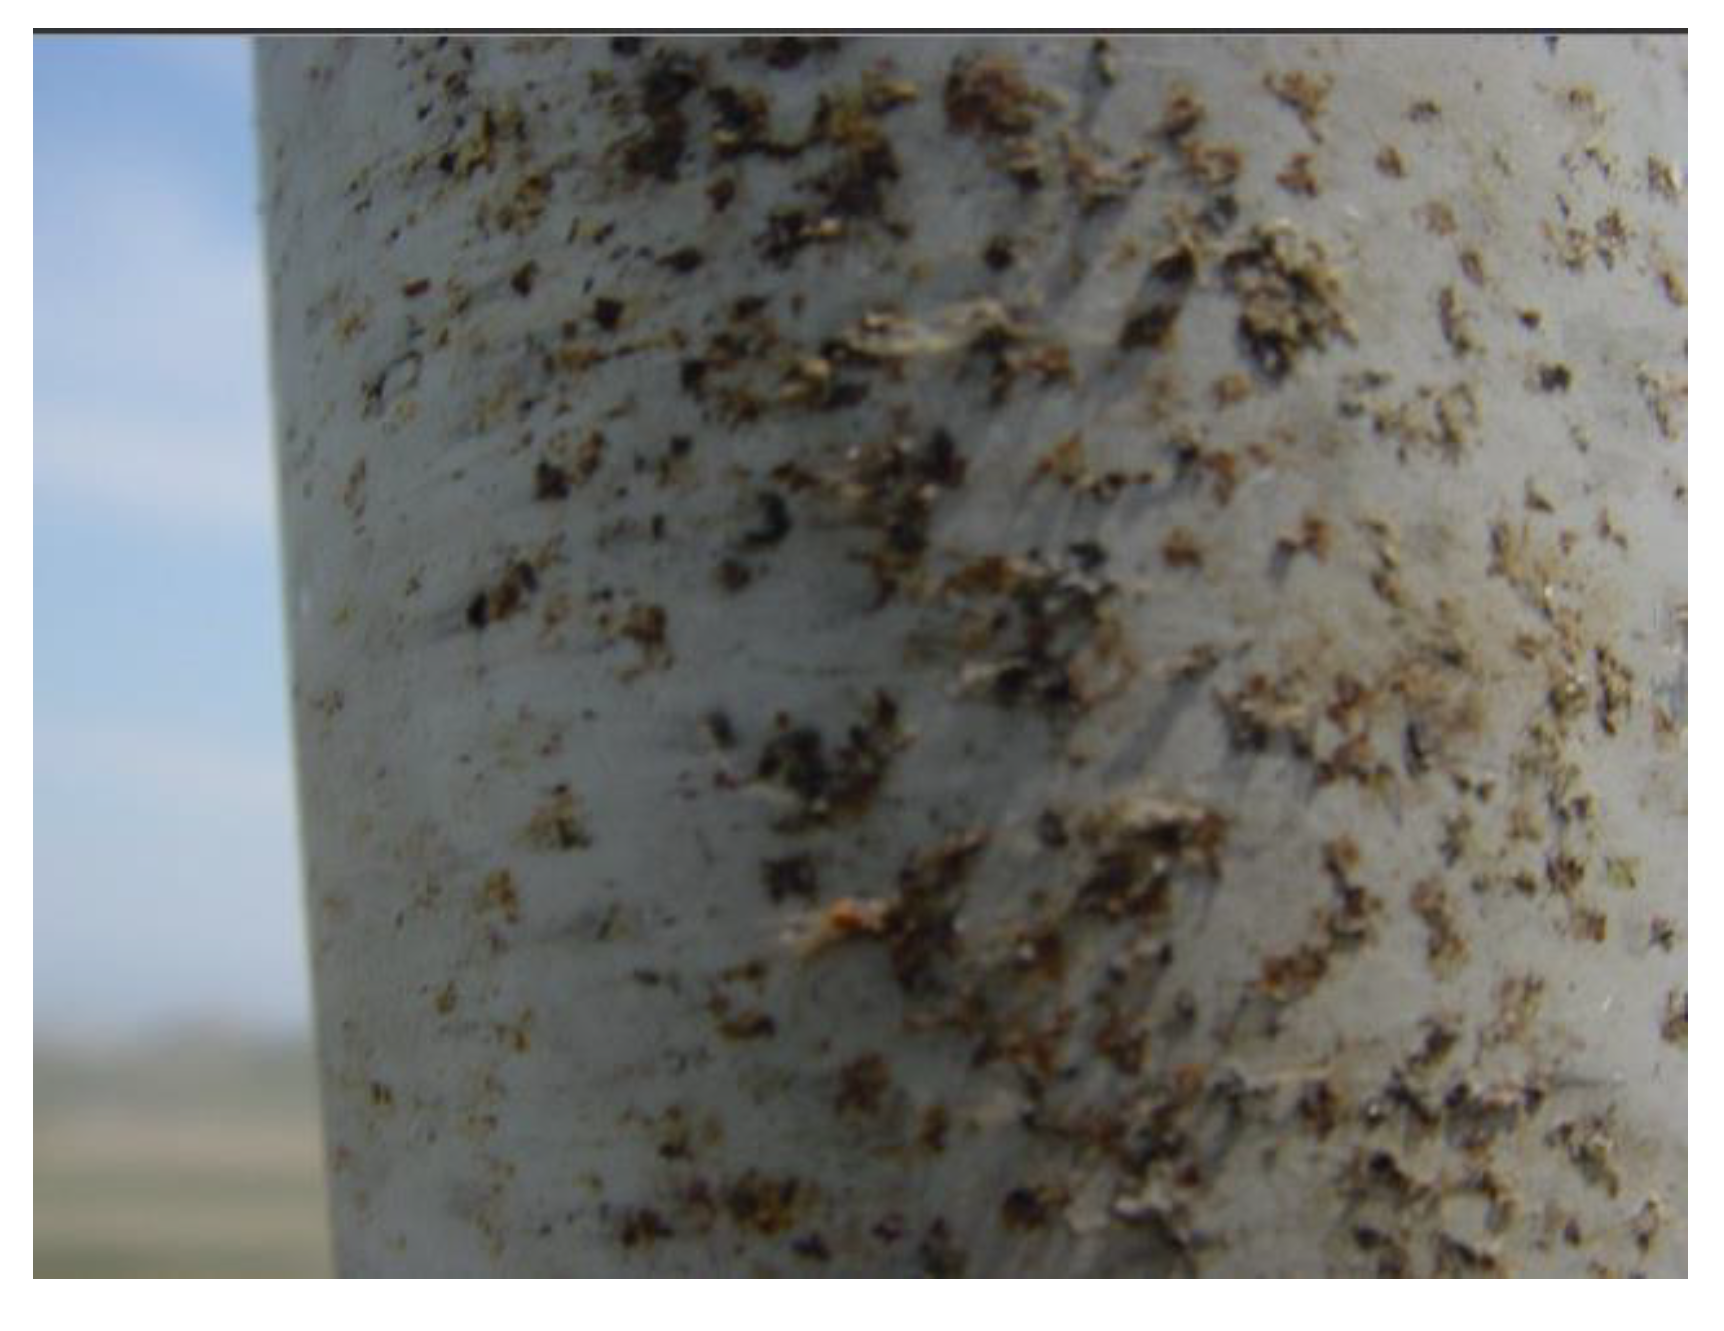
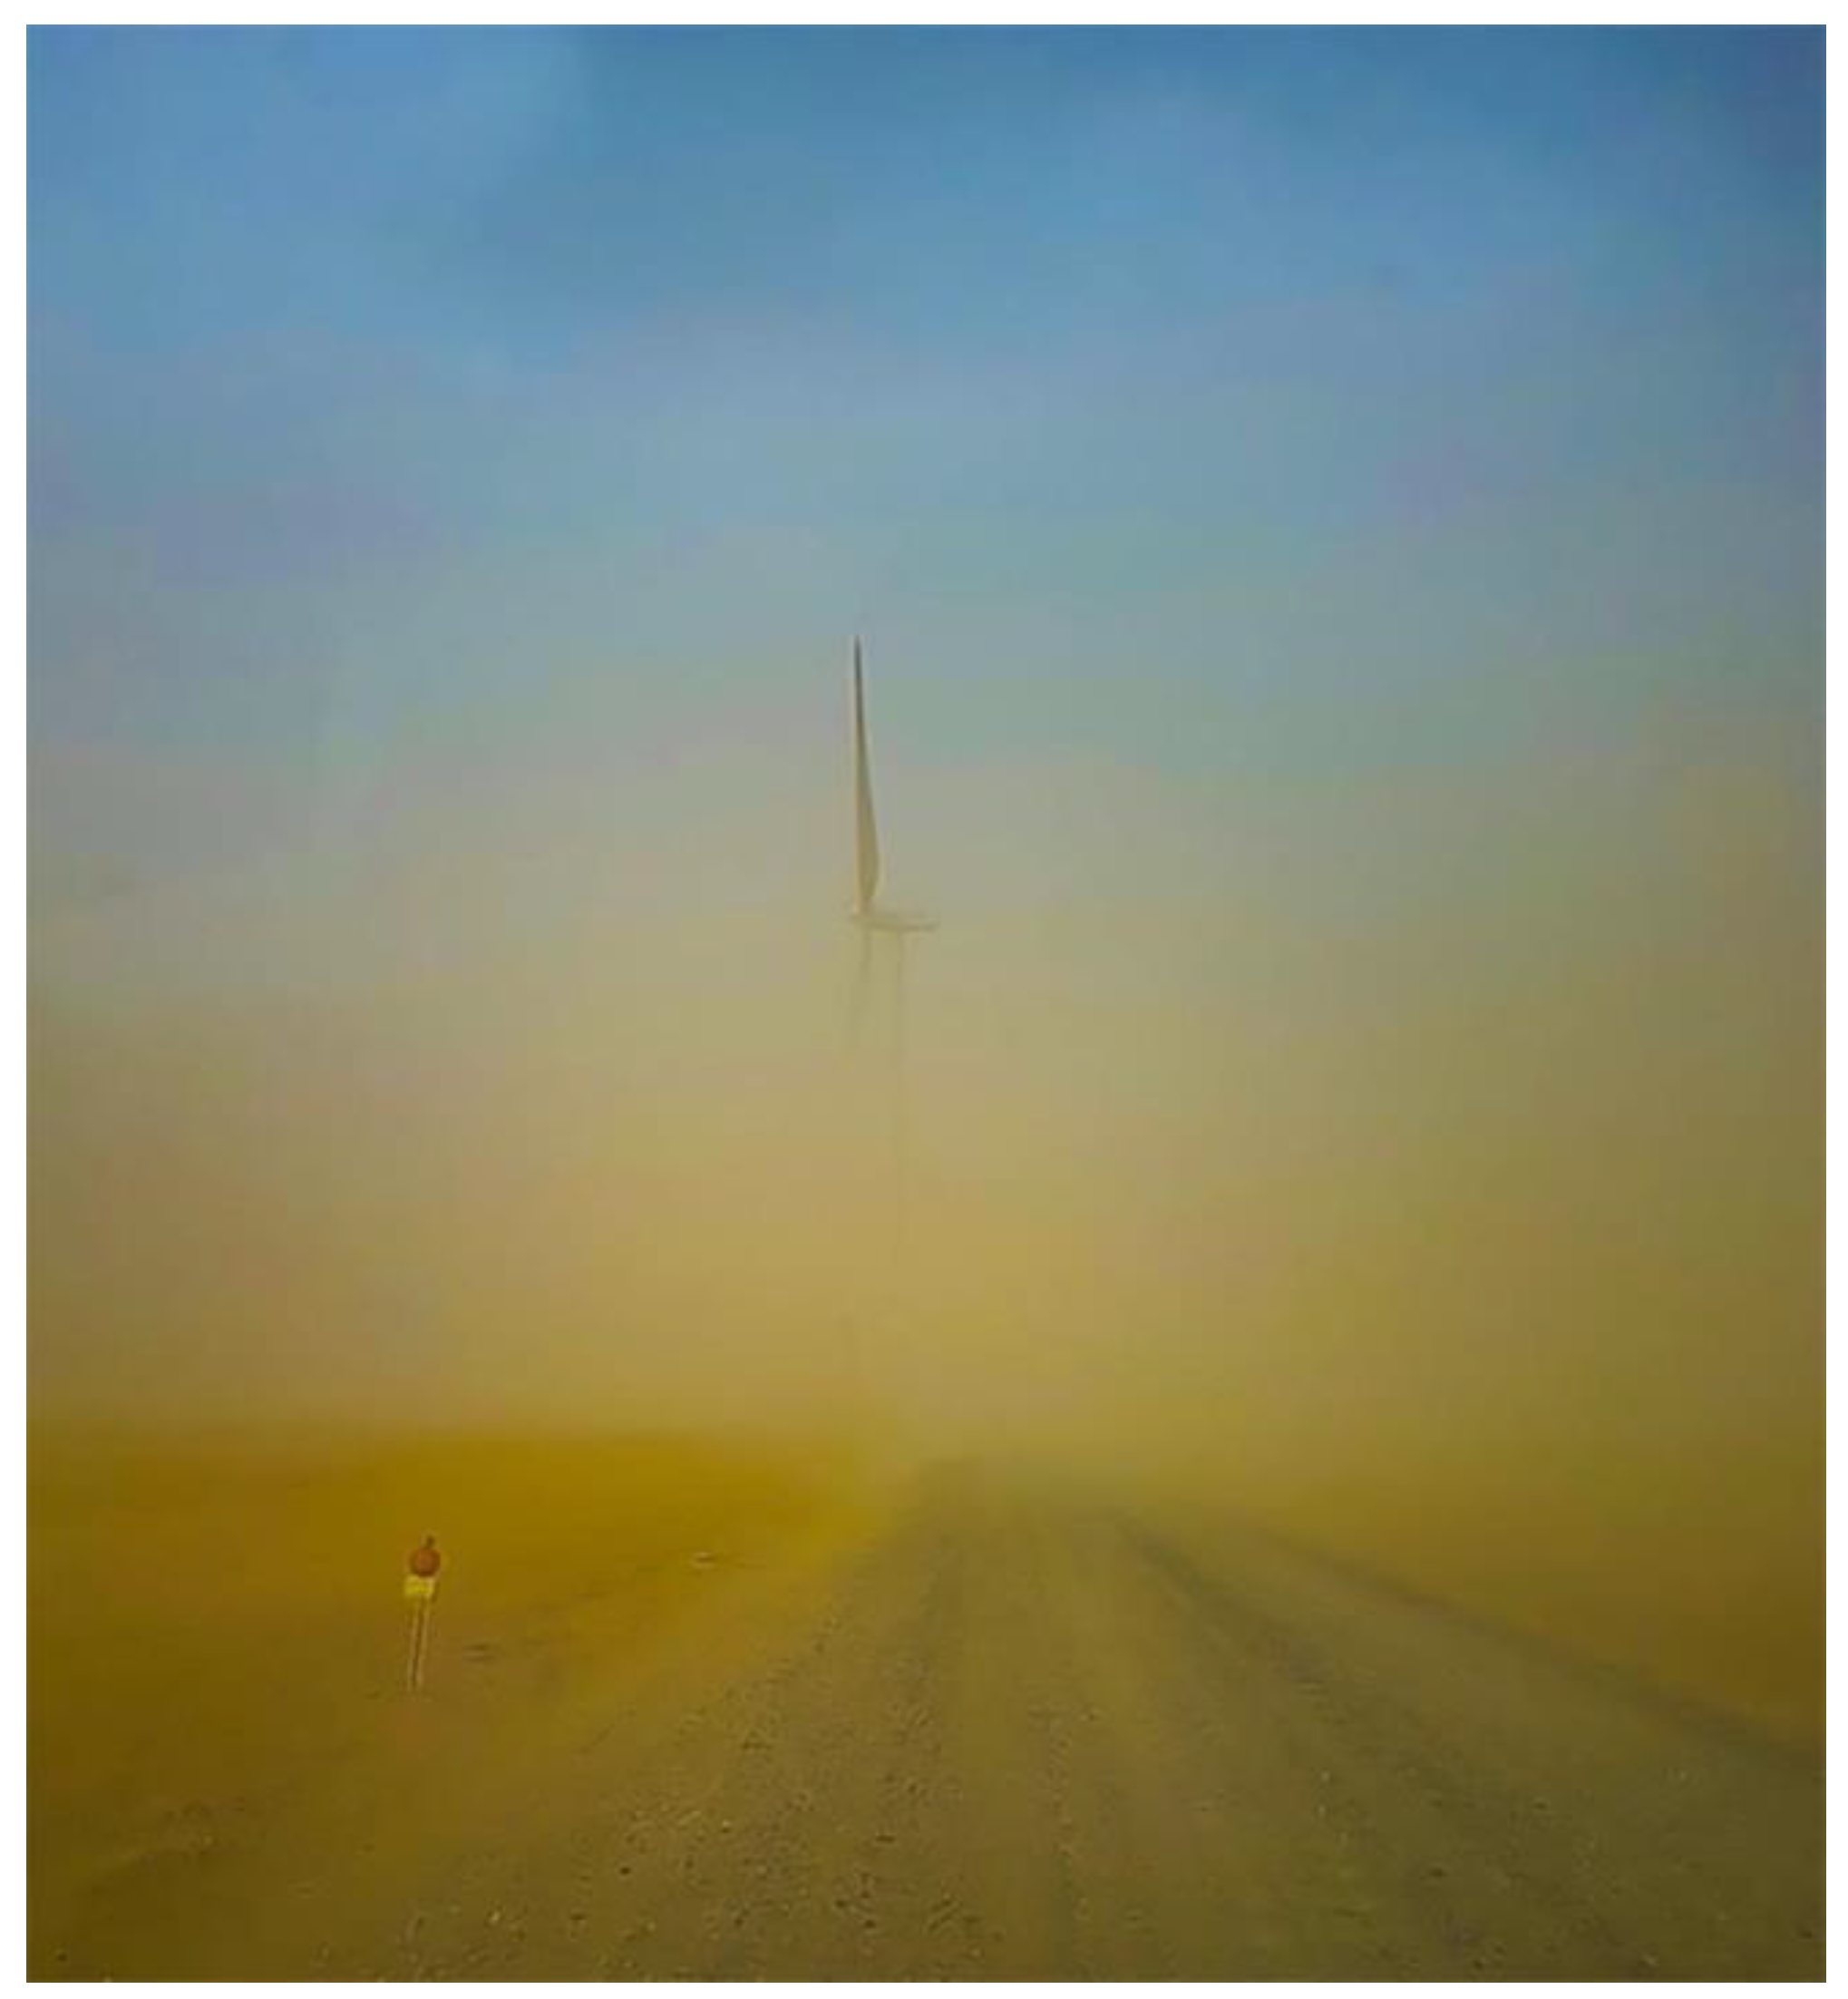
In regions with warm and dry climates, sand and dust often represent prevalent airborne particles, which potentially results in leading edge erosion concerns (Figure 11). However, in greener and wetter environments, this problem might not exist. Additionally, coastal areas may face significant threats from sand erosion. In general, dust accumulation on the blade surface can increase drag force and reduce lift force, ultimately reducing power output.
The first serious discussions and analyses of blade surface roughness caused by dust accumulation on HAWT performance emerged in 2007 with Khalfallah and Koliub [128]. Their experimental investigation focused on a stall-regulated, 300 kW HAWT, analyzing the mechanism of dust buildup and accumulation on the blade surface over the turbine’s operational period. Furthermore, the research evaluated the impact of dust on the performance of a pitch-regulated 100 kW HAWT and compared these findings with those of the 100 kW stall-regulated HAWT. They concluded that the effect of dust on HAWTs depends on various factors, including rotor speed and specifications, nacelle height from ground, power-regulation type, and wind farm site conditions.
Khakpour et al. [129] examined the way that sand particles impact the performance of the primary airfoil in a HAWT. They compared the flow pattern and pressure distribution in dusty conditions to those in uniform flow, considering different angles of attack. The findings demonstrate that introducing sand particles reduces the pressure coefficient on the airfoil, leading to lower drag coefficients. This effect is more pronounced with fine sand particles and diminishes gradually as the particles become coarser. The lift coefficient shows little sensitivity to changes in sand particles, except at high attack angles. At high angles of attack, small particles result in the highest erosion rate, while coarse particles cause maximum erosion at zero angle of attack. Their study also investigated the effects of different sand-to-air drift velocities. The results indicate that larger drift velocities yield more noticeable changes. Furthermore, when examining various sand-to-air mass flow rate ratios, it becomes evident that the discrete phase formulation is inaccurate as it fails to consider the effects of particle collisions. However, the findings regarding pressure distribution demonstrate that increasing particle mass flow rate ultimately decreases the pressure coefficient, particularly in the downstream region.
Several researchers used the two-dimensional Navier Stokes equations and the SST k-ω turbulence model to simulate the aerodynamic performance of plenty HAWT airfoils operating in dusty environment. Ren and Ou [131] studied numerically the flow past NACA 63-430 airfoil, a common HAWT airfoil, under both clean and rough surface conditions. Lift and drag coefficients of the NACA 63-430 airfoil were computed for varying roughness heights, areas, and locations, corresponding the buildup of dust on HAWT blade surfaces during their operation in natural environments and highlighting their role in promoting transition to turbulence and flow separation. Critical values for roughness height, area, and location were determined. The airfoil’s performance under different operational periods was simulated, leading to a recommended cleaning frequency of 3 months without rain for HAWT blades surface. The study revealed that airfoil performance is highly affected by small roughness height, and particularly for the NACA 63-430 airfoil, the location of roughness within the front 50% of the chord length has a significant impact on its performance.
Li et al. [132] studied also computationally another airfoil used in HAWT blades construction, the DU 95-W-180 airfoil. Their study examined the impact of surface roughness on airfoil performance, including lift and drag coefficients under various roughness heights and locations. Critical values for roughness height and location were identified, and the study explored how lift and drag coefficients changed according to roughness height at these critical locations. It was found that for smooth surface up to 0.5 mm roughness height lift coefficient increases and drag coefficient degreases rapidly. For roughness height higher than 0.7 mm the aerodynamic coefficients change is slower.
Salem et al. [133] developed a computational fluid dynamics (CFD) model merged with a deposition model to evaluate the performance degradation of HAWTs, with NACA 63-215 airfoil, operating in the dusty regions of North Africa and Middle East. Their results agreed well with the results of Ren and Ou [131] and Li et al. [132] and they proposed the same frequency of blades cleaning with Ren and Ou [131]. They concluded that roughness contributes to the premature transition to turbulent boundary layer.
Wu et al. [134] simulated the impact of the presence of contaminants on the surface of HAWT airfoil, FFA-W3-211 airfoil, on their aerodynamic performance. The airfoil surface was evenly roughened, with roughness heights ranging from 0.03mm to 2.0mm. By dividing the airfoil into 18 sections, the lift and drag coefficients were analyzed, as the locations of significant roughness varied. To determine the airfoil’s sensitivity, the results obtained from XFOIL and CFD calculations were compared. Consequently, the areas of the airfoil surface that were most affected by surface roughness were identified, both on the suction site (at 53% and 92% distances from the chord line towards the leading edge) and the pressure site (at 44% and 88% distances). The presence of sensitive roughness at these locations caused a delay in the transition point.
Fiore and Selig [135,136] conducted a numerical investigation on simulating collisions of sand grains on a 1.5 MW HAWT blade, constructed by DU 97-W-300, DU 96-W-212 and DU 96-W-180 airfoils along the blade. The goal of sand simulations is to ascertain the rate of surface erosion. The findings suggest that the locations where particles impact the blade sections depend on the airfoil type, the local angle of attack, the local freestream velocity, and the particles. Sand particles predominantly collided in the vicinity of the blade’s leading edge and the erosion rate was highest on the low-pressure side of the HAWT blade. The erosion rate at a radial position of r/R = 0.75 exhibited an approximately tenfold increase compared to the inboard section located at r/R = 0.35. In the vicinity of the leading edge, steep angles of impact were observed, resulting in a minimum erosion rate. However, as the blade section moved slightly downstream, the erosion rate reached its maximum value.
Fiore and Selig [137] optimized HAWT airfoils, which are subjected to erosion due to the collisionct of sand grains on the leading edge of the rotor blades. For the optimization, a genetic algorithm was coupled with XFOIL and BugFoil. The impact of sand impingement on the blade surface generates two distinct erosion peaks situated at a certain distance from the leading edge. These erosion peaks are susceptible to displacements influenced by factors such as angle of attack, diameter of sand particles, and velocity inlet. The study also examined the impact of different airfoil shapes on erosion rates. Results revealed that a bulbous upper leading edge facilitates downstream movement of the erosion rate peak, whereas a flat slanted inclined lower surface of the leading edge allows particles to decelerate, resulting in surface impacts at nearly perpendicular angles.
Fiore and Selig [138] used a time-stepping algorithm to predict the final form of HAWT blades affected by erosion caused by sand and determined the key factors influencing blade lifespan. The most significant factor was the sand particles diameter, with the lifespan of the blade decreasing parabolically as the particle’s diameter increases. The blade’s lifespan is influenced positively for higher lift coefficients and turbine hub heights. Furthermore, the longest observed lifespans for airfoils with bulbous and rounded leading edges, along with moderately aft-cambered airfoils.
Diab et al. [139] compared the contamination sensitivity of various airfoil shapes, DU NACA and NREL, commonly used in HAWT blades and investigated the potential application of a leading-edge slat in NACA airfoil to alleviate the HAWT performance deterioration due to dust. The thickness to chord ratio of the studied airfoils was ~ 15%, ~ 20% and ~ 25%. The flow of particles over the airfoil section is simulated by the help of SST k-ω turbulence model and the discrete phase model. The findings suggest that HAWT airfoils designed with low surface contamination sensitivity exhibit superior performance under dusty conditions. Additionally, the introduction of a leading-edge slat impacts the aerodynamics of the particle-laden flow, offering a potential solution to mitigate the detrimental effects of surface contamination, which would otherwise necessitate costly frequent cleaning.
Srinivasan and Surasani [140] examined the way that surface fouling affects NREL S814 and NREL S826 airfoils, at two Reynold’s numbers. Surface fouling was simulated by adding roughness at the leading edge of the airfoil. The research findings indicate that the transition model accurately predicts flow over clean airfoils, while the fully turbulent model provides a more precise representation of surface fouled conditions. A comparison between normal operating conditions and surface fouled conditions reveals that the Reynold’s number doesn’t significantly impact the aerodynamic performance of both airfoils. Furthermore, the S826 airfoil, which is thinner, demonstrates greater resistance to performance degradation caused by surface fouling compared to the S814 airfoil.
Jafari et al. [141] studied numerically the viscous and turbulent flow over an E387 airfoil and a turbine blade. The primary aim of their study was to explore different arrangements of roughness to minimize the negative effects caused by rough surfaces. To achieve this, sand grain roughness was evenly distributed along the suction side, the pressure side, and both sides during manufacturing. Their findings suggest that, contrary to previous research, applying roughness exclusively to the pressure side of the airfoil proves beneficial. Under this configuration, the lift coefficient increases by 8.62% compared to an airfoil with rough surfaces and by 1.2% compared to an airfoil with smooth surfaces. However, the lift coefficient of the blade with roughness on the pressure surface is slightly lower than the smooth blade, but the detrimental effects are considerably less compared to having roughness on the suction surface or on both sides.
Zidane et al. [142] examined the impact of debris flow on the efficiency of HAWT blades. The aerodynamic performance of an NACA 63415 airfoil is analyzed using two-dimensional incompressible Navier-Stokes equations and the SST turbulence model, considering both clean and sandy conditions. By utilizing the Discrete Phase Model, the study investigates the influence of sand particles on aerodynamic performance. Varying flow rates of sand particles are studied to determine their impact on the airfoil’s pressure and lift coefficients. The airfoil’s performance is evaluated at different angles of attack, ranging from 0° up to 10°. Findings demonstrate that the blade’s lift coefficient can decrease by 28% during sandstorms comparable to those experienced in the Gulf and South African countries.
Han et al. [143] analyzed quantitative the impact of contamination and erosion on the AEP of HAWTs. Transient CFD simulations of NACA 64-618 airfoil provided the relevant aerodynamic data, which were then applied to the tip area of the 5-MW NREL reference HAWT model to calculate the corresponding AEP losses. Blades with contaminant accumulation at the airfoil’s leading edge experienced a decrease of up to 27% in lift coefficient and an increase up to 159% in drag coefficient compared to a clean airfoil. On the other hand, blades affected by erosion at the leading edge exhibited a decrease of up to 53% in lift coefficient and an increase of up to 314% in drag coefficient. The reduction in aerodynamic performance was more pronounced in the section exposed to large angles of attack (10° and higher), particularly with a greater extent of surface damage at the leading edge. In general, the computed AEP reduction varied between 2% and 3.7%, based on the degree of damage observed at the LE.
Chen and Agarwal [144] studied computationally the aerodynamic performance of the S809 and S814 airfoils in clean and dusty air conditions. In the case of clean air, the Spalart-Allmaras and the Realizable k-ε turbulence models were employed, and the obtained results were compared with experimental data to determine the preferable model. In dusty air conditions, the Realizable k-ε model and the discrete phase model (DPM) were used, considering two different dust particle concentrations, 1% and 10% per volume. The results are compared with the clean air data to demonstrate the impact of dust contamination on the airfoil’s aerodynamic characteristics, and they concluded that the power degradation of HAWTs was more severe for 10% concentration of particles.
Guo et al. [145] simulated air-particle flows over S809, NH6MW25 and NACA 0012 airfoil. The results showed that a slight decrease in performance occurs in attached flow due to momentum loss in the boundary layer. However, when flow separation occurs, the performance degradation becomes more severe, primarily due to a more extensive separation caused by particles. In contrast to NACA 0012 airfoil, the other two airfoils exhibit a specific angle of attack in the light stall region that is most sensitive to particles. At this angle, the decrease in lift and the increase in drag reach their peak values. For the S809 airfoil, the most sensitive angle of attack is approximately 3° greater than the maximum lift-to-drag ratio angle. They concluded that the presence of particles has a significant impact on the aerodynamic performance of HAWTs.
ElMessiry et al. [146] studied numerically the impact of dust on the aerodynamic performance of the same airfoil families with same thickness to chord ratios with Diab et al. [139]. The results revealed that fouled airfoils generally experienced a decrease in lift coefficient, ranging from 17% to 75%, along with an increase in drag coefficient compared to the clean conditions. Most airfoils demonstrated a 40% drop in lift coefficient. Among airfoils operating in clean conditions, the DU 84-132V3 displayed greatest performance, although it cannot guarantee the same level of performance when exposed to dusty environments, which can alter the airfoil’s geometry. The NACA 63-215 airfoil demonstrated the least sensitivity to dust accumulation, exhibiting excellent performance across different angles of attack and only experiencing a minor decrease in aerodynamic performance compared to other airfoils.
Douvi et al. investigated numerically the aerodynamic characteristics of S809 [147,148] and NACA 0012 [149,150] airfoils within a Reynolds number range of 1×10⁶ to 3×10⁶, while considering different concentrations of sand particles in the airflow. The findings revealed that irrespective of the airfoil type and Reynolds number, an increase in angle of attack and sand particle concentration leads to elevated degradation of performance. Based on the examination of a three-bladed HAWT with blades utilizing these airfoils, it has been observed that the inclusion of sand particles leads to a reduction in the power coefficient, influenced by both the twist angle of the blades and the concentration of sand particles in the airflow. Moreover, the concentration of sand particles suggested a tendency for particle accumulation predominantly on the upper surface and in the region extending from the leading edge to the central area of the lower surface, particularly at small angles of attack. As the angle of attack increases, particle concentration narrowed down to a smaller section of the airfoil.
Douvi et al. [151] studied the aerodynamic efficiency of a HAWT operating in a dusty environment with varying dust concentrations in the flow domain. An optimized rotor for a three-bladed HAWT, constructed with S809 airfoil blades, was calculated using the user-friendly TTBEM application [119] and designed by QBlade [152]. Additionally, numerical simulation was carried out, with the MRF model accounting for blade rotation and the DPM model handling dust injection into the flow field. The findings of this investigation confirmed that the aerodynamic performance of a HAWT is negatively affected when operating in dusty environments. The power output of the HAWT was found to decrease between 1.24% and 9.04%, depending on the conditions. The visualization of the flow field revealed that as the concentration of sand particles in the air increased, the wake became weaker and the minimum velocity values decreased. At higher wind speeds, the velocity distribution pattern remained consistent, but the range of values increased, and the wake dissipated more rapidly. Furthermore, sand particles tended to accumulate more towards the hub, and as the concentration and wind speed increased, the particles on the rotor became more abundant (Figure 12). Moreover, it was observed that the particles were mainly dissipated near the leading edge along the blade and on the pressure surface, where static pressure reached its highest values. Approaching the hub, the particles concentrated over a larger area on the blade’s pressure surface, negatively impacting the power produced by the HAWT. The regions with the highest dissipation rate of sand coincided with those with the highest erosion rate (Figure 13).
Zare et al. [153] used numerical methods to examine the performance of the NREL Phase VI HAWT, operating under clean and dusty air. They investigate how the aerodynamic performance of the turbine is affected by variables such as wind speed (ranging from 5 to 25 m/s), particle diameter (ranging from 0.025 to 0.9 mm), and angle of attack (ranging from 0° to 44°). Their findings reveal that the HAWT’s performance declines in dusty conditions, particularly for particle diameters larger than 0.1 mm and when it is in a post-stall state. The average power generated decreases by 4.3% and 13.3% for air with particles of 0.05 mm and 0.9 mm diameter, respectively. The presence of particles significantly alters the flow field, resulting in a reduced pressure difference between the suction and pressure sides of the blade, an increased separation of the boundary layer, and strengthened recirculation zones.
Table 5. Various airfoil and HAWT types tested in bibliography for hailstorm conditions.
Author Investigation Method HAWT or airfoil type Main Conclusions
Khalfallah and Koliub [128] experimental Nordtank 300 kW HAWT The impact of dust on HAWTs depends on rotor speed, specifications, nacelle height, power regulation, and wind farm site conditions.
Khakpour et al. [129] numerical S819 airfoil Introducing sand reduces airfoil pressure, lowering drag.
Fine sand particles have a stronger effect than coarse particles.
Lift remains mostly unaffected by sand, except at high angles of attack.
Small particles erode the most at high angles, while coarse particles erode the most at 0°.
Increasing particle mass flow rate lowers pressure coefficient in the downstream region.
Ren and Ou [131] numerical NACA 63-430 airfoil HAWT blade performance is greatly influenced by small roughness height.
Roughness located in the front 50% of the chord length significantly affects performance.
It is recommended to clean the blades every 3 months if there is no rain.
Li et al. [132] numerical DU 95-W-180 airfoil For a smooth surface with roughness heights up to 0.5 mm, the lift coefficient increased while the drag coefficient decreased significantly.
For roughness heights greater than 0.7 mm, the changes in aerodynamic coefficients were more gradual.
Salem et al. [133] numerical NACA 63-215 airfoil Their findings aligned with Ren and Ou [131] and Li et al. [132].
Roughness leads to an early shift to turbulent boundary layer.
Wu et al. [134] numerical FFA-W3-211 airfoil The rough areas on the airfoil surface were at the suction site (53% and 92% from the chord line towards the leading edge) and the pressure site (44% and 88% distances).
These rough areas caused a delay in the transition point.
Fiore and Selig [135,136] numerical 1.5 MW HAWT blade, constructed by DU 97-W-300, DU 96-W-212 and DU 96-W-180 airfoils along the blade The blade sections where particles hit depend on the type of airfoil, angle of attack, freestream velocity, and particles themselves.
Sand particles mostly collide near the blade’s front edge, causing the highest erosion rate on the low-pressure side.
At a radial position of r/R = 0.75, the erosion rate increased tenfold compared to the inboard section at r/R = 0.35.
Steep impact angles were seen near the front edge, minimizing erosion.
Moving slightly downstream, the erosion rate reached its maximum.
Fiore and Selig [137] numerical DU 96-W-180, DU 96-W-212, and DU 96-W-250 airfoils The erosion from sand impacts creates two peaks on the blade surface, which can shift due to angle of attack, particle size, and inlet velocity.
A rounded upper edge helps the erosion peak move downstream, while a flat inclined lower edge causes particles to slow down, resulting in impacts at nearly perpendicular angles.
Fiore and Selig [138] numerical DU 96-W-180, S804, S810, S813, S817, S820, S821, S828, and S832 airfoils The sand particle diameter affects the blade’s lifespan. Larger diameters decrease lifespan.
Higher lift coefficients and turbine hub heights increase lifespan.
Airfoils with bulbous and rounded leading edges, as well as moderately aft-cambered airfoils, have the longest observed lifespans.
Diab et al. [139] numerical various types of airfoils HAWT airfoils less affected by dust perform better.
Adding a leading-edge slat can reduce the negative impact of dust, avoiding frequent cleaning.
Srinivasan and Surasani [140] numerical S814 and S826 airfoils The transition model accurately predicts flow over clean airfoils, while the fully turbulent model represents surface fouled conditions better.
The Reynold’s number doesn’t significantly affect aerodynamic performance for both airfoils, when comparing normal and fouled conditions.
S826 airfoil shows better resistance to performance degradation due to surface fouling than S814 airfoil.
Jafari et al. [141] numerical E387 airfoil and a turbine blade Applying roughness only on the pressure side of the airfoil improves the lift coefficient by 8.62% compared to a rough surface and by 1.2% compared to a smooth surface.
Roughness on the pressure side has a smaller negative impact on the lift coefficient compared to roughness on the suction side or both sides.
Zidane et al. [142] numerical NACA 63-415 airfoil Lift coefficient can decrease by 28% during hailstorm conditions.
Han et al. [143] numerical NACA 64-618 airfoil Blades with sand on their leading edge had 27% less lift and 159% more drag.
Eroded blades at the leading edge had 53% less lift and 314% more drag.
The impact was worse at high angles (10° and above) and the damaged area was wider at the leading edge.
Energy production dropped by 2% to 3.7%, depending on the level of damage at the leading edge.
Chen and Agarwal [144] numerical S809 and S814 airfoils 10% dust concentration caused more severe power degradation for HAWTs.
Guo et al. [145] numerical S809, NH6MW25 and NACA 0012 airfoils When flow separation happens, the performance degradation worsens due to more extensive separation caused by particles.
Unlike the NACA 0012 airfoil, the other two airfoils have a specific angle of attack in the light stall region that is highly influenced by particles.
For the S809 airfoil, the most sensitive angle of attack is about 3° higher than the angle for maximum lift-to-drag ratio.
ElMessiry et al. [146] numerical same airfoils with Diab et al. [139] Most airfoils experienced a significant 40% decrease in lift.
The DU 84-132V3 airfoil performed well under clean conditions, but its performance was uncertain in dusty environments due to changes in the airfoil’s geometry.
The NACA 63-215 airfoil was the least affected by dust accumulation and maintained good performance at different angles of attack with only a minor decrease.
Douvi et al. [147,148] numerical S809 airfoil Increasing the angle of attack and sand particle concentration degrades the performance of a three-bladed HAWT, regardless of Re.
The power coefficient decreases due to sand particles, influenced by blade twist angle and particle concentration in the airflow.
Douvi et al. [149,150] numerical NACA 0012 airfoil Sand particles tend to accumulate on the upper surface and from the leading edge to the central area of the lower surface, especially at small angles of attack.
With higher angles of attack, particle concentration narrows to a smaller section of the airfoil.
Douvi et al. [151] numerical Optimized three-bladed HAWT, constructed by S809 airfoil blades The power output of the HAWT decreases by 1.24% to 9.04% depending on conditions.
As sand particle concentration in the air increases, the wake becomes weaker and minimum velocity decreases.
Sand particles tend to gather more at the hub, and as concentration and wind speed rise, the particles on the rotor become more abundant.
Approaching the hub, particles gather over a larger area on the pressure surface, negatively impacting power production.
The areas with the highest sand dissipation rate correlate with the highest erosion rate.
Zare et al. [153] numerical NREL Phase VI HAWT The HAWT’s performance decreases in dusty conditions, especially when it’s in a post-stall state and for particle diameters > 0.1 mm.
The average power generated decreases by 4.3% and 13.3% for particles with diameters of 0.05 mm and 0.9 mm, respectively.
Particles significantly change the flow, reducing the pressure difference between the blade’s suction and pressure sides, increasing the separation of the boundary layer, and strengthening recirculation zones.

3.5. Humidity

In recent years, there has been a rise in the installation of large offshore HAWTs to harness the considerable potential of wind energy. Although offshore wind resources are plentiful, stronger, and more consistent compared to those on land, offshore HAWTs are typically operating in environments with high humidity. Consequently, the measurement of HAWT power curve based on the IEC standard is conducted onshore, often in environments with lower to moderate humidity.
When the air contains a significant amount of moisture, it can lead to condensation on the surface of the rotating blades. This condensation, especially during winter weather, can result in reduced blade performance due to contamination or the formation of ice. Additionally, in the mornings, foggy or rainy conditions are frequent around offshore wind farms. These conditions cause tiny water droplets to mix with the air, and when they collide with the rotating blades, it increases drag and negatively affects turbine performance. Offshore HAWTs are more prone to corrosion due to exposure to seawater and high humidity. Consequently, they need to be designed with greater durability to minimize maintenance, mainly because the transportation of maintenance crews and replacement parts to and from offshore wind plant sites incurs high costs.
Yu et al. [154,155] simulated the effects of different humidity levels on airfoil/blade aerodynamics and the impact of water condensation on HAWT blades. Their analysis revealed that high humidity significantly affects density under high-temperature conditions but has minimal impact on airfoil/blade aerodynamics. Additionally, water vapor condensation occurs on the airfoil or blade surfaces, primarily around the leading and trailing edges. This phenomenon leads to blade contamination, particularly in dirty environments with dust, insects, or during winter and low-temperature conditions conducive to icing. When contamination occurs, the performance of the HAWT can be considerably degraded. Their study also found that on foggy days, water droplets in humid air contaminate on the airfoil surface, forming a water film that alters the flow of the boundary layer, leading in increased drag and diminished performance. The findings from these studies are confirmed by similar findings of performance losses on rainy days.

3.6. Insects

In high winds, the presence of flying insects around turbines is infrequent, ensuring that turbines operating under steady high-wind conditions stay free from contamination, thereby maintaining constant power levels. However, during high winds, the angle formed between the airflow and the blades increases, causing the aerodynamic suction peak to shift toward the leading edge. If the leading edge is already covered with deceased insects from a prior low-wind period, the resulting power output will decrease. The level of contamination at the suction peak directly affects blade stall and lift loss. Consequently, after each low wind period, the amount of insect contamination may vary, leading to different power levels being produced in high winds [7].
In recent times, the impact of insect contamination on HAWT performance has gained recognition, although it was not previously regarded as a significant cause of power loss. Observations at wind farms in California [7,156] have revealed varying power levels among different turbines operating under the same wind speed.
Figure 14. Contamination of insects on HAWT blade [157].
Preprints 86437 g014
To investigate this phenomenon, Corten and Veldkamp [156] proposed and tested experimentally multiple hypotheses. Among these, they confirmed the plausibility of insect accretion on HAWT blades, primarily occurring during low-speed winds when insects are capable of flight. At such speeds, the roughness caused by insects has a negligible effect on power production. Though, at higher wind speeds, there is a notable decline in power output due to the increased surface roughness resulting from insect contamination. Furthermore, the level of contamination is found to rely on atmospheric conditions during insect flight, particularly when the temperature is above 10 °C and there is no rain. Additionally, insect density decreases rapidly from ground level to an altitude of 150 m [158]. Insect-free environments are more prevalent in very low temperatures and low humidity [159]. The conditions conducive to insect contamination are illustrated in Figure 15. The observed increase in the power curve is attributed to the cleaning effect of rainfall on the turbine blades.
To ascertain the validity of the hypothesis, an experimental investigation was conducted utilizing two adjacent HAWTs situated within the same wind park. The initial HAWT, designated as the clean HAWT, underwent natural exposure to insect contamination, while an artificial surface roughness was intentionally introduced to the second HAWT. Throughout the experiment, the power outputs of both HAWTs were periodically documented. Initially, the first HAWT exhibited greater power output compared to the second one. However, as the contamination level gradually escalated, the power output of the first HAWT progressively declined, eventually aligning with the power production of the second one, which means that the accumulation of natural contamination resulted in a degree of surface roughness equivalent to that of the second HAWT. These findings effectively confirm the hypothesis that the accumulation of insects on the blade surface, by augmenting its roughness, results in a reduction in power output [156].
Janiszewska et al. [160,161] studied experimentally the LS(1)-0417MOD and the S814 airfoils, under clean and rough conditions. Field measurements on the leading-edge area of a HAWT blade uncovered that the average grain size of the typical roughness resulting from insect contamination on HAWT blades ranged from 0.5mm to 0.9mm. The density of these rough elements varied from 1.25 to 5 particles per cm2. The roughness design was based on the measurements from the HAWT, leading to a 41% and 24% decline in maximum lift coefficient and a 36% and 60% increase in minimum drag coefficient, for LS(1)-0417MOD airfoil and S814 airfoil, respectively. Similar wind tunnel experiments were performed on NACA 4415, S801, S809 and S813 airfoils [162,163,164,165], using the same roughness design with Janiszewska et al. [161]. The results indicated a reduction of up to 20%, 12%, 19% and 12% in maximum lift coefficient for NACA 4415, S801, S809 and S813 airfoils, respectively, and an increase greater of 50% for all airfoils tested.
Ferrer and Munduate [166] conducted CFD analyses to determine S814 airfoil performance under clean and rough surfaces, by simulating contamination during the operational lifespan of HAWTs. The roughness pattern for the S814 tests was a molded insect pattern sourced from an actual HAWT in the field and the results agreed with the corresponding data from Janiszewska et al. [161]. The results indicate that contamination-induced roughness has a more detrimental impact on aerodynamic behavior of the airfoil than boundary layer transition. The aerodynamic degradation reached 60% for lift to drag ratio for moderate angles of attack.
Wilcox et al. [167] developed a simulation code to establish the connection between airfoil type, insect collision areas, and roughness sensitivity. They determined representative insect collection patterns for various airfoil shapes and used these data to simulate roughness on a NREL S814 airfoil, which tested experimentally at various Reynolds numbers. The obtained results were then compared to the results of Ehrmann [168], for NACA 633-418 airfoil. The analysis revealed that increasing roughness density and height led to a reduction in maximum lift, lift-to-drag ratio, and lift curve slope. It was observed that the S814 airfoil exhibited heightened sensitivity to roughness in comparison to the NACA 633-418 airfoil. To quantify the AEP losses, blade-element-momentum analysis was employed. It was determined that a NACA 633-418 HAWT experienced a 4.9% decrease in energy production, while a S814 HAWT encountered a slightly higher reduction of 6.8%.
Fiore and Selig [135,136] studied numerically except the sand grains, the collisions of insects and on a 1.5 MW HAWT blade. The debris thickness on the blade was estimated through insect simulations. The findings suggest that the locations of particle impact on the blade sections are influenced by factors such as the airfoil type, the local angle of attack, the local freestream velocity, and the particles. Collisions between insects and sand grains were predominantly observed near the leading edge of the blade. The highest volume of insect debris per unit span was found at r/R = 0.75.

3.7. Sea spray

The impact of sea spray on offshore HAWTs is a significant concern, specifically regarding the leading edge of the HAWT blades. The effects of sea spray on the blades are expected to resemble those of rain, involving forces, pressures, and individual impact events. However, there are situations where larger volumes of sea spray water may rapidly impact the blades. Another aspect to consider when addressing particulate impact is the presence of sea salt crystals in the sea spray. Airborne sea salt crystals pose a challenge in various offshore applications, primarily leading to their accumulation on components. The problem of salt-contaminated blades was considered during the study of lightning protection measures for HAWTs [169,170,171]. Moreover, since seawater typically contains 3–3.5% NaCl [172], corrosion becomes a significant concern for metallic elements. Consequently, the accumulation of salt crystals on the leading edge of the blade results in deterioration in aerodynamic performance and potentially in corrosive damage. Despite its significance, limited research has been conducted on this subject thus far.

4. Conclusions

The escalating effects of global climate change, including the rise in greenhouse gas concentrations and the depletion of fossil fuel reservoirs, have spurred a substantial surge in the demand for alternative energy sources. Among these, wind energy stands out as a highly promising solution due to its comparatively lower cost and minimal environmental impact. It is crucial to examine the impact of various meteorological phenomena on the performance of typical HAWTs, as this knowledge is essential for enhancing their design and overall efficiency.
The aim of the present research was to examine the changes in aerodynamic performance of HAWTs operating under hazard environmental conditions. Various conditions were reviewed, such as icing, rainfall, hailstorm, high concentration of dust, humidity, insect collisions and sea spray.
All of the studies reviewed here support the hypothesis that when HAWTs operate under these conditions experience a decrease in lift and a simultaneous increase in drag, which leads to aerodynamic performance degradation. Since the aerodynamic performance is directly connected to the power output of HAWTs, efforts should be implemented to mitigate these losses.
Researchers have dedicated significant attention to the study of ice accumulation and its impact on the aerodynamic characteristics of airfoils and blades. The research on this topic was popular in cold regions, like Norway and Canada. More extensive research has been conducted involving ice due to the convenient observation of ice formation on blades in such locations, allowing for experimental study of its effects. Consequently, computational simulation of ice conditions was relatively uncomplicated, as the study involved altering the geometry while assuming the presence of formed ice.
Contrary to ice, there is a scarcity of experimental research in the literature concerning the performance of HAWTs in rainy conditions. When HAWTs are subjected to rainy conditions, rain droplets accumulate on the surface of the blades or airfoils, subsequently causing a decline in aerodynamic performance.
To perform a thorough examination of HAWTs performance under various operating and environmental conditions, the Discrete Phase Model which is available in CFD codes is highly suitable for delivering accurate and intricate insights into turbine performance. This method obviates the need for expensive experimental setups at different scales by offering comprehensive and reliable information. The data obtained through the CFD approach can be utilized to optimize HAWT design, operations, and scale-up processes. This model has been used extensively to simulate the rainfall, the hailstorm, and the dust over a HAWT blade. The degradation of aerodynamic performance of a HAWT is more pronounced when faced with heavier and larger raindrops, hailstones, and sand particles, as well as higher liquid water content (LWC) and sand concentration in the air. However, a comprehensive understanding of the aerodynamic performance of offshore HAWTs in high humidity environments and in regions with sea salt remains lacking.
Countries with the most operational wind farms exhibit a notable inclination towards HAWT operation under hazard conditions, as evident from the map in Figure 16. Moreover, several airfoil types were studied, and the most popular was S809 airfoil and NACA 0012 and NACA 64-618 follow (Figure 17).
In the field of operation of HAWTs under hazardous conditions, several unresolved issues remain and need further investigation in the near future. Some of these include:
  • Operation of HAWTs in various hailstorm conditions and in environments with sea spray;
  • Design and analysis of additional airfoils and HAWT blades, aiming to optimize their performance across hazard environmental conditions;
  • Employing user-defined functions (UDFs), to introduce particles of varying shape and size, facilitating the study of multiphase flows;
  • Investigate the impact of these multiphase flows in wind farms, specifically in conjunction with terrain; this case would necessitate significant computational power.

Conflicts of Interest

The authors declare no conflict of interest.

References

  1. Intergovernmental Panel on Climate Change (IPCC); Renewable Energy Sources and Climate Change Mitigation; Cambridge University Press, Cambridge, United Kingdom, 2011.
  2. IRENA; Renewable Capacity Statistics 2023; International Renewable Energy Agency, Abu Dhabi, 2023.
  3. IEA; Renewable Energy Market Update - June 2023; IEA, Paris, 2023.
  4. Global Energy Monitor; Global Wind Power Tracker; Global Energy Monitor, Covina, CA 91723, May 2023 release.
  5. Papiez, M.; Smiech, S.; Frodyma, K. Factors affecting the efficiency of wind power in the European Union countries. Energy Policy 2019, 132, 965–977. [Google Scholar] [CrossRef]
  6. Dalili, N.; Edrisy, A.; Carriveau, R. A review of surface engineering issues critical to wind turbine performance. Renew. Sust. Energ. Rev. 2007, 13(2), 428–438. [Google Scholar] [CrossRef]
  7. Corten, G. V. H. Insects can halve wind-turbine power. Nature 2001, 412, 41–42. [Google Scholar] [CrossRef]
  8. Moroz, E.; Eggleston, D. A comparison between actual insect contamination and its simulation. Wind Power 1992, 7, 418–425. [Google Scholar]
  9. Kumar, K.; Safiulla, M.; Ahmed, A. An experimental evaluation of fiber-reinforced polypropylene thermoplastics for aerospace applications. J. Mech. Eng. 2014, 43, 92–97. [Google Scholar] [CrossRef]
  10. Amirzadeh, B.; Louhghalam, A.; Raessi, M.; Tootkaboni, M. A computational framework for the analysis of rain-induced erosion in wind turbine blades, part I: Stochastic rain texture model and drop impact simulations. J. Wind. Eng. Ind. Aerodyn. 2017, 163, 33–43. [Google Scholar] [CrossRef]
  11. Wu, Z.; Cao, Y.; Nie, S.; Yang, Y. Effects of rain on vertical axis wind turbine performance. J. Wind. Eng. Ind. Aerodyn. 2017, 170, 128–140. [Google Scholar] [CrossRef]
  12. Castorrini, A.; Corsini, A.; Rispoli, F.; Venturini, P.; Takizawa, K.; Tezduyar, T.E. Computational analysis of wind-turbine blade rain erosion. Comput. fluids 2016, 141, 175–183. [Google Scholar] [CrossRef]
  13. Verma, A.S.; Castro, S.G.; Jiang, Z.; Teuwen, J.J. Numerical investigation of rain droplet impact on offshore wind turbine blades under different rainfall conditions: A parametric study. Compos. Struct. 2020, 241. [Google Scholar] [CrossRef]
  14. Mishnaevsky, L.; Hasager, C.B.; Bak, C.; Tilg, A.-M.; Bech, J.I.; Rad, S.D.; Fæster, S. Leading edge erosion of wind turbine blades: Understanding, prevention, and protection. Renew. Energy 2021, 169, 953–969. [Google Scholar] [CrossRef]
  15. Pryor, S.; Barthelmie, R.; Cadence, J.; Dellwik, E.; Hasager, C.; Kral, S.; Reuder, J.; Rodgers, M.; Veraart, M. Atmospheric Drivers of Wind Turbine Blade Leading Edge Erosion: Review and Recommendations for Future Research. Energies 2022, 15(8553), 1–41. [Google Scholar] [CrossRef]
  16. Pugh, K.; Nash, J.; Reaburn, G.; Stack, M. On analytical tools for assessing the raindrop erosion of wind turbine blades. Renew. sustain. energy rev. 2021, 137. [Google Scholar] [CrossRef]
  17. Sareen, A.; Sapre, C.; Selig, M. Effects of leading edge erosion on wind turbine blade performance. Wind Energy 2014, 17, 1531–1542. [Google Scholar] [CrossRef]
  18. Barfknecht, N.; Kreuseler, M.; de Tavernier, D.; von Terzi, D. Performance analysis of wind turbines with leading-edge erosion and erosion-safe mode operation. J. Phys. Conf. Ser. 2022, 2265(3), 032009. [Google Scholar] [CrossRef]
  19. Papi, F.; Cappugi, L.; Salvadori, S.; Carnevale, M.; Bianchini, A. Uncertainty Quantification of the Effects of Blade Damage on the Actual Energy Production of Modern Wind Turbines. Energies 2020, 13(3785), 1–17. [Google Scholar] [CrossRef]
  20. Schramm, M.; Rahimi, H.; Stoevesandt, B.; Tangager, K. The Influence of Eroded Blades on Wind Turbine Performance Using Numerical Simulations. Energies 2017, 10(9), 1–15. [Google Scholar] [CrossRef]
  21. Manwell, J.; McGowan, J.; Rogers, A. Wind Energy Explained: Theory, Design and Application; John Wiley & Sons: Chichester, West Sussex, United Kingdom, 2009. [Google Scholar] [CrossRef]
  22. Sagol, E.; Reggio, M.; Ilinca, A. Issues concerning roughness on wind turbine blades. Renew. Sust. Energ. Rev. 2013, 23, 514–525. [Google Scholar] [CrossRef]
  23. Zidane, I.; Saqr, K.; Swadener, G.; Ma, X.; Shehadeh, M. On the role of surface roughness in the aerodynamic performance and energy conversion of horizontal wind turbine blades: A review. Int. J. Energy Res. 2016, 40(15), 2054–2077. [Google Scholar] [CrossRef]
  24. Betz, A. Introduction to the Theory of Flow Machines; Pergamon Press: Oxford, 1966. [Google Scholar]
  25. Burton, T.; Sharpe, D.; Jenkins, N.; Bossanyi, E. Wind Energy Handbook, 2nd edition ed.; John Wiley & Sons: West Sussex, 2011. [Google Scholar] [CrossRef]
  26. Wilson, R.; Lissaman, P.; Walker, S. Aerodynamic performance of wind turbines. Oregon State University, Corvallis, USA, 1976. [CrossRef]
  27. Parent, O.; Ilinca, A. Anti-icing and de-icing techniques for wind turbines: Critical review. Cold Reg Sci Technol 2011, 65(1), 88–96. [Google Scholar] [CrossRef]
  28. Fortin, G.; Perron, J.; Ilinca, A. A study of icing events at Murdochville: Conclusions for the wind power industry. in International Symposium “Wind Energy in Remote Regions”, Magdalen’s Island, 2005, October.
  29. EOC Geoservice. GSP - Global SnowPack Mean. Earth Observation Center, Available online:. Available online: https://geoservice.dlr.de/web/maps/eoc:gsp:mean (accessed on 25 May 2023).
  30. Turkia, V.; Huttunen, S.; Wallenius, T. Method for Estimating Wind Turbine Production Losses Due to Icing, VTT Technology No. 114. VTT Technical Research Centre of Finland, Espoo, Finland, 2013.
  31. Ruff, G.; Berkowitz, B. Users manual for the NASA Lewis ice accretion prediction code (LEWICE) (No. NAS 1.26: 185129). Lewis Research Center Group, Brook Park, Ohio, 1990.
  32. Marjaniemi, M.; Makkonen, L.; Laakso, T. Turbice-the wind turbine blade icing model. In Proceedings of the International Conference BOREAS V: Wind power production in cold climates, Finnish Meteorological Institute, Levi, Finland, (29 November – 1 December 2000). [Google Scholar]
  33. Makkonen, L.; Laakso, T.; Marjaniemi, M.; Finstad, K. Modelling and Prevention of Ice Accretion on Wind Turbines. Wind. Eng. 2001, 25(1), 3–21. [Google Scholar] [CrossRef]
  34. Habashi, W.; Morency, F.; Beaugendre, H. FENSAP-ICE: A comprehensive 3D Simulation Tool for In-flight Icing. In Proceedings of the 7th International Congress of Fluid Dynamics and Propulsion, Sharm-El-Sheikh, Egypt, (19–21 December 2001). [Google Scholar] [CrossRef]
  35. Beaugendre, H.; Morency, F.; Habashi, W. FENSAP-ICE’s three-dimensional in-flight ice accretion module: ICE3D. J. Aircr. 2003, 40(2), 239–247. [Google Scholar] [CrossRef]
  36. Wang, Z.; Zhu, C. Numerical simulation for in-cloud icing of three-dimensional wind turbine blades. Simulation 2017, 94(1), 31–41. [Google Scholar] [CrossRef]
  37. Jin, J.; Virk, M.; Hu, Q.; Jiang, X. Study of Ice Accretion on Horizontal Axis Wind Turbine Blade Using 2D and 3D Numerical Approach. IEEE Access 2020, 8, 166236–166245. [Google Scholar] [CrossRef]
  38. Son, C.; Kim, T. Development of an icing simulation code for rotating wind turbines. J. Wind. Eng. Ind. Aerodyn. 2020, 203, 104239. [Google Scholar] [CrossRef]
  39. Li, Y.; Tagawa, K.; Feng, F.; Li, Q.; He, Q. A wind tunnel experimental study of icing on wind turbine blade airfoil. Energy Convers. Manag. 2014, 85, 591–595. [Google Scholar] [CrossRef]
  40. Jolin, N.; Bolduc, D.; Swytink-Binnema, N.; Rosso, G.; Godreau, C. Wind turbine blade ice accretion: A correlation with nacelle ice accretion. Cold Reg. Sci. Technol. 2019, 157, 235–241. [Google Scholar] [CrossRef]
  41. Madi, E.; Pope, K.; Huang, W.; Iqbal, T. A review of integrating ice detection and mitigation for wind turbine blades. Renew. Sust. Energ. Rev. 2019, 103, 269–281. [Google Scholar] [CrossRef]
  42. Pinar Pérez, J.; García Márquez, F.; Ruiz, H. Economic viability analysis for icing blades detection in wind turbines. J. Clean. Prod. 2016, 135, 1150–1160. [Google Scholar] [CrossRef]
  43. Ibrahim, G.; Pope, K.; Muzychka, Y. Effects of blade design on ice accretion for horizontal axis wind turbines. J. Wind. Eng. Ind. Aerodyn. 2018, 173, 39–52. [Google Scholar] [CrossRef]
  44. Martini, F.; Contreras Montoya, L.; Ilinca, A. Review of Wind Turbine Icing Modelling Approaches. Energies 2021, 14(16), 1–26. [Google Scholar] [CrossRef]
  45. Bose, N. Icing on a small horizontal-axis wind turbine — Part 1: Glaze ice profiles. J. Wind. Eng. Ind. Aerodyn. 1992, 45(1), 75–85. [Google Scholar] [CrossRef]
  46. Rong, J.; Bose, N.; Brothers, C.; Lodge, M. Icing Test on a Horizontal Axis Wind Turbine. Wind. Eng. 1991, 15(2), 109–113. [Google Scholar]
  47. Han, Y.; Palacios, J.; Schmitz, S. Scaled ice accretion experiments on a rotating wind turbine blade. Journal of J. Wind. Eng. Ind. Aerodyn. 2012, 109, 55–67. [Google Scholar] [CrossRef]
  48. Hu, L.; Zhu, X.; Chen, J.; Shen, X.; Du, Z. Numerical simulation of rime ice on NREL Phase VI blade. J. Wind. Eng. Ind. Aerodyn. 2018, 178, 57–68. [Google Scholar] [CrossRef]
  49. Gao, L.; Liu, Y.; Hu, H. An experimental investigation of dynamic ice accretion process on a wind turbine airfoil model considering various icing conditions. Int. J. Heat Mass Transf. 2019, 133, 930–939. [Google Scholar] [CrossRef]
  50. Gao, L.; Tao, T.; Liu, Y.; Hu, H. A field study of ice accretion and its effects on the power production of utility-scale wind turbines. Renew. Energy 2021, 167, 917–928. [Google Scholar] [CrossRef]
  51. Gao, L.; Hu, H. Wind turbine icing characteristics and icing-induced power losses to utility-scale wind turbines. Proc. Natl. Acad. Sci. 2021, 118. [Google Scholar] [CrossRef]
  52. Li, X.; Jia, Y.; Zhang, H.; Cheng, B. Research on the Change of Airfoil Geometric Parameters of Horizontal Axis Wind Turbine Blades Caused by Atmospheric Icing. Energy Eng. 2022, 119(6), 2549–2567. [Google Scholar] [CrossRef]
  53. Seifert, H.; Richert, F. Aerodynamics of iced airfoils and their influence on loads and power production. In Proceedings of the EWEC ‘97, European Wind Energy Conference, Dublin Castle, Ireland, (6 October 1997). [Google Scholar]
  54. Jasinski, W.; Noe, S.; Selig, M.; Bragg, M. Wind Turbine Performance Under Icing Conditions. J. Sol. Energy Eng. 1998, 120(1), 60–65. [Google Scholar] [CrossRef]
  55. Hochart, C.; Fortin, G.; Perron, J.; Ilinca, A. Wind turbine performance under icing conditions. Wind Energy 2008, 11, 319–333. [Google Scholar] [CrossRef]
  56. Zhao, M.; Jiang, D.; Li, S. Research on fault mechanism of icing of wind turbine blades. In Proceedings of the 2009 World Non-Grid-Connected Wind Power and Energy Conference, Nanjing, China, (24–26 September 2009). [Google Scholar] [CrossRef]
  57. Homola, M. C.; Virk, M. S.; Wallenius, T.; Nicklasson, P. J.; Sundsbø, P. A. Effect of atmospheric temperature and droplet size variation on ice accretion of wind turbine blades. J. Wind Eng. Ind. Aerodyn. 2010, 98(12), 724–729. [Google Scholar] [CrossRef]
  58. Villalpando, F.; Reggio, M.; Ilinca, A. Numerical Study of Flow Around Iced Wind Turbine Airfoil. Eng. Appl. Comput. Fluid Mech. 2012, 6(1), 39–45. [Google Scholar] [CrossRef]
  59. Hudecz, A.; Koss, H.; Hansen, M. Ice Accretion on Wind Turbine Blades. In Proceedings of the 15th International Workshop on Atmospheric Icing of Structures (IWAIS XV), St. John’s, Newfoundland & Labrador, Canada, (8–13 September 2013). [Google Scholar]
  60. Hu, L.; Zhu, X.; Hu, C.; Chen, J.; Du, Z. Wind turbines ice distribution and load response under icing conditions, Renew. Energy 2017, 113, 608–619. [Google Scholar] [CrossRef]
  61. Virk, M.; Homola, M.; Nicklasson, P. Effect of Rime Ice Accretion on Aerodynamic Characteristics of Wind Turbine Blade Profiles. Wind Eng. 2010, 34(2), 207–218. [Google Scholar] [CrossRef]
  62. Han, W.; Kim, J.; Kim, B. Study on correlation between wind turbine performance and ice accretion along a blade tip airfoil using CFD. J. Renew. Sustain. Energy 2018, 10(2). [Google Scholar] [CrossRef]
  63. Jin, J. Y.; Virk, M. S. Study of ice accretion along symmetric and asymmetric airfoils. J. Wind Eng. Ind. Aerodyn. 2018, 179, 240–249. [Google Scholar] [CrossRef]
  64. Jin, J. Y.; Virk, M. S. Study of ice accretion and icing effects on aerodynamic characteristics of DU96 wind turbine blade profile. Cold Reg. Sci. Technol. 2019, 160, 119–127. [Google Scholar] [CrossRef]
  65. Jin, J. Y.; Virk, M. S. Experimental study of ice accretion on S826 & S832 wind turbine blade profiles. Cold Reg. Sci. Technol. 2020, 169, 102913. [Google Scholar] [CrossRef]
  66. Yirtici, O.; Tuncer, I. H.; Ozgen, S. Ice Accretion Prediction on Wind Turbines and Consequent Power Losses. J. Phys. Conf. Ser. 2016, 753(2). [Google Scholar] [CrossRef]
  67. Yirtici, O.; Ozgen, S.; Tuncer, I. Predictions of ice formations on wind turbine blades and power production losses due to icing. Wind Energy 2019, 22(7), 945–958. [Google Scholar] [CrossRef]
  68. Yirtici, O.; Cengiz, K.; Ozgen, S.; Tuncer, I. H. Aerodynamic validation studies on the performance analysis of iced wind turbine blades. Comput. Fluids 2019, 192, 104271. [Google Scholar] [CrossRef]
  69. Gao, L.; Liu, Y.; Zhou, W.; Hu, H. An experimental study on the aerodynamic performance degradation of a wind turbine blade model induced by ice accretion process. Renew. Energy 2019, 133, 663–675. [Google Scholar] [CrossRef]
  70. Jiang, F.; Qiu, T. Research on the effect of icing on aerodynamic performance of airfoil and power generation performance of wind turbine. J. Phys. Conf. Ser. 2020, 1684(1), 012141. [Google Scholar] [CrossRef]
  71. Martini, F.; Ibrahim, H.; Contreras Montoya, L.; Rizk, P.; Ilinca, A. Turbulence Modeling of Iced Wind Turbine Airfoils. Energies 2022, 15(22), 1–20. [Google Scholar] [CrossRef]
  72. Chitransh, A.; Kaur, S. Investigation of Single Shot Ice Accretion on Aerofoil of Wind Turbine Blade using ANSYS. In Proceedings of the 2022 International Conference on Smart Generation Computing, Communication and Networking (SMART GENCON), Bangalore, India, (23–25 December 2022). [Google Scholar] [CrossRef]
  73. Rotich, I.; Kollár, L. Numerical simulation of the performance of an asymmetrical airfoil under extreme weather conditions. Mérn. inform. megold. 2022, 3(2), 19–29. [Google Scholar] [CrossRef]
  74. Yang, X.; Bai, X.; Cao, H. Influence analysis of rime icing on aerodynamic performance and output power of offshore floating wind turbine. Ocean Eng. 2022, 258, 111725. [Google Scholar] [CrossRef]
  75. Virk, M.S.; Nicklasson, P.J.; Homola, M.C. Atmospheric icing on large wind turbine blades. Int. J. Energy Environ. Eng. 2012, 3(1), 1–8. [Google Scholar]
  76. Barber, S.; Wang, Y.; Jafari, S.; Chokani, N.; Abhari, R. The Impact of Ice Formation on Wind Turbine Performance and Aerodynamics. ASME. J. Sol. Energy Eng. 2011, 133(1), 011007. [Google Scholar] [CrossRef]
  77. Homola, M.C.; Virk, M.S.; Nicklasson, P.J.; Sundsbø, P.A. Modelling of ice induced power losses and comparison with observations. Proceedings of Winterwind 2011, Umea, Sweden, (8–10 February 2011). [Google Scholar]
  78. Homola, M.; Virk, M.; Nicklasson, P.; Sundsbø, P. Performance losses due to ice accretion for a 5 MW wind turbine. Wind Energy 2012, 15, 379–389. [Google Scholar] [CrossRef]
  79. Dimitrova, M.; Ibrahim, H.; Fortin, G.; Ilinca, A.; Perron, J. Software tool to predict the Wind Energy production losses due to icing. In Proceedings of the 2011 IEEE Electrical Power and Energy Conference, Winnipeg, MB, Canada, (3–5 October 2011). [Google Scholar] [CrossRef]
  80. Lamraoui, F.; Fortin, G.; Benoit, R.; Perron, J.; Masson, C. Atmospheric icing impact on wind turbine production. Cold Reg. Sci. Technol. 2014, 100, 36–49. [Google Scholar] [CrossRef]
  81. Etemaddar, M.; Hansen, M.; Moan, T. Wind turbine aerodynamic response under atmospheric icing conditions. Wind Energy 2014, 17, 241–265. [Google Scholar] [CrossRef]
  82. Myong, R. Atmospheric Icing Effects on Aerodynamics of Wind Turbine Blade. In Proceedings of the IMECE2013 ASME International Mechanical Engineering Congress and Exposition, 10.1115/IMECE2013-64085, San Diego, California, USA, (15-21November 2013). [Google Scholar] [CrossRef]
  83. Reid, T.; Baruzzi, G.; Ozcer, I.; Switchenko, D.; Habashi, W. FENSAP-ICE Simulation of Icing on Wind Turbine Blades, Part 1: Performance Degradation. In Proceedings of the 51st AIAA Aerospace Sciences Meeting including the New Horizons Forum and Aerospace Exposition, Grapevine (Dallas/Ft. Worth Region), Texas, (07 - 10 January 2013). [Google Scholar] [CrossRef]
  84. Shu, L.; Liang, J.; Hu, Q.; Jiang, X.; Ren, X.; Qiu, G. Study on small wind turbine icing and its performance. Cold Reg. Sci. Technol. 2017, 134, 11–19. [Google Scholar] [CrossRef]
  85. Shu, L.; Li, H.; Hu, Q.; Jiang, X.; Qiu, G.; McClure, G.; Yang, H. Study of ice accretion feature and power characteristics of wind turbines at natural icing environment. Cold Reg. Sci. Technol. 2018, 147, 45–54. [Google Scholar] [CrossRef]
  86. Shu, L.; Li, H.; Hu, Q.; Jiang, X.; Qiu, G.; He, G.; Liu, Y. 3D numerical simulation of aerodynamic performance of iced contaminated wind turbine rotors. Cold Reg. Sci. Technol. 2018, 148, 50–62. [Google Scholar] [CrossRef]
  87. Zanon, A.; De Gennaro, M.; Kühnelt, H. Wind energy harnessing of the NREL 5 MW reference wind turbine in icing conditions under different operational strategies. Renew. Energ. 2018, 115, 760–772. [Google Scholar] [CrossRef]
  88. Tabatabaei, N.; Gantasala, S.; Cervantes, M. Wind Turbine Aerodynamic Modeling in Icing Condition: Three-Dimensional RANS-CFD Versus Blade Element Momentum Method. J. Energy Resour. Technol. 2019, 141(7). [Google Scholar] [CrossRef]
  89. Caccia, F.; Guardone, A. Numerical simulations of ice accretion on wind turbine blades: Are performance losses due to ice shape or surface roughness? Wind Energy Sci. 2023, 8(3), 341–362. [Google Scholar] [CrossRef]
  90. Yirtici, O.; Tuncer, I. H. Aerodynamic shape optimization of wind turbine blades for minimizing power production losses due to icing. Cold Reg. Sci. Technol. 2021, 185, 103250. [Google Scholar] [CrossRef]
  91. Douvi, E.; Margaris, D. Aerodynamic Performance Investigation under the Influence of Heavy Rain of a NACA 0012 Airfoil for Wind Turbine Applications. Int. Rev. Mech. Eng. (I.RE.M.E.) 2012, 6(6), 1228–1235. [Google Scholar] [CrossRef]
  92. Douvi, E.; Margaris, D.; Lazaropoulos, S.; Svanas, S. Experimental and Computational Study of the Effects of Different Liquid Water Content on the Aerodynamic Performance of a NACA 0012 Airfoil at Low Reynolds Number. In Proceedings of the 5th International Conference on Experiments/Process/System Modeling/Simulation/ Optimization (5th IC-EpsMsO), Athens, Greece, (3–6 July 2013). [Google Scholar]
  93. Cao, Y.; Wu, Z.; Xu, Z. Effects of rainfall on aircraft aerodynamics. Prog. Aerosp. Sci. 2014, 71, 85–127. [Google Scholar] [CrossRef]
  94. Douvi, E.; Margaris, D.; Lazaropoulos, S.; Svanas, S. Low Reynolds Number Investigation of the Flow over a NACA 0012 airfoil at Different Rainfall Rates. Int. Rev. Mech. Eng. (I.RE.M.E.) 2013, 7(4), 625–632. [Google Scholar] [CrossRef]
  95. Rhode, R. Some Effects on Rainfall on Flight of Airplanes and on Instrument Indications. NACA TN 803 1941.
  96. Dunham, R.; Bezos, G.; Gentry, G.; E.M., M. E. Two-dimensional wind tunnel tests of a transport-type airfoil in a water spray. In Proceedings of the AIAA 23rd Aerospace Sciences Meeting, Reno, NV, U.S.A., (14–17 January 1985). [Google Scholar] [CrossRef]
  97. Hastings, E.; Manuel, G. Scale–Model Tests of Airfoils in Simulated Heavy Rain. J. Aircraft 1985, 22(6), 536–540. [Google Scholar] [CrossRef]
  98. Haines, P.; Luers, J. Aerodynamic Penalties of Heavy Rain on Landing Airplanes. J. Aircraft 1983, 20, 111–119. [Google Scholar] [CrossRef]
  99. Bilanin, A. Scaling Laws for Testing of High Lift Airfoils Under Heavy Rainfall. In Proceedings of the AIAA 23rd Aerospace Science Meeting, Reno, NV, U.S.A. (14–17 January 1985). [Google Scholar] [CrossRef]
  100. Thompson, B. E.; Jang, J. Aerodynamic Efficiency of Wings in Rain. J. Aircraft 1996, 33(6). [Google Scholar] [CrossRef]
  101. Wan, T.; Wu, S.W. Aerodynamic Analysis Under the Influence of Heavy Rain. J. Aeronaut. Astronaut. Aviat. 2009, 41(3), 173–180. [Google Scholar]
  102. Zhang, R.M.; Cao, Y.H. Study of Aerodynamics Characteristics of an Airfoil in Rain. J. Aerosp. Power 2010, 25(9), 2064–2069. [Google Scholar]
  103. Hansman, J.; Craig, A. Low Reynolds Number Tests of NACA 64-210, NACA 0012, and Wortman FX67-K170 Airfoils in Rain. J. Aircraft 1987, 24(8). [Google Scholar] [CrossRef]
  104. World Development Indicators (WDI). Average precipitation in depth (mm per year). Food and Agriculture Organization, 2020. Available online: https://databank.worldbank.org/reports.aspx?source=2&type=metadata&series=AG.LND.PRCP.MM (accessed on 23 March 2023).
  105. Corrigan, R.; DeMiglio, R. Effect of Precipitation on Wind Turbine Performance. NASA Lewis Research Center, Cleveland, OH, May 1985. [CrossRef]
  106. Valentine, J.R.; Decker, R.A. A Langrangian-Eulerian Scheme for Flow around an Airfoil in Rain. Int. J. Multiphase Flow 1995, 21(4), 639–648. [Google Scholar] [CrossRef]
  107. Durst, F. Durst, F.; Milojevic, D.; Schonung, B. Eulerian and Lagrangian predictions of particulate two-phase flows: A numerical study. Appl. Math. Modelling 1984, 8, 101–115. [Google Scholar] [CrossRef]
  108. Luers, J. Rain influences on a wind turbine theoretical development and applications. In Proceedings of the AIAA 23rd Aerospace Sciences Meeting, Reno, Nevada, (14–17 January 1985). [Google Scholar] [CrossRef]
  109. Cai, M.; Abbasi, E.; Arastoopour, H. Analysis of the Performance of a Wind-Turbine Airfoil under Heavy-Rain Conditions Using a Multiphase Computational Fluid Dynamics Approach. Ind. Eng. Chem. Res. 2013, 52(9), 3266–3275. [Google Scholar] [CrossRef]
  110. Douvi, E.; Margaris, D. Simulation of heavy rain flow over a NACA 0012 airfoil. In Proceedings of the 4th International Conference on Experiments/Process/System Modeling/Simulation/ Optimization (4th IC-EpsMsO), Athens, Greece, (6–9 July 2011). [Google Scholar]
  111. Cohan, A. C.; Arastoopour, H. Numerical simulation and analysis of the effect of rain and surface property on wind-turbine airfoil performance. Int. J. Multiphase Flow 2016, 81, 46–53. [Google Scholar] [CrossRef]
  112. Arastoopour, H.; Cohan, A. C. CFD simulation of the effect of rain on the performance of horizontal wind turbines. AIChE J. 2017, 63, 5375–5383. [Google Scholar] [CrossRef]
  113. Wu, S.; Sun, H.; Zheng, X. A numerical study on dynamic characteristics of 5 MW floating wind turbine under wind-rain conditions. Ocean Eng. 2022, 262, 112095. [Google Scholar] [CrossRef]
  114. Wu, S.; Sun, H.; Li, X. Response of 5 MW Floating Wind Turbines to Combined Action of Wind and Rain. J. Mar. Sci. Eng. 2022, 10, 1–16. [Google Scholar] [CrossRef]
  115. Barfknecht, N.; Kreuseler, M.; de Tavernier, D.; von Terzi, D. Performance analysis of wind turbines with leading-edge erosion and erosion-safe mode operation. J. Phys. Conf. Ser. 2022, 2265, 032009. [Google Scholar] [CrossRef]
  116. Anh, N. T.; Duc, N. H. A study on power output of horizontal-axis wind turbines under rain. Vietnam J. Sci. Technol. 2019, 57(3), 356–365. [Google Scholar] [CrossRef]
  117. Anh, N. T.; Duc, N. H. Effect Analysis of Performance and Pitch Controller Operation for Wind Turbine under Rain. GMSARN Int. J. 2022, 16, 339–347. [Google Scholar]
  118. Douvi, E.; Douvi, D.; Pylarinos, D.; Margaris, D. Effect of Rain on the Aerodynamic Performance of a Horizontal Axis Wind Turbine – A Computational Study. Int. J. Energetica (IJECA) 2021, 6(1), 35–43. [Google Scholar] [CrossRef]
  119. Douvi, E.; Margaris, D. Hydrodynamic Analysis of a Horizontal Axis Tidal Turbine, Based on the Blade Element Momentum Theory. In Proceedings of the 7th International Conference on “Experiments/ Process/ System Modeling/ Simulation/ Optimization” (7th IC-EPSMSO), Athens, Greece, (5–8 July 2017). [Google Scholar]
  120. Punge, H.; Kunz, M. Hail observations and hailstorm characteristics in Europe: A review. Atmos. Res. 2016, 176–177, 159–184. [Google Scholar] [CrossRef]
  121. Wang, P.K. Motions of Ice Hydrometeors in the Atmosphere: Numerical Studies and Implications; Springer Nature Singapore, 2020. [CrossRef]
  122. Letson, F.; Barthelmie, R.; Pryor, S. Radar-derived precipitation climatology for wind turbine blade leading edge erosion. Wind Energy Sci. 2020, 5(1), 331–347. [Google Scholar] [CrossRef]
  123. Fiore, G.; Fujiwara, G.; Selig, M. A damage assessment for wind turbine blades from heavy atmospheric particles. In Proceedings of the 53rd AIAA Aerospace Sciences Meeting, Kissimmee, Florida, USA, (5–9 January 2015). [Google Scholar] [CrossRef]
  124. Douvi, D.; Georgakopoulos, A.-G.; Lekkas, D.; Douvi, E.; Margaris, D. Aerodynamic degradation of a three-bladed horizontal axis wind turbine operating during a hailstorm. In Proceedings of the 8th International Conference on “Experiments/Process/System Modeling/Simulation/Optimization” (8th IC-EPSMSO), Athens, Greece, 3–6 July 2019. [Google Scholar]
  125. Douvi, D.; Douvi, E.; Plessas, D.K.; Margaris, D.P. Numerical Simulation of NACA 0012 Airfoil Operating under Hailstorm Conditions. Int. j. new technol. res (IJNTR) 2021, 7(2), 73–80. [Google Scholar] [CrossRef]
  126. Douvi, D.; Douvi, E. Investigation into the impact of hailstorm on the aerodynamic characteristics of S809 airfoil: A comprehensive computational analysis. In Proceedings of the 10th International Conference on “Experiments/Process/System Modeling/Simulation/Optimization” (10th IC-EPSMSO), Loutraki, Greece, 5–8 July 2023. [Google Scholar]
  127. Douvi, D.; Douvi, E.; Margaris, D. The Operation of a Three-Bladed Horizontal Axis Wind Turbine under Hailstorm Conditions—A Computational Study Focused on Aerodynamic Performance. Inventions 2022, 7(2), 1–14. [Google Scholar] [CrossRef]
  128. Khalfallah, M.G.; Koliub, A.M. Effect of dust on the performance of wind turbines. Desalination 2007, 209(1–3), 209–220. [Google Scholar] [CrossRef]
  129. Khakpour, Y.; Bardakji, S.; Nair, S. Aerodynamic performance of wind turbine blades in dusty environments. In Proceedings of the ASME 2007 International Mechanical Engineering Congress and Exposition, IMECE2007, Seattle, Washington, USA, (11–15 November 2007). [Google Scholar] [CrossRef]
  130. Al-Khayat, M.; Al-Rasheedi, M.; Gueymard, C.A.; Haupt, S.E.; Kosović, B.; Al-Qattan, A.; Lee, J.A. Performance analysis of a 10-MW wind farm in a hot and dusty desert environment. Part 2: Combined dust and high-temperature effects on the operation of wind turbines. Sustain. Energy Technol. Assess. 2021, 47, 101461. [Google Scholar] [CrossRef]
  131. Ren, N.-x.; Ou, J.-p. Dust Effect on the Performance of Wind Turbine Airfoils. J. Electromagn. Waves Appl. 2009, 1, 102–107. [Google Scholar] [CrossRef]
  132. Li, D.; Li, R.; Yang, C.; Wang, X. Effects of Surface Roughness on Aerodynamic Performance of a Wind Turbine Airfoil. In Proceedings of the 2010 Asia-Pacific Power and Energy Engineering Conference (APPEEC 2010), Chengdu, China, 28–31 March 2010. [Google Scholar]
  133. Salem, H.; Diab, A.; Ghoneim, Z. CFD Simulation and Analysis of Performance Degradation of Wind Turbine Blades in Dusty Environments. In Proceedings of the 2013 International Conference on Renewable Energy Research and Applications (ICRERA 2013), Madrid, Spain, 20–23 October 2013. [Google Scholar] [CrossRef]
  134. Wu, P.; Li, C.; Li, Z. Numerical Simulation of Influence with Surface Contamination on Aerodynamic Performance of Dedicated Wind Turbine Airfoil. Adv. Mater. Res. 2013, 724–725, 572–575. [Google Scholar] [CrossRef]
  135. Fiore, G.; Selig, M. A Simulation of Operational Damage for Wind Turbine Blades. In Proceedings of the 32nd AIAA Applied Aerodynamics Conference, Atlanta, GA, USA, 16–20 June 2014. [Google Scholar] [CrossRef]
  136. Fiore, G.; Selig, M. Simulation of Damage for Wind Turbine Blades Due to Airborne Particles. Wind Eng. 2015, 39(4), 399–418. [Google Scholar] [CrossRef]
  137. Fiore, G.; Selig, M. Optimization of Wind Turbine Airfoils Subject to Particle Erosion. In Proceedings of the 33rd AIAA Applied Aerodynamics Conference, Dallas, TX, USA, 22–26 June 2015. [Google Scholar] [CrossRef]
  138. Fiore, G.; Selig, M. Time marching simulations of wind turbine blades subject to particle erosion. In Proceedings of the 54th AIAA Aerospace Sciences Meeting, San Diego, California, USA, 4–8 January 2016. [Google Scholar] [CrossRef]
  139. Diab, A.; Alaa, M.; Hossam El-Din, A.; Salem, H.; Ghoneim, Z. Performance Degradation of Wind Turbine Airfoils due to Dust Contamination: A Comparative Numerical Study. In Proceedings of the ASME Turbo Expo 2015: Turbine Technical Conference and Exposition. Volume 9: Oil and Gas Applications; Supercritical CO2 Power Cycles; Wind Energy, Montreal, Quebec, Canada, 15–19 June 2015. [Google Scholar] [CrossRef]
  140. Srinivasan, S.; Surasani, V.K. CFD Analysis of Effects of Surface Fouling on Wind Turbine Airfoil Profiles. Int. j. power energy eng. Special Issue: Energy Systems and Developments 2015, 4(5-1), 1–11. [Google Scholar]
  141. Jafari, K.; Djavareshkian, M.; Feshalami, B. The Effects of Different Roughness Configurations on Aerodynamic Performance of Wind Turbine Airfoil and Blade. Int. J. Renew. Energy Dev. 2017, 6(3), 273–281. [Google Scholar] [CrossRef]
  142. Zidane, I.; Saqr, K.; Swadener, G.; Ma, X.; Shehadeh, M. Computational Fluid Dynamics Study of Dusty Air Flow Over NACA 63415 Airfoil for Wind Turbine Applications. J. Teknol. 2017, 79(7-3), 1–6. [Google Scholar] [CrossRef]
  143. Han, W.; Kim, J.; Kim, B. Effects of contamination and erosion at the leading edge of blade tip airfoils on the annual energy production of wind turbines. Renew. energy 2018, 115, 817–823. [Google Scholar] [CrossRef]
  144. Chen, S.; Agarwal, R.K. Numerical Investigation of Wind Turbine Airfoils under Clean and Dusty Air Conditions. Washington University Open Scholarship, St. Louis, 2019. [CrossRef]
  145. Guo, T.; Jin, J.; Lu, Z.; Zhou, D.; Wang, T. Aerodynamic Sensitivity Analysis for a Wind Turbine Airfoil in an Air-Particle Two-Phase Flow. Appl. Sci. 2019, 9(18). [Google Scholar] [CrossRef]
  146. ElMessiry, Y.; Kandil, H.; M.S., A.-E. Effect of surface contamination on the wind turbine performance. Wind. Eng. 2021, 45(3), 505–517. [Google Scholar] [CrossRef]
  147. Douvi, D.; Μargaris, D.; Davaris, A. Aerodynamic Performance of a NREL S809 Airfoil in an Air–Sand Particles Two Phase Flow. In Proceedings of the 7th International Conference “Scientific Computing to Computational Engineering” (7th IC-SCCE), Athens, Greece, 6–9 July 2016. [Google Scholar]
  148. Douvi, D.; Margaris, D.; Davaris, A.E. Aerodynamic Performance of a NREL S809 Airfoil in an Air–Sand Particle Two-Phase Flow. Computation 2017, 5(13), 1–17. [Google Scholar] [CrossRef]
  149. Douvi, D.; Douvi, E.; Margaris, D. Computational Study of NACA 0012 Airfoil in Air-Sand Particle Two-Phase Flow at Reynolds Number of Re=1.76×10⁶. Int. j. new technol. res. (IJNTR) 2019, 5(4), 101–108. [Google Scholar] [CrossRef]
  150. Douvi, D.; Margaris, D. Numerical simulation of NACA 0012 airfoil in air phase flow and in high concentration air–sand particles two-phase flow. In Proceedings of the 8th International Conference from “Scientific Computing to Computational Engineering” (8th IC-SCCE), Athens, Greece, 4–7 July 2018. [Google Scholar]
  151. Douvi, D.; Douvi, E.; Margaris, D. Aerodynamic Performance of a Horizontal Axis Wind Turbine Operating with Dust—A Computational Study. Inventions 2023, 8(3), 1–21. [Google Scholar] [CrossRef]
  152. Marten, D.; Wendler, J.; Pechlivanoglou, G.; Nayeri, C.; Paschereit, C. QBlade: An Open Source Tool for Design and Simulation of Horizontal and Vertical Axis Wind Turbines. Int. J. Emerg. Technol. Adv. Eng. 2013, 3, 264–269. [Google Scholar]
  153. Zare, J.; Hosseini, S.; Rastan, M. NREL Phase VI wind turbine in the dusty environment. arXiv preprint arXiv:2304.06285 2023.
  154. Yu, X.; Yan, L. High Humidity Aerodynamic Effects Study on Offshore Wind Turbine Airfoil/Blade Performance Through CFD Analysis. In Proceedings of the ASME Turbo Expo 2017: Turbomachinery Technical Conference and Exposition Volume 9: Oil and Gas Applications; Supercritical CO2 Power Cycles; Wind Energy, Charlotte, North Carolina, USA, 26–30 June 2017. [Google Scholar]
  155. Yue, W.; Xue, Y.; Liu, Y. High Humidity Aerodynamic Effects Study on Offshore Wind Turbine Airfoil/Blade Performance through CFD Analysis. Int. J. Rotating Mach. 2017, 1–15. [Google Scholar] [CrossRef]
  156. Corten, G.; Veldkamp, H. Insects cause double stall. EWEC, Copenhagen, 2001.
  157. BladeCleaning. BladeCleaning. 2017. Available online: http://www.bladecleaning.com/ (accessed on August 4, 2023).
  158. Petrone, G.; de Nicola, C.; Quagliarella, D.; Witteveen, J.; Iaccarino, G. Wind Turbine Performance Analysis Under Uncertainty. In Proceedings of the 49th AIAA Aerospace Sciences Meeting including the New Horizons Forum and Aerospace Exposition, Orlando, Florida, U.S.A., 4–7 January 2011. [Google Scholar] [CrossRef]
  159. Lachmann, G. Aspects of insect contamination in relation to laminar flow aircraft. Aeronautical Research Center, London, 1960.
  160. Janiszewska, J.; Rastan, R. R.; Hoffmann, M.; Gregorek, G. Effects of grit roughness and pitch oscillations on the LS(1)-0417MOD airfoil. National Renewable Energy Laboratory, Golden, CO, USA, 1996. [CrossRef]
  161. Janiszewska, J.; Reuss Ramsay, R. R.; Hoffmann, M.; Gregorek, G. Effects of Grit Roughness and Pitch Oscillations on the S814 Airfoil. National Renewable Energy Laboratory, Golden, CO, USA, 1996. [CrossRef]
  162. Hoffman, M.; Reuss, R.; Gregorek, G. Effects of surface roughness and vortex generators on the NACA 4415 airfoil, NREL/TP-442-7815. National Renewable Energy Laboratory, Golden, CO, USA, 1996. [CrossRef]
  163. Ramsay, R.; Hoffman, M.; Gregorek, G. Effects of grit roughness and pitch oscillations on the S801 airfoil, NREL/TP-442-7818. National Renewable Energy Laboratory, Golden, CO, USA, 1996. [CrossRef]
  164. Reuss, R.; Hoffman, M.; Gregorek, G. Effects of surface roughness and vortex generators on the S809 airfoil, NREL/TP-442-7817. National Renewable Energy Laboratory, Golden, CO, USA, 1995. [CrossRef]
  165. Hoffmann, M.; Reuss Ramsay, R.; Gregorek, G. Effects of Surface Roughness and Vortex Generators on the S813 Airfoil, NREL/TP-442-7815. National Renewable Energy Laboratory, Golden, CO, USA, 1996.
  166. Ferrer, E.; Munduate, X. CFD Predictions of Transition and Distributed Roughness Over a Wind Turbine Airfoil. In Proceedings of the 47th AIAA Aerospace Sciences Meeting Including The New Horizons Forum and Aerospace Exposition, Orlando, Florida, U.S.A., 5–8 January 2009. [Google Scholar] [CrossRef]
  167. Wilcox, B.; White, E.; Maniaci, D. Roughness Sensitivity Comparisons of Wind Turbine Blade Sections. Sandia National Laboratories, Albuquerque, New Mexico, 2017. [CrossRef]
  168. Ehrmann, R.; Wilcox, B.; White, E.; Maniaci, D. Effect of Surface Roughness on Wind Turbine Performance. Sandia National Laboratories, Albuquerque, New Mexico, 2017. [CrossRef]
  169. Sathiesh Kumar, V.; Vasa, N.; Sarathi, R. Detecting salt deposition on a wind turbine blade using laser-induced breakdown spectroscopy technique. Appl. Phys. A 2013, 112, 149–153. [Google Scholar] [CrossRef]
  170. Yokoyama, S. Lightning protection of wind turbine blades. Electr. Power Syst. Res. 2013, 94, 3–9. [Google Scholar] [CrossRef]
  171. Huang, S.-L.; Chen, J.-F.; Liang, T.-J.; Su, M.-S.; Chen, C.-Y. Prediction of salt contamination in the rotating blade of wind turbine under lightning strike occurrence using fuzzy c-means and k-means clustering approaches. IET Sci. Meas. Technol. 2020, 14(1), 91–97. [Google Scholar] [CrossRef]
  172. Wright, J. M.; Colling, A. Seawater: Its Composition, Properties and Behaviour, 2nd ed.; Bearman, G., Ed.; Butterworth-Heinemann: Oxford, United Kingdom, 15 January 1995. [Google Scholar]
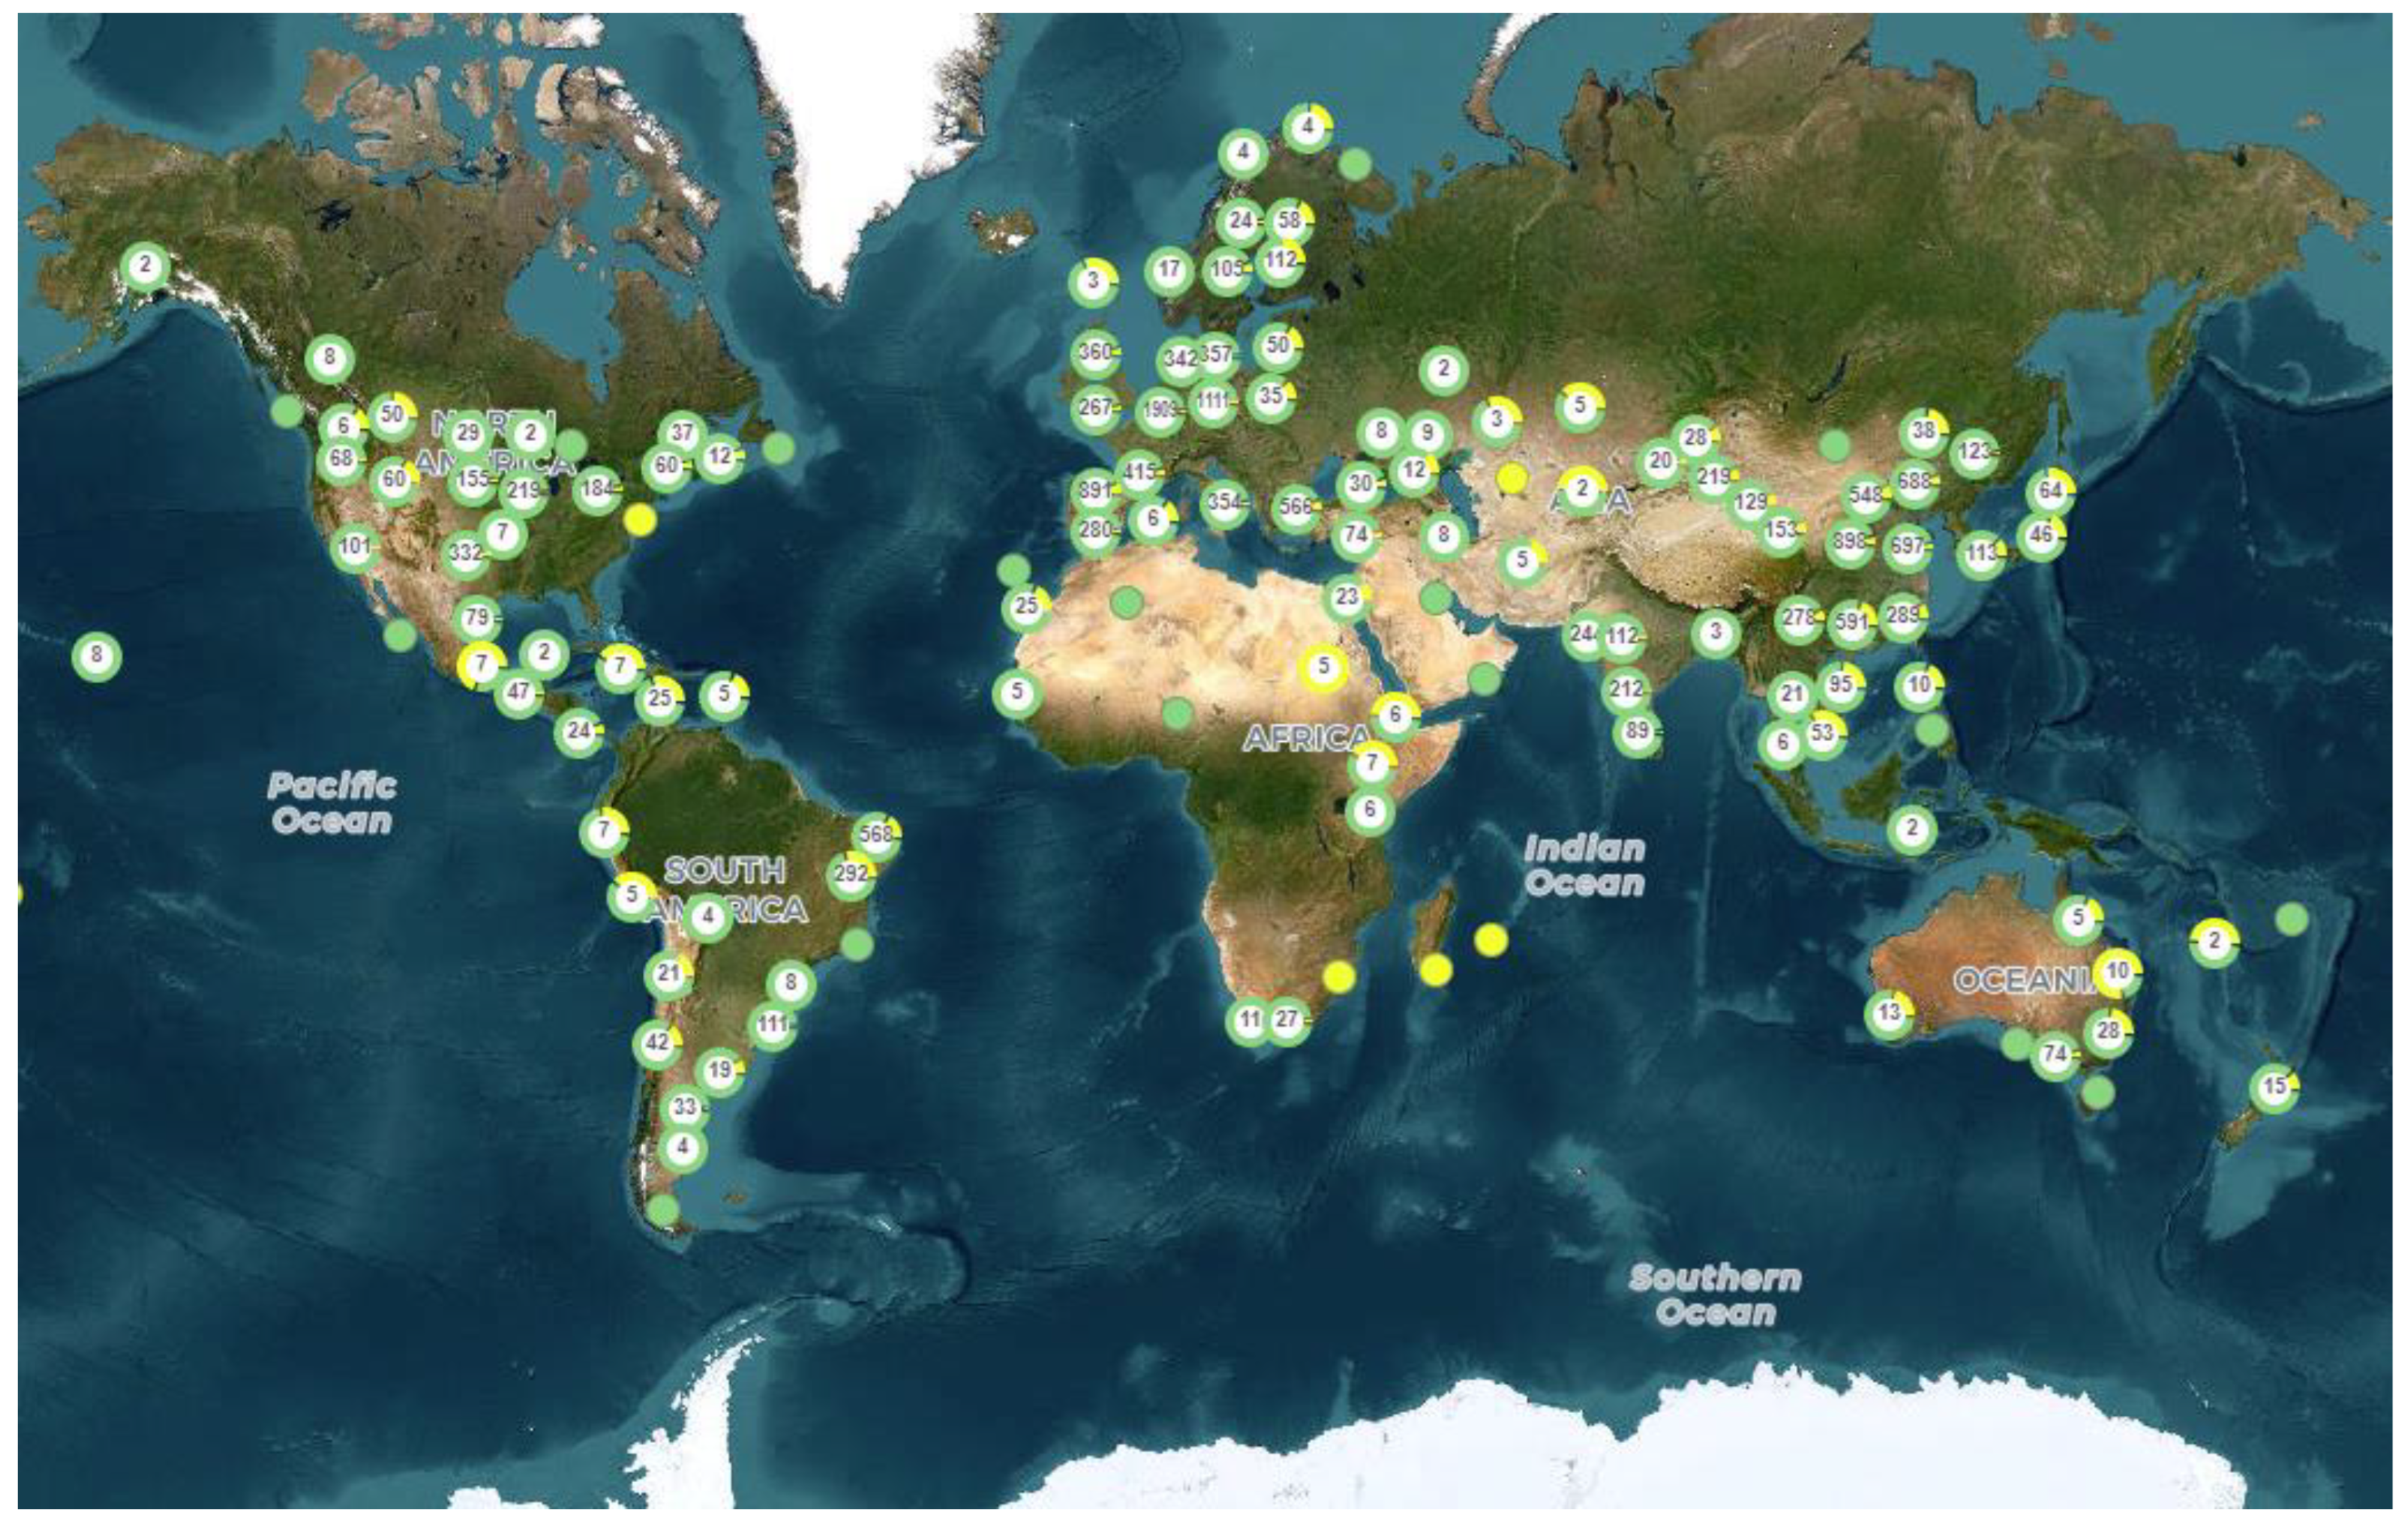
Figure 1. Worldwide map showing the operating (green) and under construction (yellow) wind farms with capacities equal to or exceeding 10 MW [4].
Preprints 86437 g001
Figure 2. Mean global snow cover duration since 1st October 2000 [29].
Preprints 86437 g002
Figure 3. Ice accretion on HAWT blade [30].
Preprints 86437 g003
Figure 4. Formation of ice on NACA 0012 airfoil, as obtained experimentally and numerically [43].
Preprints 86437 g004
Figure 5. Different ice forms obtained experimentally, for glaze and rime ice conditions [64].
Preprints 86437 g005
Figure 6. Photos of ice accretion on blade tip at various icing conditions, from light icing (case 1) to severe icing (case 6) [85].
Preprints 86437 g006
Figure 7. HAWT power coefficient versus tip speed ratio at various icing conditions, from light icing (case 1) to more severe icing (case 4) [85].
Preprints 86437 g007
Figure 8. Average precipitation in 2020 globally. Precipitation is the water that falls from clouds in either liquid or solid form [104].
Preprints 86437 g008
Figure 9. Droplets diameter over NACA 0012 airfoil at a 9° angle of attack, under varying Liquid Water Contents (LWCs) [92].
Preprints 86437 g009
Figure 10. Velocity contours downstream the three-bladed HAWT rotor at (a) 15 m; (b) 30 m; for airflow and at (c) 15 m; (d) 30 m for hailstorm conditions and wind speed of 10 m·s−1 [127].
Preprints 86437 g010
Figure 11. View of the Shagaya wind farm from the control building, 150 meters away from the nearest turbine, during a severe storm on April 26, 2018 [130].
Preprints 86437 g011
Figure 12. Sand particles concentration close to the three-bladed HAWT rotor at (a) wind speed 10m·s−1 and particles concentration 5%; (b) wind speed 10m·s−1 particles concentration 10% [151].
Preprints 86437 g012
Figure 13. Erosion rate of the three-bladed HAWT rotor blade (a) pressure; (b) suction side for wind speed 15m·s−1 particles concentration 10% [151].
Preprints 86437 g013
Figure 15. Conditions promoting insect contamination [7].
Preprints 86437 g015
Figure 16. Institutions globally that studied the operation of HAWTs under hazard conditions.
Preprints 86437 g016
Figure 17. Airfoils used for the construction of HAWT blades that investigated operating under hazard conditions.
Preprints 86437 g017
Disclaimer/Publisher’s Note: The statements, opinions and data contained in all publications are solely those of the individual author(s) and contributor(s) and not of MDPI and/or the editor(s). MDPI and/or the editor(s) disclaim responsibility for any injury to people or property resulting from any ideas, methods, instructions or products referred to in the content.
Copyright: This open access article is published under a Creative Commons CC BY 4.0 license, which permit the free download, distribution, and reuse, provided that the author and preprint are cited in any reuse.
Prerpints.org logo

Preprints.org is a free preprint server supported by MDPI in Basel, Switzerland.

Subscribe

© 2024 MDPI (Basel, Switzerland) unless otherwise stated