Submitted:
29 September 2023
Posted:
29 September 2023
You are already at the latest version
Abstract
Waterford Blaa is one of only seven Irish Protected Geographical Indication (PGI) products and the only Irish PGI bread. Currently, there are few published data characterising these products. This study aimed to determine whether any compositional or sensory markers could be used to differentiate between the three authorised producers of Waterford Blaa. Compositional testing was completed using AOAC standard methods; colour of top crust, bottom crust and crumb were identified with the Minolta Hunter lab colorimeter and texture profile analysis (TPA) was completed with an 80% compression test using the Instron 5544 to establish hardness, gumminess, and springiness. The fatty acid and aroma profiles were established in triplicate testing for the three authorised Blaa products using gas chromatography-flame ionisation detection and headspace-solid phase micro extraction-gas chromatography-mass spectrometry, respectively. As expected, results showed little variation in the overall composition of Waterford Blaa products. However, this study identified a unique fatty acid profile/volatile aroma profile for each Blaa. Specifically, the volatile profile showed potential differentiation between Blaa’s in terms of pentanal, furfural, 2-furanmethanol, 2-ethyl-1-hexanol and 2-pentyl furan. In addition, levels of hexanal and ethyl acetate were significantly different (p<0.05) in the crumb section of all three Blaa’s. This unique fingerprint has the potential to be used to identify fraudulent products claiming to be Waterford Blaa.
Keywords:
FAME
; SPME GC-MS
; Compositional Analysis
; Waterford Blaa
; Sensory Analysis
; Fatty Acid Profile
; Volatile Profile
1. Introduction
Bread is a staple food product worldwide. In Ireland, up to 57% of consumers regularly eat white bread [1]. Artisan bakery products are becoming increasingly popular with younger consumers, with the 16-24 and 25-34 age groups more likely to buy fresh bread from traditional bakeries [2]. Waterford Blaa is an Irish artisan bread product which was awarded Protected Geographic Indication (PGI) status in 2013. PGI status is awarded to products throughout the European Commission, which have an officially proven link to a specific geographical region [3].
Waterford Blaa is made in 10 steps – mixing, resting, pinning, sub-dividing (with flour addition), flattening and roll (with flour addition), proving (with flour addition), baking, assessment, cooling and lastly, packaging. For the Blaas to be unique and different from other breads, every step (except packaging) must take place in Waterford and the Blaas must be hand-floured at least three times during the production phase [4].
European consumers increasingly value authentic local produce and have shown a willingness to pay a premium for products displaying such indications on their label 5,6]. As a result of the price premium of regionally protected food products, they can be a target for food fraud whereby similar products produced in different regions are marketed as a PGI product [7,8]. To avoid such fraud, it is important to fully characterise foods with Protected Geographical Indication, to be able to differentiate them from non PGI product counterparts. This requires a comprehensive understanding of the product attributes and composition. For example, extensive research has been undertaken to authenticate PDO Olive Oil from non PDO counterparts [9] using spectroscopic, chromatographic analysis and genetics. These data have led to the identification of a chemical fingerprint with different volatiles found to be associated with different regions proving it would be a useful food fraud test [9,10]). Such in depth research is also useful to identify which product attribute is most likely to be affected by process variability, since food composition is a key determinant of sensory characteristics as evidenced by textural and flavour changes in bread [11,12,13].
In the case of Waterford Blaa, some key sensory attributes were identified during the PGI application process; for example, it is generally described as “a soft, square, white bread bun with a flour dusting on top”, the flour dusting being a characteristic feature (DAFM, 2013). A more comprehensive sensory profile, as determined by Quantitative Descriptive Analysis was previously published by this research group giving a full sensory lexicon for this product platform [14].
This is the first study that aims to develop a deep understanding of the compositional and sensory characteristics of Waterford Blaa, using FAME and SPME GC-MS to examine whether fatty acid and volatile markers could be utilised to differentiate between authorised Waterford Blaa products.
2. Materials and Methods
2.1. Compositional Analysis
Batches of freshly baked Waterford Blaa were sent directly from three separate bakeries in county Waterford, Ireland to University College Dublin (UCD), Dublin, Ireland. The samples were tested within 48 hours of arrival at UCD. The Blaa samples were refreshed by heating to 200ºC for 3 min and allowed to cool for 5 min before testing to make sure that the samples tested were treated in the same way as for the sensory testing [14] to facilitate data correlation. The compositional analysis was conducted in triplicate and repeated in three independent experiments to allow for within and between-batch variation.
Moisture analysis was conducted using the International Association for Cereal Science and Technology (ICC) method, 110/1 ;1976 [15] during which the 10g of Blaa samples were oven-dried at 130°C , The % moisture was calculated from {(weight of wet sample)-(weight of dried sample)/ (weight of sample) X 100}. Salt was measured using the Food and Agricultural Organisation of the United Nation’s potentiometric method [16] by extracting the salt from the sample and measuring the salt content. Ash, Protein, Total sugar, Fat and saturated fat were determined using Association of Official Analytical Chemists (AOAC) methods [17] (Table 1). Carbohydrate estimation was calculated using 100% minus the quantity of protein, fat, moisture, and ash. The energy content was determined for each sample using the following calculation: Energy (kilojoules) = (% Fat x 37) + (% Protein x 17) + (% Carbohydrate x 16). Since 1 Kilocalorie is equal to 4.184 Kilojoules, the kilocalorie content is equal to the Energy (kilojoules) / 4.184.
2.2. Colour
The Minolta Hunter lab colorimeter (Minolta, Model CR- 300: Minolta, GmbH Ahrensburg, Germany) was used to test the colour of Blaa from each authorised producer (Konica Minolta) [23] 2019). Readings for the top crust, bottom crust and crumb were recorded in triplicate for each Blaa. “L”, “a” and “b” results were obtained for each sample and an average for each sample type was determined where, “a” measured the amount of greenness (-values) to redness (+values), “b” measured blue (-values) to yellow (+values) and “L” indicated the level of lightness of the sample where 0 = Black and 100 = White. The colorimeter was calibrated each time by measuring against a white tile as per manufacturer’s instructions.
2.3. Texture
Textural parameters Hardness, Springiness, Gumminess and Chewiness were determined using the Texture Profile Analysis (TPA) using an Instron 5544 (Instron US, Norwood, MS, 02062-02634, US). During an 80% compression TPA profile, samples were compressed using a 50 mm compression plate. Two hardness parameters were included: Hardness 1 – the maximum force needed to compress the sample and Hardness 2 – maximum force required to compress the sample a second time. Springiness was assessed by measuring the bread’s ability to recover to its original shape after the compression.
2.4. Flour Dusting Determination
A product-tailored method was created to assess the extent of flour dusting on top of Waterford Blaa (a characteristic feature of Blaa). Flour dusting determination was developed to calculate the amount of residual flour on each Blaa variety. Ten Waterford Blaa’s from each authorised producer were brushed with a wide tipped paintbrush to remove surface flour. The Blaa were placed on a sheet of paper on top of a laboratory scale accurate to 0.001 g. The flour from each sample was brushed from the top crust in a left to right direction five times. The average weight of the collected flour was calculated for each sample type.
2.5. Fatty Acid (FAME) Analysis
Fatty acid profiles were determined as fatty acid methyl esters (FAMEs) which were prepared according to Brunton et al. [24]). This method used microwave-assisted extraction of fatty acids from the samples which were then analysed using gas chromatography-flame ionisation detection (GC-FID), in duplicate, for each type of sample. Briefly, 2 g of sample was placed into Xpress vessels with a stir bar. The samples were saponified with the addition of 10 mL 2.5% KOH in Methanol and 100L of Internal Standard Solution (10 mg/mL methyl tricosanoate in heptane). The vessels were transferred to the microwave where they were heated over 4 min to 130°C and held at this temperature for a further 4 min, followed by cooling in an ice-bath. The samples were then esterified with the addition of 15 mL 5% Acetyl Chloride in methanol solution, heated to 120°C over for 4 min in the microwave before being held at this temperature for a further 2 min. FAMEs were extracted by adding 10 mL Pentane to each vessel. Finally, 15 mL of saturated NaCl were added to the vessel to separate the layers. For analysis, 1 mL of the pentane layer containing the FAMEs was transferred to a GC vial containing 0.2 g of anhydrous sodium sulfate. FAMEs were separated using a PerkinElmer 580 GC-FID (Massachusetts, USA), as per Gangopadhyay et al. [25], by deploying a CP-Sil 88 (100 m, 0.25 mm ID, 0.2 µm film; Agilent Technologies, Santa Clara, CA, USA). For analysis, 1 µL samples was injected at 250°C at a split ration of 10:1 using hydrogen as a carrier gas at a constant flow of 1.25 mL/min. The initial oven temperature was 80°C with an initial ramp of 6.2°C/min to reach 220°C which was held for 3.2 min. A second ramp of 6.3°C/min was deployed to reach the final temperature of 240°C which was held for 6.5 min; the FID was to 270°C. FAMEs were identified through comparison of retention times to authentic standards (Supelco 37, Sigma Aldrich, Arklow, Co. Wicklow, Ireland). Data analysis was performed using TotalChrom 6.3.2 software (PerkinElmer, MA, USA).
2.6. SPME Volatile Analysis – Solid Phase Micro-Extraction Gas Chromatography Mass Spectrometry
Analysis of volatiles was conducted using headspace solid phase micro extraction-gas chromatography-mass spectrometry (HS-SPME-GC-MS) adapted from Ying et al. [26]. Briefly, samples were prepared by breaking the bread rolls into 5 g samples. The crust and crumb of each Blaa was evaluated separately. Crust samples were taken from the top crust of the bread whereas crumb samples were taken from the centre of the roll. The bread samples were put into 20 mL screw cap vials fitted with a silicone septum into which 5 ml saline solution (1 g NaCl/mL water) was added. Samples were homogenised with a glass rod and incubated for 60 min in a water bath at 40ºC. Volatile compounds were extracted by inserting the DVB/CAR/PDMS fibre (Sigma Aldrich, Arklow, Co. Wicklow, Ireland) into the glass vial for 10 min. Volatile compounds were then analysed using a Varian 3800 GC connected to a Saturn 2000 MS (Varian, CA, USA) by inserting the fibre into the inlet and desorbing the volatiles at 250°C for 5 min in splitless mode. Volatiles were separated using a DB-5MS (30 m, 0.25 mm ID, 0.25 µm film; Agilent Technologies, Santa Clara, CA, USA) by applying helium as a carrier gas with a constant flow rate of 1.5 mL/min. The initial oven temperature of 40°C was held for 3 min, before applying a ramp of 15°C/min to reach 250°C which was held for 10 min before a final ramp of 10°C/min was applied to reach 280°C which was held for a further 10 min. The transfer line was held at 280°C while ionisation in the ion trap was performed at 70 eV with a monitoring range of 33 to 230 m/z. Data analysis was performed using MS Workstation 6.9 software (Varian, CA, USA) for volatile compounds. The volatile compounds were identified using the NIST database [27].
2.7. Statistical Analysis
Data analysis was undertaken using XLSTAT sensory (version 2018.5: Addinsoft, New York, NY, United States). Two-way ANOVA was used to determine whether significant differences (p<0.05) exist between samples. Where significant differences were found, Tukey’s post- hoc test was used to determine the level of significance between means in the analysis of composition, colour, texture, flour dusting and FAME data for each Waterford Blaa product. All data points were measured in triplicate and three independent experiments were carried out. For the volatile compounds, the peak areas were determined for each Blaa crust and crumb. Non-normal data was logarithmically transformed using box-cox transformation and least square means values were presented.Correlation-based principal component analysis (PCA) was performed on the mean data using XLSTAT sensory (version 2018.5) to gain deeper insights into the correlations between datasets while maximizing the statistical information used [28].
3. Results
To understand which characteristics were fixed within the Waterford Blaa product platform, and which were specific to individual Blaa producers, a comprehensive investigation of the composition of each of the three Waterford Blaa products was undertaken to determine a possible link to key differentiating sensory properties. The data from this research sets the groundwork for the development of a product verification protocol for Waterford Blaa.
3.1. Compositional Analysis
The compositional profile, while broadly similar to white bread [29,30,31] shows some key differences for Waterford Blaa, which will be discussed below where relevant. All Waterford Blaas contain flour, water, shortening, yeast, and salt, in addition to which, each of the three recipes investigated here contained some product specific ingredient. For example, while Blaa A contains soya flour and Blaa B contains vegetable fat, Blaa C contains flour treatment agents, alpha amylase and ascorbic acid (E300). Therefore, it is not surprising to have found significant differences between Blaas. For example, Blaa A had significantly higher (p<0.05) moisture content than Blaa B and C, and is therefore more comparable with published figures for white bread and white rolls which had 36.1g/100g and 35.6g/100g [31]. Conversely, there was no significant difference observed between the three Waterford Blaa products for protein content (Table 2) and were also in keeping with published data where white bread and bread rolls had 8.7 and 9.1g/100g [31] as well as supermarket bread with 9.2g/100g (Tesco Ireland, 2020).
Salt is an important ingredient in bread baking as it assists in the development of the gluten matrix in the dough and has significant impact on the flavour of the bread [32]. In this study, Blaa C had significantly (p<0.05) more salt with 1.61 g/100 g than Blaa A or B. All Blaa products had more salt than published data of white bread and bread rolls with 0.4g/100g [31] or supermarket bread rolls with 0.8g/100g (Tesco Ireland, 2020). In line with these findings, ash levels varied significantly for all Blaas with content ranging from 1.24 to 2.50 g/100 g (Table 2) with Blaa C having a significantly higher ash content than Blaas A and B, as would be expected based on the already reported salt contents.
Typically, bread and bread products are an important source of carbohydrates [33,34]. Waterford Blaa products contained considerably more total carbohydrate than white bread or soft rolls. Blaa B had the highest level of carbohydrates, which was significantly more (p<0.05) than Blaa A. This was expected since for Blaa A wheat flour was partly substituted with soya flour, a flour low in carbohydrates. In comparison to published data where white bread and bread rolls had 48.7g/100g and 51.5g/100g respectively [31] which was slightly lower than the reported Blaa carbohydrate content. Blaa B also had significantly higher levels of reducing sugars and non-reducing sugars than Blaa A and C.
The role of fat (or shortening) in bakery products is to create different textures such as crumb structure, to prevent staling and to generally increase shelf life of bread [35]. The Fat content of all Waterford Blaa products was at least 4.7 g/100 g, although at 8.3%, Blaa C had significantly (p<0.05) more fat than Blaa A, and considerably more than published data for which were reported to contain 2.6g/100g of fat [31].
3.2. Colour
Colour of bread is influenced by baking. Specifically, the Maillard reaction is responsible for producing the browned crust and desirable colour, due to the reaction between amino acids and reducing sugars at high temperatures and low water activity [36,37]. In this study, hunter LAB units, L, a and b were determined and used to relate the “Lightness of crumb” and “darkness of browning (crust colour)” attributes established with the trained sensory panel for the three Waterford Blaa [14,23].
White bread crust has a typical colour range of L=74.5, a =-0.95 and b=23.02 for crumb and L=46.23, a=12.7 and b=24.06 for crust [38]. Waterford Blaa crumb values were within the reported levels for brightness for white bread. However, the a and b values were considerably lower than the typical published average, Waterford Blaa being considerably less red and yellow than average white bread with L=76.63, a =3.71, and b=6.19 (Table 3). Waterford Blaa top crust values ranged from L=54.0-75.2, a=6.6-13.3, b=9.65-15.92 and were brighter, redder but not as yellow as typical white bread. As expected, the Blaa crusts were darker, significantly redder, and less yellow than their crumb, since the lower internal temperatures prevent the development of melanoidins and volatile compounds [39,40].
Comparing the products, Blaa C had the lightest crumb colour (L=79.23); significantly lighter than Blaa B (L=74.74; p=0.01) but had a significantly darker crust than Blaa A and B (p<0.0001). All three Blaa’s were significantly different in a value, with Blaa C redder for crust and crumb than Blaa A and B (p<0.0001). As each baker uses a different flour supplier and Blaa is made by artisanal smaller bakeries involving hand flouring, each Blaa is expected to have variations in colour and brightness. While Blaa A contains soya flour and might therefore be expected to have elevated b levels, nonetheless, Blaa B flour is visually more yellow than Blaa A and C flour, which may explain its significantly higher b value for the crumb (p<0.0001; Table 3).
3.3. Texture
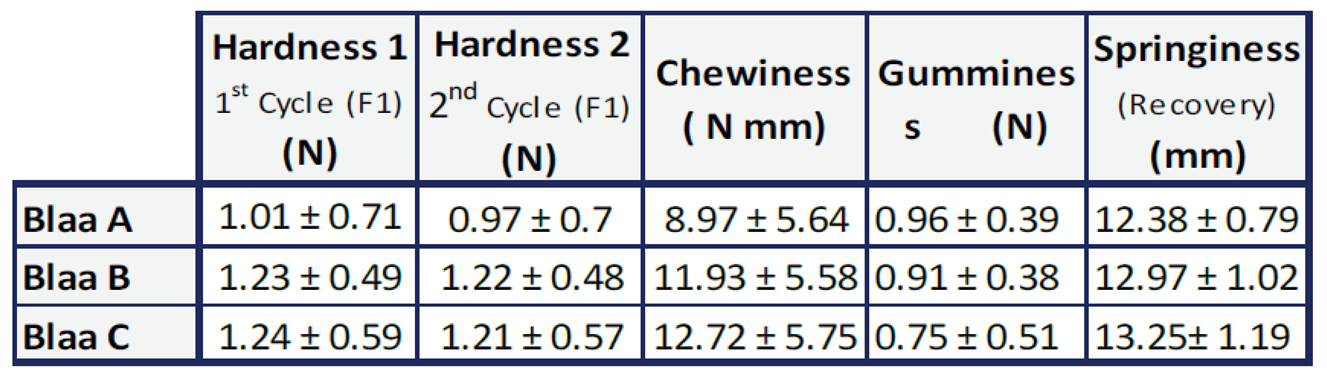
Texture Profile Analysis (TPA) is one of the key methods used to analyse the texture of baked goods. The benefit of TPA is that it mimics mastication or chewing [41] of the food product, and provides measures of hardness, chewiness, gumminess, and springiness. TPA has been used to analyse a range of bread products recently [41,42]. White bread has been found to have a hardness of 1.048 N and chewiness of 1.392 N which is similar to the hardness of Waterford Blaa’s, in this study (Table 4). However, Blaa chewiness was five times greater than what has been reported in other forms of white bread, with an average value of 8.97 N mm [43].
While there were no significant differences (p>0.05) between the Waterford Blaa’s in this study, trends indicated that Blaa B and Blaa C were slightly harder and chewier whilst Blaa A was somewhat gummier, meaning that the texture profile is not in itself sufficient to differentiate Blaas from each othe, or from other published data on white breads.
3.4. Flour Dusting
The mean flour dusting for all three Blaa bakers ranged from 0.089 g to 0.205 g per Waterford Blaa (Figure 1). Not surprisingly given the artisan production of Blaa which includes hand flouring, there was a large within-batch variation in amount of flour dusting: Blaa A ranged from 0.013 g – 0.402 g, Blaa B ranged from 0.088 g – 0.430 g and Blaa C ranged from 0.010 g – 0.450 g. In this study, Blaa B had a significantly larger quantity of flour dusting than Blaa C (p=0.003) but not Blaa A. Given the batch to batch variability of this parameter it is not a useful measure for differentiation of Waterford Blaa.
3.5. Towards building a characteristic Waterford Blaa fingerprint
While composition, moisture and texture give a lot of information about waterford Blaa, it is not easy to determine clean points of differentiation that would be useful when comparing them to non-Blaa floured bread rolls. In the last decade or so fatty acid and volatile profiles have been investigated to develop an identification fingerprint for Protected Designation of Origin (PDO) or Protected Geographical Indication (PGI) food products using chromatographic methods followed by chemometric analysis. These tools have been previously used for PDO products including Montasio cheese [44], wine vinegars [45] and olive oils [46,47]. This is the first study to attempt to investigate the potential of using chemometrics to differentiate Waterford Blaa products using fatty acid and volatile profiles.
3.5.1. Fatty Acid Profile
Fatty Acid Methyl Ester (FAME) analysis has been used to identify a unique fatty acid profile for Arnad PDO Lard, with the high proportion of saturated fats (palmitic and stearic acids) being used to distinguish this product from non-PDO Lard [48]. The fat content of bread products is much lower than in lard, however, this fat will impact on the intrinsic sensory qualities of bread, including bread loaf volume and texture of bread as well as the aroma profile [35]. There are few data published on FAME analysis of [49,50], with this study being the first to characterise the fatty acid profile of Waterford Blaa.
In all, 24 fatty acids were identified in Waterford Blaa of which ten were saturated, eight monounsaturated and six polyunsaturated (Table 5). The total fatty acids recovered in this study were 1.53 g/100 g, 3.16 g/100 g, and 2.27 g/100 g for Blaa’s A, B and C, respectively. Blaa B had the greatest saturated fat, monounsaturated fat, and polyunsaturated fat content with 0.9 g/100 g, 1.2 g/100 g and 1.0 g/100 g respectively.
Previous studies identified palmitic, stearic and arachidic as well as oleic, linoleic, and linolenic acid in white bread[49,51] all of which were also present in Waterford Blaa. In terms of identifying fatty acids uniquely associated with individual Waterford Blaa producers, it was found that half of the fatty acids identified, were present in all three Blaas, albeit in varying amounts.
The fatty acid profile unique to Blaa A did not include fatty acids that were present in both Blaa’s B and C, i.e., myristic acid, cis-vaccenic acid, and cis-11-eicosenoic acid. Furthermore, the profile of Blaa A included the presence of lignoceric acid, eruic acid and linolelaidic acid, but the absence of caprylic acid, nervonic acid, g-linolenic acid, and docosahexaenoic acid. The fatty acids associated with Blaa B were nervonic acid, and g- linolenic acid, and docosahexaenoic acid. Conversely, the presence of caprylic acid, lignoceric acid, eruic acid, and linolelaidic acid, are counter indicative for Blaa B identification. This absence of short chain fatty acids such as caprylic acid was expected since these are associated with animal fats rather than plant-based spreads [52] such as the one used in the production of Blaa B. Caprylic acid is also absent from Blaa A as there was no plant-based fat or oil in the ingredients. Finally, Blaa C could be positively associated with the unique presence of caprylic acid and the absence of elaidic acid.
Similar to Blaa B, the presence of lignoceric acid, eruic acid, linolelaidic acid, and similar to Blaa A the presence of nervonic acid, g-linolenic acid, and docosahexaenoic acid are all counter indicative of a Blaa C identification.
Comparing the fatty acid profile of white bread [49] and Waterford Blaa, it was observed that whilst palmitic, arachidic, stearic, oleic, and linoleic acid were present in both, Waterford Blaa contains many more saturated, monounsaturated, and polyunsaturated fatty acids. This study provided a unique fatty acid profile of each individual Blaa showing the similarities and differences between all three Blaa products which could be beneficial in identifying them for authentication purposes.
3.5.2. Volatile Profile
Aroma is one of the most important sensory qualities impacting consumer acceptance of a bakery product [53,54]. Volatile analysis has been conducted extensively on bread products using solid-phase microextraction (SPME) and Gas Chromatography-Mass Spectrometry (GC-MS) analysis [54,55,56,57,58] with approximately 540 bread-associated volatiles identified [59,60]. However, this is the first study exploring volatile analysis of Waterford Blaa. The volatile profile in terms of presence and proportion is key in determining the aromatic perception and hence liking of bread. Waterford Blaa was found to contain key high odour-active volatiles associated with bread crust and crumb aroma (Table 6), including 3-methyl-1-butanol, nonanal and heptanal which are considered crucial to bread aroma [55,61].
Similar to fatty acid profiling, the use of the volatile profile to differentiate between Waterford Blaa products requires the existence of consistent significant differences in the presence, absence or concentration of volatiles that are characteristic of a specific product. In this study, there was no volatile compound that was either uniquely present or absent among the three Waterford Blaa’s. Of the 14 volatiles identified, only two showed no significant difference in concentrations recovered in the three products (Table 7) These included pentanal, which is responsible for fermented and bready aroma notes and 2-ethyl-hexan-1-ol, which is responsible for sweet, fatty, and fruity. Whilst pentanal showed no significant differences between any Blass or crust/crumb, significantly different levels of 2-ethyl-hexan-1-ol were observed in the crust for all Waterford Blaa’s (p = 0.007).
All other volatiles had significant differences in concentration in both the crust and crumb (p < 0.05). In terms of developing a unique fingerprint, six of the 14 volatiles could separate the Blaa’s in the crust or crumb profiles. In the crust, Blaa A could be differentiated from the other two products (where only two statistical groups were observed), due to significantly higher levels of heptanal (p = 0.01), and significantly lower, levels of furfural (p = 0.0001). Blaa A also had the lowest levels (p < 0.05) for seven of the remaining crust volatiles (Table 7). Blaa C could be differentiated from the other two products (where only two statistical groups were observed), due to a significantly higher level of hexanal (p = 0.03) and ethyl octanoate (p = 0.02) and had significantly higher (p < 0.05) levels of a further nine crust volatiles when compared to the other two products. Where significant differences were found for Blaa B, only 2-ethylhexan-1-ol and nonanal were significantly lower than the other two products.
This situation was reversed in the case of the crumb volatiles, for which Blaa B distinguished from the other two products (where, again, only two statistical groups were observed), by having significantly higher levels of 3-methylbutan-1-ol, furfural, and 2-pentyl-furan. Blaa B also had the highest levels (p < 0.05) of hexanal, heptanal, benzaldehyde, nonanal, and Phenylethyl alcohol, for which Blaa A had the lowest values (p < 0.05). Blaa A could be differentiated by having a significantly higher level of ethyl octanoate (p = 0.007) in the crumb. In the case of the crumb, where significant differences in volatile concentration exist, Blaa C had the highest levels of ethyl acetate (p = 0.001) and 2-furanmethanol, but levels between those of Blaa A and C for the remaining volatiles identified.
Volatiles in bread may arise directly from the ingredients used, or from the processes used to make it. These factors include but are not limited to the yeast type and concentration, fermentation temperature and duration, lipid oxidation, and Maillard reactions during baking [12,36,40,63,64,65,66]. Due to the different heating patterns used in different kitchens, it is expected that the amounts and types of volatiles will, as is demonstrated by these data, differ in the crust and the crumb of bread [67]. The crust volatiles are temperature dependent as products of Maillard reactions, e.g. 2-acetyl-1-pyrroline and caramelisation of sugars e.g., caramelans, typically occurring in higher concentrations in the crust, compared to the crumb. On the other hand, the crumb volatiles, e.g. 3-methyl-1butanol, tend to develop during the fermentation of the dough [62, 68, 69] so that, in terms of identifying a unique volatile profile for Waterford Blaa, it could be postulated that the crumb profile offers a more stable, predictable option as it is less impacted by batch-to-batch variations in oven temperature and cook time.
Authentication of PDO olive oils [46] and Altamura PDO wheat bread [68, 70] has been successful using volatile identification and chemometrics. In this study, volatile analyses have pointed to potential markers that could be used to discriminate Waterford Blaa products. For example, as both pentanal and 2-ethylhexan-1-ol, furfural, 2-furanmethanol, and phenylethyl alcohol are present in all three Blaa’s and have not yet been reported in white bread [36, 68, 70] some of these volatiles could prove to be points of differentiation between Waterford Blaa and other white bread products.
However, identifying the presence or absence of volatiles or fatty acids does not give the full account of the aroma profile of bread since aroma compounds with a high odour activity value (OAV) are more impactful from a sensory perception point of view [71]. It is therefore important to fully understand how the physicochemical and sensory properties of Waterford Blaa interact.
4.. Discussion
Correlation of sensory attributes with compositional data, texture analysis and volatile analysis
Previously, Quantitative Descriptive Analysis of Waterford Blaa yielded a lexicon of 34 sensory attributes that described the key sensory characteristics of Blaa appearance, aroma, texture and flavour, and identified those qualities that discriminated between the three variants [14]. By correlating those sensory data with instrumental and chemical data collected in this study, a biplot representing a visual summary of the parameters was obtained. As can be seen in Figure. 2 Axes F1 and F2 accounted for 73.71% of the data and showed a clear separation between the three Blaa products with instrumental data as supplementary variables in the dataset.
Figure 2.
Principal Component Analysis (PCA) of three Waterford Blaa products where ■ represents trained panel quantitative descriptive analysis attributes for the three Blaa’s, ■ represents texture profile data, and ■ represents compositional analysis data.
Figure 2.
Principal Component Analysis (PCA) of three Waterford Blaa products where ■ represents trained panel quantitative descriptive analysis attributes for the three Blaa’s, ■ represents texture profile data, and ■ represents compositional analysis data.
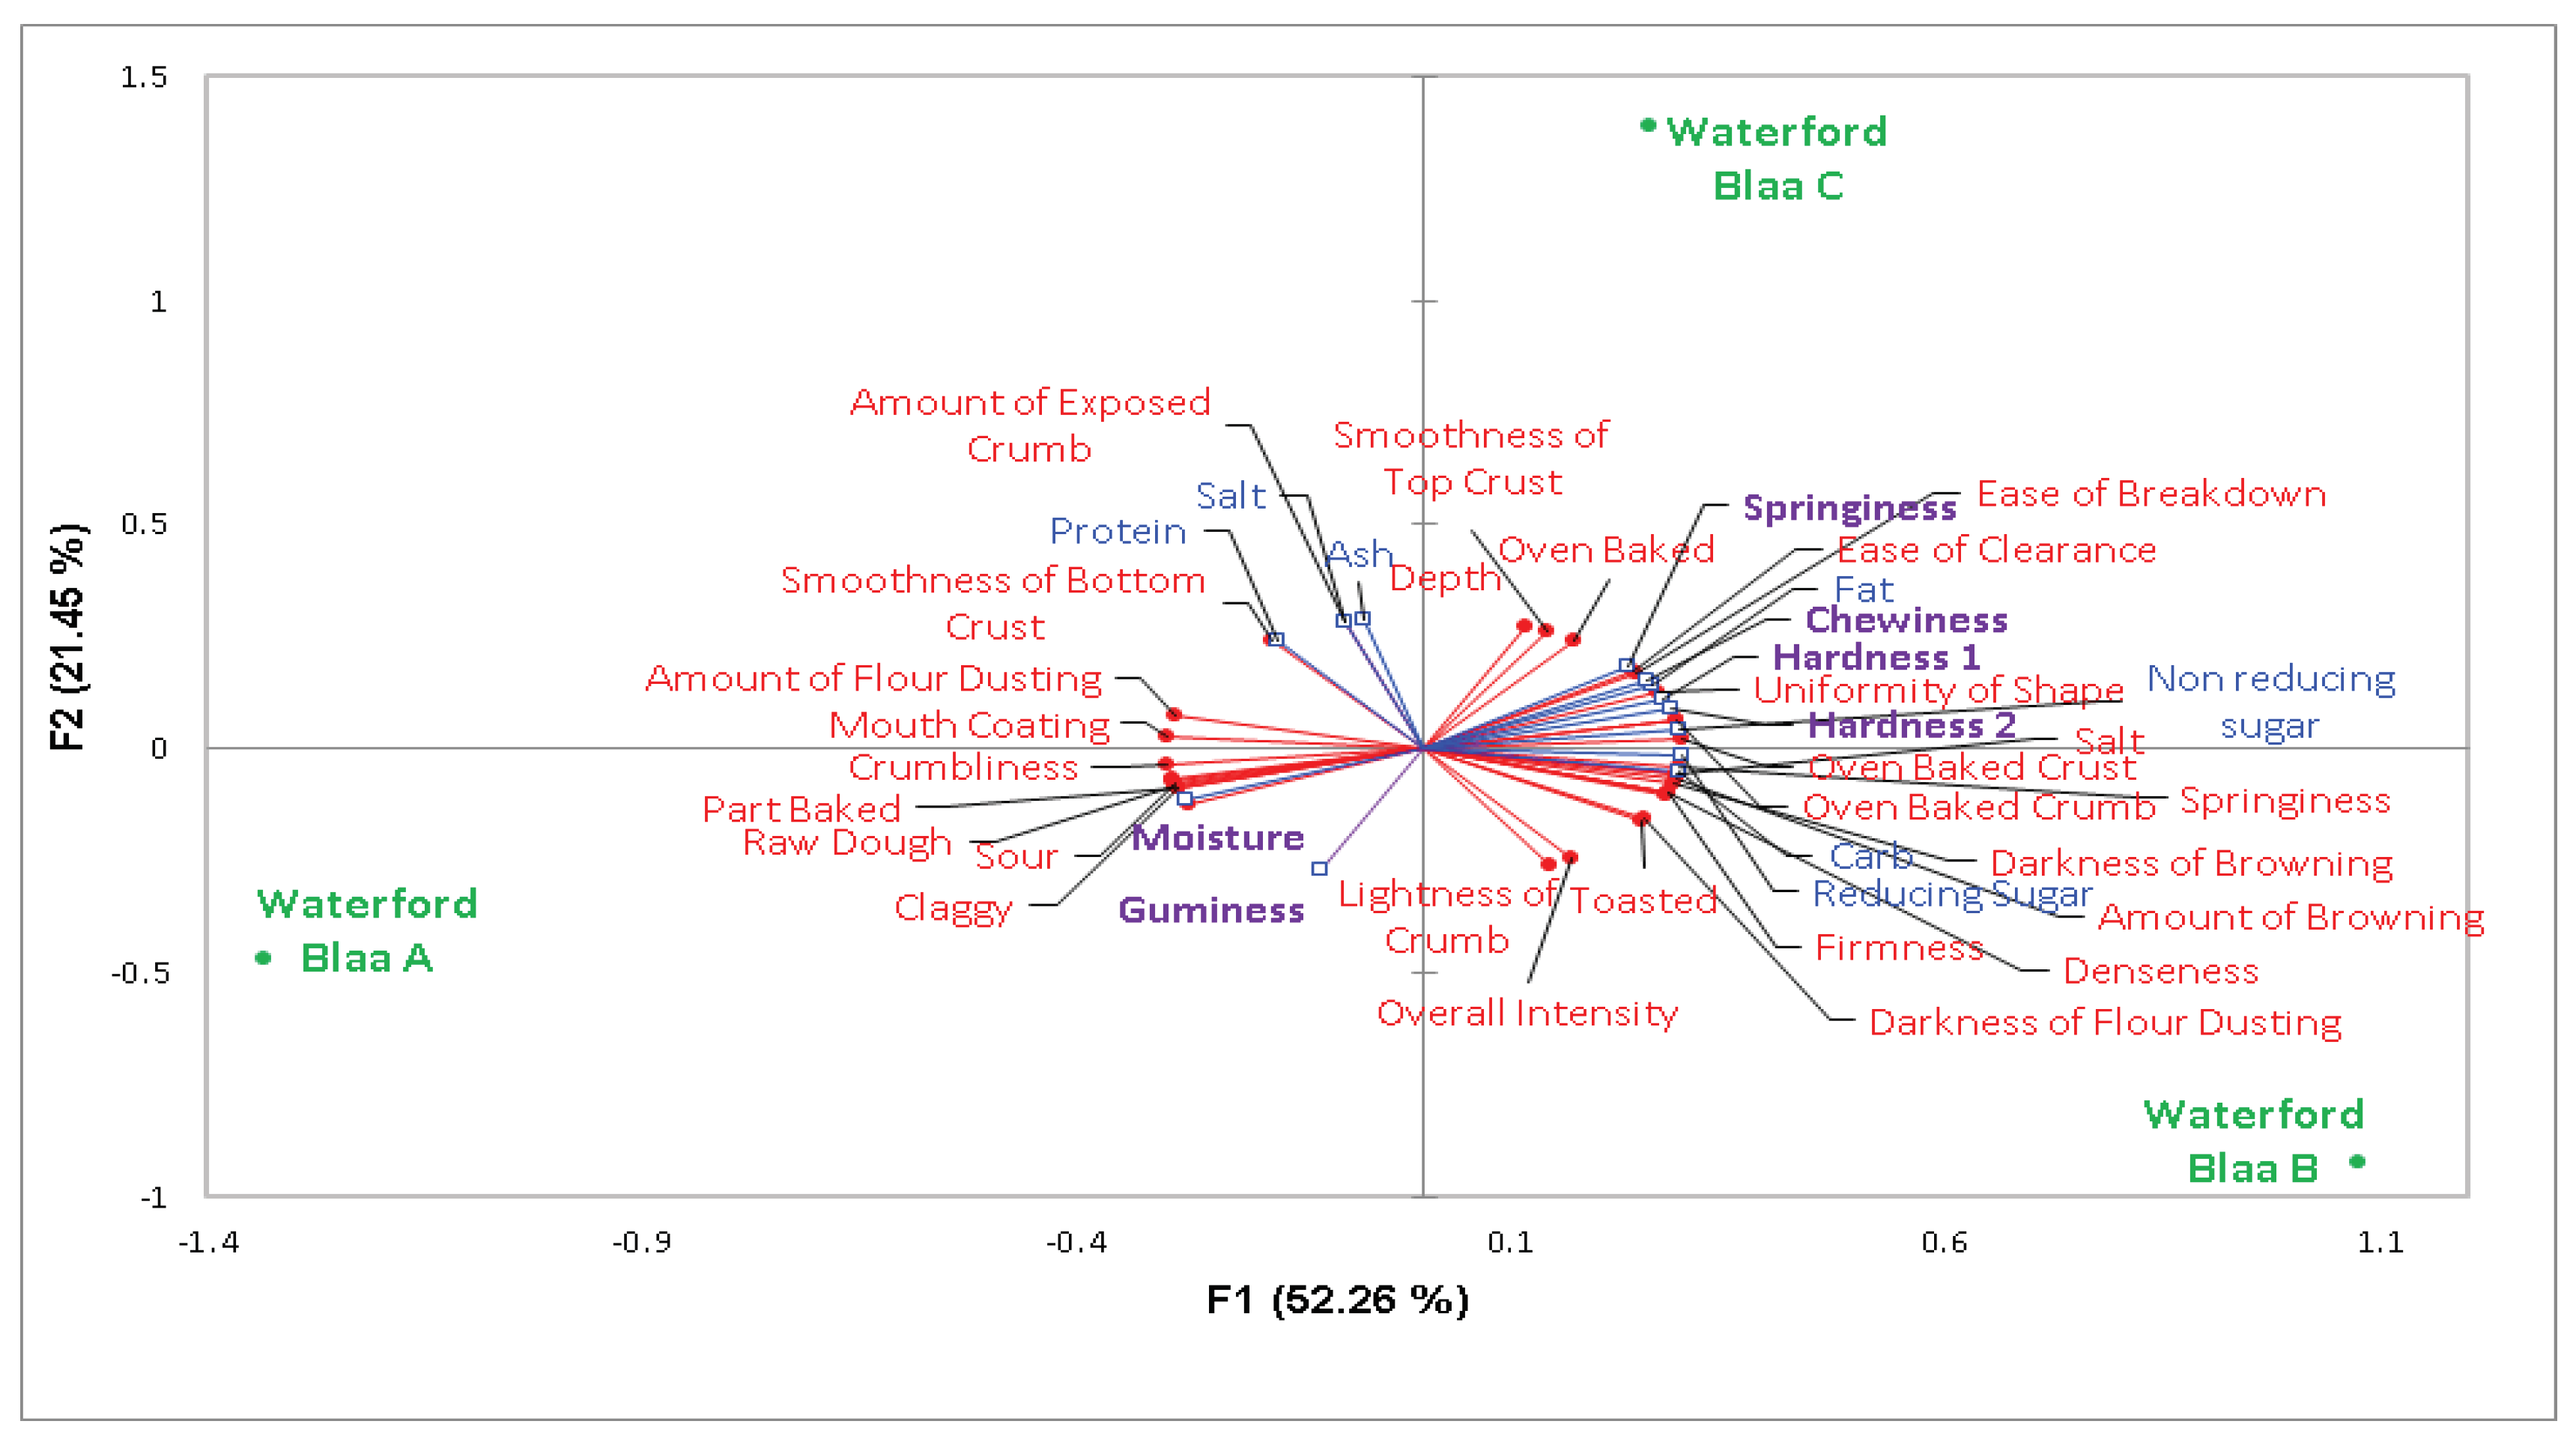
In this plot, F1 was associated with visual colour, describing a key difference between Blaa A and Blaa B, and to a lesser extent Blaa C. In this way the Blaa’s have been separated by the pale visual colour arising from the higher ‘amount of flour dusting’ associated with Blaa A, with the ‘amount and darkness of browning’ sensory attributes associated with Blaa B on the other end of the scale. From a sensory point of view, the heavily floured surface also correlates with a number of sensory and instrumental parameters. For example, Blaa A was characterised as having a ‘crumbly’ and ‘claggy’ (thick and sticky) texture during chewing. ‘Claggy’ was positively correlated with both ‘gumminess’ and ‘moisture’ content. These parameters are possibly describing the same underlying construct as both are measures of stickiness and are effectively separating the three Blaa’s on this biplot.
F2 represents instrumental texture attributes, e.g., ‘springiness’ and ‘chewiness’, that discriminated Blaa C from the other two Blaa products, and which correlates with the descriptive panel’s perception of Blaa B as significantly ‘firmer and springier’ in terms of sensory attributes [14]. F2 also expressed analytical differences in % salt, % ash, % protein.
The production of volatile compounds, e.g., melanoidins, via Maillard browning reactions during cooking is one of the key visual differences between the crust and crumb of bread [62]. Furfurals, pyranones and furanones as well as oxazoles and sulphuric compounds result from maillard browning on the crust of bread for example 2-furanmethanol and furfural [72]. Correlating volatile data with sensory data from the trained sensory panel, the resulting PCA biplot clearly separates the crust and crumb of the three Waterford Blaa products along the F2 axis which represents sensory attributes ‘darkness of flour dusting’ and ‘darkness of browning’ (Figure 3).
In this case, colour is positively correlated with sensory attributes including “toasted” and “darkness of flour dusting”, as well as with smoothness of crust, exposure of crumb appearance and furfural and heptanal volatiles. Sensory aroma attributes ‘part baked’ and ‘oven baked’ are represented on the FI axis as well as the texture associated attributes ‘claggy’, ‘ease of breakdown’, ‘ease of clearance’, and ‘amount of flour dusting’. Looking at the crust samples, there is a clear differentiation between the Blaa’s, Blaa C being more closely associated with furfural, 3-methyl-1-butanol and hexanal along F1, and somewhat less pentanal and heptanal along F2. F1 separates the crumb of the three Waterford Blaa products based on sensory aroma, ethyl ester of octanoic acid and ‘firmness’, Blaa A crumb is most closely correlated with sensory ‘sour’, ‘part-baked’ and ‘raw dough’ aroma and ethyl ester of octanoic acid and pentanal volatiles, while Blaa’s C and B crumbs are more associated with ‘oven baked crumb’ and pentanal and heptanal volatiles along FI. Blaa B crumb is also separated from Blaa’s A and C along the F2 axis being correlated more closely with the volatiles 2-pentyl-furan, nonanal and hexanal volatiles. Whilst there were positive correlations between sensory and analytical measures, these did not always represent causal relationships between the two.
5. Conclusion
This preliminary ground work with Waterford Blaa established its physicochemical properties using key analytical methodologies to glean important insights into the compositional, textural, volatile, and fatty acid profiles of the three Waterford Blaas. Further work with Waterford Blaa, and including other similar white bread products, is now needed to create a robust authentication system that could assist in comparing potentially fraudulent products to the individual profiles established in this study.
Compositionally, the three Blaa products were significantly different in colour, flour quantity, % moisture and ash, % salt, % carbohydrate, % reducing sugars and non-reducing sugars and % fat. These alone however would not be adequate to separate Waterford Blaa from other soft white bread rolls/ baps.
Both fatty acid and volatile profiling provided potential markers that could be used to develop a tool to identify Waterford Blaa products. In terms of Fatty acids, the presence of Lignoceric acid could be indicative of Blaa A, which also has significantly higher amount of the volatile Ethyl Octanoate. In contrast, Blaa B may be distinguished through the absence of Lauric Acid and presence of small quantities of Nervonic acid and Docosahexaenoic acid along with significantly higher levels of the volatiles 3-methylbutan-1-ol, 2-pentyl-furan and furfural volatiles compared to the other two Waterford Blaa’s. Finally, the presence of Caprylic Acid is unique to Blaa C. There were no identifying key crumb volatiles identified in this study, however PCA analysis indicates that the furfural, 2 furanmethanol, heptanal and pentanal volatiles may be useful in separating the Waterford Blaa’s from each other For example, Blaa B crumb and Blaa C crust were closely associated with the presence of 2-pentyl furan, nonanal and hexanal.
These results are the first to use ChemSense approaches to characterise, and distinguish between, the three authorised PGI Waterford Blaa products. In short, the instrumental and sensory data presented in this study provides insights into how the three Blaa’s differ from each other. This information has the potential use in the food industry to establish a quality specification to ensure consistent delivery of the unique sensory qualities of each Waterford Blaa. The volatile and FAME analysis provides the ground work and basis for the development of tools for in-category product differentiation and product authentication in future studies which could examine its effectiveness in identifying Waterford Blaa among other white bread products.
Author Contributions
Conceptualization, A.G.M.S; T.H; and R.K: methodology, S.H.; A.G.M.S; T.H; and R.K: .software, A.M: validation, A.G.M.S; S.H; A.M. R.K: formal analysis, R.K; S.H; A.M; investigation, R.K: resources, R.K: data curation, R.K; A.G.M.S; S.H:.; writing—original draft preparation, R.K: writing—review and editing; A.G.M.S; S.H; A.M; T.H. visualization, X.X.; supervision, A.G.M.S; T.H:.; project administration, A.G.M.S.; funding acquisition, A.G.M.S. All authors have read and agreed to the published version of the manuscript.
Funding
This research was funded by grant aid funding for the project ‘Sensory Food Network Ireland‘ under the Food Institutional Research Measure (FIRM), which is administered by the Irish Department of Agriculture, Food and Fisheries (DAFF), grant number 13 SN-401.
Data Availability Statement
Data is held by the corresponding author and can be made available upon request by email.
Conflicts of Interest
The authors declare no conflict of interest. The funders had no role in the design of the study; in the collection, analyses, or interpretation of data; in the writing of the manuscript; or in the decision to publish the results.
References
- IUNA (2016). Report on the pattern of white and wholemeal bread consumption in Irish adults and pre-school children. Available at: https:// www.fooddrinkireland.ie /Sectors / FDI/FDI. nsf/ 6cbe469001b758968025778b003b324e /04578a16193e 56d9802580f 9005 d1fe0/ $FILE/IUNA%20%20-%20IBBA%20Report%20Oct%202016%20Final.pdf. [Last Accessed 14th April 2020].
- Mintel (2018). Bread – Ireland – April 2018 Usage of bread products. pp.7. Available at: http://academic.mintel.com.ucd.idm.oclc.org/display/891275/ [Accessed on 5th September 2023].
- Department of Agriculture, Food, and the Marine (2019) Available at: http://www.agriculture.gov.ie /gi/pdopgitsg-protectedfoodnames/ products / [Last Accessed 20th September, 2023].
- Department of Agriculture, Food and the Marine (2013) Waterford Blaa Specification Available at : https://www.agriculture.gov.ie/gi/pdopgitsg-protected food names / products / waterfordblaablaa/ [Last Accessed 11th August 2023].
- Grunert, K.G. and Aachmann, K. Consumer reactions to the use of EU quality labels on food products: A review of the literature. Food Control, 2016; 59, pp.178-187. [CrossRef]
- Scozzafava, G., Gerini, F., Dominici, A., Contini, C. and Casini, L. Reach for the stars: The impact on consumer preferences of introducing a new top-tier typology into a PDO wine. Wine Econ. Policy, 2018; 7(2), pp.140-152. [CrossRef]
- Kendall, H., Clark, B., Rhymer, C., Kuznesof, S., Hajslova, J., Tomaniova, M., Brereton, P. and Frewer, L. A systematic review of consumer perceptions of food and authenticity: A European perspective. Trends Food Sci. & Technol. 2019; 94 pp.74-90. [CrossRef]
- Spink, J., Hegarty, P.V., Fortin, N.D., Elliott, C.T. and Moyer, D.C. The application of public policy theory to the emerging food fraud risk: Next steps. Trends Food Sci. & Technol. (2019) 85, pp.116-128. [CrossRef]
- Conte, L., Bendini, A., Valli, E., Lucci, P., Moret, S., Maquet, A., Lacoste, F., Brereton, P., García-González, D.L., Moreda, W. and Toschi, T.G., (2020). Olive oil quality and authenticity: A review of current EU legislation, standards, relevant methods of analyses, their drawbacks, and recommendations for the future. Trends Food Sci. & Technol., 2020; 105, pp.483-493. [CrossRef]
- García-González, D.L., Romero, N. and Aparicio, R. Comparative study of virgin olive oil quality from single varieties cultivated in Chile and Spain. J. Ag. & Food Chem. 2010; 58(24), pp.12899-12905. [CrossRef]
- Gallagher, E. ed., (2009). Gluten-Free Food Science and Technology. John Wiley & Sons. pp.75. ISBN 978-1-4051-5915-9.
- Jensen, S., Oestdal, H., Skibsted, L.H., Larsen, E. and Thybo, A.K. Chemical changes in wheat pan bread during storage and how it affects the sensory perception of aroma, flavour, and taste. J.Cereal Sci. 2011 53(2), pp.259-268. [CrossRef]
- Torbica, A., Škrobot, D., Hajnal, E.J., Belović, M. and Zhang, N., (2019). Sensory and physico-chemical properties of wholegrain wheat bread prepared with selected food by-products. LWT, 2019 114, p.108414. [CrossRef]
- Kelly, R., Hollowood, T. and Scannell, A.G.M., . Sensory characterisation of an Irish PGI bread: Waterford Blaa. Euro. Food Res. and Technol. 2019 245(6), pp.1307-1319. [CrossRef]
- International Association for Cereal Science and Technology (1976). 110/1 Determination of the Moisture Content of Cereals and Cereal Products. Available at https://icc.or.at/publications/icc-standards/standards-overview/110-1-standard-method [last accessed on 14th August 2023].
- Food and Agriculture Organization of the United Nation (2007) Compendium of Food Additive Specifications. Rome: Electronic Publishing Policy and Support Branch FAO.
- AOAC International (2005) Official methods of analysis of the association of official analytical chemists international (18th ed.) Maryland, USA (2005).
- AOAC International (2000) Official Methods of Analysis, Method 923.03 Available at: http:// www.eoma.aoac.org/ methods/info.asp?ID=26719 [Accessed: 07/05/23].
- AOAC International (2005a) Official Methods of Analysis, Method 978.04 Available at: http:// www.eoma.aoac.org /methods /info.asp?ID=32176 [Accessed: 07/05/23].
- AOAC International (2005b) Official Methods of Analysis, Method 939.03 Available at: http://www.eoma.aoac.org /methods/info.asp?ID=27059 [Accessed: 07/05/23].
- AOAC International (2005c) Official Methods of Analysis, Method 963.15 Available at: http://www.eoma.aoac.org /methods/info.asp?ID=25801 [Last accessed: 05th August 2023].
- AOAC International (2015d) Official Methods of Analysis, Method 969.33Available at: http://www.eoma.aoac.org/methods/info.asp?ID=17760 [Accessed: 07/05/21].
- Konica Minolta (2019) Chroma Meters CR-400/ CR410. Available at: https://www5.konicaminolta.eu/en/measuring-instruments/products/colour-measurement/ chroma-meters/cr-400-410/introduction.html [Accessed 5th March 2023].
- Brunton, N.P., Mason, C. and Collins, M.J. Rapid microwave assisted preparation of fatty acid methyl esters for the analysis of fatty acid profiles in foods. J.Anal. Chem. 2015; 70 (10), pp.1218-1224. [CrossRef]
- Gangopadhyay, N., Rai, D.K., Brunton, N.P., Gallagher, E., Harrison, S. Fatty Acids, stearols and tocols in Irish barley varieties: profiling and correlation. E.J.Lipid Sci. & Technol. 2016; 119. [CrossRef]
- Ying, S., Lasekan, O., Naidu, K. and Lasekan, S., Headspace solid-phase microextraction gas chromatography-mass spectrometry and gas chromatography-olfactometry analysis of volatile compounds in pineapple breads. Molecules, 2012; 17 (12), pp.13795-13812. [CrossRef]
- NIST (National Institute of Standards and Technology), NIST Chemistry Webbook (2015) Available at: https://www.nist.gov/srd/nist-standard-reference-database-1a-v17 [Last accessed in September 2023].
- Joliffe, I. T. & Cadima, J. Principal component analysis: a review and recent developments. Phil. Trans. R. Soc. A. 2016; 374: http://doi.org/10.1098/rsta.2015.02022016.
- Bagdi, A., Toth, B., Lorincz, R., Szendi, Sz., Gere, A., Kokai, Z., Sipos, L., Tomoskozi, S. Effect of aleurone-rich flour on composition, baking, textural and sensory properties of bread. LWT – Food Sci. Technol. 2016; 65, pp. 762-769. [CrossRef]
- Kihlberg, I., Öström, Å., Johansson, L. and Risvik, E. Sensory qualities of plain white pan bread: Influence of farming system, year of harvest and baking technique. J. Cereal Sci. 2006; 43(1), pp.15-30. [CrossRef]
- McCance, R. A. & Widdowson, E. M. (2014). McCance and Widdowson’s The composition of Foods. Royal Society of Chemistry, Cambridge, United Kingdom, 7th Summary Edition pp.50-51. [CrossRef]
- Pasqualone, A., Caponio, F., Pagani, M.A., Summo, C. and Paradiso, V.M. Effect of salt reduction on quality and acceptability of durum wheat bread. Food Chem. 2019; 289, pp.575-581. [CrossRef]
- Dewettinck, K., Van Bockstaele, F., Kühne, B., Van de Walle, D., Courtens, T.M. and Gellynck, X. Nutritional value of bread: Influence of processing, food interaction and consumer perception. J.Cereal Sci. 2008 48 (2), pp.243-257. [CrossRef]
- Gellynck, X., Kühne, B., Van Bockstaele, F., Van de Walle, D. and Dewettinck, K. Consumer perception of bread quality. Appetite, 2009; 53(1), pp.16-23. [CrossRef]
- Pareyt, B., Finnie, S.M., Putseys, J.A. and Delcour, J.A., (2011). Lipids in bread making: Sources, interactions, and impact on bread quality. J. Cereal Sci. 2011; 54 (3), pp.266-279. [CrossRef]
- Birch, A.N., Petersen, M.A., Arneborg, N. and Hansen, Å.S. Influence of commercial baker's yeasts on bread aroma profiles. Food Res. Int. 2013; 52(1), pp.160-166. [CrossRef]
- Conte, P., Del Caro, A., Balestra, F., Piga, A. and Fadda, C. Bee pollen as a functional ingredient in gluten-free bread: A physical-chemical, technological, and sensory approach. LWT- Food Sci. &n Technol. 2018; 90, pp.1-7. [CrossRef]
- Dhen, N., Rejeb, I.B., Boukhris, H., Damergi, C. and Gargouri, M. Physicochemical and sensory properties of wheat-Apricot kernels composite bread. LWT, 2018; 95, pp.262-267. [CrossRef]
- Izzreen, M.N.Q., Hansen, Å.S. and Petersen, M.A. Volatile compounds in whole meal bread crust: The effects of yeast level and fermentation temperature. Food Chem. 2016; 210, pp.566-576. [CrossRef]
- Shen, Y. Chen, G., Li, Y. Bread characteristics and antioxidant activities of Maillard reaction products of white pan bread containing various sugars. LWT – Food Sci. & Technol. 2018; 95, pp.308-315. [CrossRef]
- Cauvain, S.P. 2012. Breadmaking: improving quality. Woodhead Publishing, Cambridge, United Kingdom, Second Edition, Pp. 572. eBook ISBN: 9780857095695.
- Carocho, M., Morales, P., Ciudad-Mulero, M., Fernández-Ruiz, V., Ferreira, E., Heleno, S., Rodrigues, P., Barros, L. and Ferreira, I.C. Comparison of Different Bread Types: Chemical and Physical Parameters. Food Chem. 2019; 310 pp.125954. [CrossRef]
- Ding, S., Peng, B., Li, Y. and Yang, J. Evaluation of specific volume, texture, thermal features, water mobility, and inhibitory effect of staling in wheat bread affected by maltitol. Food Chem.2019: 283, pp.123-130. [CrossRef]
- Bovolenta, S., Romanzin, A., Corazzin, M., Spanghero, M., Aprea, E., Gasperi, F. and Piasentier, E. Volatile compounds and sensory properties of Montasio cheese made from the milk of Simmental cows grazing on alpine pastures. J. Dairy Sci. 2014; 97 (12), pp.7373-7385. [CrossRef]
- Ríos-Reina, R., Callejón, R.M., Savorani, F., Amigo, J.M. and Cocchi, M. Data fusion approaches in spectroscopic characterization and classification of PDO wine vinegars. Talanta,2019; 198, pp.560-572. [CrossRef]
- Vera, D.N., Jiménez-Carvelo, A.M., Cuadros-Rodríguez, L., Ruisánchez, I. and Callao, M.P. Authentication of the geographical origin of extra-virgin olive oil of the Arbequina cultivar by chromatographic fingerprinting and chemometrics. Talanta, 2019; 203 pp.194-202. [CrossRef]
- El Riachy, M.; Moubarak, P.; Al Hawi, G.; Geha, M.; Mushantaf, W.; Estephan, N.; Skaff, W. Fatty Acid and Phenolic Profiles of Virgin Olive Oils from Local and European Varieties Planted in Lebanon. Plants 2023; 12, 2681. [CrossRef]
- Chiesa, L., Panseri, S., Bonacci, S., Procopio, A., Zecconi, A., Arioli, F., Cuevas, F.J. and Moreno-Rojas, J.M. Authentication of Italian PDO lard using NIR spectroscopy, volatile profile and fatty acid composition combined with chemometrics. Food Chem. 2016; 212, pp.296-304. [CrossRef]
- Giaretta, D., Lima, V.A. and Carpes, S.T. Improvement of fatty acid profile in breads supplemented with Kinako flour and chia seed. Innov.Food Sci. & Emerg. Technol. 2017; 49, pp.211-214. [CrossRef]
- Osuna, M.B., Romero, C.A., Romero, A.M., Judis, M.A. and Bertola, N.C. Proximal composition, sensorial properties, and effect of ascorbic acid and α-ocopherol on oxidative stability of bread made with whole flours and vegetable oils. LWT – Chem. 2018; 98: pp.54-61. [CrossRef]
- Osimani, A., Milanović, V., Cardinali, F., Roncolini, A., Garofalo, C., Clementi, F., Pasquini, M., Mozzon, M., Foligni, R., Raffaelli, N. and Zamporlini, F.. Bread enriched with cricket powder (Acheta domesticus): A technological, microbiological, and nutritional evaluation. Innov. Food Sci. & Emerg.Technol. 2018; 48, pp.150-163. [CrossRef]
- Bowen-Forbes, C.S. and Goldson-Barnaby, A., 2017. Fats. In Pharmacognosy Chapter 21(pp. 425-441). Academic Press.
- Raffo, A., Carcea, M., Castagna, C. and Magrì, A. Improvement of a headspace solid phase microextraction-gas chromatography/mass spectrometry method for the analysis of wheat bread volatile compounds. J. Chromatogr. A, 2015; 1406, pp.266-278. [CrossRef]
- Ruiz, J.A., Quilez, J., Mestres, M. and Guasch, J. Solid phase microextraction method for headspace analysis of volatile compounds in bread crumb. Cereal Chem. 2003; 80 (3), pp.255-259. [CrossRef]
- Pico, J., Hansen, Å.S. and Petersen, M.A. Comparison of the volatile profiles of the crumb of gluten-free breads by DHE-GC/MS. J.Cereal Sci. 2017; 76, pp.280-288. [CrossRef]
- Paraskevopoulou, A., Chrysanthou, A., Koutidou, M. Characterisation of volatile compounds of lupin protein isolate-enriched wheat flour bread. Food Res. Int. 2012; 48, pp. 568-577. [CrossRef]
- Heenan, S. P., Dufour, J-P., Hamid, N., Harvey, W., Delahunty, C. M. The sensory quality of fresh bread: Descriptive analysis and consumer perceptions. Food Res. Int. 2008; 41, pp.989-997. [CrossRef]
- Heenan, S. P., Dufour, J-P., Hamid, N., Harvey, W., Delahunty, C. M. Characteristics of fresh bread flavour: Relationship between sensory characteristics and volatile composition. Food Chem. 2009; 116, pp.249-257. [CrossRef]
- Cho, I.H. and Peterson, D.G. Chemistry of bread aroma: A review. Food Sci. and Biotechnol. 19(3), 2010; pp.575-582. [CrossRef]
- Schieberle P. Intense aroma compounds–useful tools to monitor the influence of processing and storage on bread aroma. Advanc. Food Sci. 1996; 18, pp.237-244. https://api.semanticscholar.org/CorpusID:101220628.
- Birch, A.N., Petersen, M.A. and Hansen, Å.S., (2013b). The aroma profile of wheat bread crumb influenced by yeast concentration and fermentation temperature. LWT-Food Sci.& Technol. 2013; 50 (2), pp.480-488. [CrossRef]
- Pico, J., Bernal, J. and Gómez, M. Wheat bread aroma compounds in crumb and crust: A review. Food Res. Int. 2015; 75, pp.200-215. [CrossRef]
- Hazelwood, L.A., Daran, J.M., Van Maris, A.J., Pronk, J.T. and Dickinson, J.R. The Ehrlich pathway for fusel alcohol production: a century of research on Saccharomyces cerevisiae metabolism. Appl. Environ. Microbiol. 2008; 74(8), pp.2259-2266. [CrossRef]
- Helou, C., Jacolot, P., Niquet-Léridon, C., Gadonna-Widehem, P. and Tessier, F.J., Maillard reaction products in bread: A novel semi-quantitative method for evaluating melanoidins in bread. Food Chem. 2016; 190, pp.904-911. [CrossRef]
- Pétel, C., Onno, B. and Prost, C. Sourdough volatile compounds and their contribution to bread: A review. Trends Food Sci. & Technol. 2017; 59, pp.105-123. [CrossRef]
- Yu, Y., Wang, L., Qian, H., Zhang, H., Li, Y., Wu, G., Qi, X., Xu, M. and Rao, Z. Effect of selected strains on physical and organoleptic properties of breads. Food Chem. 2019: 276, pp.547-553. [CrossRef]
- Pico, J., Gomez, M., Bernal, J., Bernal, J. L. Analytical methods for volatile compounds in wheat bread. J.Chromatogr. A 2016; 1428, pp.55-71. [CrossRef]
- Bianchi, F., Careri, M., Chiavaro, E., Musci, M. and Vittadini, E. Gas chromatographic–mass spectrometric characterisation of the Italian protected designation of origin “Altamura” bread volatile profile. Food Chem.2008; 110(3), pp.787-793. [CrossRef]
- De Luca L, Aiello A, Pizzolongo F, Blaiotta G, Aponte M, Romano R. Volatile Organic Compounds in Breads Prepared with Different Sourdoughs. Appl. Sci. 2021; 11(3):1330. [CrossRef]
- Chiavaro, E., Vittadini, E., Musci, M., Bianchi, F. and Curti, E. Shelf-life stability of artisanally and industrially produced durum wheat sourdough bread (“Altamura bread”). LWT-Food Science and Technology, 2008; 41(1), pp.58-70. [CrossRef]
- Birch, A.N., Petersen, M.A. and Hansen, Å.S. Aroma of wheat bread crumb. Cereal Chem. 2014; 91(2), pp.105-114. [CrossRef]
- Starowicz, M. and Zieliński, H. How maillard reaction influences sensorial properties (color, flavor, and texture) of food products. Food Rev. Int. 2019; 35(8), pp.707-725. [CrossRef]
Figure 1.
The amount of flour retrieved from the surface of Blaa A, B and C. *Lowercase letters denote statistically significantly different values (p<0.05).
Figure 1.
The amount of flour retrieved from the surface of Blaa A, B and C. *Lowercase letters denote statistically significantly different values (p<0.05).
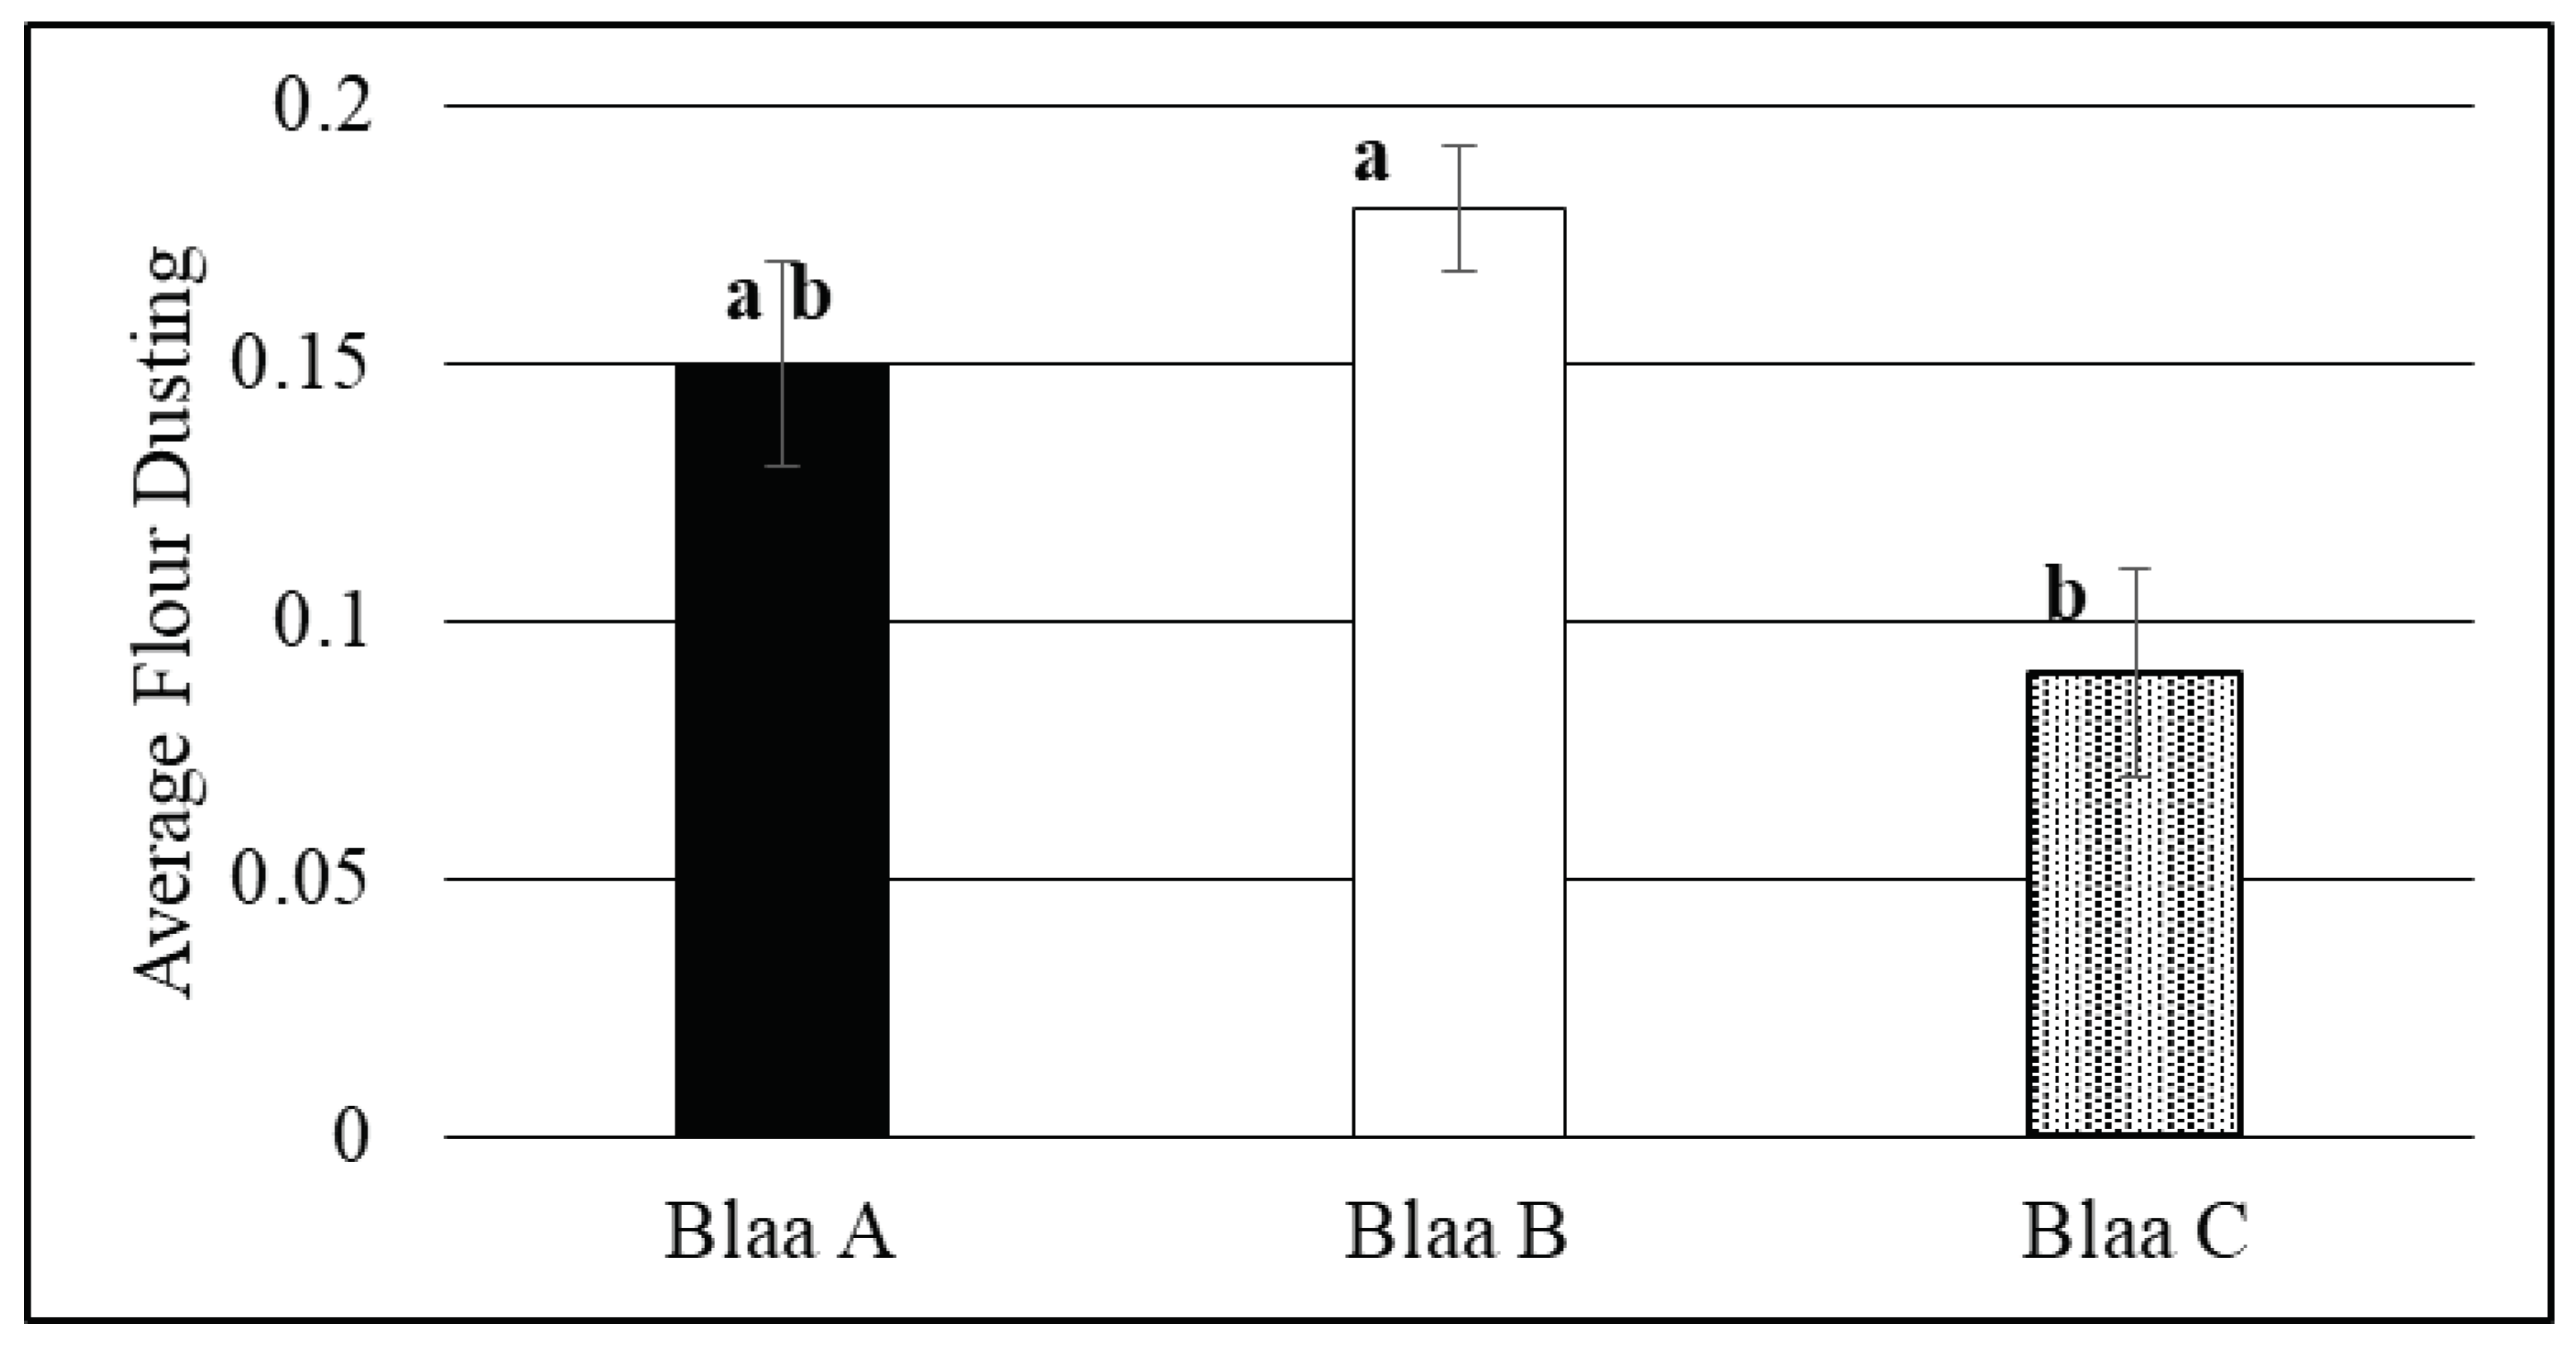
Figure 3.
Principle Component Analysis (PCA) plot discriminating crumb and crust sections of each Blaa by sensory trained attributes (■) and volatiles (■).
Figure 3.
Principle Component Analysis (PCA) plot discriminating crumb and crust sections of each Blaa by sensory trained attributes (■) and volatiles (■).
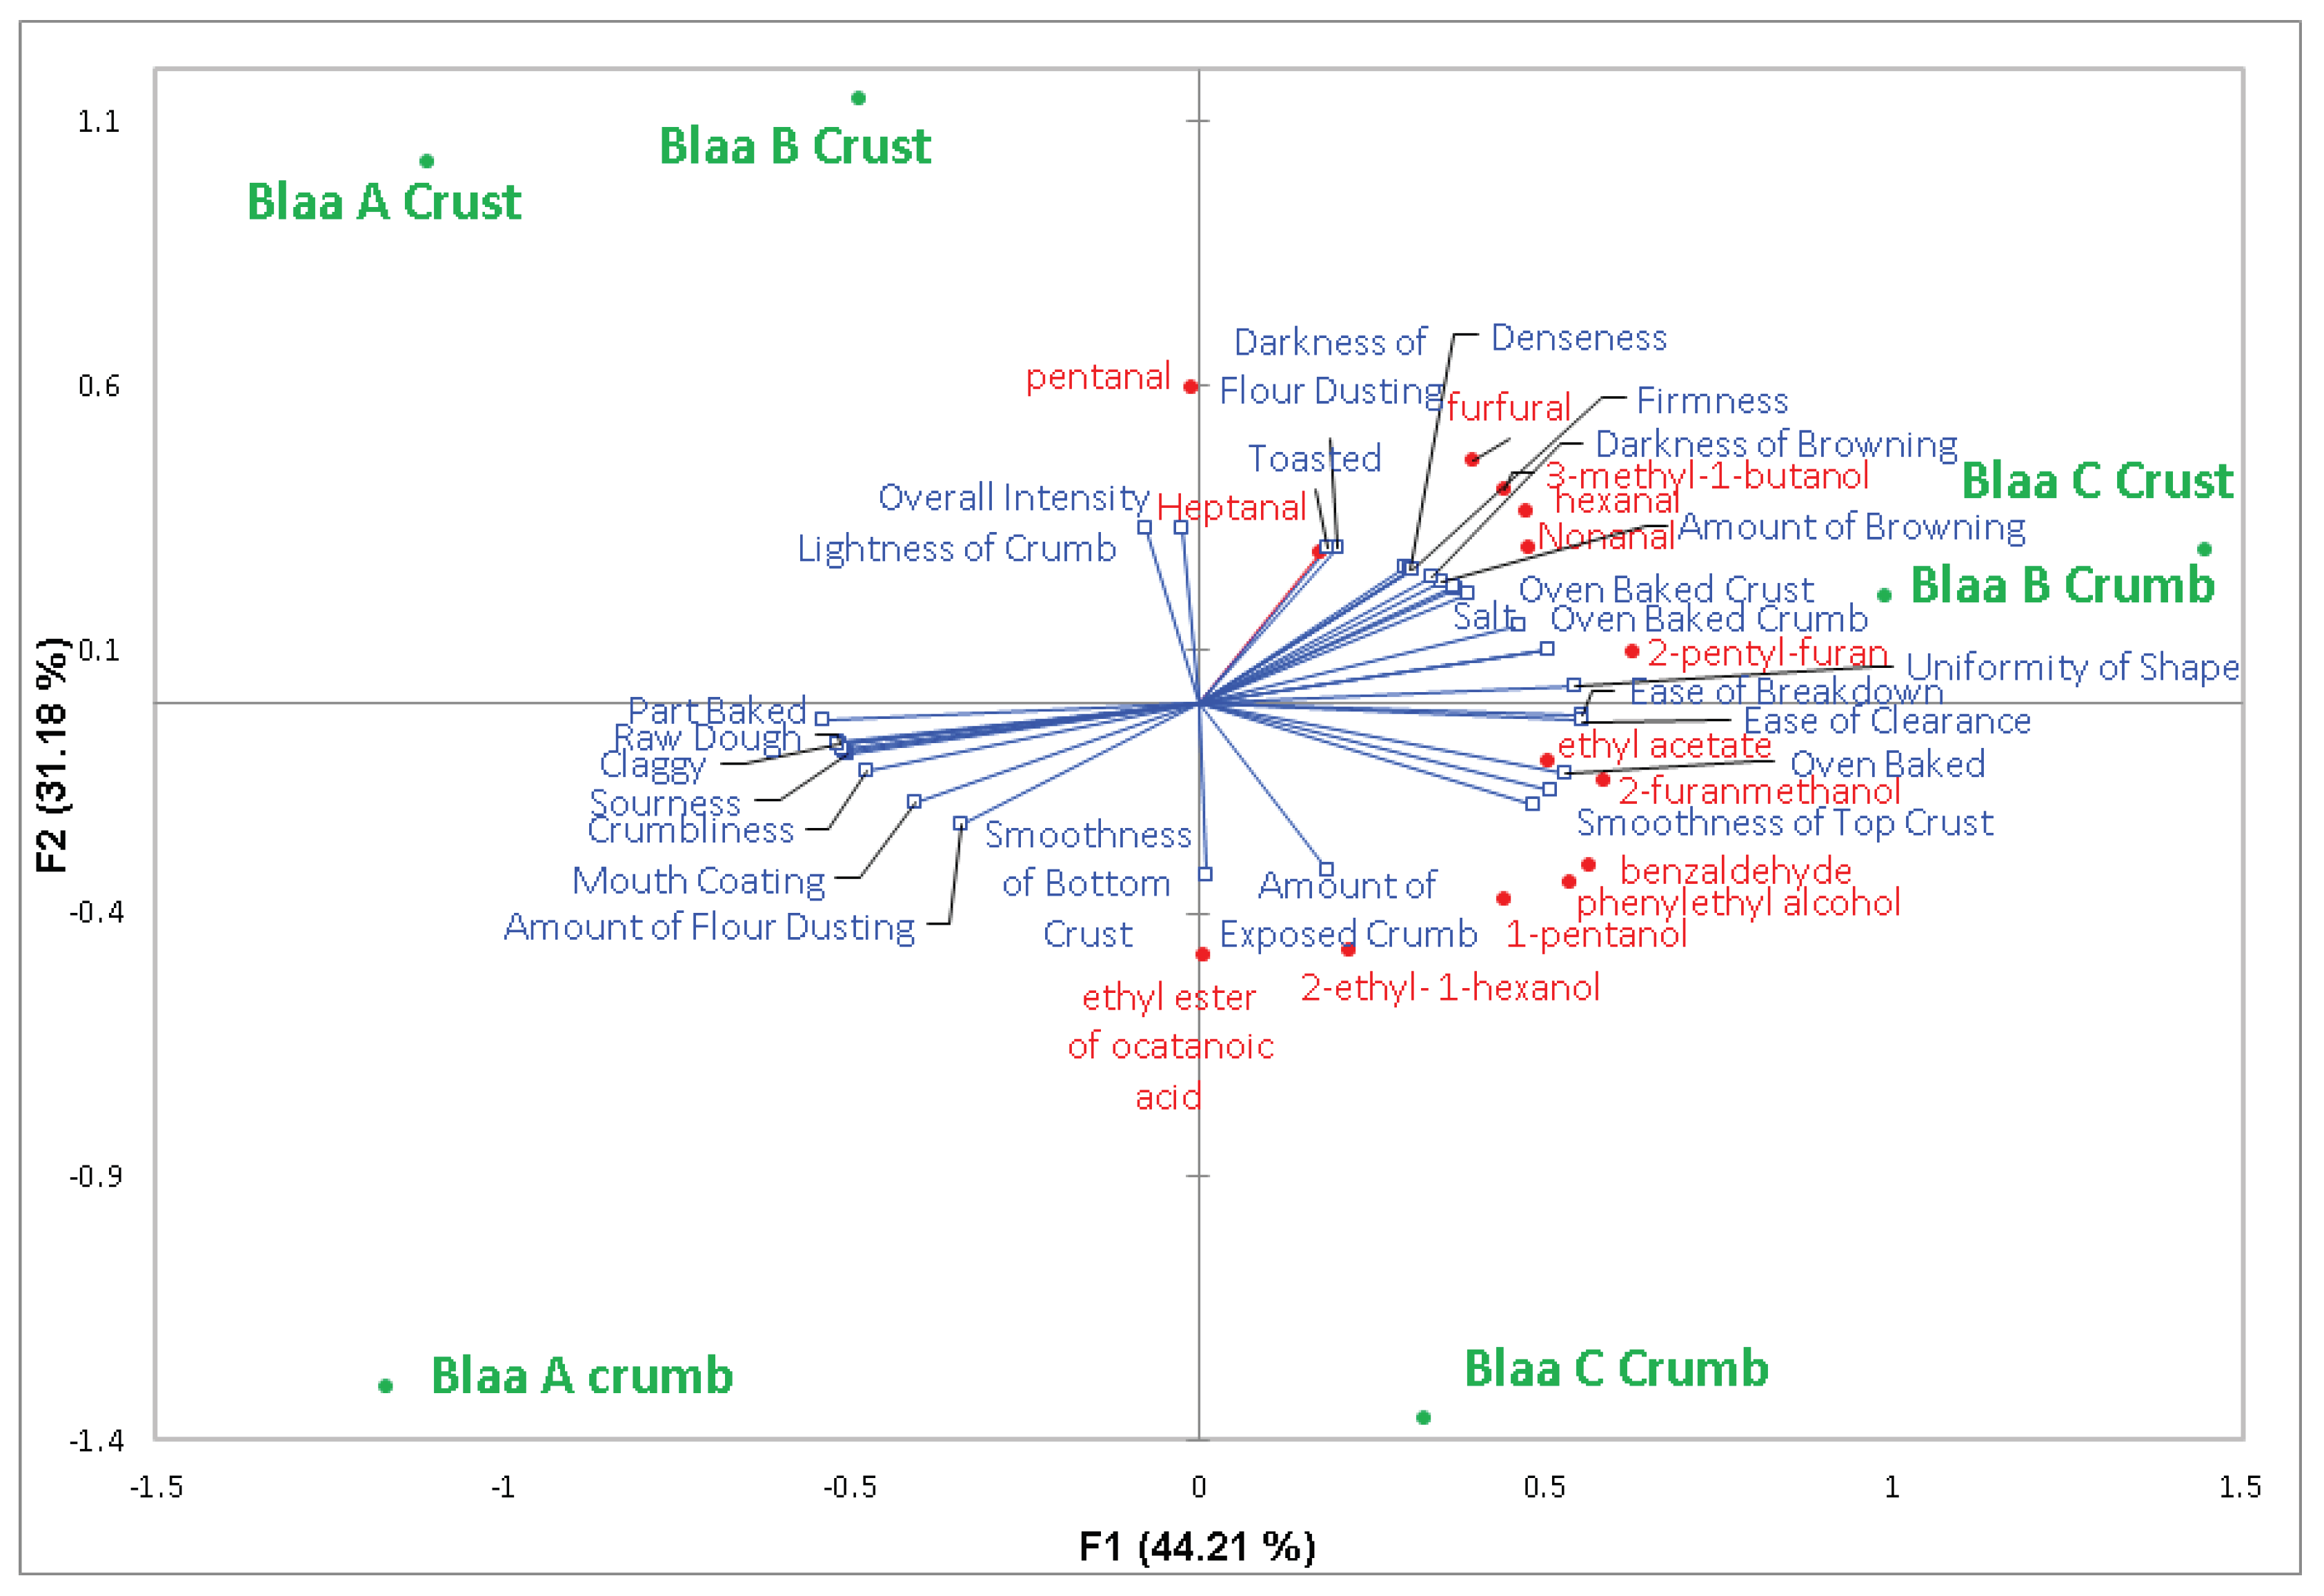

Table 1.
List of Association of Official Analytical Chemists (AOAC) methods used for Waterford Blaa Analysis.
Table 1.
List of Association of Official Analytical Chemists (AOAC) methods used for Waterford Blaa Analysis.
| Test | Standard No. | Source |
|---|---|---|
| Ash | 923.03 | AOAC, 2000 [18] |
| Protein | 978.04 | AOAC, 2005a [19] |
| Total Sugar | 939.03 | AOAC, 2005b [20] |
| Fat | 963.15 | AOAC, 2005c [21] |
| Saturated Fat | 969.33 | AOAC, 2005d [22] |
Table 2.
Compositional Data for Waterford Blaa products, A, B and C.
| Blaa A | Blaa B | Blaa C | ||||
|---|---|---|---|---|---|---|
| COMPOSITION | Mean ± Standard Deviation | p value | Mean ± Standard Deviation | p value | Mean ± Standard Deviation | p value |
| Moisture (g/100 g) | 35.36a ±2.47 | 0 | 31.78 b ± 2.99 | - | 31.59 b ± 1.5 | - |
| Ash (g/100 g) | 1.76 b ± 0.24 | 0 | 1.24 c ± 0.32 | 0.04 | 2.50 a ± 0.69 | <0.0001 |
| Protein (g/100 g) | 9.05 a ± 0.44 | - | 8.57 a ± 1 | - | 9.22 a ± 0.87 | - |
| Fat (g/100 g) | 4.7 b ± 0.77 | - | 7.7 ab ± 0.28 | - | 8.3 a ± 0.5 | 0.02 |
| Carb (g/100 g) | 54.00 b ± 3.74 | - | 57.64 a ± 2.85 | 0.013 | 55.85a,b ± 1.6 | - |
| Reducing Sugar (g/100 g) | 0.618 c ± 0.88 | <0.0001 | 1.59 a ± 0.26 | 0.009 | 1.22 b ± 0.21 | <0.0001 |
| Non-Reducing Sugar (g/100 g) | 0.21 c ± 0.104 | <0.0001 | 1.3 a ± 0.16 | <0.0001 | 1.08 b ± 0.091 | 0.003 |
| Salt (g/100 g) | 1.33 b ± 0.24 | 0.002 | 1.08 b ± 0.37 | - | 1.61 a ± 0.14 | <0.0001 |
| Energy (kJ/100 g) | 1035.1 | - | 1096.3 | - | 1081.05 | - |
| Calories (kcal/100 g) | 247.4 | - | 262.02 | - | 258.62 | - |
Data are presented as mean values ± standard deviations. Lowercase letters represent statistically significant different values (p< 0.05); comparison was performed for Blaa samples only.
Table 3.
Mean L, a b colour readings for Waterford Blaa crust and crumb.
| L | a | b | ||||
|---|---|---|---|---|---|---|
| Top Crust | ||||||
| Mean | p value | Mean | p value | Mean | p value | |
| Blaa A | 69.8 a *** | <0.0001 | 6.6 b | - | 14.12 a *** | <0.0001 |
| Blaa B | 72.2 a *** | <0.0001 | 7.3 b | - | 9.65 b | - |
| Blaa C | 54.0 b | - | 13.3 a *** | <0.0001 | 15.92 a*** | <0.0001 |
| Bottom Crust | ||||||
| Blaa A | 75.4 b | - | 5.8 b | - | 9.88 b* | 0.000 |
| Blaa B | 78.9 a * | 0.025 | 5.4 b | - | 7.2 c *** | <0.0001 |
| Blaa C | 43.1 c *** | <0.0001 | 12.3 a *** | <0.0001 | 13.2 a*** | <0.0001 |
| Crumb | ||||||
| Blaa A | 75.9 ab | - | 3.8 b*** | <0.0001 | 5.38 b | - |
| Blaa B | 74.7 b | - | 2.8 c *** | <0.0001 | 7.56 a*** | <0.0001 |
| Blaa C | 79.2 a** | 0.010 | 4.6 a*** | <0.0001 | 5.23 b | - |
Lowercase letters indicate significance from two-way ANOVA of all three Waterford Blaa products within location of bread (crust, crumb base) where * denotes p<0.05, ** denotes p<0.01 and *** denotes p<0.001.
Table 4.
Mean values of Texture Profile Parameters for Blaa A, B and C.
Data are presented as mean ± Standard Deviation.
Table 5.
Quantity of fatty acids in three Waterford Blaa products.
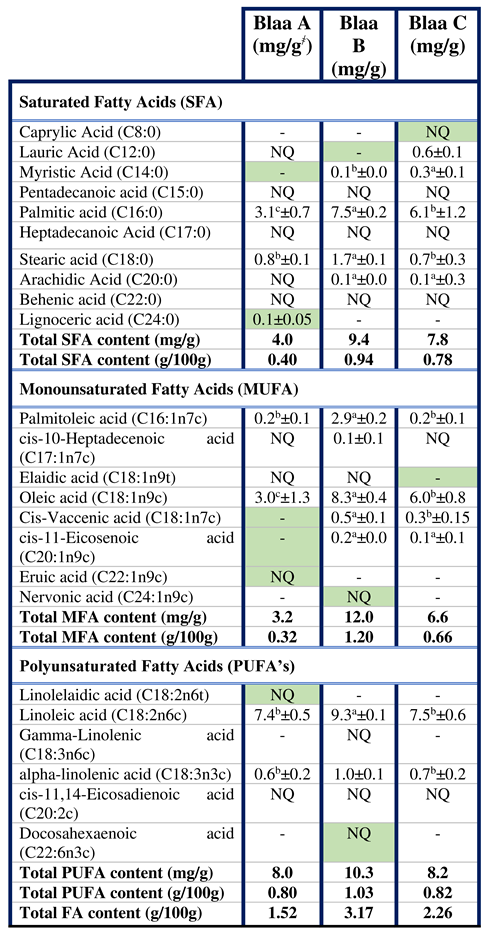
Data is presented as mean ± Standard deviation. ND= Not Detected; NQ = Not quantifiedLowercase letters indicate significance where * denotes p<0.05, ** denotes p<0.01 and *** denotes p<0.001 *Source: [49].
Table 6.
WaterFord Blaa volatile compounds with associated published aromatic descriptors.
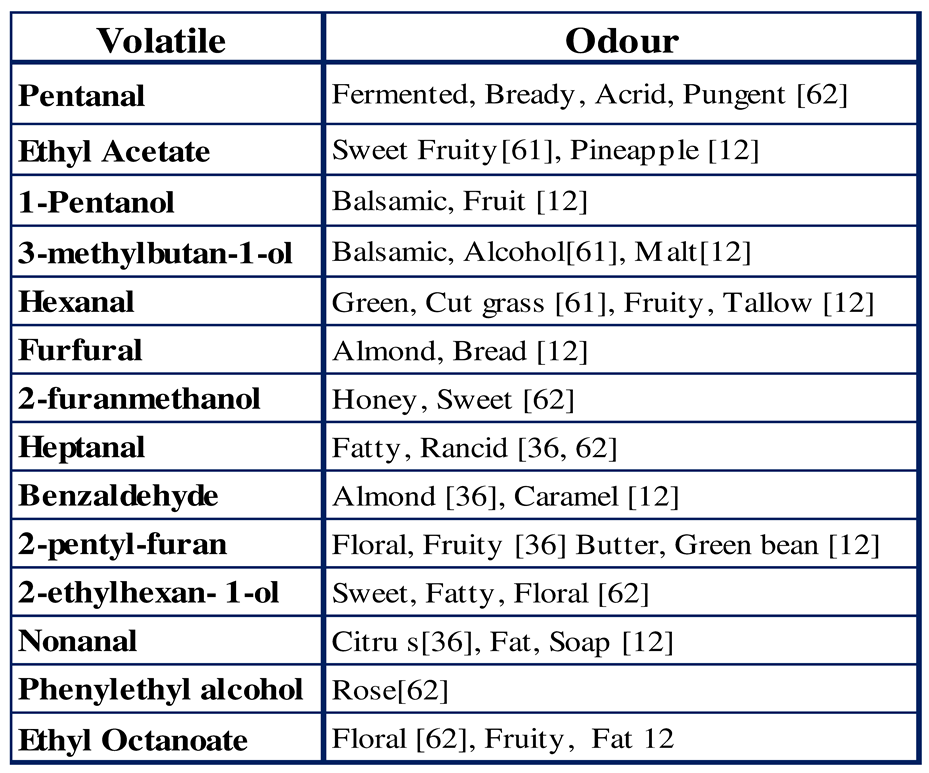
Table 7.
Least square means values for logarithmically transformed peak areas of aroma compounds for the three Waterford Blaa’s crumb and crust samples. .
Table 7.
Least square means values for logarithmically transformed peak areas of aroma compounds for the three Waterford Blaa’s crumb and crust samples. .
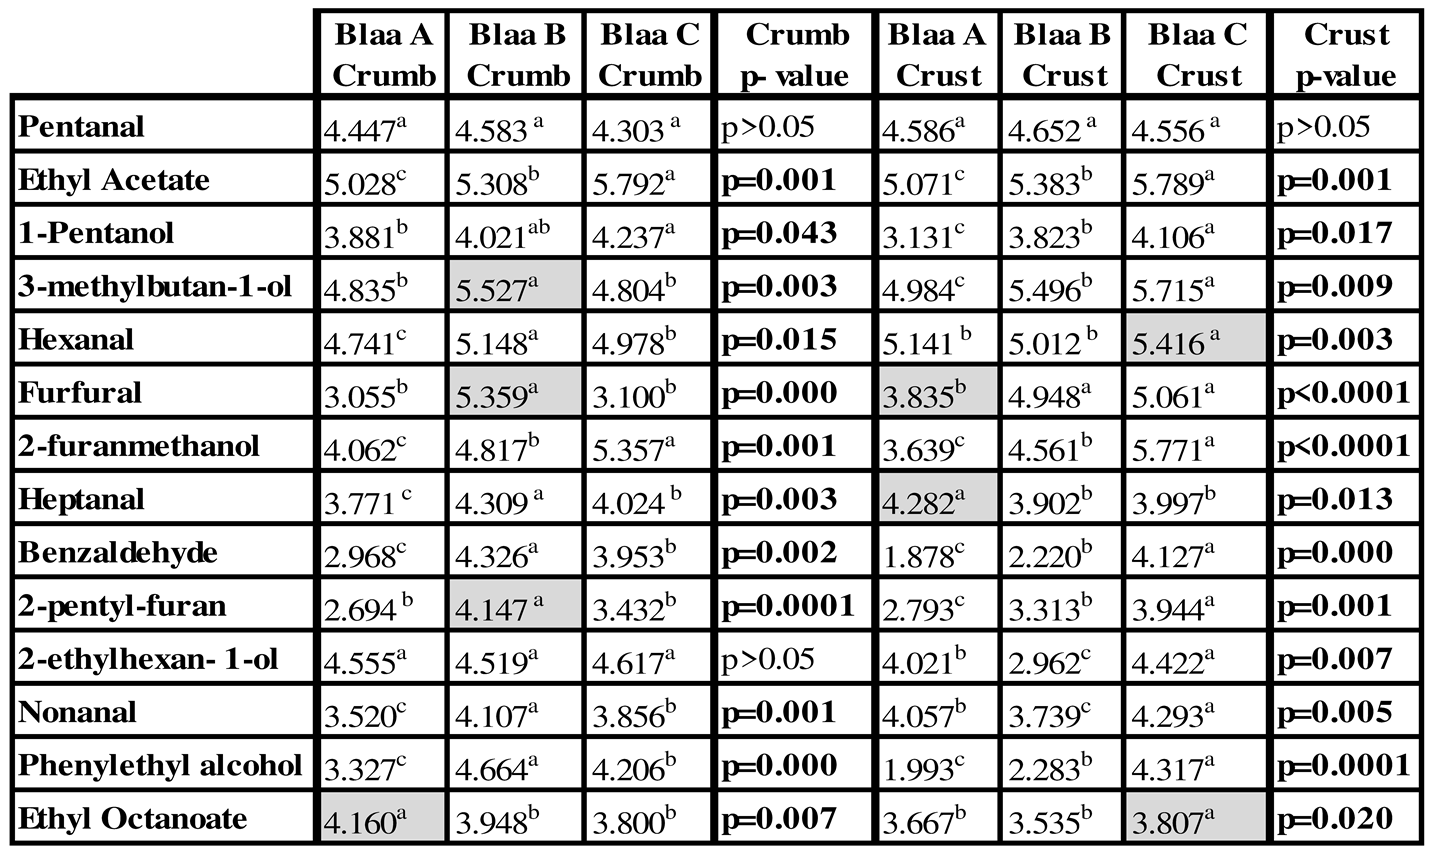
Lowercase letters represent significant differences; highlighted boxes indicate where one of the Waterford Blaas can be separated from the other two products.
Disclaimer/Publisher’s Note: The statements, opinions and data contained in all publications are solely those of the individual author(s) and contributor(s) and not of MDPI and/or the editor(s). MDPI and/or the editor(s) disclaim responsibility for any injury to people or property resulting from any ideas, methods, instructions or products referred to in the content. |
© 2023 by the authors. Licensee MDPI, Basel, Switzerland. This article is an open access article distributed under the terms and conditions of the Creative Commons Attribution (CC BY) license (http://creativecommons.org/licenses/by/4.0/).
Copyright: This open access article is published under a Creative Commons CC BY 4.0 license, which permit the free download, distribution, and reuse, provided that the author and preprint are cited in any reuse.


