
Submitted:
28 September 2023
Posted:
29 September 2023
You are already at the latest version
Abstract
The Mediterranean diet (MED) is highly recommended. Medical nutrition therapy is the cornerstone of diabetes treatment. We assessed adherence to the MED, and resultant micronutrient intake and glycemic control in youth with type 1 diabetes. Twenty adolescents, median age 18 years (interquartile range: 15.5-21), median diabetes duration 9 years (7-14), using continuous glucose monitoring devices, received personalized diet regimes based on MED. At 6 months post-intervention, the caloric intake remained unchanged; however, the carbohydrate proportion was lower (p=0.058) and the intakes of some monounsaturated fats increased (p=0.049). Sodium intake exceeded the recommended daily allowance by 250% (p=0.653), before and after the intervention. For blood glucose, the percent time-in-range 70-180 mg/dL improved from 52% (38-60) to 63% (47-71) (p=0.047). The total insulin dose decreased marginally, from 0.76 u/kg (0.64-0.97) to 0.72u/kg (0.61-0.89) (p=0.067). BMI z-score and waist circumference did not change (p=0.316 and p=0.161, respectively). Diastolic blood pressure percentile decreased from 73% (68-88) to 69% (50-79) (p=0.028), and LDL cholesterol from 114mg/ dl (105-134) to 104mg/dl (96-124) (p=0.059). The Israeli Mediterranean diet screener score increased, from 8 (7-11) to 13 points (12-14) (p=<0.001). The MED-based intervention demonstrated feasibility and improvements in glycemic outcomes and in certain nutritional parameters.
Keywords:
Mediterranean diet
; food frequency questionnaire
; Israel Mediterranean diet screener (I-MEDAS)
; time-in-range (TIR)
; type 1 diabetes
; dietary reference intake
1. Introduction
Type 1 diabetes is a chronic autoimmune disorder characterized by the inability to produce insulin, and resulting in dysregulated blood glucose levels[1]. Type 1 diabetes is the third most common chronic disease in the adolescent population; those affected in this age group often exhibit poor glycemic control[2,3]. Proper management of type 1 diabetes is crucial for preventing acute and long-term complications. Alongside insulin therapy, medical nutrition therapy is pivotal for achieving optimal glycemic outcomes and body weight; reduced risk of vascular complications, particularly cardiovascular disease (CVD); and improved overall health outcomes[4].
The nutritional recommendations for children and adolescents with type 1 diabetes are based on guidelines for healthy eating in the general population[4]. Among various dietary approaches, the Mediterranean diet (MED) is recommended for both healthy individuals and those with diabetes[5]. Inspired by traditional dietary patterns of countries bordering the Mediterranean Sea, the MED is based on whole grains, legumes, fruits, vegetables, nuts, low fat dairy products, fish, olive oil, and limited intakes of meat, processed foods, and sweets[6]. Eating patterns resembling the MED are likely to be advantageous for long-term health and reducing risks of CVD and the metabolic syndrome[7]. The vast majority of studies that examined the influence of MED on glycemic control were conducted on the adult type 2 diabetes population. Lower levels of glycated hemoglobin (HbA1c) and fasting blood glucose were reported, and lower insulin resistance and mortality[8]. For the type 1 diabetes population, the MED has gained considerable attention due to its potential to enhance glycemic control and metabolic health[9,10].
Data on the impact of MED on metabolic control in adolescents with type 1 diabetes are limited. A five-year cross-sectional study of 500 children revealed improvements in blood sugar levels and CVD risk among those with a higher Mediterranean Diet Index (KIDMED) score[10]. A greater KIDMED score signifies adherence to the MED; conversely, a diminished score implies that the child's dietary habits are not aligned with the MED[11]. However, only a minority of the participants in that cohort adhered to the Mediterranean-style diet. A cross-sectional study conducted in Italy on youth with type 1 diabetes assessed the relation between the KIDMED score and glycemic control. While a definitive causal relationship between MED and health outcomes was not established, the researchers concluded that the MED may serve as an effective strategy in the management of type 1 diabetes in young individuals[12]. A cross-sectional observational study of children with type 1 diabetes in Spain revealed lower levels of HbA1c and higher percent time-in-range (%TIR) of blood glucose, among those whose dietary patterns more aligned with the MED[9]. Bona et el, reported improved LDL cholesterol levels following a 6-month intervention in children[13].
The current body of evidence is insufficient to substantiate the utilization of MED as the primary dietary regimen for adolescents with type 1 diabetes. This warrants further research, particularly in the realm of efficacious nutrition therapy interventions. The aim of the present study was to investigate the impact of a MED intervention on micronutrient distribution among adolescents diagnosed with type 1 diabetes. The secondary objectives of the study encompassed assessment of adherence to the prescribed diet and the management of glycemic control.
2. Materials and Methods
2.1. Participants and Study Design
We conducted a prospective clinical intervention at the Pediatric Endocrinology and Diabetes Unit within the Sheba Medical Center. Eligibility criteria included a diagnosis of type 1 diabetes according to the American Diabetes Association criteria at least one year before enrollment, age between 12 and 21 years, and the use of a continuous glucose monitoring device (Dexcom, San Diego, CA, USA, Medtronic, Northridge, CA, USA, Libre, Alameda, CA, USA) [14]. Exclusion criteria included a medical history of an eating disorder or any other mental illness, in participants or their first-degree family members. Eligible trial participants were enrolled after they were contacted during their routine visits to the pediatric diabetic clinic. Written informed consent was obtained from participants aged 18 years or older, and from parents or legal guardians of those under age 18 years. Adolescents aged 12-18 years also signed informed consent. This ensured comprehensive understanding and agreement regarding the study's protocol and the potential risks. Ethics approval and monitoring were obtained from the Helsinki Committee in Sheba Medical Center (SHEBA-18-5537-OH-CTIL).
2.2. Diet Intervention
At the outset, each participant attended a cooking workshop and received a personalized eating regimen based on the MED. Nutritional instructions were provided to participants and, for those under age 18 years, also their parents. Individual diet instructions and support were provided by a dietitian at weeks 1, 2, 4, 7, 10, 12, and 24, for a total of seven face-to-face meetings. During the first 12 weeks, the dietitian called each participant twice for 10- to 15-minute motivational phone calls. Throughout the study, the dietitian was available to the participants.
2.3. Mediterranean Diet
The MED that was provided was based on the recommendations of Willett and Skerrett[15]. The diet was characterized by moderate-fat intake, rich vegetable and legume intake, low quantities of red meat; and a preference for poultry and fish over beef and lamb. The main sources of added fat were 30 to 45 g of olive oil and a handful of nuts (five to seven nuts <20g) per day. The planned macronutrient compositions of the diet were 40-50% carbohydrates, 25% protein, and 35% total fat. There was no caloric restriction, but each participant received a weekly meal plan outlining the main meals and snacks.
2.4. Assessment of Nutritional Composition and the Mediterranean diet screener score
We used a food frequency questionnaire (FFQ) that was previously used to determine the dietary intake of the Israeli multiethnic population[16]. The FFQ consisted of 116 common Israeli food items, standard portion sizes, and a section for reporting frequency consumption. We assessed the participants' habitual food consumption at baseline and at 6 months after the intervention.
Total energy intake (Kcal) and both macronutrient and micronutrient intake were calculated using the Tzameret software and the Israeli food and nutrient database[17]. The distributions of macronutrient and micronutrient intakes as percentages of daily energy consumption were also assessed and compared to dietary reference intakes (DRI) [18]. The Israeli Mediterranean diet screener (I-MEDAS) was adapted from the original 14-item MEDAS and modified to apply to the Israeli population[18]. Each item was assigned a score of 1 if it reflected the individual's food habits, and a score of 0 otherwise. Hence, the I-MEDAS questionnaire, consisting of 17 items, exhibited a scoring range from 0 to 17. The categories were established such as to categorize adherence levels as low, moderate, or high, with corresponding ranges of 0 to 7, 8 to 10, and 11 to 17, as documented in prior publications[18,19].
2.5. Medical History and Anthropometric Measurements
Data regarding the age of diabetes onset, diabetes duration, and other medical diagnoses were retrieved from medical records. At each visit, trained and certified staff followed a standard protocol that measured blood pressure, height, weight, and waist circumference. Blood pressure was evaluated according to the "Clinical Practice Guideline for Screening and Management of High Blood Pressure in Children and Adolescents"[20]. Body mass index (BMI) was calculated as weight (kg)/height squared (m2). BMI z-score norms were calculated for children aged 2 to 20 years. For older participants, we extrapolated the BMI z-score from the calculated BMI at age 20 years [20]. BMI z-scores were categorized to normal body weight -1.96- 1 (percentile 5.0-84.0), overweight 1.0-1.4 (percentile 84.1-93.3), obese 1.5-2 (percentile 93.4-97.7), and morbidly obese >2 (above 97.7 percentile)[21].
2.6. Insulin and Glycemic Parameters
The percent time-in-range (%TIR) 70-180 mg/dL (3.9-10mmol/L), as assessed by a continuous glucose monitoring device, was downloaded at each visit with the dietitian. The insulin dosage was expressed by the mean amount of insulin administered per two weeks, normalized by the individual’s weight in kilograms.
2.7. Biochemical Parameters
Blood samples, including measurements of HbA1c, total cholesterol, LDL-cholesterol, and HDL-cholesterol, were collected under metabolic stability conditions. These conditions were defined as no episode of diabetic ketoacidosis within the month before the visit, and testing after 12 hours of fasting. Laboratory results of serum C-reactive protein (CRP), blood urea nitrogen (BUN), creatinine, sodium, magnesium, calcium, zinc, phosphorous, vitamin B1, vitamin C, and folic acid were recorded. All the fasting blood samples were taken at baseline and at 6 months, drawn from a forearm vein and then processed by Enzyme-Linked Immunosorbent Assay (ELISA) at the Sheba Medical Center laboratories.
2.8. Trial Outcomes
Our primary outcome was the nutritional and mineral status after 6 months of MED. Secondary outcomes were body weight and waist circumference measures at this time point.
2.9. Statistical Analysis
Categorical variables were described using frequencies and percentages. Continuous variables were expressed as medians and interquartile ranges (IQR, 25th; 75th percentiles). Pre- and post-dichotomous dependent variables were evaluated using McNamar's test. The Wilcoxon test was used to compare continuous variables before and after the 6-month period. Spearman’s correlation coefficient test was used to study associations between continuous variables; >0.36 was considered as a moderate correlation, while r >0.67 was considered as a high correlation. Continuous variables were compered between categorical variables using the Mann–Whitney test. All the statistical tests were two-sided, and all p values were adjusted by the false discovery rate. The statistical analyses were performed by SPSS software (IBM SPSS STATISTIC version 28, IBM Corp., Armonk, NY, USA, 2021).
3. Results
3.1. Study Group Characteristics
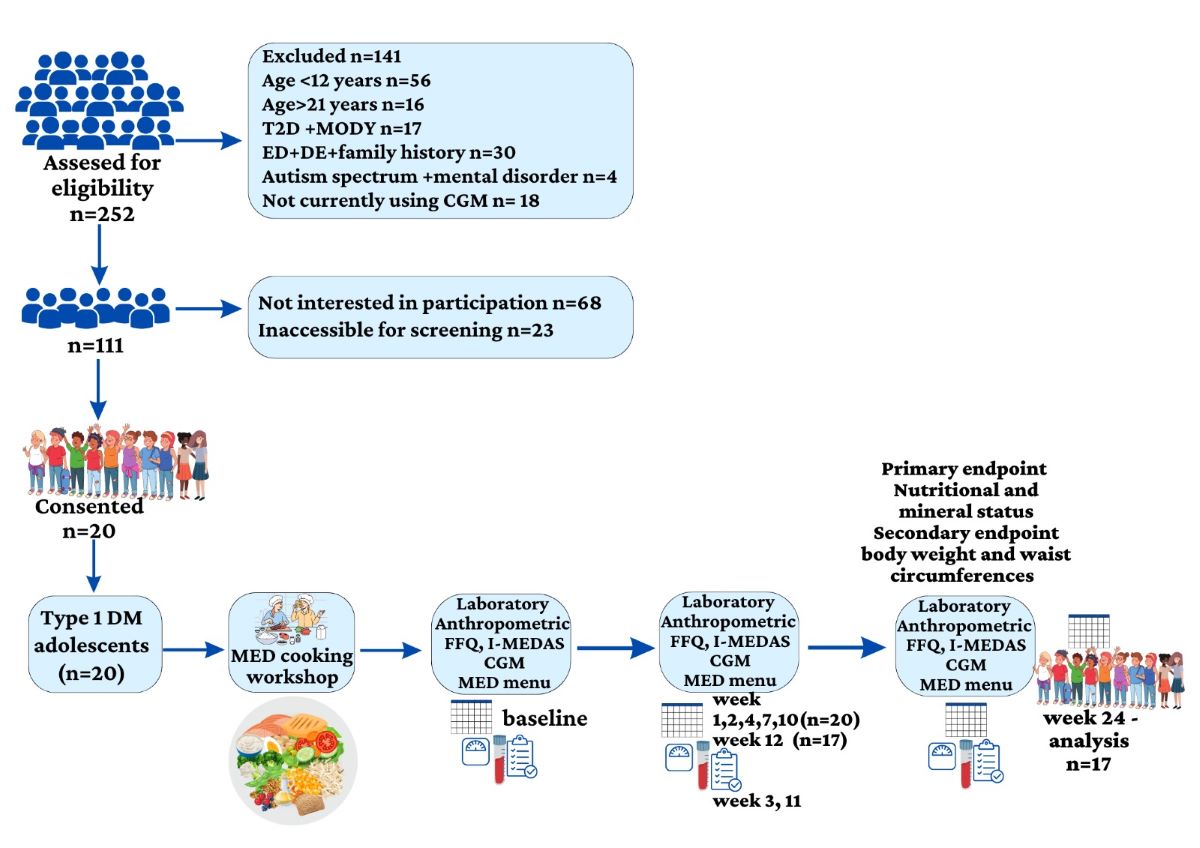
Baseline characteristics of the 20 adolescents (14 females) with type 1 diabetes who were recruited were: a median age (IQR) of 18 years (15.5-21) and a median duration of diabetes of 9 years (7-14). Seventeen participants were treated with insulin pumps and two were on multiple daily injections. The median BMI z-score was 1.1 (0.6-1.3). Nine participants were categorized as having normal weight, eight with overweight and three with obesity. The median waist circumference was 80.0 cm (72.2-90.7); the median waist circumference percentile was 71.0% (35.5-79.0). Three participants dropped out of the study after 12 weeks. One of them was a female who left because she had been on a low-carbohydrate diet prior to the study and was having difficulty adjusting to the amount of carbohydrate intake. Two male participants struggled with the diet framework and had time constraints (Figure 1- A flow chart of the study).
Figure 1-A flow chart of the study
3.2. Food Frequency Questionnaire
The median value of total calories at baseline was 2077 Kcal (1840-2661): 42% (39-47) of the calories from carbohydrate, 35% (32-37) from fat and 17% (16-20) from protein (Percentages do not add up to 100% because there are other components that contribute to the total daily energy intake, e.g., alcohol. After 6 months of the MED intervention, the percent of calories from carbohydrate decreased to 39% (35-46) (p=0.058) (Table 1).
3.2.1. Median percentages of micronutrients according to DRI
The baseline median percentages of iron, potassium, and vitamin E were 75% (59-189), 92% (71-107) and 85% (65-121) lower than the DRIs. Intakes of phosphorus, sodium, copper, vitamin C, riboflavin, pyridoxine, and B12 were more than two-fold higher than the DRIs. After 6 months of the MED intervention, the percentages of DRI (IQR) for iron, potassium, and vitamin E were higher, but with no statistical significance, and still below the recommended DRIs: 84% (60-129), p=0.868; 87% (69-107), p=0.887; and 93% (69-119), p=0.266, respectively. The intakes of phosphorus, sodium, copper, vitamin C, riboflavin, pyridoxine, and B12 remained elevated, and not significantly different from baseline (Table 1).
3.2.2. Median intakes of selected nutrients before and after the MED intervention
The median percentage of calories derived from ultra-processed foods was 17.7 (13.5-21.8) at baseline, and not significantly different (p=0.255) after the intervention, 15.2 (7.9-21.4) (Table 2). Regarding macronutrients, the intakes of protein and carbohydrates (including fructose, sugar alcohols, and fiber) did not differ significantly between baseline and the end of the 6-month period. While the median total fat intake did not change significantly, the consumption of certain types of fat decreased, and of others increased. Notably, the intakes of cholesterol and saturated fat decreased, while the intakes of monounsaturated fat and polyunsaturated fat showed slight increases. The intake of docosahexaenoic acid (DHA) increased significantly, from 0.101 g (0.0433-0.1614) at baseline to 0.1555g (0.0474-0.1994) after the intervention (p=0.035). Eicosapentaenoic acid (EPA) intake increased from 0.0266 g (0.0081-0.0419) to 0.0364g (0.0158-0.0736), p=0.035. Intakes of erucic acid (p=0.031) and docosapentaenoic acid (DPA) (p=0.049) also increased significantly. On the other hand, the intake of parinaric acid decreased significantly (p=0.049). Intakes of all the vitamins and minerals assessed remained stable (Table 2).
3.3. I-MEDAS
At the end of the intervention, the median I-MEDAS score was significantly higher, 13 (12-14) points, compared to 8 (7-11) points at baseline (p<0.001). After the 6-month intervention, preferences increased for olive oil (<0.001), and for poultry consumption versus processed meat (p=0.016). Butter and margarine consumption declined (p=0.039), as did the consumption of desserts (p=0.008). Fruit consumption was lower than recommended, and therefore scored zero at baseline and at 6 months (p=0.625). The consumptions of alcohol and salty snacks did not change significantly (Table 3).
3.4. Weight Loss, Waist Circumference, and Blood Pressure
The BMI z-score (p=0.316) and waist circumference percentile (p=0.161) did not change significantly (Table 3) during the intervention. At baseline, the median systolic blood pressure was 116 mmHg (109-125) and the diastolic blood pressure was 72 mmHg, (70-79). Both these parameters decreased following the intervention, but the change was statistically significant only for diastolic blood pressure, which decreased to 67 mmHg (71-75), p=0.039. Similarly, blood pressure percentiles followed an identical trend, with a significant change observed in the diastolic percentile (p=0.029) (Table 3).
3.5. Glycemic Parameters
Median TIR 70-180 mg/dl increased significantly after the MED intervention, from 52% (38-60) at baseline to 63% (47-71), p=0.047. HbA1c declined from 7.5% (6.8-8.5) to 7.1% (6.7-709), p=0.453. The total amount of insulin decreased from 0.76 U/kg (0.64-0.97) at baseline to 0.72 U/kg (0.61-0.89), p=0.067.
3.6. Blood Laboratory Measurements
The median LDL-cholesterol decreased from 114mg/dL (105-135) at baseline to 104 mg/dL (96-124) after 6 months (p=0.059). Median HDL and triglyceride levels did not change significantly. Blood creatinine (p=0.025), zinc (p=0.031), and potassium levels (p=0.44) were all significantly higher after the intervention. Vitamin C did not differ significantly, before and after the intervention; the respective median values were 11.7 mg/L (9.0-12.9) and 12.0 mg/L (9.0-13.4), p=0.321. However, at baseline three participants had low levels of vitamin C that increased to the normal range (4.6-14.9 mg/L) after the intervention (Table 4).
3.7. Correlations
The I-MEDAS total score was negatively correlated with CRP (r=0.704; p=0.001). The delta total score was correlated with delta calcium (r=0.521, p=0.018).
HbA1c was inversely correlated with TIR (r=-0.827; p<0.0001), delta magnesium (r=-0.472; p=0.036), and vitamin C (r=-0.827; p=<0.0001). A positive correlation was shown after 6 months between HbA1c and food energy (r=0.497; p=0.026). TIR was correlated with magnesium (r=0.470. p=0.037) and vitamin C (r=0.46; p=0.041), and inversely correlated with delta sugar consumption (r=-0.495; p=0.026).
Body weight and waist circumference were correlated with CRP (r=0.697; p=0.001 and r=0.522; p=0.018, respectively). Zinc correlated inversely with CRP (R=-0.453; P=0.045) and with BMI z scores (r=-0.458; p=0.042). Correlations between fiber intake and polyunsaturated fat are shown in Table 5.
Systolic blood pressure was correlated with sodium (r=0.582, p=0.007). Other correlations are shown in Table 5.
4. Discussion
We assessed, before and 6 months after a MED intervention, the intakes and blood levels of macronutrients and micronutrients, glycemic control, and anthropometric measurements among adolescents with type 1 diabetes. At baseline, the intakes of sodium and several trace elements were elevated compared to recommended values. We demonstrated that at 6-months, the MED-based intervention was feasible, and that glycemic outcomes and several nutritional parameters were improved.
The participants of our trial were instructed to consume extra virgin olive-oil and nuts on a daily basis. While the daily percentage of calories derived from fat changed only slightly, the composition of fatty acids, particularly docosahexaenoic acid (DHA) and eicosapentaenoic acid (EPA), increased. Associations have been reported of the consumption of nuts and extra virgin olive oil, which are abundant in unsaturated fatty acids[22] and rich in antioxidants, with improved lipid profiles[23]. While the overall lipid profile did not change significantly during the intervention, 11 participants had lower LDL cholesterol levels after the intervention.
The median %TIR significantly improved after the intervention, as did HbA1C levels. Total sugar consumption correlated inversely with TIR. Our findings corroborate a cross-sectional analysis that involved 97 children with type 1 diabetes, which demonstrated improved HbA1c levels among those with optimal adherence to MED[24]. Another research investigation demonstrated a correlation between higher levels of adherence to the MED and improved glycemic regulation[10]. An interesting finding of our study was that carbohydrates comprised a lower proportion of the total daily calories after than before the intervention. The reduced carbohydrate intake may have contributed to the observed improvement in glycemic control, as has been shown in multiple studies[25]. The intensive nutritional monitoring program, conducted by a registered dietitian, might also have contributed to better glycemic control[26,27].
The median intake of dietary fiber observed in our study met 100% of the DRIs at baseline and 111% after 6 months. Significant positive changes in the consumption of whole grains, nuts, and legumes were evident based on the I-MEADS. All the aforementioned factors contributed to the overall status of fiber intake. Fruit consumption remained unchanged during the intervention period, as indicated by a score of zero at both time points. This suggests lower intake than recommended. Fruits possess substantial concentrations of sugars, and their consumption may impact blood glucose regulation. Thus, individuals with type 1 diabetes often restrict their fruit consumption. A meta-analysis of individuals with type 2 diabetes revealed that the intake of fruits significantly reduced fasting blood glucose levels[28] but did not affect HbA1c concentrations [28]. Fresh fruits are abundant sources of dietary fiber, organic acids, minerals, and antioxidants such as vitamins and polyphenols. One prominent biological process associated with fruit consumption is antioxidation, wherein the conversion of free radicals into more stable forms enhances their scavenging capacity. This process also mitigates the generation of reactive oxygen species by restraining mitochondrial oxidative stress, thereby preserving cellular redox homeostasis[29]. Individuals with type 1 diabetes and their caregivers should be guided regarding appropriate fruit consumption and insulin administration.
A key principle of the MED involves reducing the consumption of highly processed food products. Nevertheless, we report no statistically significant difference in the median proportion of calories derived from processed foods prior to and following the intervention. This finding may be attributed to the limitations of the FFQ to distinguish between enhanced nutritional qualities of food items. For instance, both whole wheat bread and white bread are classified under the same category of ultra-processed foods, despite the former having superior nutritional qualities. Notably, the majority of participants transitioned to this particular type of bread. The use of the I-MEDAS enhanced accuracy and enabled discerning important changes in laboratory measures that were associated with distinct food items of the MED.
The intake of the micronutrient sodium is affected by the consumption of the foods mentioned in the previous paragraph. Both at baseline and at 6-months after the intervention, the median sodium intake of our participants was twice that of the recommended daily amount. We also report a significant association between systolic blood pressure and sodium intake. Our findings are consistent with the US SEARCH study in which none of the 190 children and adolescents with type 1 diabetes met the recommended sodium intake[27]. A systematic review and meta-analysis involving 58,531 children and adolescents showed a dose-response relation, such that each additional gram of sodium consumed per day raised systolic and diastolic blood pressure by about 1 mm Hg[30]. Excessive sodium consumption is a major risk factor for high blood pressure and cardiovascular disease[31]. Several studies have reported high sodium intake with high adherence to the MED[32,33]. Hence, reducing the consumption of high-sodium foods deserves specific consideration. The main sources of sodium from the MED might be pickled vegetables, whole wheat breads and canned fish. Indeed, according to the I-MEDAS, fish consumption (especially canned tuna fish) and whole wheat bread were significantly higher after the intervention.
Notably, higher potassium intake has been associated with reduced blood pressure, as well as with stroke events[33]. Despite the stability in potassium intake, and the elevated sodium intake, we report a lower median diastolic blood pressure following the intervention than at baseline. Similarly, in the PREDIMED intervention study, among those who consumed MED (extra virgin olive oil and nuts), the systolic blood pressure did not change significantly, yet the diastolic blood pressure decreased[34]. We report similar median pre-and post-potassium intakes.
Our data demonstrate a significant increase in plasma zinc levels after 6 months following the MED. Foods such as fish, eggs, dairy products, beans, nuts, and whole grains are rich sources of zinc[35]. The I-MEDAS results indicate a notable increase in the consumption of fish portions throughout the intervention. This could account for the observed rise in zinc levels. Zinc has been found to potentially enhance glucose uptake into cells by modulating the insulin-stimulated movement of GLUT4[36]. Zinc is also involved in insulin signaling and the redox signaling pathway, which has been suggested as a mechanism that may explain the association between zinc and cardiometabolic risk[36,37]. Notably, in the current study, plasma zinc levels were negatively correlated with HbA1c and CRP, further emphasizing the importance of the MED.
Dietary copper intake among our participants was two-fold higher than the DRI, but below 20% of the upper intake levels, both before and after the intervention[38]. The existing research on copper abnormalities and diabetes predominantly centers on type 2 diabetes and its association with insulin resistance[39]. Research carried out in the United States reported elevated levels of serum copper in individuals with type 1 diabetes compared to a control group[40]. In addition to elevated glucose levels that initiate free radical reactions, the dysregulation of copper also significantly contributes to the occurrence of oxidative stress, thereby increasing the risk of diabetes complications[40,41]. The primary sources of copper in the MED include seeds and nuts, wheat-bran cereals, whole-grain products, and chocolate. The question arises as to whether more attention is needed regarding excessive copper consumption among individuals with type 1 diabetes.
For our cohort, median serum Mg levels fell within the normal low range and exhibited no significant differences pre- and post-dietary intervention, despite exceeding the DRI for this micronutrient. Notably, serum levels reflect only a fraction of the total Mg present in the body [35]. We report correlations of serum Mg level with Hba1c and TIR, two measures of glycemic control, thus collaborating prior studies[42]. Mg is a vital mineral that is abundantly present in the human body. It functions as a cofactor in more than 300 enzyme systems that have crucial roles in various biochemical reactions, including the regulation of blood glucose and blood pressure [28]. Foods that are rich in dietary fibers and abundant in the MED typically serve as sources of Mg, including green leafy vegetables, such as spinach, legumes, nuts, seeds, and whole grains[35].
No significant differences were observed in BMI z-score and waist circumference following the 6-month intervention. These findings align with the constant calorie intake throughout the intervention. Given that our study did not involve caloric restriction and did not focus on weight loss, we did not anticipate significant changes in anthropometric measures. Body weight and waist circumference did correlate positively with CRP levels. This finding corresponds with a non-randomized descriptive study, in which children diagnosed with type 1 diabetes were selected and matched with a control group according to sex and age[43]. Children with obesity were included in that study. Statistically significant correlations were observed of high-sensitivity CRP with both BMI and waist circumference Z-score [43].
There are several inherent limitations to our study. FFQ interviews are susceptible to recall bias. Nevertheless, this recall method is considered more reliable than a single day recall[44]. Although the FFQ has a robust research foundation, it is likely to be limited in its accurate capture of precise nutrient quantities. Furthermore, the relatively small cohort, only 20 participants, may not provide a comprehensive understanding of the potential nutritional and metabolic effect of the MED. Another limitation is the lack of data of serum levels of several minerals that might have elucidated additional associations between nutrient intakes and their serum levels. On the positive side, the prospective follow-up design is a strength of the study. This work represents a pioneering effort in implementing a 6-month intervention, characterized by rigorous dietary surveillance focused on a MED, and comprehensive evaluation of multiple micronutrients.
In the contemporary context of prevailing exclusionary dietary practices, the MED is distinguished by its emphasis on the inclusion of specific food groups such as fruits, vegetables, whole grains, legumes, nuts, low-fat milk products, and olive oil, which are all recommended for daily consumption. The incorporation of a diverse range of foods without limitations into an individual's dietary regimen has a dualistic nature. On one hand, it facilitates adherence to the prescribed diet; while on the other hand, the absence of absolute restrictions creates a gray area that permits the consumption of foods that are not deemed advisable. The higher average I-MEDAS score observed after a 6-month period indicates greater adherence to the MED, though several micronutrients and nutritional parameters did not change significantly.
5. Conclusions
This interventional study provides valuable insights regarding the feasibility and benefits of a 6-month MED intervention for adolescents with type 1 diabetes. This intervention was shown to be feasible and to lead to improvements in glycemic outcomes and in certain nutritional parameters. However, it is crucial for caregivers and healthcare providers to focus on nutrients that remain of concern even within a MED framework. For example, sodium consumption, as evidenced in our study, needs to be monitored, akin to the focus in the DASH (Dietary Approaches to Stop Hypertension) diet. Caregivers should be attentive to food choices that contribute to high sodium intake, such as pickled vegetables and canned fish, and replace them with lower sodium food choices. Copper intake and serum levels should be monitored, to prevent overconsumption. Fruit consumption should be encouraged, with proper guidance for insulin administration and timing. The aim should be establishing a comprehensive and balanced dietary plan that enhances overall well-being and facilitates efficient management of diabetes. Additional investigations involving larger sample sizes and extended periods of observation are necessary to validate these results and enhance dietary guidelines for the specific context. In summary, the MED exhibited potential as a viable dietary strategy for managing glycemic levels and enhancing nutritional status in individuals diagnosed with type 1 diabetes.
Author Contributions
Conceptualization, N.L. (Neriya Levran), A.A., E.M.-O. and O.P.-H.; Data curation, N.L. (Neriya Levran); Formal analysis, N.L. (Neriya Levran) and O.P.-H.; Investigation, N.L. (Neriya Levran), N.L. (Noah Levek) and B.S.; Methodology, O.P.-H.; Project administration, O.P.-H.; Supervision, E.M.-O. and O.P.-H.; Writing—original draft, N.L. (Neriya Levran) and O.P.- H.; Writing—review and editing, N.L. (Noah Levek), B.S., N.G. and E.M.-O. All authors have read and agreed to the published version of the manuscript.
Funding
This research received no external funding and was partially supported by the Research Authority of Sheba Medical Center.
Institutional Review Board Statement
The study was conducted according to the guidelines of the Declaration of Helsinki and approved by the Ethical Committee of Sheba Medical Center (protocol number SMC-5537-18). The study was registered at the NIH clinicaltrials. govID NCT05872711.
Informed Consent Statement
Informed consent was obtained from all the participants of the study.
Data Availability Statement
The authors can share data upon request.
Acknowledgments
The young people and parents who kindly took part in this study.
Conflicts of Interest
The authors declare no conflict of interest related to this work.
Appendix A
Supplementary Appendix
This appendix has been provided by the authors to give readers additional information about this work. Supplement to: Neriya Levran, Orit Pinhas-Hamiel, et al.
Appendix 1:
Cooking workshop
The workshop's objectives were to explain the benefits of a Mediterranean diet and to promote skills in assembling and preparing dishes that complied with the diet.
The syllabus of the workshop - 8 hours
Part 1: A lecture was given by a dietitian regarding the aims of the study, the rationale of the Mediterranean diet and its apparent advantages, insulin administration, and general information regarding preferred types of foods and daily diet managing.
Part 2: Practical section. The participants prepared about 13 different dishes and became familiar with the main food products that are used in a Mediterranean diet cuisine. During this phase, the participants consumed the foods they prepared and administered insulin, with the guidance of a dietitian.
At the end of the cooking workshop, each participant received a booklet with recipes that comply with the Mediterranean diet, a shopping list and a detailed weekly menu that lists the amount of carbohydrates for particular meals and foods.
Individual meetings with the dietitian
Each participant met individually, for a 60-minute session, with the dietitian in weeks 1,2,4,7,10,12, and 24 of the intervention. Dietary education sessions started with weight and waist circumference measures. After blood pressure and ketone values were measured, the dietitian uploaded the glycemic, insulin, and carbohydrate data from the pump, continuous glucose monitor, and food manager applications (24-hour recall). The dietitian asked for feedback, led a discussion on problem-solving, and set clear objectives based on glycemic control and upcoming events (holidays, etc.). At the end of each meeting, a detailed menu was distributed, with recipes and more examples of daily menus.
A WhatsApp group was managed by the dietitian, who added diet recipes, notes (prior to holidays) and notifications about upcoming measurements and electronic questionnaires, and reminders for visits.
At the end of the study, after the data analysis, the participants were provided all of their individual data and calculations of trends and normal range values of the nutritional and health parameters that were assessed during the 24-week intervention.
The Mediterranean diet
The Mediterranean diet was prescribed a moderate-fat diet, rich in vegetables and low in red meat, with poultry and fish preferred to beef and lamb. The primary sources of added fat were 30 to 45 g of olive oil and/or a handful of nuts (five to seven nuts <20g) per day.
Below are examples of a two-day menu:
| Day 1 | Carbohydrate (gram) | Day 2 | Carbohydrate (gram) | |
| Breakfast | 2 slices of whole wheat bread+ 2 tablespoons of white cheese 5%+pinch of Zaatar+ 6 olives+ 1 sliced cucumber | 37 | Greek yogurt 7% fat+ 7 Walnuts+ a tablespoon of blueberries+ a tablespoon of flaxseed | 10 |
| Lunch | Seasoned chicken breast with 1 cup of rice (146 g) cauliflower (100 g) | 50 | A stew of orange lentils and rice* (320 g) + 2 chicken skewers or 3-4 chicken patties (40 gr each) | 50 |
| Dinner | Greek salad*+ 2 slices of whole wheat bread+ 1 tablespoon (15 g) of tehina | 45 | 2 slices of whole wheat bread+ 1 tomato+ 1 cucumber+1 tablespoon of olive oil+1 omelet (1 egg) | 40 |
Be sure to add 2 tablespoons of olive oil per day or nuts 30 g 5 times a week
Snacks:
Between the three main meals, two small meals can be eaten during the day. The following list contains ideas for snacks, and the number of carbohydrates of the items.
A slice of whole bread with peanut butter or almond spread or hummus or lentil spread.
2 rice crackers with peanut butter.
1 apple
Chocolate 100 g
Examples of items for a shopping list.
Orange, mash, green, black lentils, chickpeas, dry beans in different colors.
Almonds, seeds (sunflower, pumpkin), peanuts, nuts (walnuts, hazelnuts, pistachios) - without salt and not roasted. They can be lightly salted at home
Whole rice
Quinoa
Below are the main topics that we focused on during the eight sessions.
Session 1:
Adjusting insulin and the menu more precisely to participants' preferences, and in accordance with the research guidelines
Session 2:
Special concerns, according to the patients' requests: physical activity, bowel movements, hypoglycemia, etc.
Session 3:
Maintaining a Mediterranean diet when eating out, and at family and social events, holidays, and parties.
Session 4:
Healthy eating and eating habits, including avoidance of processed food, avoidance of screen time while eating, and family meals.
Session 5:
Lipids and fats, their proportions in various food items, and the effect on metabolic health
Session 6: Motivational session
Session 7: Conclusion
The staff of the center and the dietitian were available to the participants throughout the intervention.
Two motivational phone reach outs were conducted by the dietitian.
During the intervention, the participants continued regular visits with their endocrinologists.
References
- DiMeglio, L.A.; Evans-Molina, C.; Oram, R.A. Type 1 Diabetes. Lancet 2018, 391, 2449–2462. [CrossRef]
- Wood, J.R.; Miller, K.M.; Maahs, D.M.; Beck, R.W.; DiMeglio, L.A.; Libman, I.M.; Quinn, M.; Tamborlane, W. V; Woerner, S.E.; T1D Exchange Clinic Network Most Youth with Type 1 Diabetes in the T1D Exchange Clinic Registry Do Not Meet American Diabetes Association or International Society for Pediatric and Adolescent Diabetes Clinical Guidelines. Diabetes Care 2013, 36, 2035–2037. [CrossRef]
- Khadilkar, A.; Oza, C. Glycaemic Control in Youth and Young Adults: Challenges and Solutions. Diabetes Metab Syndr Obes 2022, 15, 121–129. [CrossRef]
- Annan, S.F.; Higgins, L.A.; Jelleryd, E.; Hannon, T.; Rose, S.; Salis, S.; Baptista, J.; Chinchilla, P.; Marcovecchio, M.L. ISPAD Clinical Practice Consensus Guidelines 2022: Nutritional Management in Children and Adolescents with Diabetes. Pediatr Diabetes 2022, 23, 1297–1321. [CrossRef]
- Boucher, J.L. Mediterranean Eating Pattern. Diabetes Spectr 2017, 30, 72–76. [CrossRef]
- Mańkiewicz-Żurawska, I.; Jarosz-Chobot, P. Nutrition of Children and Adolescents with Type 1 Diabetes in the Recommendations of the Mediterranean Diet. Pediatr Endocrinol Diabetes Metab 2019, 25, 74–80. [CrossRef]
- Guasch-Ferré, M.; Willett, W.C. The Mediterranean Diet and Health: A Comprehensive Overview. J Intern Med 2021, 290, 549–566. [CrossRef]
- Martín-Peláez, S.; Fito, M.; Castaner, O. Mediterranean Diet Effects on Type 2 Diabetes Prevention, Disease Progression, and Related Mechanisms. A Review. Nutrients 2020, 12. [CrossRef]
- Dominguez-Riscart, J.; Buero-Fernandez, N.; Garcia-Zarzuela, A.; Morales-Perez, C.; Garcia-Ojanguren, A.; Lechuga-Sancho, A.M. Adherence to Mediterranean Diet Is Associated With Better Glycemic Control in Children With Type 1 Diabetes: A Cross-Sectional Study. Front Nutr 2022, 9. [CrossRef]
- Zhong, V.W.; Lamichhane, A.P.; Crandell, J.L.; Couch, S.C.; Liese, A.D.; The, N.S.; Tzeel, B.A.; Dabelea, D.; Lawrence, J.M.; Marcovina, S.M.; et al. Association of Adherence to a Mediterranean Diet with Glycemic Control and Cardiovascular Risk Factors in Youth with Type I Diabetes: The SEARCH Nutrition Ancillary Study. Eur J Clin Nutr 2016, 70, 802–807. [CrossRef]
- Serra-Majem, L.; Ribas, L.; Ngo, J.; Ortega, R.M.; García, A.; Pérez-Rodrigo, C.; Aranceta, J. Food, Youth and the Mediterranean Diet in Spain. Development of KIDMED, Mediterranean Diet Quality Index in Children and Adolescents. Public Health Nutr 2004, 7, 931–935. [CrossRef]
- Antoniotti, V.; Spadaccini, D.; Ricotti, R.; Carrera, D.; Savastio, S.; Goncalves Correia, F.P.; Caputo, M.; Pozzi, E.; Bellone, S.; Rabbone, I.; et al. Adherence to the Mediterranean Diet Is Associated with Better Metabolic Features in Youths with Type 1 Diabetes. Nutrients 2022, 14. [CrossRef]
- Cadario, F.; Prodam, F.; Pasqualicchio, S.; Bellone, S.; Bonsignori, I.; Demarchi, I.; Monzani, A.; Bona, G. Lipid Profile and Nutritional Intake in Children and Adolescents with Type 1 Diabetes Improve after a Structured Dietician Training to a Mediterranean-Style Diet. J Endocrinol Invest 2012, 35, 160–168. [CrossRef]
- Chiang, J.L.; Maahs, D.M.; Garvey, K.C.; Hood, K.K.; Laffel, L.M.; Weinzimer, S.A.; Wolfsdorf, J.I.; Schatz, D. Type 1 Diabetes in Children and Adolescents: A Position Statement by the American Diabetes Association. Diabetes Care 2018. [CrossRef]
- Potter, J.D. Book Review Eat, Drink, and Be Healthy: The Harvard Medical School Guide to Healthy Eating By Walter C. Willett. 299 Pp. New York, Simon & Schuster, 2001. $25. 0-684-86337-5. New England Journal of Medicine 2002. [CrossRef]
- Shai, I.; Rosner, B.A.; Shahar, D.R.; Vardi, H.; Azrad, A.B.; Kanfi, A.; Schwarzfuchs, D.; Fraser, D.; DEARR study Dietary Evaluation and Attenuation of Relative Risk: Multiple Comparisons between Blood and Urinary Biomarkers, Food Frequency, and 24-Hour Recall Questionnaires: The DEARR Study. J Nutr 2005, 135, 573–579. [CrossRef]
- Tzameret- Israeli National Nutrient Database 2015;Ministry of Health Public Health Services Nutrition Division:Jerusalem,Isreal 2015.
- Abu-Saad, K.; Endevelt, R.; Goldsmith, R.; Shimony, T.; Nitsan, L.; Shahar, D.R.; Keinan-Boker, L.; Ziv, A.; Kalter-Leibovici, O. Adaptation and Predictive Utility of a Mediterranean Diet Screener Score. Clin Nutr 2019, 38, 2928–2935. [CrossRef]
- Galilea-Zabalza, I.; Buil-Cosiales, P.; Salas-Salvadó, J.; Toledo, E.; Ortega-Azorín, C.; Díez-Espino, J.; Vázquez-Ruiz, Z.; Zomeño, M.D.; Vioque, J.; Martínez, J.A.; et al. Mediterranean Diet and Quality of Life: Baseline Cross-Sectional Analysis of the PREDIMED-PLUS Trial. PLoS ONE 2018, 13, e0198974. [CrossRef]
- Baker-Smith, C.M.; Flinn, S.K.; Flynn, J.T.; Kaelber, D.C.; Blowey, D.; Carroll, A.E.; Daniels, S.R.; de Ferranti, S.D.; Dionne, J.M.; Falkner, B.; et al. Diagnosis, Evaluation, and Management of High Blood Pressure in Children and Adolescents. Pediatrics 2018, 142. [CrossRef]
- Vanderwall, C.; Eickhoff, J.; Randall Clark, R.; Carrel, A.L. BMI Z-Score in Obese Children Is a Poor Predictor of Adiposity Changes over Time. BMC Pediatr 2018, 18, 187. [CrossRef]
- Agregán, R.; Popova, T.; López-Pedrouso, M.; Cantalapiedra, J.; Lorenzo, J.M.; Franco, D. Fatty Acids. In Food Lipids; Elsevier, 2022; pp. 257–286.
- Mayneris-Perxachs, J.; Sala-Vila, A.; Chisaguano, M.; Castellote, A.I.; Estruch, R.; Covas, M.I.; Fitó, M.; Salas-Salvadó, J.; Martínez-González, M.A.; Lamuela-Raventós, R.; et al. Effects of 1-Year Intervention with a Mediterranean Diet on Plasma Fatty Acid Composition and Metabolic Syndrome in a Population at High Cardiovascular Risk. PLoS ONE 2014, 9, e85202. [CrossRef]
- Antoniotti, V.; Spadaccini, D.; Ricotti, R.; Carrera, D.; Savastio, S.; Goncalves Correia, F.P.; Caputo, M.; Pozzi, E.; Bellone, S.; Rabbone, I.; et al. Adherence to the Mediterranean Diet Is Associated with Better Metabolic Features in Youths with Type 1 Diabetes. Nutrients 2022, 14, 596. [CrossRef]
- Levran, N.; Levek, N.; Sher, B.; Gruber, N.; Afek, A.; Monsonego-Ornan, E.; Pinhas-Hamiel, O. The Impact of a Low-Carbohydrate Diet on Micronutrient Intake and Status in Adolescents with Type 1 Diabetes. Nutrients 2023, 15, 1418. [CrossRef]
- Nitta, A.; Imai, S.; Kajiayama, S.; Matsuda, M.; Miyawaki, T.; Matsumoto, S.; Kajiyama, S.; Hashimoto, Y.; Ozasa, N.; Fukui, M. Impact of Dietitian-Led Nutrition Therapy of Food Order on 5-Year Glycemic Control in Outpatients with Type 2 Diabetes at Primary Care Clinic: Retrospective Cohort Study. Nutrients 2022, 14. [CrossRef]
- Alman, A.C.; Talton, J.W.; Wadwa, R.P.; Urbina, E.M.; Dolan, L.M.; Daniels, S.R.; Hamman, R.F.; D’Agostino, R.B.; Marcovina, S.M.; Mayer-Davis, E.J.; et al. Cardiovascular Health in Adolescents with Type 1 Diabetes: The SEARCH CVD Study. Pediatr Diabetes 2014, 15, 502–510. [CrossRef]
- Ren, Y.; Sun, S.; Su, Y.; Ying, C.; Luo, H. Effect of Fruit on Glucose Control in Diabetes Mellitus: A Meta-Analysis of Nineteen Randomized Controlled Trials. Front Endocrinol (Lausanne) 2023, 14, 1174545. [CrossRef]
- Ola, M.S.; Al-Dosari, D.; Alhomida, A.S. Role of Oxidative Stress in Diabetic Retinopathy and the Beneficial Effects of Flavonoids. Curr Pharm Des 2018, 24, 2180–2187. [CrossRef]
- Leyvraz, M.; Chatelan, A.; da Costa, B.R.; Taffé, P.; Paradis, G.; Bovet, P.; Bochud, M.; Chiolero, A. Sodium Intake and Blood Pressure in Children and Adolescents: A Systematic Review and Meta-Analysis of Experimental and Observational Studies. Int J Epidemiol 2018, 47, 1796–1810. [CrossRef]
- Huang, L.; Trieu, K.; Yoshimura, S.; Neal, B.; Woodward, M.; Campbell, N.R.C.; Li, Q.; Lackland, D.T.; Leung, A.A.; Anderson, C.A.M.; et al. Effect of Dose and Duration of Reduction in Dietary Sodium on Blood Pressure Levels: Systematic Review and Meta-Analysis of Randomised Trials. BMJ 2020, m315. [CrossRef]
- Viroli, G.; Gonçalves, C.; Pinho, O.; Silva-Santos, T.; Padrão, P.; Moreira, P. High Adherence to Mediterranean Diet Is Not Associated with an Improved Sodium and Potassium Intake. Nutrients 2021, 13, 4151. [CrossRef]
- Vasara, E.; Marakis, G.; Breda, J.; Skepastianos, P.; Hassapidou, M.; Kafatos, A.; Rodopaios, N.; Koulouri, A.A.; Cappuccio, F.P. Sodium and Potassium Intake in Healthy Adults in Thessaloniki Greater Metropolitan Area-The Salt Intake in Northern Greece (SING) Study. Nutrients 2017, 9. [CrossRef]
- Toledo, E.; Hu, F.B.; Estruch, R.; Buil-Cosiales, P.; Corella, D.; Salas-Salvadó, J.; Covas, M.I.; Arós, F.; Gómez-Gracia, E.; Fiol, M.; et al. Effect of the Mediterranean Diet on Blood Pressure in the PREDIMED Trial: Results from a Randomized Controlled Trial. BMC Med 2013, 11, 207. [CrossRef]
- Ross Catherine; Caballero Benjemin; Cousind Robert; Ticker Katherine; Zigler Thomes Moderen Nutrition in Health Ad Disease; 11th ed.; Lipponcott Williams & wilkins: Baltimore , 2012;
- Wu, Y.; Lu, H.; Yang, H.; Li, C.; Sang, Q.; Liu, X.; Liu, Y.; Wang, Y.; Sun, Z. Zinc Stimulates Glucose Consumption by Modulating the Insulin Signaling Pathway in L6 Myotubes: Essential Roles of Akt-GLUT4, GSK3β and MTOR-S6K1. J Nutr Biochem 2016, 34, 126–135. [CrossRef]
- Little, P.J.; Bhattacharya, R.; Moreyra, A.E.; Korichneva, I.L. Zinc and Cardiovascular Disease. Nutrition 2010, 26, 1050–1057. [CrossRef]
- Dietary Reference Intakes for Thiamin, Riboflavin, Niacin, Vitamin B6, Folate, Vitamin B12, Pantothenic Acid, Biotin, and Choline; 1998; ISBN 0309064112.
- Eshak, E.S.; Iso, H.; Maruyama, K.; Muraki, I.; Tamakoshi, A. Associations between Dietary Intakes of Iron, Copper and Zinc with Risk of Type 2 Diabetes Mellitus: A Large Population-Based Prospective Cohort Study. Clinical Nutrition 2018, 37, 667–674. [CrossRef]
- Squitti, R.; Negrouk, V.; Perera, M.; Llabre, M.M.; Ricordi, C.; Rongioletti, M.C.A.; Mendez, A.J. Serum Copper Profile in Patients with Type 1 Diabetes in Comparison to Other Metals. Journal of Trace Elements in Medicine and Biology 2019, 56, 156–161. [CrossRef]
- Wolff, S.P.; Dean, R.T. Glucose Autoxidation and Protein Modification. The Potential Role of ‘Autoxidative Glycosylation’ in Diabetes. Biochemical Journal 1987, 245, 243–250. [CrossRef]
- Oost, L.J.; van Heck, J.I.P.; Tack, C.J.; de Baaij, J.H.F. The Association between Hypomagnesemia and Poor Glycaemic Control in Type 1 Diabetes Is Limited to Insulin Resistant Individuals. Sci Rep 2022, 12, 6433. [CrossRef]
- Pérez-Segura, P.; de Dios, O.; Herrero, L.; Vales-Villamarín, C.; Aragón-Gómez, I.; Gavela-Pérez, T.; Garcés, C.; Soriano-Guillén, L. Children with Type 1 Diabetes Have Elevated High-Sensitivity C-Reactive Protein Compared with a Control Group. BMJ Open Diabetes Res Care 2020, 8. [CrossRef]
- Grandjean, A.C. Dietary Intake Data Collection: Challenges and Limitations. Nutr Rev 2012, 70 Suppl 2, S101-4. [CrossRef]
Figure 1.
A flow chart of the study. T2D: type 2 diabetes; MODY: maturity-onset diabetes of the young; ED: eating disorder; DE: disordered eating; CGM: continues glucose monitoring; type 1 DM: type 1 diabetes mellitus; MED: Mediterranean diet; FFQ; food frequency questioner; I-MEDAS: Israeli Mediterranean diet screener;.

Table 1.
Percentages of macronutrients in the diet and median (interquartile range) percentages of micronutrients compared to DRI values.
Table 1.
Percentages of macronutrients in the diet and median (interquartile range) percentages of micronutrients compared to DRI values.
| Baseline | After 6 months | Delta | p-value | |
|---|---|---|---|---|
| %Protein from calories | 17(16-20) | 18(16-20) | 0.0(-1.1-2.3) | 0.552 |
| %Fat from calories | 35(32-37) | 38(34-40) | 2(-1-5) | 0.092 |
| %Carbohydrate from calories | 42(39-46) | 39(35-46) | -2.7(-8.3-1.5) | 0.058 |
| Percent DRI | ||||
| Fiber | 100(72-113) | 111(77-133) | 0.5(-8.7-47.2) | 0.501 |
| Calcium | 120(75-160) | 131(76-149) | 1.5(-25.7-16) | 0.816 |
| Iron | 75(59-189) | 84(60-129) | 0.0(-35-15) | 0.868 |
| Magnesium | 143(94-189) | 161(116-195) | 21(0-43) | 0.068 |
| Phosphorus | 241(140-271) | 221(149-278) | 0(-27-31) | 0.981 |
| Potassium | 92(71-107) | 87(69-107) | -0.5(-8.5-16.7) | 0.887 |
| Sodium | 250(194-332) | 251(186-326) | 0.5(-37.0-25.7) | 0.653 |
| Zinc | 142(115-159) | 131(109-167) | 0(-8-20) | 0.795 |
| Copper | 189(145-262) | 180(144-245) | 0(-13-49) | 0.756 |
| Vitamin C | 302(225-405) | 283(217-358) | 1(-107-111) | 0.984 |
| Thiamin B1 | 127(110-169) | 130(114-166) | 0(-4-29) | 0.408 |
| Riboflavin B2 |
217(161-261) | 225(167-266) | 0(-23-56) | 0.463 |
| Niacin B3 | 164(122-211) | 168(135-224) | 5(-11-42) | 0.309 |
| Folate B9 | 105(79-137) | 105(86-122) | 0(-17-32) | 0.981 |
| Pyridoxine B6 | 205(154(259) | 200(160-273) | 0(-30-30) | 0.868 |
| Vitamin A | 134(88-196) | 131(110-166) | 0(-17-41) | 0.687 |
| Vitamin E | 85(60-121) | 93(69-119) | 8(-9-25) | 0.266 |
| Vitamin D | 141(98-246) | 210(83-254) | 17(-3-51) | 0.103 |
The data are presented as medians and interquartile ranges. The percentages of the DRIs were calculated according to the recommended amounts for age and sex. All the data are presented as percentages except the calories. Kcal: kilocalories; DRI: dietary recommended intake.
Table 2.
Median (interquartile range) intakes of selected nutrients before and after the Mediterranean diet intervention, according to the Food Frequency Questionnaire.
Table 2.
Median (interquartile range) intakes of selected nutrients before and after the Mediterranean diet intervention, according to the Food Frequency Questionnaire.
| Baseline | After 6 months | Delta | p-value | |
|---|---|---|---|---|
| Total calories, Kcal | 2077.8(1840.7-2661.9) | 2050.9(1770.4-2827.5) | 0.0(-306.3-268.3) | 0.943 |
| Energy percent ultra-process | 17.7(13.5-21.8) | 15.2(7.9-21.4) | 0.0(-9.4-1.3) | 0.255 |
| Protein, g | 97.1(81.7-120.9) | 97.9(79.1-125.8) | 0.7(-11.3-8.2) | 0.906 |
| Fat, g | 85.7(71.8-104.8) | 89.6(69.5-104.8) | 1.1(-8.7-15.7) | 0.554 |
| Carbohydrate, g | 222.0(188.8-306.0) | 197.8(159.6-278.3) | 0.0(-63.4-25.3) | 0.356 |
| Total sugars, g | 100.9(64.1-136.6) | 88.7(70.9-106.9) | -0.2(-18.4-12.1) | 0.523 |
| Sugar alcohols, g | 0.28(0.1-0.7) | 0.2(0.1-1.7) | 0.0(-0.2-0.2) | 0.975 |
| Fructose, g | 19.4(11.1-25.5) | 19.2(12.4-25.0) | 0.0(-5.4-4.0) | 0.653 |
| Fiber, g | 27.3(19.9-41.3) | 28.5(23.5-42.1) | 0.0(-2.2-8.1) | 0.795 |
| Calcium', mg | 1283.1(775.2-1639.8) | 1308.4(899.1-1692.1) | 31.9(-234.7-204.3) | 0.554 |
| Iron, mg | 11.9(10.3-17.9) | 11.9(10.4-17.6) | 0.0(-3.1-2.3) | 0.981 |
| Magnesium, mg | 479.2(327.9-631.4) | 552.8(398.3-691.4) | 66.0(0.0-128.8) | 0.084 |
| Phosphorus, mg | 1768.9(1335.6-2038.1) | 1724.4(1410.9-2023.7) | 0.00(-144.6-356.1) | 0.586 |
| Potassium, mg | 4304.0(3338.1-5069.6) | 4110.3(3248.1-5044.1) | -13.7(-414.7-789.2) | 0.906 |
| Sodium, mg | 3757.9(2914.5-4994.4) | 3771.1(2800.2-4900.8) | -2.7(-551.4-387.2) | 0.687 |
| Zinc, mg | 12.1(9.9-14.1) | 11.9(8.8-15.6) | 0.0(-1.4-1.7) | 0.906 |
| Copper, mg | 1.9(1.4-2.6) | 1.9(1.4-2.5) | 0.0(-0.1-0.4) | 0.723 |
| Selenium, mcg | 132.9(118.4-181.1) | 148.9(105.0-183.0) | 0.0(-17.2-26.7) | 0.687 |
| Choline, mg | 503.2(345.7-682.0) | 517.6(339.1-717.9) | 0.0(-145.4-107.3) | 0.906 |
| Vitamin A, mcg | 2081.0(1281.1-2597.6) | 1934.1(1202.8-2304.4) | 5.19(-406.6-233.9) | 0.723 |
| Vitamin C | 228.4(162.9-304.1) | 212.7(148.1-274.1) | 0.0(-32.8-33.7) | 0.981 |
| Thiamin B1, mg | 1.3(1.1-1.9) | 1.4(1.2-1.8) | 0.0(-0.4-0.2) | 0.687 |
| Riboflavin B2, mg | 2.2(1.7-3.3) | 2.5(2.0-3.0) | 0.0(-0.3-0.5) | 0.653 |
| Niacin B3, mg | 23.0(18.8-29.8) | 25.1(18.4-32.8) | 0.0(-2.3-6.1) | 0.523 |
| Vitamin B6, mg | 2.6(1.9-3.3) | 2.5(1.9-3.3) | 0.0(-0.7-0.4) | 0.831 |
| Folate B9, mcg | 422.3(316.3-551.2) | 423.4(331.6-488.6) | 0.0(-127.8-127.5) | 0.943 |
| Vitamin B12 mcg | 5.8(3.8-7.0) | 6.1(4.1-7.2) | 0.0(-0.8-0.5) | 0.981 |
| Vitamin D, mcg | 7.0(4.8-12.3) | 9.8(4.1-12.6) | 0.5(-1.2-2.6) | 0.246 |
| Vitamin K, mcg | 224.5(184.3-354.4) | 218(155.6-317.0) | -4.0(-56.5-35.5) | 0.356 |
| Vitamin E, mcg | 12.7(9.0-17.1) | 13.2(10.3-17.2) | 0.0(-3.6-3.7) | 0.460 |
| Cholesterol, mg | 395.1(262.6-559.3) | 346.0(242.3-617.1) | 0.0(-99.2-45.4) | 0.831 |
| Saturated fat, mg | 27.9(20.7-31.6) | 27.1(19.7-30.9) | -1.1(-3.1-0.7) | 0.287 |
| Monounsaturated fat, g | 34.1(27.0-42.4) | 39.3(29.7-43.2) | 2.3(0.0-11.4) | 0.149 |
| Polyunsaturated fat, g | 17.7(15.0-24.2) | 18.2(13.1-25.4) | 0.0(-3.3-3.4) | 0.906 |
| Docosahexaenoic acid (DHA,) g | 0.1018(0.0433-0.1614) | 0.1555(0.0474-0.1994) | 0.0184(0.0785) | 0.035 |
| Palmitoleic acid, g | 1.0639(0.8908-1.3945) | 1.0873(0.7696-1.6299) | -0.0069(-0.1928-0.2098) | 0.943 |
| Parinaric acid, g | 0.0196(0.004-0.0278) | 0.0198(0.0052-0.0556) | -0.0454(-0.0832; -0.0056) | 0.049 |
| Eicosapentaenoic acid (EPA), g | 0.0266(0.0081-0.0419) | 0.0364(0.0158-0.0736) | 0.0048(0.0000-0.0323) | 0.035 |
| Erucic acid, g | 0.0431(0.0051-0.0604) | 0.0435(0.0134-0.1145) | 0.0042(0.0000-0.0526) | 0.031 |
| Docosapentaenoic acid (DPA), g | 0.0220(0.0117-0.0392) | 0.0312(0.0137-0.0476) | 0.0015(-0.0001-0.0174) | 0.049 |
The data are presented as medians and interquartile ranges. BMI: body mass index; HbA1c: glycated hemoglobin: C-reactive protein; mg/L: milligrams per liter; mcg: microgram per deciliter; ng/mL: nanogram per milliliter.
Table 3.
I-MEDAS Israeli Mediterranean diet screener.
| Baseline | Six months | P value | ||
|---|---|---|---|---|
| Total Score | 8(7-11) | 13(12-14) delta: 5(2-6) | <0.001 | |
| The criterion for a positive score | ||||
| Preference for olive oil | Yes | Y=1(5%) N=19(95%) | Y=18(90%) N=2(90%) | <0.001 |
| Poultry more than red/processed meat | Yes | Y=12(60%) N=8(40%) | Y=19(95%) N=1(5%) | 0.016 |
| Non-starchy vegetables | 2+ servings/d | Y=16(80%) N=4(20%) | Y=19(95%) N=1(5%) | 0.25 |
| Fruits- without juice | 3+ servings a day | Y=4(20%) N=16(80%) | Y=6(30%) N=14(70%) | 0.625 |
| Butter/Margarine | <1 serving /day | Y=9(45%) N=11(55%) | Y=16(80%) N=4(20%) | 0.039 |
| Sweet soft drinks | <1 serving /day | Y=13(65%) N=7(35%) | Y=18(90%) N=2(10%) | 0.063 |
| Whole grains | 3+servings/ day | Y=7(35%) N=13(65%) | Y=13(65%) N=7(35%) | 0.07 |
| Red and ultra-processed meat | <7 servings/ wk | Y=15(75%) N=5(25%) | Y=15(75%) N=5(25%) | * |
| Alcohol | 7+ servings / wk | Y=20(100%) N=0(0%) | Y=20(100%) N=0(0%) | * |
| Non sweetened dairy | 2 + servings /d | Y=16(80%) N=4(20%) | Y=17(85%) N=3(15%) | 0.999 |
| Legumes | 3+ servings/d | Y=1(5%) N=19(95%) | Y=8(40%) N=12(60%) | 0.016 |
| Fish (fresh& preserved) | 3+servings/wk | Y=10(55%) N=10(50%) | Y=17(85%) N=3(15%) | 0.016 |
| Nuts | 3+servings/wk | Y=3(15%) N=17(85%) | Y=12(60%) N=8(40%) | 0.004 |
| Hummus/tahini salad | 3+servings/wk | Y=7(35%) N=13(65%) | Y=6(30%) N=14(70%) | 0.999 |
| Desserts | <3 servings/wk | Y=7(35%) N=13(65%) | Y=15(75%) N=5(25%) | 0.008 |
| Savory pastries | ≤2 servings/wk | Y=16(80%) N=4(20%) | Y=19(95%) N=1(5%) | 0.375 |
| Salty snacks | ≤3 servings/ wk | Y=16(80%) N=4(20%) | Y=16(80%) N=4(20%) | * |
Total score is presented as medians and interquartile. Significantly differences showed in bold; wk: week; d: day; Y=yes; N=no. * The discordant pairs are equal or less than 25, so a chi value was not calculated.
Table 4.
Clinical and biochemical data of the participants before and after the MED intervention.
| Before | After | Change | p-value | ||
| Anthropometric measurements | BMI z-score | 1.1(0.6-1.3) | 1.2(0.5-1.5) | 0.0(-0.1-0.1) | 0.316 |
| Waist circumference percentile | 71.0(35.5-79.0) | 59.5(26.5-77.0) | -1.0(-5.5-1.7) | 0.161 | |
| Glucose variables | TIR 70-180 mg/dl | 52(38-60) | 63(47-71) | 7(-1-14) | 0.047 |
| Total daily dose unit/kg | 0.76(0.64-0.97) | 0.72(0.61-0.89) | -0.04(-0.13-0.00) | 0.067 | |
| Blood pressure percentiles |
Systolic % | 64(38-94) | 60(30-72) | -1(-28-14) | 0.349 |
| Diastolic% | 73(68-88) | 69(50-79) | -8(-21-5) | 0.028 | |
| Blood tests | HbA1c % | 7.5(6.8-8.5) | 7.1(6.7-7.9) | 0.0(-0.6-0.3) | 0.453 |
| Cholesterol mg/dL mg/dl |
176(160-186) | 171(156-189) | 0(-22-7) | 0.293 | |
| LDL cholesterol mg/dL | 114(105-134) | 104(96-124) | -3.5(-24-1.5) | 0.059 | |
| HDL cholesterol mg/dL | 64(58-69) | 62(50-74) | -2(-8-1) | 0.195 | |
| Triglyceride mg/dL | 68(61-95) | 72(51-87) | 0(-16-9) | 0.877 | |
| CRP <0.20-5.00 mg/L | 1.9(1.0-5.3) | 2.1(0.5-6.9) | 0.0(-0.3-0.6) | 0.744 | |
| Urea 17-45 mg/dL | 28.0(22.2-33.7) | 26.0(20.0-33.7) | 0.0(-7.0-2.0) | 0.307 | |
| Creatinine 0.62-1.10 mg/dL | 0.70(0.57-0.79) | 0.73(0.54-0.85) | 0.01(-0.01-0.08) | 0.025 | |
| Zinc 50.0-150.0 mcg/dL | 119.0(96.5-140.0) | 131.5(110.5-150.7) | 8.5(0.0-30.7) | 0.031 | |
| Calcium 8.1-10.4 mg/dL | 9.8(0.6-10.0) | 9.8(9.5-10.1) | 0.0(-0.2-0.2) | 1.000 | |
| Phosphorus 2.00-4.00 mg/dL | 4.2(3.4-4.3) | 4.1(3.5-4.3) | -0.05(-0.37-0.20) | 0.477 | |
|
Potassium 3.5-5.1 mmol/L |
4.2(4.1-4.4) | 4.4(4.2-4.6) | 0.1(-0.1-0.4) | 0.044 | |
| Magnesium 1.90-2.70 mg/dL | 1.9(1.8-2.0) | 1.9(1.8-2.0) | 0.0(0.0-0.1) | 0.424 | |
| Vitamin C 4.6-14.9 mg/L | 11.7(9.0-12.9) | 12.0(9.0-13.4) | 0.2(-0.8-0.9) | 0.321 | |
| Vitamin B1 66.5-200.0 nmol/L | 144.8(121.0-171.0) | 141.5(118.3-158.0) | -0.2(-11.4-4.8) | 0.472 | |
| Folic acid 5.9-24.0 ng/mL | 8.7(6.7-12.3) | 10.5(6.2-13.5) | 0.0(-2.3-3.9) | 0.679 | |
The data are presented as medians and interquartile ranges. BMI: body mass index; HbA1c: glycated hemoglobin: C-reactive protein; mg/L: milligrams per liter; mcg: microgram per deciliter; ng/mL: nanogram per milliliter; TIR, time-in-range; CRP, C-reactive protein.
Table 5.
Correlations of food energy and various nutrients with delta total daily fiber intake (g).
| R | p-value | |
|---|---|---|
| Delta food energy | -0.473 | 0.035 |
| Delta energy from ultra-processed | 0.741 | <0.0001 |
| Delta total fat | 0.566 | 0.009 |
| Delta carbohydrates | 0.659 | 0.002 |
| Delta calcium | 0.771 | <0.0001 |
| Delta zinc | 0.641 | 0.002 |
| Delta copper | 0.78 | <0.0001 |
| Delta vitamin C | 0.576 | 0.008 |
| Delta thiamin | 0.891 | <0.001 |
| Correlation with delta polyunsaturated fat (g) | ||
| R | p-value | |
| Delta energy from ultra-processed food | 0.7 | 0.001 |
| Delta carbohydrate | 0.893 | <0.0001 |
| Delta total fiber | 0.765 | <0.0001 |
| Delta fructose | 0.671 | 0.001 |
| Delta magnesium | 0.805 | <0.0001 |
| Delta zinc | 0.63 | 0.003 |
| Delta copper | 0.784 | <0.0001 |
| Delta folate | 0.768 | <0.0001 |
| Delta thiamine | 0.712 | <0.0001 |
| Delta vitamin C | 0.637 | 0.003 |
Delta; after minus before; g: gram.
Disclaimer/Publisher’s Note: The statements, opinions and data contained in all publications are solely those of the individual author(s) and contributor(s) and not of MDPI and/or the editor(s). MDPI and/or the editor(s) disclaim responsibility for any injury to people or property resulting from any ideas, methods, instructions or products referred to in the content. |
© 2023 by the authors. Licensee MDPI, Basel, Switzerland. This article is an open access article distributed under the terms and conditions of the Creative Commons Attribution (CC BY) license (http://creativecommons.org/licenses/by/4.0/).
Copyright: This open access article is published under a Creative Commons CC BY 4.0 license, which permit the free download, distribution, and reuse, provided that the author and preprint are cited in any reuse.


