Submitted:
27 September 2023
Posted:
28 September 2023
You are already at the latest version
Abstract
Keywords:
1. Introduction
2. Experiment setup
3. Results and discussion
3.1. Supercontinuum
3.2. Self-focusing critical power and filamentation threshold
4. Conclusions
Author Contributions
Funding
Institutional Review Board Statement
Informed Consent Statement
Data Availability Statement
Conflicts of Interest
References
- Braun, A.; Korn, G.; Liu, X.; Du, D.; Squier, J.; Mourou, G. Self-channeling of high-peak-power femtosecond laser pulses in air. Opt. Lett. 1995, 20, 73–75. [Google Scholar] [CrossRef] [PubMed]
- Couairon, A.; Mysyrowicz, A. Femtosecond filamentation in transparent media. Phys. Rep. 2007, 441, 47–189. [Google Scholar] [CrossRef]
- Papazoglou, D.G.; Tzortzakis, S. In-line holography for the characterization of ultrafast laser filamentation in transparent media. Appl. Phys. Lett. 2008, 93, 041120. [Google Scholar] [CrossRef]
- Dharmadhikari, A.K.; Alti, K.; Dharmadhikari, J.A.; Mathur, D. Control of the onset of filamentation in condensed media. Phys. Rev. A. 2007, 76, 033811. [Google Scholar] [CrossRef]
- Couairon, A.; Bergé, L. Modeling the filamentation of ultra-short pulses in ionizing media. Phys. Plasmas 1999, 7, 193–209. [Google Scholar] [CrossRef]
- Kolesik, M.; Wright, E.M.; Moloney, J.V. Dynamic nonlinear X-waves for femtosecond pulse propagation in water. Phys. Rev. Lett. 2004, 92, 253901. [Google Scholar] [CrossRef]
- Faccio, D.; Averchi, A.; Lotti, A.; Kolesik, M.; Moloney, J.V.; Couairon, A.; Di Trapani, P. Generation and control of extreme blueshifted continuum peaks in optical Kerr media. Phys. Rev. A. 2008, 78, 033825. [Google Scholar] [CrossRef]
- Porras, M.A.; Dubietis, A.; Kučinskas, E.; Bragheri, F.; Degiorgio, V.; Couairon, A.; Faccio, D.; Di Trapani, P. From X- to O-shaped spatiotemporal spectra of light filaments in water. Opt. Lett. 2005, 30, 3398–3400. [Google Scholar] [CrossRef]
- Kolesik, M.; Katona, G.; Moloney, J.V.; Wright, E.M. Physical factors limiting the spectral extent and band gap dependence of supercontinuum generation. Phys. Rev. Lett. 2003, 91, 043905. [Google Scholar] [CrossRef]
- Faccio, D.; Averchi, A.; Couairon, A.; Dubietis, A.; Piskarskas, R.; Matijosius, A.; Bragheri, F.; Porras, M.A.; Piskarskas, A.; Di Trapani, P. Competition between phase-matching and stationarity in Kerr-driven optical pulse filamentation. Phys. Rev. E. 2006, 74, 047603. [Google Scholar] [CrossRef]
- Gaeta, A.L. Catastrophic collapse of ultrashort pulses. Phys. Rev. Lett. 2000, 84, 3582–3585. [Google Scholar] [CrossRef] [PubMed]
- Kovalenko, S.A.; Schanz, R.; Hennig, H.; Ernsting, N.P. Cooling dynamics of an optically excited molecular probe in solution from femtosecond broadband transient absorption spectroscopy. J. Chem. Phys. 2001, 115, 3256–3273. [Google Scholar] [CrossRef]
- Harilal, S.S.; Kautz, E.J.; Phillips, M.C. Time-resolved absorption spectroscopic characterization of ultrafast laser-produced plasmas under varying background pressures. Phys. Rev. E. 2021, 103, 013213. [Google Scholar] [CrossRef] [PubMed]
- Smirnov, S.V.; Ania-Castanon, J.D.; Ellingham, T.J.; Kobtsev, S.M.; Kukarin, S.; Turitsyn, S.K. Optical spectral broadening and supercontinuum generation in telecom applications. Opt. Fiber Technol. 2006, 12, 122–147. [Google Scholar] [CrossRef]
- Rairoux, P.; Schillinger, H.; Niedermeier, S.; Rodriguez, M.; Ronneberger, F.; Sauerbrey, R.; Stein, B.; Waite, D.; Wedekind, C.; Wille, H.; Wöste, L.; Ziener, C. Remote sensing of the atmosphere using ultrashort laser pulses. Appl. Phys. B. 2000, 71, 573–580. [Google Scholar] [CrossRef]
- Brown, D.M.; Shi, K.; Liu, Z.; Philbrick, C.R. Long-path supercontinuum absorption spectroscopy for measurement of atmospheric constituents. Opt. Express 2008, 16, 8457–8471. [Google Scholar] [CrossRef]
- Tu, H.; Boppart, S.A. Coherent fiber supercontinuum for biophotonics. Laser Photon. Rev. 2013, 7, 628–645. [Google Scholar] [CrossRef]
- Bergé, L.; Rolle, J.; Köhler, C. Enhanced self-compression of mid-infrared laser filaments in argon. Phys. Rev. A. 2013, 88, 023816. [Google Scholar] [CrossRef]
- Zhang, H.; Zhang, Y.; Lin, S.; Chang, M.; Yu, M.; Wang, Y.; Chen, A.; Jiang, Y.; Li, S.; Jin, M. Testing the coherence of supercontinuum generated by optical vortex beam in water. J. Phys. B: At. Mol. Opt. Phys. 2021, 54, 165401. [Google Scholar] [CrossRef]
- Brodeur, A.; Ilkov, F.A.; Chin, S.L. Beam filamentation and the white light continuum divergence. Opt. Commun. 1996, 129, 193–198. [Google Scholar] [CrossRef]
- Golub, I. Optical characteristics of supercontinuum generation. Opt. Lett. 1990, 15, 305–307. [Google Scholar] [CrossRef] [PubMed]
- Wittmann, M.; Penzkofer, A. Spectral superbroadening of femtosecond laser pulses. Opt. Commun. 1996, 126, 308–317. [Google Scholar] [CrossRef]
- Santhosh, C.; Dharmadhikari, A.K.; Alti, K.; Dharmadhikari, J.A.; Deepak, M. Suppression of ultrafast supercontinuum generation in a salivary protein. J. Biomed. Opt. 2007, 12, 020510. [Google Scholar] [CrossRef] [PubMed]
- Santhosh, C.; Dharmadhikari, A.K.; Dharmadhikari, J.A.; Alti, K.; Mathur, D. Supercontinuum generation in macromolecular media. Appl. Phys. B. 2010, 99, 427–432. [Google Scholar] [CrossRef]
- Vasa, P.; Singh, M.; Bernard, R.; Dharmadhikari, A.K.; Dharmadhikari, J.A.; Mathur, D. Supercontinuum generation in water doped with gold nanoparticles. Appl. Phys. Lett. 2013, 103, 111109. [Google Scholar] [CrossRef]
- Liu, W.; Chin, S.L. Direct measurement of the critical power of femtosecond Ti: sapphire laser pulse in air. Opt. Express 2005, 13, 5750–5755. [Google Scholar] [CrossRef]
- Bernhardt, J.; Simard, P.T.; Liu, W.; Xu, H.L.; Théberge, F.; Azarm, A.; Daigle, J.F.; Chin, S.L. Critical power for self-focussing of a femtosecond laser pulse in helium. Opt. Commun. 2008, 281, 2248–2251. [Google Scholar] [CrossRef]
- Li, H.; Chu, W.; Zang, H.; Xu, H.; Cheng, Y.; Chin, S.L. Critical power and clamping intensity inside a filament in a flame. Opt. Express 2016, 24, 3424–3431. [Google Scholar] [CrossRef]
- Liang, W.; Li, D.; Chang, J.; Xi, T.; Ji, L.; Li, D.; Zhang, L.; Hao, Z. Experimentally determined critical power for self-focusing of femtosecond vortex beams in air by a fluorescence measurement. Opt. Express 2023, 31, 1557–1566. [Google Scholar] [CrossRef]
- Akturk, S.; D’Amico, C.; Franco, M.; Couairon, A.; Mysyrowicz, A. A simple method for determination of nonlinear propagation regimes in gases. Opt. Express 2007, 15, 15260–15267. [Google Scholar] [CrossRef]
- Li, S.; Wang, X.; Zhang, Y.; Yu, M.; Wang, Y.; Liu, F.; Jin, M. Femtosecond filamentation in water studied by the interference of supercontinuum. Phys. Scr. 2023, 98, 015501. [Google Scholar] [CrossRef]
- Kasparian, J.; Sauerbrey, R.; Mondelain, D.; Niedermeier, S.; Yu, J.; Wolf, J.P.; André, Y.B.; Franco, M.; Prade, B.; Tzortzakis, S.; Mysyrowicz, A.; Rodriguez, M.; Wille, H.; Wöste, L. Infrared extension of the supercontinuum generated by femtosecond terawatt laser pulses propagating in the atmosphere. Opt. Lett. 2000, 25, 1397–1399. [Google Scholar] [CrossRef] [PubMed]
- Théberge, F.; Châteauneuf, M.; Ross, V.; Mathieu, P.; Dubois, J. Ultrabroadband conical emission generated from the ultraviolet up to the far-infrared during the optical filamentation in air. Opt. Lett. 2008, 33, 2515–2517. [Google Scholar] [CrossRef] [PubMed]
- Chin, S.L. Femtosecond laser filamentation, New York: Springer, 2010; pp. 13.
- Bergé, L.; Skupin, S.; Nuter, R.; Kasparian, J.; Wolf, J.P. Ultrashort filaments of light in weakly ionized, optically transparent media. Rep. Prog. Phys. 2007, 70, 1633. [Google Scholar] [CrossRef]
- Yablonovitch, E.; Bloembergen, N. Avalanche ionization and the limiting diameter of filaments induced by light pulses in transparent media. Phys. Rev. Lett. 1972, 29, 907–910. [Google Scholar] [CrossRef]
- Feng, Q.; Moloney, J.V.; Newell, A.C.; Wright, E.M.; Cook, K.; Kennedy, P.K.; Hammer, D.X.; Rockwell, B.A.; Thompson, C.R. Theory and simulation on the threshold of water breakdown induced by focused ultrashort laser pulses. IEEE J. Quantum Electron. 1997, 33, 127–137. [Google Scholar] [CrossRef]
- Noack, J.; Vogel, A. Laser-induced plasma formation in water at nanosecond to femtosecond time scales: calculation of thresholds, absorption coefficients, and energy density. IEEE J. Quantum Electron. 1999, 35, 1156–1167. [Google Scholar] [CrossRef]
- Liu, W.; Petit, S.; Becker, A.; Aközbek, N.; Bowden, C.M.; Chin, S.L. Intensity clamping of a femtosecond laser pulse in condensed matter. Opt. Commun. 2002, 202, 189–197. [Google Scholar] [CrossRef]
- Kolesik, M.; Katona, G.; Moloney, J.V.; Wright, E.M. Theory and simulation of supercontinuum generation in transparent bulk media. Appl. Phys. B. 2003, 77, 185–195. [Google Scholar] [CrossRef]
- Jones, W.J.; Stoicheff, B.P. Inverse Raman spectra: induced absorption at optical frequencies. Phys. Rev. Lett. 1964, 13, 657–659. [Google Scholar] [CrossRef]
- Li, H.; Shi, Z.; Wang, X.; Sui, L.; Li, S.; Jin, M. Influence of dopants on supercontinuum generation during the femtosecond laser filamentation in water. Chem. Phys. Lett. 2017, 681, 86–89. [Google Scholar] [CrossRef]
- Wilkes, Z.W.; Varma, S.; Chen, Y.H.; Milchberg, H.M.; Jones, T.G.; Ting, A. Direct measurements of the nonlinear index of refraction of water at 815 and 407 nm using single-shot supercontinuum spectral interferometry. Appl. Phys. Lett. 2009, 94, 211102. [Google Scholar] [CrossRef]
- Dubietis, A.; Gaižauskas, E.; Tamošauskas, G.; Di Trapani, P. Light filaments without self-channeling. Phys. Rev. Lett. 2004, 92, 253903. [Google Scholar] [CrossRef] [PubMed]
- Boyd, R.W. Nonlinear optics, 3rd ed.; Academic press, 2008; pp. 212.
- Heller, W. Remarks on refractive index mixture rules. J. Phys. Chem. 1965, 69, 1123–1129. [Google Scholar] [CrossRef]
- Tan, C.Y.; Huang, Y.X. Dependence of refractive index on concentration and temperature in electrolyte solution, polar solution, nonpolar solution, and protein solution. J. Chem. Eng. Data 2015, 60, 2827–2833. [Google Scholar] [CrossRef]
- Luther, G.G.; Moloney, J.V.; Newell, A.C.; Wright, E.M. Self-focusing threshold in normally dispersive media. Opt. Lett. 1994, 19, 862–864. [Google Scholar] [CrossRef]
- Kandidov, V.P.; Kosareva, O.G.; Golubtsov, I.S.; Liu, W.; Becker, A.; Akozbek, N.; Bowden, C.M.; Chin, S.L. Self-transformation of a powerful femtosecond laser pulse into a white-light laser pulse in bulk optical media (or supercontinuum generation). Appl. Phys. B. 2003, 77, 149–165. [Google Scholar] [CrossRef]
- Liu, W.; Gravel, J.F.; Théberge, F.; Becker, A.; Chin, S.L. Background reservoir: its crucial role for long-distance propagation of femtosecond laser pulses in air. Appl. Phys. B. 2005, 80, 857–860. [Google Scholar] [CrossRef]
- Liu, W.; Théberge, F.; Arévalo, E.; Gravel, J.F.; Becker, A.; Chin, S.L. "Experiment and simulations on the energy reservoir effect in femtosecond light filaments. Opt. Lett. 2005, 30, 2602–2604. [Google Scholar] [CrossRef]
- Théberge, F.; Liu, W.; Simard, P.T.; Becker, A.; Chin, S.L. Plasma density inside a femtosecond laser filament in air: Strong dependence on external focusing. Phys. Rev. E 2006, 74, 036406. [Google Scholar] [CrossRef]
- Reyes, D.; Baudelet, M.; Richardson, M.; Fairchild, S.R. Transition from linear-to nonlinear-focusing regime of laser filament plasma dynamics. J. Appl. Phys. 2018, 124, 053103. [Google Scholar] [CrossRef]
- Kiran, P.P.; Bagchi, S.; Arnold, C.L.; Krishnan, S.R.; Kumar, G.R.; Couairon, A. Filamentation without intensity clamping. Opt. Express 2010, 18, 21504–21510. [Google Scholar] [CrossRef] [PubMed]
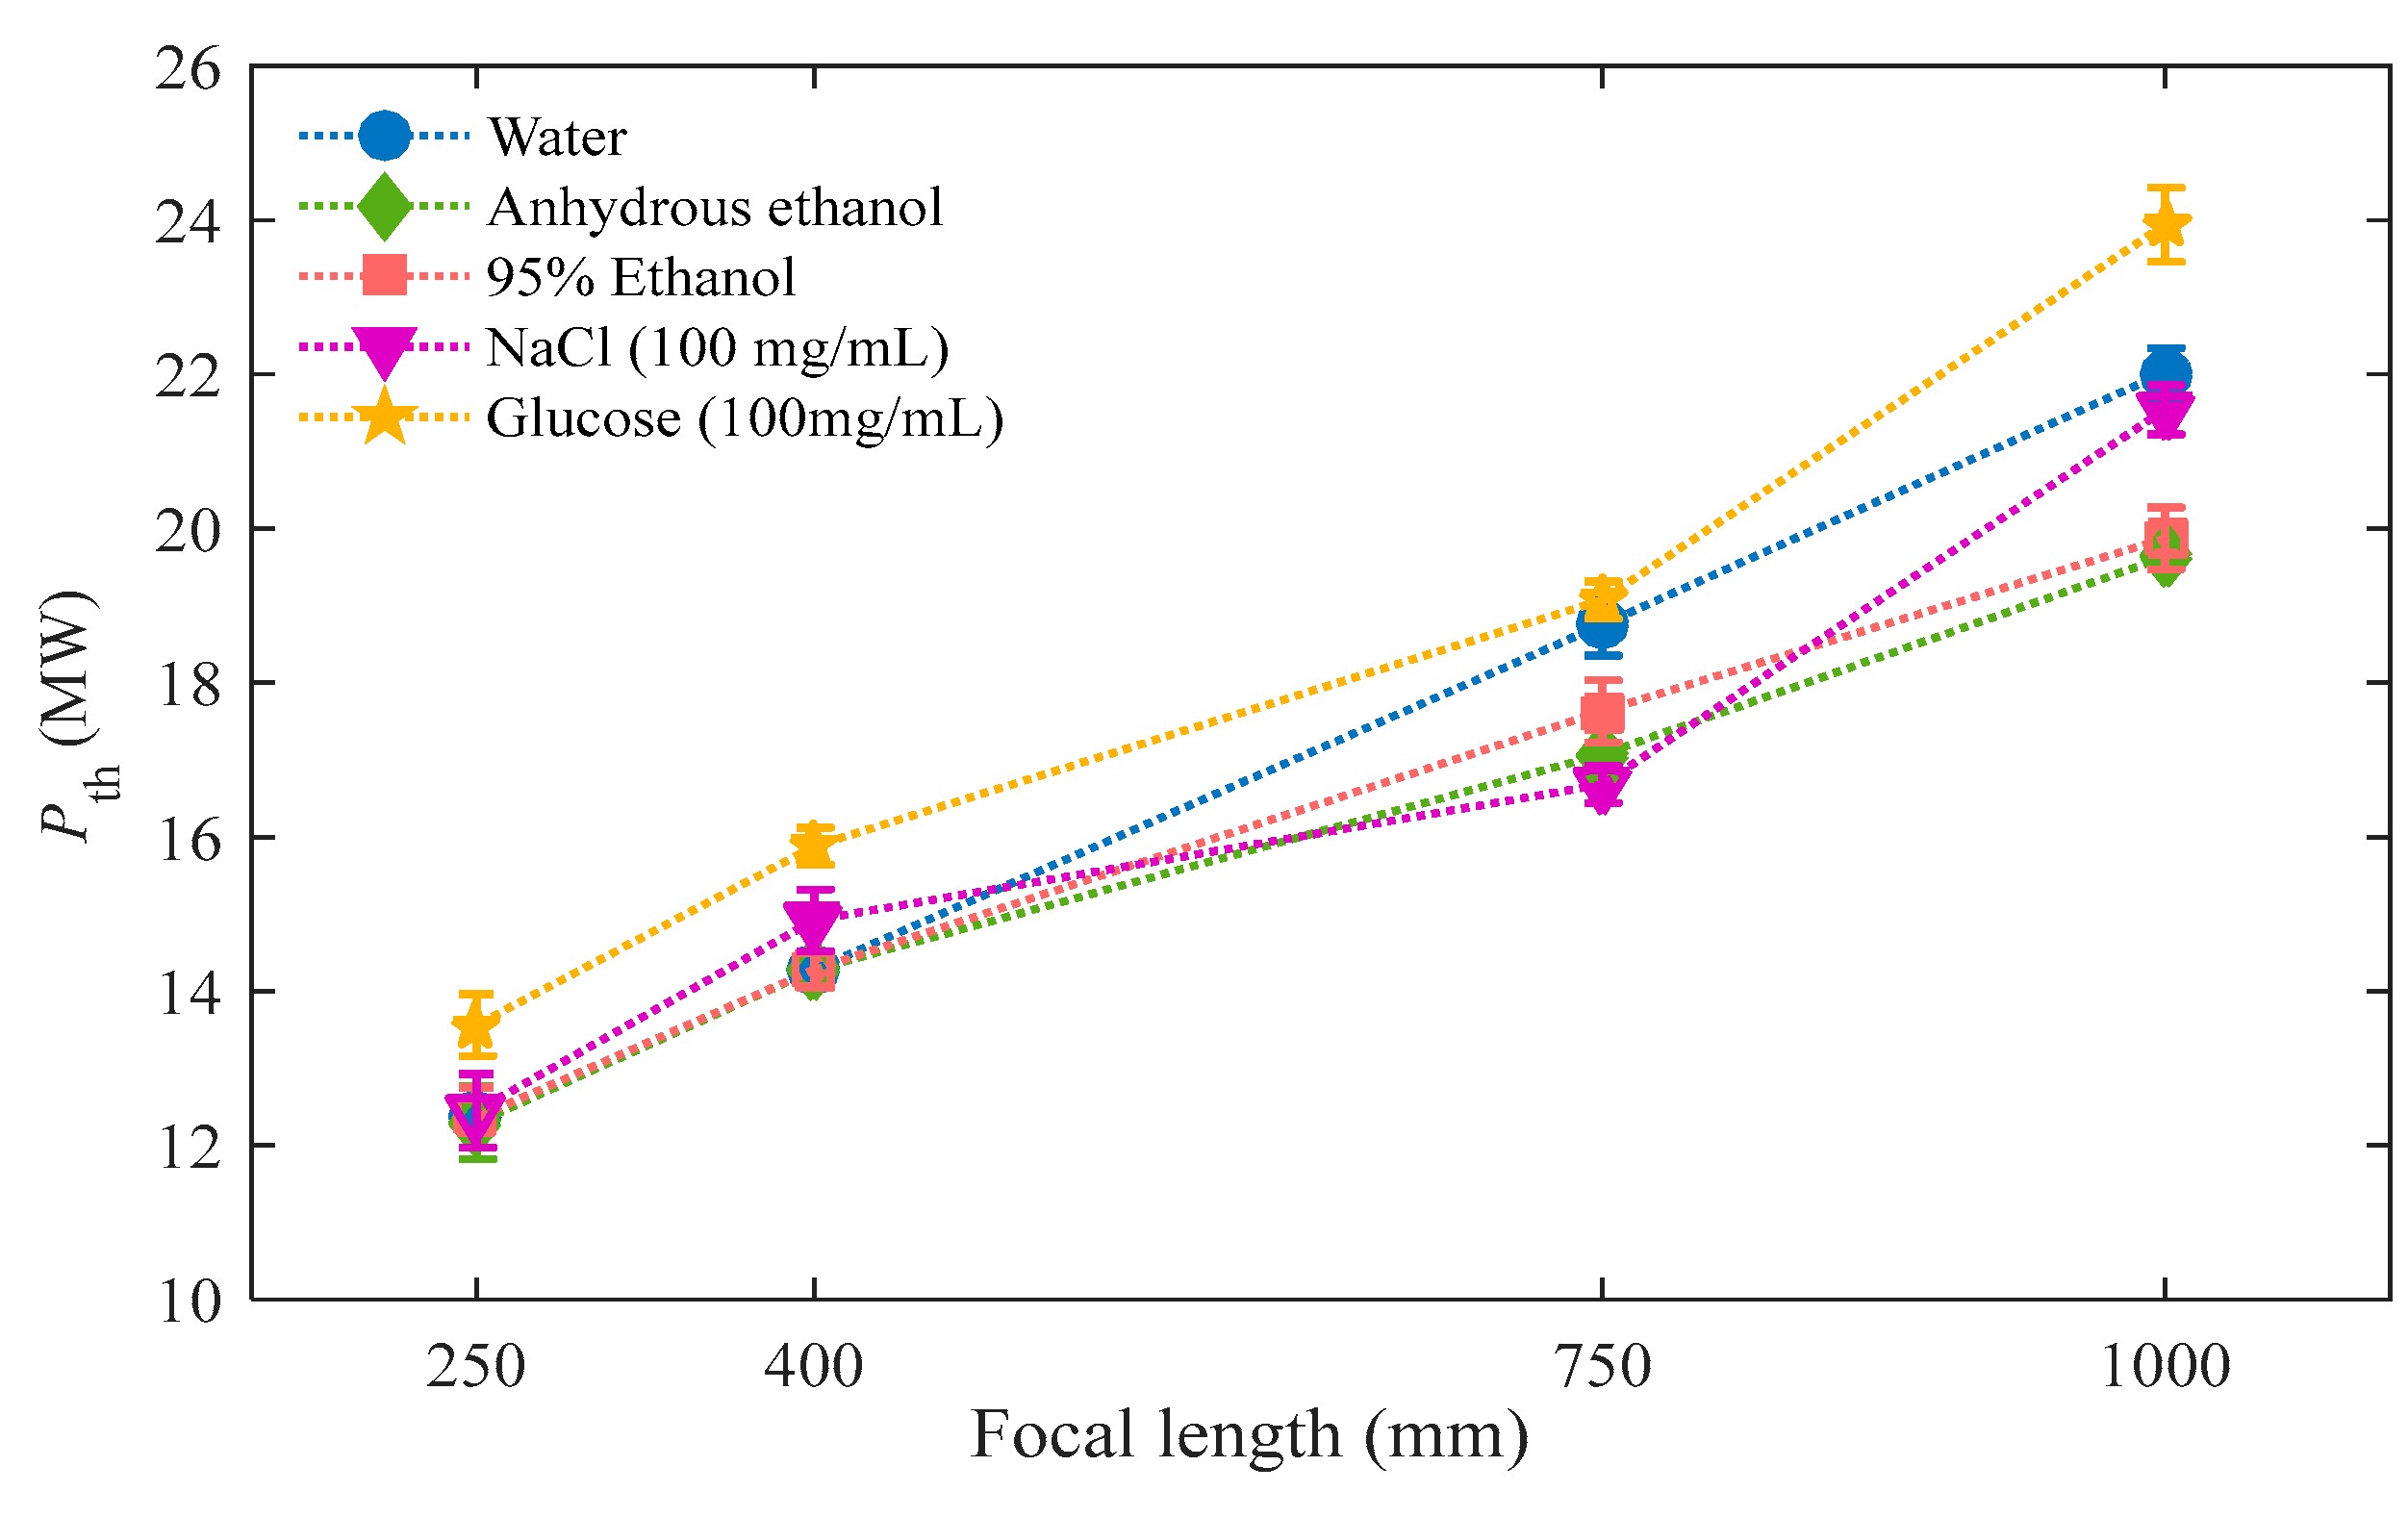
| Material | Pcr(MW) | Pth(MW) | |||||
|---|---|---|---|---|---|---|---|
| f = 1000 mm |
f = 750 mm |
f = 400 mm |
f = 250 mm |
||||
| Water | 1.33 | 4.1×10⁻¹⁶ | 1.76 | 22.02 | 18.67 | 14.20 | 12.45 |
| Anhydrous ethanol | 1.36 | 7.7×10⁻¹⁶ | 0.92 | 19.63 | 17.07 | 14.36 | 12.29 |
| 95% Ethanol | 1.3585 | 7.52×10⁻¹⁶ | 0.94 | 19.79 | 17.55 | 14.20 | 12.29 |
| NaCl (100 mg/mL) |
1.3521 | 21.54 | 16.76 | 14.84 | 12.45 | ||
| Glucose (100 mg/mL) |
1.3481 | 23.94 | 19.15 | 15.79 | 13.56 | ||
Disclaimer/Publisher’s Note: The statements, opinions and data contained in all publications are solely those of the individual author(s) and contributor(s) and not of MDPI and/or the editor(s). MDPI and/or the editor(s) disclaim responsibility for any injury to people or property resulting from any ideas, methods, instructions or products referred to in the content. |
© 2023 by the authors. Licensee MDPI, Basel, Switzerland. This article is an open access article distributed under the terms and conditions of the Creative Commons Attribution (CC BY) license (http://creativecommons.org/licenses/by/4.0/).


