1. Introduction
Sensor Data Fusion (SDF) is the combination of datasets from homogeneous or heterogeneous sensors in order to produce a complementary, cooperative or competitive outcome [
1]. Data from multiple sensors can also be fused for better accuracy and reliability [
2]. Processes involved in SDF depend primarily on the type of data and algorithms. The processes typically include data integration, aggregation, filtering, estimation and time synchronisation [
1].
1.1. Sensor Data Fusion Architectures
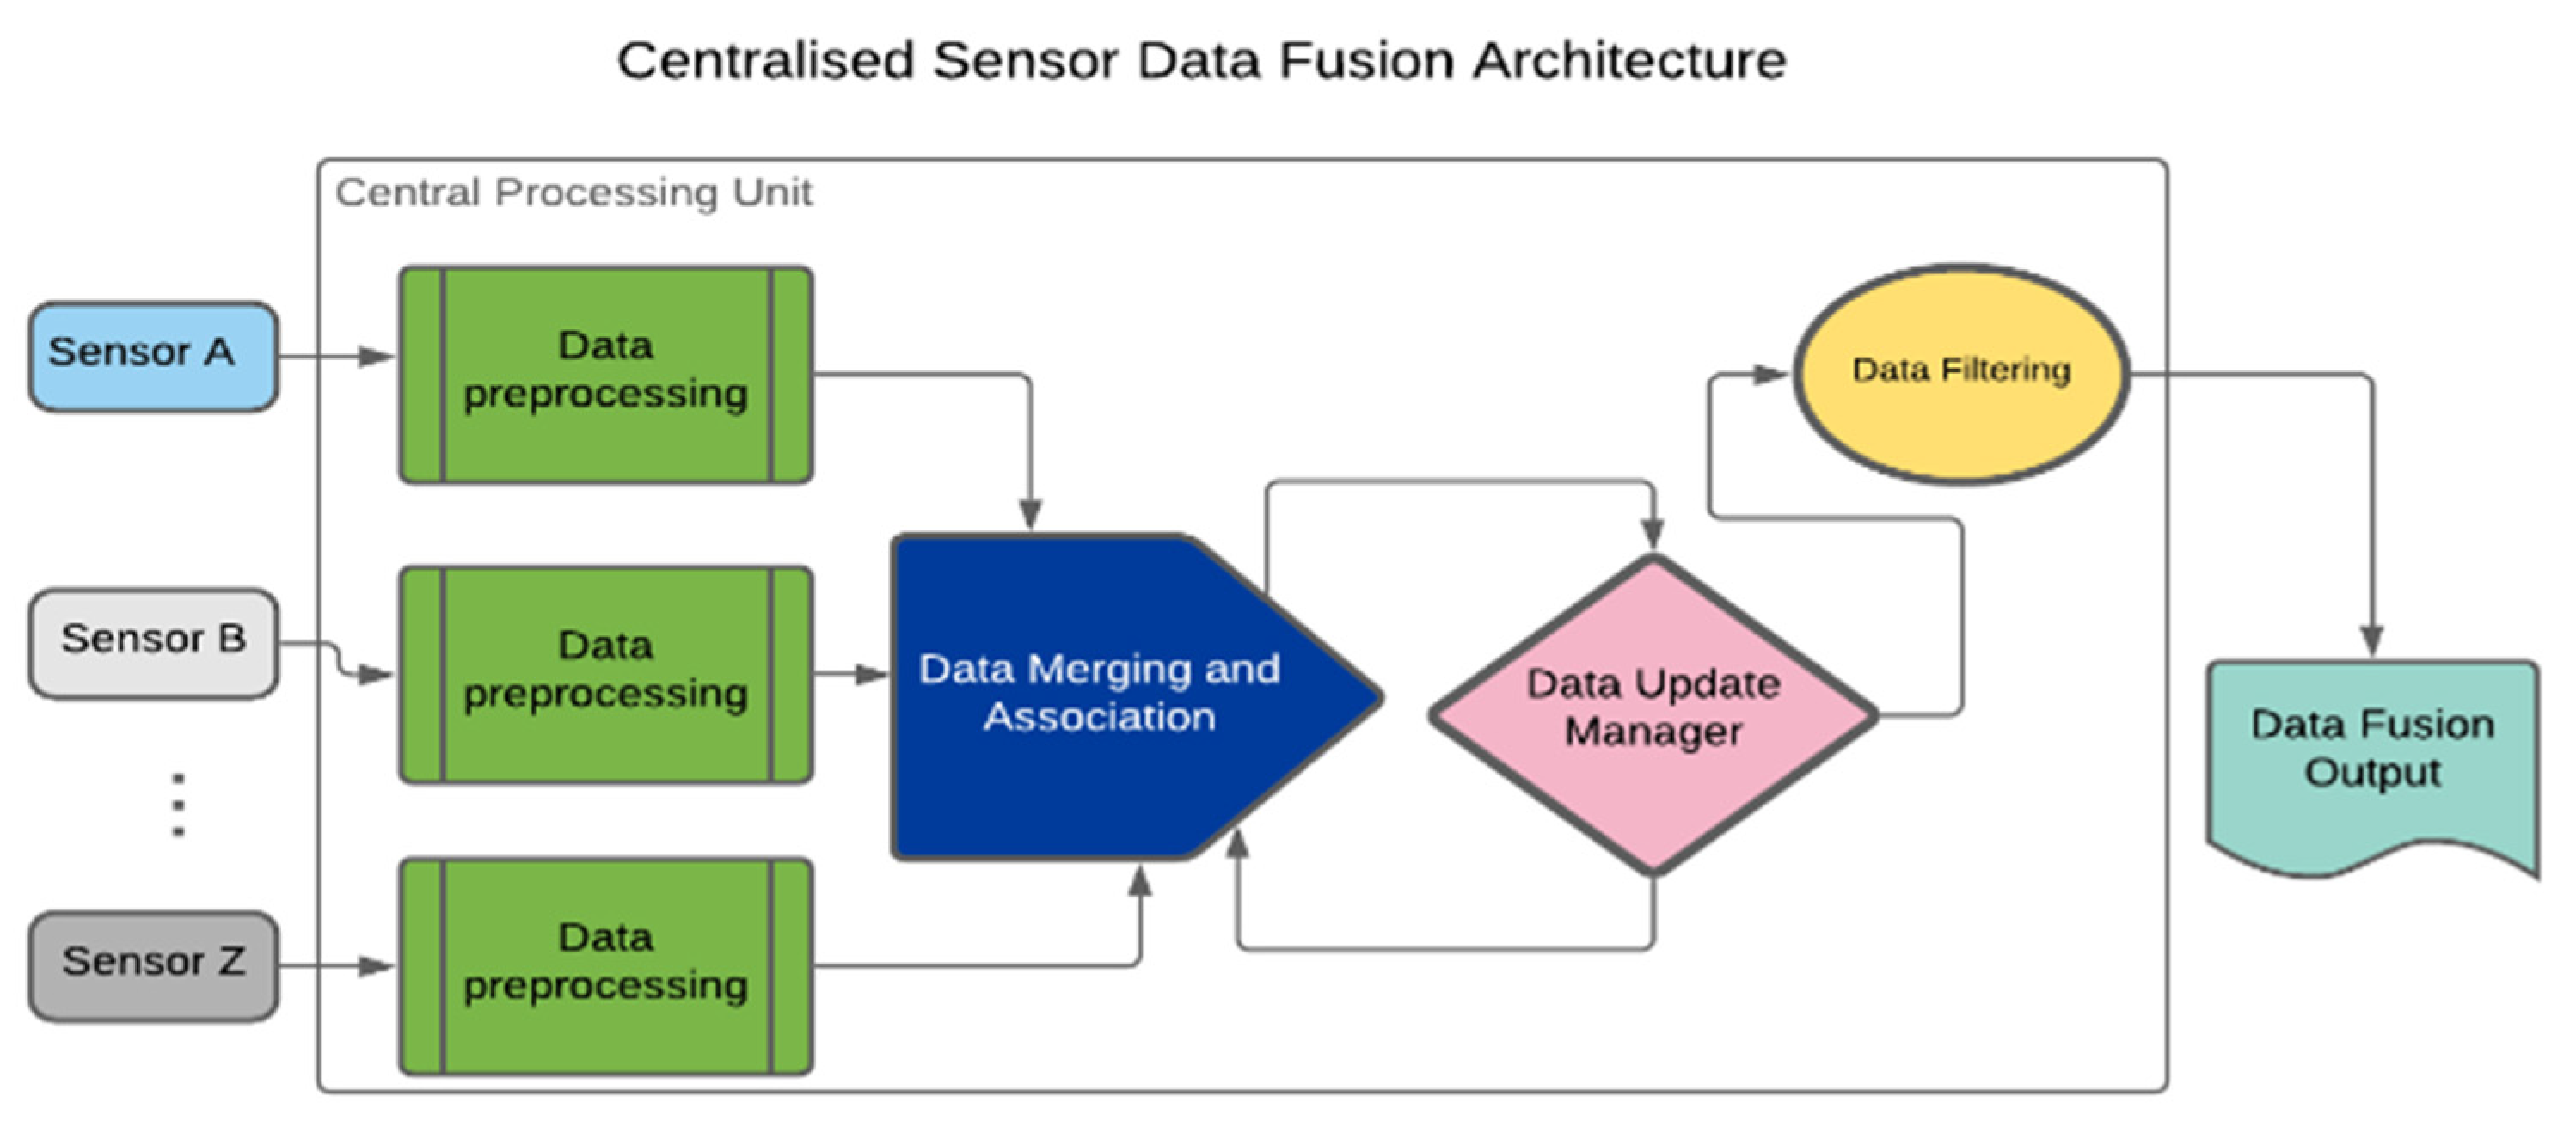
SDF architectures can be categorised into three broad groups to include centralised, distributed and hybrid architectures. The centralised architecture is often applied when dealing with homogeneous Sensing Solutions (SSs) [
3]. It involves time-based synchronisation, correction and transformation of all raw sensing data for central processing. Others include data merging and association, updating and filtering as presented in
Figure 1 [
4].
In
Figure 1, sensor data are pre-processed in the Central Processing Unit (CPU). The pre-processing procedures entail data cleaning and alignment. The data algorithm requires sub-processes such as data integration, aggregation and association. Moreover, a Data Update Manager (DUM) algorithm keeps a trail of changes in the output’s status. DUM is easily implemented in a centralised architecture because of the availability of all raw data in the CPU. Filtering and output prediction follow the data merging and association.
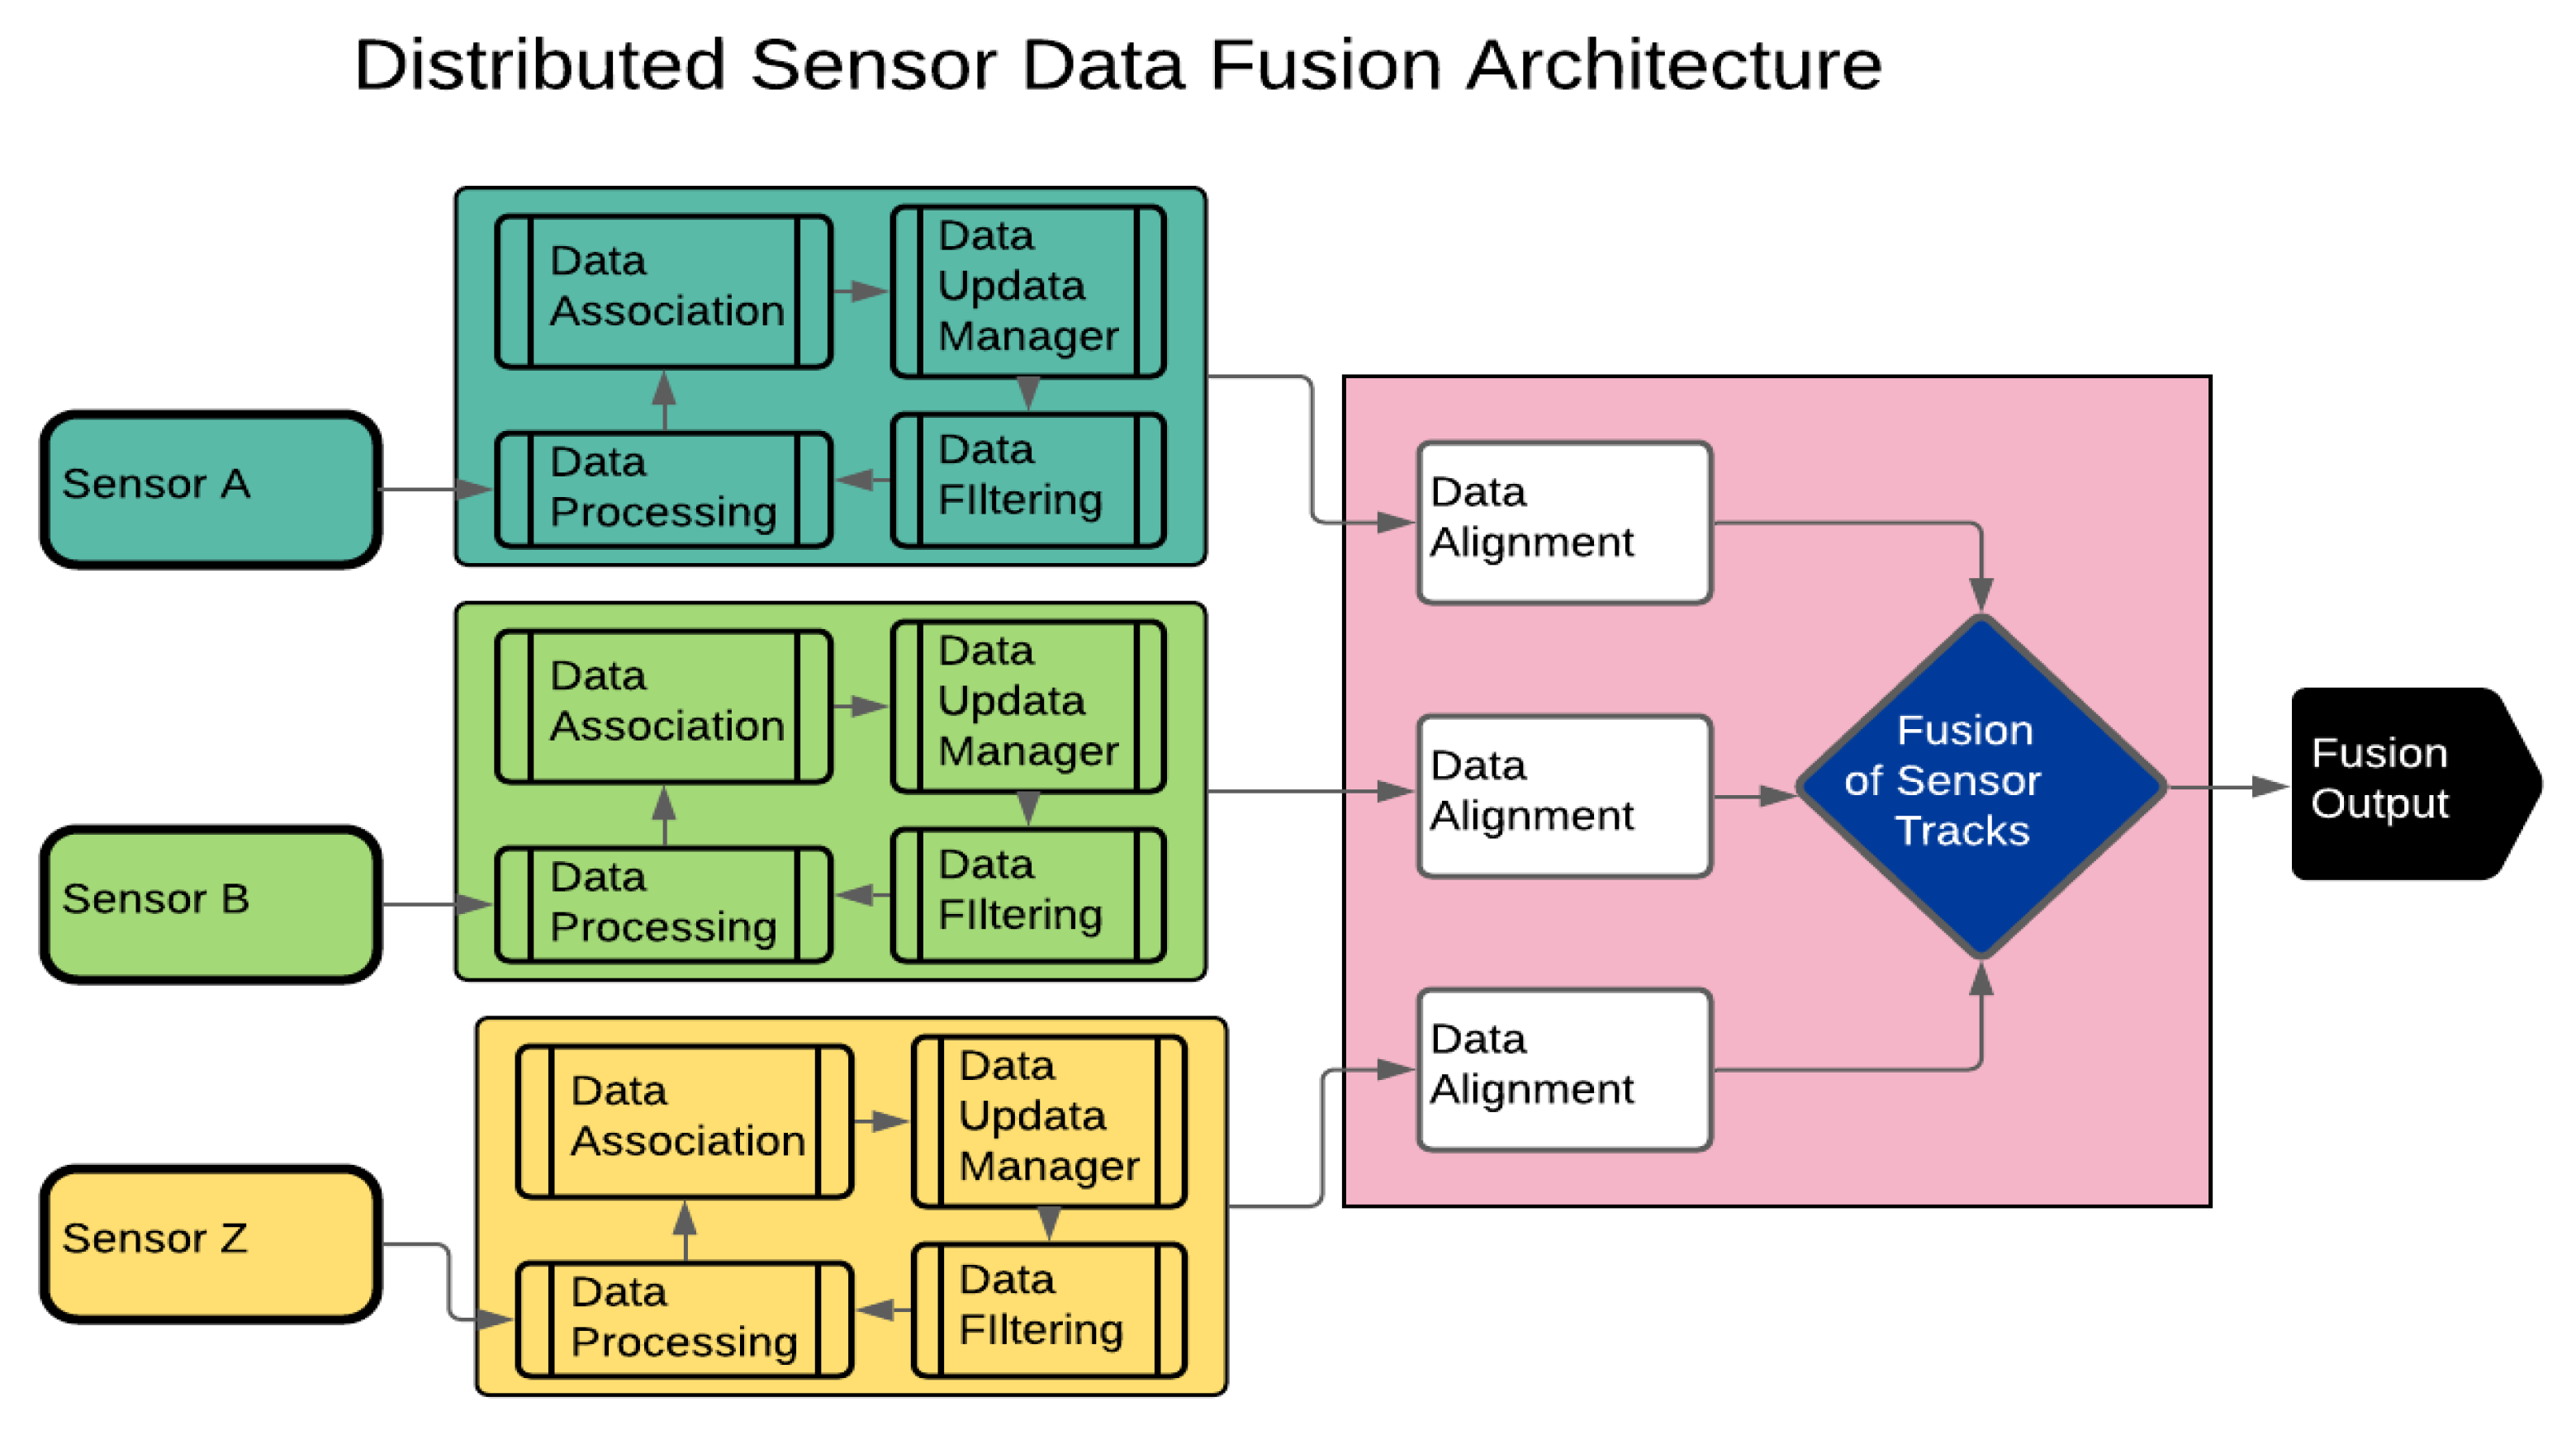
In a distributed SDF architecture, data pre-processing for each sensor takes place separately before the actual fusion process, as presented in
Figure 2. Unlike the centralised architecture, gating, association, local track management, filtration and prediction are performed locally for each sensor before fusion of the local tracks (
Figure 2) [
5]. This architecture is best suited for heterogeneous sensors with dissimilar data frames such as datasets from infrared and Radar sensors [
6]. Data filtering for each sensor associated with the distributed SDF architecture can be performed by Kalman Filter (KF), square-root information or extended KF [
7].
The hybrid SDF architecture unifies the attributes of centralised and distributed architectures. Their capabilities depend on computational workload, communication, and accuracy requirements. The hybrid SDF also has centralised architecture characteristics, such as accurate data association, data tracking and direct logic implementation. Nevertheless, it is complex and requires high data transfer between the central and local trackers compared with the centralised and the distributed architectures. SDF architectures can be implemented using Machine Learning (ML) and Data Mining (DM) algorithms.
1.2. Data Mining Concepts
DM is an iterative process for exploratory analysis of unstructured, multi-feature and varied datasets. It involves the use of machine learning, deep learning and statistical algorithms to determine patterns, clusters and classes in a dataset [
8]. The two standard analyses with the use of DM tools are descriptive and predictive [
9]. Whilst descriptive seeks to identify patterns in a dataset, the predictive analysis uses some variables in a dataset to envisage some undefined variables [
10].
DM can also be categorised into tasks, models, and methods. Tasks-based DM seeks to discover rules, perform predictive and descriptive modelling, and retrieve contents of interest. DM methods include clustering, classification, association and time-series analysis. Clustering is often used in descriptive research, while classification is always associated with predictive analysis [
10].
In DM, there is a slight distinction between classification and clustering. Classification is a supervised machine learning approach to group datasets into predefined classes or labels. On the other hand, clustering involves unlabelled data grouping based on similarities of instances such as inherent characteristics of the datasets [
10].
Table 1 presents an overview of classification and clustering techniques.
Data clustering techniques such as partitional, model-based and grid-based, density-based and hierarchical clustering can be used for data grouping [
8]. Whilst density-based approach is centred on the discovery of non-linear structures in datasets, model and grid-based methods utilise neural networks and grids creation, respectively. The Hierarchical Clustering Technique (HCT) involves the structural representation of datasets as binary trees based on similarities of instances. HCT also accommodates sub-clusters in nested arrangements. The two main approaches in HCT include division and agglomeration [
11].
Partitioning Clustering Technique (PCT) is a technique that groups data by optimising an objective function [
8]. PCT is a non-HCT technique that involves partition iterations to improve the accuracy of formed groups. A popular algorithm in PCT is the K-Means++ Algorithm (KMA) [
11]. KMA utilises uncovered characteristics in datasets to improve the similarities of instances. It also reduces data complexities by minimising their variance and noise components [
12].
Recent studies have suggested the use of a DM method known as Classification by Clustering (CbyC) [
13] for classifying unlabelled datasets. The CbyC method converges the algorithms used in data classification and clustering techniques for a systematic analysis of datasets. The basis for CbyC is to discover instance similarities instead of class labels, which are normally used in classification techniques. Also, the CbyC technique is an improvement on the traditional data clustering method, which involves pattern discovery and deviations from natural categories. One of the significant advantages of CbyC is that it saves time and cost for data labelling, especially in big data analysis [
13]. Although CbyC does not require class labels for its analysis, its outcome (clustered datasets) can be assigned labels for easy exploration. The present work leveraged the CbyC method to perform the clustering datasets from thermal and Radar SSs with the help of DM and ML algorithms.
The novel contributions of this work are four-fold: (i) presentation of online research findings on DM packages such as RapidMiner Studio, Anaconda, Weka, and Orange data mining software, (ii) homogeneous data analysis involving binary data from thermal sensors with the software packages, (iii) heterogeneous data analysis involving thermal sensor’s binary data and Radar sensor’s datasets such as speed, Range of Motion (RoM) and the Angle of Approach or Retreat (AAR), and (iv) detailed analysis of the proposed SDF framework.
The remainder of the paper is organised as follows.
Section 2 discusses related work on the application of SDF, ML and DM algorithms;
Section 3 presents the materials and methods used in this study;
Section 4 presents the conceptual and experimental results, and a detailed analysis of the preferred DM software package;
Section 5 discusses findings from the study and
Section 6 presents the conclusion of the study.
2. Related Work
SDF algorithms and methods have been utilised in many applications ranging from automobiles to healthcare systems. Kim et al. [
14] proposed a Radar and Infrared sensor fusion system for object detection based on a Radar ranging concept, which required the use of a calibrated infrared camera alongside the Levenberg-Marquardt optimisation method. The purpose of using dual sensors in [
14] was to compensate for the deficiencies of each sensor used in the experiment. The implementation of the fusion system was performed on a car with magenta and green cross marks as calibrated points (in meters) positioned at different distances. The performance of this experiment using the fusion of sensor data was rated 13 times better compared with baseline methods. Work in [
15] proposed the fusion of LiDAR and vision sensors for a multi-channel environment detection system. The fusion algorithm enabled image calibration to remove distortion. The study indicated improved performance in terms of communication reliability and stability compared with non-fusion-based approaches.
In automated vehicles with driver assist systems, data from front-facing cameras such as vision, LiDAR, Radar, and infrared sensors are combined for collision avoidance; and pedestrian, obstacle, distance and speed detection [
16]. The multi-sensor fusion enhanced the redundancy of measured parameters to improve safety since measurement metrics are inferred from multiple sensors before actions are taken. A multimodal advanced driver assist system simultaneously monitors driver’s behaviour to predict risky behaviours that can result in road accidents [
16]. Other LiDAR-based sensor fusion research included the use of vision sensors to enhance environmental visualisation [
17].
Ultrasonic sensors can also be fused with other types of sensors to increase their precision and accuracy. Kovacs and Nagy [
18] investigated the use of an ultrasonic echolocation based aid for the visually impaired using a mathematical model which allowed the fusion of as many sensors as possible, notwithstanding their positions or formations. Another study by [
19] proposed a gas leak detection system based on SDF. Chen and Wang [
20] researched the fusion of an ultrasonic and infrared sensor using the Support Vector Machine (SVM) learning approach. The study used SDF to improve fall detection accuracy by more than 20% compared with a stand-alone sensor on continuous data acquisition.
Huang et al. [
21] proposed the fusion of images from a depth sensor and a hyperspectral camera to improve high-throughput phenotyping. The initial results from the technique indicated more accurate information capable of enhancing the precision of the process. Other studies on the fusion of depth with other SSs can be found in [
22,
23,
24]. The work in [
25] involved gait parameters measurement of people with Parkinson disease, by the fusion of depth and vision sensor systems. An accuracy of more than 90% was obtained in the study. Also, in Kepski and Kwolek [
26], data from a body-worn accelerometer was fused with depth maps metrics from depth sensors to predict falls in ageing adults. The proposed method was highly efficient and reliable, showing the added advantages of sensor fusion. Work in [
27] proposed the fusion of an RGB-depth and millimetre wave Radar sensor to assist the visually impaired. Experimental results from the study indicated the extension of the effective range of the sensors and, more importantly, multiple object detection at different angles.
The integration of SDF algorithms with ML and DM models can help predict risky behaviours and accidents [
20,
28,
29,
30,
31]. Work in [
32] discussed the use of Cluster-Based Analysis (CBA) for a data-driven correlation of ageing adults that required hip replacement in Ireland. Experimental results from the study suggested three distinct clusters with respect to patients’ characteristics and care-related issues. In [
33], data evaluation using CBA helped in clustering healthcare records such as illness and treatment methods. A combined method, including CBA for user activity recognition in smart homes was proposed in [
34]. Experimental results indicated higher probabilities for activity recognition owing to the use of a combination of K-pattern and artificial neural network. Work in [
35,
36,
37] proposed the use CBA method in health related data analysis. Experimental results indicated the suitability of the method for pattern identification and recognition in datasets.
The present work considers a cluster-based data fusion technique with the help of DM software packages, namely, Anaconda, RapidMiner Studio (RMS), Weka DM Software (WDMS) and Orange DM Software (ODMS). The rationale for using these packages includes analytical data workflows, interactive data visualisation and predictive capabilities. Others include the ability of their algorithms to discover patterns in binary and greyscale images, unsupervised learning capabilities, ease of use and the integration of ML algorithms.
3. Materials and Methods
The methods used in our work include: first, conceptual and evaluation methods to select a suitable software package from a list including WDMS, RMS, Anaconda and ODMS. Second, data analysis using the software packages. Third, a detailed description and evaluation of the proposed framework.
Whilst the conceptual methodology informed the initial selection of software packages for the research, the experimental methodology was adopted for testing with real data obtained during sprained ankle rehabilitation exercises. The basis for the preliminary consideration of the software packages include the ability to recognise and categorise binary images, unsupervised feature extraction [
38], CbyC capabilities [
11,
13,
39], and ease of data fusion. The experimental methodology involved data collection processes with the aid of single, homogeneous and heterogenous USSs.
Qualitative data [
40,
41,
42] such as postural orientations and actions in the form of binary images acquired with a thermal SS were utilised in this work. The rationale for using binary images for this study was to protect the privacy of occupants. Further, binary images posed peculiar challenges in the implementation of AI in healthcare datasets [
43,
44] when compared with RGB and greyscale images. Therefore, the ability of a software package to perform CBA with binary images was one of the requirements for suitability to this framework. Likewise, binary images were considered suitable given they require less storage space [
45].
Data gleaned from the Radar and the Infrared Thermopile Array (ITA) thermal sensors were analysed using the selected software packages, namely, RMS, WDMS, and ODMS. The WDMS is a Java-based package, whilst RMS and ODMS are Python-oriented. DM and ML models such as Random Forest (RF), Decision Tree (DT), AdaBoost, Logistic Regression (LR), Support Vector Machine (SVM), Stochastic Gradient Descent (SGD) and Naïve Bayes were used to compute the Classification Accuracy (CA) metrics of the packages. Whilst binary images were gleaned from a 32 by 32 thermal sensor, speed, RoM and AAR metrics, recorded during Lower Extremity Rehabilitation Exercises Monitoring (LEREM) were obtained from a Radar sensor. Both the thermal and the Radar generated timestamps that were used as basis for the data fusion. The study aimed to: (i) perform a CbyC on homogeneous and heterogeneous datasets using selected software packages, (ii) rate the accuracy metrics of the packages using ML algorithms, and (iii) evaluate the software package based on their ease of use, and feature extraction capabilities, amongst others. The experimental procedure was considered in two iterations, namely, homogenous, and heterogeneous iterations.
The homogenous iteration included the thermal images gleaned from lateral and ceiling ITA thermal SSs. In this pathway, 574 binary images from each ITA sensor were used. These images were sorted based on their timestamps. Three software packages (ODMS, WDMS and RMS) were used to analyse the images. Moreover, cluster-based 10-fold cross-validation and prediction were performed on the images using DM and ML models.
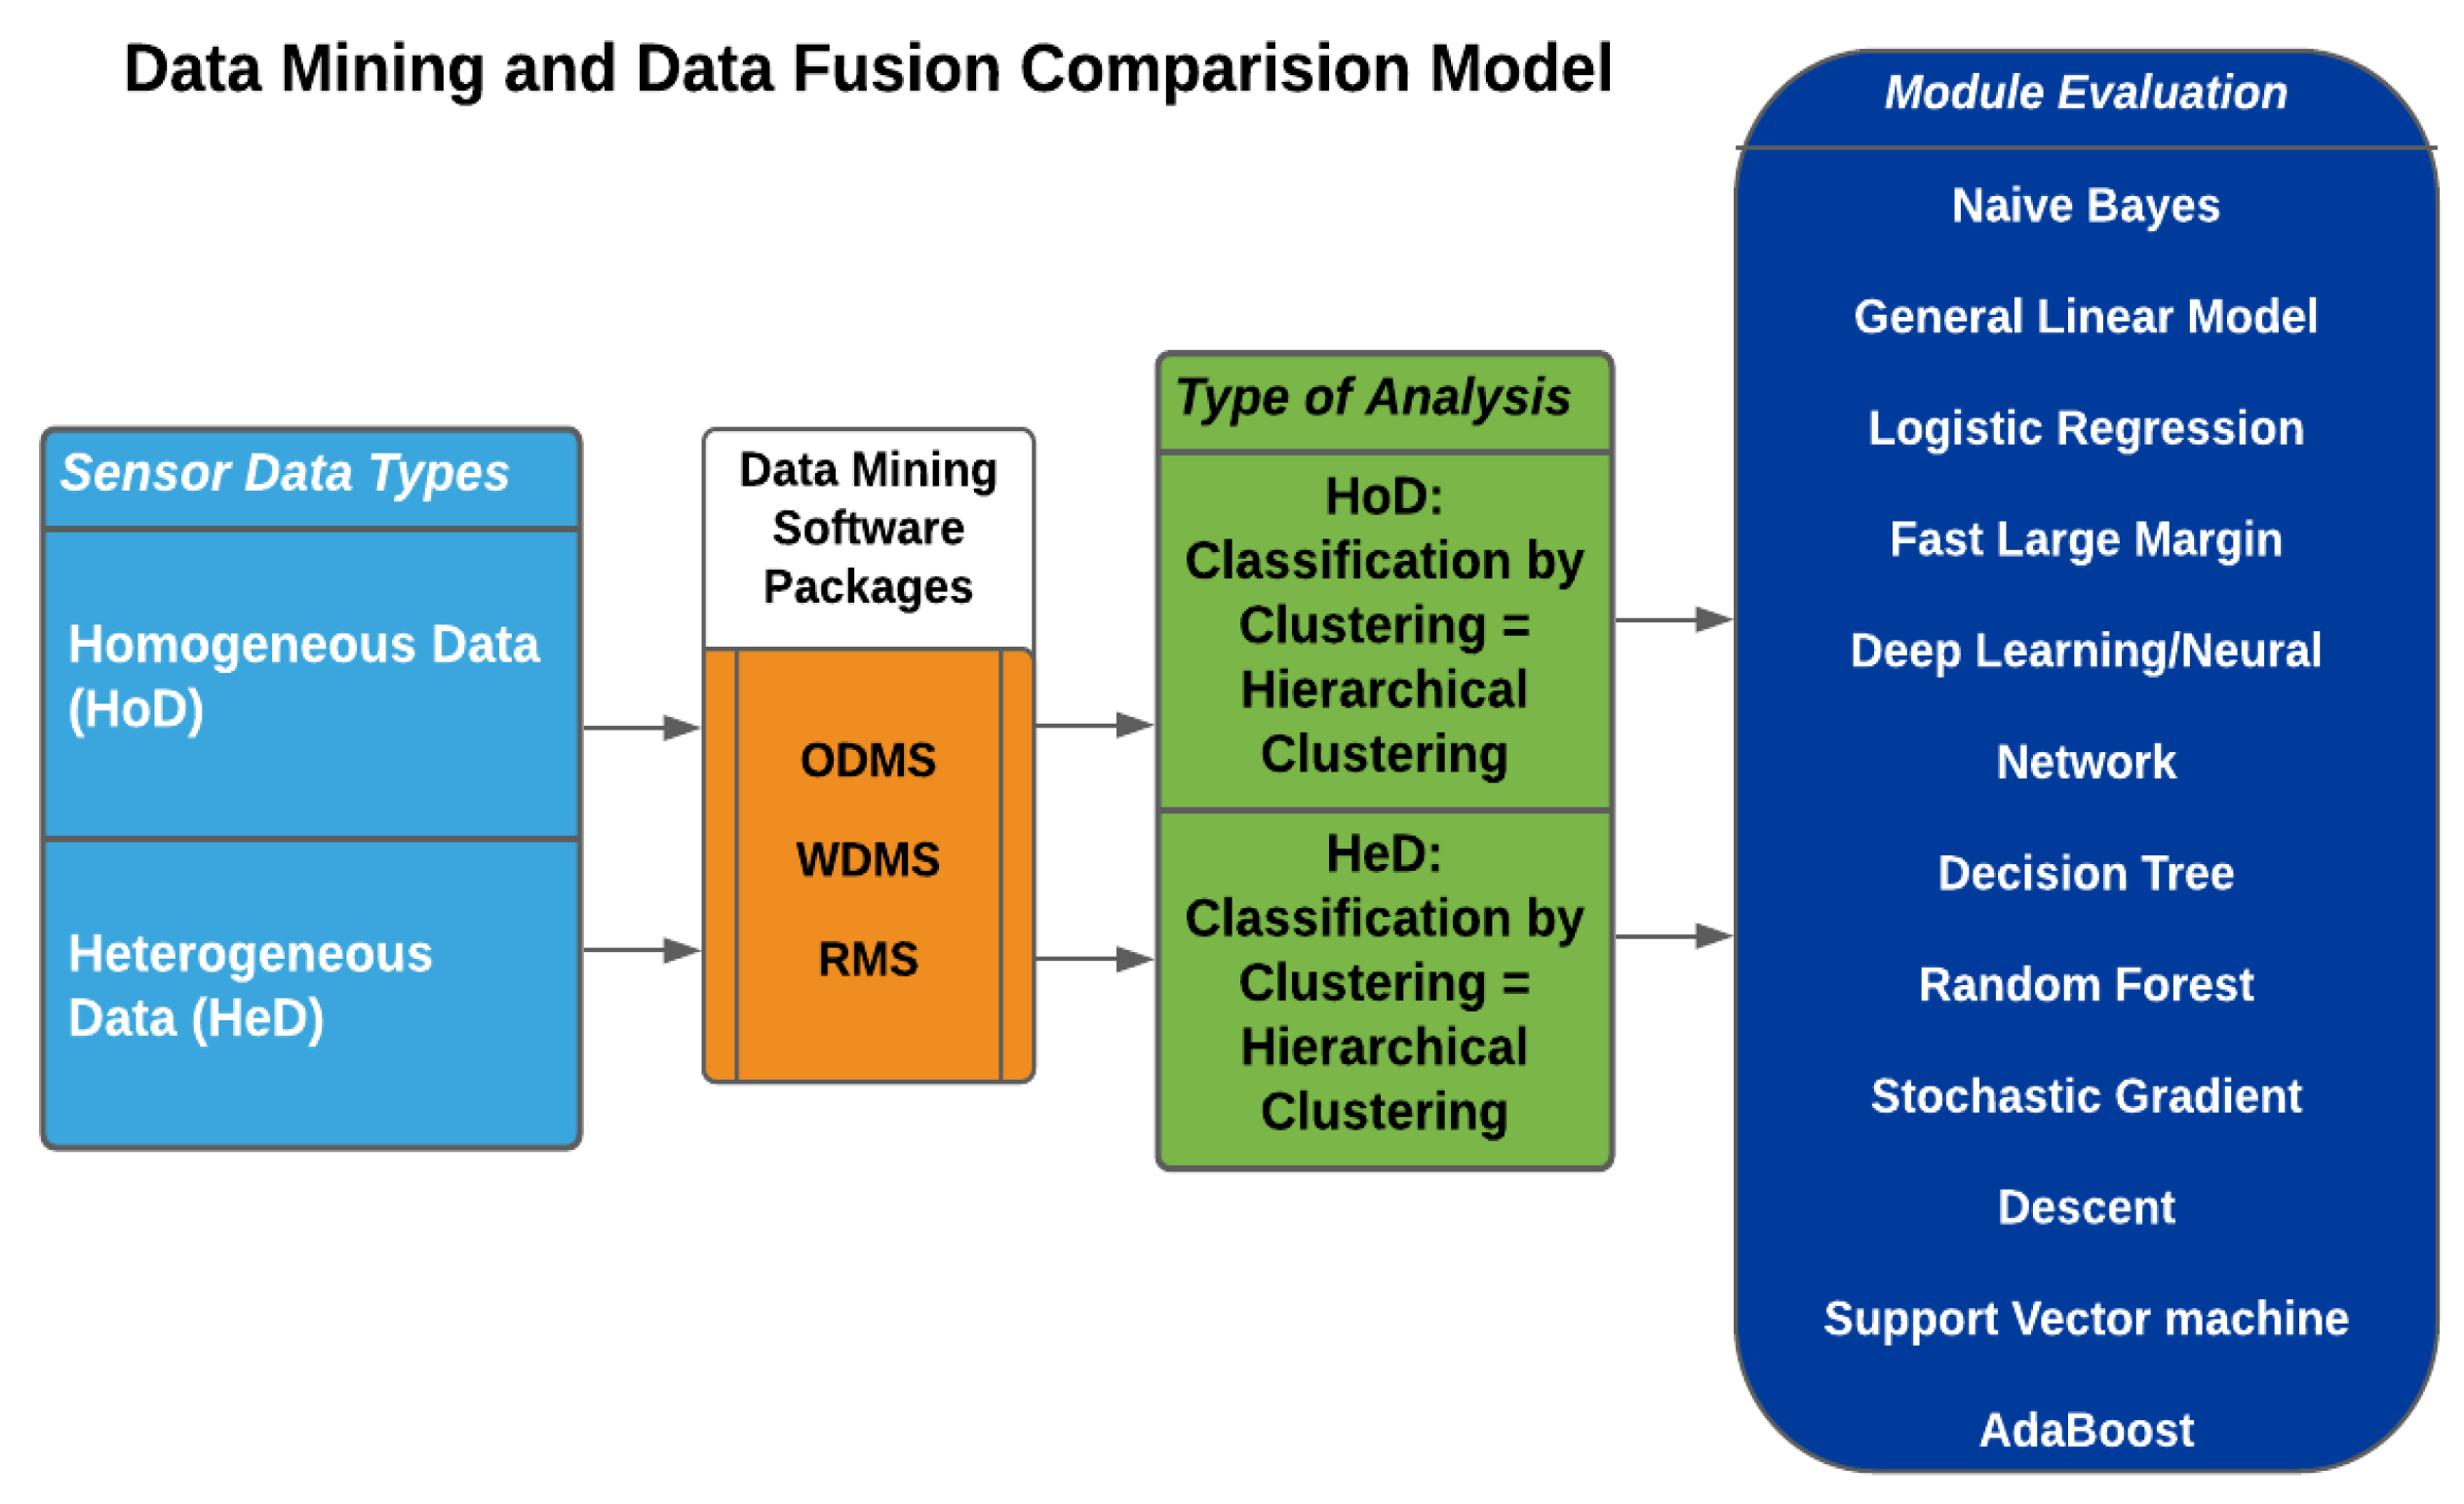
The heterogeneous iteration entailed 574 binary images and 1,722 (574 rows x 3 columns) Radar sensor datasets. The datasets were uploaded to the software packages through their respective data import interfaces. Whilst heterogeneous dataset fusion using WDMS was challenging with their Java-based algorithm, the process was seamless using the ODMS package. A diagram of the ODMS model is presented in
Figure 3.
In
Figure 3, the binary images were uploaded to the ODMS workbench directly from folders and sub-folders. Contrarywise, WDMS requires them to be uploaded in a CSV, ARFF, etc., file format. Preparing these files by hand takes a lot of time, however, with the help of the MATLAB application or ODMS, the information was easily extracted from image folders. In the same vein, RMS required a CSV or other type of file rather than a direct image upload from folders. The data upload process underscores one of the advantages of the ODMS over WDMS and RMS.
Feature extraction from the binary images for all the packages was performed in ODMS. This is because the generic features generated by WDMS and RMS did not contain details such as image size, width, height, and other metrics necessary for a proper CBA. Also, whilst the WDMS could extract only ten generic features at each instance, the ODMS extracted up to 1,000 features from each binary image in addition to image length, width, height.
4. Results
Results from this study are presented in four-fold: (i) conceptual findings, (ii) homogeneous experimental analysis, (iii) heterogeneous experimental analysis, and (iv) detailed description and analysis of the proposed SDF framework.
4.1. Conceptual Findings
Research findings by Predictive Analysis Today (PAT) [
46] included DM tools rating based on their ease of use, performance index, functionality and feature management, availability of advanced features and user experience. The ratings are presented in
Table 2.
From
Table 2, ODMS has the highest average rating of 94.2%, followed by RMS, 90.2% and WDMS, 88.2%. Anaconda is rated the least with 77.2%, hence, it was not considered for further data analysis in this study. Whilst RMS has the best rating in terms of its functionality as 96%, ODMS and WDMS were rated 95% and 92% for functionality, respectively. Ease of use and user implementation were best rated in ODMS as 96% and 90% compared with other packages.
4.2. Homogeneous Data Analysis
The initial observation indicated that data fusion tools such as merge and union performed well in ODMS and RMS, respectively. WDMS and RMS, however, were unable to work with the data directly. Hence, their data were arranged in a CSV file before being analysed on their respective platforms. Moreover, a 10-fold cross-validation CbyC was performed on the data following normalisation using the DM models.
The CA from the first iteration involving homogeneous data fusion is presented in
Table 3.
The results presented in
Table 3 show that ODMS has an average accuracy of 84.7%, followed by WDMS, 76.2%, and RMS, 72.0%. A further breakdown of the results shows that ODMS has the highest accuracy of more than 94.0% in 4 models. RMS and WDMS, however, scored less than 90.0% in all their models. The performance of these models in different software packages was attributed to the number of inherent computational resources that were available in the packages. This property of a model is referred to as model efficiency. Hence, LR, SGD, SVM, and NN models were very efficient in ODMS in processing binary data such as was used in this study.
4.3. Heterogeneous Data Analysis
Metrics such as Naïve Bayes, Generalised Linear Model, Fast Large Margin, amongst others were used for the heterogeneous data analysis. A detailed breakdown of the data import process is presented in sub-section D. The accuracy values of the models are presented in
Table 4.
From
Table 4, ODMS has the highest average accuracy of 95.7%, while WDMS and RMS had 64.7% and 59.7% accuracies, respectively. DT and CN2 induction obtained 99.5% accuracy each in ODMS. CN2 induction is an algorithm that is designed to classify an imperfect set of data [
45]. Also, while the least accuracy value was 80.7% in ODMS, the highest accuracy values in WDMS and RMS were 70.0% and 62.2%, respectively. Due to the many advantages of the ODMS (as presented in this study and other relevant literature [
45]), the SDF framework proposed in this work leveraged the ODMS software package.
4.4. Proposed Data Fusion Framework
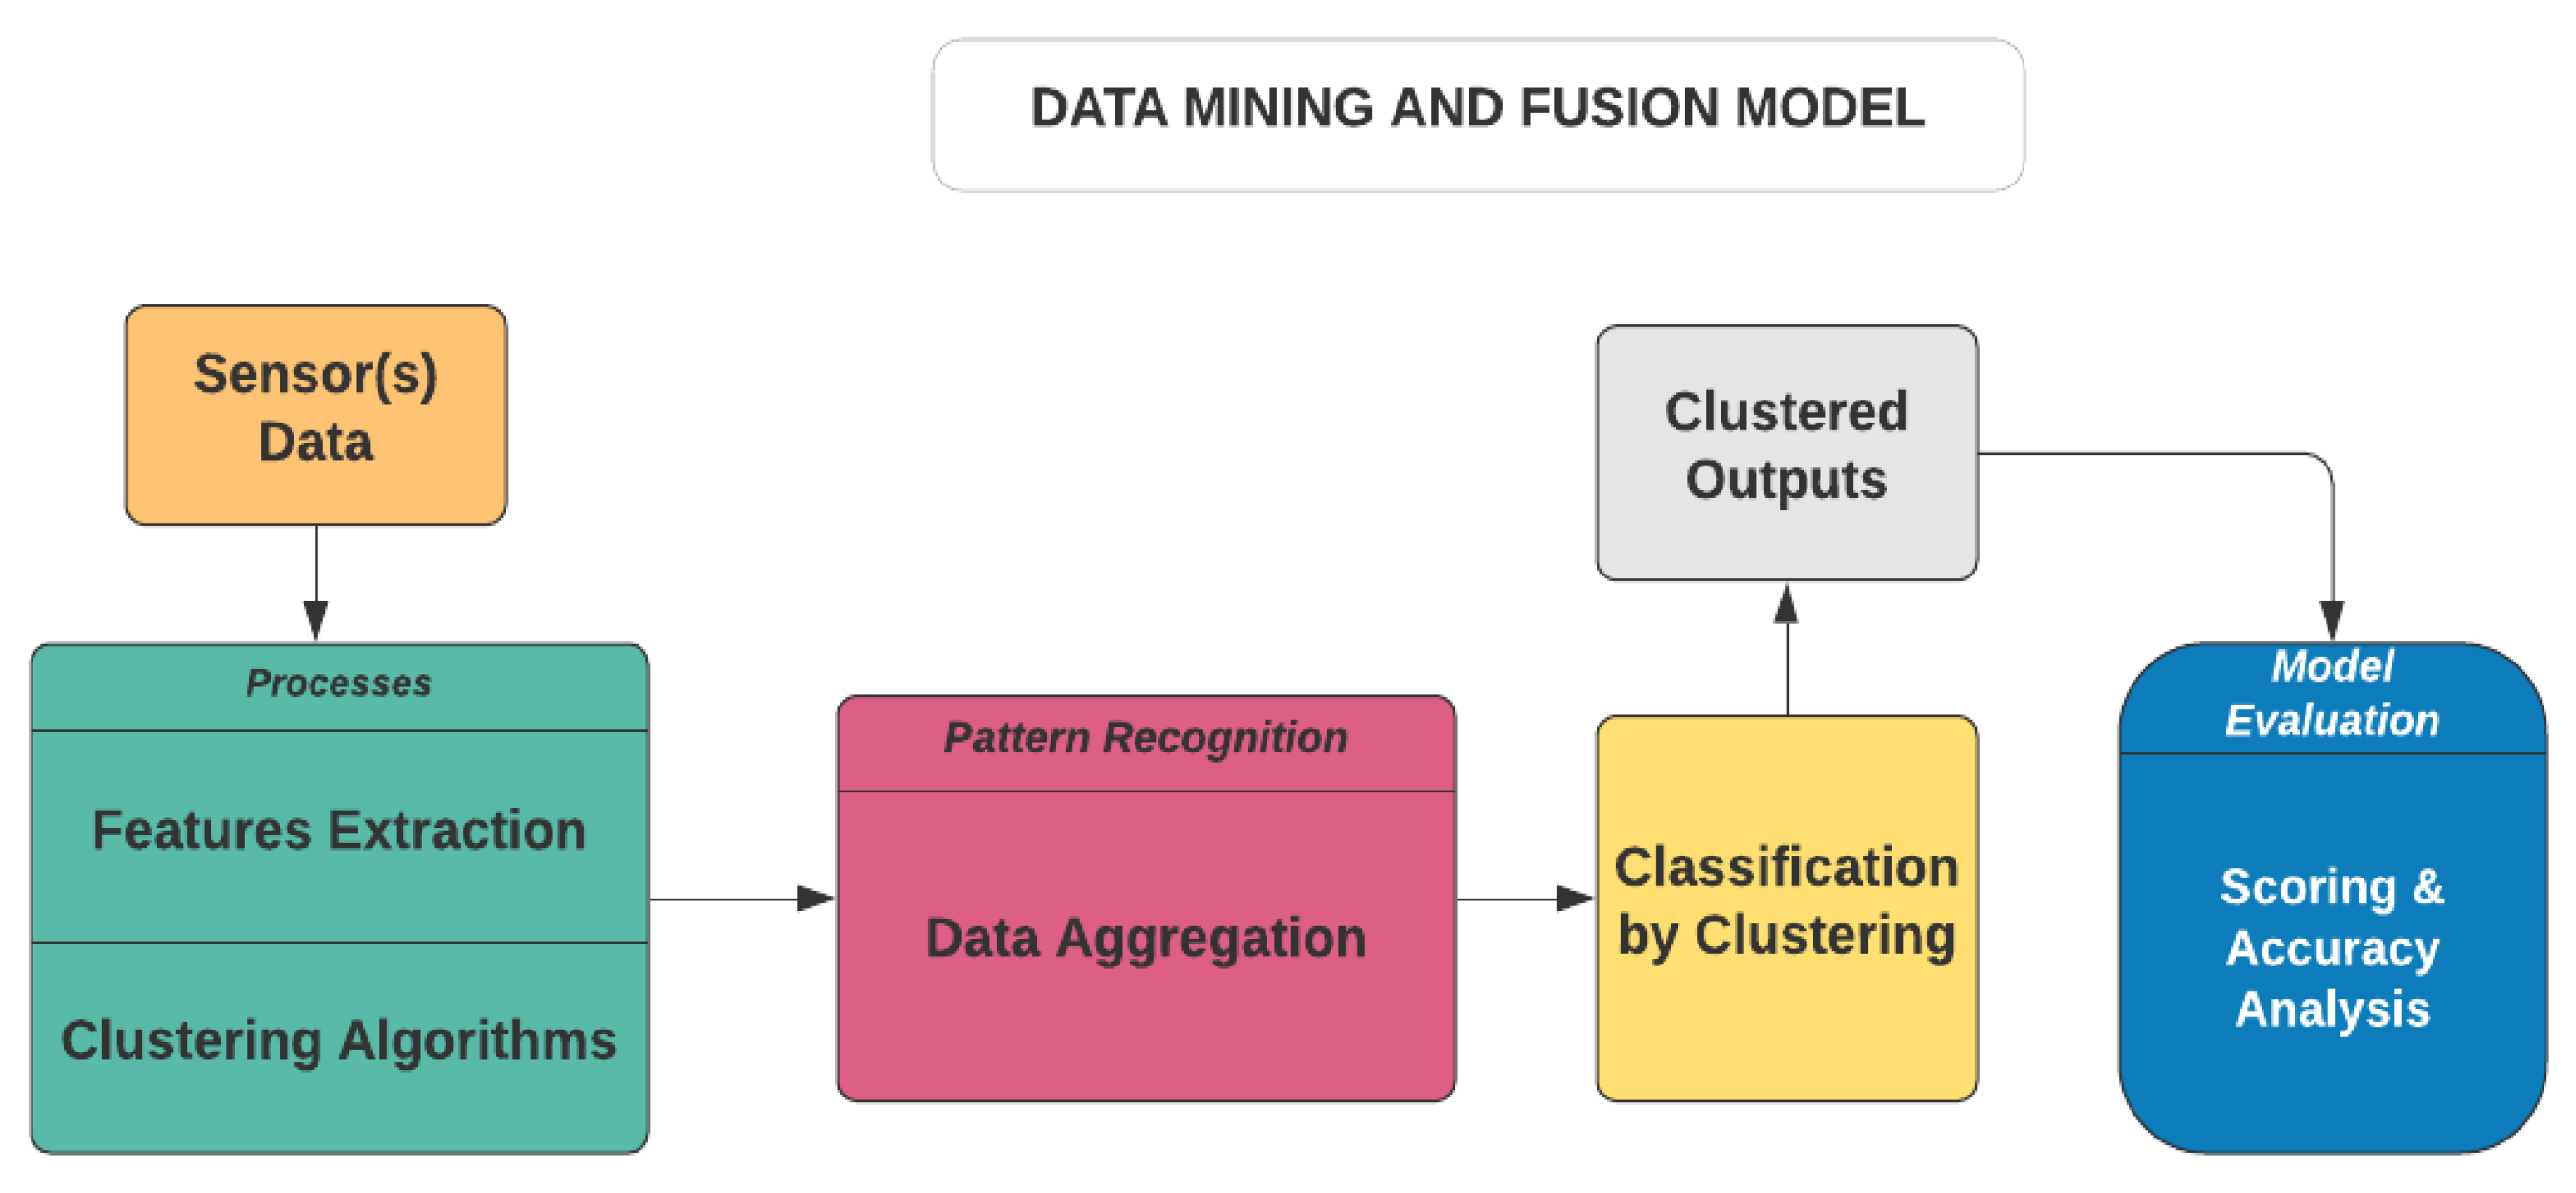
The ODMS is an open-source data analytics and visualisation tool. It is based on the visual design layout and Python scripting. It consists of DM and ML algorithms that extend its functionality. The data component layout consists of a file toolkit, CSV file import, pivot table, Python script and datasets toolkits. It can be used for distributed CbyC processes which are fundamentally based on HCA and KMA. A simplified description of the proposed framework is presented in
Figure 4.
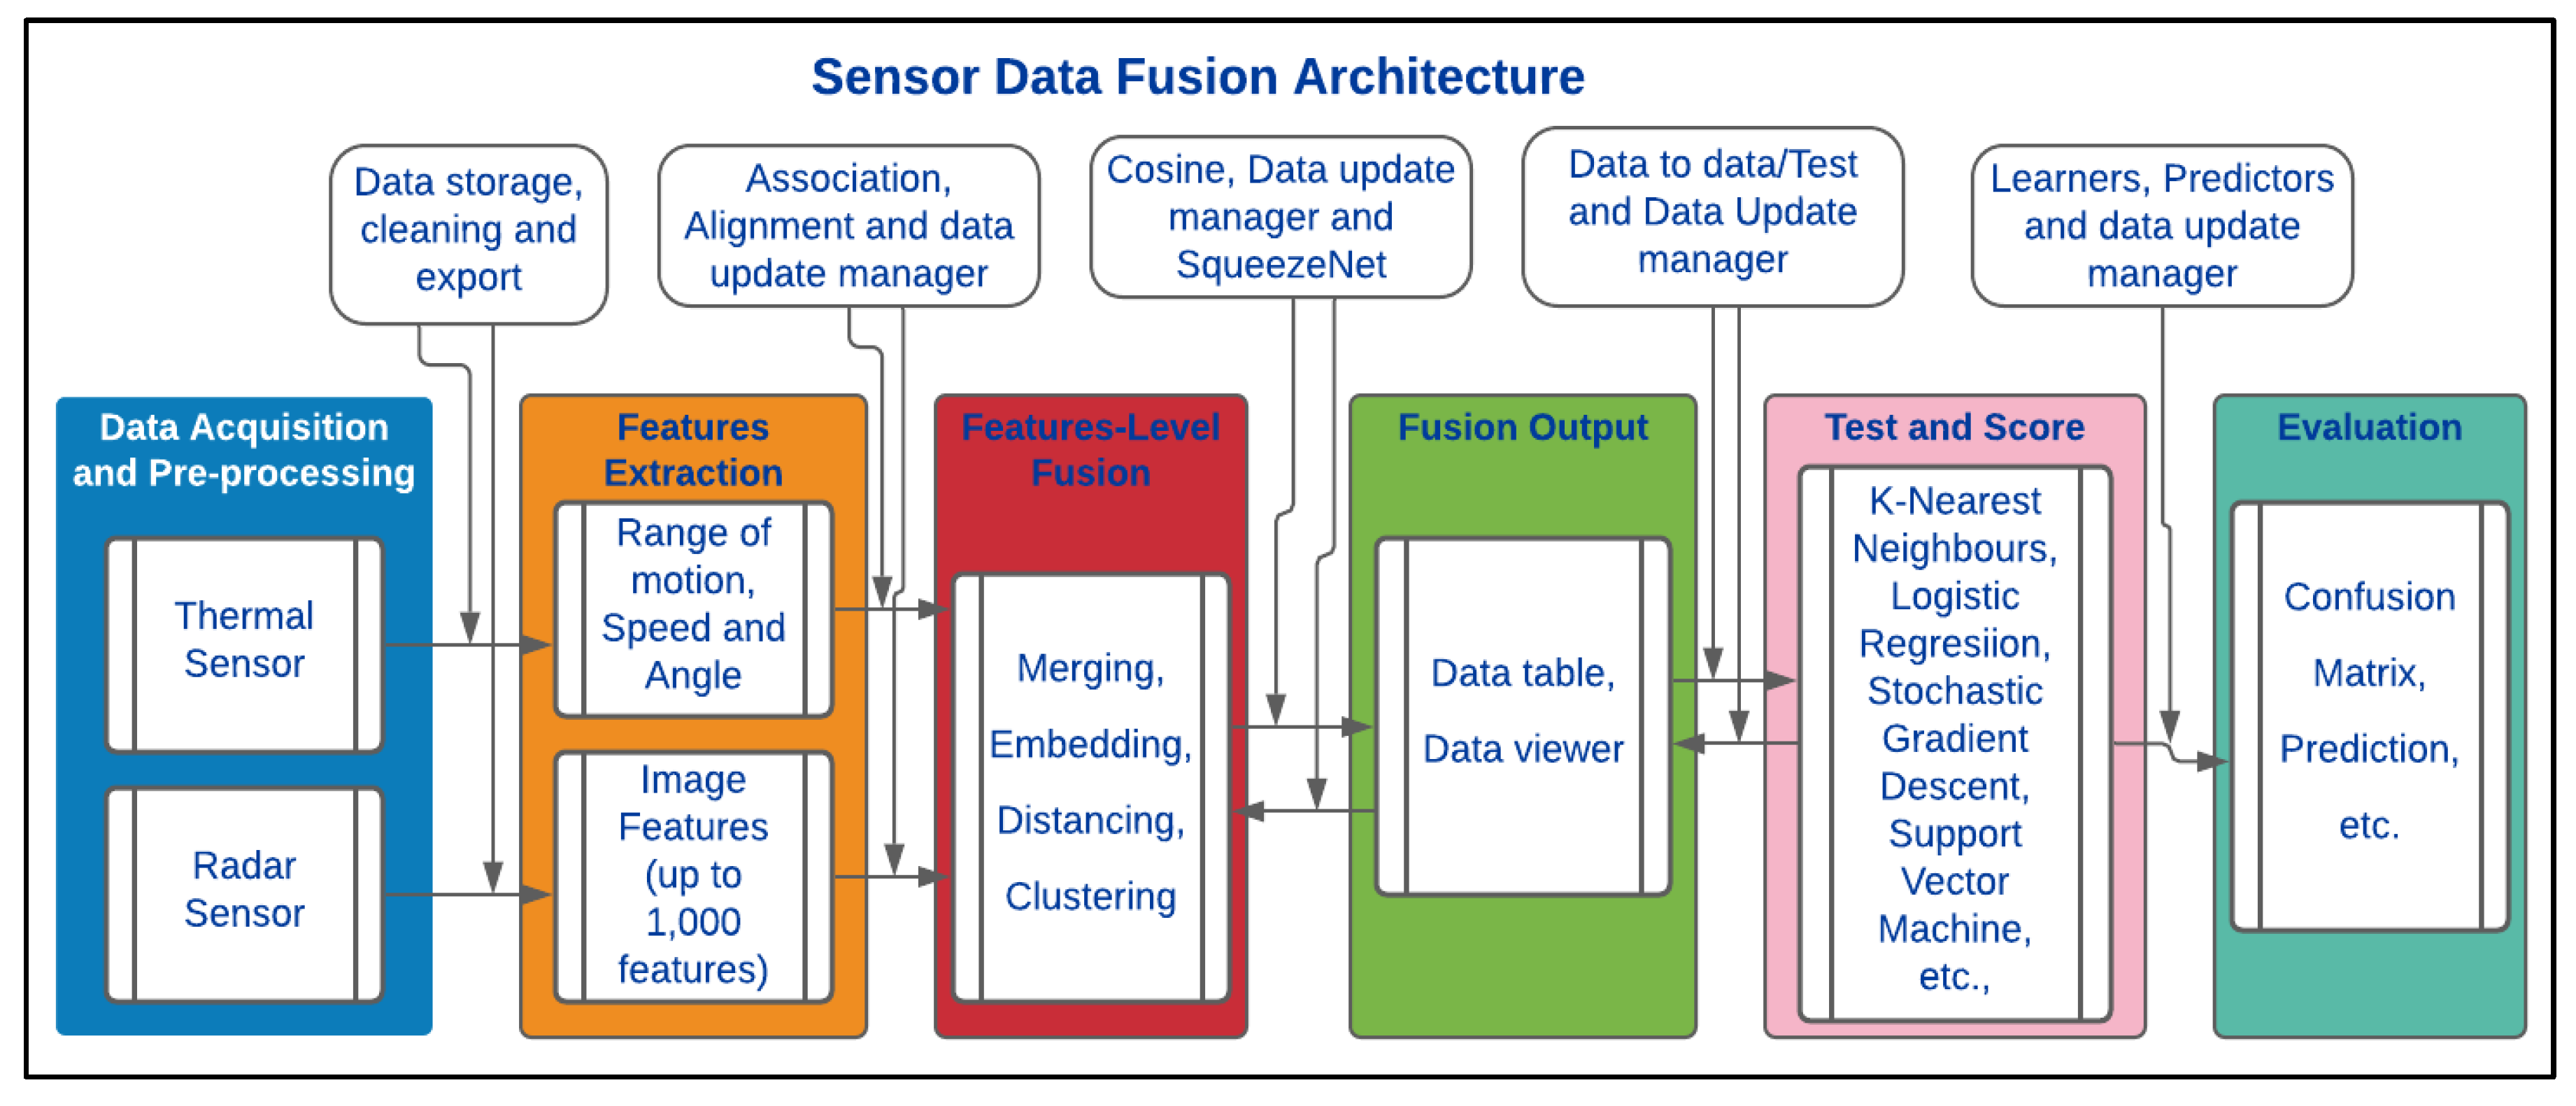
In
Figure 4, the data processing unit takes inputs from the sensor(s) before feature extraction and aggregation. This is then followed by training the CbyC algorithms on the datasets. The clustered outputs are evaluated to ascertain the accuracy of the clustered entities using several classification algorithms. In addition, the model can analyse and fuse both homogeneous and heterogeneous datasets without rigorous data labelling processes. A more detailed description of this model is presented in
Figure 5.
In
Figure 5, data acquisition and pre-processing are performed by individual sensors: Radar and thermal. For Radar sensors, signal strength, RoM, speed and AAR are acquired and are stored in a CSV file. Parameters such as time, range, speed and AAR are extracted from the Radar sensor, while up to 1,000 features are extracted from the thermal (greyscale and binary) images. Thermal blobs gleaned from the ITA sensor are stored in a predetermined folder with timestamps. The rationale for storing the data from both sensors with timestamps is to enable a time-based fusion of the data.
Furthermore, data from the sensors are exported to DM and fusion block using file import and image-import toolkits. While the former enables the reading of tabular data and their instances from a spreadsheet or a text document, the latter helps upload images from folders. Information such as image width, size, height, path and name are automatically appended to each image uploaded in a tabular format.
Preliminary feature extraction can be programmed to begin automatically or with a click at the data merging component. A matching-row-append, matching-rows-pairs function or concatenation is used to ensure that the features are correctly matched. Definitive feature extraction takes place at a data embedding capsule where more than 1,000 features, represented as vectors (n
0 to n
999), are extracted from each ITA image. Feature extraction can be performed by using deep learning image embedders for image recognition such as painters, Inception v3 (IV3), deepLoc, squeezeNet and Convolutional Neural Networks (CNN) [
47]. The rationale for using these embedders includes efficient and distributed training processes [
48].
Metrics, namely Euclidean, cosine, Manhattan, Jaccard, Spearman and Pearson, are situated in the Distances Application (DA). Feature normaliser, which performed column-wise normalisation for both categorical and numerical data, can be applied to both homogeneous and heterogeneous datasets [
47]. The output of DA is connected to the HCA for the classification of the distanced features. Moreover, a dendrogram corresponding to a cluster of similar features from the DA is computed using the HCA. Other DA-based features used include weighted, average, single or complete association of data.
The Louvain clustering algorithm can be used to detect and integrate communities into the module. It can also be utilised for grouped feature conversion into a K-Nearest Neighbours (KNN) graph and structures optimisation to obtain nodes that are interconnected. The principal graph parameters of Louvain clustering are KNN, resolution and distance metric [
49].
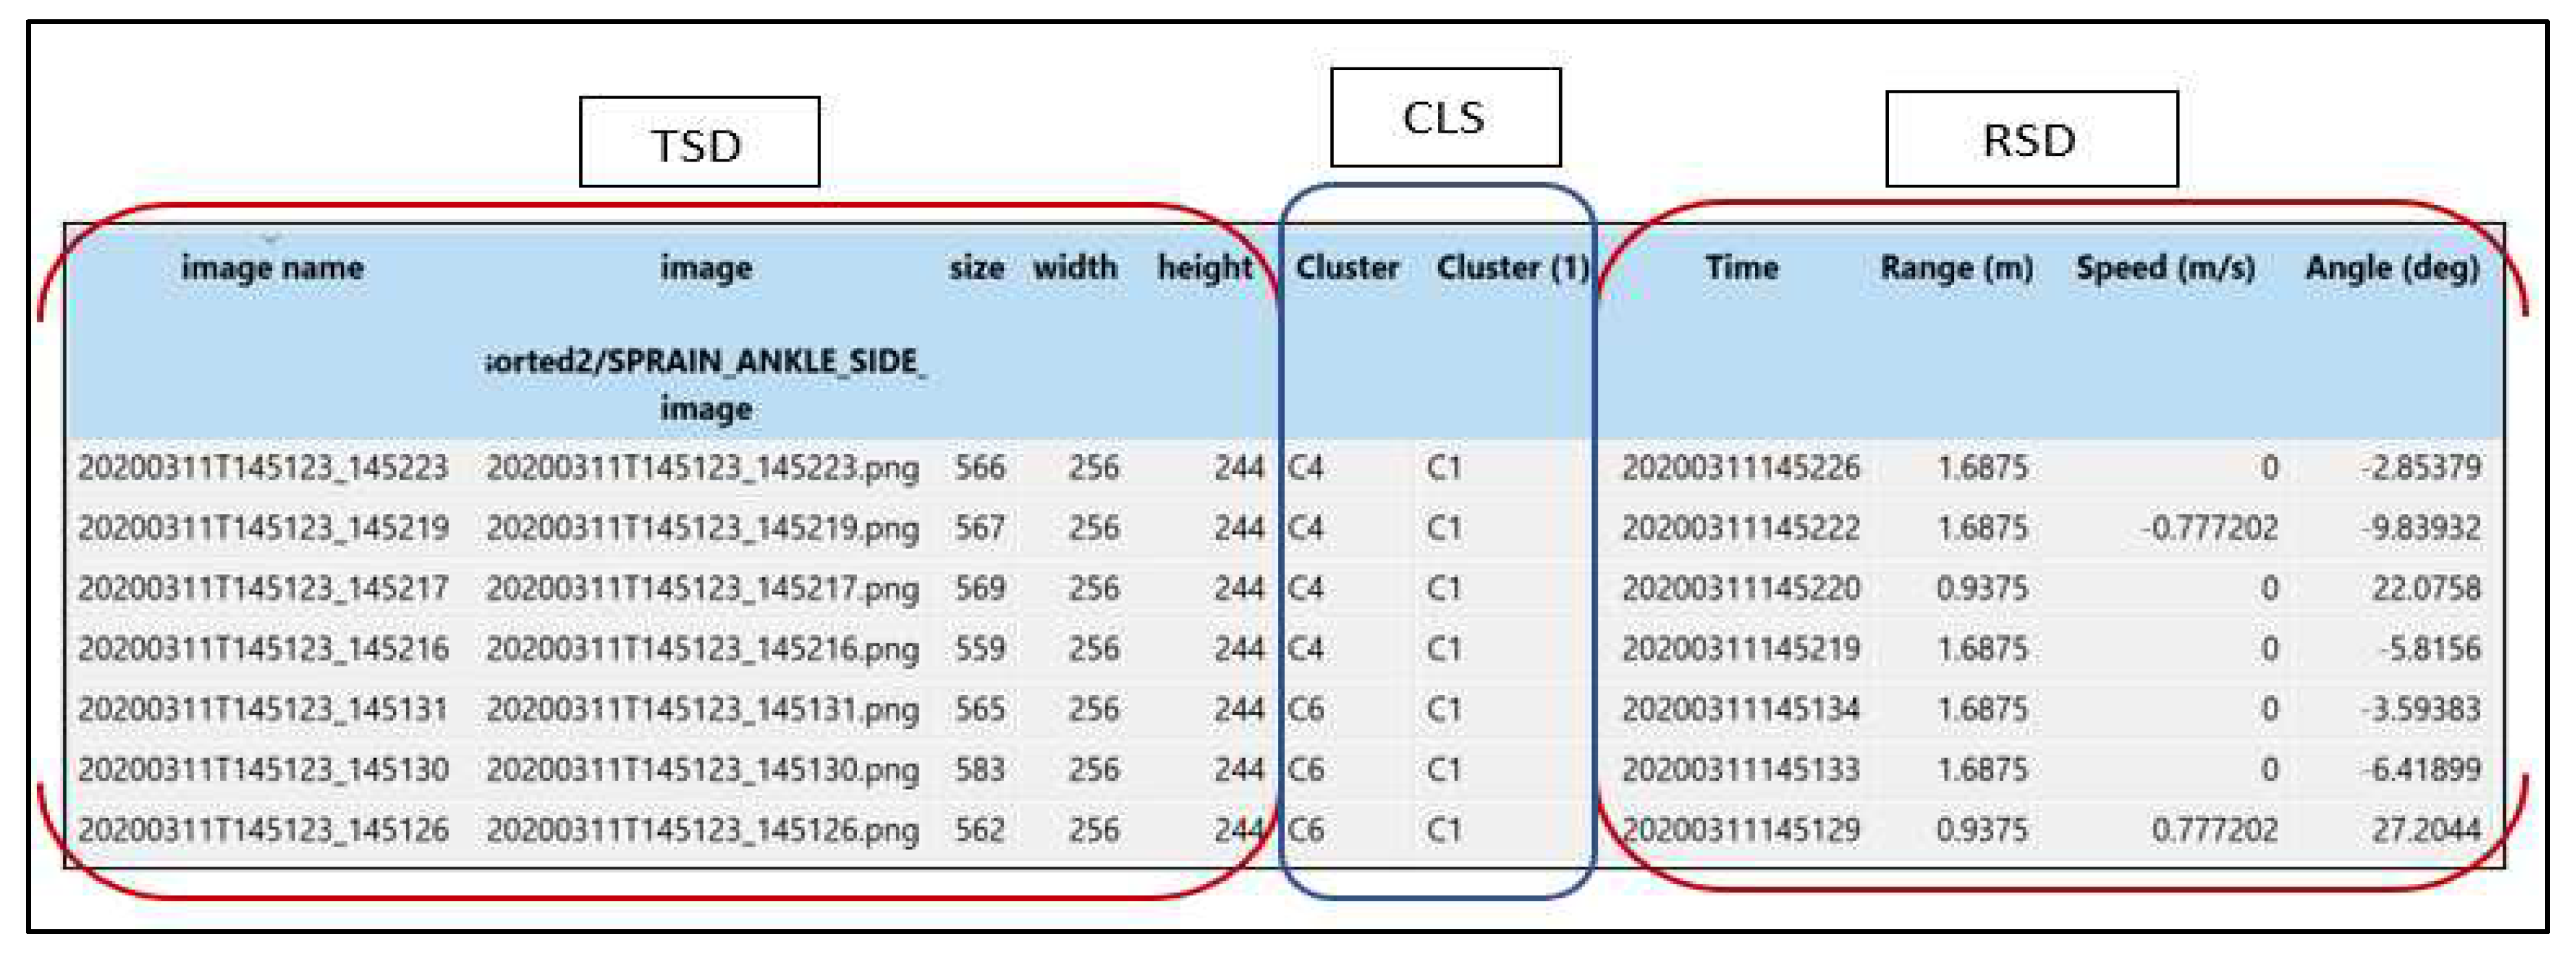
Figure 6 presents a data table after data fusion where image name, path, size, width, clusters, timestamps, RoM, speed, AAR, and up to 1,000 features can be viewed at a glance.
In
Figure 6, the areas marked as TSD, CLS and RSD represent Thermal, Clusters and Radar Sensor Data, respectively. Moreover, the first two columns of TSD indicated the timestamps, which also represent the image name. These are followed by size, width, and height. The clusters of the images are labelled as CLS (
Figure 6). Data from the Radar sensor are represented by the time, RoM, speed and angle in the area marked RSD (refer to
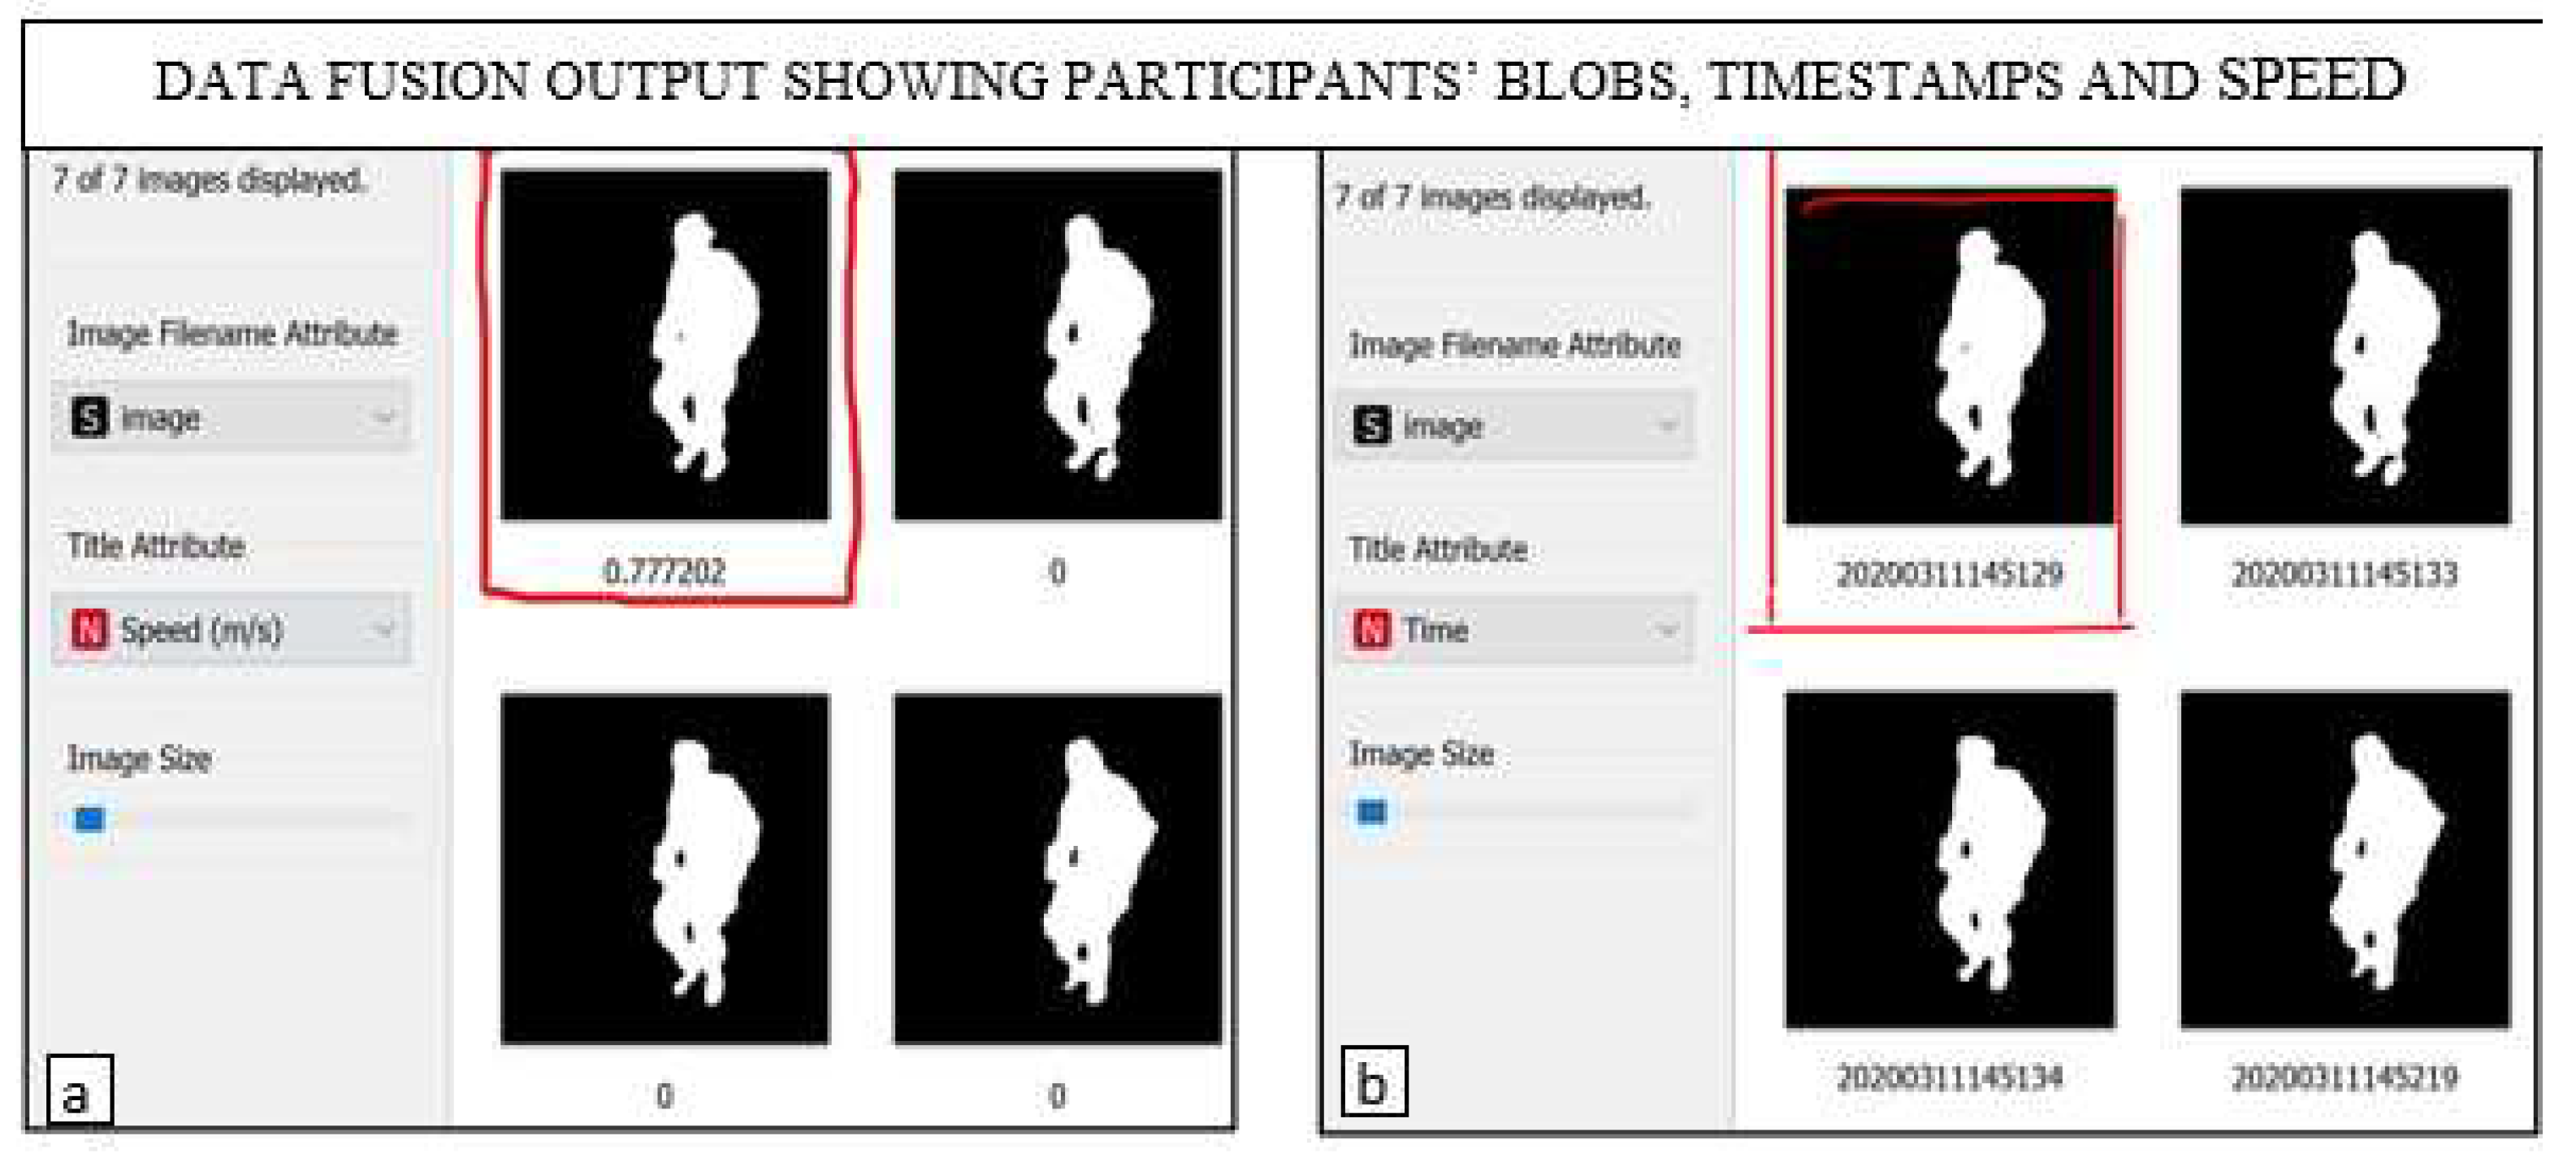
Figure 6). Similarly, the data viewer toolkit can be used to visualise images (after fusion) and relevant information such as speed, RoM and the AAR of participants from the selected cluster(s) as presented in
Figure 7(a) and (b).
The side view of participants performing LERE in a laboratory sitting room that mimics a real-life sitting room is presented in
Figure 7(a) and (b). The results indicated the action that was taken at a particular time interval. Hence, activities with similar features are grouped in clusters, thus enabling the visualisation of similar activities notwithstanding the day or time they were performed. In
Figure 7(a), the speed at which the exercise was performed is appended to the image as 0.777202 m/s as indicated on the top left image. On the other hand, the time at which the exercise was performed is appended to the top left image (
Figure 7(b)) as 20200311145129 (11th of March 2020 at 29 seconds past 14.51pm). With these data fusion outputs, tangible information that can help exercise prescription by therapists can be obtained.
Evaluation of the clustering accuracy of the detailed SDF (
Figure 5) can be performed using cross-validation, Test on Train Data (TTD), or random sampling technique. Cross-validation is a sampling technique used for the evaluation of models by training them on a fraction of the input data [
50]. A comparative result from the same datasets based on cross-validation and TTD techniques are presented in
Table 5 and
Table 6, respectively.
In
Table 5, cross-validation by features was performed on the 574 ITA-32 images and 1,722 Radar sensor data using DM algorithms such as RF, NN, KNN and CN2 induction. These algorithms were chosen at random for the comparison of the cross-validation and TTD sampling techniques. From the evaluation, RF has the least value for Area Under the Curve (AUC), followed by CN2 induction. CA was, however, higher with NN, followed by RF and then KNN and CN2. Also, the value of the weighted average (F1) [
47] was higher (more than 94%) with NN, Precision, Recall and Specificity.
TTD implies using all the data for both training and testing. In most instances, TTD can give incorrect results, and as such, it is not a recommended evaluation technique. The evaluation accuracies for the models using the TTD technique are presented in
Table 6.
Table 6.
Evaluation based on “Test on Train Data”.
Table 6.
Evaluation based on “Test on Train Data”.
| Model |
AUC (%) |
CA (%) |
F1 (%) |
Precision (%) |
Recall (%) |
LogLoss (%) |
| Random Forest |
100.0 |
99.5 |
99.5 |
99.5 |
99.5 |
0.0 |
| Neural Network |
100.0 |
100.0 |
100.0 |
100.0 |
100.0 |
0.0 |
| K-Near Neighbors |
98.7 |
98.2 |
98.0 |
98.0 |
98.2 |
0.1 |
| CN2 induction |
100.0 |
100.0 |
100.0 |
100.0 |
100.0 |
0.0 |
| Legend: Area Under the Curve (AUC), Classification Accuracy (CA), F1 = Weighted Average |
As presented in
Table 5, the results of all the models are higher in TTD than in the cross-validation technique (
Table 6). For example, RF, which was 85.2% in the cross-validation technique, attained an accuracy of 100.0% in TTD. Similarly, CN2 induction, which was 85.2% with cross-validation (
Table 5), attained an accuracy of 100% (
Table 6).
5. Discussions
The present work on SDF using DM and ML models leveraged the ODMS for feature-level fusion using a matching-row-append, matching-rows-pairs function or concatenation of features. The framework suits both homogeneous and heterogeneous datasets ranging from RGB to greyscale and binary images.
Experimental results indicated that our proposed framework has a better performance than the SDF frameworks in [
6,
51] in terms of the accuracy metrics. In [
52], the proposed architecture estimated the states of dynamic legged robots. The added advantage of our work includes homogeneous data analysis. Additionally, the proposed framework contains evaluation modules for testing and scoring the output of the data fusion and classification of features, as presented in
Figure 5.
Furthermore, the proposed architecture offers a range of flexibilities depending on the type of sensors used and expected results. As an example, a scatter plot, data distribution toolkit or heat map can be included in the framework depending on the intent of the user. Other algorithms which can also be featured in the architecture include data randomisation, ranking, transposition and correlation.
This framework addresses the drawbacks of the centralised architecture, such as computational overload. It entailed the modification of the generic distributed SDF (earlier described). Its main advantages include: (i) communication adaptability, (ii) lesser computational load due to distributed functions, (iii) minimal communication delay, and (iv) higher stability due to its shared processes [
3].
The main limitation of the proposed framework is that models such as DT and RF in the ODMS perform poorly on homogeneous datasets when computing their AUC. Hence, DT and RF scored 62.3% and 73.9%, respectively, on AUC due to their inability to compute the definite integral datasets. This challenge was mostly experienced with binary datasets.
6. Conclusions
This paper proposed an SDF framework for in-home applications. PAT research findings and a comparative study on DM software packages presented the ODMS as a preferred DM software package. An SDF analysis with the proposed framework indicated average accuracies of 84.7% and 95.7% for homogeneous and heterogenous SDF, respectively. Information obtained from the SDF output can help estimate the speed at which in-home exercises such as post-stroke and LERE were performed. Other details such as the timestamps, the RoM and the AAR can help the therapist determine if recommended activities were performed as prescribed. Further work will apply the proposed SDF framework to ambient assisted living activity modelling using other sensing solutions.
Author Contributions
Conceptualisation, I.E. and C.N.; methodology, I.E.; software, I.E.; validation, M.G.-C. and C.N.; formal analysis, I.E.; investigation, I.E. and M.G.-C.; resources, C.N.; data curation, I.E. and M.G.-C.; writing—original draft preparation, I.E.; writing—review and editing, M.G.-C., P.M. and C.N.; supervision, C.N. and J.M.; project administration, C.N.; funding acquisition, J.M. All authors have read and agreed to the published version of the manuscript.
Funding
EU’s INTERREG VA program, IVA5034.
Acknowledgments
Research is funded by the EU’s INTERREG VA program, managed by the Special EU Program Body (SEUPB).
Conflicts of Interest
The authors declare no conflict of interest.
References
- Jitendra, R. Multi-Sensor Data Fusion with MATLAB; CRC Press, 6000 Broken SOund Parkway NW, 2013; Vol. 106; ISBN 9781439800058.
- Chen, C.Y.; Li, C.; Fiorentino, M.; Palermo, S. A LIDAR Sensor Prototype with Embedded 14-Bit 52 Ps Resolution ILO-TDC Array. Analog Integr. Circuits Signal Process. 2018, 94, 369–382. [CrossRef]
- Al-Dhaher, A.H.G.; Mackesy, D. Multi-Sensor Data Fusion Architecture. In Proceedings of the Proceedings - 3rd IEEE International Workshop on Haptic, Audio and Visual Environments and their Applications - HAVE 2004; 2004; pp. 159–163.
- Lytrivis, P.; Thomaidis, G.; Amditis, A.; Lytrivis P., Thomaidis G., A.A. Sensor Data Fusion in Automotive Applications. INTECH 2009, 490. [CrossRef]
- Dhiraj, A.; Deepa, P. Sensors and Their Applications. J. Phys. E. 2012, 1, 60–68. [CrossRef]
- Elmenreich, W.; Leidenfrost, R. Fusion of Heterogeneous Sensors Data. In Proceedings of the Proceedings of the 6th Workshop on Intelligent Solutions in Embedded Systems, WISES’08; 2008.
- Nobili, S.; Camurri, M.; Barasuol, V.; Focchi, M.; Caldwell, D.G.; Semini, C.; Fallon, M. Heterogeneous Sensor Fusion for Accurate State Estimation of Dynamic Legged Robots. Robot. Sci. Syst. 2017, 13. [CrossRef]
- King, R.S. Cluster Analysis and Data Mining; David Pallai, 2015; ISBN 9781938549380.
- Ashraf, I. Data Mining Algorithms and Their Applications in Education Data Mining. Int. J. Adv. Res. 2014.
- Kantardzic, M. Data Mining: Concepts, Models, Methods, and Algorithms; 3rd ed.; IEEE Press: New Jersey, 2020; Vol. 36; ISBN 9781119516040.
- Oyelade, J.; Isewon, I.; Oladipupo, O.; Emebo, O.; Omogbadegun, Z.; Aromolaran, O.; Uwoghiren, E.; Olaniyan, D.; Olawole, O. Data Clustering: Algorithms and Its Applications. Proc. - 2019 19th Int. Conf. Comput. Sci. Its Appl. ICCSA 2019 2019, 71–81. [CrossRef]
- Morissette, L.; Chartier, S. The K-Means Clustering Technique: General Considerations and Implementation in Mathematica. Tutor. Quant. Methods Psychol. 2013, 9, 15–24. [CrossRef]
- Khan, S.S.; Ahamed, S.; Jannat, M.; Shatabda, S.; Farid, D.M. Classification by Clustering (CbC): An Approach of Classifying Big Data Based on Similarities. In Proceedings of the Proc. of the International Joint Conference on Computional Intelligence; Springer Singapore, 2019; pp. 593–605.
- Kim, T.; Kim, S.; Lee, E.; Park, M. Comparative Analysis of RADAR- IR Sensor Fusion Methods for Object Detection. 2017, 1576–1580.
- Lee, G.H.; Choi, J.D.; Lee, J.H.; Kim, M.Y. Object Detection Using Vision and LiDAR Sensor Fusion for Multi-Channel V2X System. In Proceedings of the 2020 International Conference on Artificial Intelligence in Information and Communication, ICAIIC 2020; Institute of Electrical and Electronics Engineers Inc., February 1 2020; pp. 1–5.
- Rezaei, M. Computer Vision for Road Safety: A System for Simultaneous Monitoring of Driver Behaviour and Road Hazards. 2014, 1 file.
- Silva, V. De; Roche, J.; Kondoz, A.; Member, S. Fusion of LiDAR and Camera Sensor Data for Environment Sensing in Driverless Vehicles.
- Kovács, G.; Nagy, S. Ultrasonic Sensor Fusion Inverse Algorithm for Visually Impaired Aiding Applications. Sensors 2020, 20, 3682. [CrossRef]
- Wang, T.; Wang, X.; Hong, M. Gas Leak Location Detection Based on Data Fusion with Time Difference of Arrival and Energy Decay Using an Ultrasonic Sensor Array. Sensors (Switzerland) 2018, 18. [CrossRef]
- Chen, Z.; Wang, Y. Infrared–Ultrasonic Sensor Fusion for Support Vector Machine–Based Fall Detection. J. Intell. Mater. Syst. Struct. 2018, 29, 2027–2039. [CrossRef]
- Huang, P.; Luo, X.; Jin, J.; Wang, L.; Zhang, L.; Liu, J.; Zhang, Z. Improving High-Throughput Phenotyping Using Fusion of Close-Range Hyperspectral Camera and Low-Cost Depth Sensor. Sensors (Switzerland) 2018, 18. [CrossRef]
- Liu, X.; Payandeh, S. A Study of Chained Stochastic Tracking in RGB and Depth Sensing. J. Control Sci. Eng. 2018, 2018. [CrossRef]
- Kanwal, N.; Bostanci, E.; Currie, K.; Clark, A.F.A.F. A Navigation System for the Visually Impaired: A Fusion of Vision and Depth Sensor. Appl. Bionics Biomech. 2015, 2015. [CrossRef]
- Shao, F.; Lin, W.; Li, Z.; Jiang, G.; Dai, Q. Toward Simultaneous Visual Comfort and Depth Sensation Optimization for Stereoscopic 3-D Experience. IEEE Trans. Cybern. 2017, 47, 4521–4533. [CrossRef]
- Procházka, A.; Vyšata, O.; Vališ, M.; Ťupa, O.; Schätz, M.; Mařík, V. Use of the Image and Depth Sensors of the Microsoft Kinect for the Detection of Gait Disorders. Neural Comput. Appl. 2015, 26, 1621–1629. [CrossRef]
- Kepski, M.; Kwolek, B. Event-Driven System for Fall Detection Using Body-Worn Accelerometer and Depth Sensor. IET Comput. Vis. 2018, 12, 48–58. [CrossRef]
- Long, N.; Wang, K.; Cheng, R.; Yang, K.; Hu, W.; Bai, J. Assisting the Visually Impaired: Multitarget Warning through Millimeter Wave Radar and RGB-Depth Sensors. J. Electron. Imaging 2019, 28. [CrossRef]
- Salcedo-Sanz, S.; Ghamisi, P.; Piles, M.; Werner, M.; Cuadra, L.; Moreno-Martínez, A.; Izquierdo-Verdiguier, E.; Muñoz-Marí, J.; Mosavi, A.; Camps-Valls, G. Machine Learning Information Fusion in Earth Observation: A Comprehensive Review of Methods, Applications and Data Sources. Inf. Fusion 2020, 63, 256–272. [CrossRef]
- Chang, N. Bin; Bai, K. Multisensor Data Fusion and Machine Learning for Environmental Remote Sensing. Multisens. Data Fusion Mach. Learn. Environ. Remote Sens. 2018, 1–508. [CrossRef]
- Bowler, A.L.; Bakalis, S.; Watson, N.J. Monitoring Mixing Processes Using Ultrasonic Sensors and Machine Learning. Sensors (Switzerland) 2020, 20. [CrossRef]
- Madeira, R.; Nunes, L. A Machine Learning Approach for Indirect Human Presence Detection Using IOT Devices. In Proceedings of the 2016 11th International Conference on Digital Information Management, ICDIM 2016; Institute of Electrical and Electronics Engineers Inc., 2016; pp. 145–150.
- Elbattah, M.; Molloy, O. Data-Driven Patient Segmentation Using K-Means Clustering: The Case of Hip Fracture Care in Ireland. ACM Int. Conf. Proceeding Ser. 2017, 3–10. [CrossRef]
- Samriya, J. kumar; Kumar, S.; Singh, S. Efficient K-Means Clustering for Healthcare Data. Adv. J. Comput. Sci. Eng. 2016, 4.
- Bourobou, S.T.M.; Yoo, Y. User Activity Recognition in Smart Homes Using Pattern Clustering Applied to Temporal ANN Algorithm. Sensors (Switzerland) 2015, 15, 11953–11971. [CrossRef]
- Liao, M.; Li, Y.; Kianifard, F.; Obi, E.; Arcona, S. Cluster Analysis and Its Application to Healthcare Claims Data: A Study of End-Stage Renal Disease Patients Who Initiated Hemodialysis Epidemiology and Health Outcomes. BMC Nephrol. 2016, 17, 1–14. [CrossRef]
- Ekerete, I.; Garcia-constantino, M.; Diaz, Y.; Nugent, C.; Mclaughlin, J. Fusion of Unobtrusive Sensing Solutions for Sprained Ankle Rehabilitation Exercises Monitoring in Home Environments. 2021, 1–11. [CrossRef]
- Negi, N.; Chawla, G. Clustering Algorithms in Healthcare BT - Intelligent Healthcare: Applications of AI in EHealth. In; Bhatia, S., Dubey, A.K., Chhikara, R., Chaudhary, P., Kumar, A., Eds.; Springer International Publishing: Cham, 2021; pp. 211–224 ISBN 978-3-030-67051-1.
- Smola, A.; Vishwanathan, S.V.. Introduction to Machine Learning; 2008; Vol. 252; ISBN 521 82583 0.
- Ekerete, I.; Garcia-Constantino, M.; Konios, A.; Mustafa, M.A.; Diaz-Skeete, Y.; Nugent, C.; McLaughlin, J. Fusion of Unobtrusive Sensing Solutions for Home-Based Activity Recognition and Classification Using Data Mining Models and Methods. Appl. Sci. 2021, 11. [CrossRef]
- Keogh, A.; Dorn, J.F.; Walsh, L.; Calvo, F.; Caulfield, B. Comparing the Usability and Acceptability of Wearable Sensors among Older Irish Adults in a Real-World Context: Observational Study. JMIR mHealth uHealth 2020, 8. [CrossRef]
- Rahman, M.S. The Advantages and Disadvantages of Using Qualitative and Quantitative Approaches and Methods in Language “Testing and Assessment” Research: A Literature Review. J. Educ. Learn. 2016, 6, 102. [CrossRef]
- Silva, C.A.; Santilli, G.; Sano, E.E.; Rodrigues, S.W.P. Qualitative Analysis of Deforestation in the Amazonian Rainforest from SAR, Optical and Thermal Sensors. Anu. do Inst. Geociencias 2019, 42, 18–29. [CrossRef]
- Kelly, C.J.; Karthikesalingam, A.; Suleyman, M.; Corrado, G.; King, D. Key Challenges for Delivering Clinical Impact with Artificial Intelligence. BMC Med. 2019, 17, 1–9. [CrossRef]
- Hesamian, M.H.; Jia, W.; He, X.; Kennedy, P. Deep Learning Techniques for Medical Image Segmentation: Achievements and Challenges. J. Digit. Imaging 2019, 32, 582–596. [CrossRef]
- Motti, V.G. Wearable Health: Opportunities and Challenges. In Proceedings of the ACM International Conference Proceeding Series; 2019; pp. 356–359.
- PAT Research 43 Top Free Data Mining Software Available online: https://www.predictiveanalyticstoday.com/top-free-data-mining-software/ (accessed on 12 November 2020).
- Bhatia, P. Introduction to Data Mining. Data Min. Data Warehous. 2019, 17–27. [CrossRef]
- Iandola, F.N.; Han, S.; Moskewicz, M.W.; Ashraf, K.; Dally, W.J.; Keutzer, K. SqueezeNet: AlexNet-Level Accuracy with 50x Fewer Parameters and <0.5MB Model Size. 2016, 1–13.
- De Meo, P.; Ferrara, E.; Fiumara, G.; Provetti, A. Generalized Louvain Method for Community Detection in Large Networks. Int. Conf. Intell. Syst. Des. Appl. ISDA 2011, 88–93. [CrossRef]
- Mishra, A. Amazon Machine Learning. Mach. Learn. AWS Cloud 2019, 317–351. [CrossRef]
- Caruso, M.; Bonci, T.; Knaflitz, M.; Croce, U. Della; Cereatti, A. A Comparative Accuracy Analysis of Five Sensor Fusion Algorithms for Orientation Estimation Using Magnetic and Inertial Sensors. Gait Posture 2018, 66, S9–S10. [CrossRef]
- Rodrigo Marco, V.; Kalkkuhl, J.; Raisch, J.; Scholte, W.J.; Nijmeijer, H.; Seel, T. Multi-Modal Sensor Fusion for Highly Accurate Vehicle Motion State Estimation. Control Eng. Pract. 2020, 100, 104409. [CrossRef]
|
Disclaimer/Publisher’s Note: The statements, opinions and data contained in all publications are solely those of the individual author(s) and contributor(s) and not of MDPI and/or the editor(s). MDPI and/or the editor(s) disclaim responsibility for any injury to people or property resulting from any ideas, methods, instructions or products referred to in the content. |
© 2023 by the authors. Licensee MDPI, Basel, Switzerland. This article is an open access article distributed under the terms and conditions of the Creative Commons Attribution (CC BY) license (http://creativecommons.org/licenses/by/4.0/).
