1. Summary (required)
Rheumatoid arthritis (RA) is an autoimmune disease, primarily inflammatory, affecting the joints [
1,
2]. Extra-articular manifestations have been described in this condition, with the lung being one of the affected sites. Damage to the pulmonary interstitium (interstitial lung disease ILD) [
3]. It has been linked to the involvement of proteins participating in the inflammatory process and associated with extracellular matrix deposition and fibrosis establishment in the lungs, such as peptidyl arginine deiminases (PAD) enzymes that carry out protein citrullination.
The prevalence of musculoskeletal diseases in Mexico has been reported to vary by geographic location [
4], leading to an analysis of private markers within the Mexican population obtained by Silva et al. in 2009 [
5].
Regarding factors associated with developing both diseases (RA and RA-ILD), smoking has been described as one of the main risk factors, in addition to occupational and environmental factors [
6].
2. Data Description
The data obtained in each analysis are presented and described in the tables and figures.
2.1. Study groups
The included groups consisted of patients with rheumatoid arthritis (RA), RA associated with diffuse interstitial lung disease (RA-ILD), as well as a group of clinically healthy subjects (CHS). These groups are displayed in the result tables.
2.2. Genotyping
Table 1 displays the analysis variable at the top of each column, including the gene, the SNV with their respective genotypes or alleles, and the patient or control group. The rows represent the frequency in percentage.
In
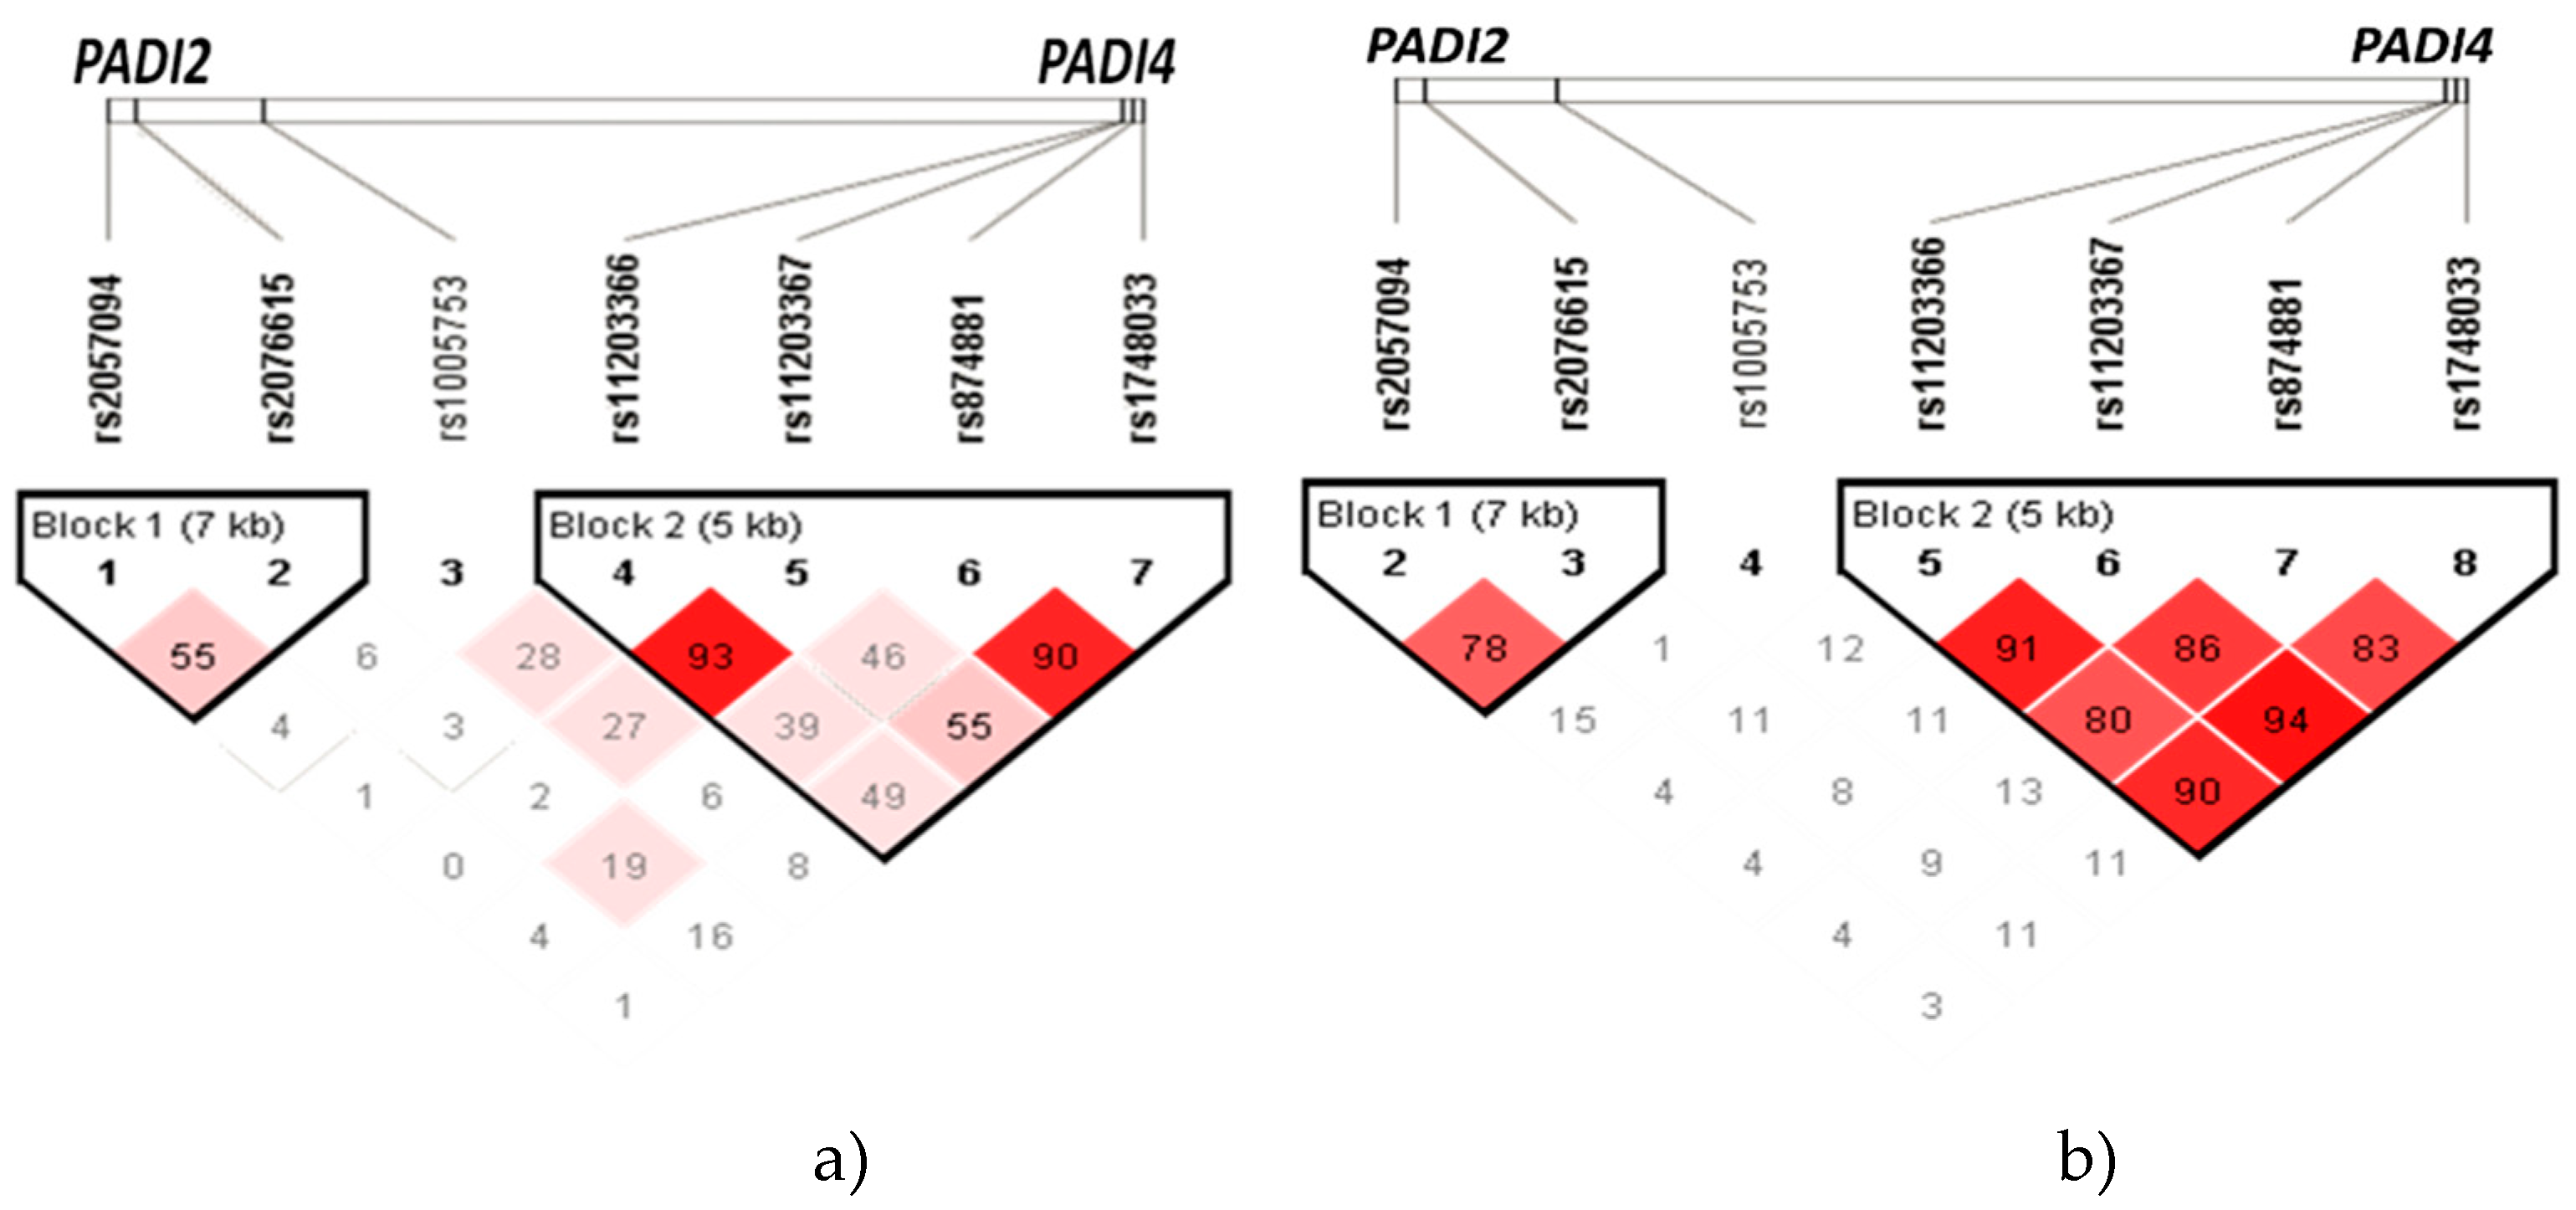
Figure 1, diamond plots depict haplotype blocks identified in
PADI2 and
PADI4 within the Mexican mestizo population. The diamonds, connected by lines to form a block, represent a haplotype. At the top of the graph, you can see the 7 SNVs, with each diamond symbolizing the linkage between these loci. Diamonds with a deeper shade of red indicate a higher degree of linkage disequilibrium, while lighter diamonds suggest a lower degree of linkage disequilibrium. The diamonds also display the linkage disequilibrium as ‘r’ (Pearson’s Correlation Coefficient).
The haplotype analysis was conducted between all the groups of patients with RA (with and without ILD) and the group of individuals without the diseases (
Figure 1a), as well as within ILD-RA patients vs. RA patients (
Figure 1b).
Table 2 displays the percentage frequencies of the haplotypes identified in
PADI4 (rs11203366-rs11203367-rs1748033-rs874881) within the patient populations of ILD-RA, RA and the group of individuals without the diseases (CHS), as shown in
Figure 1a,b.
2.3. AIMs
The genotyping of ancestry informative markers consists of 14 private SNVs between chromosomes 1 and 13. These markers exhibit differential Minor Allele Frequencies (MAF) between the ZAP and CEU populations (taken as reference).
Table 3 presents the results of the minor allele frequency in the reference populations, and at the end of the table, you can find the MAF for the study population (n=867 individuals).
The assessment of genetic distances between the study groups was carried out using the 14 SNVs presented in
Table 3. To do this, we conducted a group comparison analysis, and the results of the FST index, along with their corresponding p-values, are shown in
Table 4 for the comparisons between the respective row and column.
2.4. Eigenvectors PCA
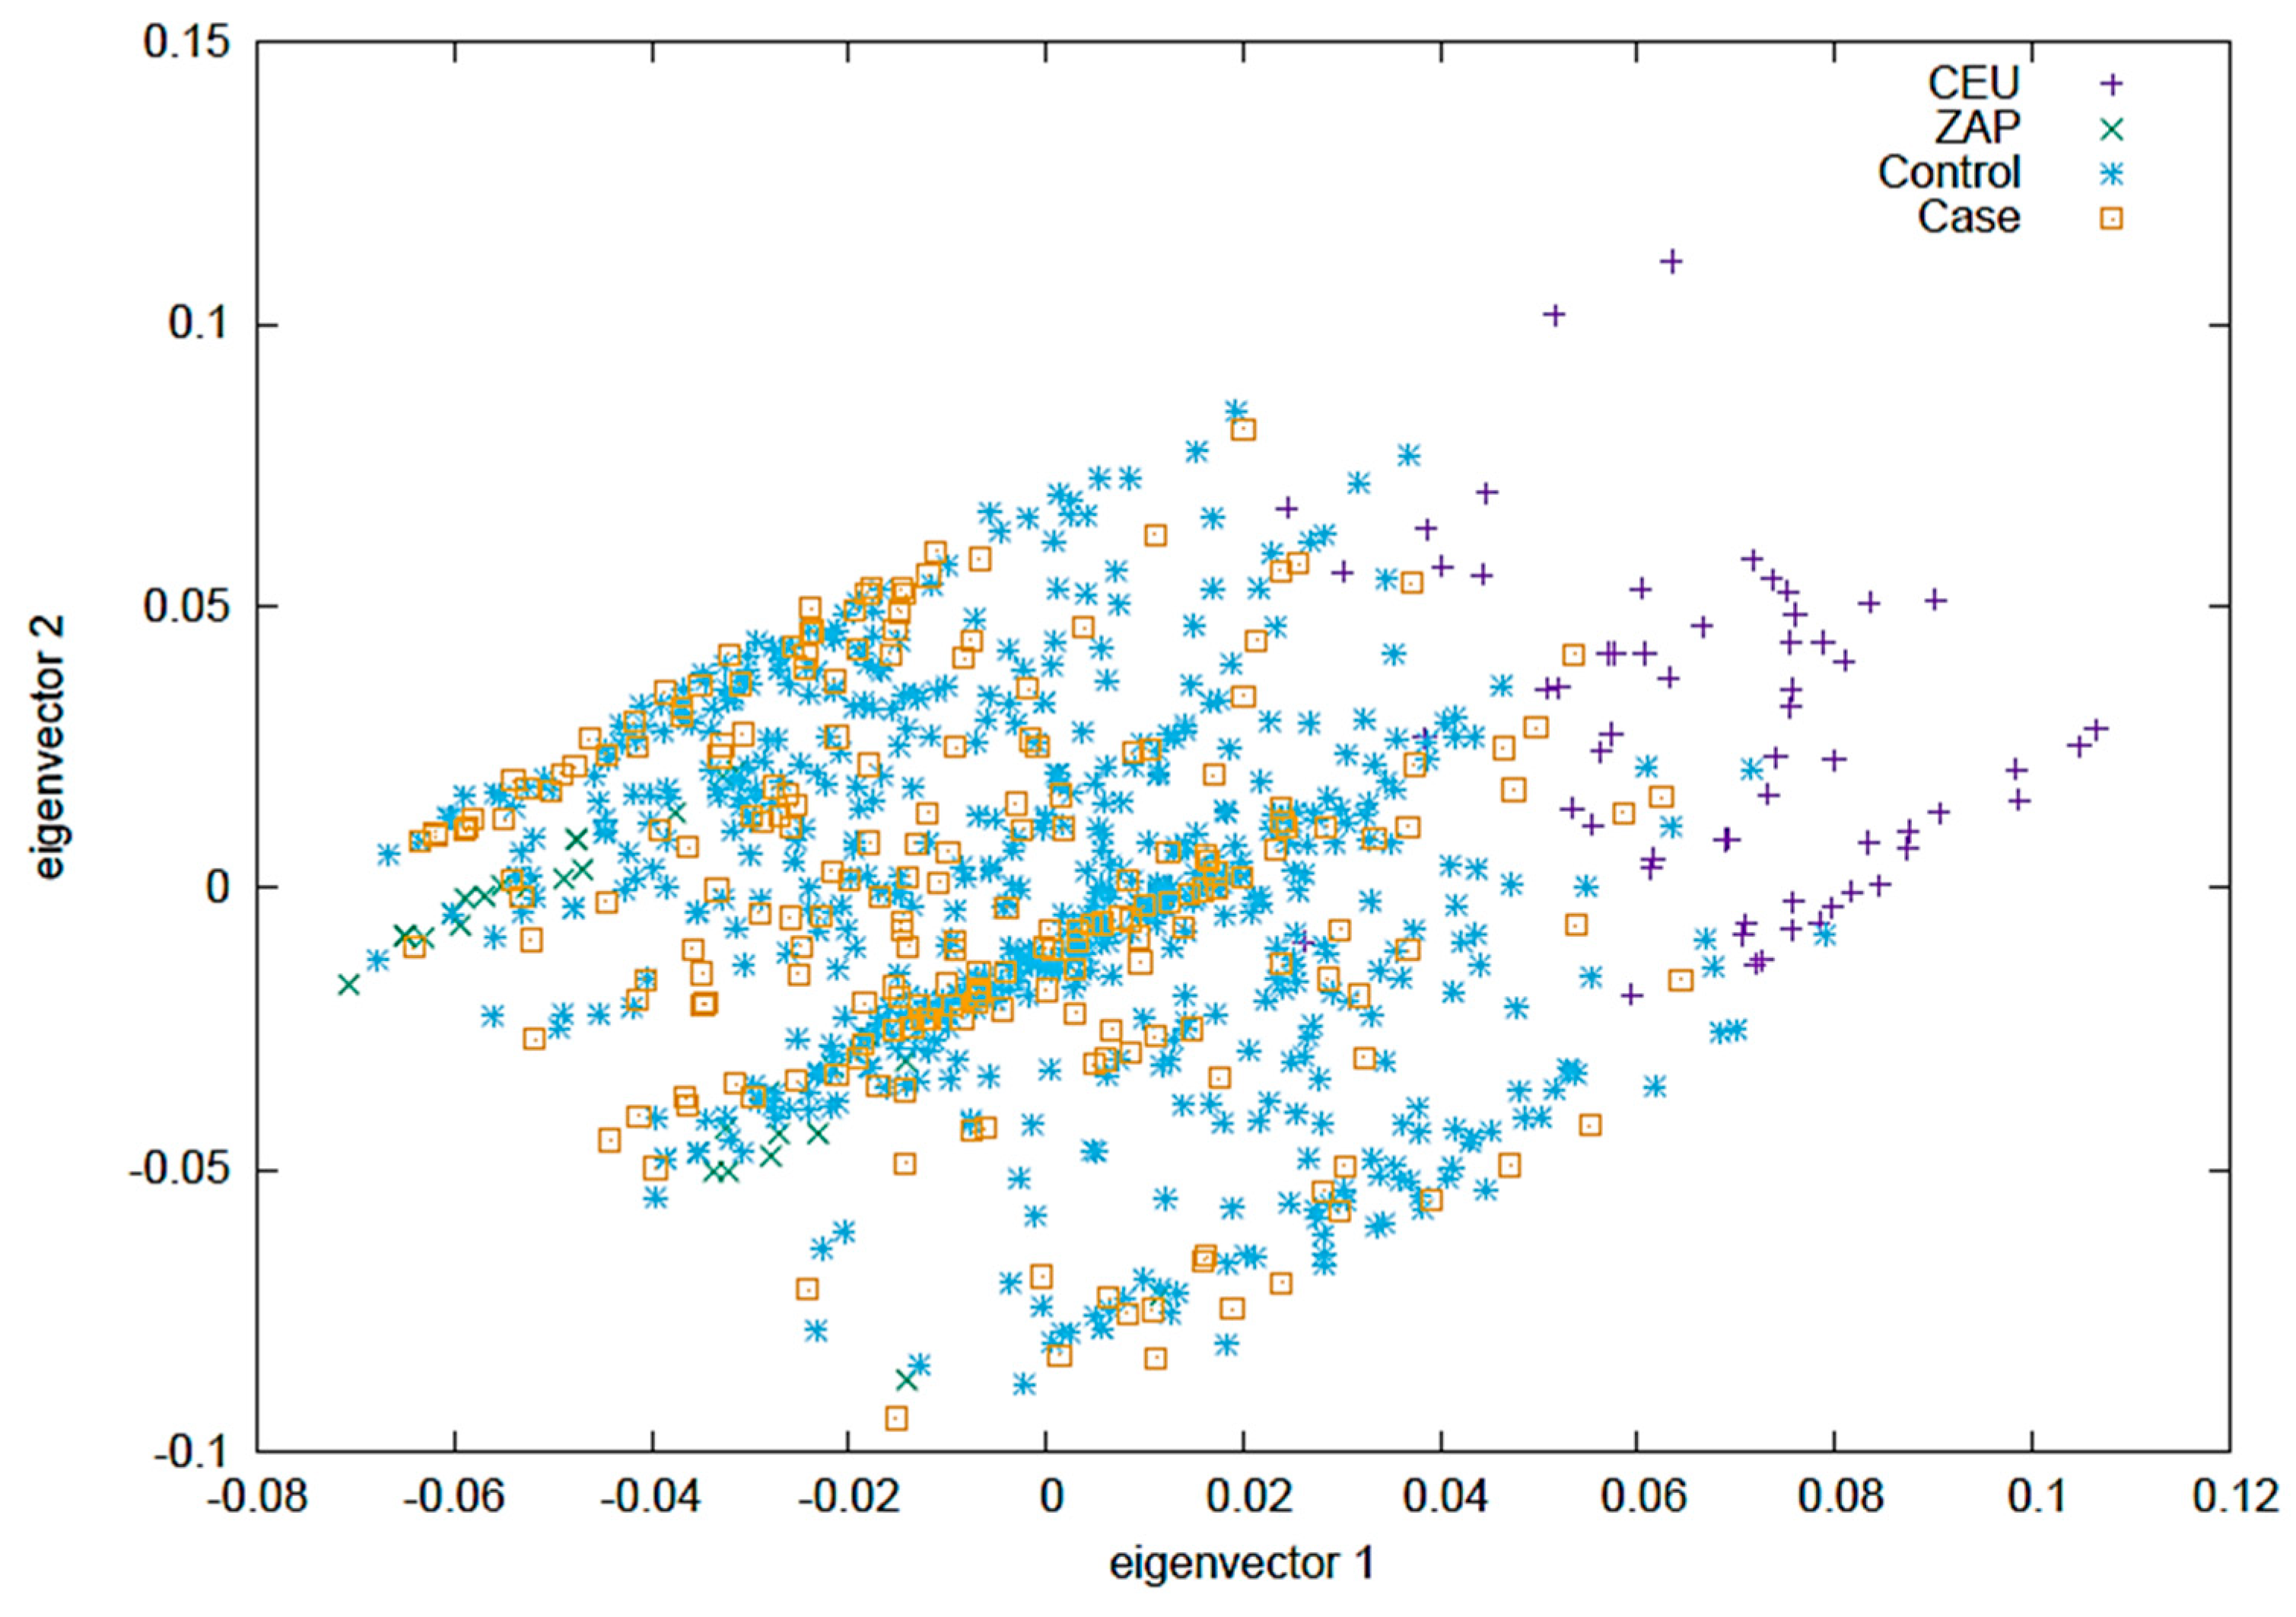
Figure 2 displays a Principal Component Analysis (PCA) where the CEU and ZAP populations are taken as reference groups. In this analysis, the control group consists of clinically healthy individuals from the CHS group, and the case group includes all patients from the RA and RA-ILD groups. The first two vectors are shown, collectively providing more than 85% of the information within the population.
2.5. Exposures and protein PAD2 and PAD4 levels
In
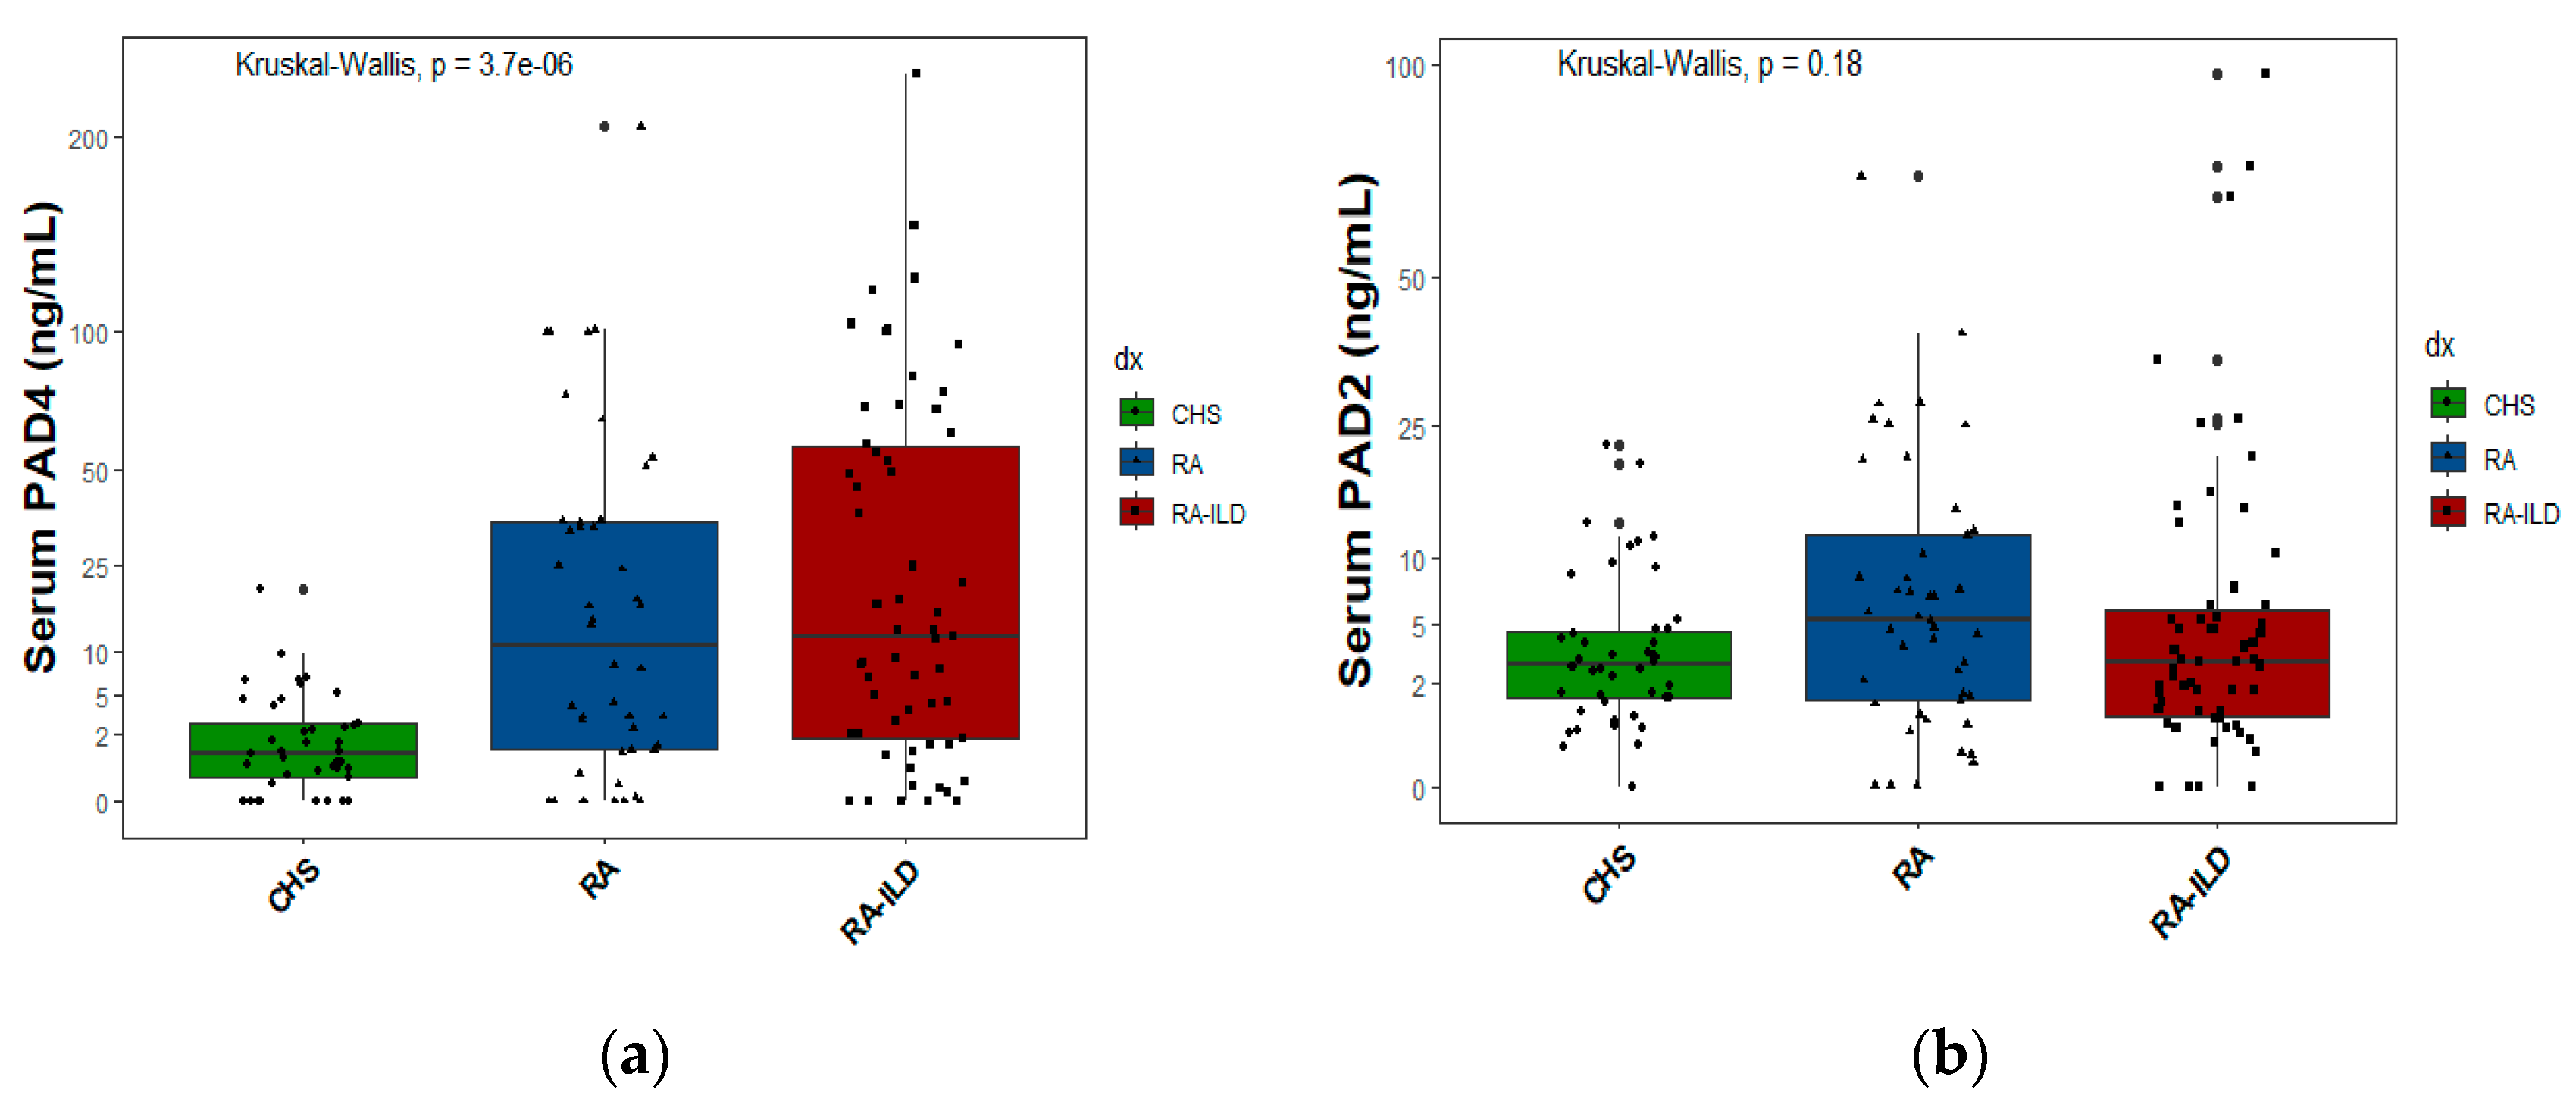
Figure 3a, the serum levels of PAD4 protein are displayed, and in
Figure 3b, the PAD2 protein levels are shown for the three study groups. Each spot (circle, triangle, and black square) represents an individual in whom the protein was measured.
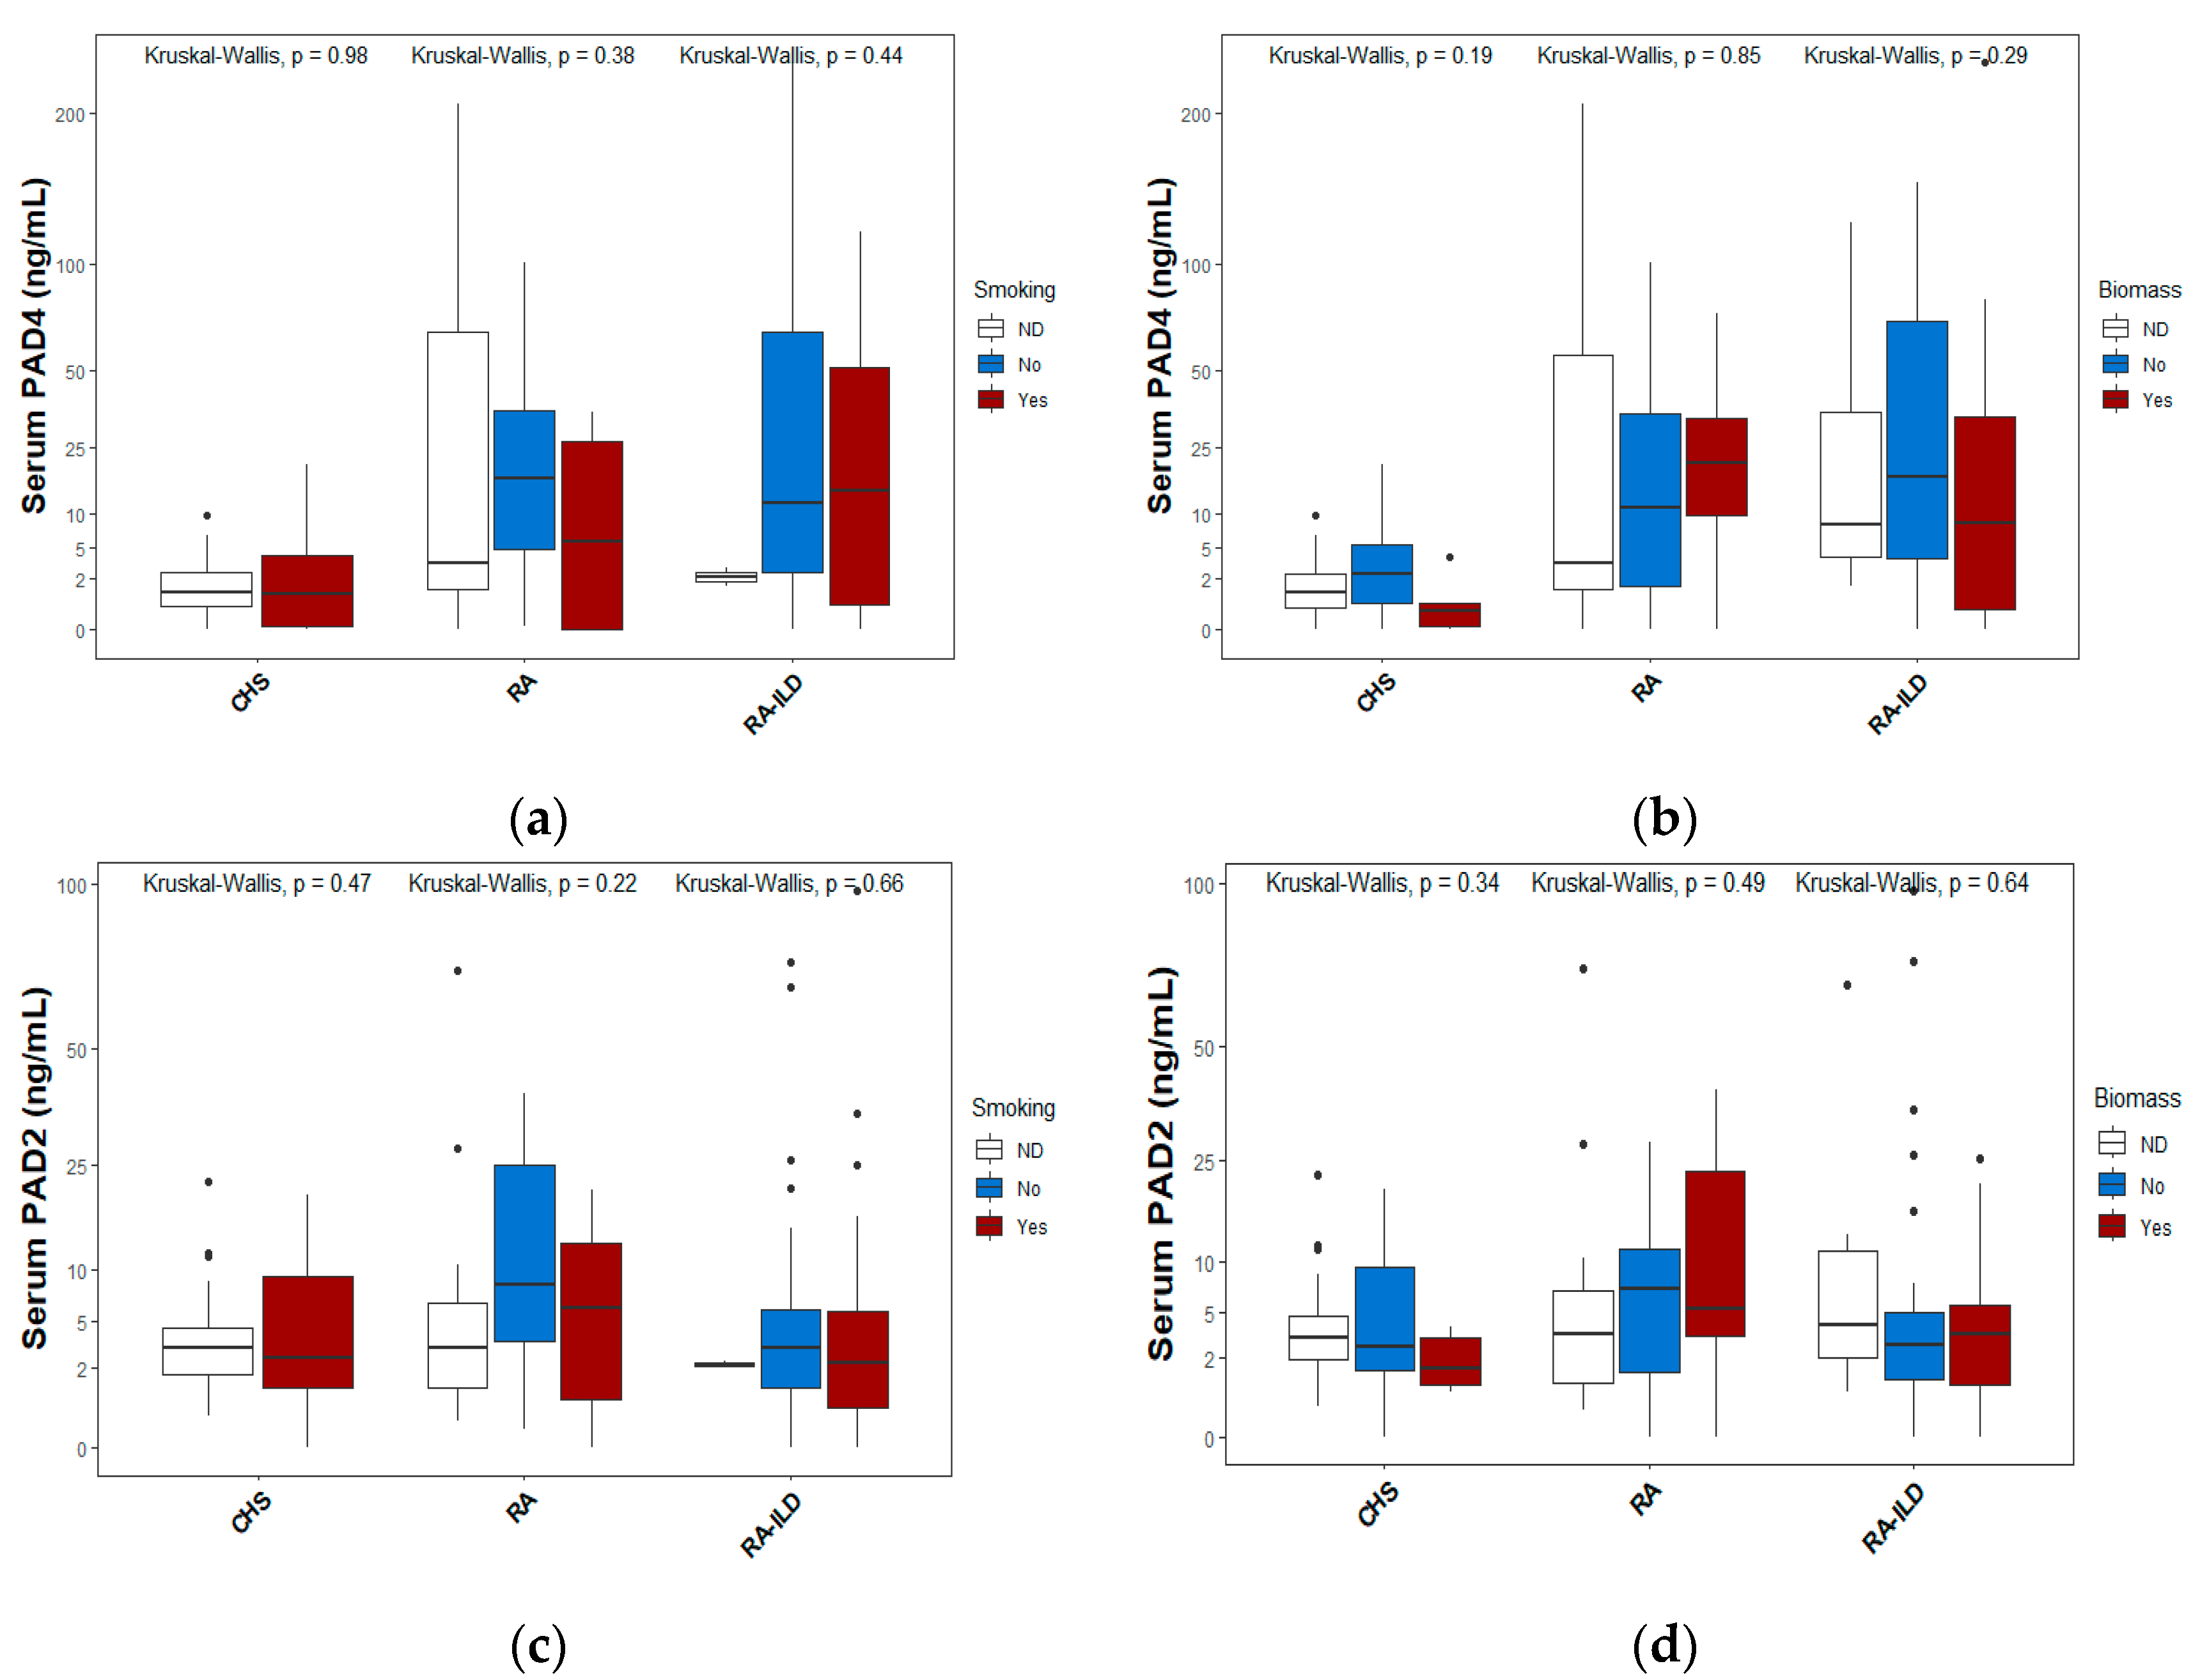
Figure 4 displays the levels of PAD4 and PAD2 proteins according to exposure to smoking (a and c) or biomass (b and d), which are the primary environmental factors associated with the risk of both lung and joint diseases. In each figure, median values and interquartile ranges are depicted using box-and-whisker plots. The classification is based on smoking status or, in the case of exposure to biomass-burning smoke.
2.6. Proteins in BAL samples
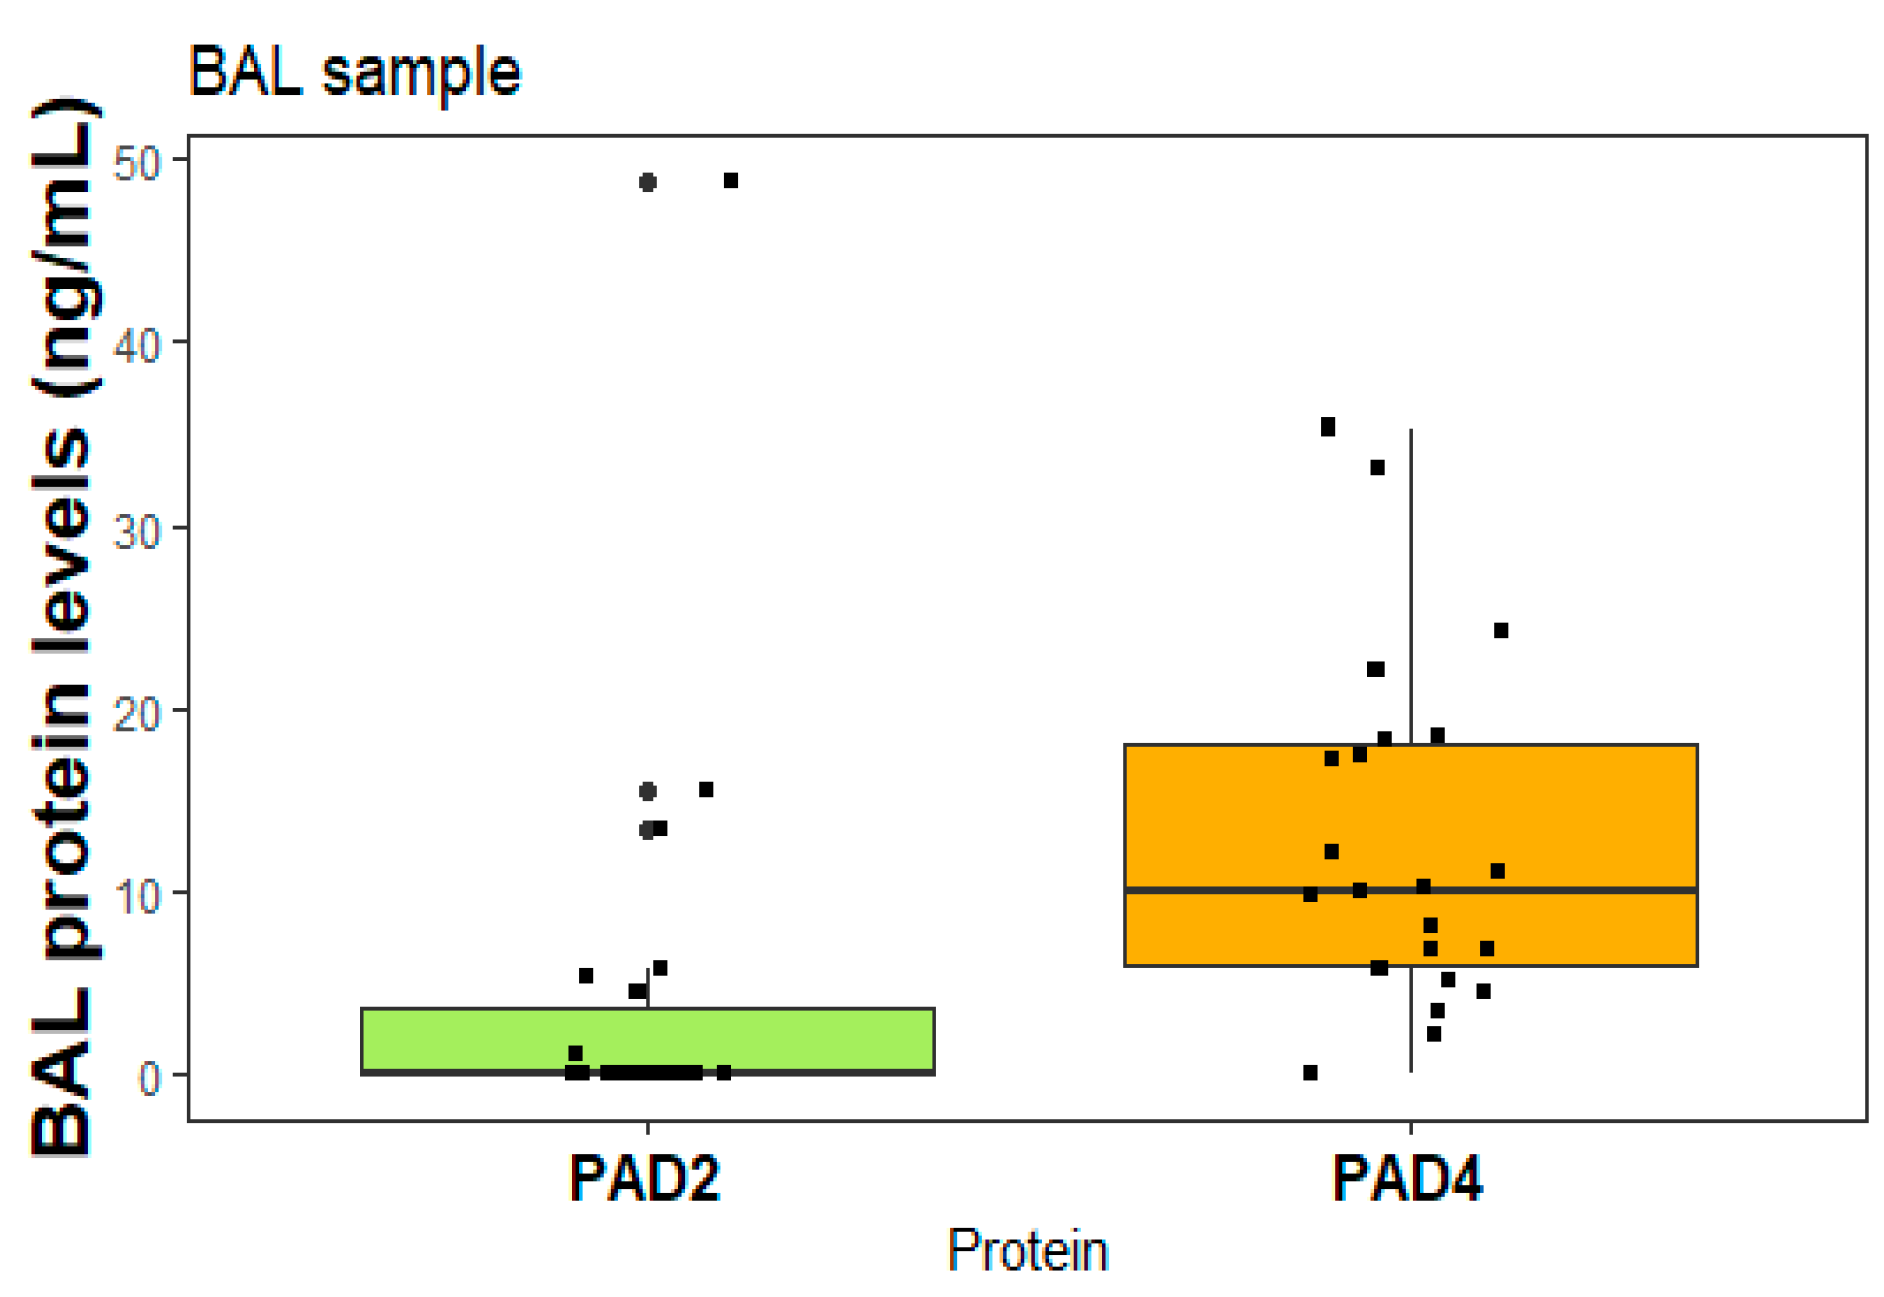
Figure 5 presents the levels of PAD2 and PAD4 proteins, specifically measured in patients diagnosed with RA-ILD who underwent bronchoscopy for diagnostic purposes. Each box in the figure represents an individual patient.
3. Methods
The genetic data analysis was conducted using Plink v1.07[
7]. A total of 23 SNVs were assessed in 907 individuals, with the analysis divided into two parts: initially, 14 AIMs were examined independently, followed by an investigation of 8 SNVs, including four from
PADI2 and four from
PADI4, for genetic association analysis.
A quality control process was implemented for all polymorphisms to ensure data quality. Individuals with more than 5% missing data, attributed to unsuccessful genotyping of SNVs, were excluded, resulting in the removal of 40 individuals. Additionally, a marker-level evaluation of Hardy-Weinberg equilibrium was performed, leading to the exclusion of SNV rs2235926 in PADI4 (p = 8.9x10⁻²⁴).
Ancestry markers were analyzed in Plink v1.07, utilizing CEU and ZAP as reference populations, obtained from Phase 3 of the 1000 Genomes Project and the International HapMap Project (websites:
http://browser.1000genomes.org and
https://ftp.ncbi.nlm.nih.gov/hapmap, respectively) [
5,
8]. The F
ST index was assessed in R using the “Fine Pop” package, and distances were analyzed within a matrix among the three study groups, calculating the global F
ST [
9].
Protein levels were analyzed through non-parametric tests comparing the three groups. Medians and interquartile ranges were assessed using the Kruskal-Wallis test, and these statistics are presented in box-and-whisker plots for protein levels.
3.1 Ethical statement
Approval for this study was obtained from the Research Institutional Committees for Research, Biosecurity, and Research Ethics at the Instituto Nacional de Enfermedades Respiratorias Ismael Cosío Villegas (INER) under the approval codes B20-15 and C08-15. All participants were granted their authorization and signed informed consent forms. INER provided a document ensuring the safeguarding, including, and adequately handling of personal data as sensitive and confidential information. The research adhered to the guidelines outlined in the 1975 Declaration of Helsinki.
Author Contributions
Conceptualization, Karol Nava-Quiroz, Jorge Rojas-Serrano, Gloria Pérez-Rubio, Ivette Buendia-Roldan and Ramcés Falfán-Valencia; Data curation, Karol Nava-Quiroz, Ivette Buendia-Roldan, Mayra Mejía, Juan Fernández-López and Espiridión Ramos-Martínez; Formal analysis, Karol Nava-Quiroz, Gloria Pérez-Rubio, Mayra Mejía, Juan Fernández-López, Espiridión Ramos-Martínez and Alma Del Ángel-Pablo; Funding acquisition, Ramcés Falfán-Valencia; Investigation, Karol Nava-Quiroz, Jorge Rojas-Serrano, Gloria Pérez-Rubio, Ivette Buendia-Roldan, Mayra Mejía, Juan Fernández-López, Espiridión Ramos-Martínez, Alma Del Ángel-Pablo and Ramcés Falfán-Valencia; Methodology, Karol Nava-Quiroz, Gloria Pérez-Rubio, Ivette Buendia-Roldan, Juan Fernández-López, Luis López-Flores, Alma Del Ángel-Pablo and Ramcés Falfán-Valencia; Project administration, Ramcés Falfán-Valencia; Resources, Jorge Rojas-Serrano, Mayra Mejía, Espiridión Ramos-Martínez, Luis López-Flores and Ramcés Falfán-Valencia; Software, Karol Nava-Quiroz, Gloria Pérez-Rubio, Juan Fernández-López, Luis López-Flores and Alma Del Ángel-Pablo; Supervision, Jorge Rojas-Serrano, Mayra Mejía and Ramcés Falfán-Valencia; Validation, Jorge Rojas-Serrano, Gloria Pérez-Rubio, Mayra Mejía, Juan Fernández-López, and Alma Del Ángel-Pablo; Visualization, Jorge Rojas-Serrano and Ramcés Falfán-Valencia; Writing – original draft, Karol Nava-Quiroz, Jorge Rojas-Serrano, Gloria Pérez-Rubio, Espiridión Ramos-Martínez and Ramcés Falfán-Valencia; Writing – review & editing, Karol Nava-Quiroz, Gloria Pérez-Rubio and Ramcés Falfán-Valencia.
Institutional Review Board Statement
The research adhered to the principles of the Declaration of Helsinki and received approval from the Ethics Committee of the Instituto Nacional de Enfermedades Respiratorias “Ismael Cosío Villegas” (with protocol codes B20-15 and C08-15).
Informed Consent Statement
Consent was secured from all research participants, encompassing written consent and assurance of personal data confidentiality for publication purposes, both from the patients and healthy subjects who partook in the study.
Data Availability Statement
The datasets generated for this study can be found in ClinVar accessions SCV001422427 – SCV001422434.
Acknowledgments
Programa de Maestría y Doctorado en Ciencias Médicas Odontológicas y de la Salud of the Universidad Nacional Autónoma de México (UNAM). Furthermore, the support provided by the Consejo Nacional de Humanidades, Ciencia y Tecnología (National Council of Science and Technology) (CONAHCyT), CVU: 690362.
Conflicts of Interest
All authors declare no conflict of interest.
References
- Kelly, C.; Iqbal, K.; Iman-Gutierrez, L.; Evans, P.; Manchegowda, K. Lung Involvement in Inflammatory Rheumatic Diseases. Best Pract. Res. Clin. Rheumatol. 2016, 30, 870–888. [CrossRef]
- Smolen, J.S.; Landewé, R.; Breedveld, F.C.; Buch, M.; Burmester, G.; Dougados, M.; Emery, P.; Gaujoux-Viala, C.; Gossec, L.; Nam, J.; et al. EULAR Recommendations for the Management of Rheumatoid Arthritis with Synthetic and Biological Disease-Modifying Antirheumatic Drugs: 2013 Update. Ann. Rheum. Dis. 2014, 73, 492–509. [CrossRef]
- Bilgici, A.; Ulusoy, H.; Kuru, O.; Celenk, C.; Ünsal, M.; Danacı, M. Pulmonary Involvement in Rheumatoid Arthritis. Rheumatol. Int. 2005, 25, 429–435. [CrossRef]
- Peláez-Ballestas, I.; Sanin, L.H.; Moreno-Montoya, J.; Alvarez-Nemegyei, J.; Burgos-Vargas, R.; Garza-Elizondo, M.; Rodríguez-Amado, J.; Goycochea-Robles, M.V.; Madariaga, M.; Zamudio, J.; et al. Epidemiology of the Rheumatic Diseases in Mexico. A Study of 5 Regions Based on the COPCORD Methodology. J. Rheumatol. 2011, 38, 3–6. [CrossRef]
- Silva-Zolezzi, I.; Hidalgo-Miranda, A.; Estrada-Gil, J.; Fernandez-Lopez, J.C.; Uribe-Figueroa, L.; Contreras, A.; Balam-Ortiz, E.; Bosque-Plata, L.; Velazquez-Fernandez, D.; Lara, C.; et al. Analysis of Genomic Diversity in Mexican Mestizo Populations to Develop Genomic Medicine in Mexico. PNAS 2009, 106, 8611–8616. [CrossRef]
- Regalado, J.; Pérez-Padilla, R.; Sansores, R.; Páramo-Ramirez, J.I.; Brauer, M.; Paré, P.; Vedal, S. The Effect of Biomass Burning on Respiratory Symptoms and Lung Function in Rural Mexican Women. Am. J. Respir. Crit. Care Med. 2006, 174, 901–905. [CrossRef]
- Purcell, S.; Neale, B.; Todd-Brown, K.; Thomas, L.; Ferreira, M.; Bender, D.; Maller, J.; Sklar, P.; de Bakker, P.; Daly, MJ & Sham, P. PLINK: A Toolset for Whole-Genome Association and Population-Based Linkage Analysis. Am. J. Hum. Genet. 2007, 81. [CrossRef]
- Pardo-Seco, J.; Martinón-Torres, F.; Salas, A. Evaluating the Accuracy of AIM Panels at Quantifying Genome Ancestry. BMC Genomics 2014, 15. [CrossRef]
- Team, R.C. R: A Language and Environment for Statistical Computing. Vienna, Austria 2021.
|
Disclaimer/Publisher’s Note: The statements, opinions and data contained in all publications are solely those of the individual author(s) and contributor(s) and not of MDPI and/or the editor(s). MDPI and/or the editor(s) disclaim responsibility for any injury to people or property resulting from any ideas, methods, instructions or products referred to in the content. |
© 2023 by the authors. Licensee MDPI, Basel, Switzerland. This article is an open access article distributed under the terms and conditions of the Creative Commons Attribution (CC BY) license (http://creativecommons.org/licenses/by/4.0/).
