

Submitted:
25 September 2023
Posted:
27 September 2023
You are already at the latest version
Abstract
Hispanics are disproportionately affected by low rates of physical activity and high rates of chronic diseases. Hispanics generally and Mexican Americans specifically are underrepresented in research on physical activity and its impact on mental well-being. Some community-based interventions have been effective in increasing physical activity among Hispanics. This study examined data from a sample of low-income Hispanic participants in free community exercise classes to characterize the association between self-reported frequency of exercise class attendance, intensity of physical activity, and participant well-being. As part of two cross-sectional samples recruited from a stratified random sample of community exercise classes, 302 participants completed a questionnaire consisting of a modified version of the Godin-Shephard Leisure-Time Exercise Questionnaire (LTEQ) and the Mental Health Continuum Short Form (MHC-SF). Adjusted binary logistic regression analyses indicated that those who achieve moderate and strenuous self-reported physical activity have 130% higher odds (p = 0.0422) of positive mental well-being after adjustment for age, attendance, and self-reported health. This study provides evidence that physical activity intensity and time are associated with flourishing mental health among Hispanics. The study provides insight into the planning and development of community-based physical activity programming tailored to low-income populations.
Keywords:
US-Mexico border health
; community-wide campaign
; physical exercise
; mental health
; public health
; Latino community health
; health behavior promotion
1. Introduction
Many studies have shown that regular, moderate, and strenuous physical activity prevents the risk of noncommunicable diseases including obesity, cardiovascular disease, and diabetes [1]. Hispanics in the U.S. are less physically active across all subgroups than non-Hispanic whites, with socioeconomic factors partially contributing to the disparity [2]. A study comparing Hispanic respondents from the 2009 national Behavioral Risk Factor Surveillance System (BRFSS) to the Cameron County Hispanic Cohort (CCHC), a randomly-ascertained cohort of around 5,000 Mexican American living in communities near the Texas-Mexico border, revealed significant health disparities in preventive health behaviors, including physical activity. National BRFSS respondents were significantly more likely than local CCHC participants to meet recommended physical activity guidelines (44.14% vs 33.3%) [3].
Hispanics generally and Mexican American populations specifically are underrepresented in research on physical activity, but literature exists to guide the development of community interventions prioritizing these groups. Interventions focused on addressing barriers to physical activity (e.g., cost, transportation, cultural fit) have been shown to increase the adoption and maintenance of regular leisure-time physical activity among underserved populations, including Mexican American and lower-income individuals living in the Rio Grande Valley [4,5,6]. In addition, community-based interventions have been shown to be successful in increasing physical activity among Mexican Americans by culturally tailoring interventions and increasing social support [7,8]. Social support is associated with regular exercise in all adults, regardless of ethnicity [9,10], and may explain why greater participation is reported for group exercise [11,12,13]. Evidence also suggests that participation in group park runs was statistically associated with higher levels of participation, satisfaction with exercise activity, and group cohesion [14].
Another area of physical activity research where Hispanics are underrepresented is in the impact of physical activity on mental well-being. Studies have shown an association between physical activity and positive emotions in older Hispanic adults [15]. Additionally, a statistically significant association between lack of physical activity and depressive mood symptoms, specifically among Spanish-speaking participants in the U.S. Texas-Mexico Border region, has also been reported [16]. These findings support the beneficial nature that physical activity has in association with positive mental health outcomes. Studies within the general population show that lack of physical activity can also impact mental health, resulting in increased risk of depression, anxiety, and lower levels of positive mental health [17,18,19]. These associations have not been evaluated among Mexican American populations, specifically those from low-income backgrounds. In general, the relation between poverty, physical activity, and mental health has been explored with findings demonstrating that low-income adults with low levels of physical activity experience poorer mental health outcomes using the Patient Health Questionnaire for Depression and Anxiety (PHQ-4) and Perceived Stress Scale (PSS) [20]. However, there is a gap in the literature substantiating this relationship between the amount of time doing physical activity, the intensity of that activity, and mental health among low-income Mexican American populations. The aim of this study is to fill that gap. Specifically, this study examined data from a sample of low-income Hispanic participants in free community exercise classes along the U.S. Mexico Border to characterize the association between self-reported frequency of exercise class attendance, intensity of physical activity, and participant well-being.
2. Materials and Methods
The Tu Salud ¡Si Cuenta! (TSSC) program was developed to address health disparities in chronic disease disproportionately affecting residents of Cameron and Hidalgo counties, located in the U.S. Texas-Mexico Border region. Approximately 1.2 million people, predominantly Mexican American residents, live in Cameron and Hidalgo counties [21]. Residents experience some of the highest rates of poverty, chronic disease, and related mortality when compared to other regions of the state and nation [22,23]. Historically, the high poverty rates, lack of access to healthcare, and lack of environments, systems, and policies that promote healthy living result in nearly two-thirds of the population overweight or obese [3,24]. One-third of adults live with diabetes, exceeding the rate of U.S. Mexican Americans and non-Hispanic white populations [23]. The Tu Salud ¡Si Cuenta! (TSSC) program is based on evidence provided through recommendations from The Guide to Community Preventive Services. The guide recommends community-wide campaigns as large-scale initiatives delivering messages using mass media and providing individually-focused efforts such as physical activity counseling, health risk screenings, and education [25].
The TSSC community-wide campaign was designed and implemented by community partners, and has grown over the last 15 years to include many communities throughout the U.S. Texas-Mexico Border region. As one component of the program, TSSC offers hundreds of weekly and free exercise classes across the region community sites for residents [26,27]. The exercise classes offered through the TSSC program include walking groups, chair exercises, aerobics, and strength training exercises. The different class offerings help provide physical activity opportunities for participants of all experience levels and capabilities over time.
Two cross-sectional samples of participants attending community exercise classes between October 2018 and November 2019 were recruited from randomly selected exercise classes. Exercise classes were selected from the total number of classes available during the study period by year. A stratified random sample was conducted to ensure a proportional response from different class groupings. Classes are offered throughout the year but may vary based on venue and instructor availability along with participant interest. Random selection was done each year to account for this variability. Tu Salud ¡Si Cuenta! offers up to 250 free exercise classes each week at different times and venues across the county in 11 municipalities. A listing of the classes was enumerated by the city for the random selection process. If a city had only one type of class or one class, it was grouped with the nearest city geographically. Classes were listed in numerical order and assigned a class identification number. Using a random sequence generator without duplicates, classes were randomly selected for inclusion in the study. Between 30-40 classes were selected each year in order to provide a 15-20% sample of the total number of classes offered. The number of classes randomly selected in each city was determined by dividing 30 by the total number of blocks. The first sample selection was assessed for proportional representation of all class types being offered at that point in time. Both years, the sample was expanded to include an additional 2-3 classes to help ensure that the sample list captured all types of classes being offered. A total of eight of the 63 selected classes had no class participants or were canceled in 2018 and 2019.
A total of 481 participants from the 55 randomly selected exercise classes completed study questionnaires in 2018 and 2019. Of the 481 participants who completed the surveys, 302 participants were included in the analysis after excluding those who were not Hispanic, did not provide demographic information, did not correctly answer the physical activity questions, or did not complete the mental health portion of the questionnaire (Figure 1). All adults over the age of 18 years in every randomly selected class were asked to complete the questionnaire. The questionnaire was self-administered, took approximately 20 to 30 minutes to complete, and was available in both English and Spanish. The questionnaire was distributed at the randomly selected classes between October and November the year the sample was drawn, and it was only administered once per selected class. Staff were present to assist participants with completing the questionnaire if they were having difficulties with reading the questions. Some participants chose not to participate because they did not have time or for other unknown reasons. Participants were not asked to provide identifying information, so the questionnaires were completed anonymously.
Demographic variables: Categorical variables included Age (18-29, 30-39, 40-49, 50-59, 60), Sex (M/F), Hispanic / Latino (yes/no), Language (English vs Spanish), Insurance Status (Y/N), Employment (Employed for Wages, Self-Employed, Student, Other(retired/homemaker), Unable to Work, Currently Unemployed). We also measured Self-Reported Health (Fair, Good, Very Good, Excellent, Other), and How Often Do You Attend Class (None to Several times a month, One to Multiple times a week)(Table 1).
A modified version of the Godin-Shephard Leisure-Time Exercise Questionnaire (LTEQ) instrument was used to measure the intensity, frequency, and duration of intentional physical activity [28]. The LTEQ contains three main questions regarding strenuous, moderate, and mild exercise behaviors within a 7-day period. The responses to these items determine the intensity of physical activity. Each question provides examples of activities related to the specified intensity and asks for both the average number of minutes exercised and how many times each week the participant exercises. Minutes and times to participate in exercise were used as estimates for time completing physical activity. Weekly frequency of moderate or strenuous physical activity was multiplied by the minutes spent on each moderate or strenuous activity to calculate each participant’s weekly metabolic equivalent adjusted minutes (MET-minutes). The metric for being “physically active” was quantified as meeting the U.S. physical activity recommendations of ≥600 MET-minutes weekly [29].
The Mental Health Continuum Short Form (MHC-SF) was included in the questionnaire. The MHC-SF contains 14 questions regarding emotional, social, and psychological well-being over the course of two weeks prior to completing the questionnaire. All questions were answered using a six-point Likert scale ranging from Never to Every Day. This instrument was used to measure mental health, and using total scores, participant mental well-being was categorized into Languishing, Moderately Mentally Healthy, or Flourishing categories [30].
Simple descriptive statistics were created for all covariates, with standard deviations for continuous variables and counts and percentages for categorical variables. Chi-Square values (Table 2) were used to measure the association between mental well-being and all exercise covariates. Due to unexpected cell counts less than 5 for physical activity and frequency of class attendance, these variables were collapsed into binary variables. The Chi-Square test was used to determine whether an association existed between mental well-being and frequency of class attendance or the amount of self-reported MET minutes of activity. Logistic regression was used to explore these associations for all covariates. Unadjusted ORs (95% CI) models explored how each covariate individually is associated with mental well-being (Table 3). All covariates with p-values < 0.25 were used to create a final adjusted model. Since participation in exercise classes was the exposure of interest, we evaluated all two-way interactions between exercise classes (MET minute classifications and number of classes attended) and all other covariates using an alpha of 0.01 to account for multiple testing. SAS 9.4 was used to perform all analyses. An alpha of 0.05 was used to determine significance.
3. Results
Most participants were female (91.4%) and over 40 years (n = 216, 71.5%). The average age of participants was 48.2 (SD=13.9) with an age range of 18 to 86 years. Most participants in the study reported having met the standard for exercise using MET minutes whether activity levels used all types of activity (mild, moderate, strenuous) or simply included moderate and strenuous activity, which is more typical. Additionally, most participants reported an MHC-SF flourishing diagnosis (75.2%). There was roughly equal representation across employment status, preferred language, year of participation, and insurance status.
Without adjustment, age is associated with mental well-being. Participants who are aged 60+ have 140% higher odds of reporting flourishing mental well-being relative to those who are aged younger than 60 years.
After adjustment, we found that physical activity level is associated with mental well-being in Model 1 where all activity levels are considered (Table 4). The inclusion of mild activity increased the odds of positive mental health. When considering all levels of activity, those who achieve moderate and strenuous self-reported physical activity have 130% higher odds (p = 0.0422) of mental well-being after adjustment for age, attendance, and self-reported health. When only considering moderate and strenuous activity in self-reported physical activity level, the association is attenuated. Using moderate and strenuous activity after adjustment, those who achieve moderate and high activity report 89% higher odds of flourishing mental well-being with a p-value that is not significant at the traditional 0.05 level.
4. Discussion
This study provides evidence that physical activity intensity and time are associated with flourishing mental health among a Hispanic population attending exercise classes. We found that moderate and strenuous physical activity is associated with a flourishing mental health categorization as measured by the MHC-SF instrument among low-income Hispanics participating in exercise classes. Similarly, a study conducted with older Hispanic adults noted that physical activity was associated with positive emotions [16]. In general, exercise has been shown to improve mental health [31]. A study found the optimal range of physical activity required to associate it with better mental health was between 2.5 to 7.5 hours of physical activity a week [32]. Our study provides cross-sectional evidence that aligns with the current recommended physical activity guidelines [29]. When considering mild physical activity along with moderate and strenuous physical activity, our study provides additional evidence of a positive correlation between all levels of intensity of physical activity and flourishing mental health.
This study also found that mild, or light-intensity, physical activity was associated with a flourishing mental health categorization as it strengthened the association between physical activity and positive mental health among the same population of Hispanics participating in exercise classes. Similarly, a study found that mild physical activity was the optimal intensity for women to report positive mental health. However, the study also found that the optimal physical activity intensity for men for positive mental health was high intensity [33]. Interestingly, studies have found that light-intensity physical activity is also associated with many physical health benefits as well as meaningful improvements in mental health related to depressive symptoms in both the general adult and older adult populations [34,35,36]. Our study supports existing evidence that physical activity at any level is associated with positive mental health and our findings suggest that attending group exercise classes in low-income communities is associated with positive mental health.
Regarding the amount of time spent participating in physical activity, as shown in Table 2, participants who reported attending exercise classes one to multiple times a week were more likely to belong to the flourishing mental health category (82.7%) as opposed to those who reported attending exercise classes none to several times a month (17.3%). Studies suggested that higher participation or exercise class attendance may be explained by the social support aspect of group exercise classes [10].
A study conducted on Scottish adults indicated some estimates of time and intensity as it is associated with improved mental health. This study found that a minimum of 20 minutes of physical activity a week was associated with observed mental health benefits. The higher the participation and/or intensity the greater the mental health benefits [37]. The average length of a TSSC exercise class is 60 minutes, so participants attending one or more times a week easily achieved more than the 20 minutes observed by Hamer et al. [37]. In fact, attending two to three free TSSC exercise classes per week can help participants meet U.S. physical activity guidelines [29].
The TSSC program is helping to address moderate and strenuous physical activity disparities and reinforcing positive behaviors by tailoring classes to address the cultural and socio-economic barriers to exercising [3]. Cultural tailoring included use of local appealing music, recruitment of Hispanic instructors, provision of classes in Spanish, and opportunities for exercise incorporating culturally familiar dance styles (e.g., huapango). Additionally, by creating many opportunities at different times of day and days of the week, and in locations seen as familiar and safe in underserved neighborhoods (churches, schools, parks), accessibility is increased to individuals employed in shift work, acting as caregivers, and with mixed immigration status concerns. Future research should examine the effects of providing a safe infrastructure and active transportation to create opportunities for moderate and strenuous physical activity as well as activating public spaces for active transportation (i.e., walking and hiking) to ensure mild physical activity effects on mental health well-being.
Our findings indicate that frequent attendance at free TSSC exercise classes is associated with self-reported flourishing mental health. Based on these data, we can infer that at any level of physical activity and group exercise attendance are associated with reporting a flourishing positive mental health. We are not able to indicate that this relationship is causal, however. The TSSC program currently offers hundreds of group exercise classes each week, all of which are opportunities for participants to work towards meeting weekly physical activity recommendations. Future studies should examine the extent of the effect of social support as a factor influencing mental health through group exercise classes.
There are several limitations to consider in this study. Firstly, this cross-sectional study did not include a no-treatment control group. Therefore, we are unable to draw conclusions about flourishing and languishing mental health status among a group of Hispanic individuals not participating in exercise classes. Additionally, because this is cross-sectional data, it is not possible to determine causality between exercise class attendance and positive mental health. We are also not able to determine if participants who self-reported flourishing mental health were more likely to attend the exercise classes or whether attendance contributes to a flourishing mental health status. Another limitation is that participants self-reported their physical activity levels and positive mental health. It is possible that both variables could be reported more favorably. The sample was largely female, with only 8.6% male participants. Therefore, the associations reported are more robustly sound for Hispanic women. Engaging men in the TSSC exercise offerings is an ongoing challenge that is being addressed by providing various exercise options, including those centered around strength training and boot camps. Lastly, because identifying information was not collected, we were unable to determine whether a participant submitted multiple questionnaires either by attending two of the selected classes in one year, or by completing a questionnaire both years. As such, all data points may not be unique and some of the data may be duplicated.
5. Conclusions
All levels of physical activity were found to be associated with self-reported flourishing mental health among participants in the free, culturally relevant, exercise class offerings among low-income Mexican American Hispanics in this study. The exercise offerings ranged from light-intensity to high-intensity. Our findings contribute to existing research about the effect of physical activity on general mental health and can provide insight into the planning and development of community programming tailored to low-income populations.
Author Contributions
Conceptualization, Alma G. Ochoa-Del Toro, Belinda M. Reininger, Lisa Mitchell-Bennett, Candance Robledo, Michael Machiorlatti; methodology, Belinda M. Reininger, Michael Machiorlatti; software, Alma G. Ochoa-Del Toro, Amanda Davé, Rebecca Lozoya; validation, Rebecca Lozoya, Michael Machiorlatti; formal analysis, Michael Machiorlatti, Candance A. Robledo; investigation, Lisa Mitchell-Bennett, Belinda M. Reininger; resources, Belinda M. Reininger; data curation, Alma G. Ochoa Del-Toro, Rebecca N. Lozoya, Amanda C. Davé; writing—original draft preparation, Alma G. Ochoa-Del Toro; Michael Machiorlatti, Belinda M. Reininger writing—review and editing, Alma G. Ochoa-Del Toro, Belinda M. Reininger, Lisa Mitchell-Bennett, Amanda C. Davé, Michael Machiorlatti, Candace A. Robledo, and Rebecca N. Lozoya; visualization, Alma G. Ochoa-Del Toro; supervision, Belinda M. Reininger; project administration, Lisa A. Mitchell-Bennett, Amanda C. Davé, Belinda M. Reininger; funding acquisition, Belinda M. Reininger. All authors have read and agreed to the published version of the manuscript.
Funding
This research was partially funded by the UT Health Clinical and Translational Science Award (UL1 TR003167) and the Texas Health and Human Services Commission SNAP-Ed program.
Institutional Review Board Statement
The study was conducted in accordance with the Declaration of Helsinki, and approved by the Institutional Review Board of the University of Texas Health Sciences at Houston (HSC-SPH-18-0584, 09/19/2022).
Informed Consent Statement
Informed consent was obtained from all subjects involved in the study.
Data Availability Statement
The data presented in this study are available on request from the corresponding author.
Acknowledgments
We would like to thank the following partners including the cities, towns and precincts of Brownsville, Combes, Harlingen, La Feria, Los Fresnos, Los Indios, Port Isabel, Rio Hondo, San Benito, Hidalgo County Precincts 1 and 4. We would also like to recognize staff on our University team including Marcelina Martinez, Alba Flores, Mirna Carrizales, Jessica Perez, and Otila Estrada. Finally, a special thanks to Maria Zolezzi and Andrey Shalomov for assisting with the integration of mental health in this area of our research.
Conflicts of Interest
The authors declare no conflict of interest.
References
- Reiner, M., Niermann, C., Jekauc, D. et al. Long-term health benefits of physical activity – a systematic review of longitudinal studies. BMC Public Health 2013, 13, 813. [CrossRef]
- Bautista, L, Reininger, B, Gay, J, et al. Perceived barriers to exercise in Hispanic adults by level of activity. J Phys Act Health 2011, 8, 916-25. [CrossRef]
- Reininger, Belinda; Wang, Jing; Cron, Stanley; and Fisher-Hoch, Susan P. Preventive Health Behaviors among Hispanics: Comparing A US-Mexico Border Cohort and National Sample. International Journal of Exercise Science: Conference Proceedings 2012, 6. Available at: https://digitalcommons.wku.edu/ijesab/vol6/iss2/19.
- Heredia N, Lee M, Mitchell-Bennett L, Reininger B. Tu Salud, ¡Sí Cuenta! Your Health Matters! A community-wide campaign in a Hispanic border community in Texas. J Nutr Educ Behav 2017, 49, 801-809. [CrossRef]
- Hovell MF, Mulvihill MM, Buono MJ, et al. Culturally tailored aerobic exercise intervention for low-income Latinas. Am J Health Promot 2008, 22, 155-163. [CrossRef]
- Vincent D. Culturally tailored education to promote lifestyle change in Mexican Americans with type 2 diabetes. J Am Acad Nurse Pract 2009; 21: 520-527. [CrossRef]
- Ickes MJ, Sharma M. A systematic review of physical activity interventions in Hispanic adults. J Environ Public Health 2012, 2012, 156435. [CrossRef]
- Heredia NI, Reininger BM. Exposure to a community-wide campaign is associated with physical activity and sedentary behavior among Hispanic adults on the Texas-Mexico border. BMC Public Health 2017, 17, 883. [CrossRef]
- Kouvonen A, De Vogli R, Stafford M, et al. Social support and the likelihood of maintaining and improving levels of physical activity: the Whitehall II Study. Eur J Public Health 2012, 22, 514-8. [CrossRef]
- Smith LG, Banting L, Eime R, et al. The association between social support and physical activity in older adults: a systematic review. Int J Behav Nutr Phys Act 2017, 14, 56. [CrossRef]
- Graupensperger S, Gottschall JS, Benson AJ, et al. Perceptions of groupness during fitness classes positively predict recalled perceptions of exertion, enjoyment, and affective valence: An intensive longitudinal investigation. Sport Exerc Perform Psychol 2019, 8, 290-304. [CrossRef]
- Heinrich, K, Kurtz, B, Patterson M, et al. Incorporating a Sense of Community in a Group Exercise Intervention Facilitates Adherence. Health Behav Res 2022, 5. doi: 10.4148/2572-1836.1124.
- Firestone MJ, Yi SS, Bartley KF, Eisenhower, DL. Perceptions and the role of group exercise among New York City adults, 2010-2011: an examination of interpersonal factors and leisure-time physical activity. Prev Med 2015, 72, 50-5. [CrossRef]
- Stevens M, Rees T, Polman R. Social identification, exercise participation, and positive exercise experiences: Evidence from parkrun. J Sports Sci 2018, 37, 221-228, doi: 10.1080/02640414.2018.1489360.
- Lee B, Howard EP. Physical Activity and Positive Psychological Well-Being Attributes Among U.S. Latino Older Adults. J Gerontol Nurs 2019, 45, 44-56. [CrossRef]
- Rizvi S, Khan AM. Physical Activity and Its Association with Depression in the Diabetic Hispanic Population. Cureus 2019, 11, e4981. [CrossRef]
- Schuch FB, Vancampfort D. Physical activity, exercise, and mental disorders: it is time to move on. Trends Psychiatry Psychother 2021, 43, 177-184. [CrossRef]
- Gomes M, Figueiredo D, Teixeira L, et al. Physical inactivity among older adults across Europe based on the SHARE database. Age Ageing 2017, 46, 71-77. [CrossRef]
- Tamminen N, Reinikainen J, Appelqvist-Schmidlechnew K, et al. Associations of physical activity with positive mental health: A population-based study. Ment Health and Phys Act 2020, 18. [CrossRef]
- Walsh JL, Senn TL, Carey MP. Longitudinal associations between health behaviors and mental health in low-income adults. Transl Behav Med 2013, 3, 104-13. [CrossRef]
- U.S. Census Bureau (2020). DEC Redistricting Data (PL 94-171). Retrieved from https://data.census.gov/cedsci/.
- U.S. Census Bureau (2020). American Community Survey 5-Year Estimates Subject Tables. Retrieved from https://data.census.gov/cedsci/.
- Fisher-Hoch S, Rentfro AR, Salinas JJ, et al. Socioeconomic status and prevalence of obesity and diabetes in a Mexican American community, Cameron County, Texas, 2004-2007. Prev Chronic Dis 2010, 7, A53.
- Alzoubi A, Abunaser R, Khassawneh A, et al. The Bidirectional Relationship between Diabetes and Depression: A Literature Review. Korean J Fam Med 2018, 39, 137-146. [CrossRef]
- Task Force on Community Preventive Services. Recommendations to increase physical activity in communities. Am J Prev Med 2002, 22, 67-72.
- Reininger BM, Barroso CS, Mitchell-Bennett L, et al. Process Evaluation and Participatory Methods in an Obesity-Prevention Media Campaign for Mexican Americans. Health Promot Pract 2010, 11, 347-57. [CrossRef]
- Heredia NI, Lee M, Mitchell-Bennett L, et al. Tu Salud ¡Sí Cuenta! Your Health Matters!: A quasi-experimental design to assess the contribution of a community-wide campaign to eating behaviors and anthropometric outcomes in a Hispanic border community in Texas. J Nutr Educ Behav 2017, 49, 801-809.e1. [CrossRef]
- Godin G, Shephard RJ. A simple method to assess exercise behavior in the community. Can J Appl Sport Sci 1985, 10, 141-6.
- U.S. Department of Health and Human Services. Physical Activity Guidelines for Americans, 2nd edition. Washington, DC: U.S.
- Lamers SMA, Westerhof GJ, Bohlmeijer ET, et al. Evaluating the psychometric properties of the mental health Continuum-Short Form (MHC-SF). J Clin Psychol 2011, 67, 99-110. [CrossRef]
- Sharma A, Madaan V, Petty FD. Exercise for mental health. Prim Care Companion J Clin Psychiatry 2006, 8, 106. [CrossRef]
- Kim YS, Park YS, Allegrante JP, et al. Relationship between physical activity and general mental health. Prev Med 2012, 55, 458-63. [CrossRef]
- Asztalos M, De Bourdeaudhuij I, Cardon G. The relationship between physical activity and mental health varies across activity intensity levels and dimensions of mental health among women and men. Public Health Nutr 2010, 13, 1207-14. [CrossRef]
- Füzéki E, Engeroff T, Banzar W. Health benefits of light-intensity physical activity: a systematic review of accelerometer data of the National Health and Nutrition Examinations Survey (NHANES). Sports Med 2017, 47, 1769-1793. [CrossRef]
- Loprinzi PD. Light-intensity physical activity and all-cause mortality. Am J Health Promot 2017, 31, 340-342. [CrossRef]
- Ku PW, Steptoe A, Liao Y, et al. Prospective relationship between objectively measured light physical activity and depressive symptoms in later life. Int J Geriatr Psychiatry 2018, 33, 58-65. [CrossRef]
- Hamer M, Stamataki E, Steptoe A. Dose-response relationship between physical activity and mental: the Scottish Health Survey. Br J Sports Med 2009, 43, 1111-4. [CrossRef]
Figure 1.
Flow diagram – Final sample size.
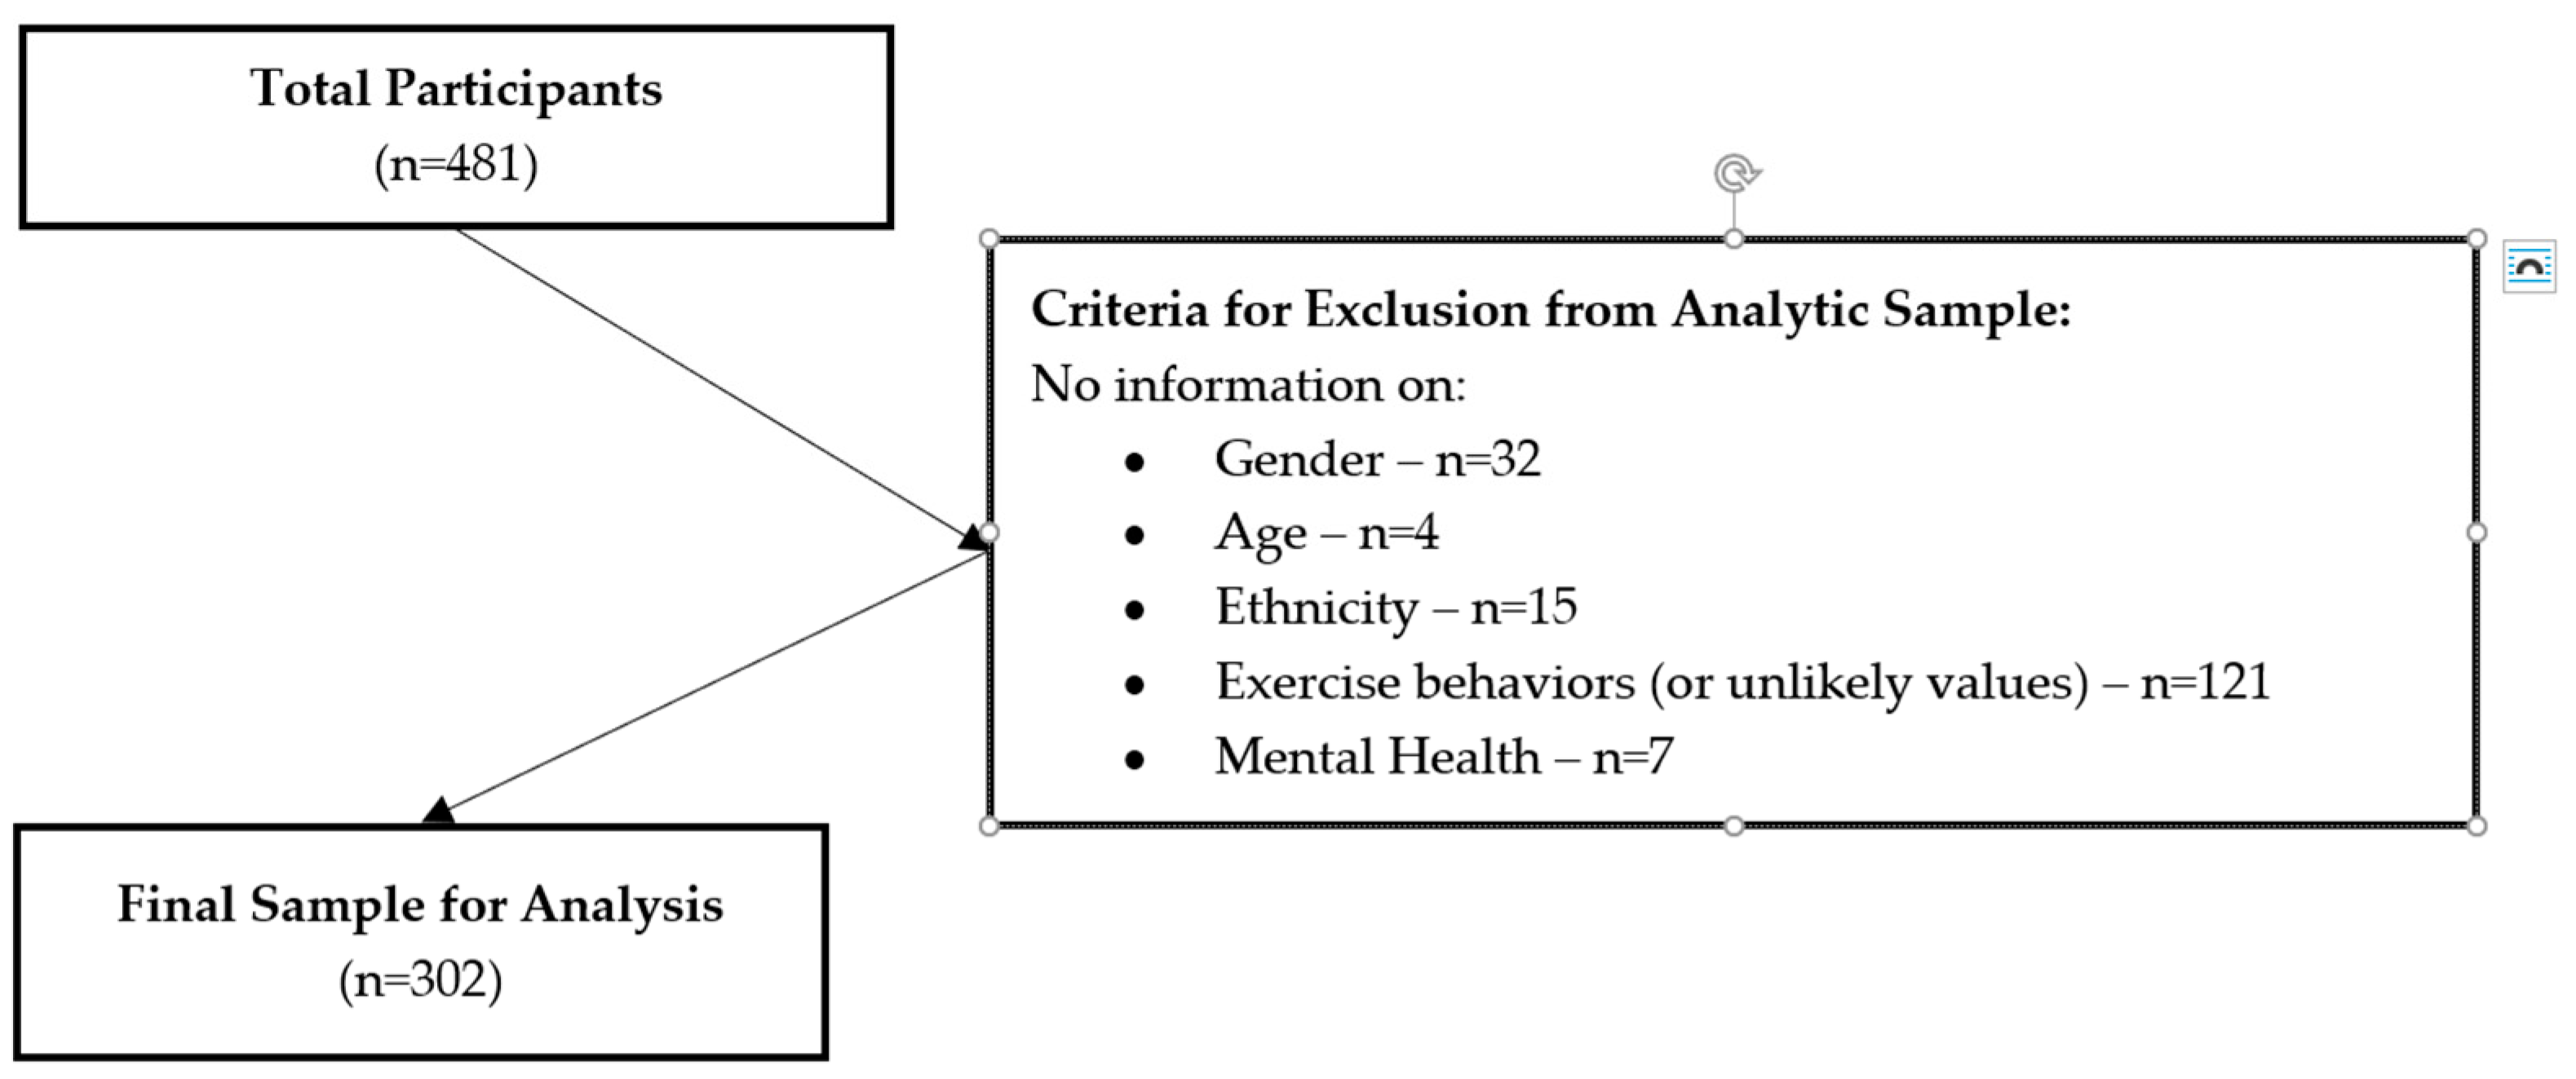

Table 1.
Demographic characteristics for Hispanic participants attending free community exercise classes, 2018-2019 (n=302).
Table 1.
Demographic characteristics for Hispanic participants attending free community exercise classes, 2018-2019 (n=302).
| Variable | Class | n (%) |
|---|---|---|
| Age Category | 18-29 | 28 (9.3) |
| 30-39 | 58 (19.2) | |
| 40-49 | 77 (25.5) | |
| 50-59 | 74 (24.5) | |
| 60+ | 65 (21.5) | |
| Sex | M | 26 (8.6) |
| F | 276 (91.4) | |
| Preferred Language | English | 161 (53.3) |
| Spanish | 141 (46.7) | |
| Year | 2018 | 149 (49.3) |
| 2019 | 153 (50.7) | |
| Insurance Status | No | 141 (48.0) |
| Yes | 153 (52.0) | |
| Employment Status | Unemployed (all reasons) | 151 (52.8) |
| Employed | 135 (47.2) | |
| Self-Reported Health Status |
Poor/Fair/Not Sure | 83 (28.2) |
| Good | 129 (43.7) | |
| Very Good | 50 (17.0) | |
| Excellent | 33 (11.2) | |
| Physical Activity Intensity Level 1 (mild+mod+strenuous) |
Sedentary/Low | 42 (13.9) |
| Mild/Strenuous (met recommendations) |
260 (86.1) | |
| Physical Activity Intensity Level 2 (mod+strenuous) |
Sedentary/Low | 61 (20.2) |
| Mild/Strenuous (met recommendations) |
241 (79.8) | |
| Time in Class Attendance | <1 to several times a month or my first wk. |
59 (19.9) |
| At least once weekly to multiple times wk. |
238 (80.1) | |
| MHC-SF Diagnosis of Mental Well-Being |
Languishing/Moderate | 75 (24.8) |
| Flourishing | 227 (75.2) |
Table 2.
Chi-Square tests for the association between mental well-being and frequency of class attendance and levels of physical activity among Hispanic participants.
Table 2.
Chi-Square tests for the association between mental well-being and frequency of class attendance and levels of physical activity among Hispanic participants.
| Mental Well-Being | |||
|---|---|---|---|
| Languishing & Moderate n (%) |
Flourishing n (%) |
χ2 p-value | |
| Time Attending Community Exercise Class | 0.0532 | ||
| None to several times a month or first time | 20 (27.8) | 39 (17.3) | |
| One to multiple times a week | 52 (72.2) | 186 (82.7) | |
| Mild, Moderate and Strenuous Intensity of Physical Activity (MET-adjusted minutes) | 0.0786 | ||
| Sedentary to Low | 15 (20.0) | 27 (11.9) | |
| Moderate to Strenuous | 60 (80.0) | 200 (88.1) | |
| Moderate and Strenuous Intensity of Physical Activity (MET-adjusted minutes) | 0.2014 | ||
| Sedentary to Low | 19 (25.3) | 42 (18.5) | |
| Moderate to Strenuous | 56 (74.7) | 185 (81.5) | |
Table 3.
Unadjusted binary logistic regression predicting ‘flourishing’ mental well-being among Hispanic participants – ORs [95% CI and p-value].
Table 3.
Unadjusted binary logistic regression predicting ‘flourishing’ mental well-being among Hispanic participants – ORs [95% CI and p-value].
| Variable | Class | OR (95% CI) | p-value |
|---|---|---|---|
| Age Category | 60+ vs < 60 | 2.40 (1.12,5.13) | 0.0237 |
| Sex | Male vs Female | 0.59 (0.25,1.39) | 0.2310 |
| Insurance | No vs Yes | 0.75 (0.44,1.27) | 0.2817 |
| Employment Status | Currently Unemployed vs Employed |
0.68 (0.4,1.18) | 0.1738 |
| Self-Reported Health | Good vs Poor/Fair/Not Sure | 1.51 (0.83,2.76) | 0.1440 |
| Very Good vs Poor/Fair/Not Sure | 2.72 (1.13,6.58) | 0.4798 | |
| Excellent vs Poor/Fair/Not Sure | 5.18 (1.45,18.47) | 0.0612 | |
| How Often Do You Attend Class | None to Several Times a Month vs One to Several Times a Week |
1.83 (0.99,3.41) | 0.0554 |
| Physical Activity Level | Moderate and Strenuous vs Sedentary and Low |
1.85 (0.93,3.71) | 0.0818 |
| Physical Activity Level† | Moderate and Strenuous vs Sedentary and Low |
1.50 (0.81,2.78) | 0.2031 |
†moderate+strenuous.
Table 4.
Adjusted binary logistic regression results of association with mental well-being among Hispanic participants – ORS [95% CI and p-value].
Table 4.
Adjusted binary logistic regression results of association with mental well-being among Hispanic participants – ORS [95% CI and p-value].
| Var | Class | Physical Activity Level | |||
|---|---|---|---|---|---|
| Model 1 mild+moderate+strenuous | Model 2 moderate+strenuous |
||||
| OR (95% CI) |
p-value | OR (95% CI) |
p-value | ||
| Age Category | 60+ vs < 60 | 2.21 (0.97,5.06) |
0.0596 | 2.22 (0.97,5.1) |
0.0595 |
| Self-Reported Health | Good vs Poor/Fair/Not Sure |
1.72 (0.9,3.29) |
0.5062 | 1.7 (0.89,3.26) |
0.4692 |
| Very Good vs Poor/Fair/Not Sure |
2.28 (0.91,5.69) |
0.7382 | 2.28 (0.91,5.68) | 0.7520 | |
| Excellent vs Poor/Fair/Not Sure |
4.36 (1.19,15.93) |
0.1098 | 4.5 (1.23,16.41) | 0.0974 | |
| How Often Do You Attend Class | At least once weekly to multiple times wk. vs <1 to several times a month or my first wk. |
1.75 (0.89,3.44) |
0.1075 | 1.79 (0.91,3.52) | 0.0904 |
| Physical Activity Level | Moderate and Strenuous vs Sedentary and Low |
2.30 (1.03,5.12) |
0.0422 | 1.89 (0.92,3.9) |
0.0848 |
Disclaimer/Publisher’s Note: The statements, opinions and data contained in all publications are solely those of the individual author(s) and contributor(s) and not of MDPI and/or the editor(s). MDPI and/or the editor(s) disclaim responsibility for any injury to people or property resulting from any ideas, methods, instructions or products referred to in the content. |
© 2023 by the authors. Licensee MDPI, Basel, Switzerland. This article is an open access article distributed under the terms and conditions of the Creative Commons Attribution (CC BY) license (http://creativecommons.org/licenses/by/4.0/).
Copyright: This open access article is published under a Creative Commons CC BY 4.0 license, which permit the free download, distribution, and reuse, provided that the author and preprint are cited in any reuse.


