Submitted:
22 September 2023
Posted:
25 September 2023
You are already at the latest version
Abstract
Land surface temperature (LST) is a crucial parameter in climate and ecology, exerting significant influence on meteorological conditions, ecosystems, and human life. LST data sources are diverse, with remote sensing being the prevailing means of acquisition. FY-4A/AGRI offers high-quality LST products for East Asia. In this study, we evaluated the performance of the product in Hunan Province and conducted refined analysis of surface heat resources based on the 4km/1h resolution product over a two-year period. The results demonstrate that the FY-4A LST product effectively captures surface temperature (R=0.893), albeit with a relatively high error level (Bias=-6.295℃; RMSE=8.58℃), particularly in capturing high LST values. The performance of this product is superior in the eastern flat terrain area of Hunan Province compared to its performance in the western mountainous region due to environmental conditions causing systematic errors that contribute to instability in detection deviation for this product. Surface heat resources are more abundant in eastern Hunan Province than in mountainous areas located west and southwardly, and the detailed distribution of them at finer scales is mainly influenced by the terrain and climate conditions. There is no obvious seasonal difference in the distribution of heat resources except in winter, and rapid urbanization within Chang-Zhu-Tan urban agglomeration during two years has significantly altered the spatial distribution pattern of surface heat resources across Hunan Province. These findings provide a quantitative baseline for assessing FY-4A satellite's detection capability while serving as a reference for further application of its LST products and establishing foundations for divisional classification and utilization strategies pertaining to surface heat resources within Hunan Province.
Keywords:
FY-4A/AGRI LST
; In situ measurement
; remote sensing product evaluation
; surface heat resource
; temporal and spatial analysis
1. Introduction
Land surface temperature (LST) is a crucial parameter in the surface energy balance, directly influencing the interaction between the surface and atmosphere[1], as well as various activities such as climate and hydrological cycles[2], animal and plant growth[3], human lives[4], and social production[5]. Consequently, LST has been recognized as one of the high-priority parameters by the International Geosphere and Biosphere Program (IGBP)[6].
The mainstream observation methods for LST include in situ measurements, remote sensing techniques, model simulations, etc., each with its own advantages and disadvantages. While data obtained through manual or instrument-based observations are accurate, they require continuous support in terms of manpower and funds for station construction and maintenance. Moreover, due to hardware limitations and ground environment constraints, the in situ measurements cannot provide large-scale spatial coverage or high spatial resolution data products. On the other hand, satellite-based remote sensing can easily acquire real-time land surface parameters over extensive areas; however, concerns regarding product accuracy necessitate ongoing authenticity testing and assessment along with improvements in detection equipment and retrieval algorithms. Model simulations can generate long time series of high spatial-temporal resolution LST products; nevertheless they demand advanced modeling techniques and precise input parameters while often exhibiting significant time delays[7] that fail to meet requirements for time-efficient applications.
With the advancement of satellite payload technology and continuous refinement of retrieval algorithms, there has been a significant enhancement in the precision and resolution of satellite-based remote sensing LST products. Notably, the latest generation of official geostationary satellite LST products can achieve kilometer-scale spatial resolution and hour-scale temporal resolution, thereby greatly enhancing their applicability. As the first satellite belonging to China's second-generation geostationary meteorological satellites, FY-4A is equipped with state-of-the-art detection instruments. And as the primary instrument of satellite payload, the advanced geostationary radiation imager (AGRI) is designed mainly to image the land surface, atmosphere, and cloud targets with high spatial and temporal resolution[8]. Despite providing various retrieval products derived from FY-4A since its operation commenced, extensive verification, evaluation, and applicaiton studies with these satellite-derived products have not yet been conducted.
The traditional analysis of surface heat resources and urban heat island effect primarily relies on in situ observation data. However, due to the significant heterogeneity of land use types and land surface characteristics such as vegetation, topography, and soil texture[4,9], LST exhibits rapid spatial and temporal changes[10]. The limited number of in situ observation stations results in low spatial resolution of data products that fail to meet the demand for high-quality analysis (e.g., Hunan Province's meteorological bureau has only 99 LST observation stations across an area of 211,800 km2). Nevertheless, satellite data provides the sole opportunity for measuring LST over a large spatial range with sufficiently high temporal-spatial resolution and complete spatially averaged values rather than point measurements[1]. Therefore, remote sensing LST products are more suitable for conducting temporal-spatial analysis of surface heat resources at a larger scale[11]. It is essential to authenticate remote sensing products within specific areas to determine their scientific validity as alternative measured data before assessing surface heat resources based on long-term series remote sensing LST products.
This study aims to comprehensively evaluate the FY-4A/AGRI LST product using in situ observation data from Hunan Province in central China while analyzing surface heat resources based on this long time series remote sensing product. The research findings can serve as a reference for further promotion and application of FY-4A LST products while providing technical support for assessing and zoning surface heat resources in Hunan Province. Additionally, this study's work can offer valuable data support for production management, urban construction, and government decision-making.
2. Materials and Methods
2.1. Study Area
Hunan Province is located in south-central China, spanning from 24°38`–30°08`N and 108°47`–114°15`E. Encompassing an area of 211,800 km2, the province lies within the transitional zone between the Yunnan-Guizhou Plateau and the Jiangnan Hills as well as the Nanling Mountains to the Jianghan Plain. The province is highest in the south and lowest in the north and is surrounded by mountains on three sides (Figure 1). Hunan Province has a variety of topographical and environmental conditions, with hills alternating with river valleys and basins in the central region, and the low-lying Dongting Lake Plain lies in the north. The climate of Hunan is continental subtropical monsoon humid with abundant light, heat and water resources but large intra-annual variations and significant vertical changes. The province has a high forest cover and a good natural environment.
2.2. Data
FY-4A/AGRI LST
FY-4A is a second-generation geostationary meteorological satellite in the Fengyun series of Chinese meteorological satellites that was launched in December 2016. It was launched in December 2016 and delivered in September 2017, positioned over the equator at 99.5°E (it later drifted to 104.7°E). FY-4A was the most advanced integrated atmospheric observation satellite of its time. The three-axis stabilized FY-4 series will offer full-disc coverage every 15 minutes or better (compared to 30min of FY-2) and the option for more rapid regional and mesoscale observation modes. The Advanced Geostationary Radiation Imager (AGRI) on FY-4A, with 14 channels, can be used to improve applications in a wide range of ocean, land, and atmosphere monitoring and in forecasting extreme weather, especially typhoons and thunderstorms[8]. The LST product is retrieved based on the split-window algorithm[12] and used two TIR bands (10.3-12.5 µm). The sensitivity of LST product is 0.2K, the spatial resolution is 4 km, and the temporal resolution is up to 15 min. The product was projected using the normalized projection (NOM) and was downloaded from http://satellite.nsmc.org.cn/. Data were stored in netCDF format.
In Situ Measured LST Data
The in situ LST measurements were obtained from the National Meteorological Observation Stations of CMA. These stations are predominantly situated in flat terrain areas with uniform land cover, making them representative of local-scale land surface conditions and thus suitable for verification benchmarking purposes. The in situ data were automatically collected using platinum resistance sensors with an accuracy of 0.1℃. Following quality control processes, the data range was limited to [-80, 80]℃. Hunan Province has a total of 99 stations (Figure 1), and the data were downloaded from https://data.cma.cn/ at an hourly temporal resolution.
2.3. Methods
2.3.1. Research Methods
The LST measurement unit of each product in the study was standardized as ℃, and the time was standardized as UTC. Given that the data quality flags in FY-4A LST product are identified as invalid parameters, no data filtering was performed on the remote sensing product. The following steps were undertaken to conduct this research:
1) Acquiring FY-4A/AGRI LST product from 2019-10-01 0 h to 2021-09-30 23 h and decoding and extracting data specifically for Hunan Province; employing the average method to standardize the temporal-spatial resolution of the products to a uniform scale of 1h/4km; conducting nearest-neighbor sampling to match the remote sensing product with in situ measurements by hour; utilizing this matched dataset for evaluation and assessment based on measured data.
2) Selecting stations with optimal, worst, and median correlation coefficient values between remote sensing product and in situ measurements based on evaluation results; selecting a dataset covering a one-year period for comparative analysis of time-series between remote sensing products and in situ measured data.
3) Analyzing surface heat resources of Hunan province based on extracted data from FY-4A LST product encompassing both years' worth of data.
2.3.2. Performance Indicators of Authenticity Test
The performance of remote sensing–based LST products in Hunan province was evaluated using following error parameters: Pearson correlation coefficient (R), Bias, Root mean square error (RMSE), and unbiased RMSE (ubRMSE).
where RST is the LST of each remote sensing–based product, IST is the in situ measured LST, cov () is the covariance, and σ is the standard deviation. Of the preceding parameters, greater R, lesser Bias, RMSE, and ubRMSE indicate better product performance.
2.3.3. Parameter Classification Method in Analysis—the Natural Breaks (Jenks)
In the spatial analysis of surface heat resources, due to the large differences in LST conditions among different regions of Hunan province, the traditional parameter classification method can not perform a better hierarchical display of data intensive areas when covering the classification of extreme value areas. To address this limitation, we employ the Natural breaks (Jenks) classification method[13] for mapping. This optimization algorithm enables a more detailed representation of spatial information in analysis and mapping by minimizing intra-category data differences and maximizing inter-category data differences during classification. The calculation steps are as follows:
Step 1: The user selects the attribute, x, to be classified and specifies the number of classes required, k.
Step 2: A set of k-1 random or uniform values are generated in the range [min(x), max(x)]. These are used as initial class boundaries.
Step 3: The mean values for each initial class are computed and the sum of squared deviations of class members from the mean values is computed. The total sum of squared deviations (TSSD) is recorded.
Step 4: Individual values in each class are then systematically assigned to adjacent classes by adjusting the class boundaries to see if the TSSD can be reduced. This is an iterative process, which ends when improvement in TSSD falls below a threshold level, i.e. when the within class variance is as small as possible and between class variance is as large as possible. True optimization is not assured. The entire process can be optionally repeated from Step 1 or 2 and TSSD values compared.
3. Results and Discussion
3.1. Evaluation of FY-4A LST Using In Situ Measurement
The hourly matched LST dataset of FY-4A/AGRI and in situ measurement of Hunan Province from 2019-10-01 0 h to 2021-09-30 23 h with a total of 5.394×10⁵ data quantity after data preprocessing. The comparative analysis shows (Figure 2) that the FY-4A product well-captured changes in surface temperature for Hunan Province (R=0.893), but that it generally underestimated LST (Bias = −6.295 °C) and had some deviation from in situ measurement (RMSE = 8.58 °C; ubRMSE = 5.842 °C), of which ubRMSE was significantly lower than RMSE, but still with a relatively high error value, which could also indicates that FY-4A LST product were greatly affected by systematic error and random error at the same time. Compared with relevant research, the error level of FY-4A LST product was higher than that of similar advanced Himawari imager (AHI) from Himawari-8[14]。
The strip with higher brightness in Figure 2 is the center of density of the scatterplot, the trend of its central zone changing with the increase of temperature shows that when LST was low (≤ 25℃), the accuracy of FY-4A LST was better and stable, and the center of density of its scatterplot was around the y = x line. But as the temperature increased (>25 ℃), the deviation from observation gradually increased, and the underestimation of LST became greater, which may be one reason for its larger overall error (Bias=-6.295 ℃; RMSE=8.58 ℃). Moreover, there were also some outliers in the product, which means that even when LST was low (the measured LST was 15-25 ℃), the FY-4A/AGRI instrument was unstable in detection.
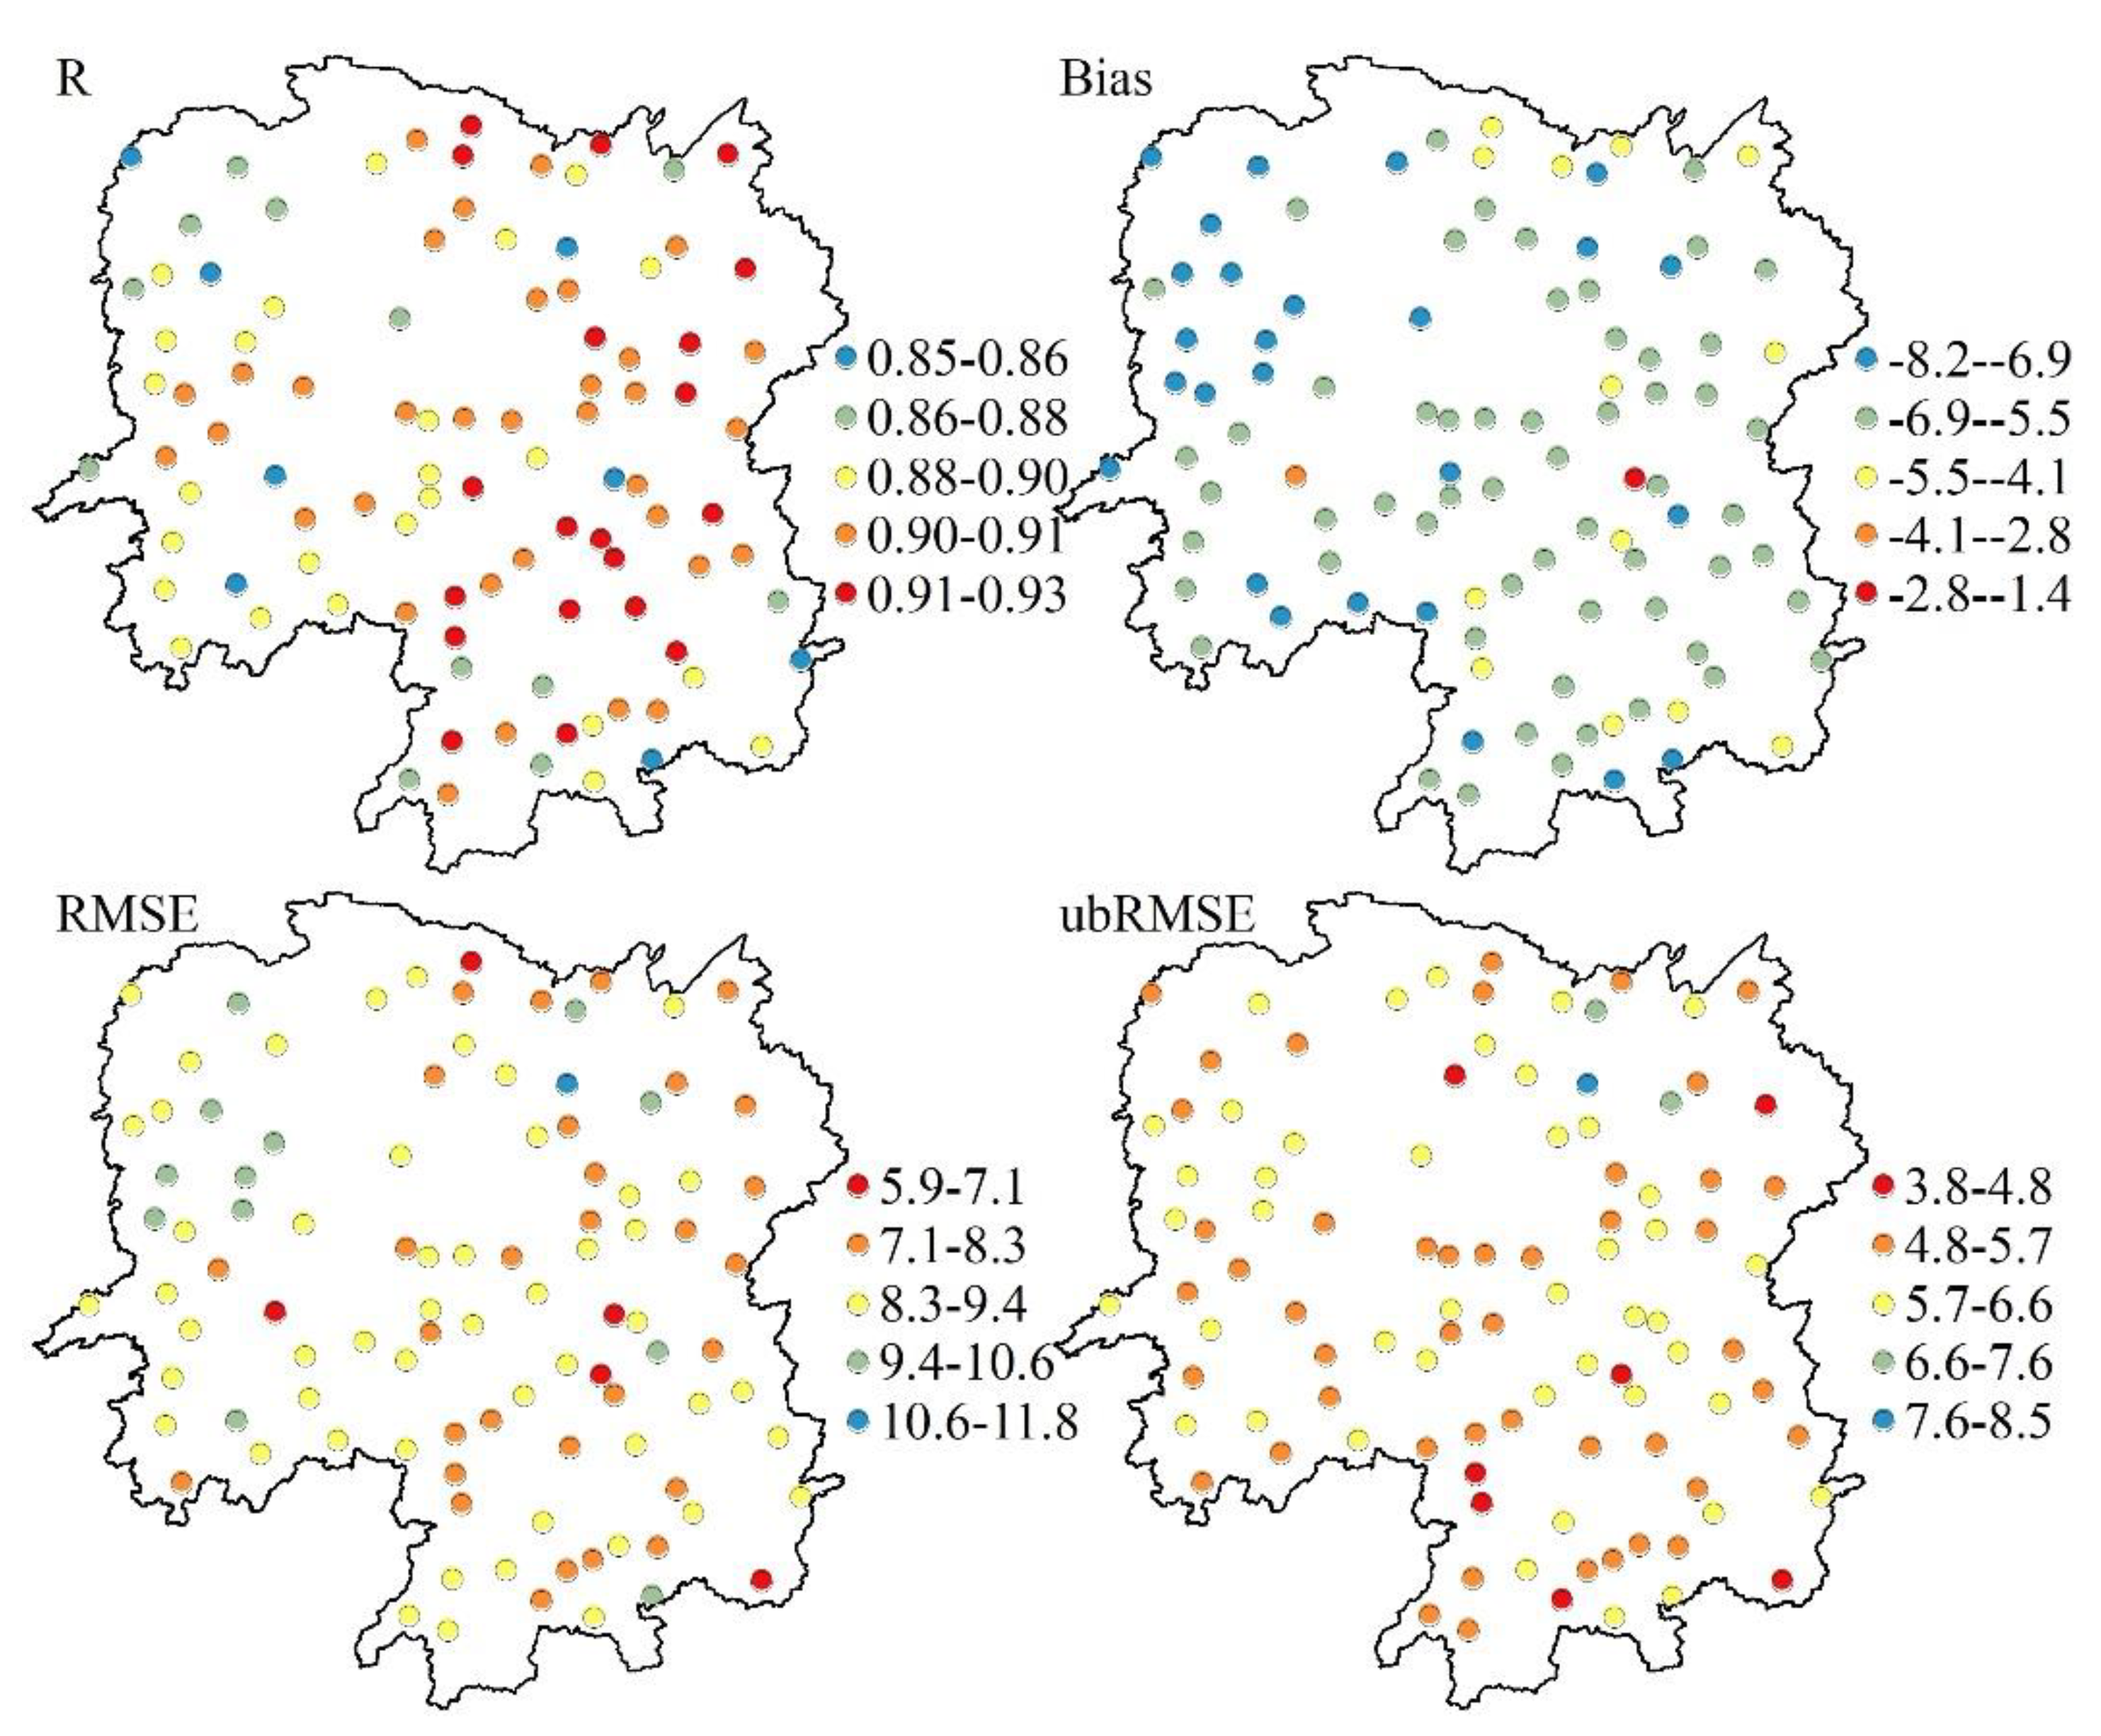
The performance indexes of in situ measured LST from 99 stations in Hunan Province with the remote sensing LST product in located FY-4A grids were calculated respectively using the matched dataset. From the spatial distribution map of these indexes, it can be seen that:
1. The R value of eastern stations in Hunan Province was generally higher than that of western; for the eastern region, the R value in the northeast stations was higher than that in the southeast. The distribution result of R value shows that the accuracy of satellite remote sensing LST may be closed related with the terrain. The west and south of Hunan are mountainous, while the central region is mostly plain terrain that conducive to satellite remote sensing. The lower R value of some stations in northeastern Hunan may be related to there stands the Dongting Lake, which is the second largest freshwater lake in China.
2. The overall deviation of stations in eastern Hunan is smaller than that in western Hunan (the Bias is closer to 0 and RMSE value is smaller); the random error in the detection has no obviously changing trend under various environmental conditions. The distribution of error parameters shows that the impact of terrain is mostly manifested in the high systematic error, and the accuracy of remote sensing product in mountainous area has more impact factors as well as more complex affect mechanisms than the plain area[15]. However, the instrument capability of FY-4A/AGRI and the retrieval algorithm of LST failed to well filter out the impact of complex terrain, resulting in the significantly higher systematic error level in mountainous areas. From this point of view, the eastern region of Hunan Province is more conducive to remote sensing detection. The distribution of ubRMSE shows that the random error has no spatial distribution characteristics in Hunan Province, the remote sensing detection accuracy is no longer greatly affected by topographic factors after removing the systematic error, but the accuracy of FY-4A LST on water body is still relatively low.
Figure 3.
Error parameters between FY-4A LST and in situ measurement in Hunan Province.
3.2. Time-Series Analysis between FY-4A LST and In Situ Measured Data
We selected three stations with the highest, median, and lowest R values between FY-4A LST and in situ measurements, and obtained one year of data (from 2020-10-01 0 h to 2021-09-30 23 h) for conducting time-series analysis.
Figure 4.
Time-series data of FY-4A LST product and in situ measurement data in 3 stations with the highest, median, and lowest R values in Hunan Province.
Figure 4.
Time-series data of FY-4A LST product and in situ measurement data in 3 stations with the highest, median, and lowest R values in Hunan Province.
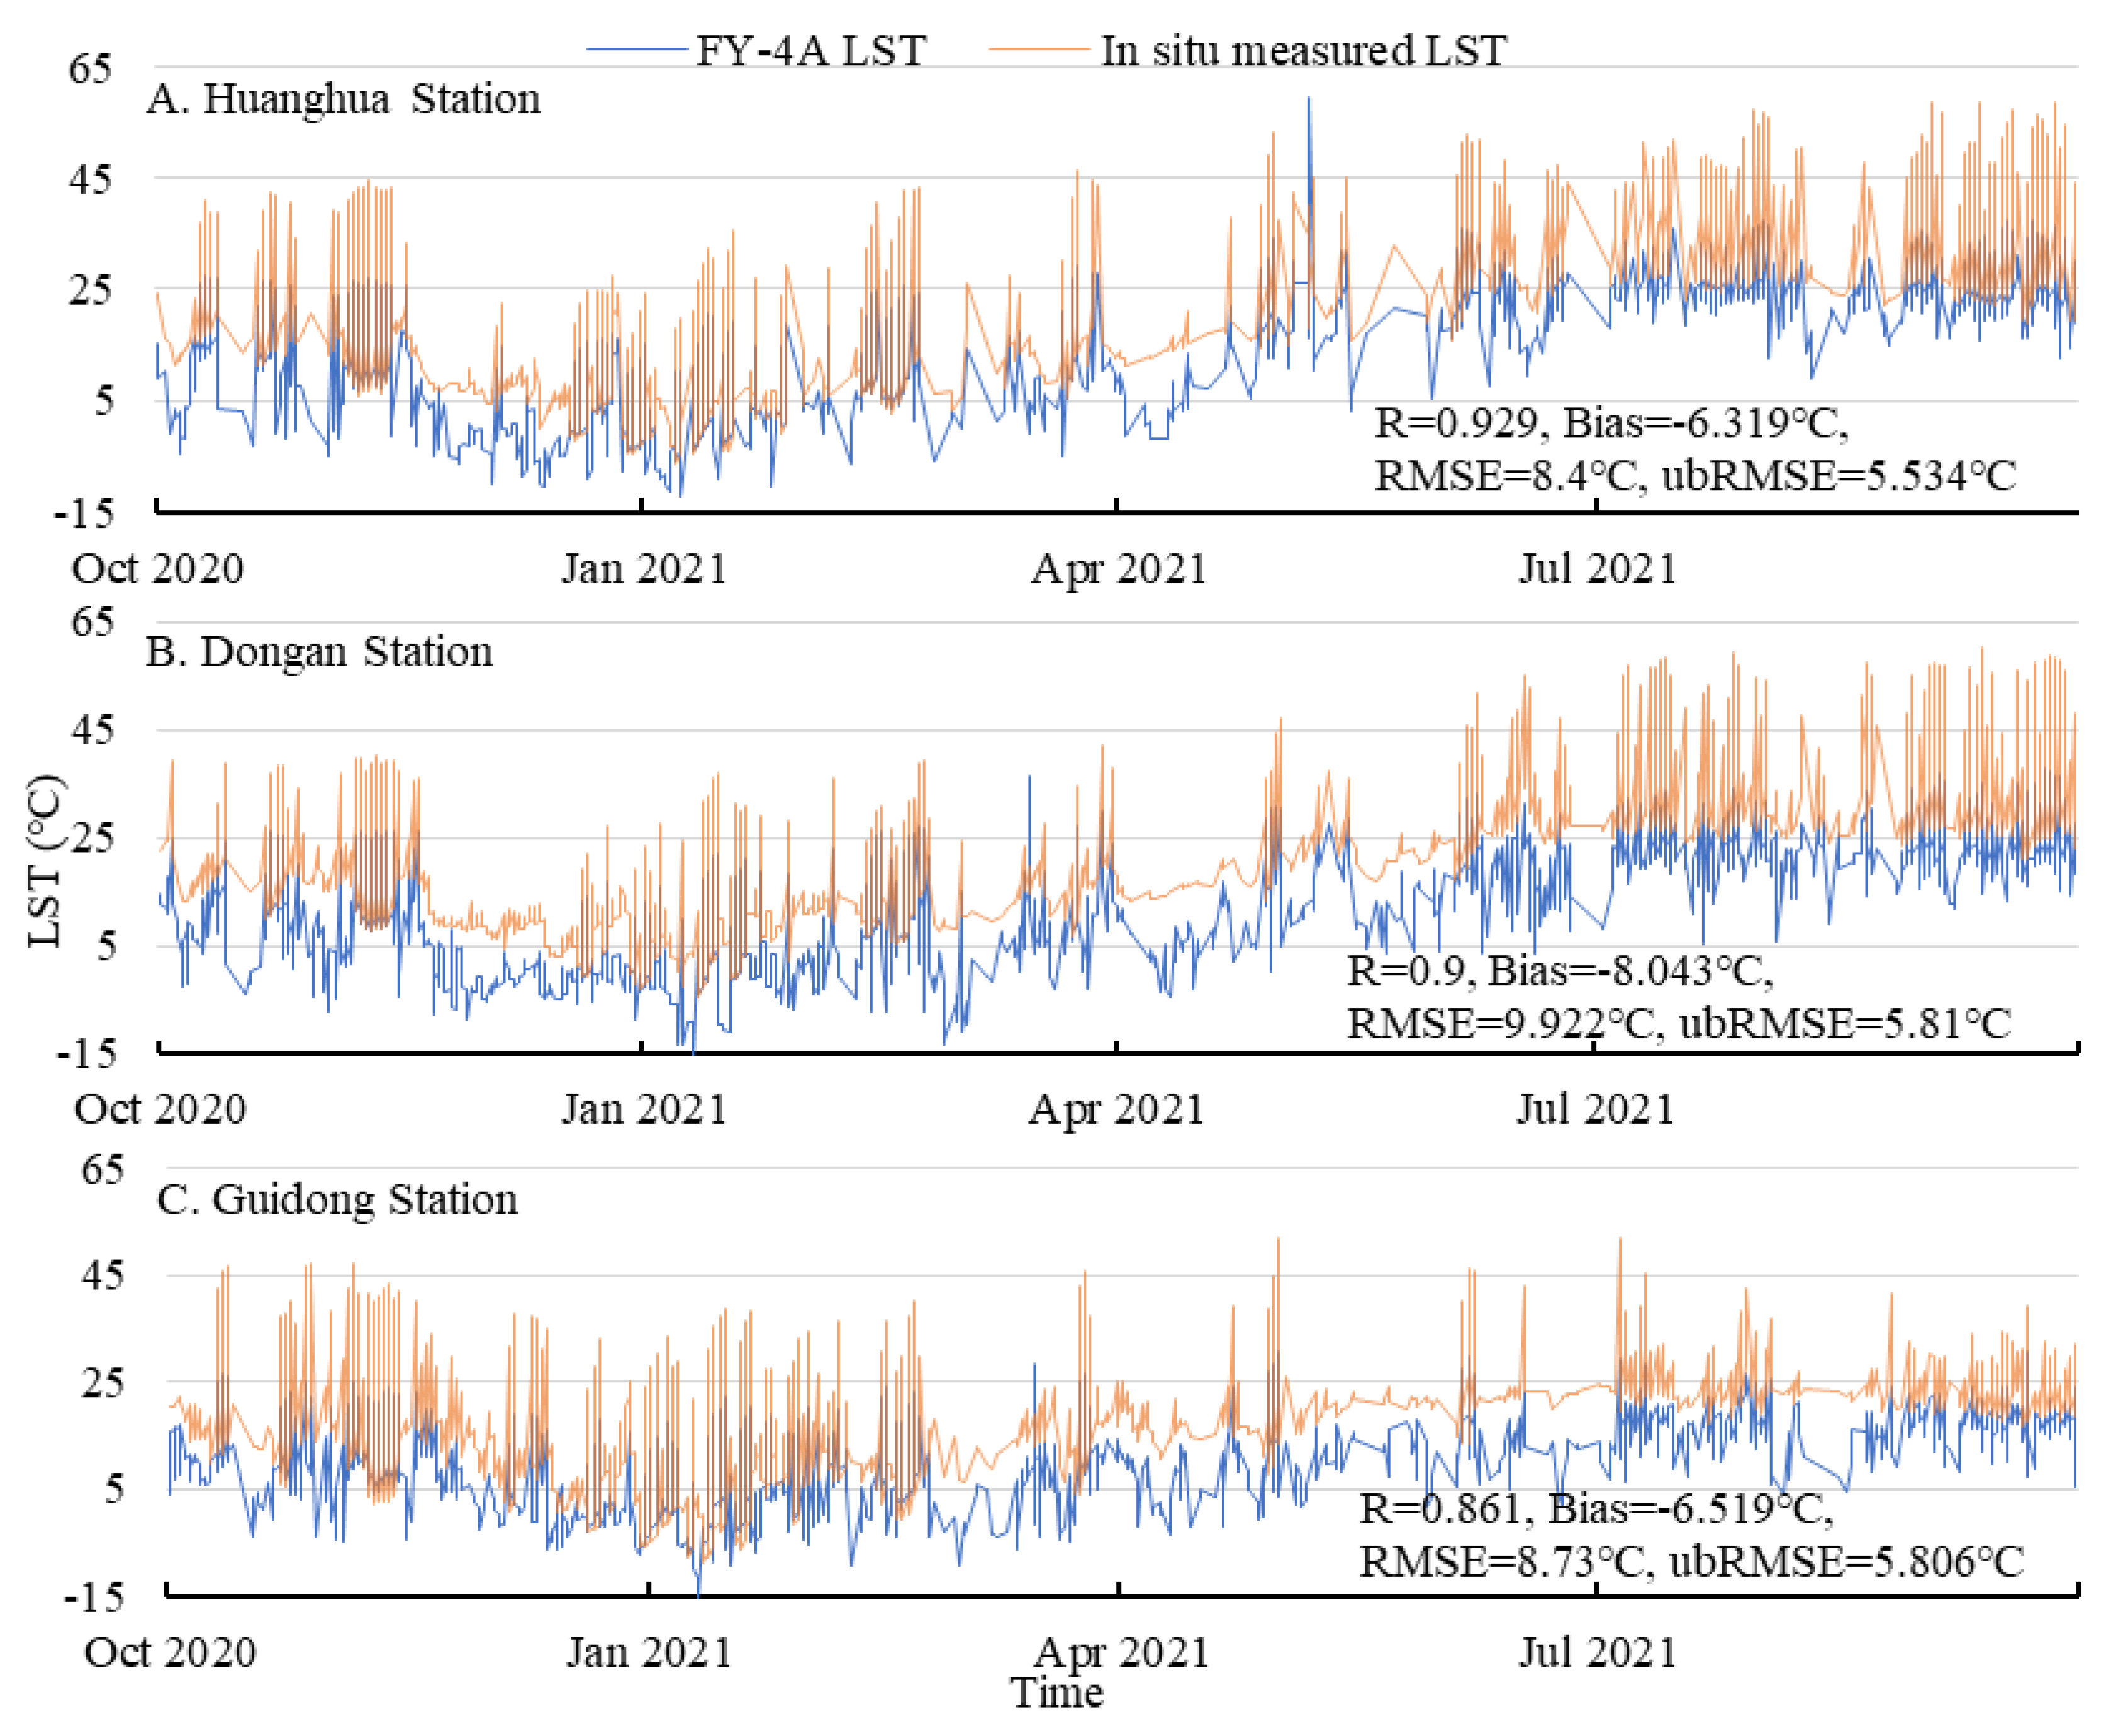
Through comparative analysis of time-series data diagrams from the three stations/grids, the following results were obtained: 1) The FY-4A/AGRI LST product accurately captures the fluctuation trend of LST time-series but generally underestimates and has limited ability in capturing high LST values. 2) Comparing R values, there are greater differences in Bias and RMSE between FY-4A LST and in situ measurements among stations. For instance, at Dongan Station, FY-4A LST was underestimated by an average of more than 8℃, and Bias was not considered when selecting these stations, thus, there may be other stations/grids with even greater underestimation of LST. 3) Compared to other error indicators, ubRMSE values remained relatively stable among stations indicating that random errors in FY-4A LST were consistent across Hunan Province while systematic errors were responsible for variations in detection deviation due to environmental conditions.
Based on the above analysis results, we manually supplemented the overall averaged Bias value within Hunan Province (6.295℃) for FY-4A LST products from the three grids and conducted another time-series analysis. By comparing polylines representing two sets of LST time-series data as well as changes in error parameters shown in Figure 5, it is evident that this method significantly reduces deviations observed in FY-4A LST products. Both Bias and RMSE values noticeably decreased, particularly noteworthy is that RMSE values almost equaled ubRMSE at Huanghua station which exhibited optimal performance and Guidong station which showed worst performance. This further confirms that unstable detection deviation observed in FY-4A LST primarily stems from systematic errors influenced by environmental conditions which can be mitigated through inclusion of Bias value.
3.3. Analysis of Refined Surface Heat Resources in Hunan Province Based on FY-4A LST
Based on two years of FY-4A LST products, the surface heat parameters were calculated for each FY-4A grid, and a regional analysis of surface heat resources in Hunan Province was conducted through mapping. The spatial distribution of average LST in Hunan Province exhibits a strong correlation with topography and urbanization, as depicted in Figure 6.A. The mountainous areas in the west and south display lower levels of LST, while the plains and basins in eastern and central Hunan, characterized by urban agglomerations, consistently exhibit higher mean-LST values. Notably, the high-value zone (mean value ≥ 13.3℃) encompasses major urban centers such as Yueyang City, Yiyang City, Changde City to the north; Changsha City, Zhuzhou City, Xiangtan City, Loudi city, and Shaoyang city at the center; as well as Yongzhou City and Chenzhou city to the south. These findings underscore that both topography and urban underlying surfaces play crucial roles in shaping surface heat resources.
The distribution of the highest LST in two consecutive years is significantly influenced by extreme high temperature climates, which are closely associated with latitude. Consequently, the highest LST levels tend to exhibit similarity in both northern and central regions of Hunan province. In contrast, the southern mountainous areas of Hunan experience comparatively lower maximum LST values over the same period (Max value∈[31.4, 34.7]). Notably, downtown areas in Hengyang City, Yongzhou City, and Chenzhou City located in southern Hunan display consistently elevated LST levels (Max value∈[42.9, 66.1]), while other low-lying terrain areas predominantly exhibit yellow and orange colors indicating relatively moderate maximum LSTs (Max value∈[36.4, 42.9]).
The distribution of the lowest LST in Hunan Province exhibited a complex pattern (Figure 6.C). Based on regional divisions, three areas with high minimum LST values were identified over a span of two years: the Chang-Zhu-Tan urban agglomeration, southern basin area, and western mountainous region. The elevated minimum LST values observed in the first two areas can be attributed to their status as economically developed urban agglomerations. However, it is intriguing that the western mountainous region also displayed relatively high minimum LST values, which may be linked to local topography-induced climate conditions, further investigation is warranted to ascertain the exact cause. Conversely, regions with low minimum LST values encompassed the northeast Dongting Lake area and southwest mountainous region, likely influenced by a combination of reduced human activities and topographic factors.
The distribution of the average daily LST range exhibits distinct patterns, with significantly wider ranges observed in the northwestern and southern regions, comparatively narrower ranges near the provincial border areas, and an intermediate average daily range in the flat terrain area located centrally. Notably, the high daily range values in the northwest region aligned well with the topographical trend. Conversely, in the southern region (Mean daily range∈[12.7, 19.1]), areas of low elevation experienced high daily ranges, whereas areas with high elevation had lower daily ranges (Mean daily range∈[0.9, 9.8]). The disparity between topography and daily LST range in these two regions can be attributed to different influencing factors: solar radiation primarily affects surface temperature in mountainous areas of northwest Hunan resulting in higher daytime LST and subsequently larger LST variations; warm and humid airflow from the south influences temperature conditions in southern mountainous areas causing cloudy weather because of airflow climbs in the mountainous areas, that reduces ridge temperatures during daytime but increases valley temperatures leading to higher LST ranges due to enhanced warming effect by this airflow. Additionally, the Nanling Mountains in southern Hunan effectively act as a barrier, impeding the warm and humid airflow from the south. Simultaneously, the mountainous regions in the northwest remain relatively unaffected by this airflow.
According to the mean LST values distribution in four seasons of FY-4A grids over two years, as shown in Figure 7, it is evident that the western mountainous area consistently exhibits lower LST levels across all seasons. Particularly, the northwest mountainous region displays the lowest LST levels throughout the year within the province. The average distribution of LST in the central region and eastern region remains relatively consistent during spring, summer, and autumn, aligning with the overall average LST distribution depicted in Figure 6.A, except for an expanded range of high temperatures during summer. This observation also underscores how LST patterns vary with topographic conditions and urban centers. However, winter exhibits distinct differences in LST distribution compared to other seasons; notably characterized by relatively low LST values in northeastern Hunan and a more uniform LST distribution across western areas. Although one would expect higher temperatures in this northeast region same as the overall average condition, winter temperatures have dropped to match those observed in central regions possibly due to influences from East Asian monsoons during this season. Prevailing winds from northeasterly directions in winter bring dry and cold continental air masses resulting in lower temperatures on the northeastern plain.
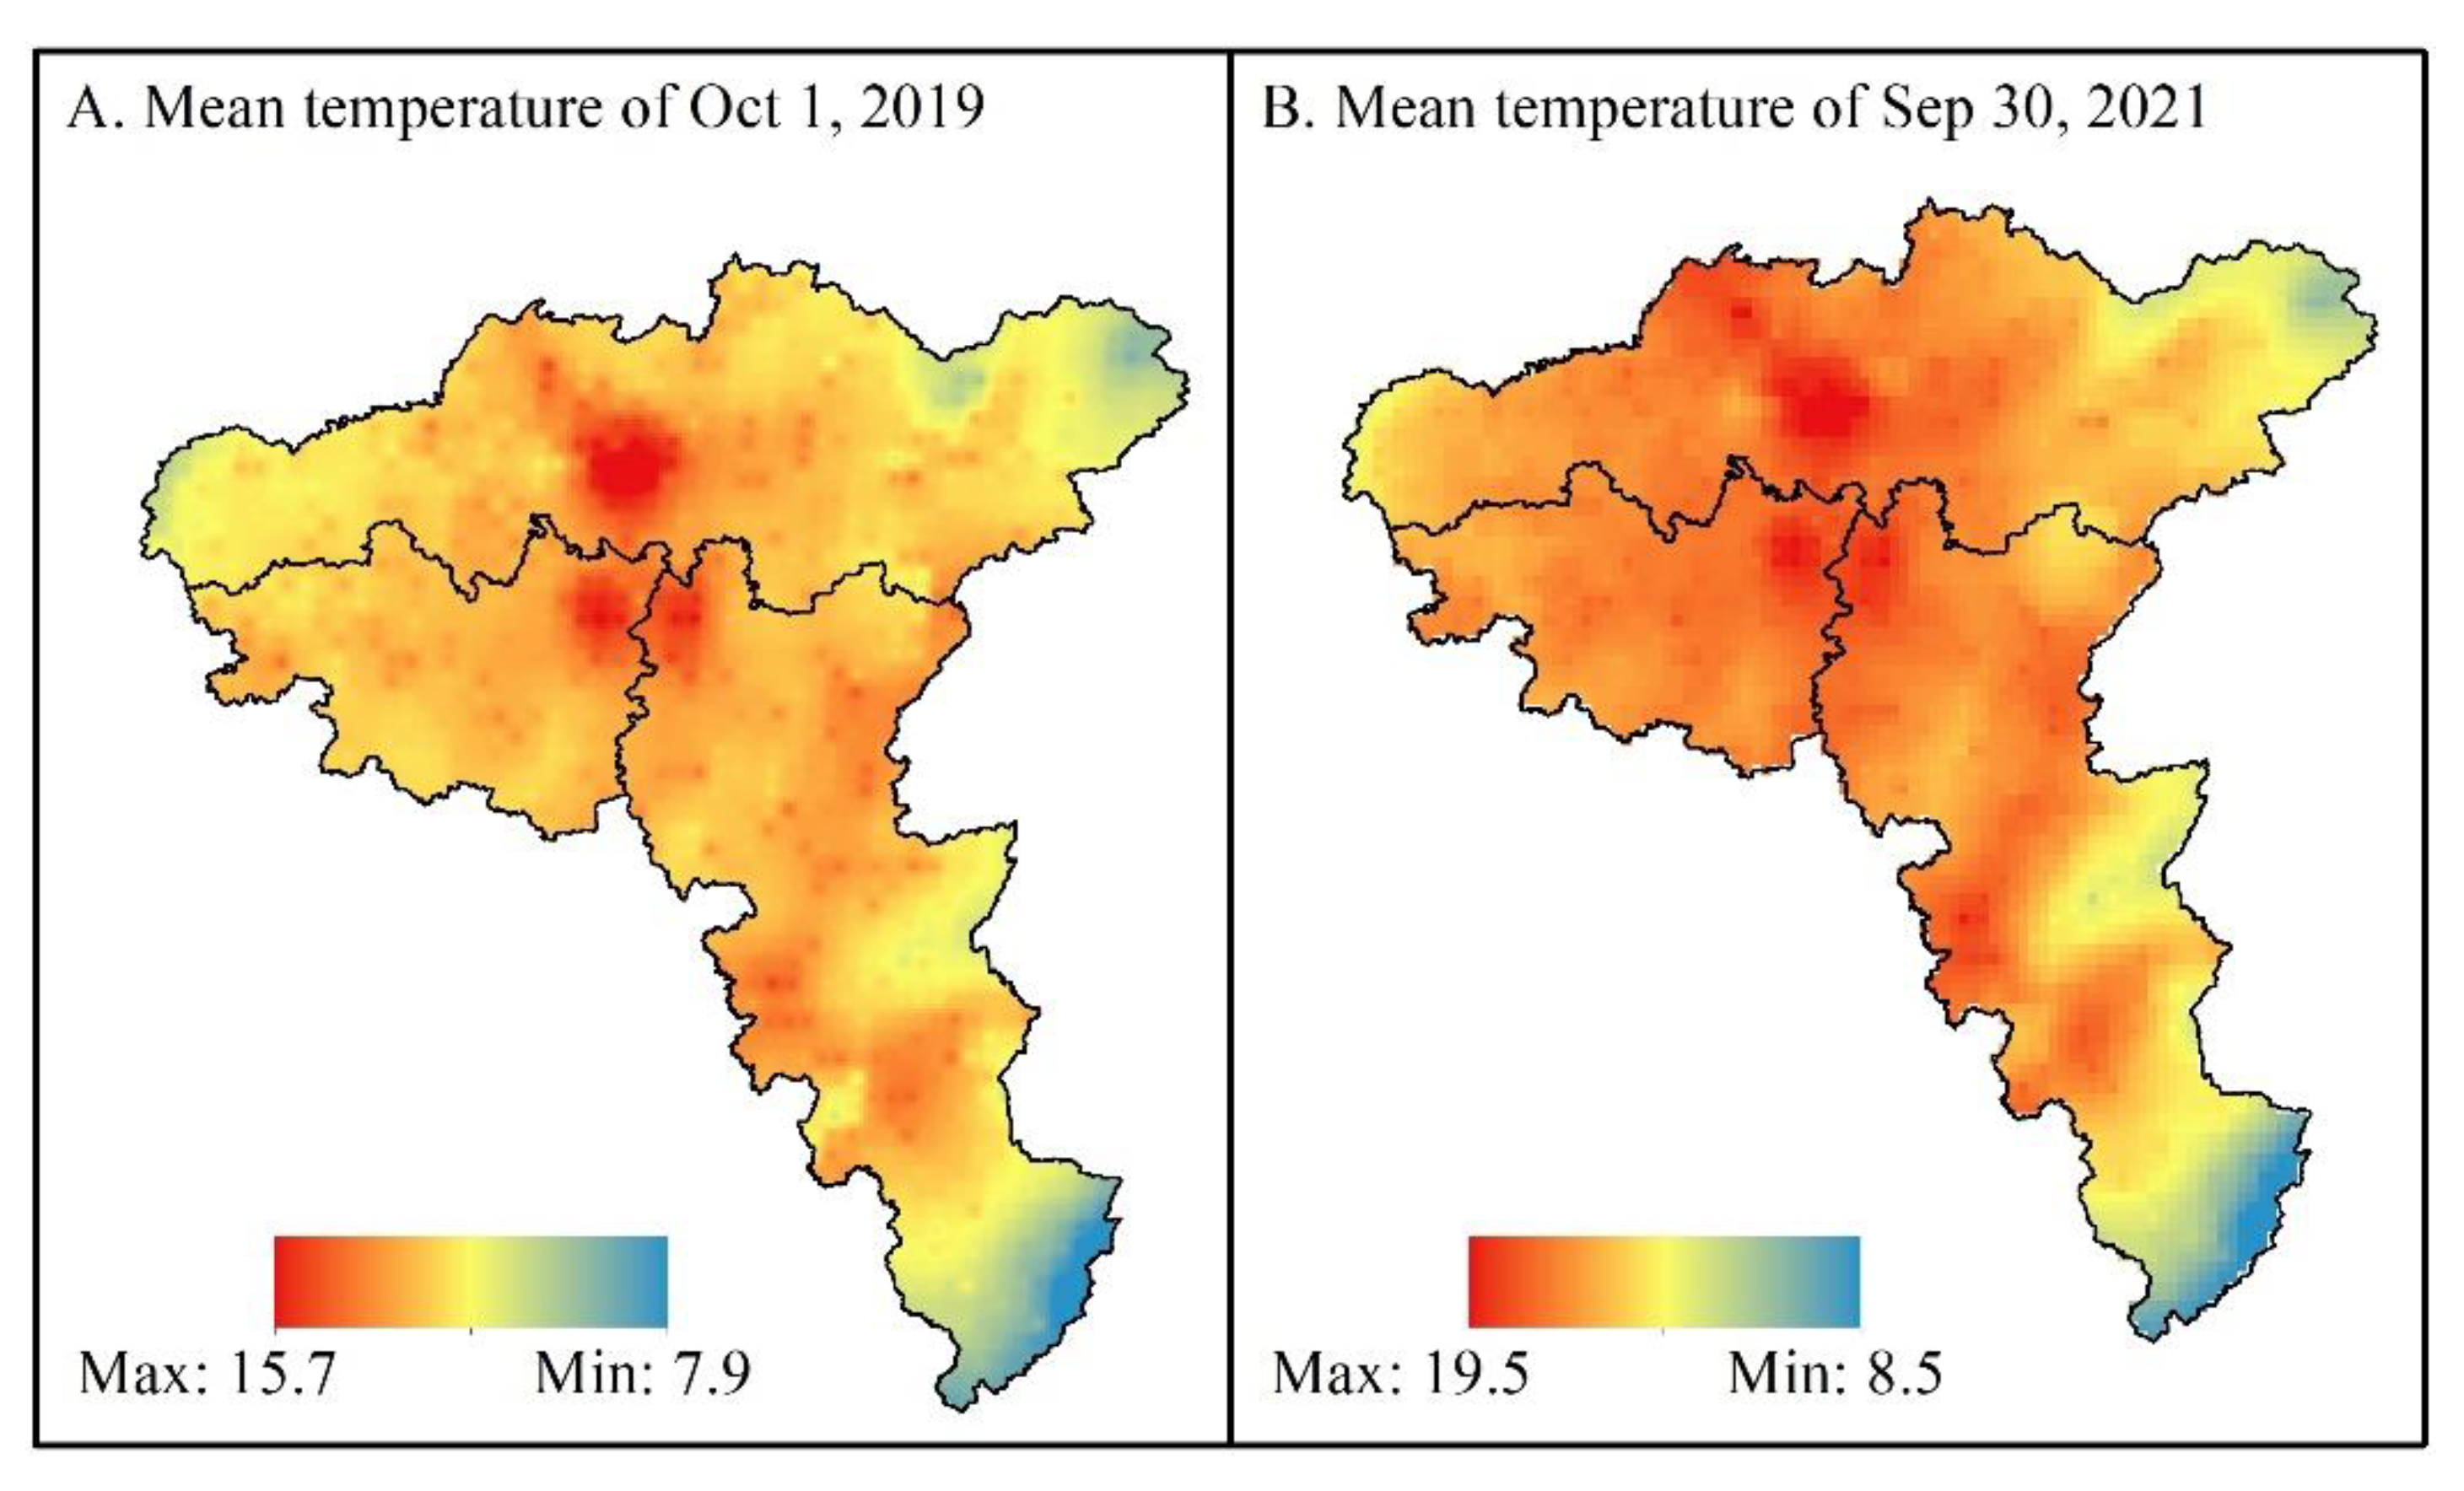
The Chang-Zhu-Tan urban agglomeration, located in the central part of Hunan Province, is a national urban agglomeration in China that comprises Changsha City, Zhuzhou City and Xiangtan City. It represents the most densely populated and economically developed area in Hunan Province. By extracting mean daily LST data from the first day and last day of the two-year dataset for this urban agglomeration area, we can draw relevant conclusions about its development by comparing LST distribution between two diagrams (Figure 8). Although differences in meteorological conditions result in varying LST levels and variation ranges between Figure 8.A and Figure 8.B, spatial distribution of LST combined with heat island effect suggests that development within this urban agglomeration tends to be centralized; junction areas among three cities are also densely distributed areas with high LST values which have expanded over two years; temperature difference between core areas at the center of this region's urban center versus remote rural regions has increased significantly over time. These differences in LST spatial distribution highlight rapid construction within this urban agglomeration during these past two years while reflecting China's ongoing commitment to developing it as outlined within their 14th Five-Year Plan.
According to the aforementioned analysis results, the distribution of surface heat resources in Hunan Province based on FY-4A LST can be summarized as follows: 1. The surface heat resources in the flat terrain eastern part of Hunan Province generally exhibit superiority over those in mountainous areas located in the west and the south. The central region and northern region are prone to extreme heat, while the northwestern region and certain parts of the south experience higher daily LST range, which is conducive to crop growth. 2. The distribution pattern of LST remains similar across spring, summer, and autumn seasons in Hunan Province, in which the eastern region demonstrates distinct advantages regarding surface heat resources. Conversely, during winter months, primary heat resources tend to concentrate in the southeast region. 3. Furthermore, changes observed in surface heat resources also highlight rapid development within Chang-Zhu-Tan urban agglomeration area, because of the indicated tendency towards concentration over the two-year period with an increasing disparity between core and surrounding areas.
4. Conclusion
In this study, we conducted a comprehensive verification of the remote sensing product based on the FY-4A/AGRI LST product and in situ measured LST data from Hunan province over a two-year period. Our analysis determined the ability of FY-4A/AGRI to capture LST and enabled us to carry out high spatio-temporal resolution analysis of surface heat resources using this data product. In summary, our research leads us to draw the following conclusions:
1) The FY-4A/AGRI LST product effectively captures surface temperature in Hunan Province; however, it exhibits a high level of error that becomes more pronounced when temperatures rise above 25℃. The main reason for the unstable detection deviation of FY-4A LST is attributed to systematic errors influenced by environmental conditions, which can be optimized by incorporating a Bias value.
2) Spatial analysis reveals better performance of FY-4A LST products in the eastern part of Hunan Province compared to the western part due to terrain conditions. The flat terrain in eastern Hunan Province contributes to mitigating systematic errors in the products. Time series analysis demonstrates the product's ability to accurately capture LST fluctuation trends; however, a general underestimation phenomenon persists and its capability to detect high surface temperatures is limited.
3) Surface heat resources are generally more abundant in the eastern region than mountainous areas of west and south, with finer distribution divisions primarily driven by terrain and climate conditions. Apart from winter months, there are no significant differences observed in heat resource distribution among other seasons; and the rapid urban agglomeration development within Chang-Zhu-Tan over two years has led to noticeable surface heat resources changes.
Author Contributions
Data curation, S.T. and J.F.; formal analysis, J.F. and L.C.; funding acquisition, H.L.; methodology, J.F. and H.L.; resources and software, Q.H.; writing—original draft, J.F. and W.L.; validation and writing—review and editing, J.F. and H.L. All authors have read and agreed to the published version of the manuscript.
Funding
This research was funded by Hunan Meteorological Bureau, grant number NO. XQKJ22C010 and CXFZ2023-QNZX21, and the major program of the Hunan Provincial Natural Science Foundation of China (grant number 2021JC0009): “Multi-source satellite remote sensing model of meso- and micro-scale severe convective weather system and its derived disasters”.
Institutional Review Board Statement
Not applicable.
Informed Consent Statement
Not applicable.
Data Availability Statement
All the data used in the study can be obtained in a public way, as described in the Data section of the article.
Acknowledgments
We thank the National Satellite Meteorological Center (NSMC) for providing FY-4A product, and the Hunan Meteorological Big Data Center for providing in situ observation data.
Conflicts of Interest
The authors declare that the research was conducted in the absence of any commercial or financial relationships that could be construed as a potential conflict of interest.
References
- Li, Z.-L.; Tang, B.-H.; Wu, H.; Ren, H.; Yan, G.; Wan, Z.; Trigo, I.F.; Sobrino, J.A. Satellite-derived land surface temperature: Current status and perspectives. Remote Sensing of Environment 2013, 131, 14-37.
- Hansen, J.; Ruedy, R.; Sato, M.; Lo, K. GLOBAL SURFACE TEMPERATURE CHANGE. Reviews of Geophysics 2010, 48.
- Karnieli, A.; Agam, N.; Pinker, R.T.; Anderson, M.; Imhoff, M.L.; Gutman, G.G.; Panov, N.; Goldberg, A. Use of NDVI and Land Surface Temperature for Drought Assessment: Merits and Limitations. Journal of Climate 2010, 23, 618-633.
- Chen, W.; Hu, C.; Liu, L.; Zhang, J.; Wang, K.; Liu, S. Characteristics of built-up land change in resource-based cities and their impact on land surface temperature—Taking Wu'an as an example. Ecological Informatics 2022, 68, 101582.
- Hazaymeh, K.; Hassan, Q.K. A remote sensing-based agricultural drought indicator and its implementation over a semi-arid region, Jordan. Journal of Arid Land 2017, 9, 319-330. [CrossRef]
- Townshend, J.R.G.; Justice, C.O.; Skole, D.; Malingreau, J.P.; Cihlar, J.; Teillet, P.; Sadowski, F.; Ruttenberg, S. The 1 km resolution global data set: needs of the International Geosphere Biosphere Programme†. International Journal of Remote Sensing 1994, 15, 3417-3441. [CrossRef]
- Albergel, C.; Dutra, E.; Munier, S.; Calvet, J.C.; Munoz-Sabater, J.; de Rosnay, P.; Balsamo, G. ERA-5 and ERA-Interim driven ISBA land surface model simulations: which one performs better? Hydrol. Earth Syst. Sci. 2018, 22, 3515-3532. [CrossRef]
- Yang, J.; Zhang, Z.; Wei, C.; Lu, F.; Guo, Q. Introducing the new generation of Chinese geostationary weather satellites, Fengyun-4. Bulletin of the American Meteorological Society 2017, 98, 1637-1658.
- Neteler, M. Estimating Daily Land Surface Temperatures in Mountainous Environments by Reconstructed MODIS LST Data. Remote Sensing 2010, 2, 333-351. [CrossRef]
- Prata, A.J.; Caselles, V.; Coll, C.; Sobrino, J.A.; Ottlé, C. Thermal remote sensing of land surface temperature from satellites: Current status and future prospects. Remote Sensing Reviews 1995, 12, 175-224. [CrossRef]
- Tran, D.X.; Pla, F.; Latorre-Carmona, P.; Myint, S.W.; Caetano, M.; Kieu, H.V. Characterizing the relationship between land use land cover change and land surface temperature. ISPRS Journal of Photogrammetry and Remote Sensing 2017, 124, 119-132.
- Yu, Y.; Tarpley, D.; Privette, J.L.; Goldberg, M.D.; Raja, M.K.R.V.; Vinnikov, K.Y.; Xu, H. Developing Algorithm for Operational GOES-R Land Surface Temperature Product. IEEE Transactions on Geoscience and Remote Sensing 2009, 47, 936-951. [CrossRef]
- Jenks, G.F.; Caspall, F.C. ERROR ON CHOROPLETHIC MAPS: DEFINITION, MEASUREMENT, REDUCTION. Annals of the Association of American Geographers 1971, 61, 217-244. [CrossRef]
- Fan, J.; Han, Q.; Wang, S.; Liu, H.; Chen, L.; Tan, S.; Song, H.; Li, W. Evaluation of Fengyun-4A Detection Accuracy: A Case Study of the Land Surface Temperature Product for Hunan Province, Central China. Atmosphere 2022, 13. [CrossRef]
- Weiss, D.J.; Walsh, S.J. Remote Sensing of Mountain Environments. Geography Compass 2009, 3, 1-21.
Figure 1.
Distribution of topography, water body, and in situ observation stations in Hunan Province.
Figure 1.
Distribution of topography, water body, and in situ observation stations in Hunan Province.
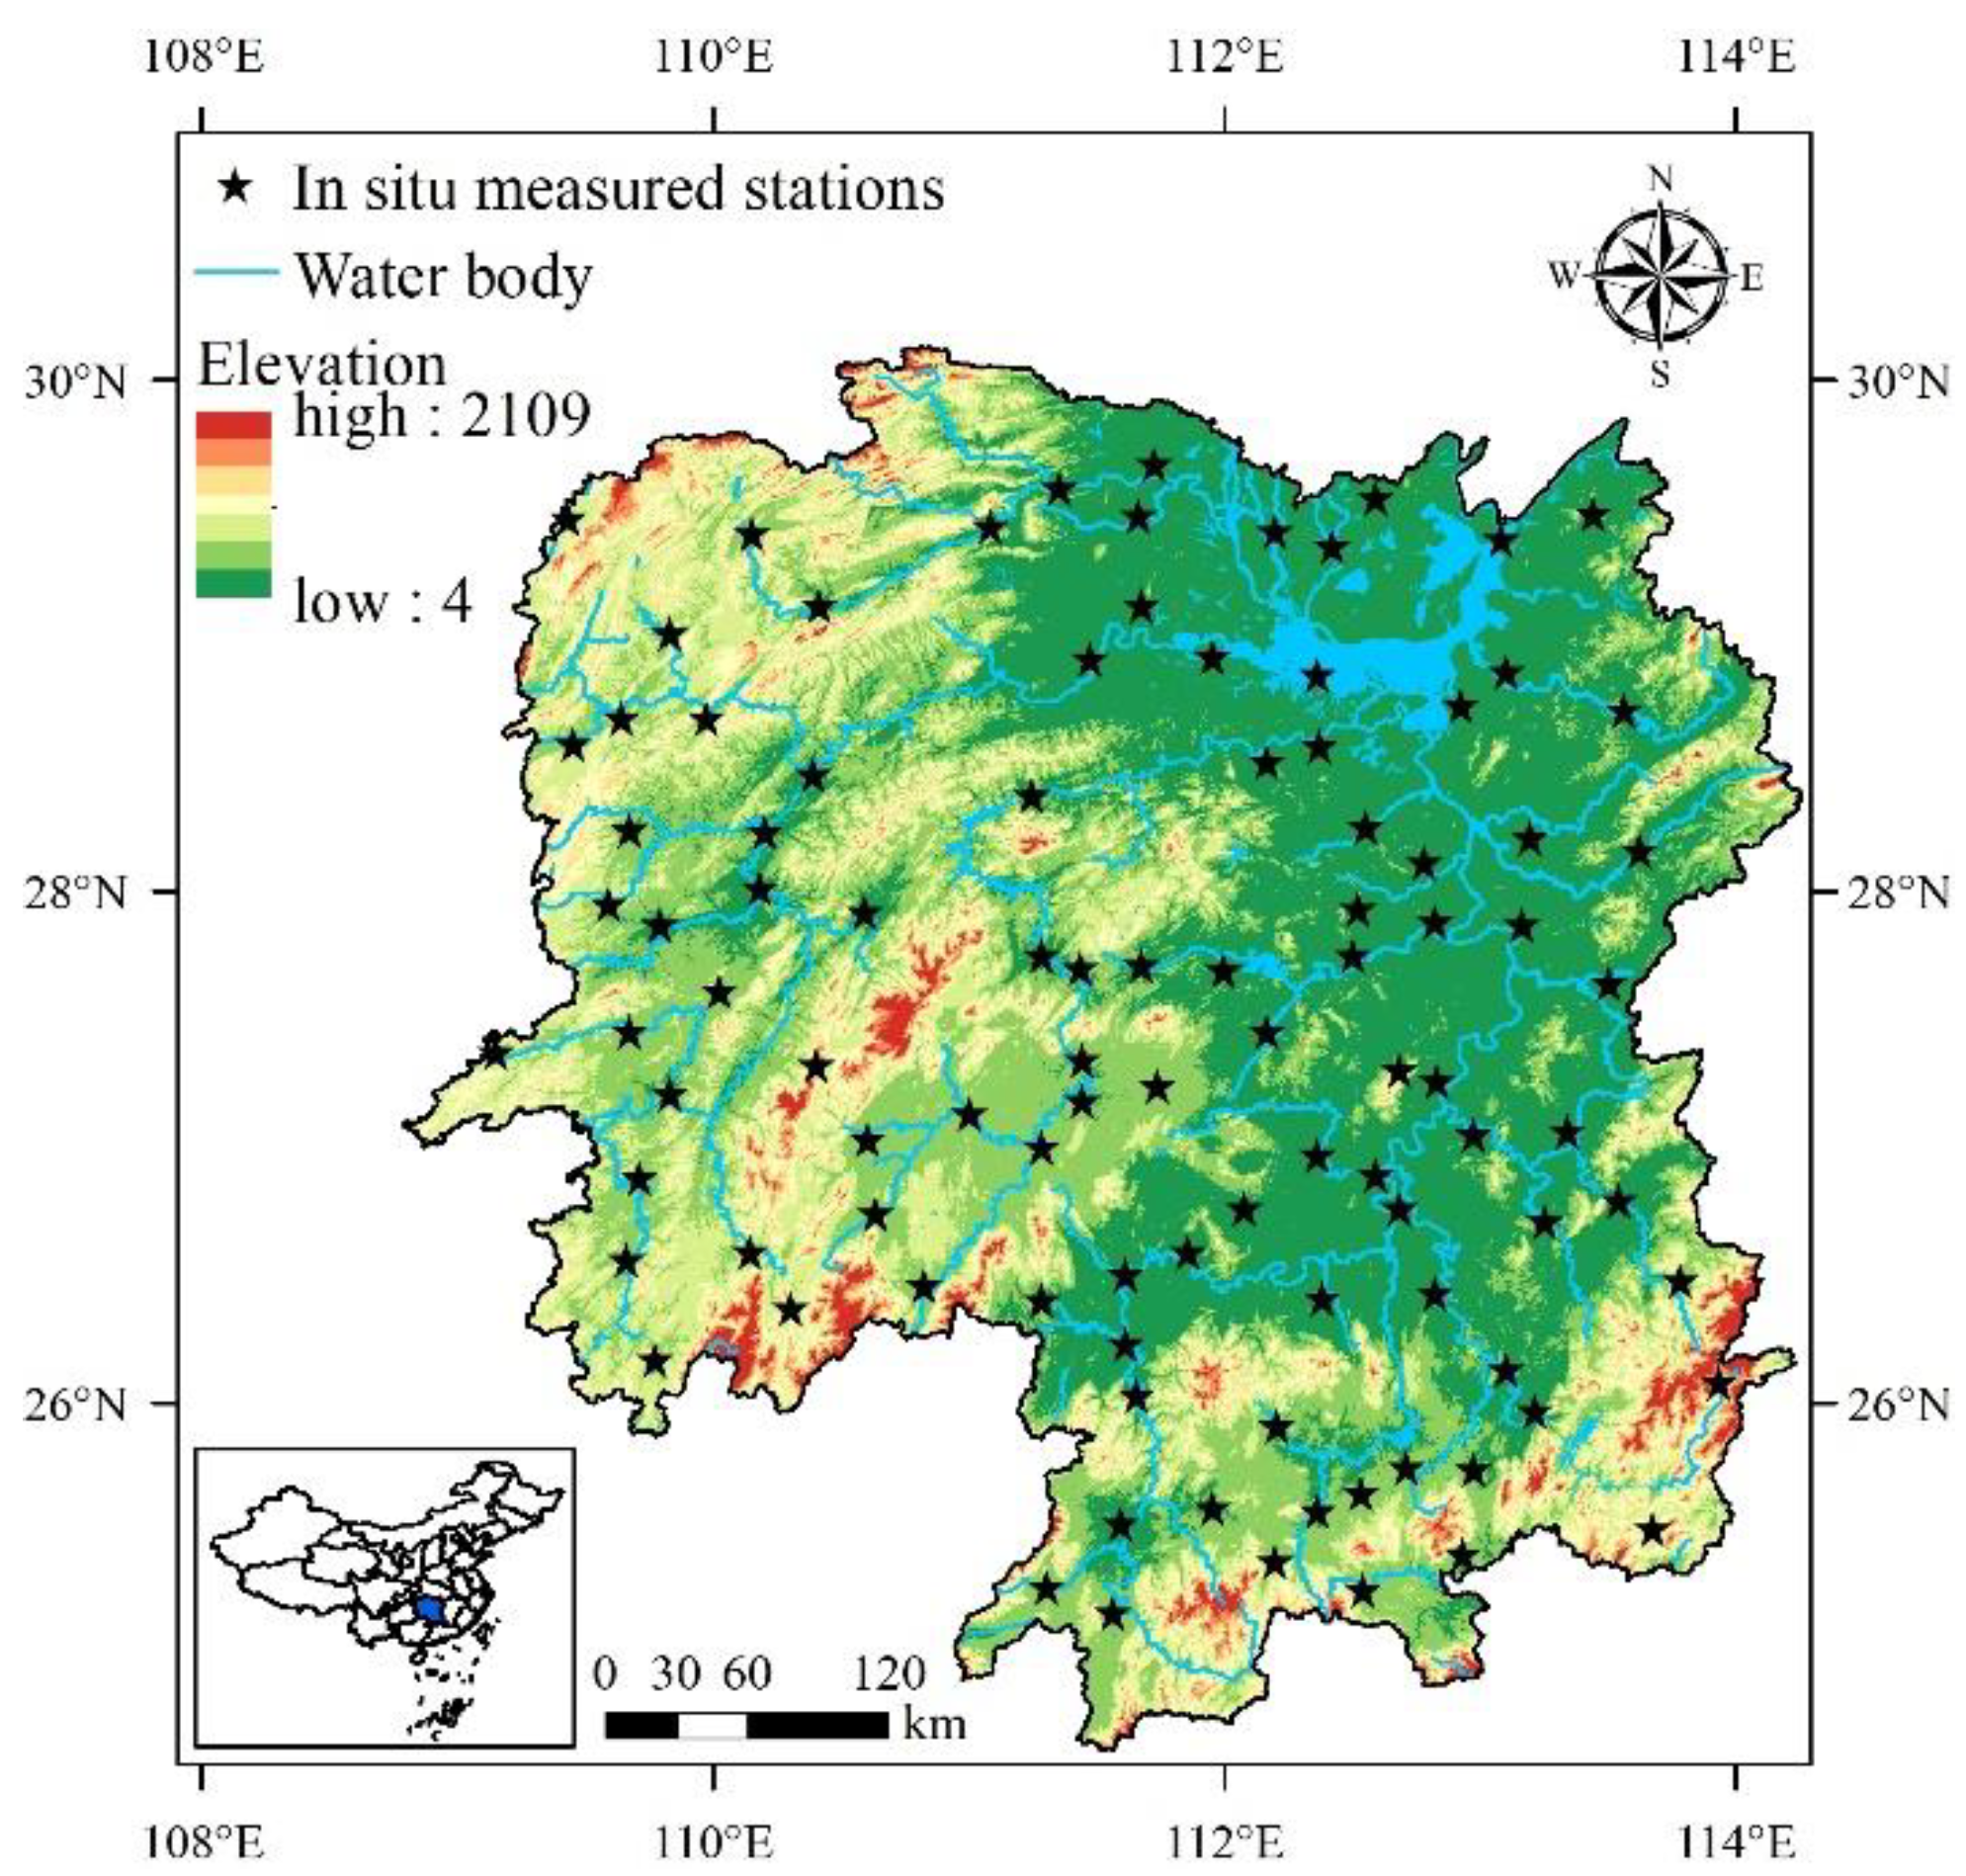
Figure 2.
Scatterplot of FY-4A LST vs in situ measurement; the straight line in the figure is the y=x line; the brighter the color in the figure, the more concentrated the data points.
Figure 2.
Scatterplot of FY-4A LST vs in situ measurement; the straight line in the figure is the y=x line; the brighter the color in the figure, the more concentrated the data points.
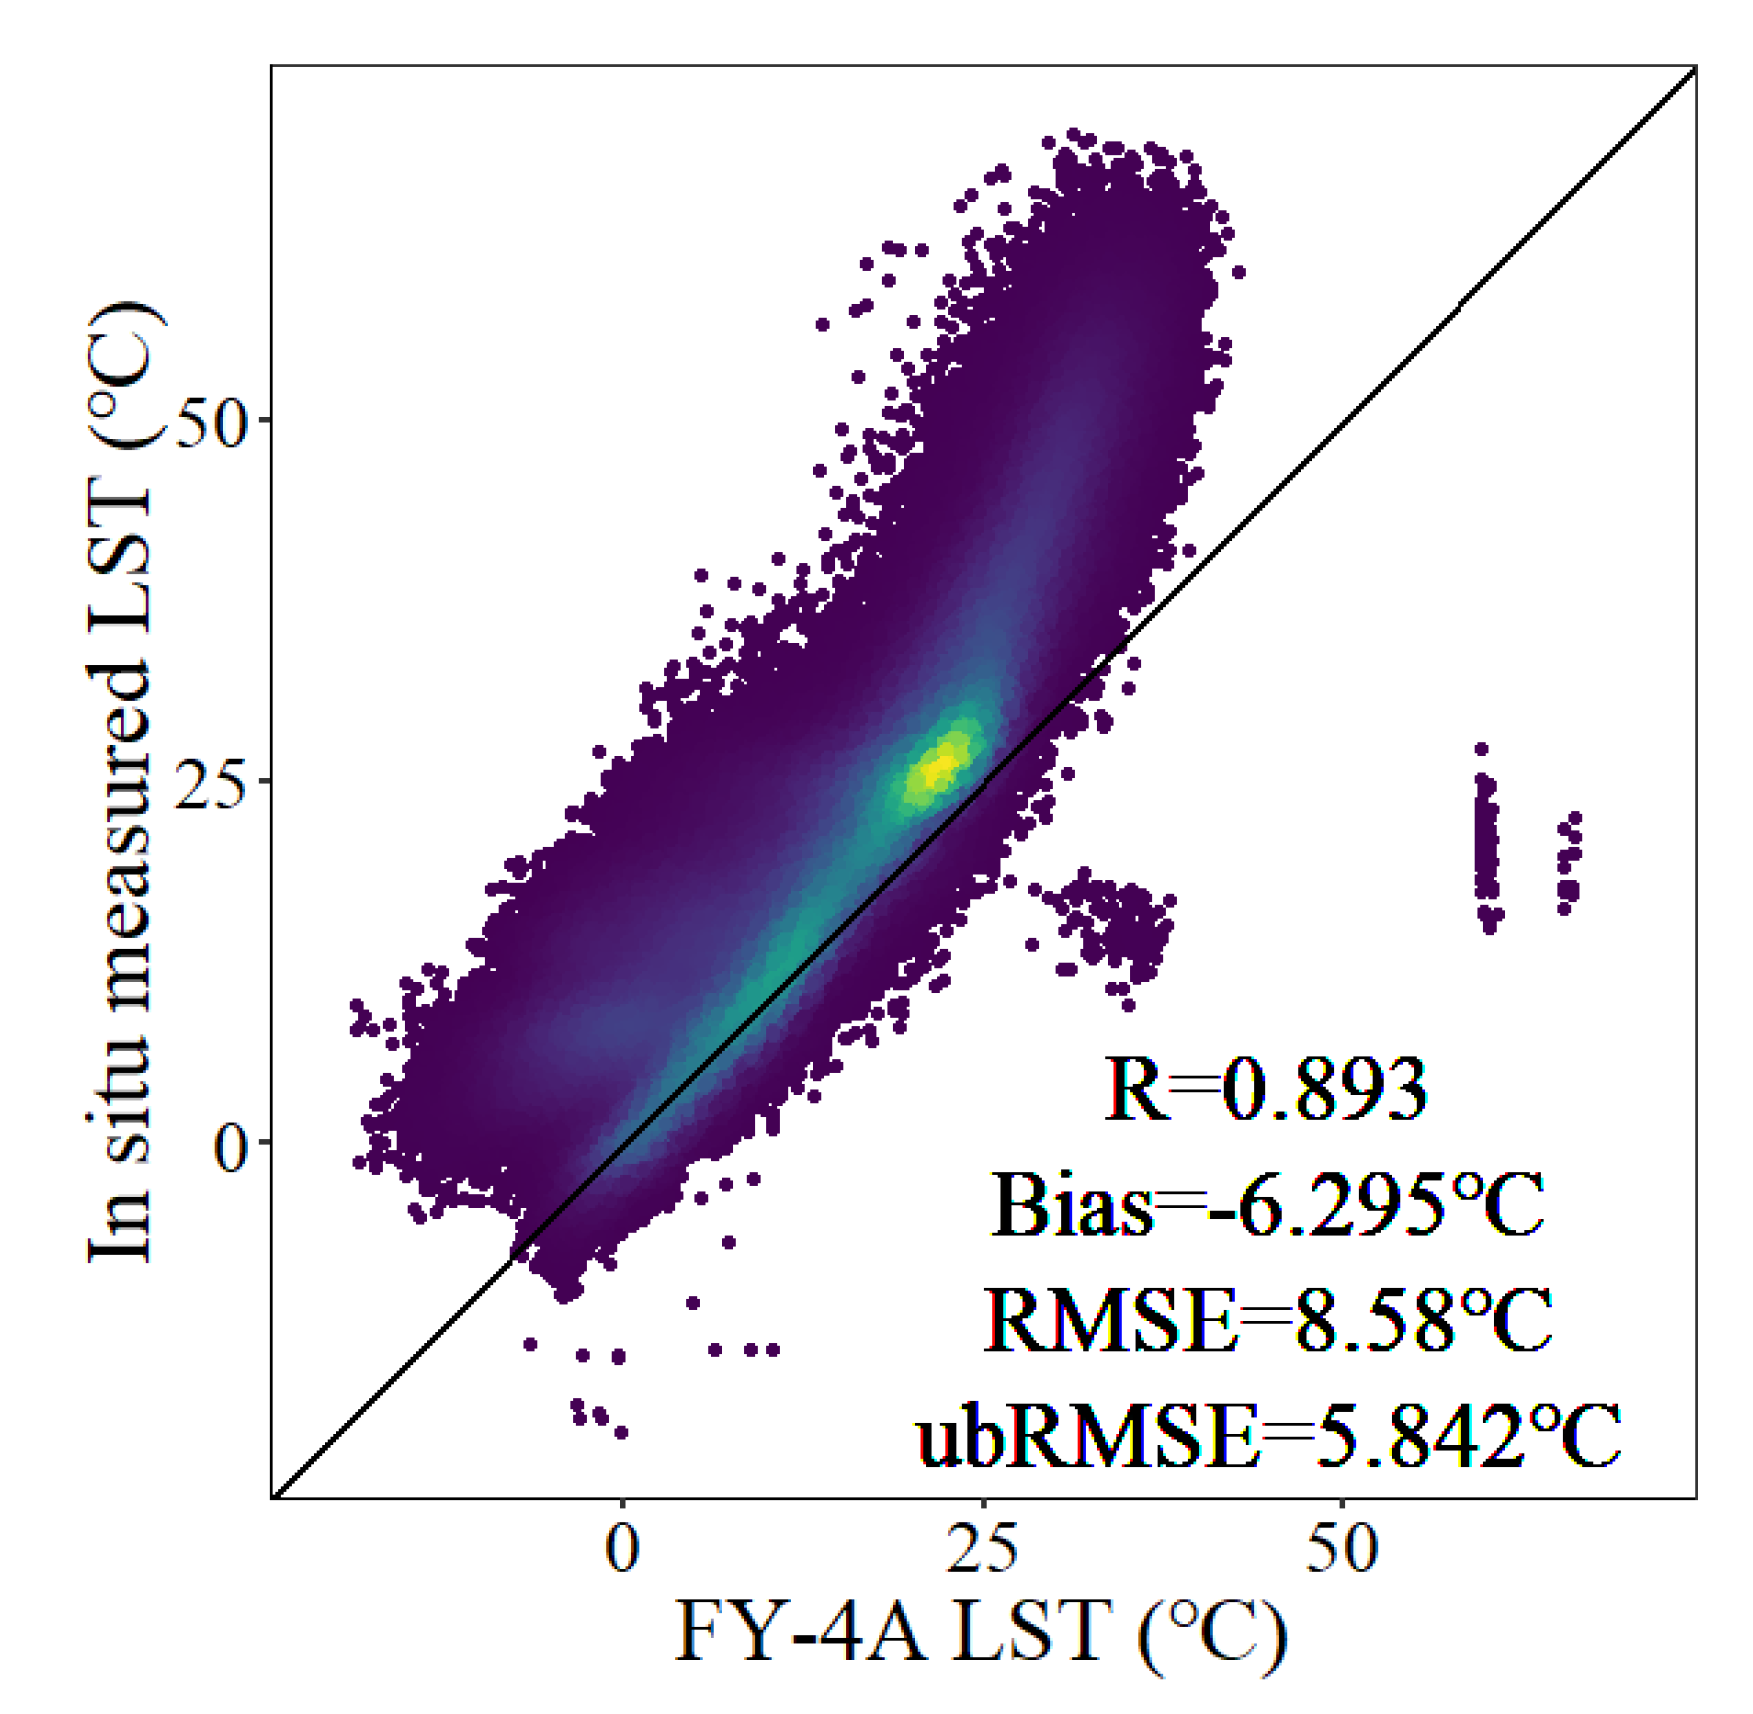
Figure 5.
Time-series data of in situ measurement data and FY-4A LST product that added the overall Bias from the above three stations/grids in Figure 4.
Figure 5.
Time-series data of in situ measurement data and FY-4A LST product that added the overall Bias from the above three stations/grids in Figure 4.
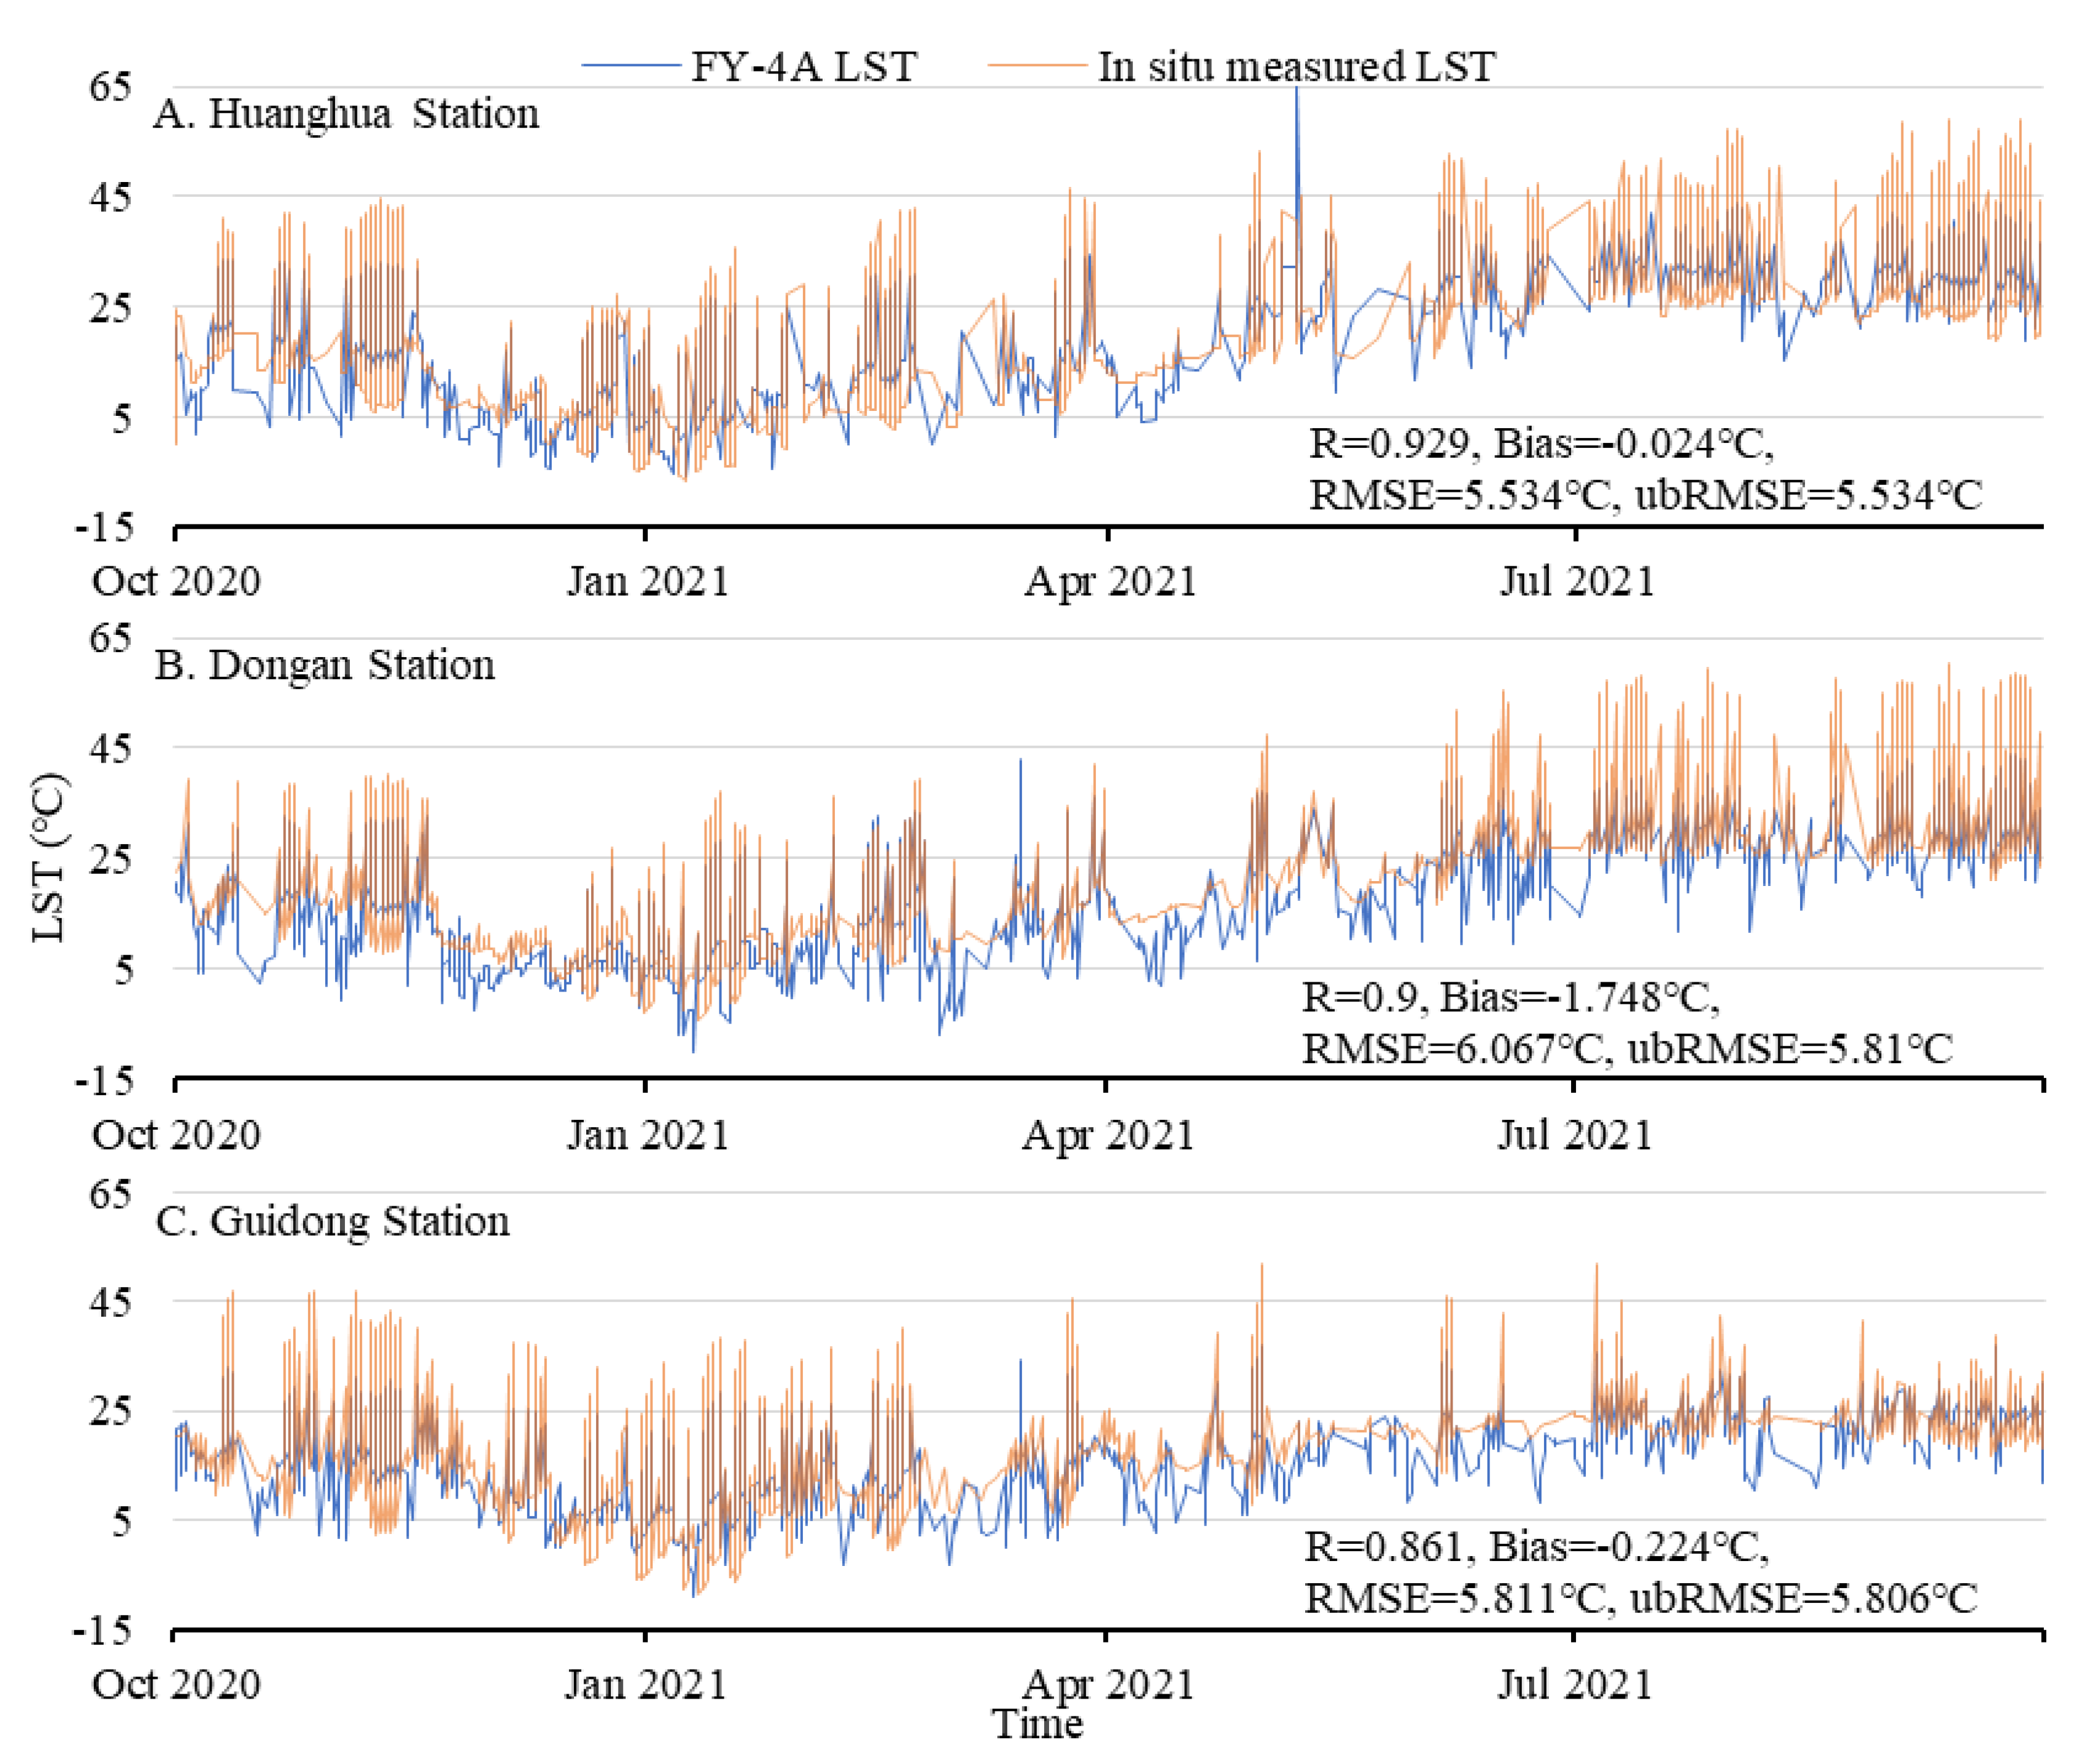
Figure 6.
Spatial distribution map of mean value, maximum value, minimum value and daily range of LST within FY-4A grids in Hunan Province among two years.
Figure 6.
Spatial distribution map of mean value, maximum value, minimum value and daily range of LST within FY-4A grids in Hunan Province among two years.
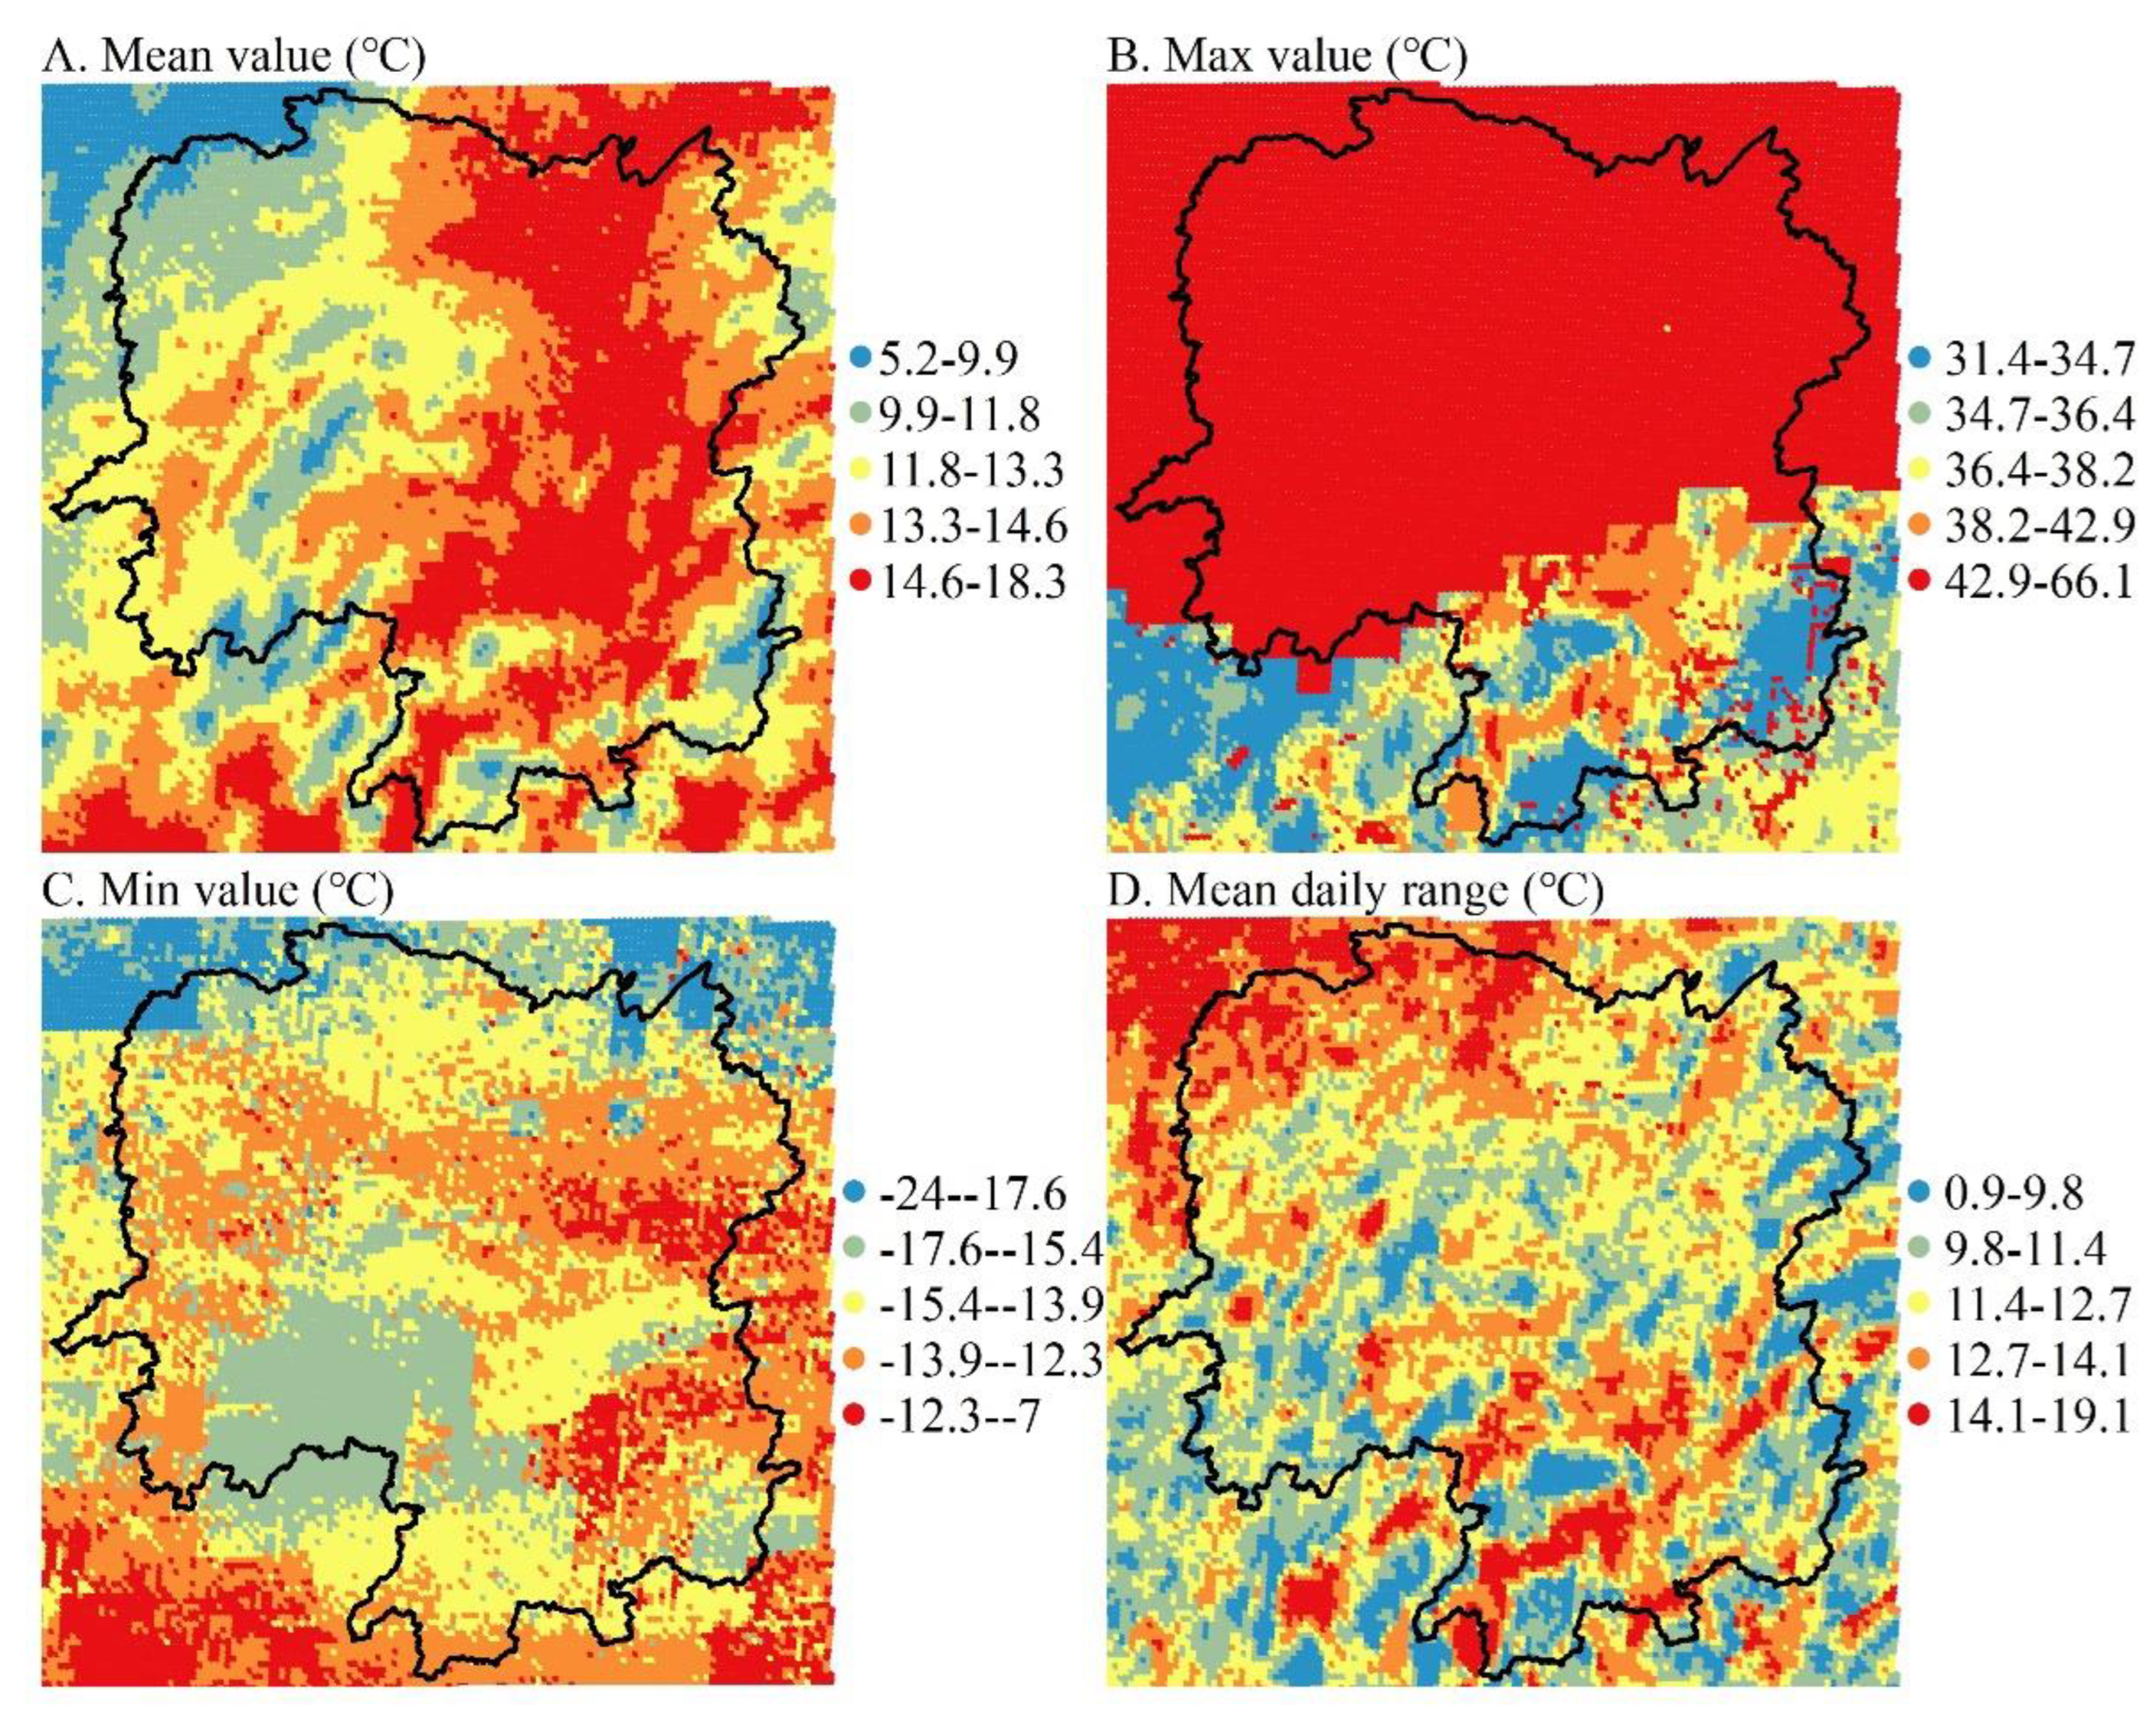
Figure 7.
Spatial distribution map of mean FY-4A LST of each season in Hunan Province among two years; in which March, April, and May represent spring, June, July, and August represent summer, September, October, and November represent autumn, and December, January and February represent winter.
Figure 7.
Spatial distribution map of mean FY-4A LST of each season in Hunan Province among two years; in which March, April, and May represent spring, June, July, and August represent summer, September, October, and November represent autumn, and December, January and February represent winter.
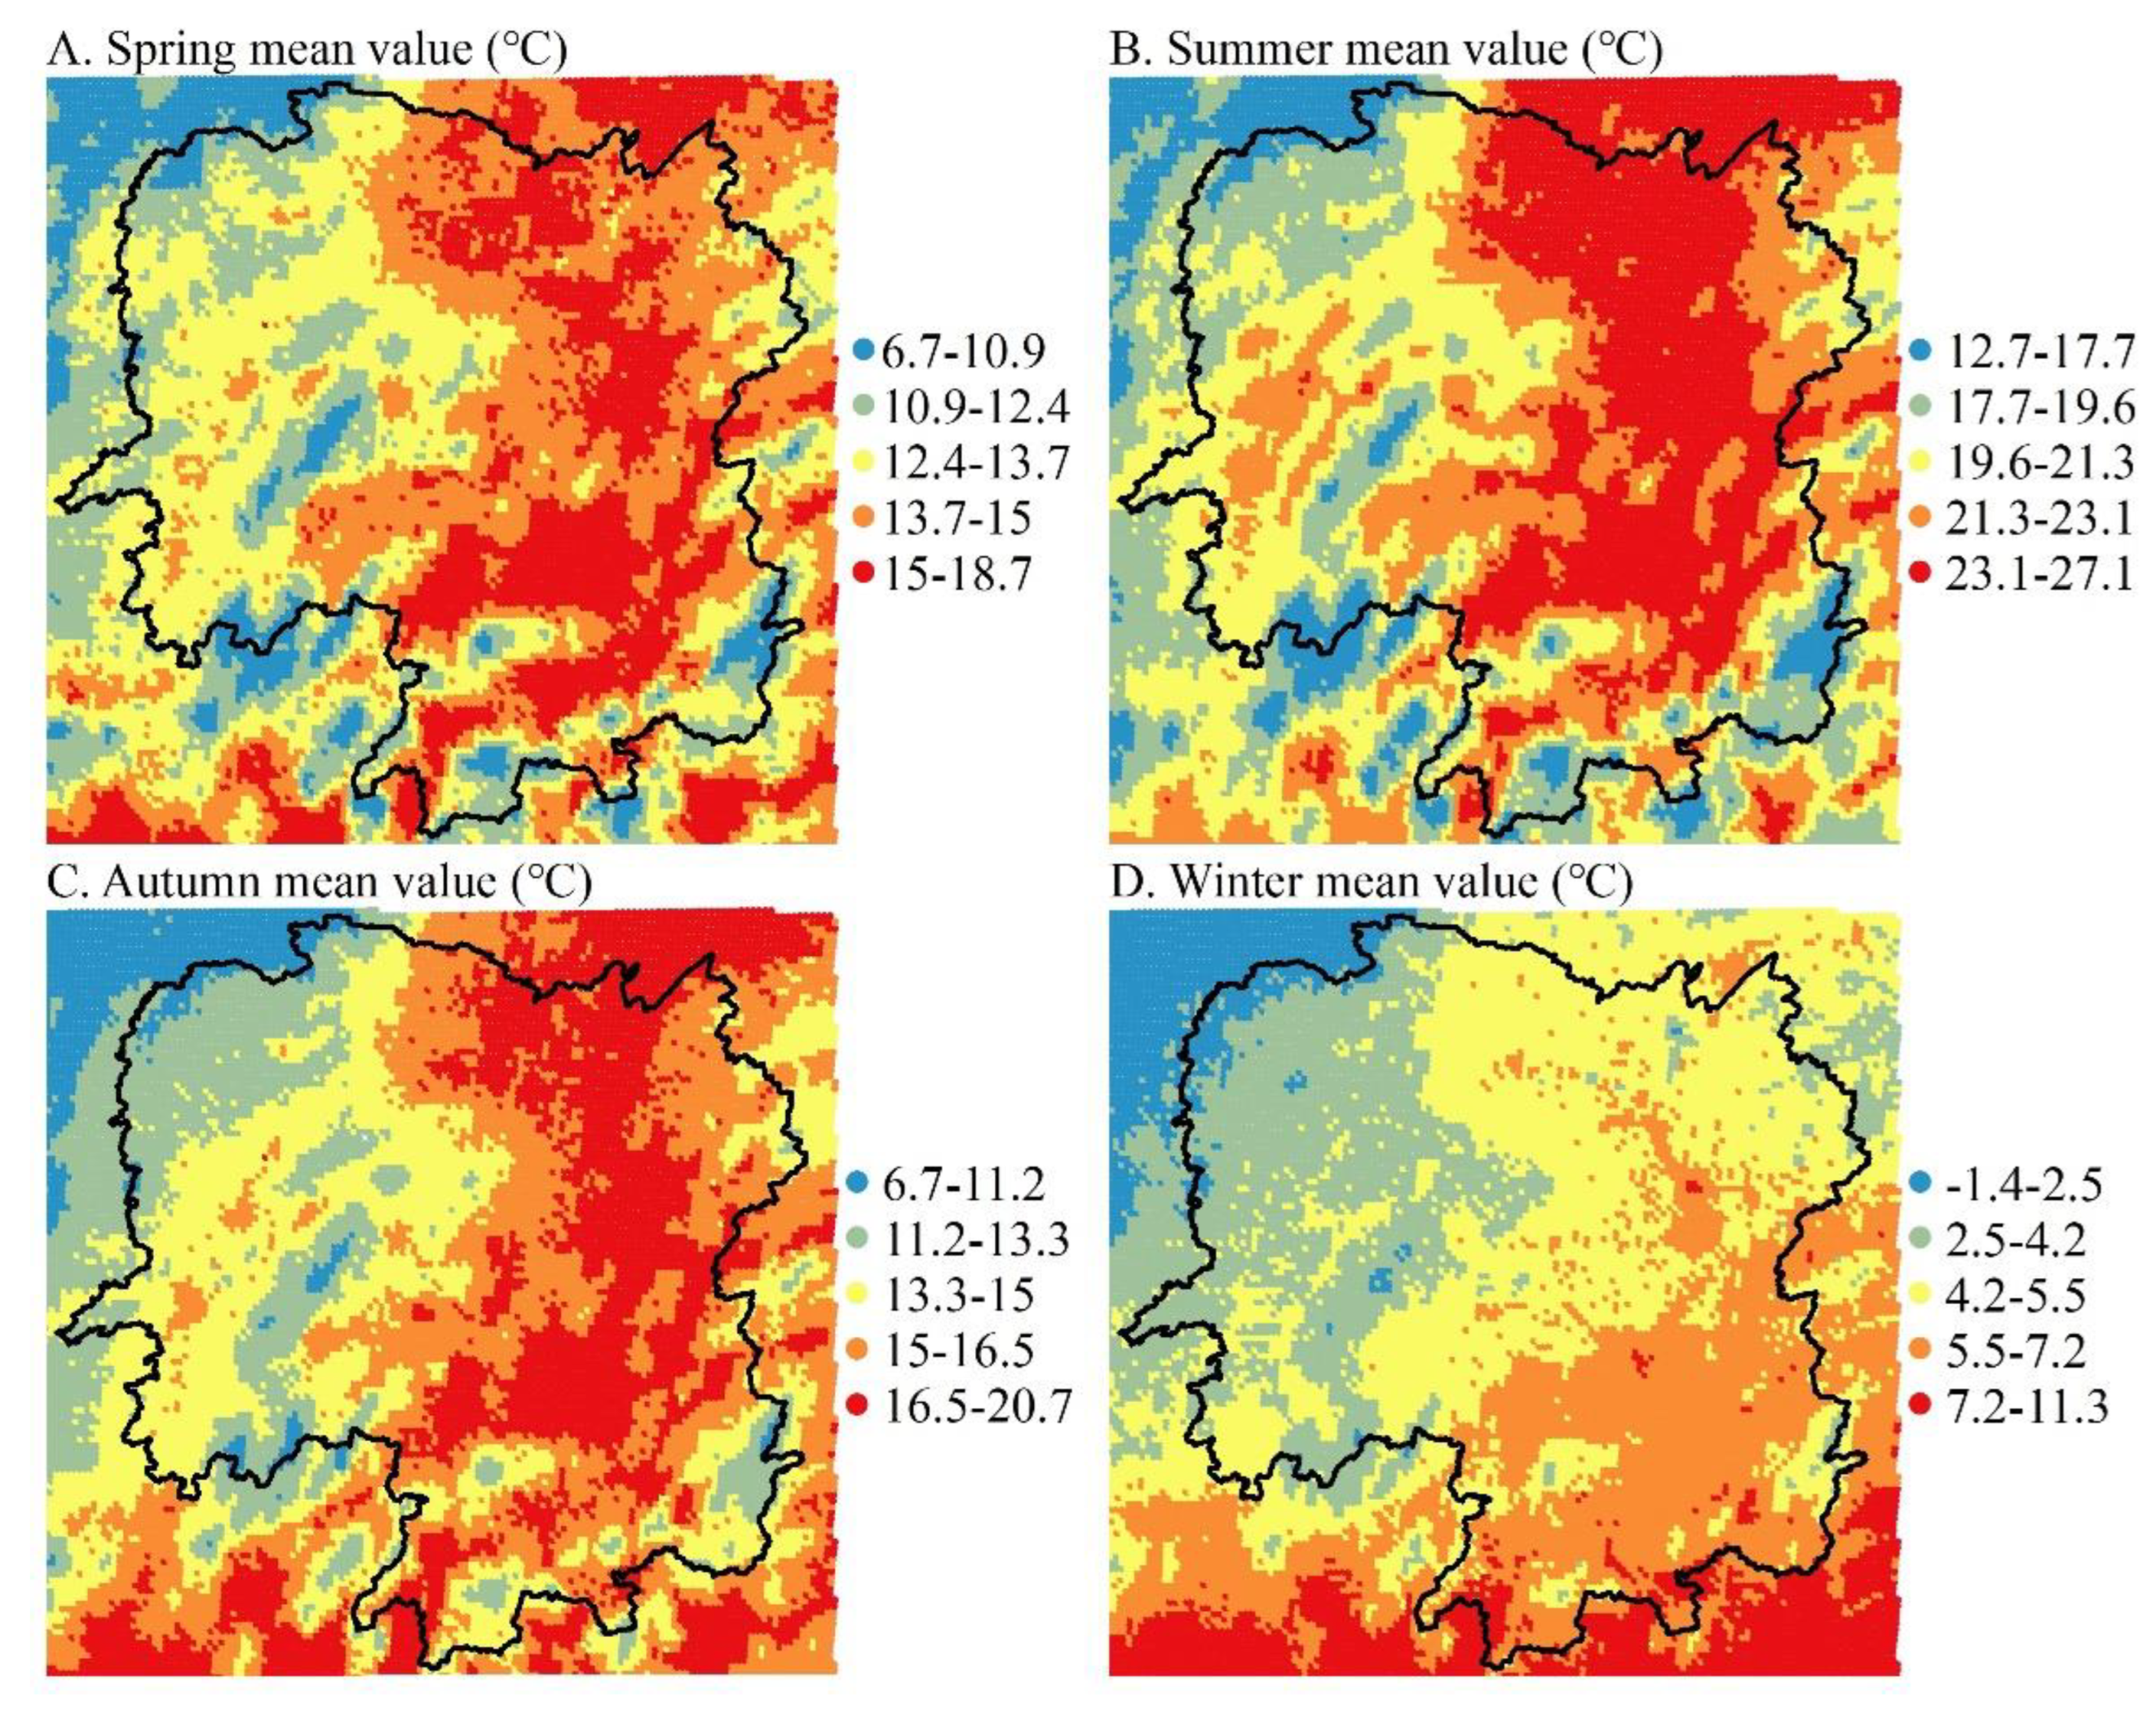
Figure 8.
Spatial distribution map of mean daily FY-4A LST in the Chang-Zhu-Tan urban agglomeration on October 1, 2019 (left) and September 30, 2021 (right).
Figure 8.
Spatial distribution map of mean daily FY-4A LST in the Chang-Zhu-Tan urban agglomeration on October 1, 2019 (left) and September 30, 2021 (right).
Disclaimer/Publisher’s Note: The statements, opinions and data contained in all publications are solely those of the individual author(s) and contributor(s) and not of MDPI and/or the editor(s). MDPI and/or the editor(s) disclaim responsibility for any injury to people or property resulting from any ideas, methods, instructions or products referred to in the content. |
© 2023 by the authors. Licensee MDPI, Basel, Switzerland. This article is an open access article distributed under the terms and conditions of the Creative Commons Attribution (CC BY) license (http://creativecommons.org/licenses/by/4.0/).
Copyright: This open access article is published under a Creative Commons CC BY 4.0 license, which permit the free download, distribution, and reuse, provided that the author and preprint are cited in any reuse.


